Embed Size (px)
Citation preview
Dear Parent or Guardian,
You are the first teacher and most important partner in your child’s education. As a result, you need high-quality information on the performance of DCPS schools and the District overall. This scorecard provides important facts related to student performance, school facilities, and the academic and extracurricular opportunities available at this school. Taken together, I believe these data can help you make the best, most informed decisions possible related to your child’s education.
While the data on this scorecard objectively illustrate the progress of this school, the best way to gauge a school’s quality is to get involved. Be sure to review the back page of this document for ideas on engaging with your school community, such as volunteering or attending parent-teacher conferences. You can also compare schools’ programs and performance online at www.dcps.dc.gov/profiles.
It’s my hope that you use this information to hold principals, school staff and my office accountable for continuing to improve the quality of education available to your family.
Sincerely,
Kaya Henderson Chancellor
2012–13 S c h o o l S c o r e c a r d
elementary and Secondary education act claSSification
Student demograPhicS (2011–12)
academic enrichment WellneSS and fitneSS artS and culture
3 4 5 6 7 8
M
1 2 81 2
ProgramS (2012–13)
Enrollment:
Dunbar High School WARD
5GRADES
9th-12th
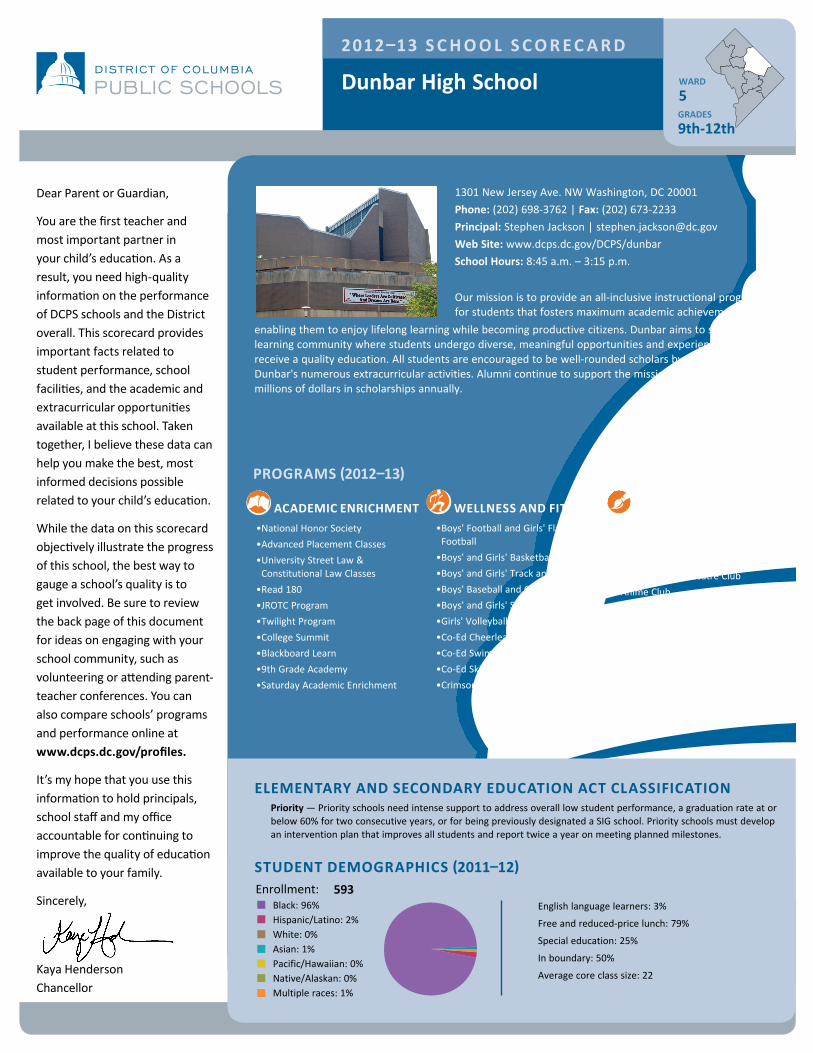
1301 New Jersey Ave. NW Washington, DC 20001Phone: (202) 698-3762 | Fax: (202) 673-2233Principal: Stephen Jackson | [email protected] Site: www.dcps.dc.gov/DCPS/dunbarSchool Hours: 8:45 a.m. – 3:15 p.m.
Our mission is to provide an all-inclusive instructional programfor students that fosters maximum academic achievement,
enabling them to enjoy lifelong learning while becoming productive citizens. Dunbar aims to serve as alearning community where students undergo diverse, meaningful opportunities and experiences andreceive a quality education. All students are encouraged to be well-rounded scholars by participating inDunbar's numerous extracurricular activities. Alumni continue to support the mission of the school withmillions of dollars in scholarships annually.
•National Honor Society•Advanced Placement Classes•University Street Law &
Constitutional Law Classes•Read 180•JROTC Program•Twilight Program•College Summit•Blackboard Learn•9th Grade Academy•Saturday Academic Enrichment
•Boys' Football and Girls' FlagFootball
•Boys' and Girls' Basketball•Boys' and Girls' Track and Field•Boys' Baseball and Girls' Softball•Boys' and Girls' Soccer•Girls' Volleyball•Co-Ed Cheerleading•Co-Ed Swimming•Co-Ed Ski Team•Crimson Lace Dance Team
•Crimson Tide Marching Band•International Club•Robotics Club•Poetry Slam & Theatre Club•Anime Club•Gay and Lesbian Alliance•Catwalk Modeling Group•Gentlemen and Ladies of Dunbar•Alpha Leadership Program•Teen Family Development
Program
Priority — Priority schools need intense support to address overall low student performance, a graduation rate at orbelow 60% for two consecutive years, or for being previously designated a SIG school. Priority schools must developan intervention plan that improves all students and report twice a year on meeting planned milestones.
593English language learners: 3%
Free and reduced-price lunch: 79%
Special education: 25%
In boundary: 50%
Average core class size: 22
Black: 96%Hispanic/Latino: 2%White: 0%Asian: 1%Pacific/Hawaiian: 0%Native/Alaskan: 0%Multiple races: 1%
2012–13 S c h o o l S c o r e c a r d
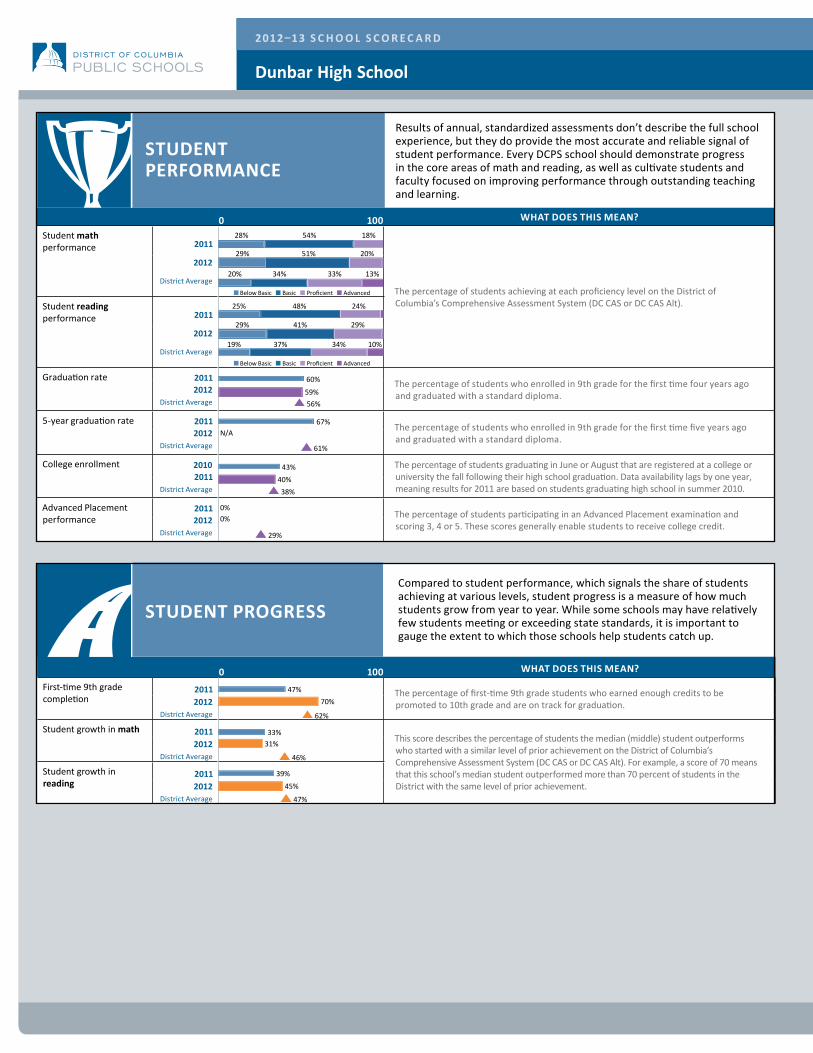
Student Performance
0 100 What doeS thiS mean?
Student math performance 2011
The percentage of students achieving at each proficiency level on the District of Columbia’s Comprehensive Assessment System (DC CAS or DC CAS Alt).
2012
District Average
Student reading performance 2011
2012
District Average
Graduation rate 20112012
District Average
The percentage of students who enrolled in 9th grade for the first time four years ago and graduated with a standard diploma.
5-year graduation rate 20112012
District Average
The percentage of students who enrolled in 9th grade for the first time five years ago and graduated with a standard diploma.
College enrollment 20102011
District Average
The percentage of students graduating in June or August that are registered at a college or university the fall following their high school graduation. Data availability lags by one year, meaning results for 2011 are based on students graduating high school in summer 2010.
Advanced Placement performance
20112012
District Average
The percentage of students participating in an Advanced Placement examination and scoring 3, 4 or 5. These scores generally enable students to receive college credit.
Compared to student performance, which signals the share of students achieving at various levels, student progress is a measure of how much students grow from year to year. While some schools may have relatively few students meeting or exceeding state standards, it is important to gauge the extent to which those schools help students catch up.
0 100 What doeS thiS mean?
First-time 9th grade completion
2011 The percentage of first-time 9th grade students who earned enough credits to be promoted to 10th grade and are on track for graduation.2012
District Average
Student growth in math 2011This score describes the percentage of students the median (middle) student outperforms who started with a similar level of prior achievement on the District of Columbia’s Comprehensive Assessment System (DC CAS or DC CAS Alt). For example, a score of 70 means that this school’s median student outperformed more than 70 percent of students in the District with the same level of prior achievement.
2012District Average
Student growth in reading
20112012
District Average
Student ProgreSS
Results of annual, standardized assessments don’t describe the full school experience, but they do provide the most accurate and reliable signal of student performance. Every DCPS school should demonstrate progress in the core areas of math and reading, as well as cultivate students and faculty focused on improving performance through outstanding teaching and learning.
■ Below Basic ■ Basic ■ Proficient ■ Advanced
■ Below Basic ■ Basic ■ Proficient ■ Advanced
28% 54% 18%
Dunbar High School
43% 40%
47% 70%
33% 31%
45% 39%
67% N/A
60%
59%
29% 51% 20%
25% 48% 24%
29% 41% 29%
56%
61%
38%
20% 34% 33% 13%
19% 37% 34% 10%
29%
0% 0%
62%
46%
47%
2012–13 S c h o o l S c o r e c a r d
DCPS believes that all schools must provide caring and supportive environments. School environments that are safe and welcoming better enable students and staff to learn and teach.
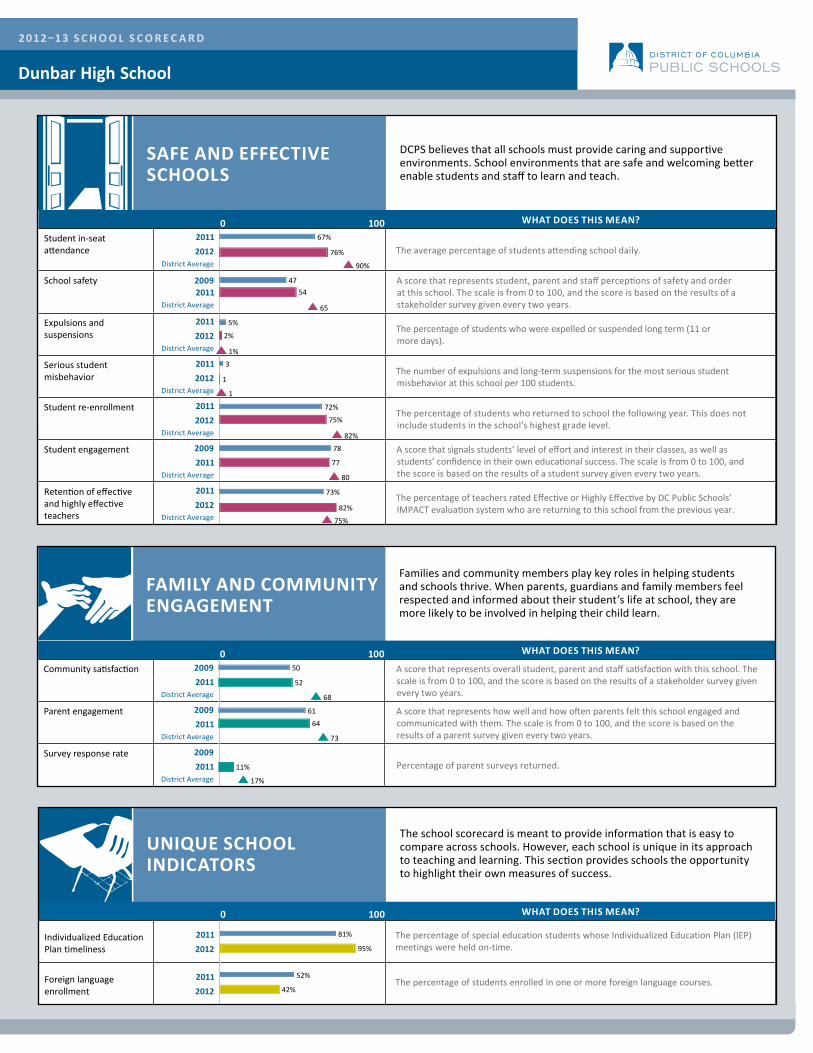
Safe and effective SchoolS
0 100 What doeS thiS mean?
Student in-seat attendance
2011
2012 District Average
The average percentage of students attending school daily.
School safety 20092011
District Average
A score that represents student, parent and staff perceptions of safety and order at this school. The scale is from 0 to 100, and the score is based on the results of a stakeholder survey given every two years.
Expulsions and suspensions
2011
2012District Average
The percentage of students who were expelled or suspended long term (11 or more days).
Serious student misbehavior
2011
2012District Average
The number of expulsions and long-term suspensions for the most serious student misbehavior at this school per 100 students.
Student re-enrollment 2011
2012District Average
The percentage of students who returned to school the following year. This does not include students in the school’s highest grade level.
Student engagement 2009
2011District Average
A score that signals students’ level of effort and interest in their classes, as well as students’ confidence in their own educational success. The scale is from 0 to 100, and the score is based on the results of a student survey given every two years.
Retention of effective and highly effective teachers
2011
2012District Average
The percentage of teachers rated Effective or Highly Effective by DC Public Schools’ IMPACT evaluation system who are returning to this school from the previous year.
0 100 What doeS thiS mean?
Community satisfaction 2009
2011District Average
A score that represents overall student, parent and staff satisfaction with this school. The scale is from 0 to 100, and the score is based on the results of a stakeholder survey given every two years.
Parent engagement 2009
2011District Average
A score that represents how well and how often parents felt this school engaged and communicated with them. The scale is from 0 to 100, and the score is based on the results of a parent survey given every two years.
Survey response rate 2009
2011District Average
Percentage of parent surveys returned.
Families and community members play key roles in helping students and schools thrive. When parents, guardians and family members feel respected and informed about their student’s life at school, they are more likely to be involved in helping their child learn.
family and community engagement
0 100 What doeS thiS mean?
2011
2012
2011
2012
The school scorecard is meant to provide information that is easy to compare across schools. However, each school is unique in its approach to teaching and learning. This section provides schools the opportunity to highlight their own measures of success.
unique School indicatorS
Dunbar High School
67%
76%
47 54
5%
2%
3
1
72%
75%
50
52
61
64
95%
52%
42%
Individualized EducationPlan timeliness
The percentage of special education students whose Individualized Education Plan (IEP)meetings were held on-time.
Foreign languageenrollment
The percentage of students enrolled in one or more foreign language courses.
81%
78
73%
77
82%
11%
90%
65
1%
1
82%
80
75%
68
73
17%
2012–13 S c h o o l S c o r e c a r d
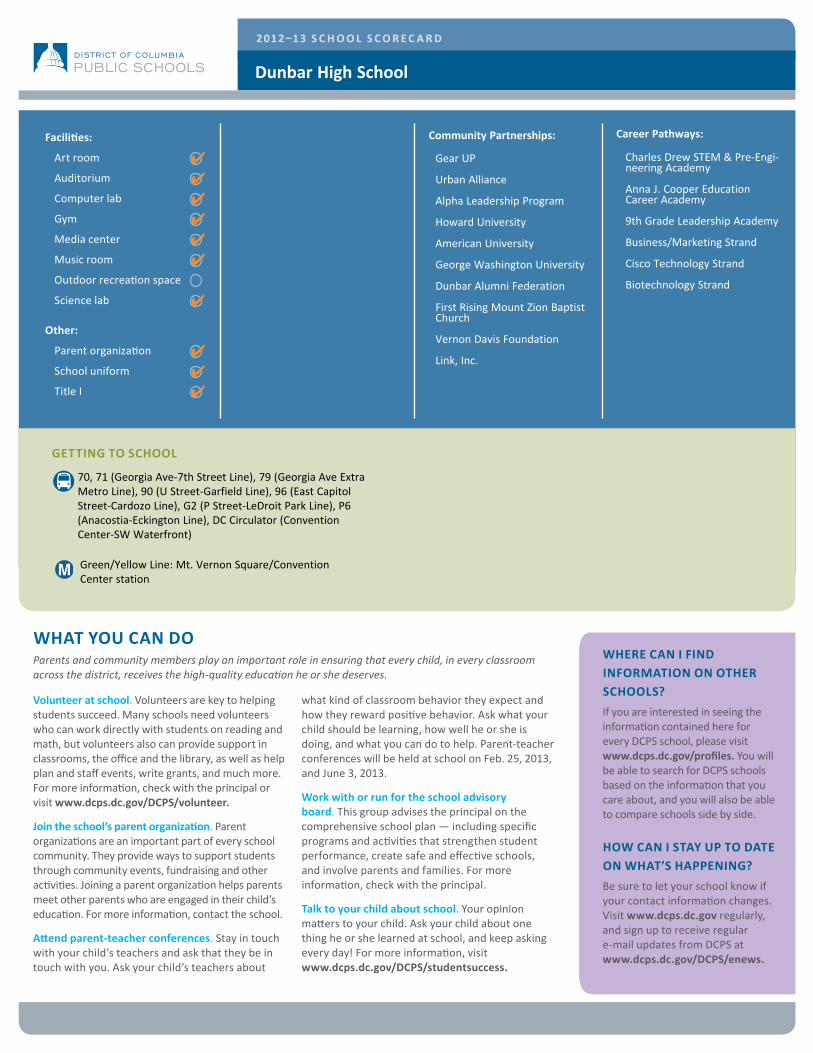
What you can doParents and community members play an important role in ensuring that every child, in every classroom across the district, receives the high-quality education he or she deserves.
volunteer at school. Volunteers are key to helping students succeed. Many schools need volunteers who can work directly with students on reading and math, but volunteers also can provide support in classrooms, the office and the library, as well as help plan and staff events, write grants, and much more. For more information, check with the principal or visit www.dcps.dc.gov/dcPS/volunteer.
Join the school’s parent organization. Parent organizations are an important part of every school community. They provide ways to support students through community events, fundraising and other activities. Joining a parent organization helps parents meet other parents who are engaged in their child’s education. For more information, contact the school.
attend parent-teacher conferences. Stay in touch with your child’s teachers and ask that they be in touch with you. Ask your child’s teachers about
what kind of classroom behavior they expect and how they reward positive behavior. Ask what your child should be learning, how well he or she is doing, and what you can do to help. Parent-teacher conferences will be held at school on . 25, 2013, and June 3, 2013.
Work with or run for the school advisory board. This group advises the principal on the comprehensive school plan — including specific programs and activities that strengthen student performance, create safe and effective schools, and involve parents and families. For more information, check with the principal.
talk to your child about school. Your opinion matters to your child. Ask your child about one thing he or she learned at school, and keep asking every day! For more information, visit www.dcps.dc.gov/dcPS/studentsuccess.
1 2 3 4 5 6 7
1 2
�
3 4 5 67 8 9 10 11 12
KA
1 2 3 4 5 6 7
1 2
�
3 4 5 67 8 9 10 11 12
KA
getting to School
Where can i find information on other SchoolS?
If you are interested in seeing the information contained here for every DCPS school, please visit www.dcps.dc.gov/profiles. You will be able to search for DCPS schools based on the information that you care about, and you will also be able to compare schools side by side.
hoW can i Stay uP to date on What’S haPPening?
Be sure to let your school know if your contact information changes. Visit www.dcps.dc.gov regularly, and sign up to receive regular e-mail updates from DCPS at www.dcps.dc.gov/dcPS/enews.
facilities:
Art room
Auditorium
Computer lab
Gym
Media center
Music room
Outdoor recreation space
Science lab
other:
Parent organization
School uniform
Title I
Feb
Dunbar High School
70, 71 (Georgia Ave-7th Street Line), 79 (Georgia Ave ExtraMetro Line), 90 (U Street-Garfield Line), 96 (East CapitolStreet-Cardozo Line), G2 (P Street-LeDroit Park Line), P6(Anacostia-Eckington Line), DC Circulator (ConventionCenter-SW Waterfront)
M Green/Yellow Line: Mt. Vernon Square/ConventionCenter station
Community Partnerships: Career Pathways:
Charles Drew STEM & Pre-Engi-neering Academy
Anna J. Cooper EducationCareer Academy
9th Grade Leadership Academy
Business/Marketing Strand
Cisco Technology Strand
Biotechnology Strand
Gear UP
Urban Alliance
Alpha Leadership Program
Howard University
American University
George Washington University
Dunbar Alumni Federation
First Rising Mount Zion BaptistChurch
Vernon Davis Foundation
Link, Inc.