Embed Size (px)
Citation preview

8/6/2019 fort worth isd - dunbar middle school (grades 7-8) - 1998 Texas School Survey of Drug and Alcohol Use
http://slidepdf.com/reader/full/fort-worth-isd-dunbar-middle-school-grades-7-8-1998-texas-school-survey 1/138
8/6/2019 fort worth isd - dunbar middle school (grades 7-8) - 1998 Texas School Survey of Drug and Alcohol Use
http://slidepdf.com/reader/full/fort-worth-isd-dunbar-middle-school-grades-7-8-1998-texas-school-survey 2/138
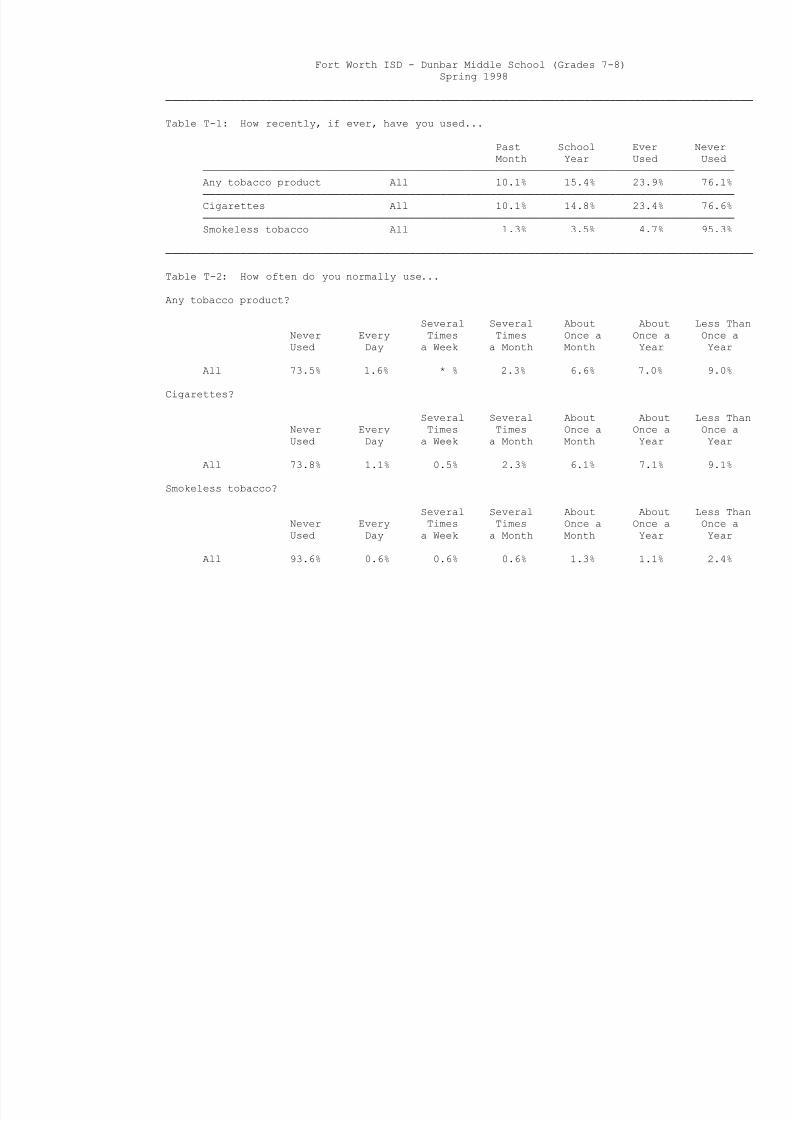
Fort Worth ISD - Dunbar Middle School (Grades 7-8)
Spring 1998
──────────────────────────────────────────────────────────────────────────────────────────────
Table T-1: How recently, if ever, have you used...
Past School Ever Never
Month Year Used Used
─────────────────────────────────────────────────────────────────────────────────────
Any tobacco product All 10.1% 15.4% 23.9% 76.1%
─────────────────────────────────────────────────────────────────────────────────────
Cigarettes All 10.1% 14.8% 23.4% 76.6%
─────────────────────────────────────────────────────────────────────────────────────
Smokeless tobacco All 1.3% 3.5% 4.7% 95.3%
──────────────────────────────────────────────────────────────────────────────────────────────
Table T-2: How often do you normally use...
Any tobacco product?
Several Several About About Less Than
Never Every Times Times Once a Once a Once a
Used Day a Week a Month Month Year Year
All 73.5% 1.6% * % 2.3% 6.6% 7.0% 9.0%
Cigarettes?
Several Several About About Less Than
Never Every Times Times Once a Once a Once a
Used Day a Week a Month Month Year Year
All 73.8% 1.1% 0.5% 2.3% 6.1% 7.1% 9.1%
Smokeless tobacco?
Several Several About About Less Than
Never Every Times Times Once a Once a Once a
Used Day a Week a Month Month Year Year
All 93.6% 0.6% 0.6% 0.6% 1.3% 1.1% 2.4%
8/6/2019 fort worth isd - dunbar middle school (grades 7-8) - 1998 Texas School Survey of Drug and Alcohol Use
http://slidepdf.com/reader/full/fort-worth-isd-dunbar-middle-school-grades-7-8-1998-texas-school-survey 3/138
──────────────────────────────────────────────────────────────────────────────────────────────
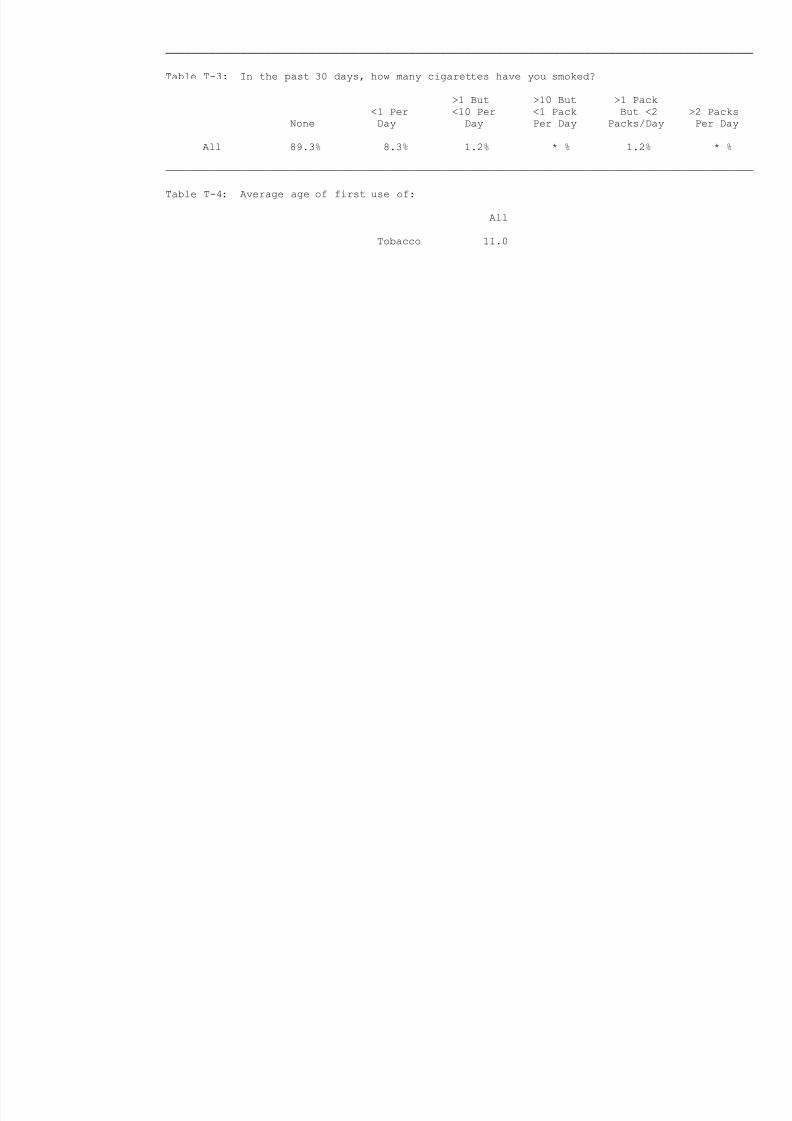
Table T-3: In the past 30 days, how many cigarettes have you smoked?
>1 But >10 But >1 Pack
<1 Per <10 Per <1 Pack But <2 >2 Packs
None Day Day Per Day Packs/Day Per Day
All 89.3% 8.3% 1.2% * % 1.2% * %
──────────────────────────────────────────────────────────────────────────────────────────────
Table T-4: Average age of first use of:
All
Tobacco 11.0
8/6/2019 fort worth isd - dunbar middle school (grades 7-8) - 1998 Texas School Survey of Drug and Alcohol Use
http://slidepdf.com/reader/full/fort-worth-isd-dunbar-middle-school-grades-7-8-1998-texas-school-survey 4/138
Fort Worth ISD - Dunbar Middle School (Grades 7-8)
Spring 1998
──────────────────────────────────────────────────────────────────────────────────────────────
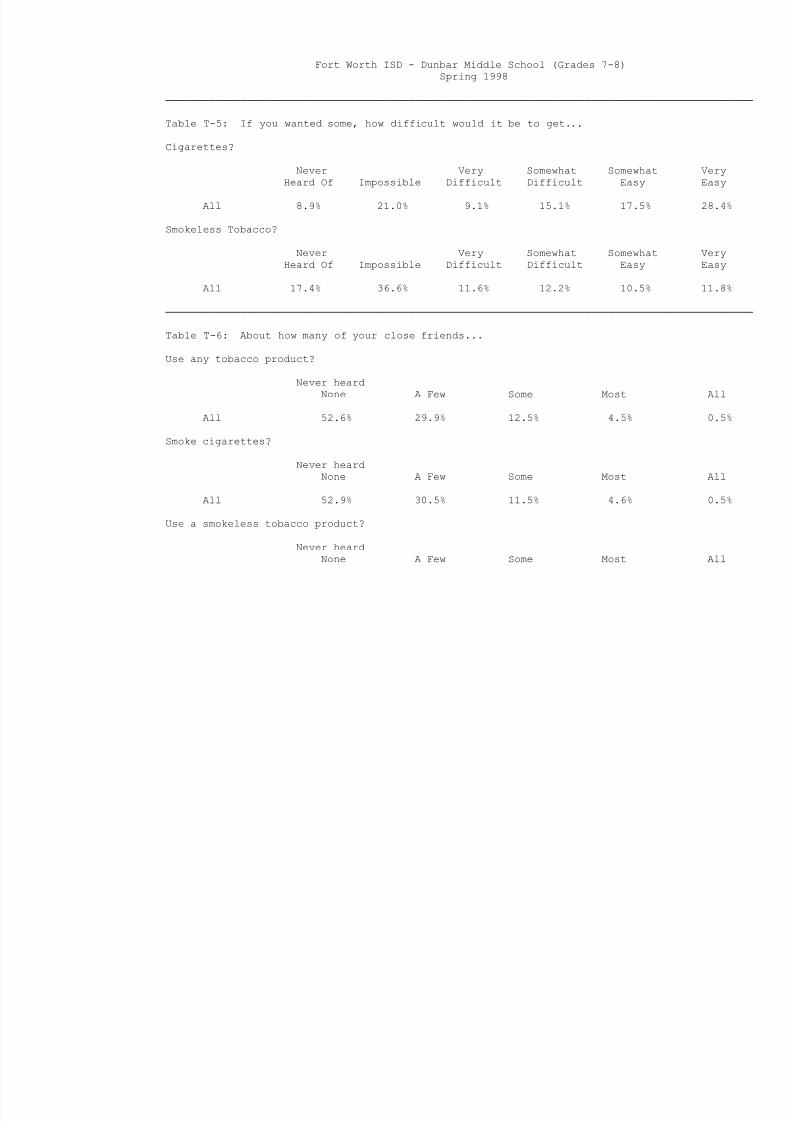
Table T-5: If you wanted some, how difficult would it be to get...
Cigarettes?
Never Very Somewhat Somewhat Very
Heard Of Impossible Difficult Difficult Easy Easy
All 8.9% 21.0% 9.1% 15.1% 17.5% 28.4%
Smokeless Tobacco?
Never Very Somewhat Somewhat Very
Heard Of Impossible Difficult Difficult Easy Easy
All 17.4% 36.6% 11.6% 12.2% 10.5% 11.8%
──────────────────────────────────────────────────────────────────────────────────────────────
Table T-6: About how many of your close friends...
Use any tobacco product?
Never heard
None A Few Some Most All
All 52.6% 29.9% 12.5% 4.5% 0.5%
Smoke cigarettes?
Never heard
None A Few Some Most All
All 52.9% 30.5% 11.5% 4.6% 0.5%
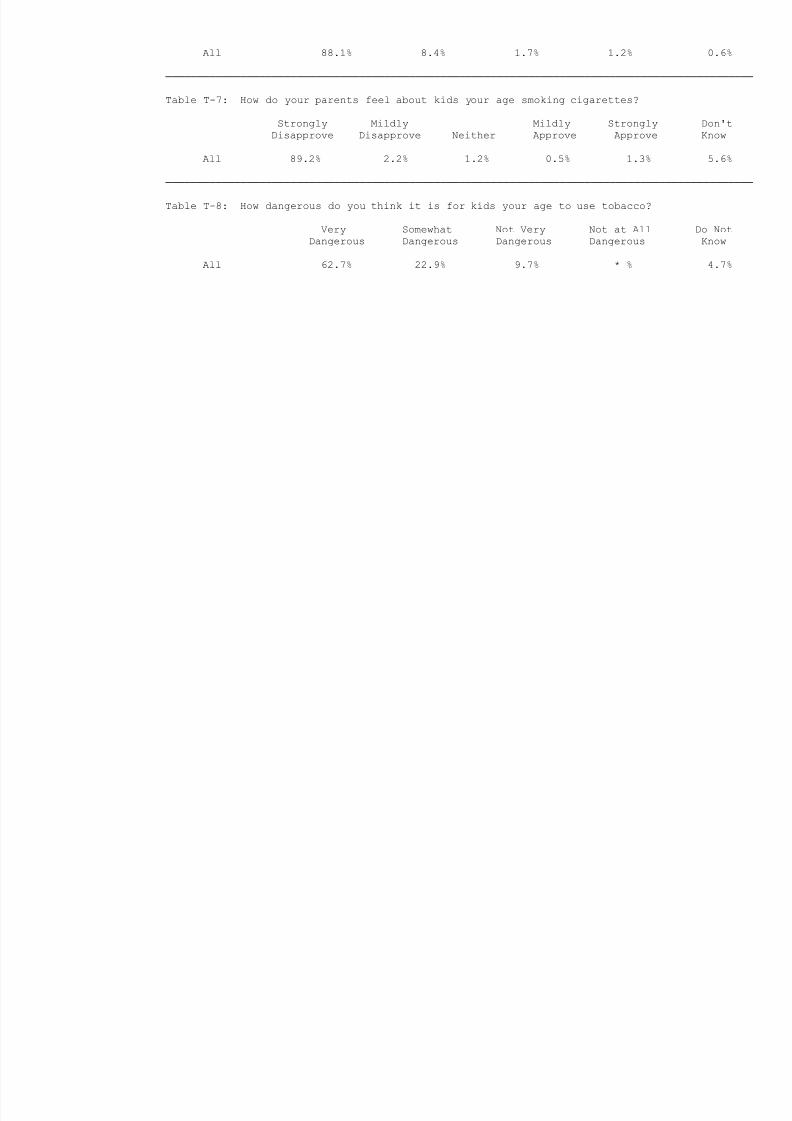
Use a smokeless tobacco product?
Never heardNone A Few Some Most All
8/6/2019 fort worth isd - dunbar middle school (grades 7-8) - 1998 Texas School Survey of Drug and Alcohol Use
http://slidepdf.com/reader/full/fort-worth-isd-dunbar-middle-school-grades-7-8-1998-texas-school-survey 5/138
All 88.1% 8.4% 1.7% 1.2% 0.6%
──────────────────────────────────────────────────────────────────────────────────────────────
Table T-7: How do your parents feel about kids your age smoking cigarettes?
Strongly Mildly Mildly Strongly Don't
Disapprove Disapprove Neither Approve Approve Know
All 89.2% 2.2% 1.2% 0.5% 1.3% 5.6%
──────────────────────────────────────────────────────────────────────────────────────────────
Table T-8: How dangerous do you think it is for kids your age to use tobacco?
Very Somewhat Not Very Not at All Do Not
Dangerous Dangerous Dangerous Dangerous Know
All 62.7% 22.9% 9.7% * % 4.7%

8/6/2019 fort worth isd - dunbar middle school (grades 7-8) - 1998 Texas School Survey of Drug and Alcohol Use
http://slidepdf.com/reader/full/fort-worth-isd-dunbar-middle-school-grades-7-8-1998-texas-school-survey 6/138
Fort Worth ISD - Dunbar Middle School (Grades 7-8)
Spring 1998
──────────────────────────────────────────────────────────────────────────────────────────────
Table A-1: How recently, if ever, have you used...
Past School Ever Never
Month Year Used Used
─────────────────────────────────────────────────────────────────────────────────────
Any alcohol product All 22.5% 30.6% 49.8% 50.2%
─────────────────────────────────────────────────────────────────────────────────────
Beer All 12.4% 18.9% 32.5% 67.5%
─────────────────────────────────────────────────────────────────────────────────────
Wine coolers All 15.0% 24.9% 43.1% 56.9%
─────────────────────────────────────────────────────────────────────────────────────
Wine All 11.6% 19.3% 28.5% 71.5%
─────────────────────────────────────────────────────────────────────────────────────
Liquor All 12.5% 17.1% 25.1% 74.9%
──────────────────────────────────────────────────────────────────────────────────────────────
Table A-2: How often do you normally use...
Any alcohol product?
Several Several About About Less Than
Never Every Times Times Once a Once a Once a
Used Day a Week a Month Month Year Year
All 56.1% 1.7% 5.0% 5.9% 9.8% 13.3% 8.2%
Beer?
Several Several About About Less Than
Never Every Times Times Once a Once a Once a
Used Day a Week a Month Month Year Year
All 67.8% 1.1% 1.3% 5.4% 8.6% 9.8% 6.0%
Wine coolers?
Several Several About About Less Than
8/6/2019 fort worth isd - dunbar middle school (grades 7-8) - 1998 Texas School Survey of Drug and Alcohol Use
http://slidepdf.com/reader/full/fort-worth-isd-dunbar-middle-school-grades-7-8-1998-texas-school-survey 7/138
Never Every Times Times Once a Once a Once a
Used Day a Week a Month Month Year Year
All 59.8% 1.8% 3.9% 3.5% 10.0% 10.9% 10.2%
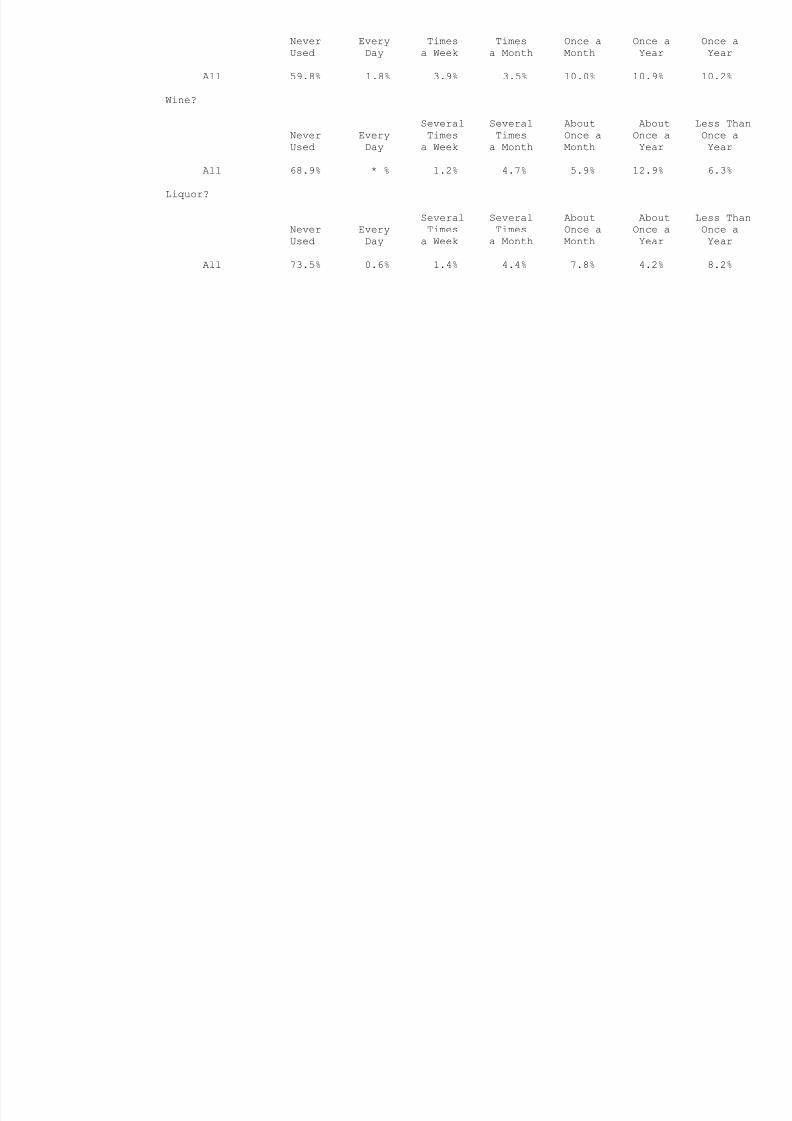
Wine?
Several Several About About Less Than
Never Every Times Times Once a Once a Once aUsed Day a Week a Month Month Year Year
All 68.9% * % 1.2% 4.7% 5.9% 12.9% 6.3%
Liquor?
Several Several About About Less Than
Never Every Times Times Once a Once a Once a
Used Day a Week a Month Month Year Year
All 73.5% 0.6% 1.4% 4.4% 7.8% 4.2% 8.2%
8/6/2019 fort worth isd - dunbar middle school (grades 7-8) - 1998 Texas School Survey of Drug and Alcohol Use
http://slidepdf.com/reader/full/fort-worth-isd-dunbar-middle-school-grades-7-8-1998-texas-school-survey 8/138
Fort Worth ISD - Dunbar Middle School (Grades 7-8)
Spring 1998
──────────────────────────────────────────────────────────────────────────────────────────────
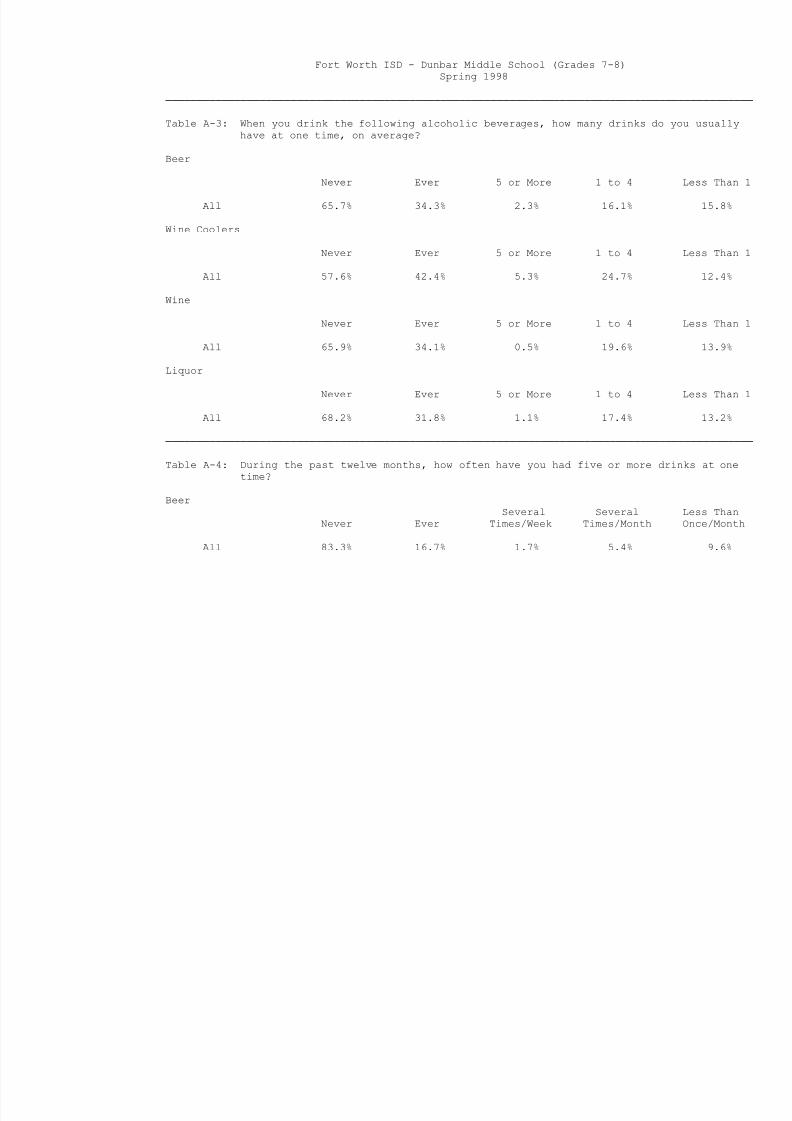
Table A-3: When you drink the following alcoholic beverages, how many drinks do you usually
have at one time, on average?
Beer
Never Ever 5 or More 1 to 4 Less Than 1
All 65.7% 34.3% 2.3% 16.1% 15.8%
Wine Coolers
Never Ever 5 or More 1 to 4 Less Than 1
All 57.6% 42.4% 5.3% 24.7% 12.4%
Wine
Never Ever 5 or More 1 to 4 Less Than 1
All 65.9% 34.1% 0.5% 19.6% 13.9%
Liquor
Never Ever 5 or More 1 to 4 Less Than 1
All 68.2% 31.8% 1.1% 17.4% 13.2%
──────────────────────────────────────────────────────────────────────────────────────────────
Table A-4: During the past twelve months, how often have you had five or more drinks at one
time?
Beer
Several Several Less Than
Never Ever Times/Week Times/Month Once/Month
All 83.3% 16.7% 1.7% 5.4% 9.6%
8/6/2019 fort worth isd - dunbar middle school (grades 7-8) - 1998 Texas School Survey of Drug and Alcohol Use
http://slidepdf.com/reader/full/fort-worth-isd-dunbar-middle-school-grades-7-8-1998-texas-school-survey 9/138
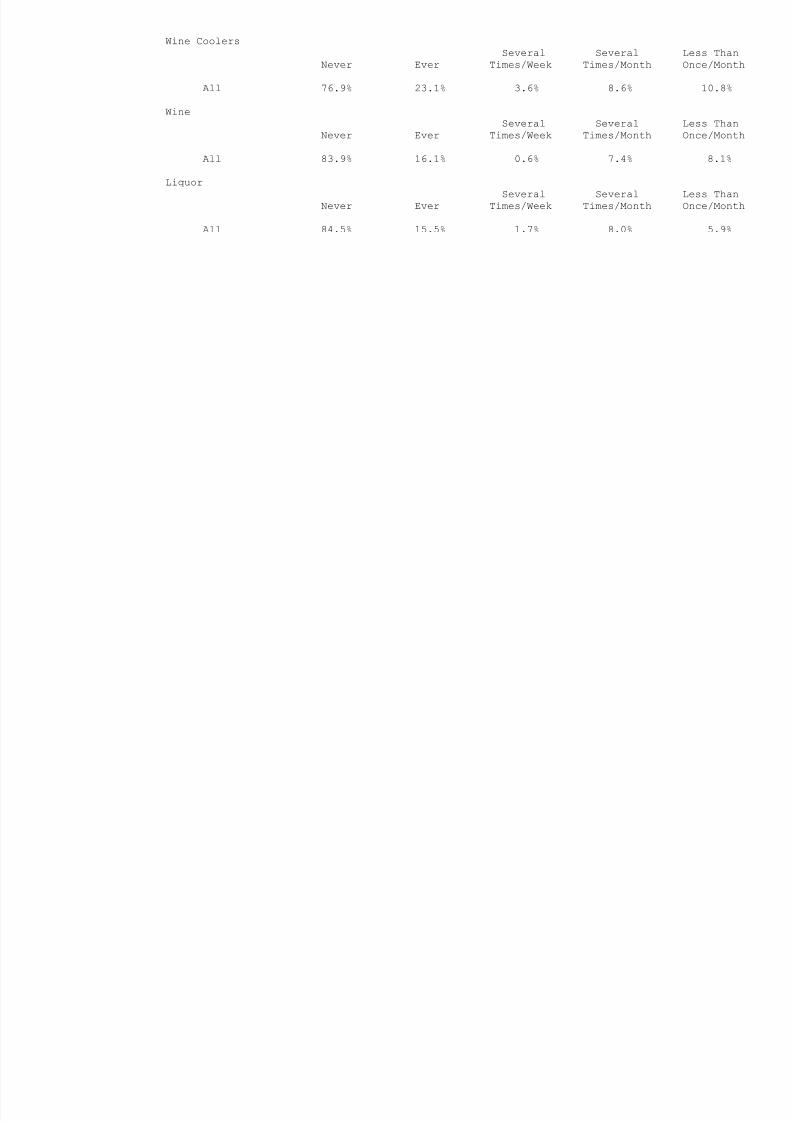
Wine Coolers
Several Several Less Than
Never Ever Times/Week Times/Month Once/Month
All 76.9% 23.1% 3.6% 8.6% 10.8%
Wine
Several Several Less Than
Never Ever Times/Week Times/Month Once/Month
All 83.9% 16.1% 0.6% 7.4% 8.1%
Liquor
Several Several Less Than
Never Ever Times/Week Times/Month Once/Month
All 84.5% 15.5% 1.7% 8.0% 5.9%
8/6/2019 fort worth isd - dunbar middle school (grades 7-8) - 1998 Texas School Survey of Drug and Alcohol Use
http://slidepdf.com/reader/full/fort-worth-isd-dunbar-middle-school-grades-7-8-1998-texas-school-survey 10/138
Fort Worth ISD - Dunbar Middle School (Grades 7-8)
Spring 1998
──────────────────────────────────────────────────────────────────────────────────────────────
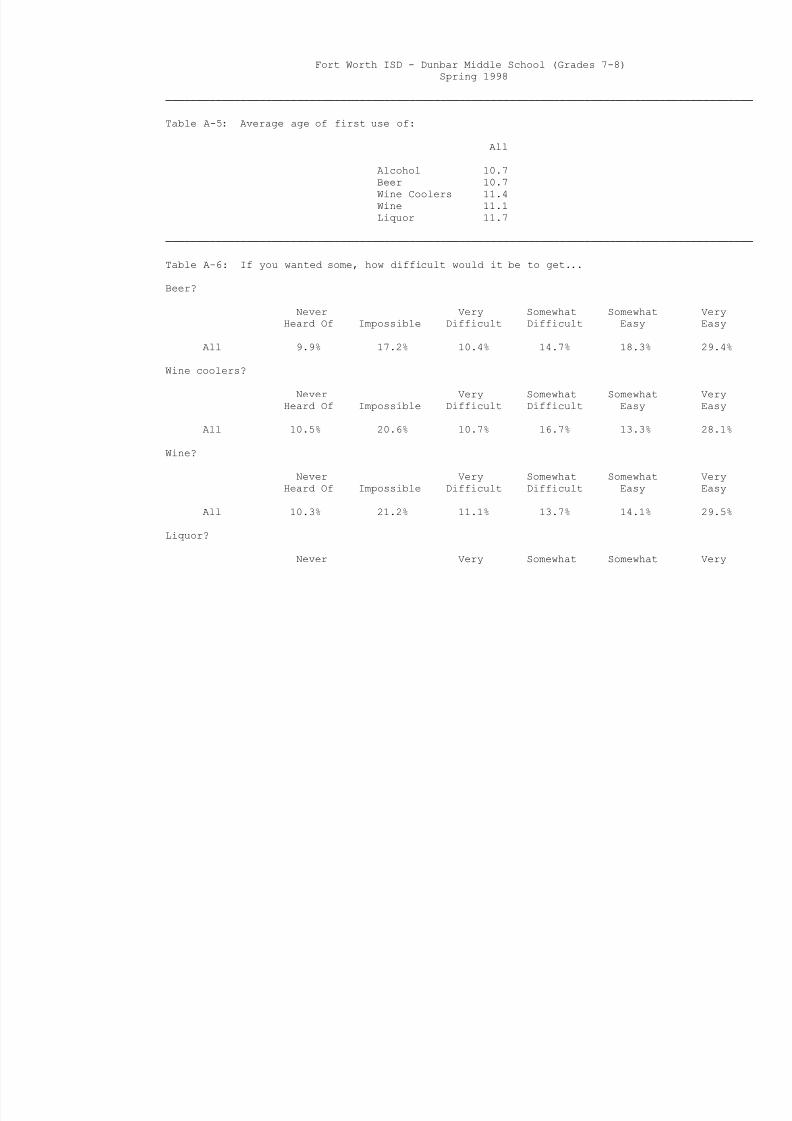
Table A-5: Average age of first use of:
All
Alcohol 10.7
Beer 10.7
Wine Coolers 11.4
Wine 11.1
Liquor 11.7
──────────────────────────────────────────────────────────────────────────────────────────────
Table A-6: If you wanted some, how difficult would it be to get...
Beer?
Never Very Somewhat Somewhat Very
Heard Of Impossible Difficult Difficult Easy Easy
All 9.9% 17.2% 10.4% 14.7% 18.3% 29.4%
Wine coolers?
Never Very Somewhat Somewhat Very
Heard Of Impossible Difficult Difficult Easy Easy
All 10.5% 20.6% 10.7% 16.7% 13.3% 28.1%
Wine?
Never Very Somewhat Somewhat Very
Heard Of Impossible Difficult Difficult Easy Easy
All 10.3% 21.2% 11.1% 13.7% 14.1% 29.5%
Liquor?
Never Very Somewhat Somewhat Very
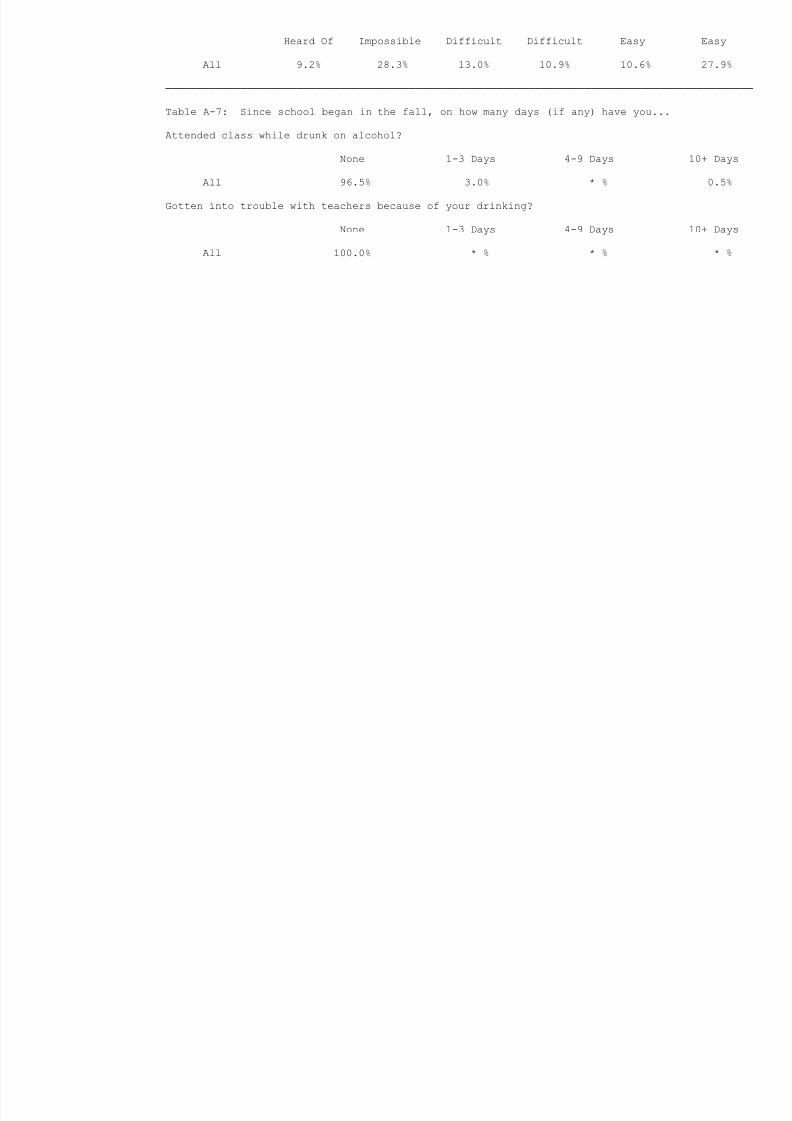
8/6/2019 fort worth isd - dunbar middle school (grades 7-8) - 1998 Texas School Survey of Drug and Alcohol Use
http://slidepdf.com/reader/full/fort-worth-isd-dunbar-middle-school-grades-7-8-1998-texas-school-survey 11/138
Heard Of Impossible Difficult Difficult Easy Easy
All 9.2% 28.3% 13.0% 10.9% 10.6% 27.9%
──────────────────────────────────────────────────────────────────────────────────────────────
Table A-7: Since school began in the fall, on how many days (if any) have you...
Attended class while drunk on alcohol?
None 1-3 Days 4-9 Days 10+ Days
All 96.5% 3.0% * % 0.5%
Gotten into trouble with teachers because of your drinking?
None 1-3 Days 4-9 Days 10+ Days
All 100.0% * % * % * %

8/6/2019 fort worth isd - dunbar middle school (grades 7-8) - 1998 Texas School Survey of Drug and Alcohol Use
http://slidepdf.com/reader/full/fort-worth-isd-dunbar-middle-school-grades-7-8-1998-texas-school-survey 12/138
Fort Worth ISD - Dunbar Middle School (Grades 7-8)
Spring 1998
──────────────────────────────────────────────────────────────────────────────────────────────
Table A-8: School year use of alcohol by absences and conduct problems:
Average days absent due to illness or other reasons:
Alcohol Users: 4.9 days per student
Alcohol Non-users: 4.4 days per student
Average days conduct problems reported:
Alcohol Users: 3.9 days per student
Alcohol Non-users: 0.8 days per student
──────────────────────────────────────────────────────────────────────────────────────────────
Table A-9: During the past twelve months, how many times have you...
Driven a car when you've had a good bit to drink?
None 1-3 Times 4-9 Times 10+ Times
* * % * % * % * %
Gotten into trouble with the police because of drinking?
None 1-3 Times 4-9 Times 10+ Times
All 99.3% * % 0.7% * %
──────────────────────────────────────────────────────────────────────────────────────────────
Table A-10: About how many of your close friends use...
Any alcohol product?
Never heard
None A Few Some Most All
All 46.2% 25.2% 14.6% 9.1% 4.8%
8/6/2019 fort worth isd - dunbar middle school (grades 7-8) - 1998 Texas School Survey of Drug and Alcohol Use
http://slidepdf.com/reader/full/fort-worth-isd-dunbar-middle-school-grades-7-8-1998-texas-school-survey 13/138
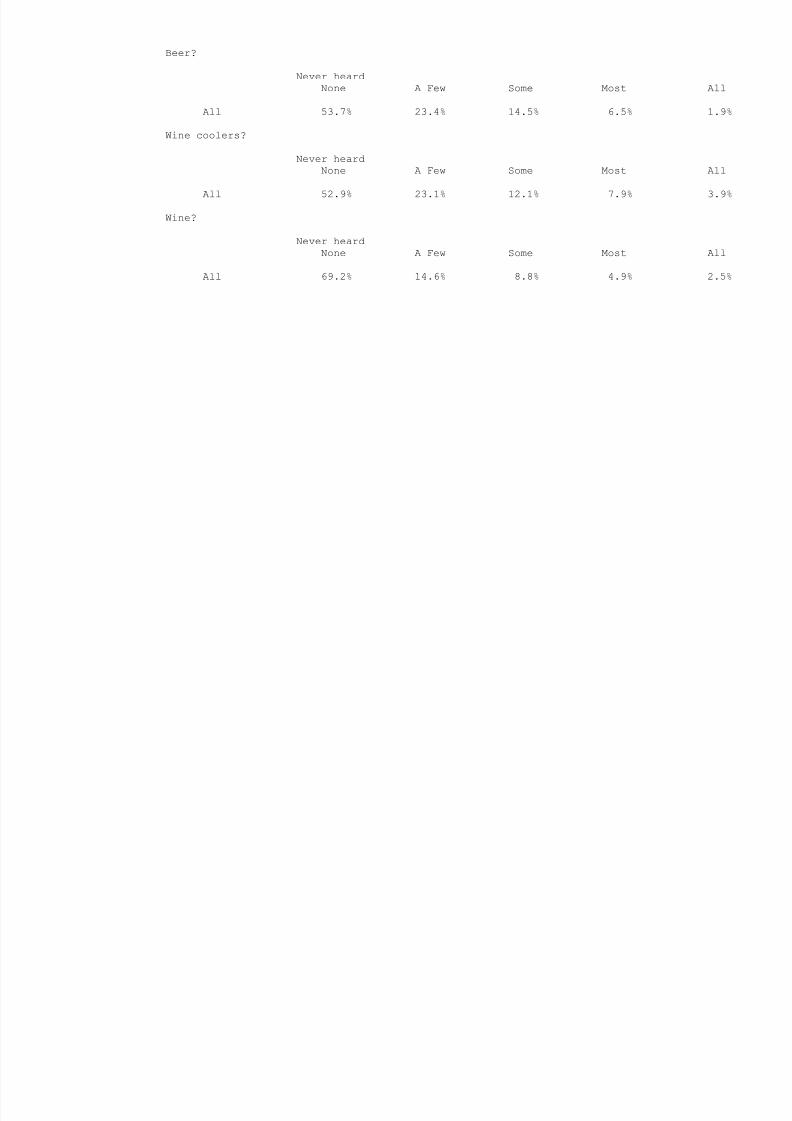
Beer?
Never heard
None A Few Some Most All
All 53.7% 23.4% 14.5% 6.5% 1.9%
Wine coolers?
Never heard
None A Few Some Most All
All 52.9% 23.1% 12.1% 7.9% 3.9%
Wine?
Never heard
None A Few Some Most All
All 69.2% 14.6% 8.8% 4.9% 2.5%
8/6/2019 fort worth isd - dunbar middle school (grades 7-8) - 1998 Texas School Survey of Drug and Alcohol Use
http://slidepdf.com/reader/full/fort-worth-isd-dunbar-middle-school-grades-7-8-1998-texas-school-survey 14/138
Fort Worth ISD - Dunbar Middle School (Grades 7-8)
Spring 1998
──────────────────────────────────────────────────────────────────────────────────────────────
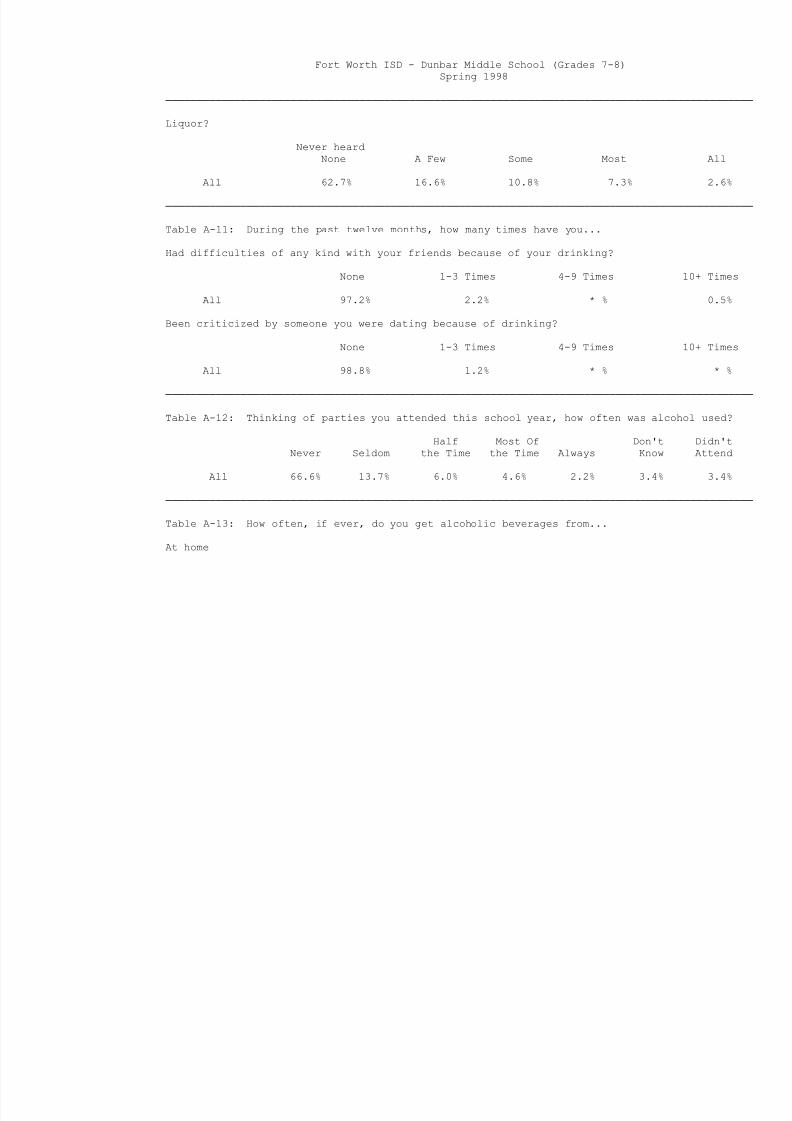
Liquor?
Never heard
None A Few Some Most All
All 62.7% 16.6% 10.8% 7.3% 2.6%
──────────────────────────────────────────────────────────────────────────────────────────────
Table A-11: During the past twelve months, how many times have you...
Had difficulties of any kind with your friends because of your drinking?
None 1-3 Times 4-9 Times 10+ Times
All 97.2% 2.2% * % 0.5%
Been criticized by someone you were dating because of drinking?
None 1-3 Times 4-9 Times 10+ Times
All 98.8% 1.2% * % * %
──────────────────────────────────────────────────────────────────────────────────────────────
Table A-12: Thinking of parties you attended this school year, how often was alcohol used?
Half Most Of Don't Didn't
Never Seldom the Time the Time Always Know Attend
All 66.6% 13.7% 6.0% 4.6% 2.2% 3.4% 3.4%
──────────────────────────────────────────────────────────────────────────────────────────────
Table A-13: How often, if ever, do you get alcoholic beverages from...
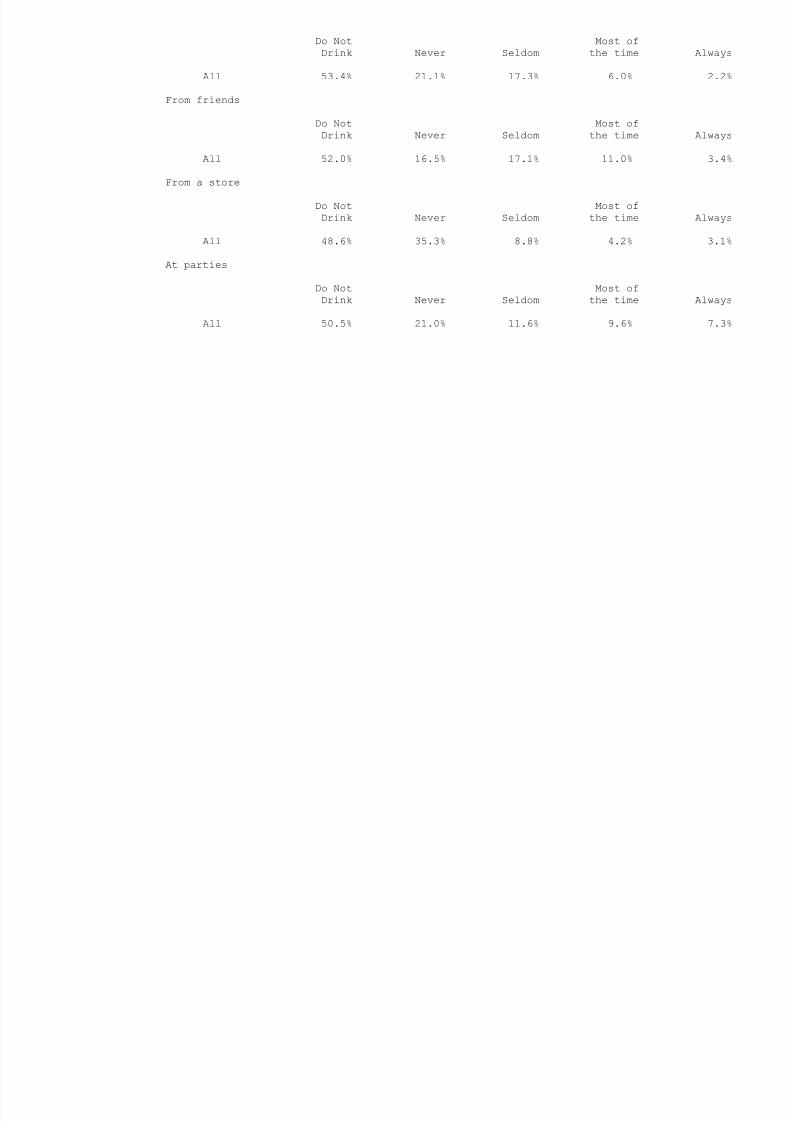
At home
8/6/2019 fort worth isd - dunbar middle school (grades 7-8) - 1998 Texas School Survey of Drug and Alcohol Use
http://slidepdf.com/reader/full/fort-worth-isd-dunbar-middle-school-grades-7-8-1998-texas-school-survey 15/138
Do Not Most of
Drink Never Seldom the time Always
All 53.4% 21.1% 17.3% 6.0% 2.2%
From friends
Do Not Most of
Drink Never Seldom the time Always
All 52.0% 16.5% 17.1% 11.0% 3.4%
From a store
Do Not Most of
Drink Never Seldom the time Always
All 48.6% 35.3% 8.8% 4.2% 3.1%
At parties
Do Not Most of
Drink Never Seldom the time Always
All 50.5% 21.0% 11.6% 9.6% 7.3%
8/6/2019 fort worth isd - dunbar middle school (grades 7-8) - 1998 Texas School Survey of Drug and Alcohol Use
http://slidepdf.com/reader/full/fort-worth-isd-dunbar-middle-school-grades-7-8-1998-texas-school-survey 16/138
Fort Worth ISD - Dunbar Middle School (Grades 7-8)
Spring 1998
──────────────────────────────────────────────────────────────────────────────────────────────
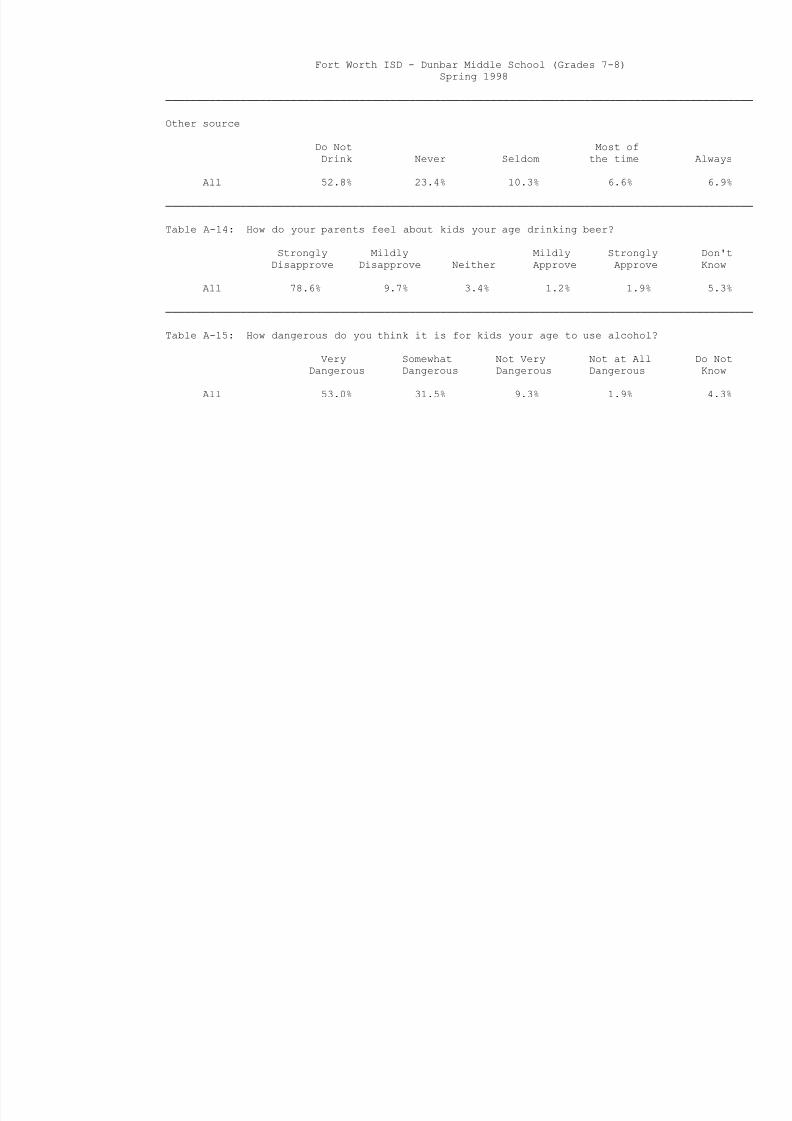
Other source
Do Not Most of
Drink Never Seldom the time Always
All 52.8% 23.4% 10.3% 6.6% 6.9%
──────────────────────────────────────────────────────────────────────────────────────────────
Table A-14: How do your parents feel about kids your age drinking beer?
Strongly Mildly Mildly Strongly Don't
Disapprove Disapprove Neither Approve Approve Know
All 78.6% 9.7% 3.4% 1.2% 1.9% 5.3%
──────────────────────────────────────────────────────────────────────────────────────────────
Table A-15: How dangerous do you think it is for kids your age to use alcohol?
Very Somewhat Not Very Not at All Do Not
Dangerous Dangerous Dangerous Dangerous Know
All 53.0% 31.5% 9.3% 1.9% 4.3%
8/6/2019 fort worth isd - dunbar middle school (grades 7-8) - 1998 Texas School Survey of Drug and Alcohol Use
http://slidepdf.com/reader/full/fort-worth-isd-dunbar-middle-school-grades-7-8-1998-texas-school-survey 17/138
Fort Worth ISD - Dunbar Middle School (Grades 7-8)
Spring 1998
──────────────────────────────────────────────────────────────────────────────────────────────
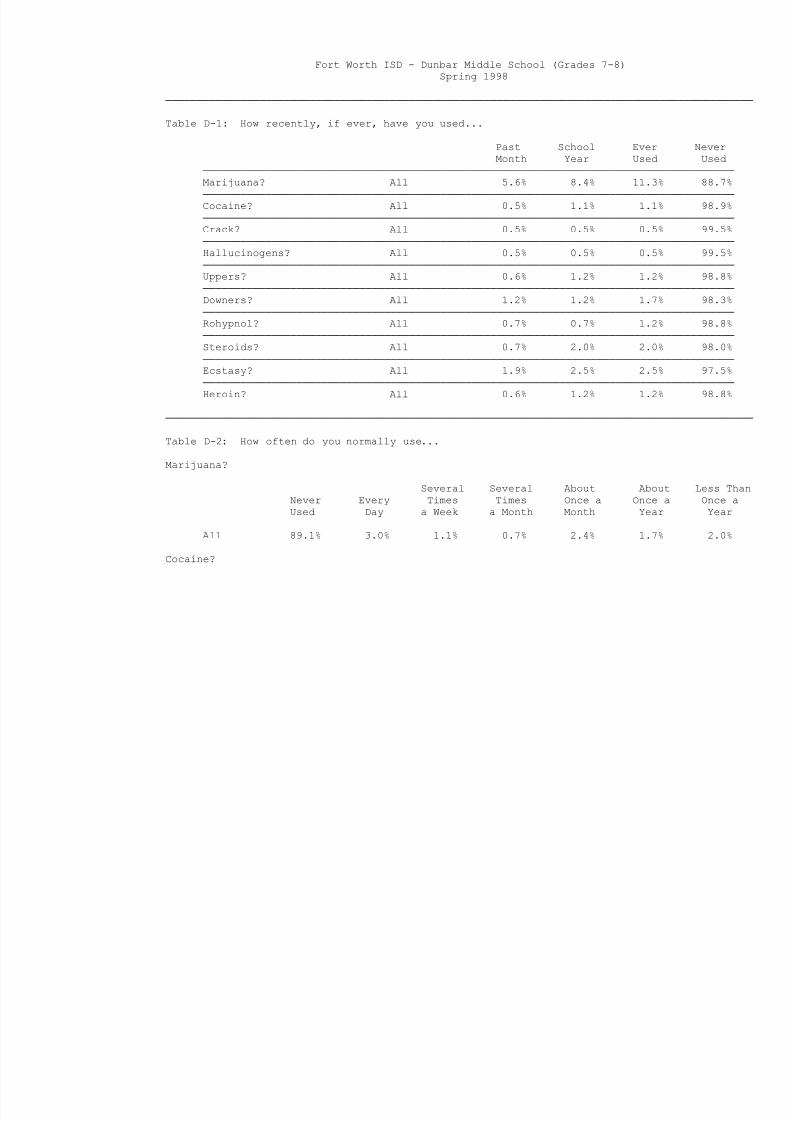
Table D-1: How recently, if ever, have you used...
Past School Ever Never
Month Year Used Used
─────────────────────────────────────────────────────────────────────────────────────
Marijuana? All 5.6% 8.4% 11.3% 88.7%
─────────────────────────────────────────────────────────────────────────────────────
Cocaine? All 0.5% 1.1% 1.1% 98.9%
─────────────────────────────────────────────────────────────────────────────────────
Crack? All 0.5% 0.5% 0.5% 99.5%
─────────────────────────────────────────────────────────────────────────────────────
Hallucinogens? All 0.5% 0.5% 0.5% 99.5%
─────────────────────────────────────────────────────────────────────────────────────
Uppers? All 0.6% 1.2% 1.2% 98.8%─────────────────────────────────────────────────────────────────────────────────────
Downers? All 1.2% 1.2% 1.7% 98.3%
─────────────────────────────────────────────────────────────────────────────────────
Rohypnol? All 0.7% 0.7% 1.2% 98.8%
─────────────────────────────────────────────────────────────────────────────────────
Steroids? All 0.7% 2.0% 2.0% 98.0%
─────────────────────────────────────────────────────────────────────────────────────
Ecstasy? All 1.9% 2.5% 2.5% 97.5%
─────────────────────────────────────────────────────────────────────────────────────
Heroin? All 0.6% 1.2% 1.2% 98.8%
──────────────────────────────────────────────────────────────────────────────────────────────
Table D-2: How often do you normally use...
Marijuana?
Several Several About About Less Than
Never Every Times Times Once a Once a Once a
Used Day a Week a Month Month Year Year
All 89.1% 3.0% 1.1% 0.7% 2.4% 1.7% 2.0%
Cocaine?
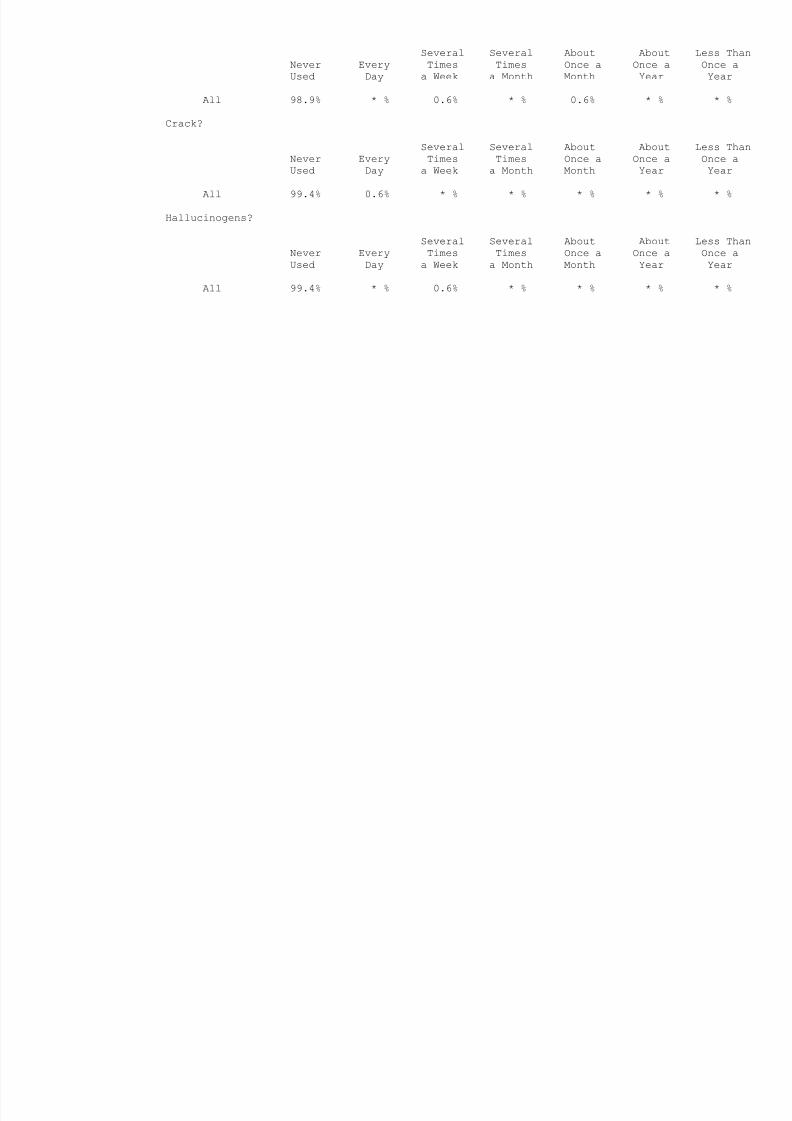
8/6/2019 fort worth isd - dunbar middle school (grades 7-8) - 1998 Texas School Survey of Drug and Alcohol Use
http://slidepdf.com/reader/full/fort-worth-isd-dunbar-middle-school-grades-7-8-1998-texas-school-survey 18/138
Several Several About About Less Than
Never Every Times Times Once a Once a Once a
Used Day a Week a Month Month Year Year
All 98.9% * % 0.6% * % 0.6% * % * %
Crack?
Several Several About About Less Than
Never Every Times Times Once a Once a Once a
Used Day a Week a Month Month Year Year
All 99.4% 0.6% * % * % * % * % * %
Hallucinogens?
Several Several About About Less Than
Never Every Times Times Once a Once a Once a
Used Day a Week a Month Month Year Year
All 99.4% * % 0.6% * % * % * % * %

8/6/2019 fort worth isd - dunbar middle school (grades 7-8) - 1998 Texas School Survey of Drug and Alcohol Use
http://slidepdf.com/reader/full/fort-worth-isd-dunbar-middle-school-grades-7-8-1998-texas-school-survey 19/138
Fort Worth ISD - Dunbar Middle School (Grades 7-8)
Spring 1998
──────────────────────────────────────────────────────────────────────────────────────────────
Uppers?
Several Several About About Less Than
Never Every Times Times Once a Once a Once a
Used Day a Week a Month Month Year Year
All 98.8% * % * % 0.6% * % 0.6% * %
Downers?
Several Several About About Less Than
Never Every Times Times Once a Once a Once a
Used Day a Week a Month Month Year Year
All 98.8% * % * % 0.6% * % 0.6% * %
Rohypnol?
Several Several About About Less Than
Never Every Times Times Once a Once a Once a
Used Day a Week a Month Month Year Year
All 99.4% * % * % * % * % * % 0.6%
Steroids?
Several Several About About Less Than
Never Every Times Times Once a Once a Once a
Used Day a Week a Month Month Year Year
All 97.8% * % 1.4% * % * % 0.8% * %
Ecstasy?
Several Several About About Less Than
Never Every Times Times Once a Once a Once a
Used Day a Week a Month Month Year Year
8/6/2019 fort worth isd - dunbar middle school (grades 7-8) - 1998 Texas School Survey of Drug and Alcohol Use
http://slidepdf.com/reader/full/fort-worth-isd-dunbar-middle-school-grades-7-8-1998-texas-school-survey 20/138
All 98.6% 0.8% * % * % 0.6% * % * %
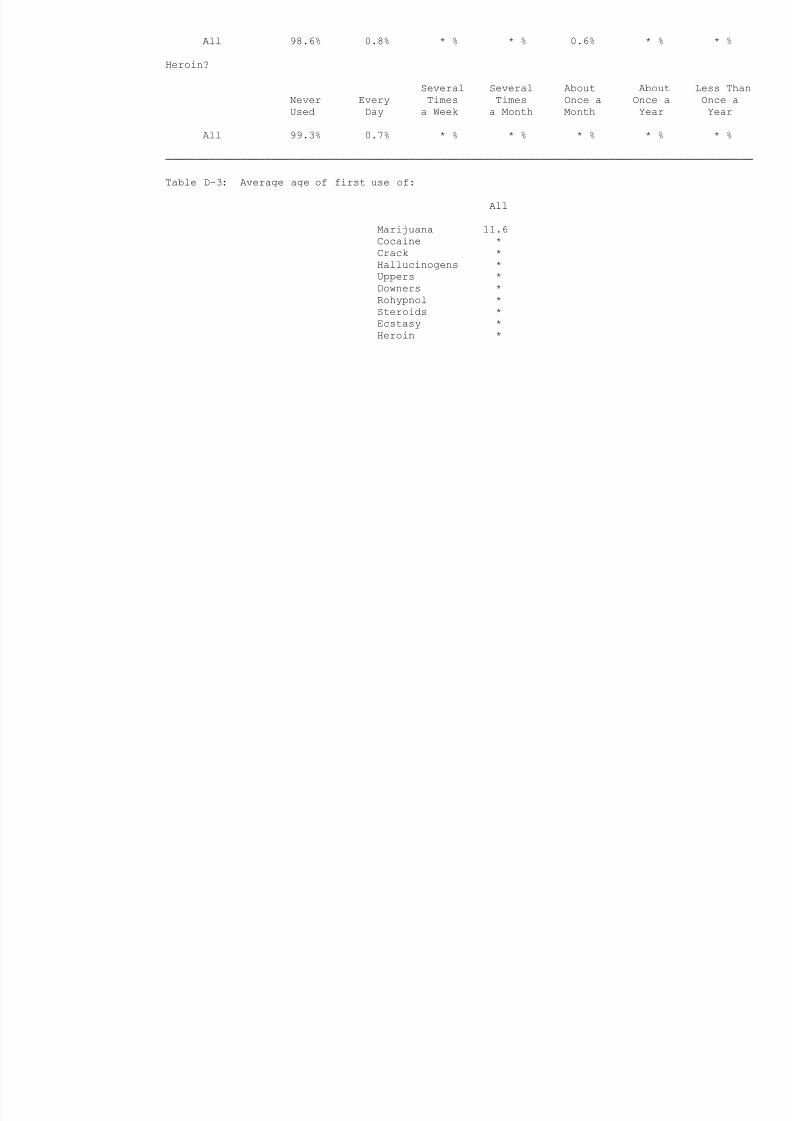
Heroin?
Several Several About About Less Than
Never Every Times Times Once a Once a Once a
Used Day a Week a Month Month Year Year
All 99.3% 0.7% * % * % * % * % * %
──────────────────────────────────────────────────────────────────────────────────────────────
Table D-3: Average age of first use of:
All
Marijuana 11.6
Cocaine *
Crack *
Hallucinogens *
Uppers *Downers *
Rohypnol *
Steroids *
Ecstasy *
Heroin *
8/6/2019 fort worth isd - dunbar middle school (grades 7-8) - 1998 Texas School Survey of Drug and Alcohol Use
http://slidepdf.com/reader/full/fort-worth-isd-dunbar-middle-school-grades-7-8-1998-texas-school-survey 21/138
Fort Worth ISD - Dunbar Middle School (Grades 7-8)
Spring 1998
──────────────────────────────────────────────────────────────────────────────────────────────
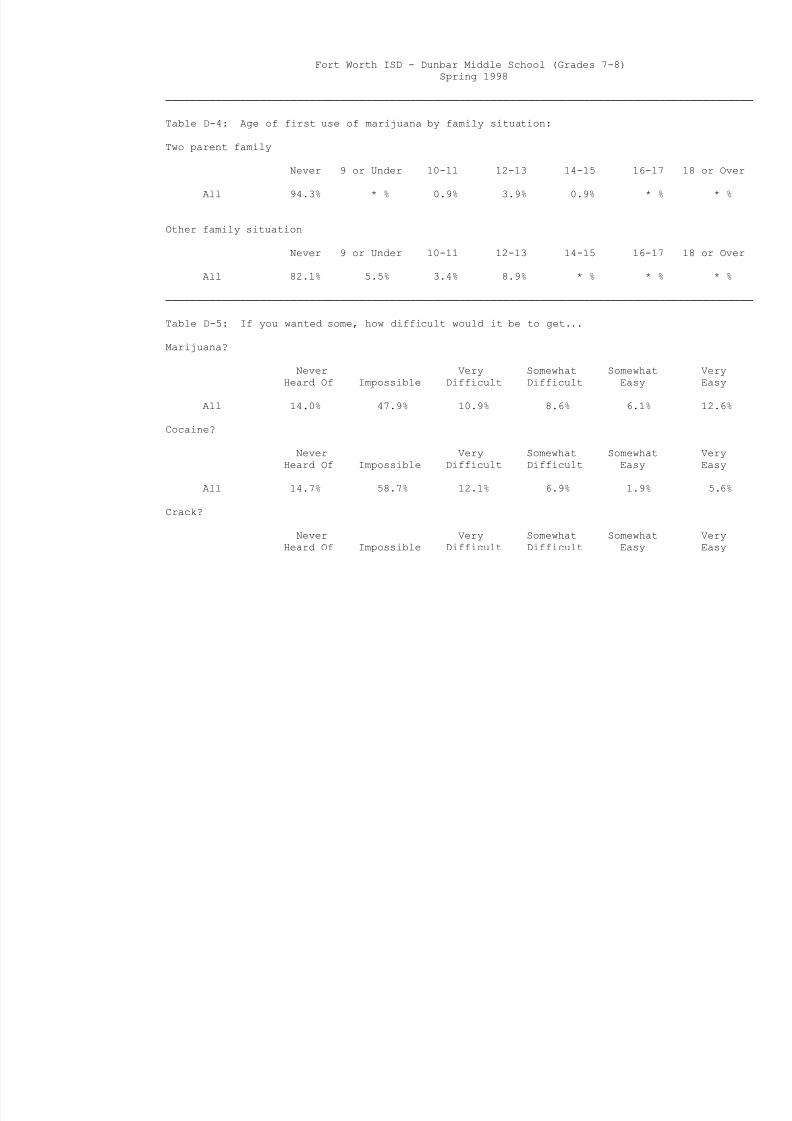
Table D-4: Age of first use of marijuana by family situation:
Two parent family
Never 9 or Under 10-11 12-13 14-15 16-17 18 or Over
All 94.3% * % 0.9% 3.9% 0.9% * % * %
Other family situation
Never 9 or Under 10-11 12-13 14-15 16-17 18 or Over
All 82.1% 5.5% 3.4% 8.9% * % * % * %
──────────────────────────────────────────────────────────────────────────────────────────────
Table D-5: If you wanted some, how difficult would it be to get...
Marijuana?
Never Very Somewhat Somewhat Very
Heard Of Impossible Difficult Difficult Easy Easy
All 14.0% 47.9% 10.9% 8.6% 6.1% 12.6%
Cocaine?
Never Very Somewhat Somewhat Very
Heard Of Impossible Difficult Difficult Easy Easy
All 14.7% 58.7% 12.1% 6.9% 1.9% 5.6%
Crack?
Never Very Somewhat Somewhat Very
Heard Of Impossible Difficult Difficult Easy Easy
8/6/2019 fort worth isd - dunbar middle school (grades 7-8) - 1998 Texas School Survey of Drug and Alcohol Use
http://slidepdf.com/reader/full/fort-worth-isd-dunbar-middle-school-grades-7-8-1998-texas-school-survey 22/138
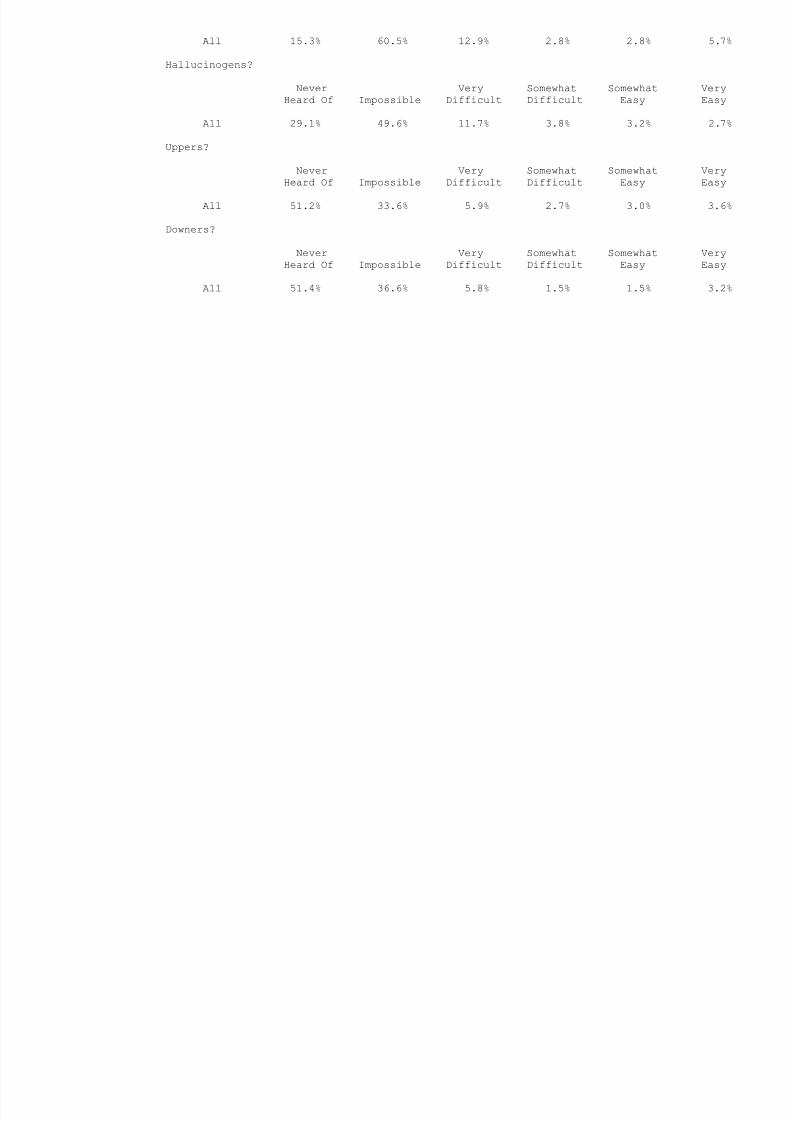
All 15.3% 60.5% 12.9% 2.8% 2.8% 5.7%
Hallucinogens?
Never Very Somewhat Somewhat Very
Heard Of Impossible Difficult Difficult Easy Easy
All 29.1% 49.6% 11.7% 3.8% 3.2% 2.7%
Uppers?
Never Very Somewhat Somewhat Very
Heard Of Impossible Difficult Difficult Easy Easy
All 51.2% 33.6% 5.9% 2.7% 3.0% 3.6%
Downers?
Never Very Somewhat Somewhat Very
Heard Of Impossible Difficult Difficult Easy Easy
All 51.4% 36.6% 5.8% 1.5% 1.5% 3.2%
8/6/2019 fort worth isd - dunbar middle school (grades 7-8) - 1998 Texas School Survey of Drug and Alcohol Use
http://slidepdf.com/reader/full/fort-worth-isd-dunbar-middle-school-grades-7-8-1998-texas-school-survey 23/138
Fort Worth ISD - Dunbar Middle School (Grades 7-8)
Spring 1998
──────────────────────────────────────────────────────────────────────────────────────────────
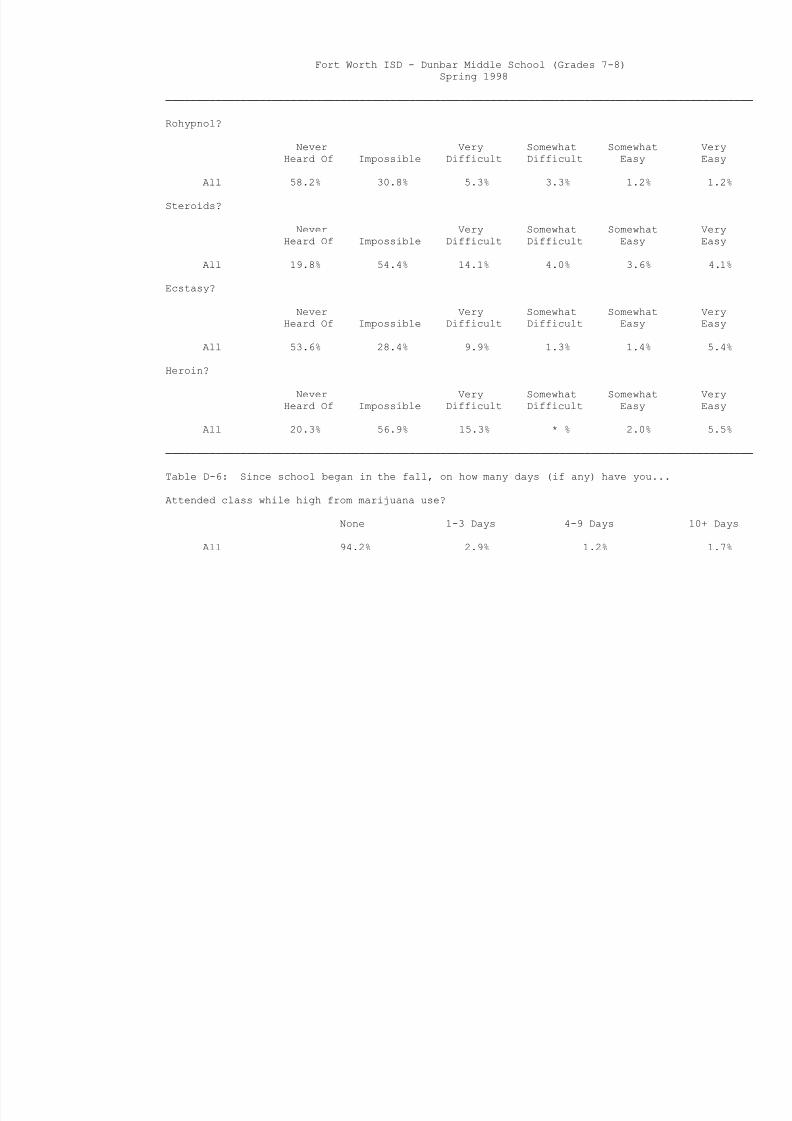
Rohypnol?
Never Very Somewhat Somewhat Very
Heard Of Impossible Difficult Difficult Easy Easy
All 58.2% 30.8% 5.3% 3.3% 1.2% 1.2%
Steroids?
Never Very Somewhat Somewhat Very
Heard Of Impossible Difficult Difficult Easy Easy
All 19.8% 54.4% 14.1% 4.0% 3.6% 4.1%
Ecstasy?
Never Very Somewhat Somewhat Very
Heard Of Impossible Difficult Difficult Easy Easy
All 53.6% 28.4% 9.9% 1.3% 1.4% 5.4%
Heroin?
Never Very Somewhat Somewhat Very
Heard Of Impossible Difficult Difficult Easy Easy
All 20.3% 56.9% 15.3% * % 2.0% 5.5%
──────────────────────────────────────────────────────────────────────────────────────────────
Table D-6: Since school began in the fall, on how many days (if any) have you...
Attended class while high from marijuana use?
None 1-3 Days 4-9 Days 10+ Days
All 94.2% 2.9% 1.2% 1.7%
8/6/2019 fort worth isd - dunbar middle school (grades 7-8) - 1998 Texas School Survey of Drug and Alcohol Use
http://slidepdf.com/reader/full/fort-worth-isd-dunbar-middle-school-grades-7-8-1998-texas-school-survey 24/138
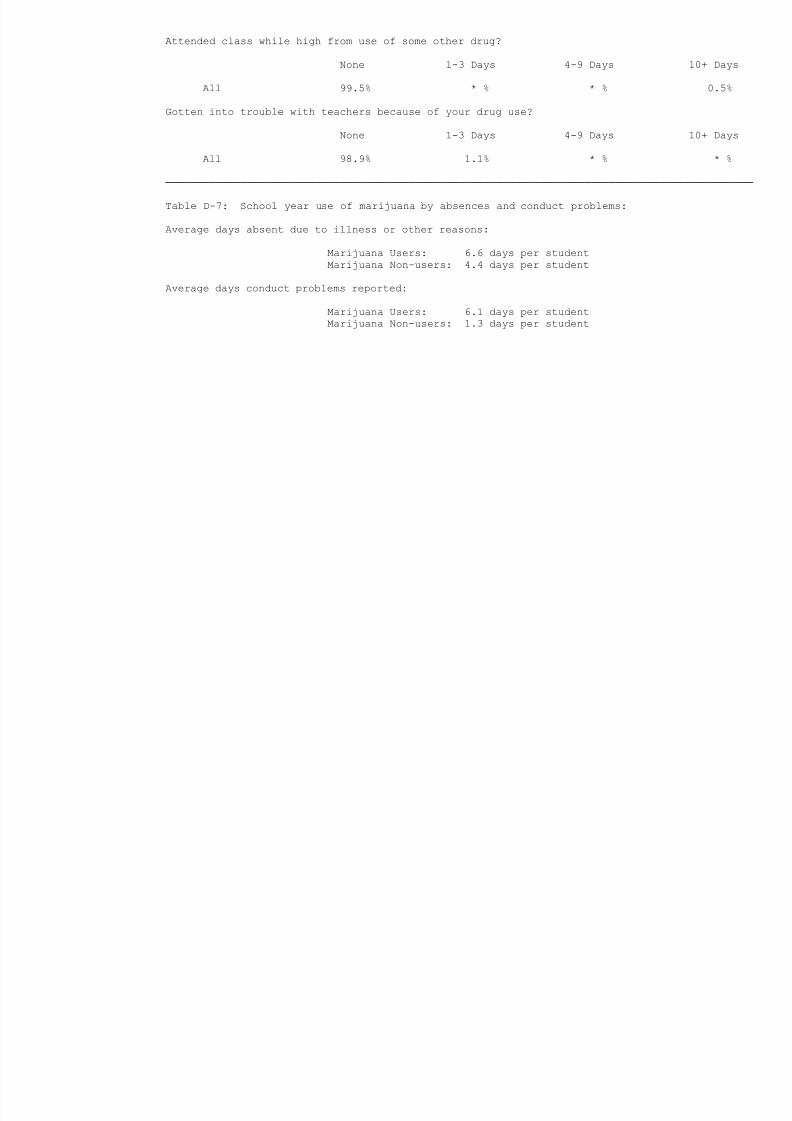
Attended class while high from use of some other drug?
None 1-3 Days 4-9 Days 10+ Days
All 99.5% * % * % 0.5%
Gotten into trouble with teachers because of your drug use?
None 1-3 Days 4-9 Days 10+ Days
All 98.9% 1.1% * % * %
──────────────────────────────────────────────────────────────────────────────────────────────
Table D-7: School year use of marijuana by absences and conduct problems:
Average days absent due to illness or other reasons:
Marijuana Users: 6.6 days per student
Marijuana Non-users: 4.4 days per student
Average days conduct problems reported:
Marijuana Users: 6.1 days per student
Marijuana Non-users: 1.3 days per student
8/6/2019 fort worth isd - dunbar middle school (grades 7-8) - 1998 Texas School Survey of Drug and Alcohol Use
http://slidepdf.com/reader/full/fort-worth-isd-dunbar-middle-school-grades-7-8-1998-texas-school-survey 25/138
Fort Worth ISD - Dunbar Middle School (Grades 7-8)
Spring 1998
──────────────────────────────────────────────────────────────────────────────────────────────
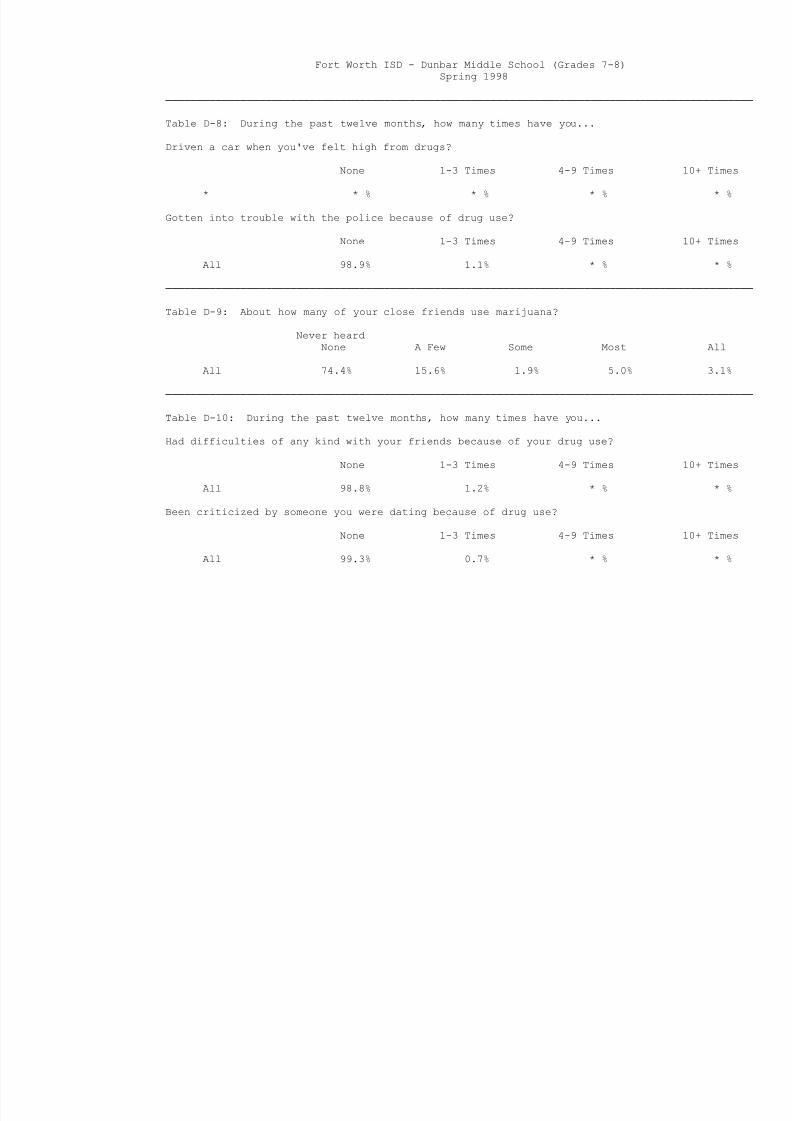
Table D-8: During the past twelve months, how many times have you...
Driven a car when you've felt high from drugs?
None 1-3 Times 4-9 Times 10+ Times
* * % * % * % * %
Gotten into trouble with the police because of drug use?
None 1-3 Times 4-9 Times 10+ Times
All 98.9% 1.1% * % * %
──────────────────────────────────────────────────────────────────────────────────────────────
Table D-9: About how many of your close friends use marijuana?
Never heard
None A Few Some Most All
All 74.4% 15.6% 1.9% 5.0% 3.1%
──────────────────────────────────────────────────────────────────────────────────────────────
Table D-10: During the past twelve months, how many times have you...
Had difficulties of any kind with your friends because of your drug use?
None 1-3 Times 4-9 Times 10+ Times
All 98.8% 1.2% * % * %
Been criticized by someone you were dating because of drug use?
None 1-3 Times 4-9 Times 10+ Times
All 99.3% 0.7% * % * %
8/6/2019 fort worth isd - dunbar middle school (grades 7-8) - 1998 Texas School Survey of Drug and Alcohol Use
http://slidepdf.com/reader/full/fort-worth-isd-dunbar-middle-school-grades-7-8-1998-texas-school-survey 26/138
──────────────────────────────────────────────────────────────────────────────────────────────
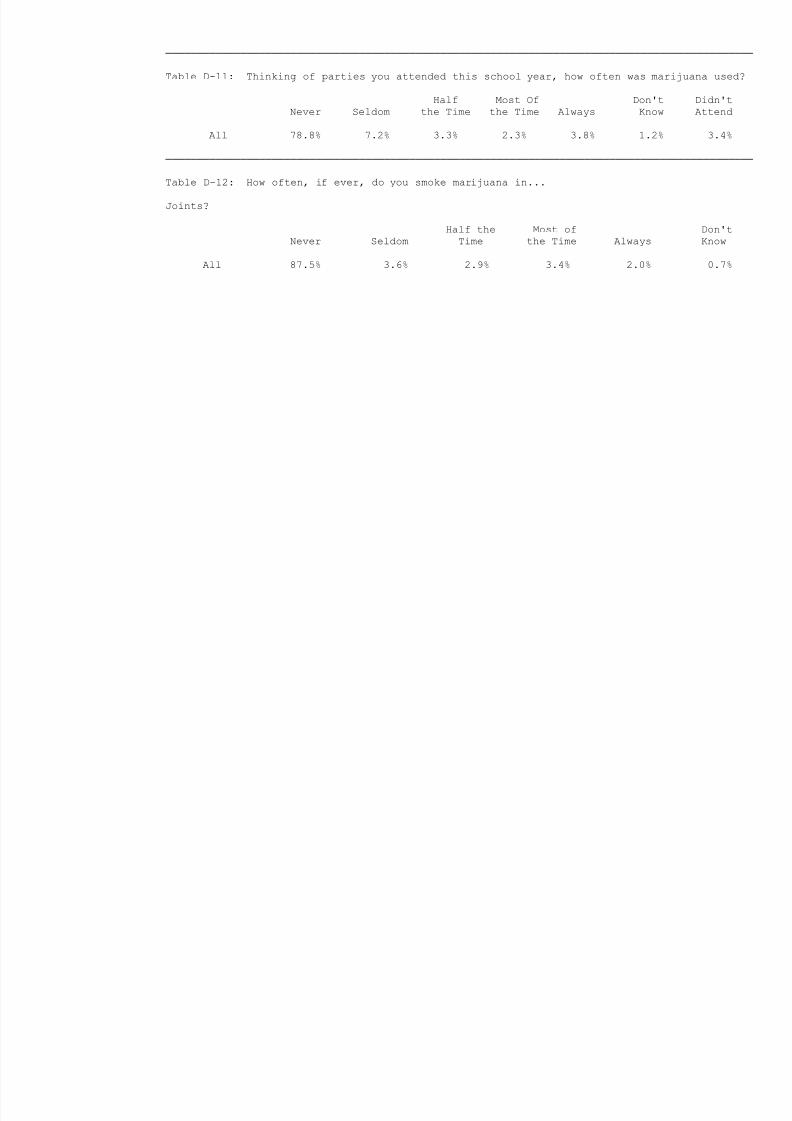
Table D-11: Thinking of parties you attended this school year, how often was marijuana used?
Half Most Of Don't Didn't
Never Seldom the Time the Time Always Know Attend
All 78.8% 7.2% 3.3% 2.3% 3.8% 1.2% 3.4%
──────────────────────────────────────────────────────────────────────────────────────────────
Table D-12: How often, if ever, do you smoke marijuana in...
Joints?
Half the Most of Don't
Never Seldom Time the Time Always Know
All 87.5% 3.6% 2.9% 3.4% 2.0% 0.7%
8/6/2019 fort worth isd - dunbar middle school (grades 7-8) - 1998 Texas School Survey of Drug and Alcohol Use
http://slidepdf.com/reader/full/fort-worth-isd-dunbar-middle-school-grades-7-8-1998-texas-school-survey 27/138
Fort Worth ISD - Dunbar Middle School (Grades 7-8)
Spring 1998
──────────────────────────────────────────────────────────────────────────────────────────────
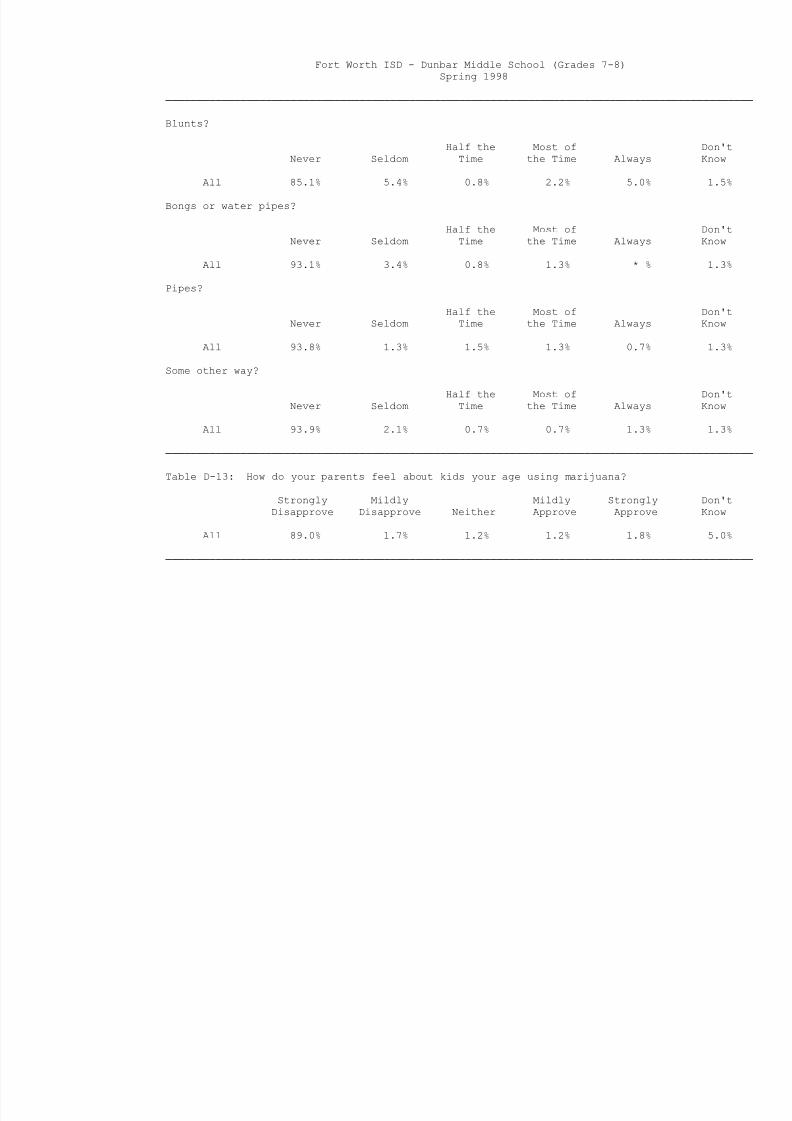
Blunts?
Half the Most of Don't
Never Seldom Time the Time Always Know
All 85.1% 5.4% 0.8% 2.2% 5.0% 1.5%
Bongs or water pipes?
Half the Most of Don't
Never Seldom Time the Time Always Know
All 93.1% 3.4% 0.8% 1.3% * % 1.3%
Pipes?
Half the Most of Don't
Never Seldom Time the Time Always Know
All 93.8% 1.3% 1.5% 1.3% 0.7% 1.3%
Some other way?
Half the Most of Don't
Never Seldom Time the Time Always Know
All 93.9% 2.1% 0.7% 0.7% 1.3% 1.3%
──────────────────────────────────────────────────────────────────────────────────────────────
Table D-13: How do your parents feel about kids your age using marijuana?
Strongly Mildly Mildly Strongly Don't
Disapprove Disapprove Neither Approve Approve Know
All 89.0% 1.7% 1.2% 1.2% 1.8% 5.0%
──────────────────────────────────────────────────────────────────────────────────────────────
8/6/2019 fort worth isd - dunbar middle school (grades 7-8) - 1998 Texas School Survey of Drug and Alcohol Use
http://slidepdf.com/reader/full/fort-worth-isd-dunbar-middle-school-grades-7-8-1998-texas-school-survey 28/138
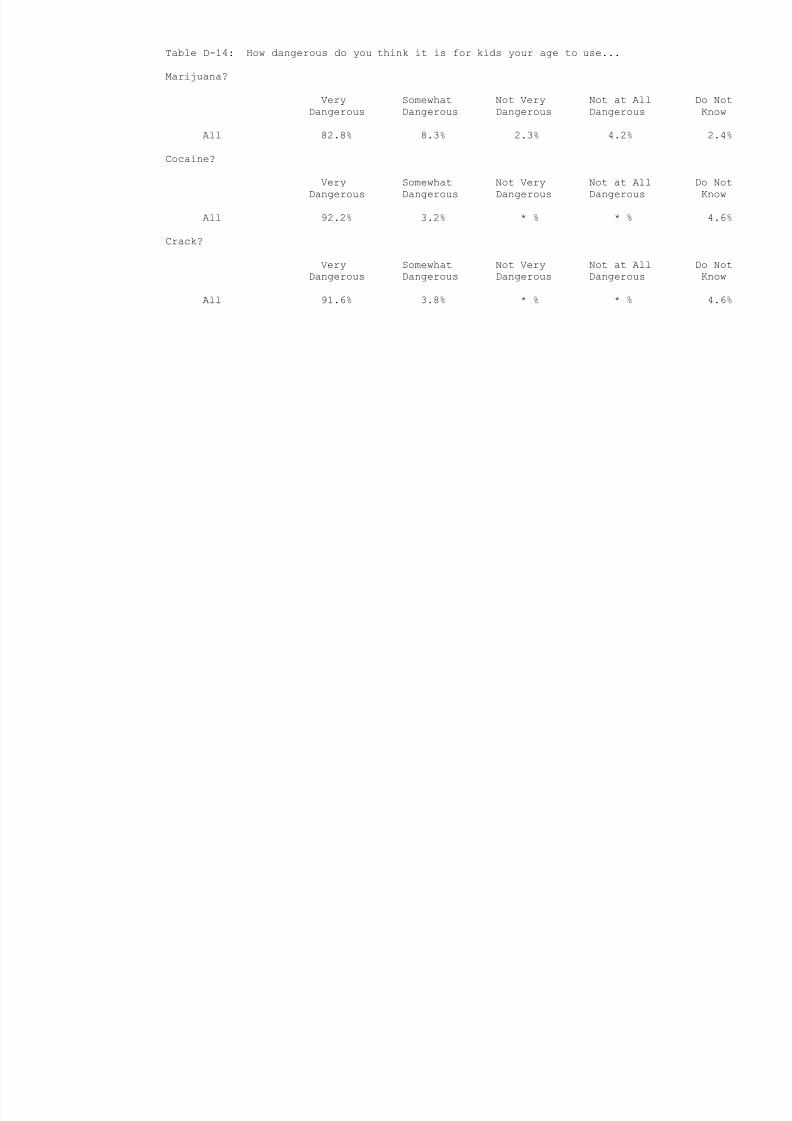
Table D-14: How dangerous do you think it is for kids your age to use...
Marijuana?
Very Somewhat Not Very Not at All Do Not
Dangerous Dangerous Dangerous Dangerous Know
All 82.8% 8.3% 2.3% 4.2% 2.4%
Cocaine?
Very Somewhat Not Very Not at All Do Not
Dangerous Dangerous Dangerous Dangerous Know
All 92.2% 3.2% * % * % 4.6%
Crack?
Very Somewhat Not Very Not at All Do Not
Dangerous Dangerous Dangerous Dangerous Know
All 91.6% 3.8% * % * % 4.6%
8/6/2019 fort worth isd - dunbar middle school (grades 7-8) - 1998 Texas School Survey of Drug and Alcohol Use
http://slidepdf.com/reader/full/fort-worth-isd-dunbar-middle-school-grades-7-8-1998-texas-school-survey 29/138
Fort Worth ISD - Dunbar Middle School (Grades 7-8)
Spring 1998
──────────────────────────────────────────────────────────────────────────────────────────────
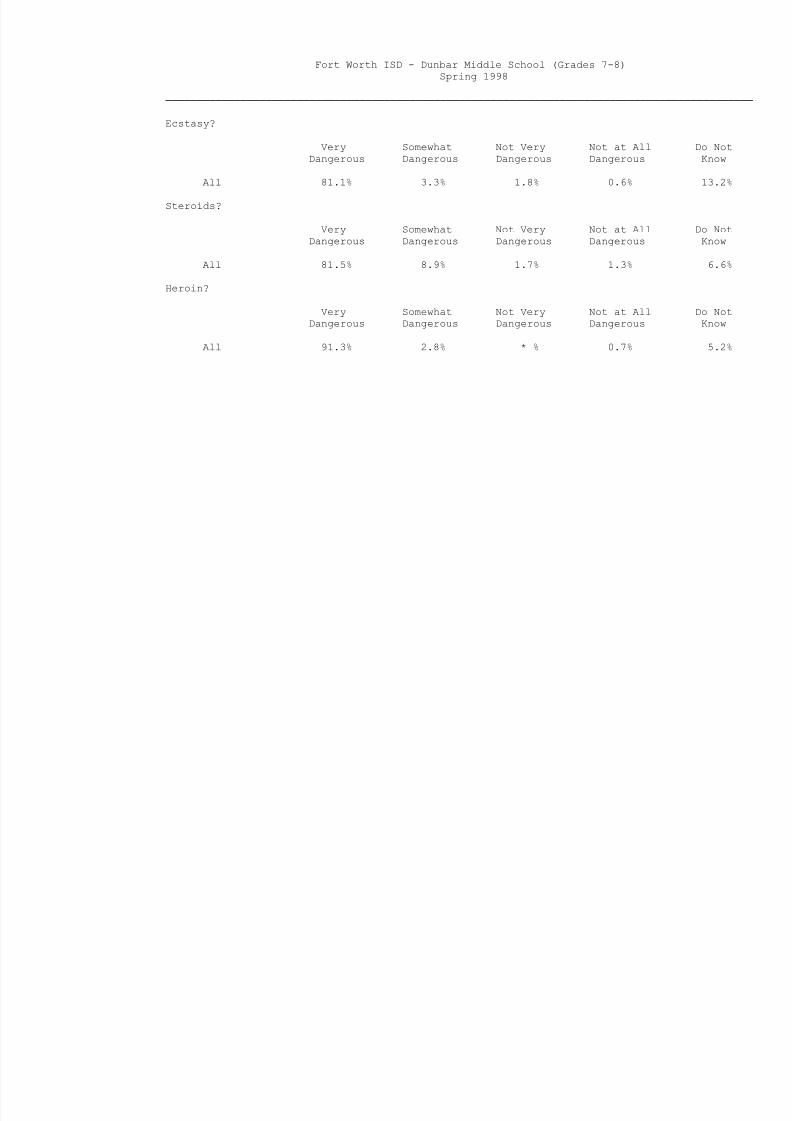
Ecstasy?
Very Somewhat Not Very Not at All Do Not
Dangerous Dangerous Dangerous Dangerous Know
All 81.1% 3.3% 1.8% 0.6% 13.2%
Steroids?
Very Somewhat Not Very Not at All Do Not
Dangerous Dangerous Dangerous Dangerous Know
All 81.5% 8.9% 1.7% 1.3% 6.6%
Heroin?
Very Somewhat Not Very Not at All Do Not
Dangerous Dangerous Dangerous Dangerous Know
All 91.3% 2.8% * % 0.7% 5.2%

8/6/2019 fort worth isd - dunbar middle school (grades 7-8) - 1998 Texas School Survey of Drug and Alcohol Use
http://slidepdf.com/reader/full/fort-worth-isd-dunbar-middle-school-grades-7-8-1998-texas-school-survey 30/138
8/6/2019 fort worth isd - dunbar middle school (grades 7-8) - 1998 Texas School Survey of Drug and Alcohol Use
http://slidepdf.com/reader/full/fort-worth-isd-dunbar-middle-school-grades-7-8-1998-texas-school-survey 31/138
Fort Worth ISD - Dunbar Middle School (Grades 7-8)
Spring 1998
──────────────────────────────────────────────────────────────────────────────────────────────
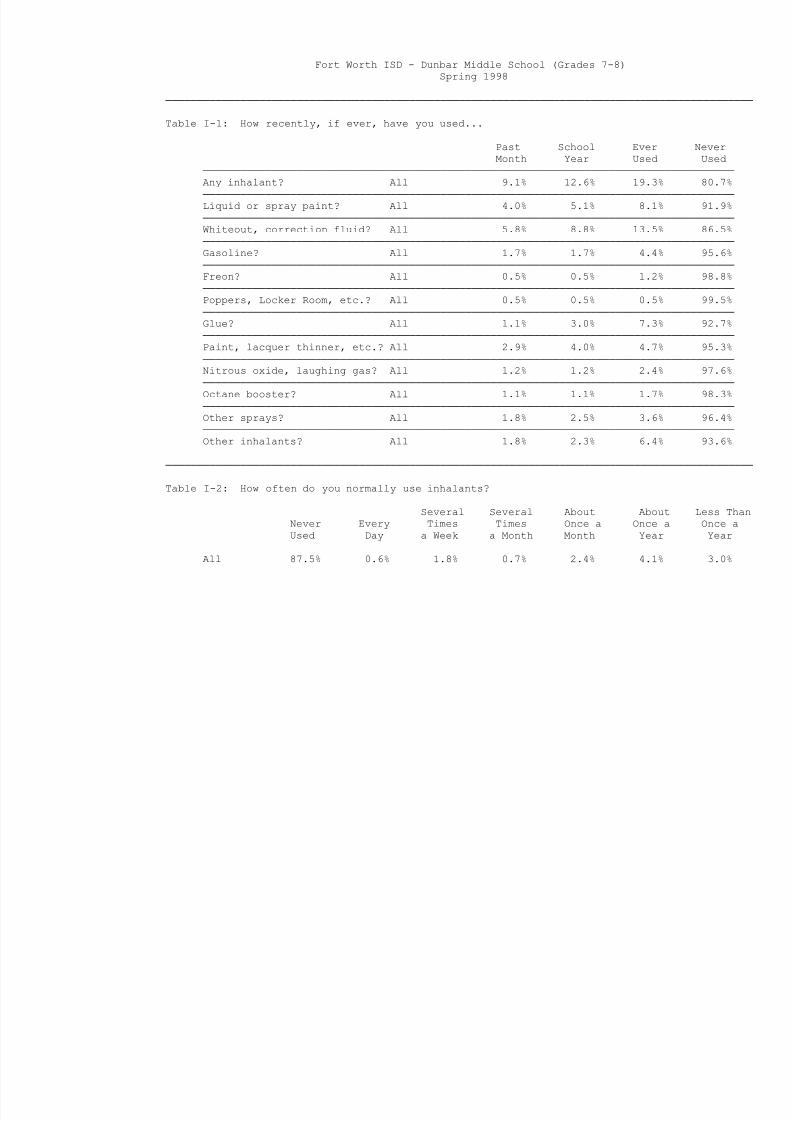
Table I-1: How recently, if ever, have you used...
Past School Ever Never
Month Year Used Used
─────────────────────────────────────────────────────────────────────────────────────
Any inhalant? All 9.1% 12.6% 19.3% 80.7%
─────────────────────────────────────────────────────────────────────────────────────
Liquid or spray paint? All 4.0% 5.1% 8.1% 91.9%
─────────────────────────────────────────────────────────────────────────────────────
Whiteout, correction fluid? All 5.8% 8.8% 13.5% 86.5%
─────────────────────────────────────────────────────────────────────────────────────
Gasoline? All 1.7% 1.7% 4.4% 95.6%
─────────────────────────────────────────────────────────────────────────────────────
Freon? All 0.5% 0.5% 1.2% 98.8%─────────────────────────────────────────────────────────────────────────────────────
Poppers, Locker Room, etc.? All 0.5% 0.5% 0.5% 99.5%
─────────────────────────────────────────────────────────────────────────────────────
Glue? All 1.1% 3.0% 7.3% 92.7%
─────────────────────────────────────────────────────────────────────────────────────
Paint, lacquer thinner, etc.? All 2.9% 4.0% 4.7% 95.3%
─────────────────────────────────────────────────────────────────────────────────────
Nitrous oxide, laughing gas? All 1.2% 1.2% 2.4% 97.6%
─────────────────────────────────────────────────────────────────────────────────────
Octane booster? All 1.1% 1.1% 1.7% 98.3%
─────────────────────────────────────────────────────────────────────────────────────
Other sprays? All 1.8% 2.5% 3.6% 96.4%─────────────────────────────────────────────────────────────────────────────────────
Other inhalants? All 1.8% 2.3% 6.4% 93.6%
──────────────────────────────────────────────────────────────────────────────────────────────
Table I-2: How often do you normally use inhalants?
Several Several About About Less Than
Never Every Times Times Once a Once a Once a
Used Day a Week a Month Month Year Year
All 87.5% 0.6% 1.8% 0.7% 2.4% 4.1% 3.0%
8/6/2019 fort worth isd - dunbar middle school (grades 7-8) - 1998 Texas School Survey of Drug and Alcohol Use
http://slidepdf.com/reader/full/fort-worth-isd-dunbar-middle-school-grades-7-8-1998-texas-school-survey 32/138
──────────────────────────────────────────────────────────────────────────────────────────────
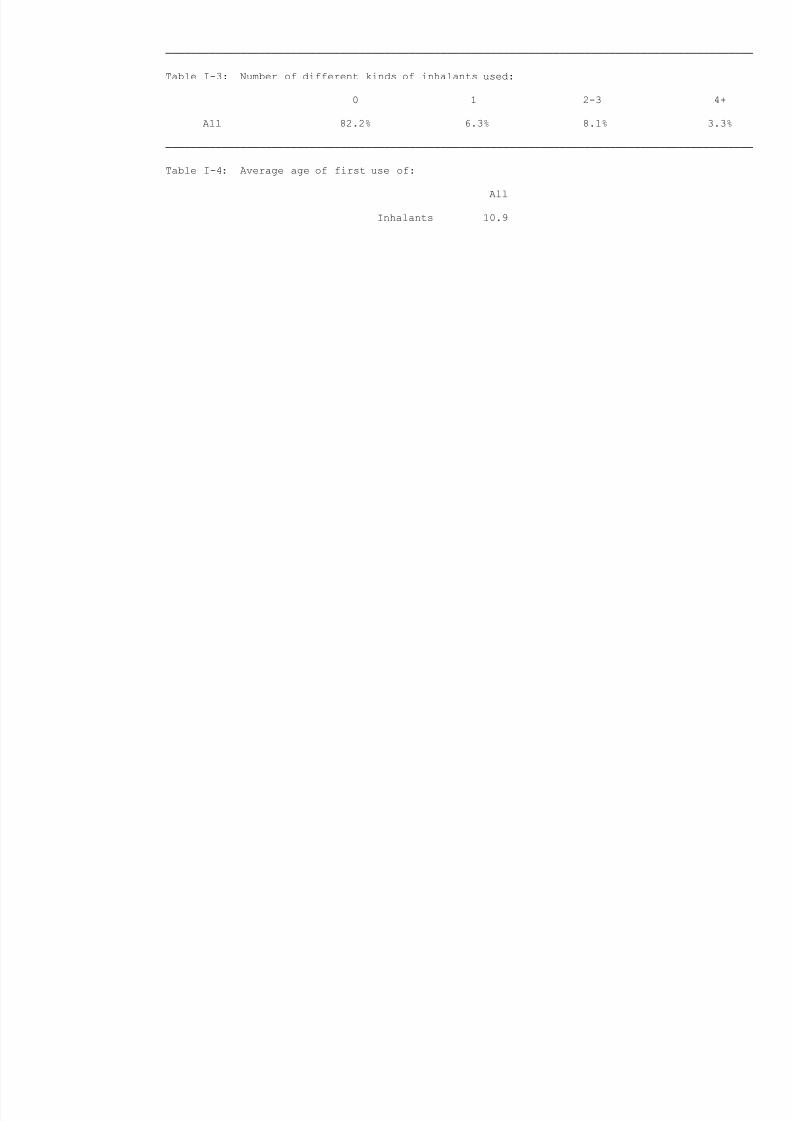
Table I-3: Number of different kinds of inhalants used:
0 1 2-3 4+
All 82.2% 6.3% 8.1% 3.3%
──────────────────────────────────────────────────────────────────────────────────────────────
Table I-4: Average age of first use of:
All
Inhalants 10.9
8/6/2019 fort worth isd - dunbar middle school (grades 7-8) - 1998 Texas School Survey of Drug and Alcohol Use
http://slidepdf.com/reader/full/fort-worth-isd-dunbar-middle-school-grades-7-8-1998-texas-school-survey 33/138
Fort Worth ISD - Dunbar Middle School (Grades 7-8)
Spring 1998
──────────────────────────────────────────────────────────────────────────────────────────────
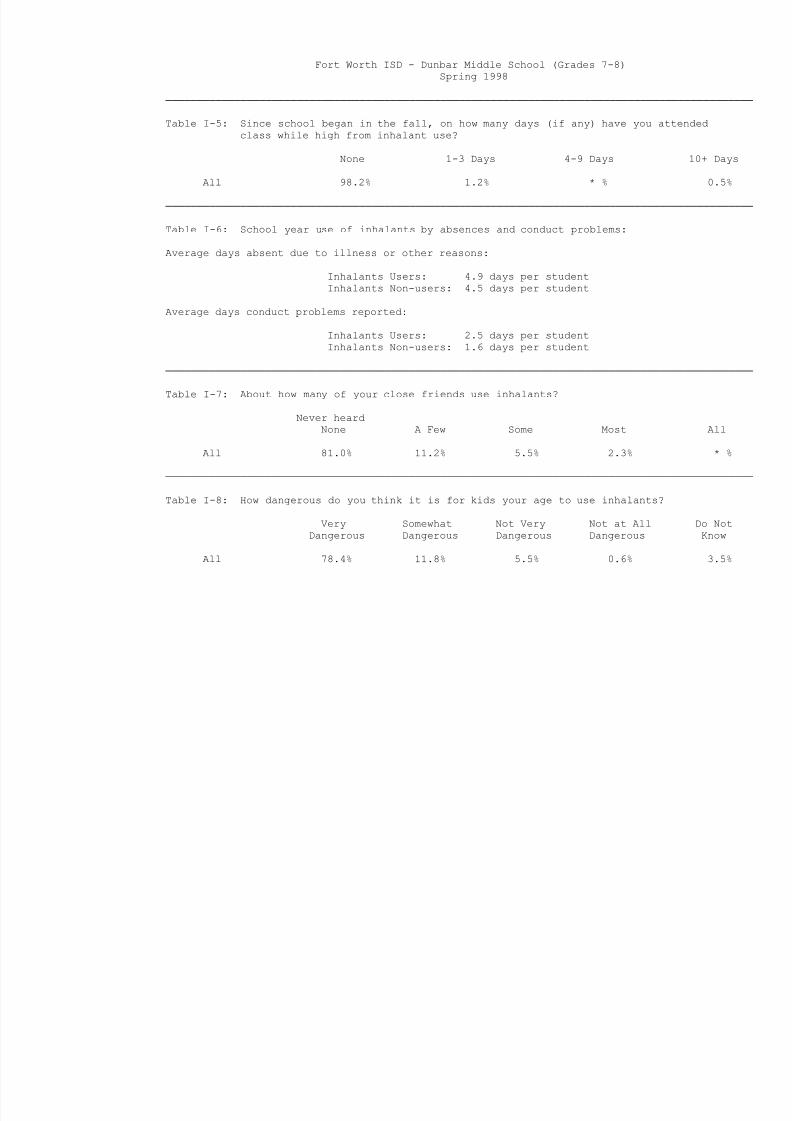
Table I-5: Since school began in the fall, on how many days (if any) have you attended
class while high from inhalant use?
None 1-3 Days 4-9 Days 10+ Days
All 98.2% 1.2% * % 0.5%
──────────────────────────────────────────────────────────────────────────────────────────────
Table I-6: School year use of inhalants by absences and conduct problems:
Average days absent due to illness or other reasons:
Inhalants Users: 4.9 days per studentInhalants Non-users: 4.5 days per student
Average days conduct problems reported:
Inhalants Users: 2.5 days per student
Inhalants Non-users: 1.6 days per student
──────────────────────────────────────────────────────────────────────────────────────────────
Table I-7: About how many of your close friends use inhalants?
Never heardNone A Few Some Most All
All 81.0% 11.2% 5.5% 2.3% * %
──────────────────────────────────────────────────────────────────────────────────────────────
Table I-8: How dangerous do you think it is for kids your age to use inhalants?
Very Somewhat Not Very Not at All Do Not
Dangerous Dangerous Dangerous Dangerous Know
All 78.4% 11.8% 5.5% 0.6% 3.5%

8/6/2019 fort worth isd - dunbar middle school (grades 7-8) - 1998 Texas School Survey of Drug and Alcohol Use
http://slidepdf.com/reader/full/fort-worth-isd-dunbar-middle-school-grades-7-8-1998-texas-school-survey 34/138
8/6/2019 fort worth isd - dunbar middle school (grades 7-8) - 1998 Texas School Survey of Drug and Alcohol Use
http://slidepdf.com/reader/full/fort-worth-isd-dunbar-middle-school-grades-7-8-1998-texas-school-survey 35/138
Fort Worth ISD - Dunbar Middle School (Grades 7-8)
Spring 1998
──────────────────────────────────────────────────────────────────────────────────────────────
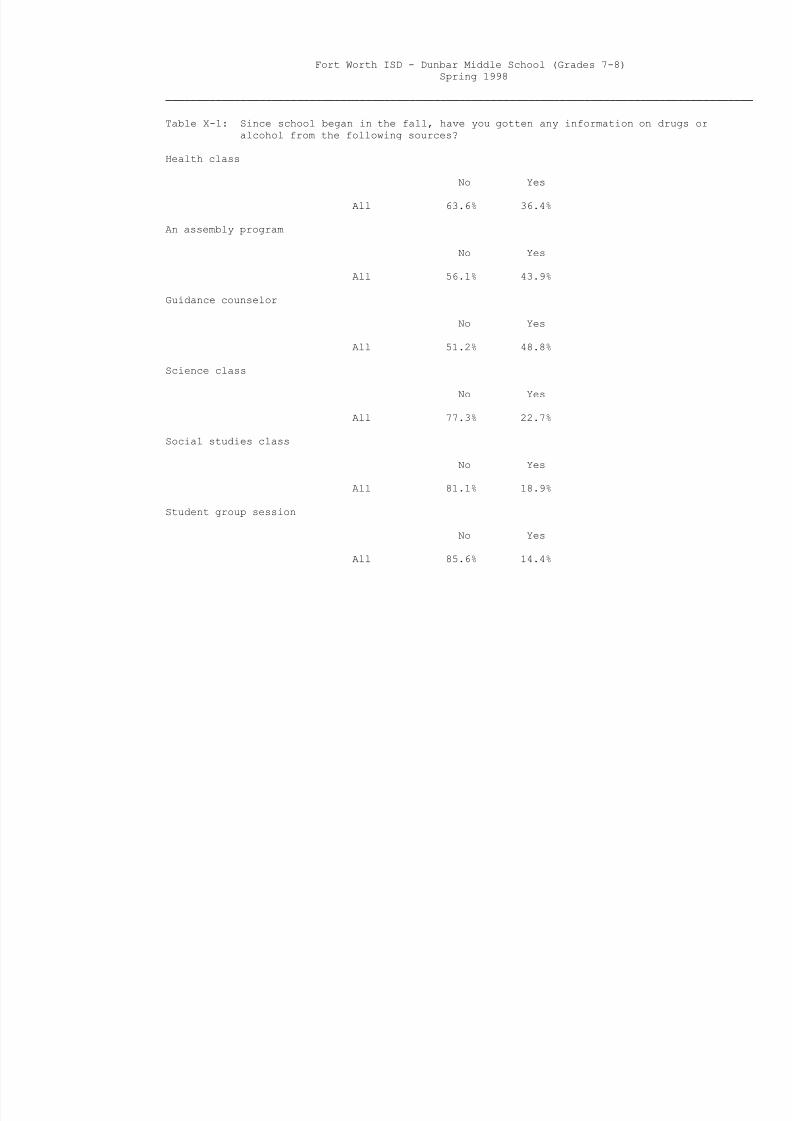
Table X-1: Since school began in the fall, have you gotten any information on drugs or
alcohol from the following sources?
Health class
No Yes
All 63.6% 36.4%
An assembly program
No Yes
All 56.1% 43.9%
Guidance counselor
No Yes
All 51.2% 48.8%
Science class
No Yes
All 77.3% 22.7%
Social studies class
No Yes
All 81.1% 18.9%
Student group session
No Yes
All 85.6% 14.4%
8/6/2019 fort worth isd - dunbar middle school (grades 7-8) - 1998 Texas School Survey of Drug and Alcohol Use
http://slidepdf.com/reader/full/fort-worth-isd-dunbar-middle-school-grades-7-8-1998-texas-school-survey 36/138
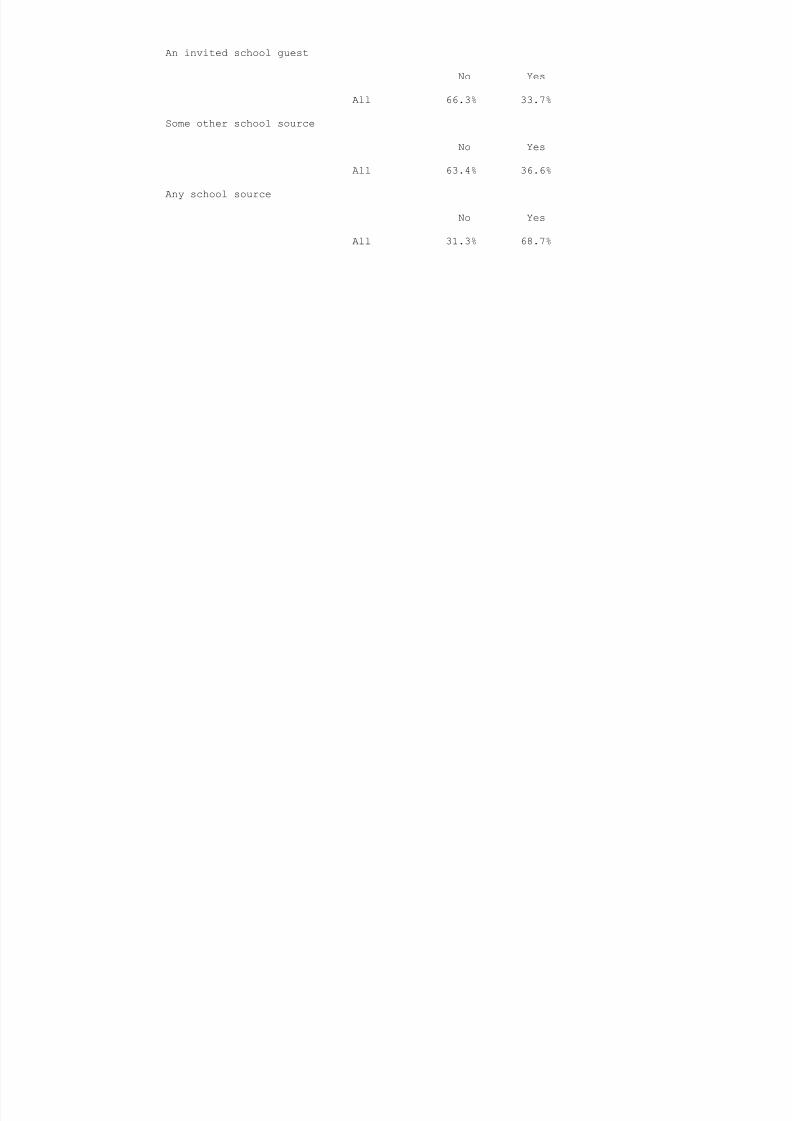
An invited school guest
No Yes
All 66.3% 33.7%
Some other school source
No Yes
All 63.4% 36.6%
Any school source
No Yes
All 31.3% 68.7%
8/6/2019 fort worth isd - dunbar middle school (grades 7-8) - 1998 Texas School Survey of Drug and Alcohol Use
http://slidepdf.com/reader/full/fort-worth-isd-dunbar-middle-school-grades-7-8-1998-texas-school-survey 37/138
Fort Worth ISD - Dunbar Middle School (Grades 7-8)
Spring 1998
──────────────────────────────────────────────────────────────────────────────────────────────
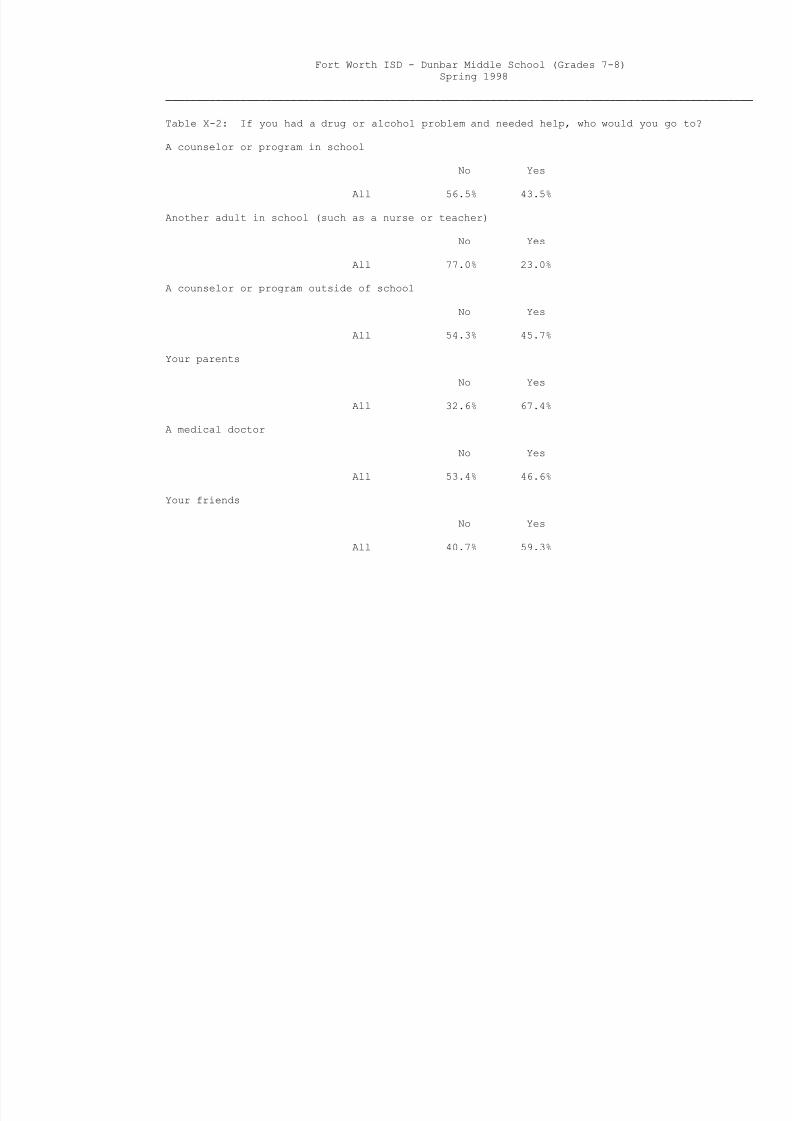
Table X-2: If you had a drug or alcohol problem and needed help, who would you go to?
A counselor or program in school
No Yes
All 56.5% 43.5%
Another adult in school (such as a nurse or teacher)
No Yes
All 77.0% 23.0%
A counselor or program outside of school
No Yes
All 54.3% 45.7%
Your parents
No Yes
All 32.6% 67.4%
A medical doctor
No Yes
All 53.4% 46.6%
Your friends
No Yes
All 40.7% 59.3%

8/6/2019 fort worth isd - dunbar middle school (grades 7-8) - 1998 Texas School Survey of Drug and Alcohol Use
http://slidepdf.com/reader/full/fort-worth-isd-dunbar-middle-school-grades-7-8-1998-texas-school-survey 38/138
Another adult (a relative, clergyman, or other family friend)
No Yes
All 35.2% 64.8%
──────────────────────────────────────────────────────────────────────────────────────────────
Table X-3: Since school began in the fall, have you sought help, other than from family or
friends, for problems in any way connected with your use of alcohol, marijuana,
or other drugs?
No Yes
All 98.6% 1.4%
──────────────────────────────────────────────────────────────────────────────────────────────
Table X-4: About how many of your friends:
Feel close to their parents?
None A Few Some Most All
All 3.0% 19.0% 20.1% 35.8% 22.2%
8/6/2019 fort worth isd - dunbar middle school (grades 7-8) - 1998 Texas School Survey of Drug and Alcohol Use
http://slidepdf.com/reader/full/fort-worth-isd-dunbar-middle-school-grades-7-8-1998-texas-school-survey 39/138
Fort Worth ISD - Dunbar Middle School (Grades 7-8)
Spring 1998
──────────────────────────────────────────────────────────────────────────────────────────────
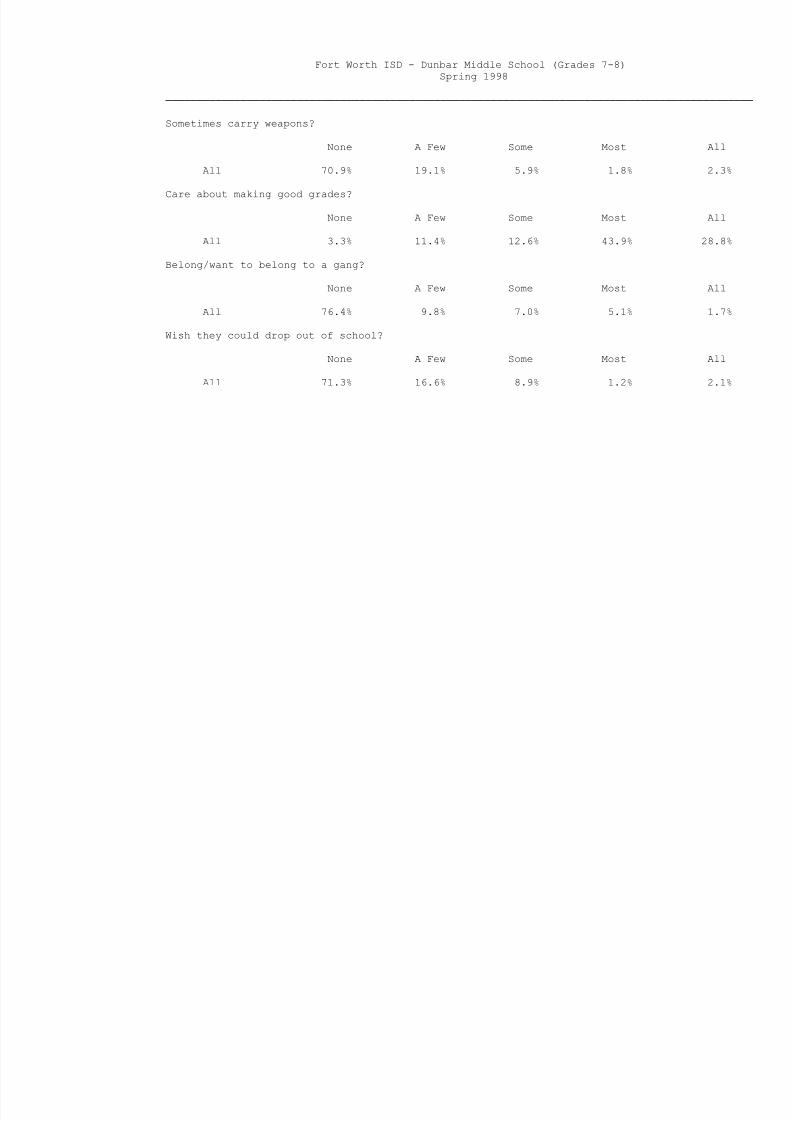
Sometimes carry weapons?
None A Few Some Most All
All 70.9% 19.1% 5.9% 1.8% 2.3%
Care about making good grades?
None A Few Some Most All
All 3.3% 11.4% 12.6% 43.9% 28.8%
Belong/want to belong to a gang?
None A Few Some Most All
All 76.4% 9.8% 7.0% 5.1% 1.7%
Wish they could drop out of school?
None A Few Some Most All
All 71.3% 16.6% 8.9% 1.2% 2.1%

8/6/2019 fort worth isd - dunbar middle school (grades 7-8) - 1998 Texas School Survey of Drug and Alcohol Use
http://slidepdf.com/reader/full/fort-worth-isd-dunbar-middle-school-grades-7-8-1998-texas-school-survey 40/138
8/6/2019 fort worth isd - dunbar middle school (grades 7-8) - 1998 Texas School Survey of Drug and Alcohol Use
http://slidepdf.com/reader/full/fort-worth-isd-dunbar-middle-school-grades-7-8-1998-texas-school-survey 41/138
Fort Worth ISD - Dunbar Middle School (Grades 7-8)
Spring 1998
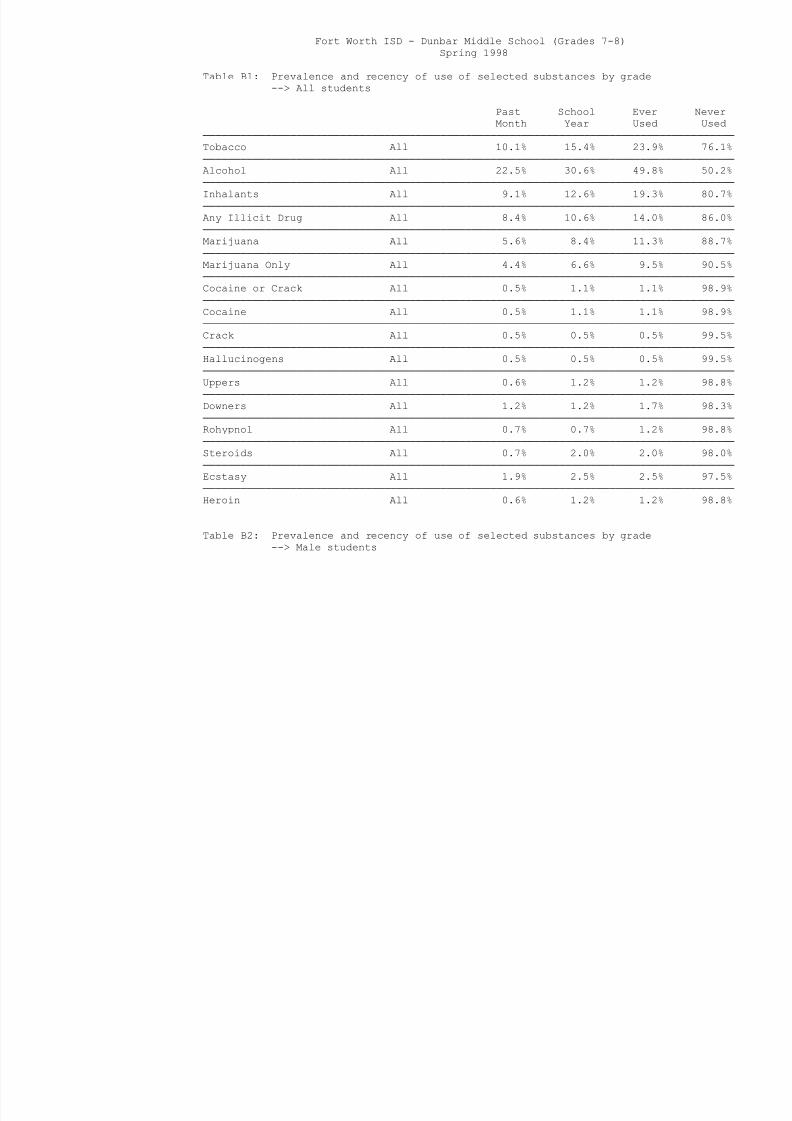
Table B1: Prevalence and recency of use of selected substances by grade
--> All students
Past School Ever Never
Month Year Used Used
─────────────────────────────────────────────────────────────────────────────────────
Tobacco All 10.1% 15.4% 23.9% 76.1%─────────────────────────────────────────────────────────────────────────────────────
Alcohol All 22.5% 30.6% 49.8% 50.2%
─────────────────────────────────────────────────────────────────────────────────────
Inhalants All 9.1% 12.6% 19.3% 80.7%
─────────────────────────────────────────────────────────────────────────────────────
Any Illicit Drug All 8.4% 10.6% 14.0% 86.0%
─────────────────────────────────────────────────────────────────────────────────────
Marijuana All 5.6% 8.4% 11.3% 88.7%
─────────────────────────────────────────────────────────────────────────────────────
Marijuana Only All 4.4% 6.6% 9.5% 90.5%
─────────────────────────────────────────────────────────────────────────────────────
Cocaine or Crack All 0.5% 1.1% 1.1% 98.9%
─────────────────────────────────────────────────────────────────────────────────────
Cocaine All 0.5% 1.1% 1.1% 98.9%
─────────────────────────────────────────────────────────────────────────────────────
Crack All 0.5% 0.5% 0.5% 99.5%
─────────────────────────────────────────────────────────────────────────────────────
Hallucinogens All 0.5% 0.5% 0.5% 99.5%
─────────────────────────────────────────────────────────────────────────────────────
Uppers All 0.6% 1.2% 1.2% 98.8%
─────────────────────────────────────────────────────────────────────────────────────
Downers All 1.2% 1.2% 1.7% 98.3%
─────────────────────────────────────────────────────────────────────────────────────Rohypnol All 0.7% 0.7% 1.2% 98.8%
─────────────────────────────────────────────────────────────────────────────────────
Steroids All 0.7% 2.0% 2.0% 98.0%
─────────────────────────────────────────────────────────────────────────────────────
Ecstasy All 1.9% 2.5% 2.5% 97.5%
─────────────────────────────────────────────────────────────────────────────────────
Heroin All 0.6% 1.2% 1.2% 98.8%
Table B2: Prevalence and recency of use of selected substances by grade
--> Male students

8/6/2019 fort worth isd - dunbar middle school (grades 7-8) - 1998 Texas School Survey of Drug and Alcohol Use
http://slidepdf.com/reader/full/fort-worth-isd-dunbar-middle-school-grades-7-8-1998-texas-school-survey 42/138
Past School Ever Never
Month Year Used Used
─────────────────────────────────────────────────────────────────────────────────────
Tobacco All 11.2% 15.2% 24.5% 75.5%
─────────────────────────────────────────────────────────────────────────────────────
Alcohol All 19.0% 23.2% 39.6% 60.4%
─────────────────────────────────────────────────────────────────────────────────────
Inhalants All 7.8% 10.3% 22.2% 77.8%
─────────────────────────────────────────────────────────────────────────────────────
Any Illicit Drug All 10.7% 12.0% 14.8% 85.2%─────────────────────────────────────────────────────────────────────────────────────
Marijuana All 9.5% 10.7% 13.6% 86.4%
─────────────────────────────────────────────────────────────────────────────────────
Marijuana Only All 6.6% 7.8% 10.6% 89.4%
─────────────────────────────────────────────────────────────────────────────────────
Cocaine or Crack All 1.3% 1.3% 1.3% 98.7%
─────────────────────────────────────────────────────────────────────────────────────
Cocaine All 1.3% 1.3% 1.3% 98.7%
─────────────────────────────────────────────────────────────────────────────────────
Crack All 1.3% 1.3% 1.3% 98.7%
─────────────────────────────────────────────────────────────────────────────────────
Hallucinogens All 1.3% 1.3% 1.3% 98.7%
─────────────────────────────────────────────────────────────────────────────────────
Uppers All 1.4% 1.4% 1.4% 98.6%
─────────────────────────────────────────────────────────────────────────────────────
Downers All 1.4% 1.4% 1.4% 98.6%
─────────────────────────────────────────────────────────────────────────────────────
Rohypnol All 1.6% 1.6% 1.6% 98.4%
─────────────────────────────────────────────────────────────────────────────────────
Steroids All 1.7% 4.9% 4.9% 95.1%
─────────────────────────────────────────────────────────────────────────────────────
Ecstasy All * % * % * % 100.0%
─────────────────────────────────────────────────────────────────────────────────────Heroin All 1.4% 1.4% 1.4% 98.6%
8/6/2019 fort worth isd - dunbar middle school (grades 7-8) - 1998 Texas School Survey of Drug and Alcohol Use
http://slidepdf.com/reader/full/fort-worth-isd-dunbar-middle-school-grades-7-8-1998-texas-school-survey 43/138

8/6/2019 fort worth isd - dunbar middle school (grades 7-8) - 1998 Texas School Survey of Drug and Alcohol Use
http://slidepdf.com/reader/full/fort-worth-isd-dunbar-middle-school-grades-7-8-1998-texas-school-survey 44/138
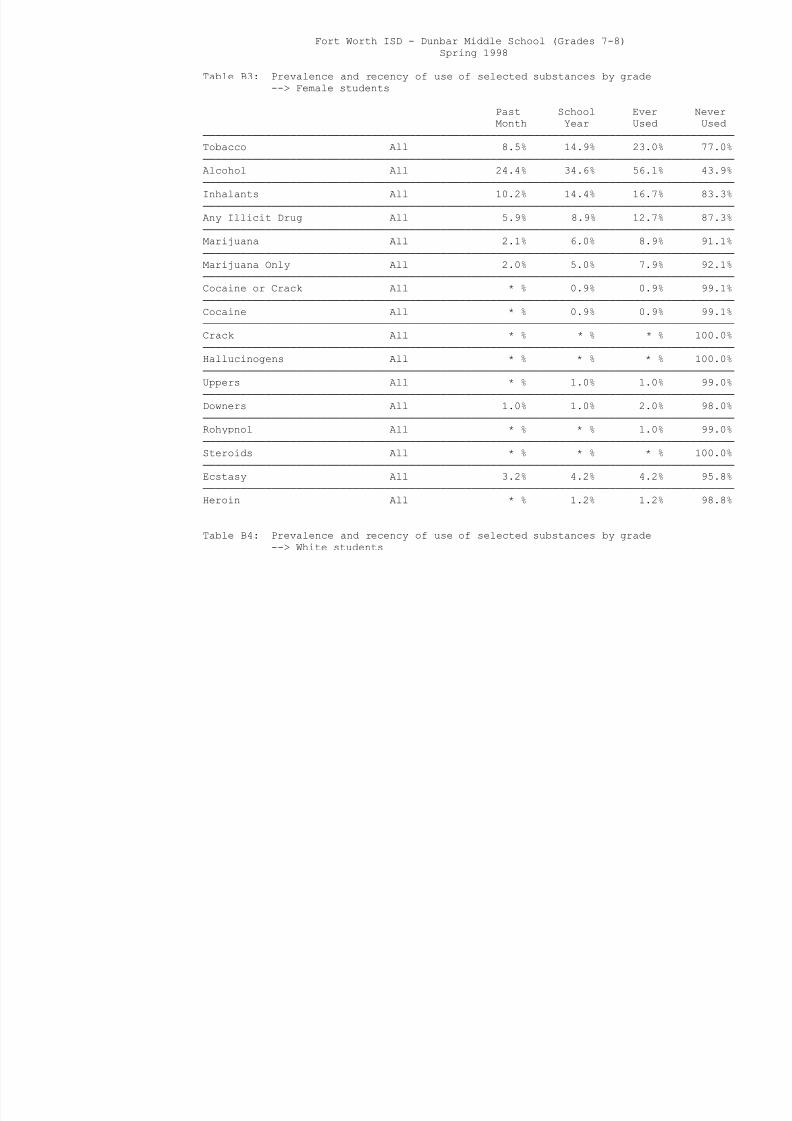
Past School Ever Never
Month Year Used Used
─────────────────────────────────────────────────────────────────────────────────────
Tobacco All 9.8% 16.0% 26.1% 73.9%
─────────────────────────────────────────────────────────────────────────────────────
Alcohol All 18.9% 23.9% 36.3% 63.7%
─────────────────────────────────────────────────────────────────────────────────────
Inhalants All 16.0% 19.2% 23.9% 76.1%
─────────────────────────────────────────────────────────────────────────────────────
Any Illicit Drug All 7.7% 9.1% 13.8% 86.2%─────────────────────────────────────────────────────────────────────────────────────
Marijuana All 1.5% 2.9% 6.2% 93.8%
─────────────────────────────────────────────────────────────────────────────────────
Marijuana Only All 1.5% 2.9% 6.2% 93.8%
─────────────────────────────────────────────────────────────────────────────────────
Cocaine or Crack All * % * % * % 100.0%
─────────────────────────────────────────────────────────────────────────────────────
Cocaine All * % * % * % 100.0%
─────────────────────────────────────────────────────────────────────────────────────
Crack All * % * % * % 100.0%
─────────────────────────────────────────────────────────────────────────────────────
Hallucinogens All * % * % * % 100.0%
─────────────────────────────────────────────────────────────────────────────────────
Uppers All 1.5% 3.1% 3.1% 96.9%
─────────────────────────────────────────────────────────────────────────────────────
Downers All 1.6% 1.6% 3.1% 96.9%
─────────────────────────────────────────────────────────────────────────────────────
Rohypnol All * % * % 1.5% 98.5%
─────────────────────────────────────────────────────────────────────────────────────
Steroids All 1.9% 1.9% 1.9% 98.1%
─────────────────────────────────────────────────────────────────────────────────────
Ecstasy All 5.0% 5.0% 5.0% 95.0%
─────────────────────────────────────────────────────────────────────────────────────Heroin All * % 1.8% 1.8% 98.2%
8/6/2019 fort worth isd - dunbar middle school (grades 7-8) - 1998 Texas School Survey of Drug and Alcohol Use
http://slidepdf.com/reader/full/fort-worth-isd-dunbar-middle-school-grades-7-8-1998-texas-school-survey 45/138
Fort Worth ISD - Dunbar Middle School (Grades 7-8)
Spring 1998
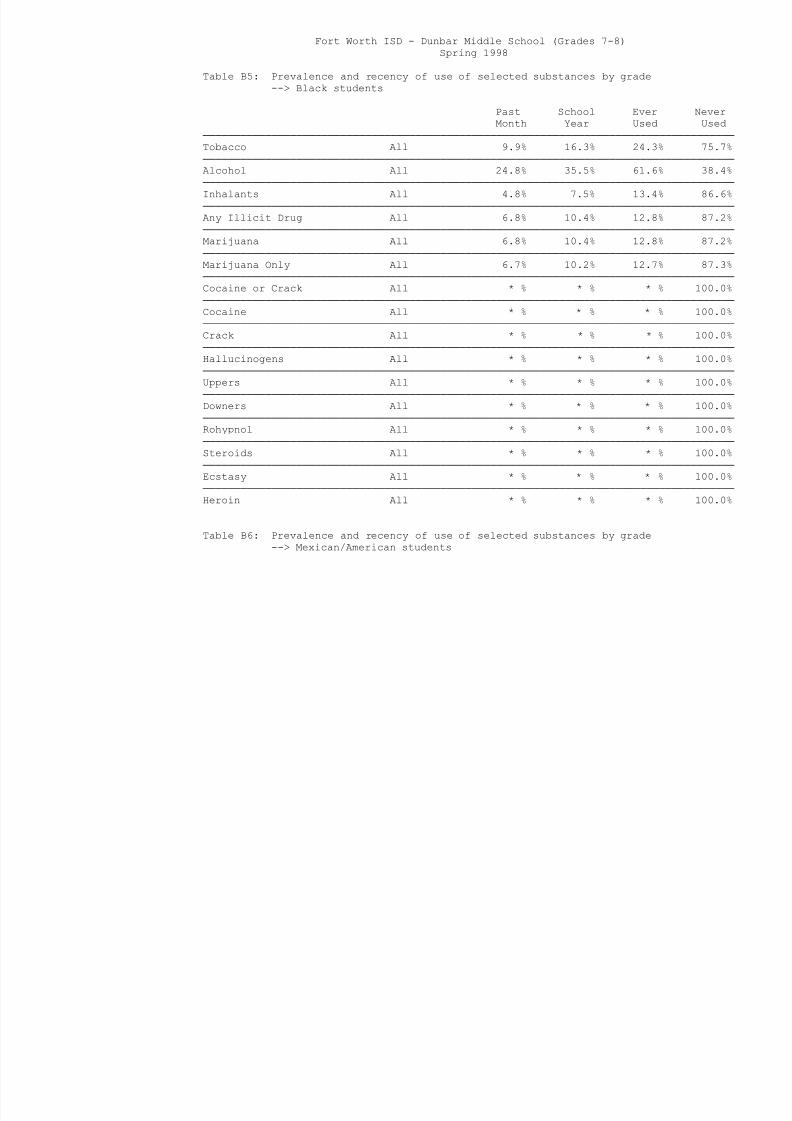
Table B5: Prevalence and recency of use of selected substances by grade
--> Black students
Past School Ever Never
Month Year Used Used
─────────────────────────────────────────────────────────────────────────────────────
Tobacco All 9.9% 16.3% 24.3% 75.7%─────────────────────────────────────────────────────────────────────────────────────
Alcohol All 24.8% 35.5% 61.6% 38.4%
─────────────────────────────────────────────────────────────────────────────────────
Inhalants All 4.8% 7.5% 13.4% 86.6%
─────────────────────────────────────────────────────────────────────────────────────
Any Illicit Drug All 6.8% 10.4% 12.8% 87.2%
─────────────────────────────────────────────────────────────────────────────────────
Marijuana All 6.8% 10.4% 12.8% 87.2%
─────────────────────────────────────────────────────────────────────────────────────
Marijuana Only All 6.7% 10.2% 12.7% 87.3%
─────────────────────────────────────────────────────────────────────────────────────
Cocaine or Crack All * % * % * % 100.0%
─────────────────────────────────────────────────────────────────────────────────────
Cocaine All * % * % * % 100.0%
─────────────────────────────────────────────────────────────────────────────────────
Crack All * % * % * % 100.0%
─────────────────────────────────────────────────────────────────────────────────────
Hallucinogens All * % * % * % 100.0%
─────────────────────────────────────────────────────────────────────────────────────
Uppers All * % * % * % 100.0%
─────────────────────────────────────────────────────────────────────────────────────
Downers All * % * % * % 100.0%
─────────────────────────────────────────────────────────────────────────────────────Rohypnol All * % * % * % 100.0%
─────────────────────────────────────────────────────────────────────────────────────
Steroids All * % * % * % 100.0%
─────────────────────────────────────────────────────────────────────────────────────
Ecstasy All * % * % * % 100.0%
─────────────────────────────────────────────────────────────────────────────────────
Heroin All * % * % * % 100.0%
Table B6: Prevalence and recency of use of selected substances by grade
--> Mexican/American students
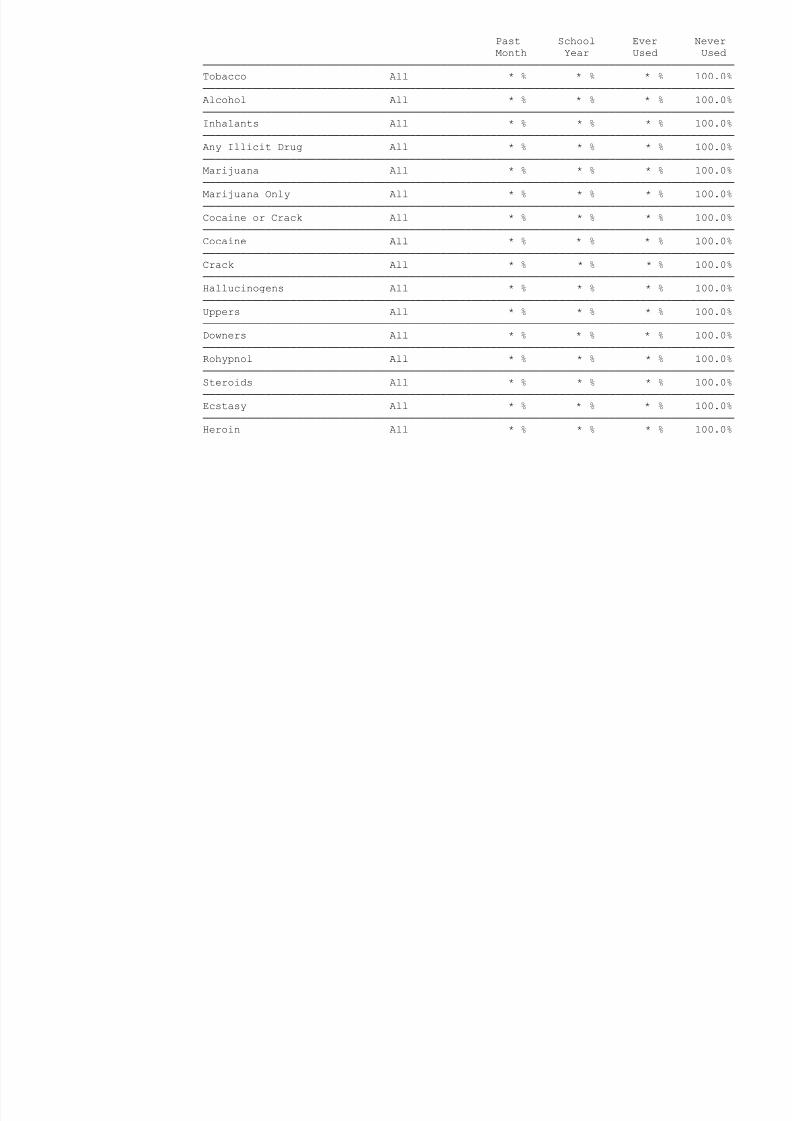
8/6/2019 fort worth isd - dunbar middle school (grades 7-8) - 1998 Texas School Survey of Drug and Alcohol Use
http://slidepdf.com/reader/full/fort-worth-isd-dunbar-middle-school-grades-7-8-1998-texas-school-survey 46/138
Past School Ever Never
Month Year Used Used
─────────────────────────────────────────────────────────────────────────────────────
Tobacco All * % * % * % 100.0%
─────────────────────────────────────────────────────────────────────────────────────
Alcohol All * % * % * % 100.0%
─────────────────────────────────────────────────────────────────────────────────────
Inhalants All * % * % * % 100.0%
─────────────────────────────────────────────────────────────────────────────────────
Any Illicit Drug All * % * % * % 100.0%─────────────────────────────────────────────────────────────────────────────────────
Marijuana All * % * % * % 100.0%
─────────────────────────────────────────────────────────────────────────────────────
Marijuana Only All * % * % * % 100.0%
─────────────────────────────────────────────────────────────────────────────────────
Cocaine or Crack All * % * % * % 100.0%
─────────────────────────────────────────────────────────────────────────────────────
Cocaine All * % * % * % 100.0%
─────────────────────────────────────────────────────────────────────────────────────
Crack All * % * % * % 100.0%
─────────────────────────────────────────────────────────────────────────────────────
Hallucinogens All * % * % * % 100.0%
─────────────────────────────────────────────────────────────────────────────────────
Uppers All * % * % * % 100.0%
─────────────────────────────────────────────────────────────────────────────────────
Downers All * % * % * % 100.0%
─────────────────────────────────────────────────────────────────────────────────────
Rohypnol All * % * % * % 100.0%
─────────────────────────────────────────────────────────────────────────────────────
Steroids All * % * % * % 100.0%
─────────────────────────────────────────────────────────────────────────────────────
Ecstasy All * % * % * % 100.0%
─────────────────────────────────────────────────────────────────────────────────────Heroin All * % * % * % 100.0%
8/6/2019 fort worth isd - dunbar middle school (grades 7-8) - 1998 Texas School Survey of Drug and Alcohol Use
http://slidepdf.com/reader/full/fort-worth-isd-dunbar-middle-school-grades-7-8-1998-texas-school-survey 47/138
Fort Worth ISD - Dunbar Middle School (Grades 7-8)
Spring 1998
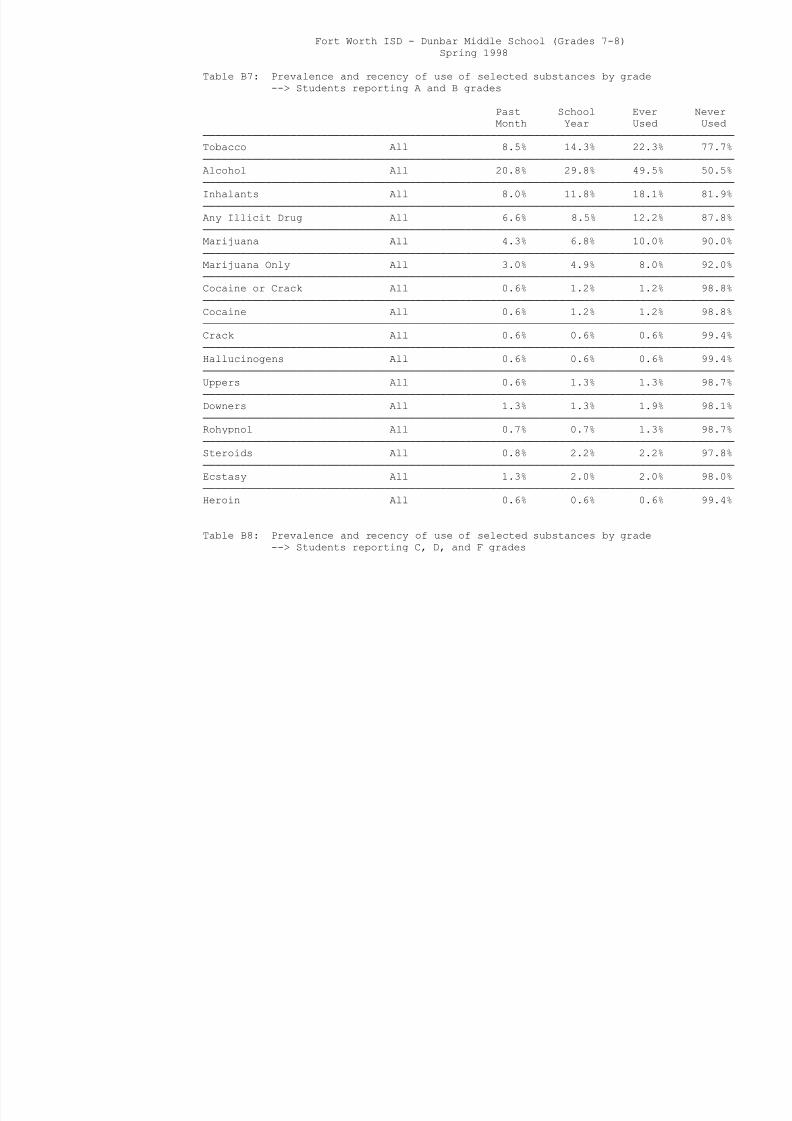
Table B7: Prevalence and recency of use of selected substances by grade
--> Students reporting A and B grades
Past School Ever Never
Month Year Used Used
─────────────────────────────────────────────────────────────────────────────────────
Tobacco All 8.5% 14.3% 22.3% 77.7%─────────────────────────────────────────────────────────────────────────────────────
Alcohol All 20.8% 29.8% 49.5% 50.5%
─────────────────────────────────────────────────────────────────────────────────────
Inhalants All 8.0% 11.8% 18.1% 81.9%
─────────────────────────────────────────────────────────────────────────────────────
Any Illicit Drug All 6.6% 8.5% 12.2% 87.8%
─────────────────────────────────────────────────────────────────────────────────────
Marijuana All 4.3% 6.8% 10.0% 90.0%
─────────────────────────────────────────────────────────────────────────────────────
Marijuana Only All 3.0% 4.9% 8.0% 92.0%
─────────────────────────────────────────────────────────────────────────────────────
Cocaine or Crack All 0.6% 1.2% 1.2% 98.8%
─────────────────────────────────────────────────────────────────────────────────────
Cocaine All 0.6% 1.2% 1.2% 98.8%
─────────────────────────────────────────────────────────────────────────────────────
Crack All 0.6% 0.6% 0.6% 99.4%
─────────────────────────────────────────────────────────────────────────────────────
Hallucinogens All 0.6% 0.6% 0.6% 99.4%
─────────────────────────────────────────────────────────────────────────────────────
Uppers All 0.6% 1.3% 1.3% 98.7%
─────────────────────────────────────────────────────────────────────────────────────
Downers All 1.3% 1.3% 1.9% 98.1%
─────────────────────────────────────────────────────────────────────────────────────Rohypnol All 0.7% 0.7% 1.3% 98.7%
─────────────────────────────────────────────────────────────────────────────────────
Steroids All 0.8% 2.2% 2.2% 97.8%
─────────────────────────────────────────────────────────────────────────────────────
Ecstasy All 1.3% 2.0% 2.0% 98.0%
─────────────────────────────────────────────────────────────────────────────────────
Heroin All 0.6% 0.6% 0.6% 99.4%
Table B8: Prevalence and recency of use of selected substances by grade
--> Students reporting C, D, and F grades

8/6/2019 fort worth isd - dunbar middle school (grades 7-8) - 1998 Texas School Survey of Drug and Alcohol Use
http://slidepdf.com/reader/full/fort-worth-isd-dunbar-middle-school-grades-7-8-1998-texas-school-survey 48/138
Past School Ever Never
Month Year Used Used
─────────────────────────────────────────────────────────────────────────────────────
Tobacco All 29.2% 29.2% 45.3% 54.7%
─────────────────────────────────────────────────────────────────────────────────────
Alcohol All 43.8% 43.8% 59.9% 40.1%
─────────────────────────────────────────────────────────────────────────────────────
Inhalants All 22.6% 22.6% 29.2% 70.8%
─────────────────────────────────────────────────────────────────────────────────────
Any Illicit Drug All 29.2% 35.8% 35.8% 64.2%─────────────────────────────────────────────────────────────────────────────────────
Marijuana All 21.2% 27.8% 27.8% 72.2%
─────────────────────────────────────────────────────────────────────────────────────
Marijuana Only All 21.2% 27.8% 27.8% 72.2%
─────────────────────────────────────────────────────────────────────────────────────
Cocaine or Crack All * % * % * % 100.0%
─────────────────────────────────────────────────────────────────────────────────────
Cocaine All * % * % * % 100.0%
─────────────────────────────────────────────────────────────────────────────────────
Crack All * % * % * % 100.0%
─────────────────────────────────────────────────────────────────────────────────────
Hallucinogens All * % * % * % 100.0%
─────────────────────────────────────────────────────────────────────────────────────
Uppers All * % * % * % 100.0%
─────────────────────────────────────────────────────────────────────────────────────
Downers All * % * % * % 100.0%
─────────────────────────────────────────────────────────────────────────────────────
Rohypnol All * % * % * % 100.0%
─────────────────────────────────────────────────────────────────────────────────────
Steroids All * % * % * % 100.0%
─────────────────────────────────────────────────────────────────────────────────────
Ecstasy All 9.6% 9.6% 9.6% 90.4%
─────────────────────────────────────────────────────────────────────────────────────Heroin All * % 8.0% 8.0% 92.0%
8/6/2019 fort worth isd - dunbar middle school (grades 7-8) - 1998 Texas School Survey of Drug and Alcohol Use
http://slidepdf.com/reader/full/fort-worth-isd-dunbar-middle-school-grades-7-8-1998-texas-school-survey 49/138
Fort Worth ISD - Dunbar Middle School (Grades 7-8)
Spring 1998
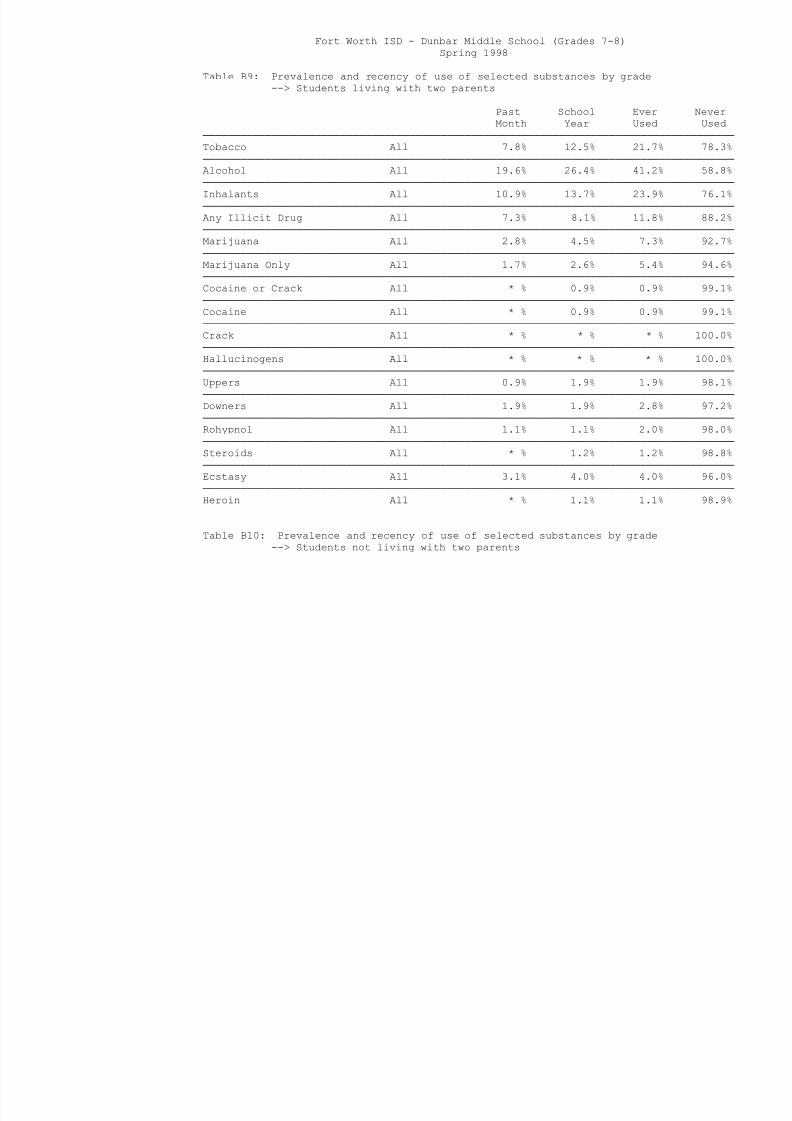
Table B9: Prevalence and recency of use of selected substances by grade
--> Students living with two parents
Past School Ever Never
Month Year Used Used
─────────────────────────────────────────────────────────────────────────────────────
Tobacco All 7.8% 12.5% 21.7% 78.3%─────────────────────────────────────────────────────────────────────────────────────
Alcohol All 19.6% 26.4% 41.2% 58.8%
─────────────────────────────────────────────────────────────────────────────────────
Inhalants All 10.9% 13.7% 23.9% 76.1%
─────────────────────────────────────────────────────────────────────────────────────
Any Illicit Drug All 7.3% 8.1% 11.8% 88.2%
─────────────────────────────────────────────────────────────────────────────────────
Marijuana All 2.8% 4.5% 7.3% 92.7%
─────────────────────────────────────────────────────────────────────────────────────
Marijuana Only All 1.7% 2.6% 5.4% 94.6%
─────────────────────────────────────────────────────────────────────────────────────
Cocaine or Crack All * % 0.9% 0.9% 99.1%
─────────────────────────────────────────────────────────────────────────────────────
Cocaine All * % 0.9% 0.9% 99.1%
─────────────────────────────────────────────────────────────────────────────────────
Crack All * % * % * % 100.0%
─────────────────────────────────────────────────────────────────────────────────────
Hallucinogens All * % * % * % 100.0%
─────────────────────────────────────────────────────────────────────────────────────
Uppers All 0.9% 1.9% 1.9% 98.1%
─────────────────────────────────────────────────────────────────────────────────────
Downers All 1.9% 1.9% 2.8% 97.2%
─────────────────────────────────────────────────────────────────────────────────────Rohypnol All 1.1% 1.1% 2.0% 98.0%
─────────────────────────────────────────────────────────────────────────────────────
Steroids All * % 1.2% 1.2% 98.8%
─────────────────────────────────────────────────────────────────────────────────────
Ecstasy All 3.1% 4.0% 4.0% 96.0%
─────────────────────────────────────────────────────────────────────────────────────
Heroin All * % 1.1% 1.1% 98.9%
Table B10: Prevalence and recency of use of selected substances by grade
--> Students not living with two parents
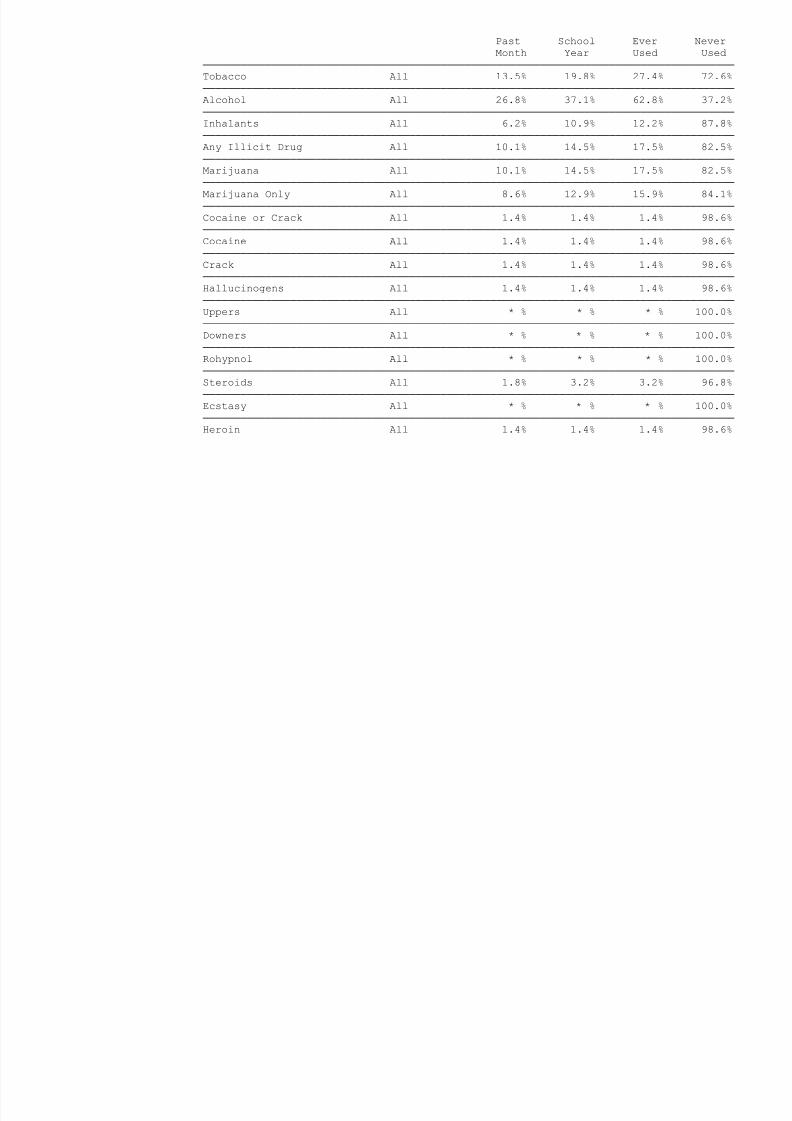
8/6/2019 fort worth isd - dunbar middle school (grades 7-8) - 1998 Texas School Survey of Drug and Alcohol Use
http://slidepdf.com/reader/full/fort-worth-isd-dunbar-middle-school-grades-7-8-1998-texas-school-survey 50/138
Past School Ever Never
Month Year Used Used
─────────────────────────────────────────────────────────────────────────────────────
Tobacco All 13.5% 19.8% 27.4% 72.6%
─────────────────────────────────────────────────────────────────────────────────────
Alcohol All 26.8% 37.1% 62.8% 37.2%
─────────────────────────────────────────────────────────────────────────────────────
Inhalants All 6.2% 10.9% 12.2% 87.8%
─────────────────────────────────────────────────────────────────────────────────────
Any Illicit Drug All 10.1% 14.5% 17.5% 82.5%─────────────────────────────────────────────────────────────────────────────────────
Marijuana All 10.1% 14.5% 17.5% 82.5%
─────────────────────────────────────────────────────────────────────────────────────
Marijuana Only All 8.6% 12.9% 15.9% 84.1%
─────────────────────────────────────────────────────────────────────────────────────
Cocaine or Crack All 1.4% 1.4% 1.4% 98.6%
─────────────────────────────────────────────────────────────────────────────────────
Cocaine All 1.4% 1.4% 1.4% 98.6%
─────────────────────────────────────────────────────────────────────────────────────
Crack All 1.4% 1.4% 1.4% 98.6%
─────────────────────────────────────────────────────────────────────────────────────
Hallucinogens All 1.4% 1.4% 1.4% 98.6%
─────────────────────────────────────────────────────────────────────────────────────
Uppers All * % * % * % 100.0%
─────────────────────────────────────────────────────────────────────────────────────
Downers All * % * % * % 100.0%
─────────────────────────────────────────────────────────────────────────────────────
Rohypnol All * % * % * % 100.0%
─────────────────────────────────────────────────────────────────────────────────────
Steroids All 1.8% 3.2% 3.2% 96.8%
─────────────────────────────────────────────────────────────────────────────────────
Ecstasy All * % * % * % 100.0%
─────────────────────────────────────────────────────────────────────────────────────Heroin All 1.4% 1.4% 1.4% 98.6%
8/6/2019 fort worth isd - dunbar middle school (grades 7-8) - 1998 Texas School Survey of Drug and Alcohol Use
http://slidepdf.com/reader/full/fort-worth-isd-dunbar-middle-school-grades-7-8-1998-texas-school-survey 51/138
Fort Worth ISD - Dunbar Middle School (Grades 7-8)
Spring 1998
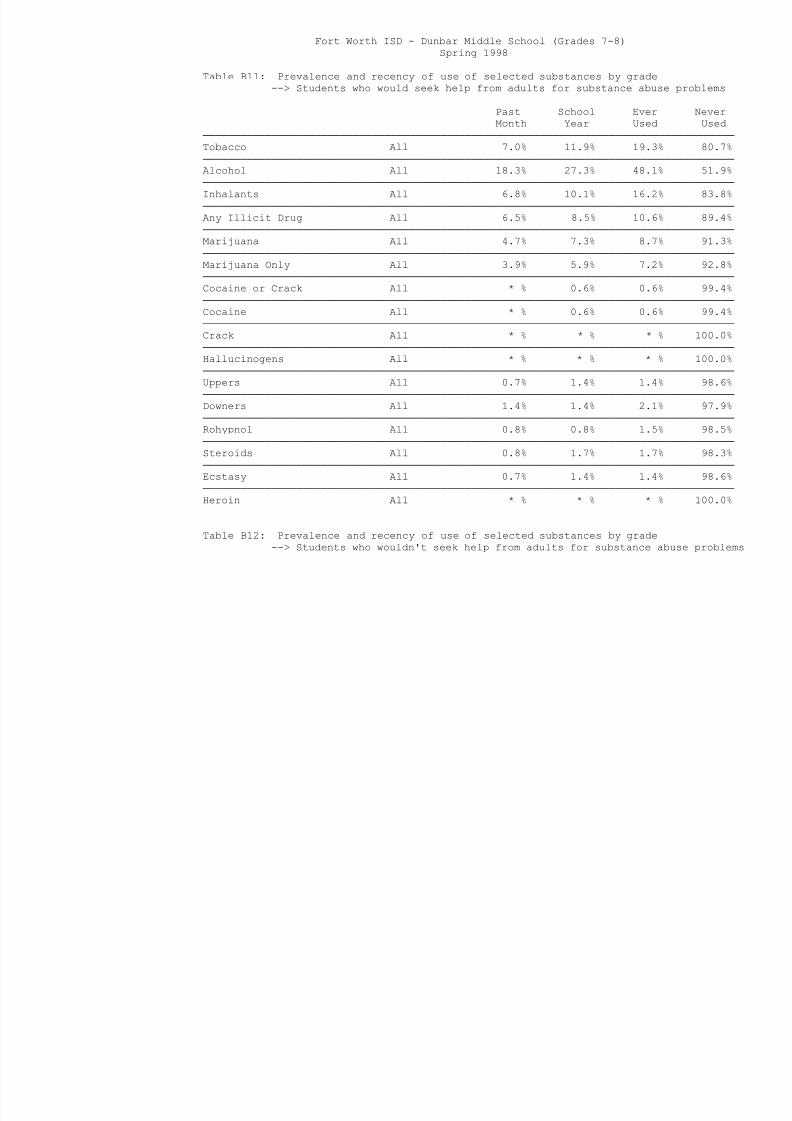
Table B11: Prevalence and recency of use of selected substances by grade
--> Students who would seek help from adults for substance abuse problems
Past School Ever Never
Month Year Used Used
─────────────────────────────────────────────────────────────────────────────────────
Tobacco All 7.0% 11.9% 19.3% 80.7%─────────────────────────────────────────────────────────────────────────────────────
Alcohol All 18.3% 27.3% 48.1% 51.9%
─────────────────────────────────────────────────────────────────────────────────────
Inhalants All 6.8% 10.1% 16.2% 83.8%
─────────────────────────────────────────────────────────────────────────────────────
Any Illicit Drug All 6.5% 8.5% 10.6% 89.4%
─────────────────────────────────────────────────────────────────────────────────────
Marijuana All 4.7% 7.3% 8.7% 91.3%
─────────────────────────────────────────────────────────────────────────────────────
Marijuana Only All 3.9% 5.9% 7.2% 92.8%
─────────────────────────────────────────────────────────────────────────────────────
Cocaine or Crack All * % 0.6% 0.6% 99.4%
─────────────────────────────────────────────────────────────────────────────────────
Cocaine All * % 0.6% 0.6% 99.4%
─────────────────────────────────────────────────────────────────────────────────────
Crack All * % * % * % 100.0%
─────────────────────────────────────────────────────────────────────────────────────
Hallucinogens All * % * % * % 100.0%
─────────────────────────────────────────────────────────────────────────────────────
Uppers All 0.7% 1.4% 1.4% 98.6%
─────────────────────────────────────────────────────────────────────────────────────
Downers All 1.4% 1.4% 2.1% 97.9%
─────────────────────────────────────────────────────────────────────────────────────Rohypnol All 0.8% 0.8% 1.5% 98.5%
─────────────────────────────────────────────────────────────────────────────────────
Steroids All 0.8% 1.7% 1.7% 98.3%
─────────────────────────────────────────────────────────────────────────────────────
Ecstasy All 0.7% 1.4% 1.4% 98.6%
─────────────────────────────────────────────────────────────────────────────────────
Heroin All * % * % * % 100.0%
Table B12: Prevalence and recency of use of selected substances by grade
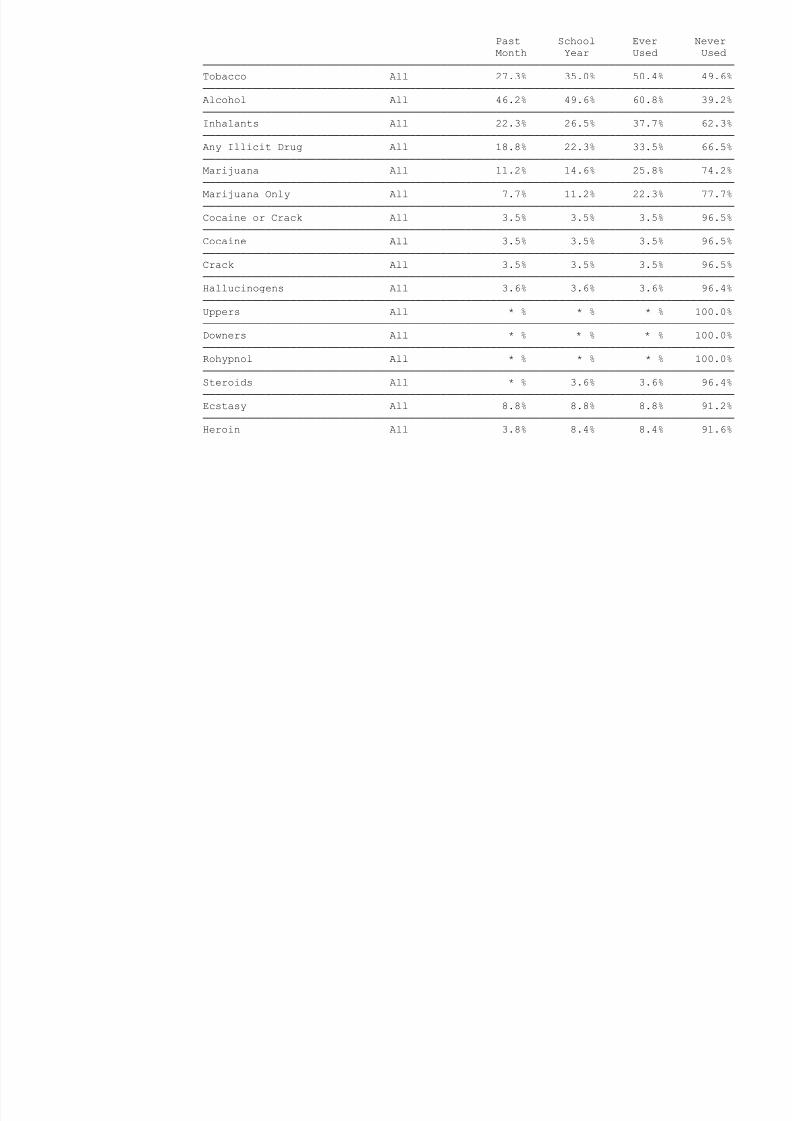
--> Students who wouldn't seek help from adults for substance abuse problems
8/6/2019 fort worth isd - dunbar middle school (grades 7-8) - 1998 Texas School Survey of Drug and Alcohol Use
http://slidepdf.com/reader/full/fort-worth-isd-dunbar-middle-school-grades-7-8-1998-texas-school-survey 52/138
Past School Ever Never
Month Year Used Used
─────────────────────────────────────────────────────────────────────────────────────
Tobacco All 27.3% 35.0% 50.4% 49.6%
─────────────────────────────────────────────────────────────────────────────────────
Alcohol All 46.2% 49.6% 60.8% 39.2%
─────────────────────────────────────────────────────────────────────────────────────
Inhalants All 22.3% 26.5% 37.7% 62.3%
─────────────────────────────────────────────────────────────────────────────────────
Any Illicit Drug All 18.8% 22.3% 33.5% 66.5%─────────────────────────────────────────────────────────────────────────────────────
Marijuana All 11.2% 14.6% 25.8% 74.2%
─────────────────────────────────────────────────────────────────────────────────────
Marijuana Only All 7.7% 11.2% 22.3% 77.7%
─────────────────────────────────────────────────────────────────────────────────────
Cocaine or Crack All 3.5% 3.5% 3.5% 96.5%
─────────────────────────────────────────────────────────────────────────────────────
Cocaine All 3.5% 3.5% 3.5% 96.5%
─────────────────────────────────────────────────────────────────────────────────────
Crack All 3.5% 3.5% 3.5% 96.5%
─────────────────────────────────────────────────────────────────────────────────────
Hallucinogens All 3.6% 3.6% 3.6% 96.4%
─────────────────────────────────────────────────────────────────────────────────────
Uppers All * % * % * % 100.0%
─────────────────────────────────────────────────────────────────────────────────────
Downers All * % * % * % 100.0%
─────────────────────────────────────────────────────────────────────────────────────
Rohypnol All * % * % * % 100.0%
─────────────────────────────────────────────────────────────────────────────────────
Steroids All * % 3.6% 3.6% 96.4%
─────────────────────────────────────────────────────────────────────────────────────
Ecstasy All 8.8% 8.8% 8.8% 91.2%
─────────────────────────────────────────────────────────────────────────────────────Heroin All 3.8% 8.4% 8.4% 91.6%
h S b iddl S h l (G d 7 8)
8/6/2019 fort worth isd - dunbar middle school (grades 7-8) - 1998 Texas School Survey of Drug and Alcohol Use
http://slidepdf.com/reader/full/fort-worth-isd-dunbar-middle-school-grades-7-8-1998-texas-school-survey 53/138
Fort Worth ISD - Dunbar Middle School (Grades 7-8)
Spring 1998
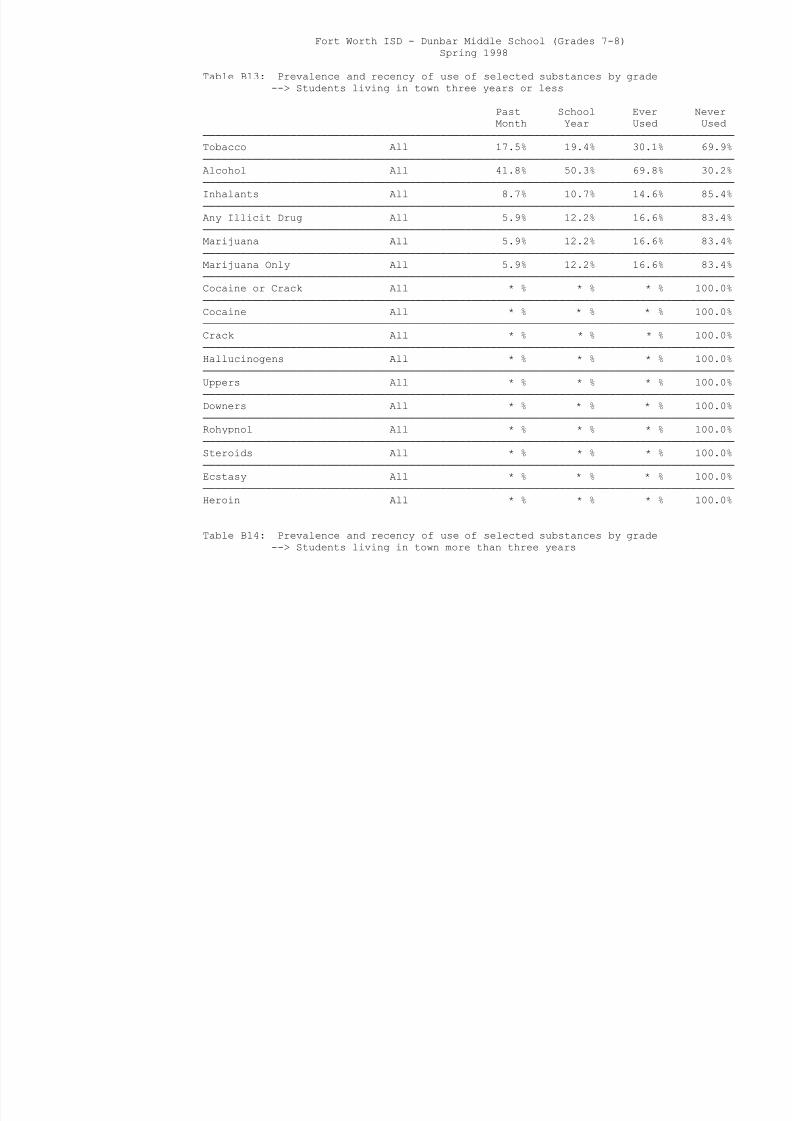
Table B13: Prevalence and recency of use of selected substances by grade
--> Students living in town three years or less
Past School Ever Never
Month Year Used Used
─────────────────────────────────────────────────────────────────────────────────────
Tobacco All 17.5% 19.4% 30.1% 69.9%─────────────────────────────────────────────────────────────────────────────────────
Alcohol All 41.8% 50.3% 69.8% 30.2%
─────────────────────────────────────────────────────────────────────────────────────
Inhalants All 8.7% 10.7% 14.6% 85.4%
─────────────────────────────────────────────────────────────────────────────────────
Any Illicit Drug All 5.9% 12.2% 16.6% 83.4%
─────────────────────────────────────────────────────────────────────────────────────
Marijuana All 5.9% 12.2% 16.6% 83.4%
─────────────────────────────────────────────────────────────────────────────────────
Marijuana Only All 5.9% 12.2% 16.6% 83.4%
─────────────────────────────────────────────────────────────────────────────────────
Cocaine or Crack All * % * % * % 100.0%
─────────────────────────────────────────────────────────────────────────────────────
Cocaine All * % * % * % 100.0%
─────────────────────────────────────────────────────────────────────────────────────
Crack All * % * % * % 100.0%
─────────────────────────────────────────────────────────────────────────────────────
Hallucinogens All * % * % * % 100.0%
─────────────────────────────────────────────────────────────────────────────────────
Uppers All * % * % * % 100.0%
─────────────────────────────────────────────────────────────────────────────────────
Downers All * % * % * % 100.0%
─────────────────────────────────────────────────────────────────────────────────────Rohypnol All * % * % * % 100.0%
─────────────────────────────────────────────────────────────────────────────────────
Steroids All * % * % * % 100.0%
─────────────────────────────────────────────────────────────────────────────────────
Ecstasy All * % * % * % 100.0%
─────────────────────────────────────────────────────────────────────────────────────
Heroin All * % * % * % 100.0%
Table B14: Prevalence and recency of use of selected substances by grade
--> Students living in town more than three years
P t S h l E N
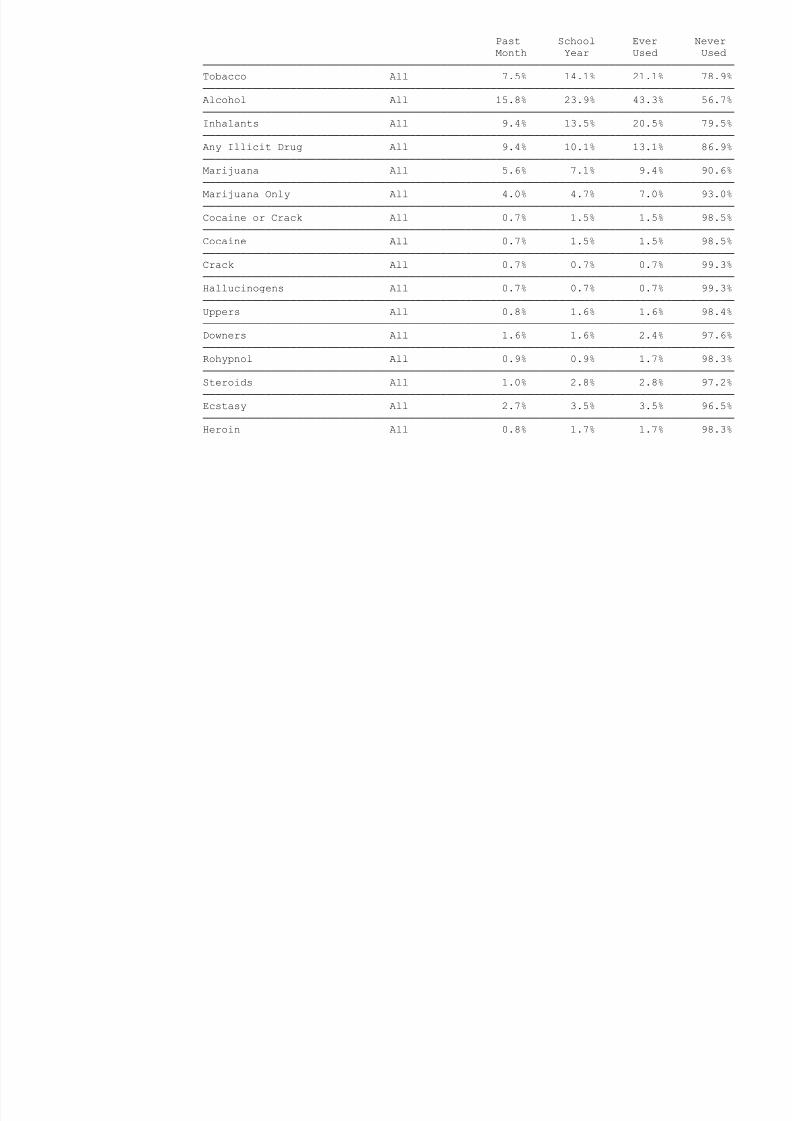
8/6/2019 fort worth isd - dunbar middle school (grades 7-8) - 1998 Texas School Survey of Drug and Alcohol Use
http://slidepdf.com/reader/full/fort-worth-isd-dunbar-middle-school-grades-7-8-1998-texas-school-survey 54/138
Past School Ever Never
Month Year Used Used
─────────────────────────────────────────────────────────────────────────────────────
Tobacco All 7.5% 14.1% 21.1% 78.9%
─────────────────────────────────────────────────────────────────────────────────────
Alcohol All 15.8% 23.9% 43.3% 56.7%
─────────────────────────────────────────────────────────────────────────────────────
Inhalants All 9.4% 13.5% 20.5% 79.5%
─────────────────────────────────────────────────────────────────────────────────────
Any Illicit Drug All 9.4% 10.1% 13.1% 86.9%─────────────────────────────────────────────────────────────────────────────────────
Marijuana All 5.6% 7.1% 9.4% 90.6%
─────────────────────────────────────────────────────────────────────────────────────
Marijuana Only All 4.0% 4.7% 7.0% 93.0%
─────────────────────────────────────────────────────────────────────────────────────
Cocaine or Crack All 0.7% 1.5% 1.5% 98.5%
─────────────────────────────────────────────────────────────────────────────────────
Cocaine All 0.7% 1.5% 1.5% 98.5%
─────────────────────────────────────────────────────────────────────────────────────
Crack All 0.7% 0.7% 0.7% 99.3%
─────────────────────────────────────────────────────────────────────────────────────
Hallucinogens All 0.7% 0.7% 0.7% 99.3%
─────────────────────────────────────────────────────────────────────────────────────
Uppers All 0.8% 1.6% 1.6% 98.4%
─────────────────────────────────────────────────────────────────────────────────────
Downers All 1.6% 1.6% 2.4% 97.6%
─────────────────────────────────────────────────────────────────────────────────────
Rohypnol All 0.9% 0.9% 1.7% 98.3%
─────────────────────────────────────────────────────────────────────────────────────
Steroids All 1.0% 2.8% 2.8% 97.2%
─────────────────────────────────────────────────────────────────────────────────────
Ecstasy All 2.7% 3.5% 3.5% 96.5%
─────────────────────────────────────────────────────────────────────────────────────Heroin All 0.8% 1.7% 1.7% 98.3%
Fort Worth ISD D nbar Middle School (Grades 7 8)
8/6/2019 fort worth isd - dunbar middle school (grades 7-8) - 1998 Texas School Survey of Drug and Alcohol Use
http://slidepdf.com/reader/full/fort-worth-isd-dunbar-middle-school-grades-7-8-1998-texas-school-survey 55/138
Fort Worth ISD - Dunbar Middle School (Grades 7-8)
Spring 1998
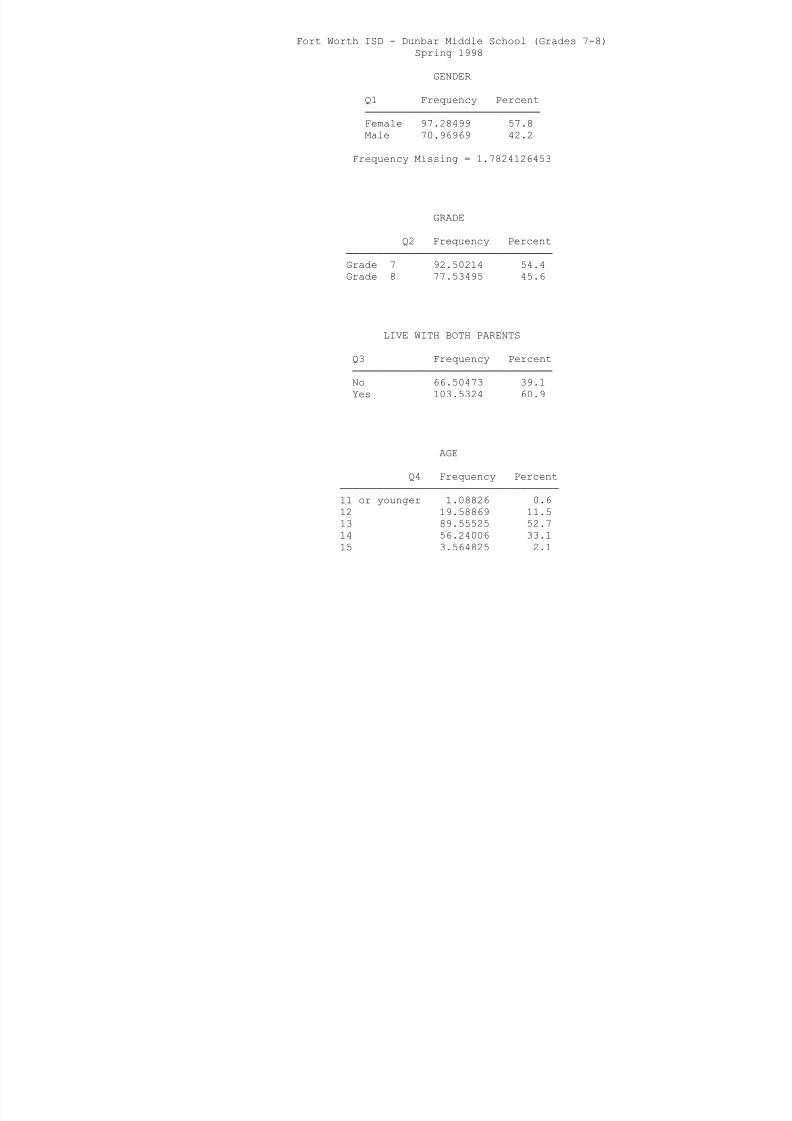
GENDER
Q1 Frequency Percent
────────────────────────────
Female 97.28499 57.8
Male 70.96969 42.2
Frequency Missing = 1.7824126453
GRADE
Q2 Frequency Percent
─────────────────────────────────
Grade 7 92.50214 54.4
Grade 8 77.53495 45.6
LIVE WITH BOTH PARENTS
Q3 Frequency Percent
────────────────────────────────
No 66.50473 39.1
Yes 103.5324 60.9
AGE
Q4 Frequency Percent
───────────────────────────────────
11 or younger 1.08826 0.6
12 19.58869 11.5
13 89.55525 52.7
14 56.24006 33.1
15 3.564825 2.1
8/6/2019 fort worth isd - dunbar middle school (grades 7-8) - 1998 Texas School Survey of Drug and Alcohol Use
http://slidepdf.com/reader/full/fort-worth-isd-dunbar-middle-school-grades-7-8-1998-texas-school-survey 56/138
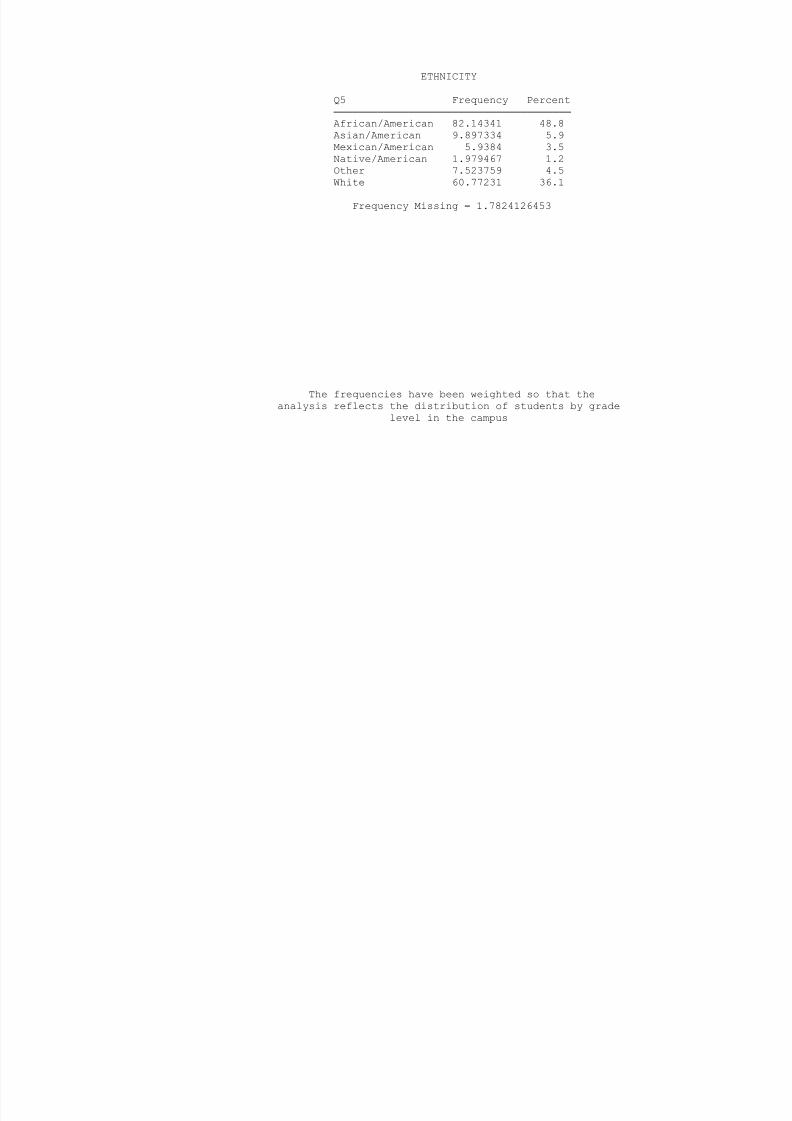
ETHNICITY
Q5 Frequency Percent
──────────────────────────────────────
African/American 82.14341 48.8
Asian/American 9.897334 5.9
Mexican/American 5.9384 3.5Native/American 1.979467 1.2
Other 7.523759 4.5
White 60.77231 36.1
Frequency Missing = 1.7824126453
The frequencies have been weighted so that the
analysis reflects the distribution of students by grade
level in the campus
Fort Worth ISD - Dunbar Middle School (Grades 7-8)
8/6/2019 fort worth isd - dunbar middle school (grades 7-8) - 1998 Texas School Survey of Drug and Alcohol Use
http://slidepdf.com/reader/full/fort-worth-isd-dunbar-middle-school-grades-7-8-1998-texas-school-survey 57/138
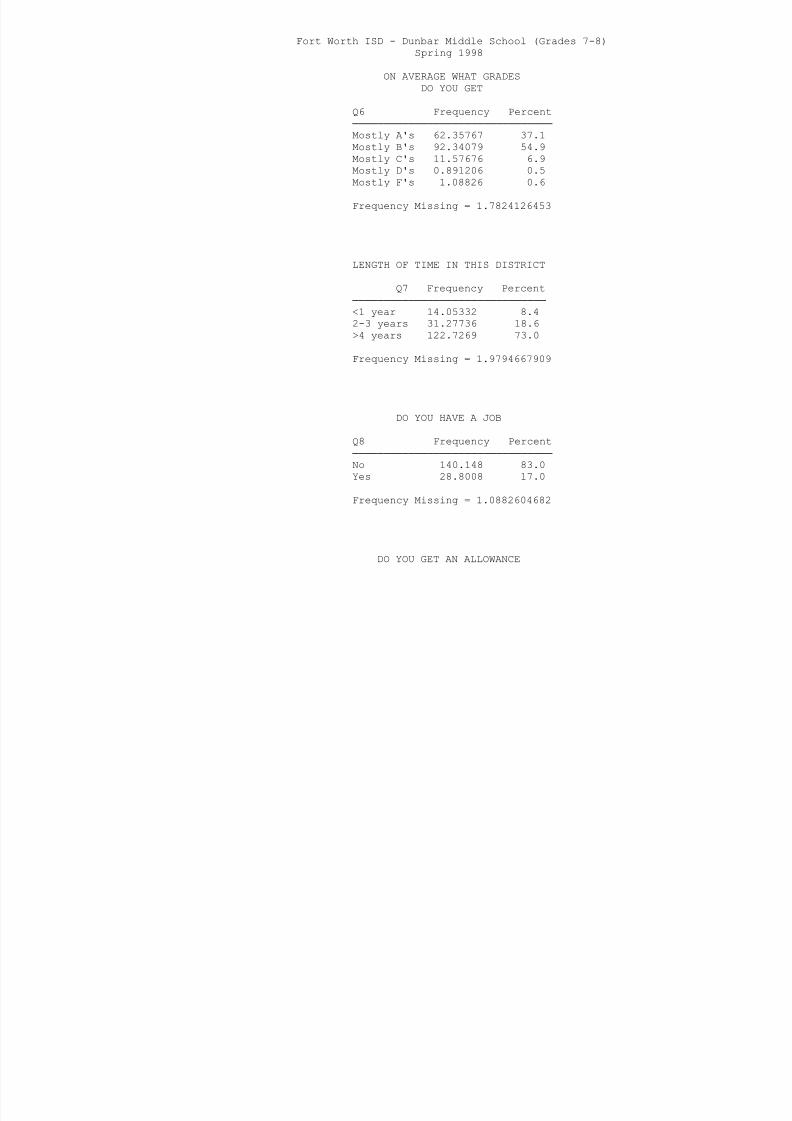
Fort Worth ISD - Dunbar Middle School (Grades 7-8)
Spring 1998
ON AVERAGE WHAT GRADES
DO YOU GET
Q6 Frequency Percent
────────────────────────────────
Mostly A's 62.35767 37.1
Mostly B's 92.34079 54.9Mostly C's 11.57676 6.9
Mostly D's 0.891206 0.5
Mostly F's 1.08826 0.6
Frequency Missing = 1.7824126453
LENGTH OF TIME IN THIS DISTRICT
Q7 Frequency Percent
───────────────────────────────
<1 year 14.05332 8.4
2-3 years 31.27736 18.6
>4 years 122.7269 73.0
Frequency Missing = 1.9794667909
DO YOU HAVE A JOB
Q8 Frequency Percent
────────────────────────────────
No 140.148 83.0
Yes 28.8008 17.0
Frequency Missing = 1.0882604682
DO YOU GET AN ALLOWANCE
8/6/2019 fort worth isd - dunbar middle school (grades 7-8) - 1998 Texas School Survey of Drug and Alcohol Use
http://slidepdf.com/reader/full/fort-worth-isd-dunbar-middle-school-grades-7-8-1998-texas-school-survey 58/138
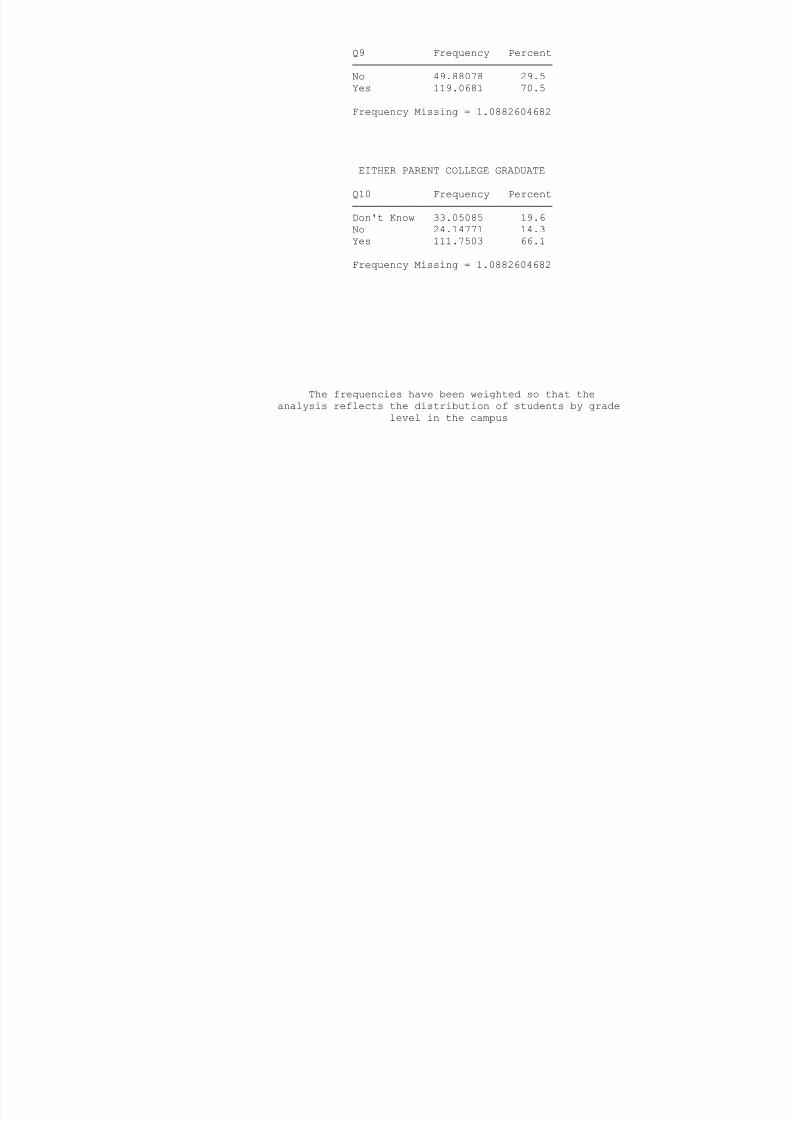
Q9 Frequency Percent
────────────────────────────────
No 49.88078 29.5
Yes 119.0681 70.5
Frequency Missing = 1.0882604682
EITHER PARENT COLLEGE GRADUATE
Q10 Frequency Percent
────────────────────────────────
Don't Know 33.05085 19.6
No 24.14771 14.3
Yes 111.7503 66.1
Frequency Missing = 1.0882604682
The frequencies have been weighted so that the
analysis reflects the distribution of students by grade
level in the campus
Fort Worth ISD - Dunbar Middle School (Grades 7-8)
8/6/2019 fort worth isd - dunbar middle school (grades 7-8) - 1998 Texas School Survey of Drug and Alcohol Use
http://slidepdf.com/reader/full/fort-worth-isd-dunbar-middle-school-grades-7-8-1998-texas-school-survey 59/138
Fort Worth ISD Dunbar Middle School (Grades 7 8)
Spring 1998
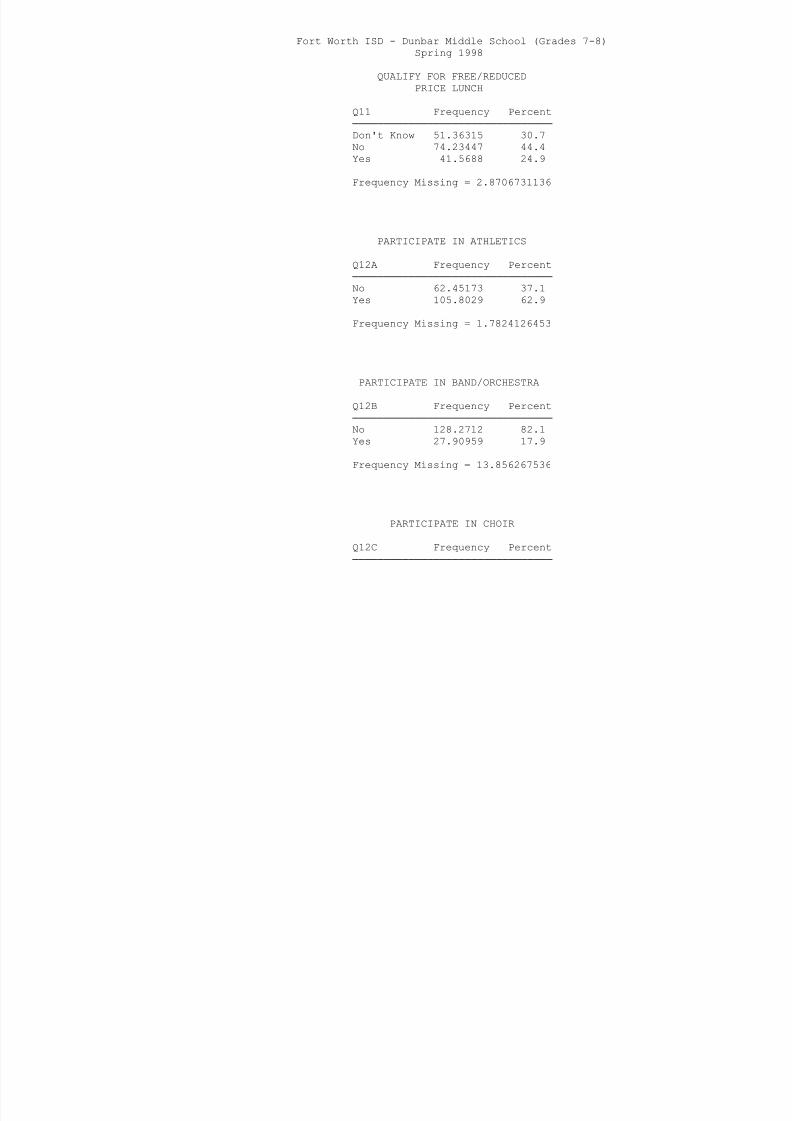
QUALIFY FOR FREE/REDUCED
PRICE LUNCH
Q11 Frequency Percent
────────────────────────────────
Don't Know 51.36315 30.7
No 74.23447 44.4Yes 41.5688 24.9
Frequency Missing = 2.8706731136
PARTICIPATE IN ATHLETICS
Q12A Frequency Percent
────────────────────────────────
No 62.45173 37.1
Yes 105.8029 62.9
Frequency Missing = 1.7824126453
PARTICIPATE IN BAND/ORCHESTRA
Q12B Frequency Percent
────────────────────────────────No 128.2712 82.1
Yes 27.90959 17.9
Frequency Missing = 13.856267536
PARTICIPATE IN CHOIR
Q12C Frequency Percent
────────────────────────────────
No 121.4416 78.3
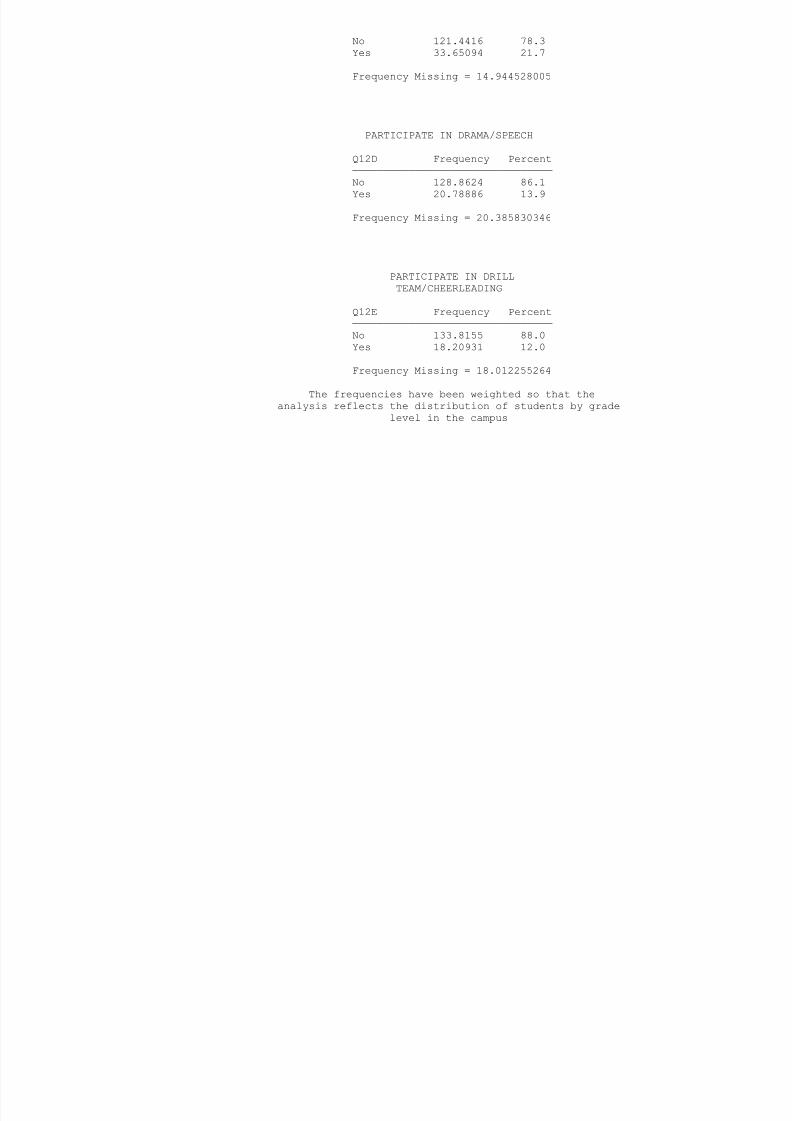
8/6/2019 fort worth isd - dunbar middle school (grades 7-8) - 1998 Texas School Survey of Drug and Alcohol Use
http://slidepdf.com/reader/full/fort-worth-isd-dunbar-middle-school-grades-7-8-1998-texas-school-survey 60/138
No 121.4416 78.3
Yes 33.65094 21.7
Frequency Missing = 14.944528005
PARTICIPATE IN DRAMA/SPEECH
Q12D Frequency Percent
────────────────────────────────
No 128.8624 86.1
Yes 20.78886 13.9
Frequency Missing = 20.385830346
PARTICIPATE IN DRILL
TEAM/CHEERLEADING
Q12E Frequency Percent
────────────────────────────────
No 133.8155 88.0
Yes 18.20931 12.0
Frequency Missing = 18.012255264
The frequencies have been weighted so that the
analysis reflects the distribution of students by grade
level in the campus
Fort Worth ISD - Dunbar Middle School (Grades 7-8)
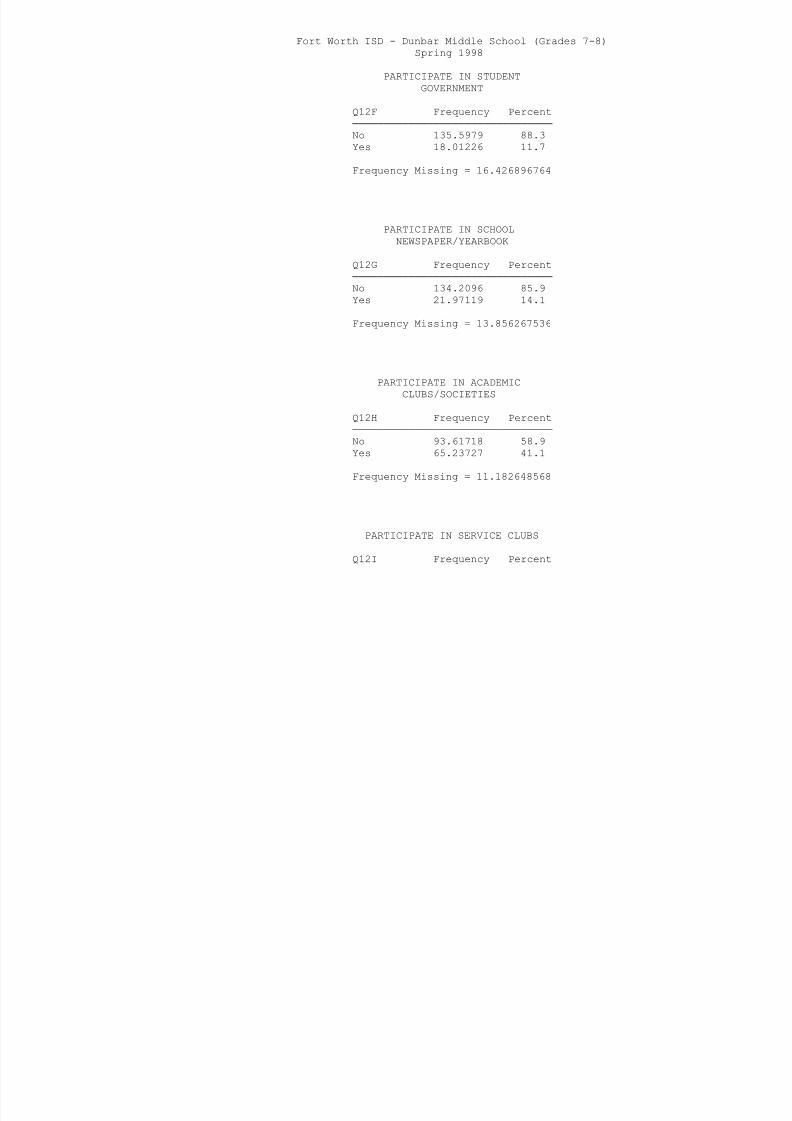
8/6/2019 fort worth isd - dunbar middle school (grades 7-8) - 1998 Texas School Survey of Drug and Alcohol Use
http://slidepdf.com/reader/full/fort-worth-isd-dunbar-middle-school-grades-7-8-1998-texas-school-survey 61/138
o t o t S u ba dd e Sc oo (G ades )
Spring 1998
PARTICIPATE IN STUDENT
GOVERNMENT
Q12F Frequency Percent
────────────────────────────────
No 135.5979 88.3
Yes 18.01226 11.7
Frequency Missing = 16.426896764
PARTICIPATE IN SCHOOL
NEWSPAPER/YEARBOOK
Q12G Frequency Percent
────────────────────────────────
No 134.2096 85.9Yes 21.97119 14.1
Frequency Missing = 13.856267536
PARTICIPATE IN ACADEMIC
CLUBS/SOCIETIES
Q12H Frequency Percent────────────────────────────────
No 93.61718 58.9
Yes 65.23727 41.1
Frequency Missing = 11.182648568
PARTICIPATE IN SERVICE CLUBS
Q12I Frequency Percent
────────────────────────────────
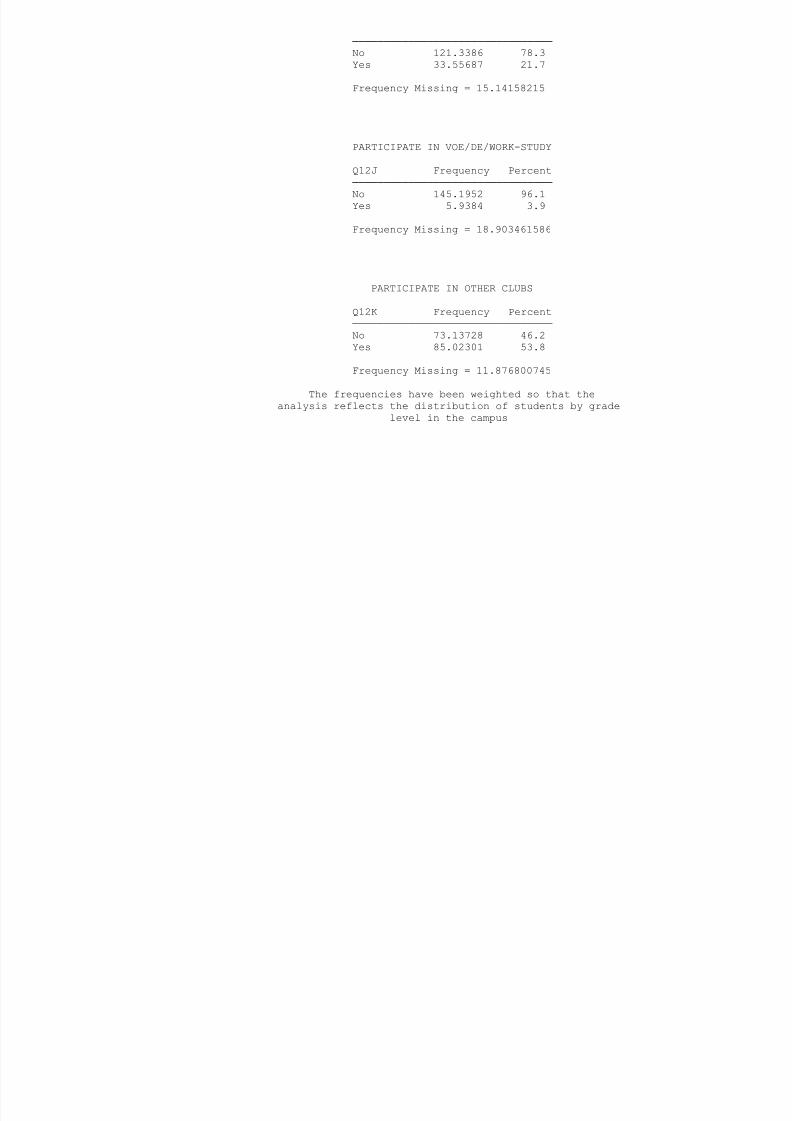
8/6/2019 fort worth isd - dunbar middle school (grades 7-8) - 1998 Texas School Survey of Drug and Alcohol Use
http://slidepdf.com/reader/full/fort-worth-isd-dunbar-middle-school-grades-7-8-1998-texas-school-survey 62/138
No 121.3386 78.3
Yes 33.55687 21.7
Frequency Missing = 15.14158215
PARTICIPATE IN VOE/DE/WORK-STUDY
Q12J Frequency Percent
────────────────────────────────
No 145.1952 96.1
Yes 5.9384 3.9
Frequency Missing = 18.903461586
PARTICIPATE IN OTHER CLUBS
Q12K Frequency Percent
────────────────────────────────
No 73.13728 46.2
Yes 85.02301 53.8
Frequency Missing = 11.876800745
The frequencies have been weighted so that the
analysis reflects the distribution of students by grade
level in the campus
Fort Worth ISD - Dunbar Middle School (Grades 7-8)
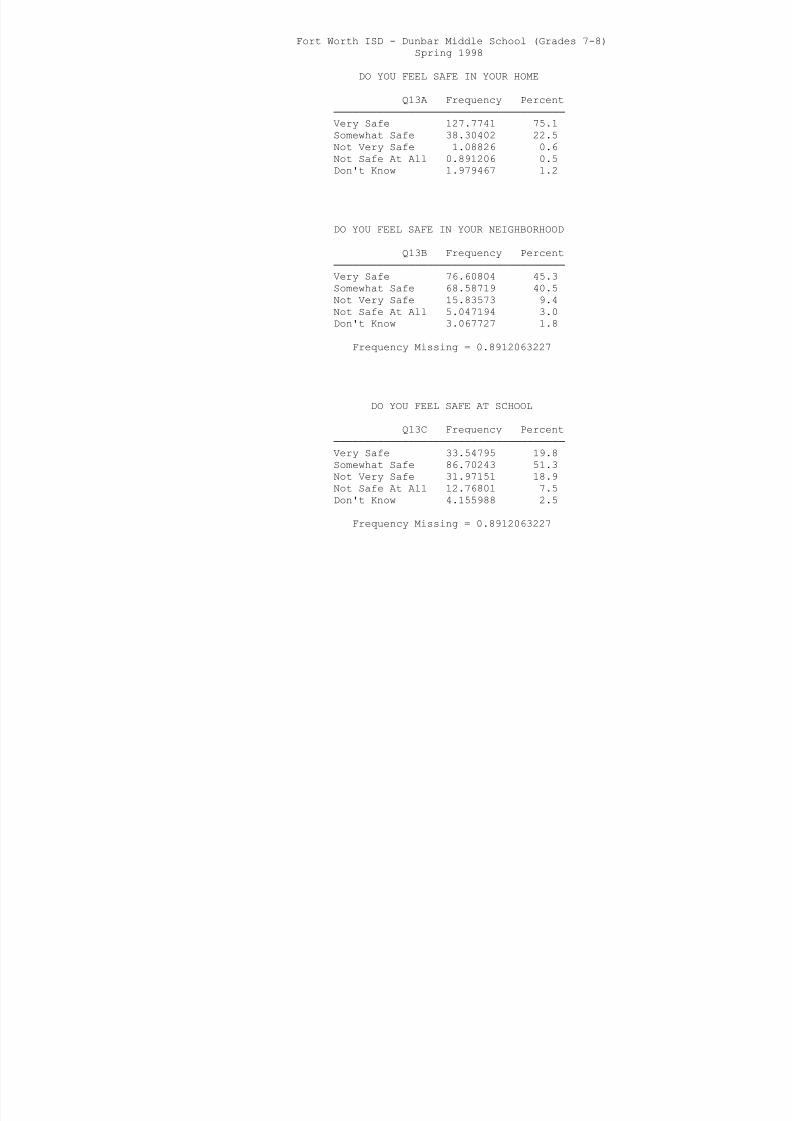
8/6/2019 fort worth isd - dunbar middle school (grades 7-8) - 1998 Texas School Survey of Drug and Alcohol Use
http://slidepdf.com/reader/full/fort-worth-isd-dunbar-middle-school-grades-7-8-1998-texas-school-survey 63/138
Spring 1998
DO YOU FEEL SAFE IN YOUR HOME
Q13A Frequency Percent
─────────────────────────────────────
Very Safe 127.7741 75.1
Somewhat Safe 38.30402 22.5
Not Very Safe 1.08826 0.6Not Safe At All 0.891206 0.5
Don't Know 1.979467 1.2
DO YOU FEEL SAFE IN YOUR NEIGHBORHOOD
Q13B Frequency Percent
─────────────────────────────────────
Very Safe 76.60804 45.3
Somewhat Safe 68.58719 40.5Not Very Safe 15.83573 9.4
Not Safe At All 5.047194 3.0
Don't Know 3.067727 1.8
Frequency Missing = 0.8912063227
DO YOU FEEL SAFE AT SCHOOL
Q13C Frequency Percent
─────────────────────────────────────
Very Safe 33.54795 19.8
Somewhat Safe 86.70243 51.3
Not Very Safe 31.97151 18.9
Not Safe At All 12.76801 7.5
Don't Know 4.155988 2.5
Frequency Missing = 0.8912063227

8/6/2019 fort worth isd - dunbar middle school (grades 7-8) - 1998 Texas School Survey of Drug and Alcohol Use
http://slidepdf.com/reader/full/fort-worth-isd-dunbar-middle-school-grades-7-8-1998-texas-school-survey 64/138
FRIENDS FEELING CLOSE
TO THEIR PARENTS
Q14A Frequency Percent
───────────────────────────
None 5.047194 3.0
A Few 32.06558 19.0
Some 33.95098 20.1
Most 60.57525 35.8All 37.50688 22.2
Frequency Missing = 0.8912063227
HOW MANY FRIENDS
CARRY WEAPONS
Q14B Frequency Percent
───────────────────────────None 116.1885 70.9
A Few 31.38035 19.1
Some 9.70028 5.9
Most 2.870673 1.8
All 3.761879 2.3
Frequency Missing = 6.1354545183
The frequencies have been weighted so that the
analysis reflects the distribution of students by grade
level in the campus
Fort Worth ISD - Dunbar Middle School (Grades 7-8)
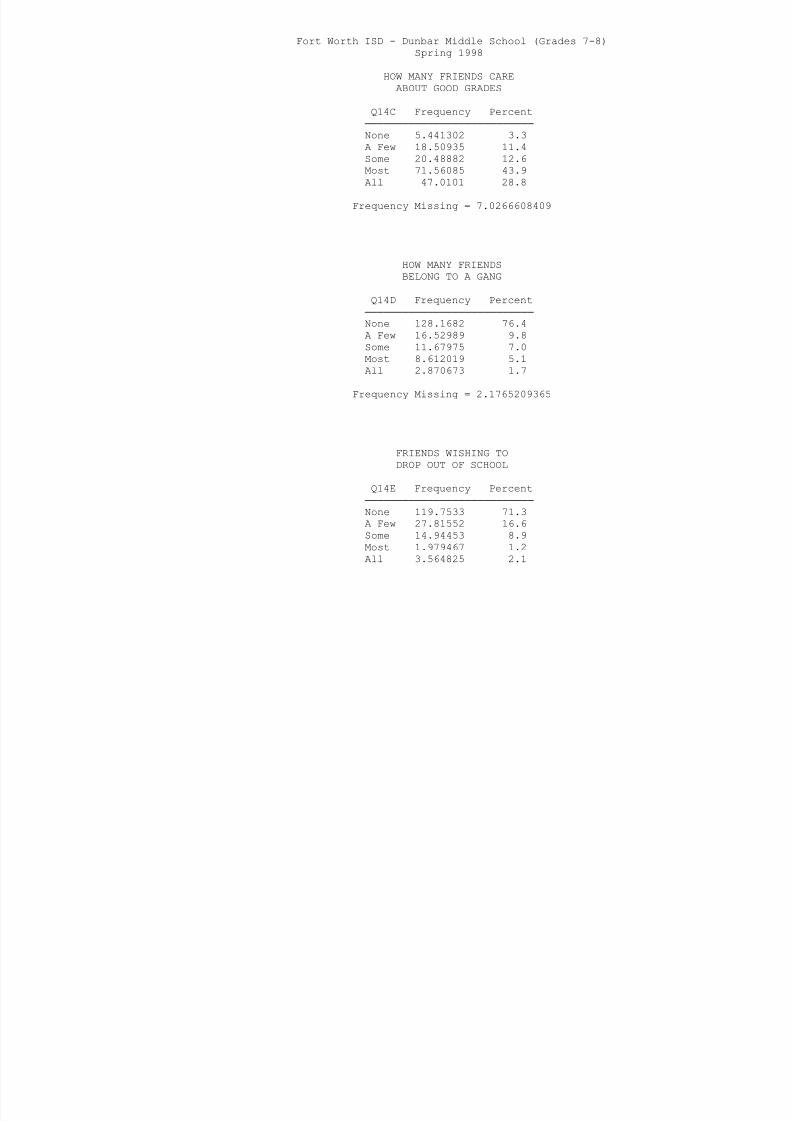
8/6/2019 fort worth isd - dunbar middle school (grades 7-8) - 1998 Texas School Survey of Drug and Alcohol Use
http://slidepdf.com/reader/full/fort-worth-isd-dunbar-middle-school-grades-7-8-1998-texas-school-survey 65/138
Spring 1998
HOW MANY FRIENDS CARE
ABOUT GOOD GRADES
Q14C Frequency Percent
───────────────────────────
None 5.441302 3.3
A Few 18.50935 11.4Some 20.48882 12.6
Most 71.56085 43.9
All 47.0101 28.8
Frequency Missing = 7.0266608409
HOW MANY FRIENDS
BELONG TO A GANG
Q14D Frequency Percent
───────────────────────────
None 128.1682 76.4
A Few 16.52989 9.8
Some 11.67975 7.0
Most 8.612019 5.1
All 2.870673 1.7
Frequency Missing = 2.1765209365
FRIENDS WISHING TO
DROP OUT OF SCHOOL
Q14E Frequency Percent
───────────────────────────
None 119.7533 71.3
A Few 27.81552 16.6
Some 14.94453 8.9
Most 1.979467 1.2
All 3.564825 2.1
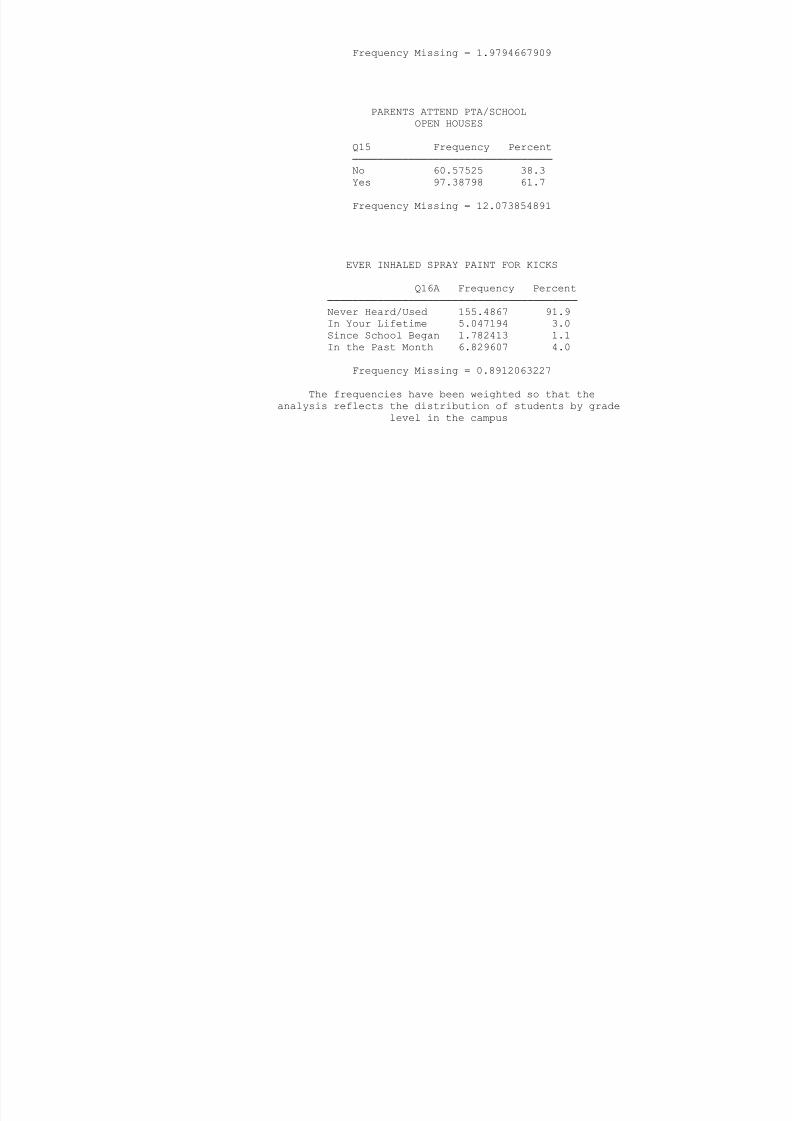
8/6/2019 fort worth isd - dunbar middle school (grades 7-8) - 1998 Texas School Survey of Drug and Alcohol Use
http://slidepdf.com/reader/full/fort-worth-isd-dunbar-middle-school-grades-7-8-1998-texas-school-survey 66/138
Frequency Missing = 1.9794667909
PARENTS ATTEND PTA/SCHOOL
OPEN HOUSES
Q15 Frequency Percent────────────────────────────────
No 60.57525 38.3
Yes 97.38798 61.7
Frequency Missing = 12.073854891
EVER INHALED SPRAY PAINT FOR KICKS
Q16A Frequency Percent────────────────────────────────────────
Never Heard/Used 155.4867 91.9
In Your Lifetime 5.047194 3.0
Since School Began 1.782413 1.1
In the Past Month 6.829607 4.0
Frequency Missing = 0.8912063227
The frequencies have been weighted so that the
analysis reflects the distribution of students by grade
level in the campus
Fort Worth ISD - Dunbar Middle School (Grades 7-8)
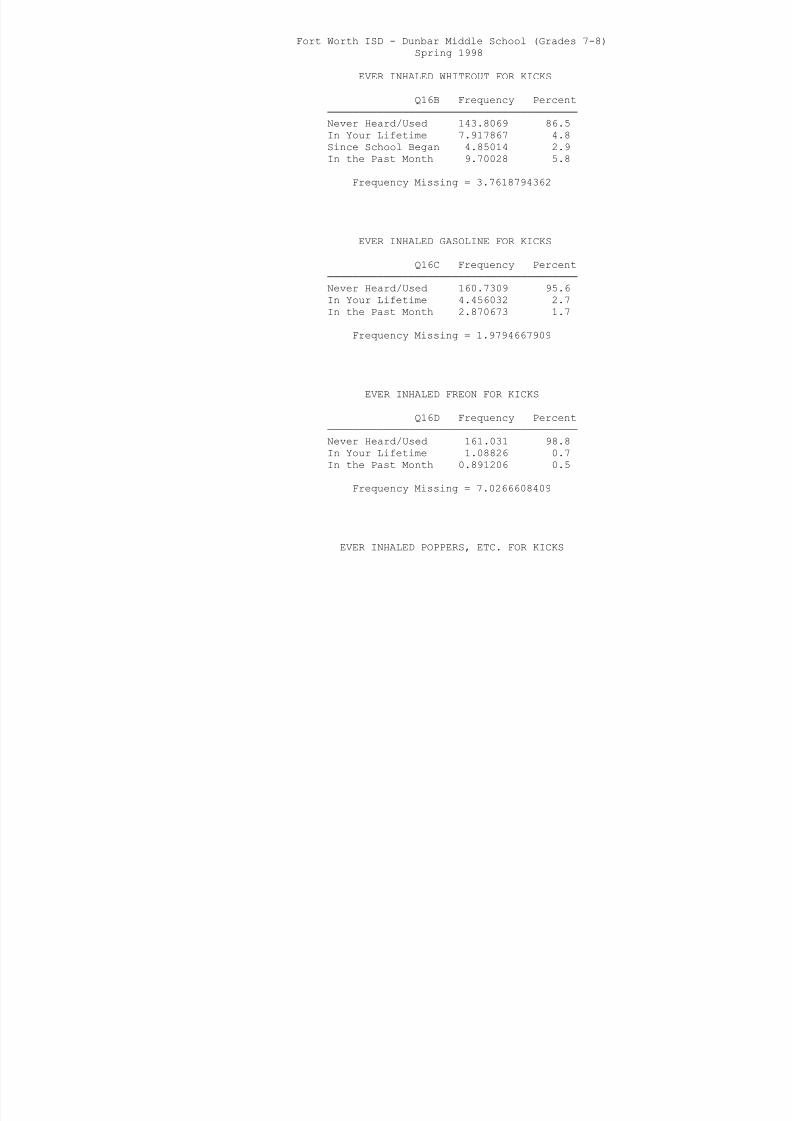
8/6/2019 fort worth isd - dunbar middle school (grades 7-8) - 1998 Texas School Survey of Drug and Alcohol Use
http://slidepdf.com/reader/full/fort-worth-isd-dunbar-middle-school-grades-7-8-1998-texas-school-survey 67/138
Spring 1998
EVER INHALED WHITEOUT FOR KICKS
Q16B Frequency Percent
────────────────────────────────────────
Never Heard/Used 143.8069 86.5
In Your Lifetime 7.917867 4.8
Since School Began 4.85014 2.9In the Past Month 9.70028 5.8
Frequency Missing = 3.7618794362
EVER INHALED GASOLINE FOR KICKS
Q16C Frequency Percent
────────────────────────────────────────
Never Heard/Used 160.7309 95.6In Your Lifetime 4.456032 2.7
In the Past Month 2.870673 1.7
Frequency Missing = 1.9794667909
EVER INHALED FREON FOR KICKS
Q16D Frequency Percent
────────────────────────────────────────
Never Heard/Used 161.031 98.8
In Your Lifetime 1.08826 0.7
In the Past Month 0.891206 0.5
Frequency Missing = 7.0266608409
EVER INHALED POPPERS, ETC. FOR KICKS

8/6/2019 fort worth isd - dunbar middle school (grades 7-8) - 1998 Texas School Survey of Drug and Alcohol Use
http://slidepdf.com/reader/full/fort-worth-isd-dunbar-middle-school-grades-7-8-1998-texas-school-survey 68/138
Fort Worth ISD - Dunbar Middle School (Grades 7-8)
S i 1998
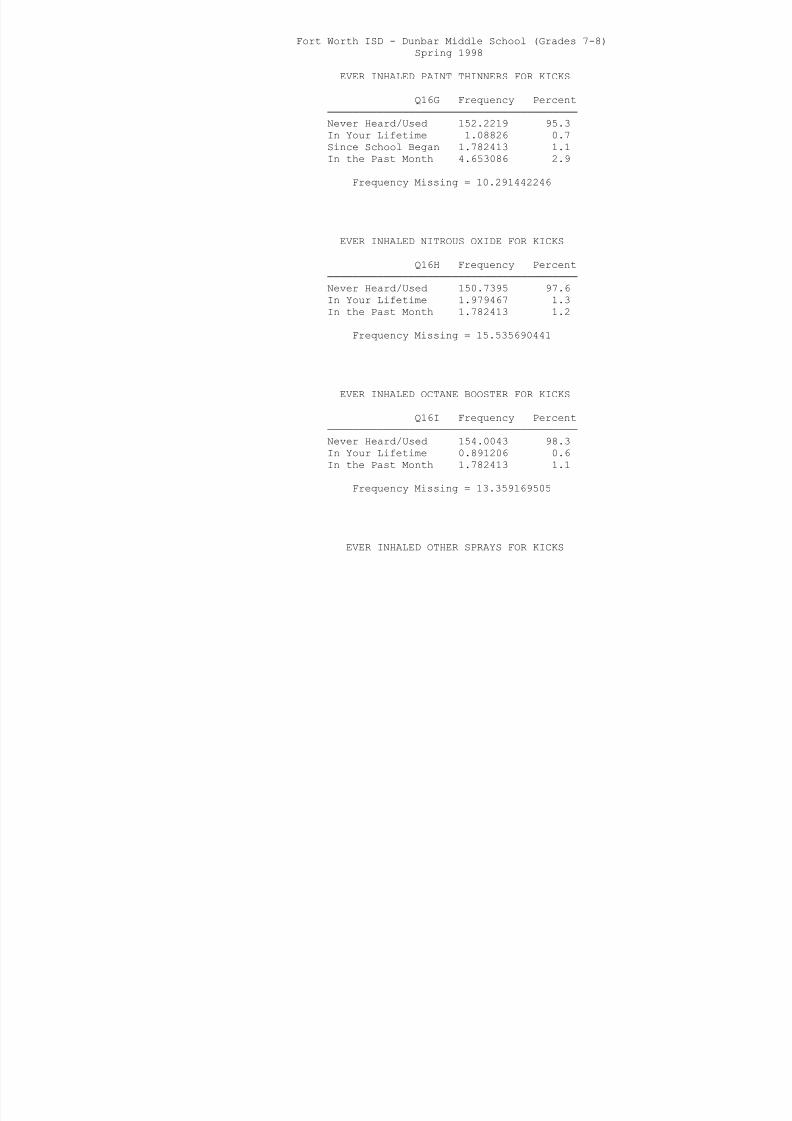
8/6/2019 fort worth isd - dunbar middle school (grades 7-8) - 1998 Texas School Survey of Drug and Alcohol Use
http://slidepdf.com/reader/full/fort-worth-isd-dunbar-middle-school-grades-7-8-1998-texas-school-survey 69/138
Spring 1998
EVER INHALED PAINT THINNERS FOR KICKS
Q16G Frequency Percent
────────────────────────────────────────
Never Heard/Used 152.2219 95.3
In Your Lifetime 1.08826 0.7
Since School Began 1.782413 1.1In the Past Month 4.653086 2.9
Frequency Missing = 10.291442246
EVER INHALED NITROUS OXIDE FOR KICKS
Q16H Frequency Percent
────────────────────────────────────────
Never Heard/Used 150.7395 97.6In Your Lifetime 1.979467 1.3
In the Past Month 1.782413 1.2
Frequency Missing = 15.535690441
EVER INHALED OCTANE BOOSTER FOR KICKS
Q16I Frequency Percent
────────────────────────────────────────
Never Heard/Used 154.0043 98.3
In Your Lifetime 0.891206 0.6
In the Past Month 1.782413 1.1
Frequency Missing = 13.359169505
EVER INHALED OTHER SPRAYS FOR KICKS
Q16J Frequency Percent
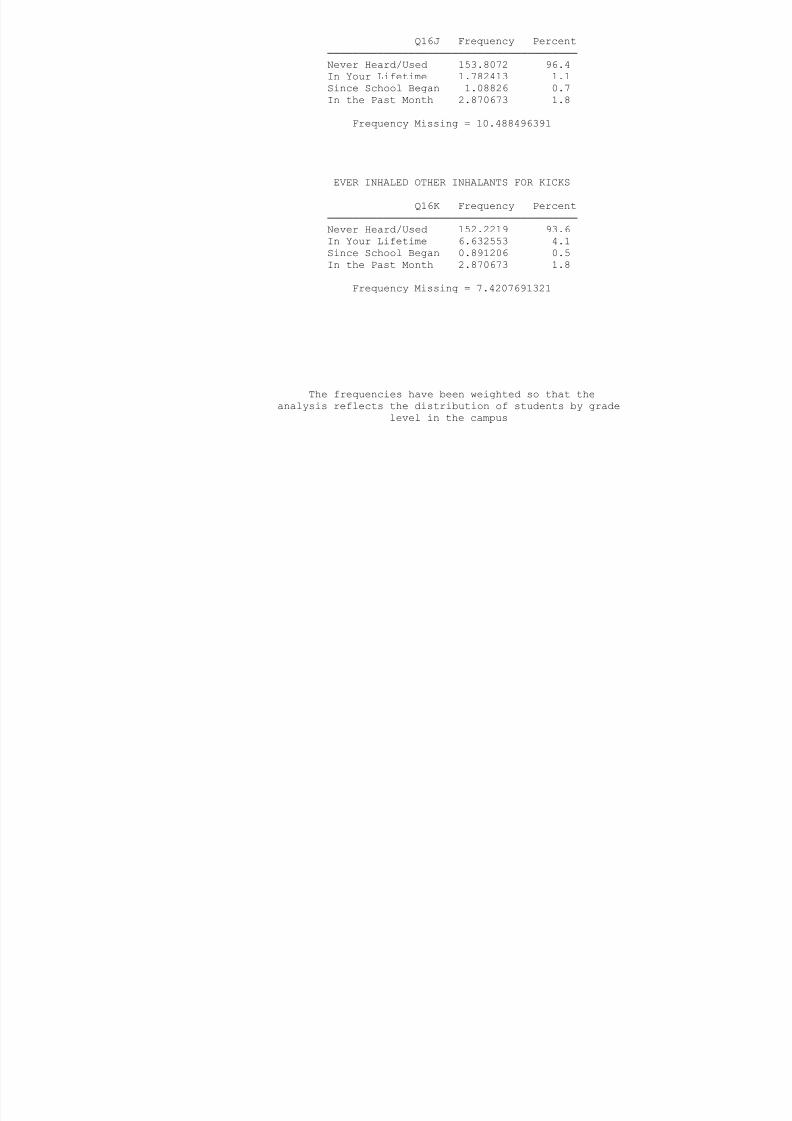
8/6/2019 fort worth isd - dunbar middle school (grades 7-8) - 1998 Texas School Survey of Drug and Alcohol Use
http://slidepdf.com/reader/full/fort-worth-isd-dunbar-middle-school-grades-7-8-1998-texas-school-survey 70/138
────────────────────────────────────────
Never Heard/Used 153.8072 96.4
In Your Lifetime 1.782413 1.1
Since School Began 1.08826 0.7
In the Past Month 2.870673 1.8
Frequency Missing = 10.488496391
EVER INHALED OTHER INHALANTS FOR KICKS
Q16K Frequency Percent
────────────────────────────────────────
Never Heard/Used 152.2219 93.6
In Your Lifetime 6.632553 4.1
Since School Began 0.891206 0.5
In the Past Month 2.870673 1.8
Frequency Missing = 7.4207691321
The frequencies have been weighted so that the
analysis reflects the distribution of students by grade
level in the campus
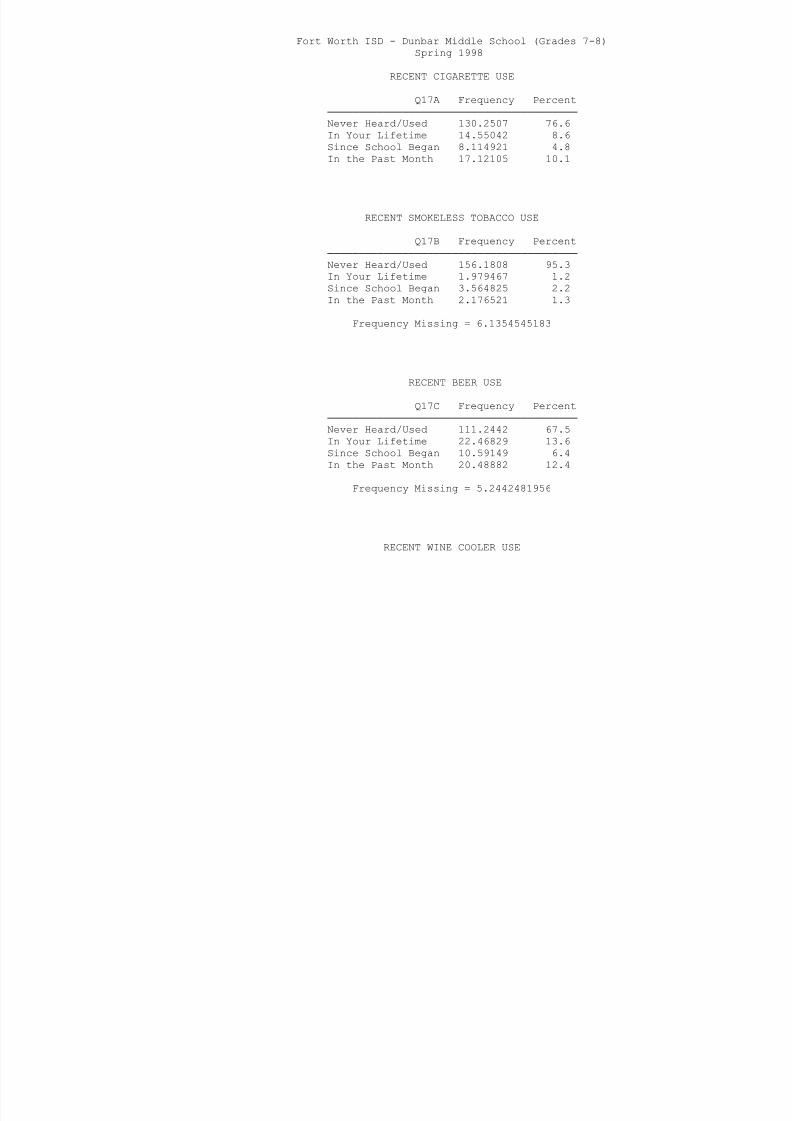
8/6/2019 fort worth isd - dunbar middle school (grades 7-8) - 1998 Texas School Survey of Drug and Alcohol Use
http://slidepdf.com/reader/full/fort-worth-isd-dunbar-middle-school-grades-7-8-1998-texas-school-survey 71/138
Q17D Frequency Percent
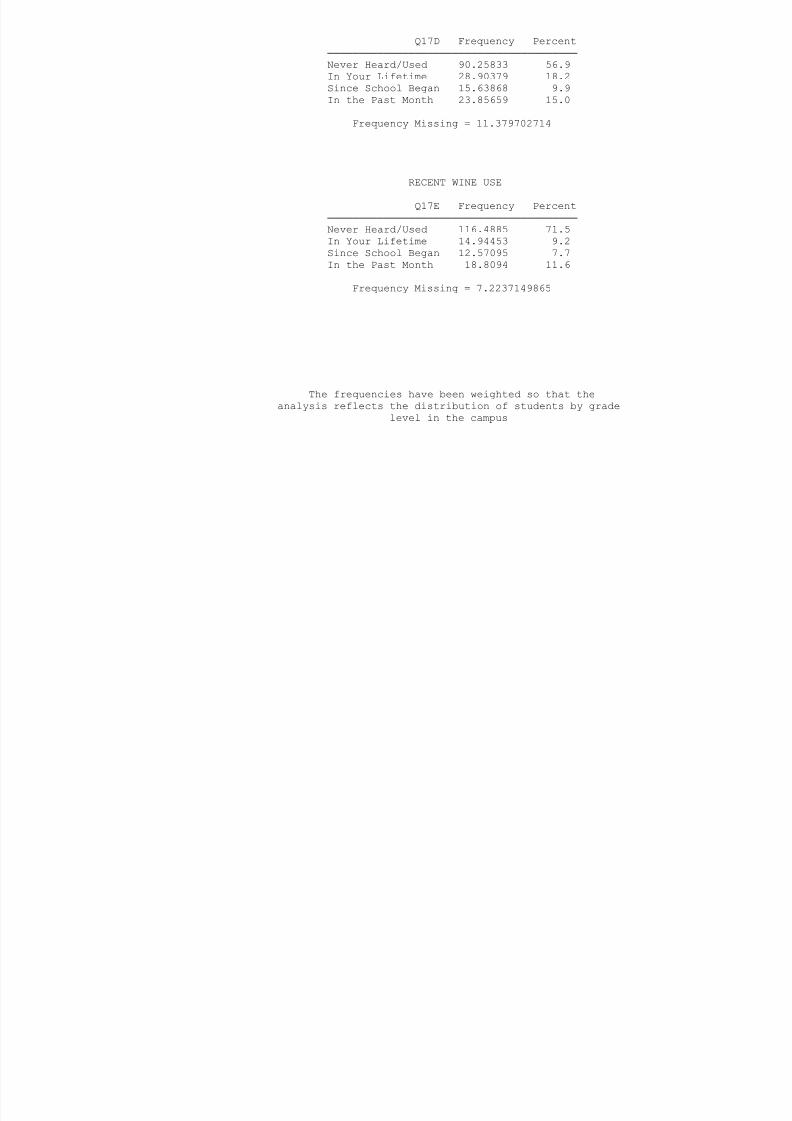
8/6/2019 fort worth isd - dunbar middle school (grades 7-8) - 1998 Texas School Survey of Drug and Alcohol Use
http://slidepdf.com/reader/full/fort-worth-isd-dunbar-middle-school-grades-7-8-1998-texas-school-survey 72/138
────────────────────────────────────────
Never Heard/Used 90.25833 56.9
In Your Lifetime 28.90379 18.2
Since School Began 15.63868 9.9
In the Past Month 23.85659 15.0
Frequency Missing = 11.379702714
RECENT WINE USE
Q17E Frequency Percent
────────────────────────────────────────
Never Heard/Used 116.4885 71.5
In Your Lifetime 14.94453 9.2
Since School Began 12.57095 7.7
In the Past Month 18.8094 11.6
Frequency Missing = 7.2237149865
The frequencies have been weighted so that the
analysis reflects the distribution of students by grade
level in the campus
Fort Worth ISD - Dunbar Middle School (Grades 7-8)
Spring 1998
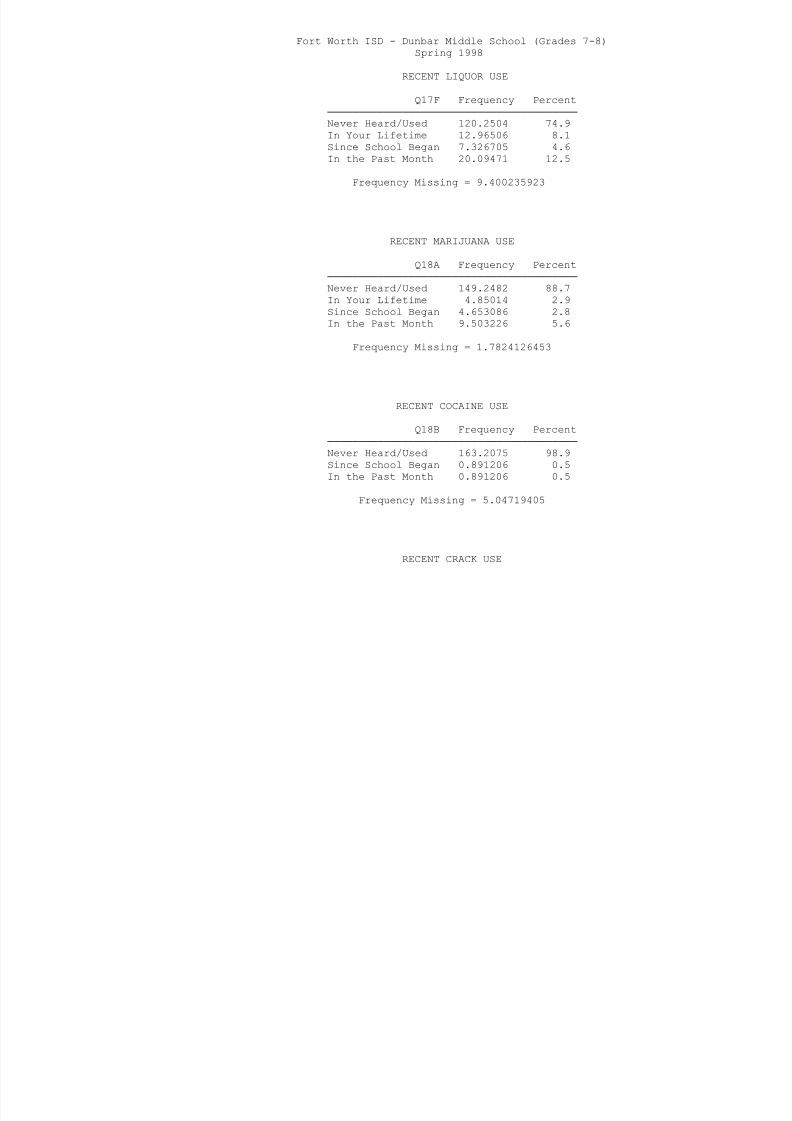
8/6/2019 fort worth isd - dunbar middle school (grades 7-8) - 1998 Texas School Survey of Drug and Alcohol Use
http://slidepdf.com/reader/full/fort-worth-isd-dunbar-middle-school-grades-7-8-1998-texas-school-survey 73/138
Spring 1998
RECENT LIQUOR USE
Q17F Frequency Percent
────────────────────────────────────────
Never Heard/Used 120.2504 74.9
In Your Lifetime 12.96506 8.1
Since School Began 7.326705 4.6In the Past Month 20.09471 12.5
Frequency Missing = 9.400235923
RECENT MARIJUANA USE
Q18A Frequency Percent
────────────────────────────────────────
Never Heard/Used 149.2482 88.7In Your Lifetime 4.85014 2.9
Since School Began 4.653086 2.8
In the Past Month 9.503226 5.6
Frequency Missing = 1.7824126453
RECENT COCAINE USE
Q18B Frequency Percent
────────────────────────────────────────
Never Heard/Used 163.2075 98.9
Since School Began 0.891206 0.5
In the Past Month 0.891206 0.5
Frequency Missing = 5.04719405
RECENT CRACK USE
Q18C Frequency Percent
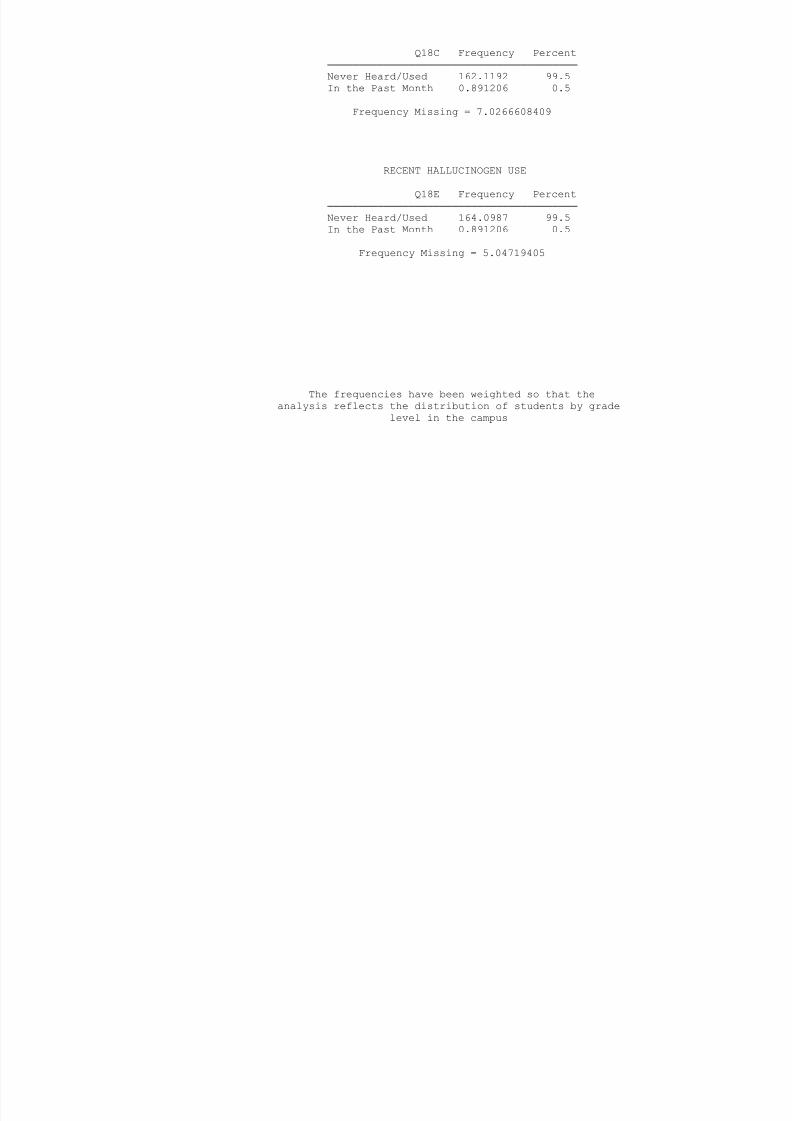
8/6/2019 fort worth isd - dunbar middle school (grades 7-8) - 1998 Texas School Survey of Drug and Alcohol Use
http://slidepdf.com/reader/full/fort-worth-isd-dunbar-middle-school-grades-7-8-1998-texas-school-survey 74/138
Q18C Frequency Percent
────────────────────────────────────────
Never Heard/Used 162.1192 99.5
In the Past Month 0.891206 0.5
Frequency Missing = 7.0266608409
RECENT HALLUCINOGEN USE
Q18E Frequency Percent
────────────────────────────────────────
Never Heard/Used 164.0987 99.5
In the Past Month 0.891206 0.5
Frequency Missing = 5.04719405
The frequencies have been weighted so that the
analysis reflects the distribution of students by grade
level in the campus
Fort Worth ISD - Dunbar Middle School (Grades 7-8)
Spring 1998
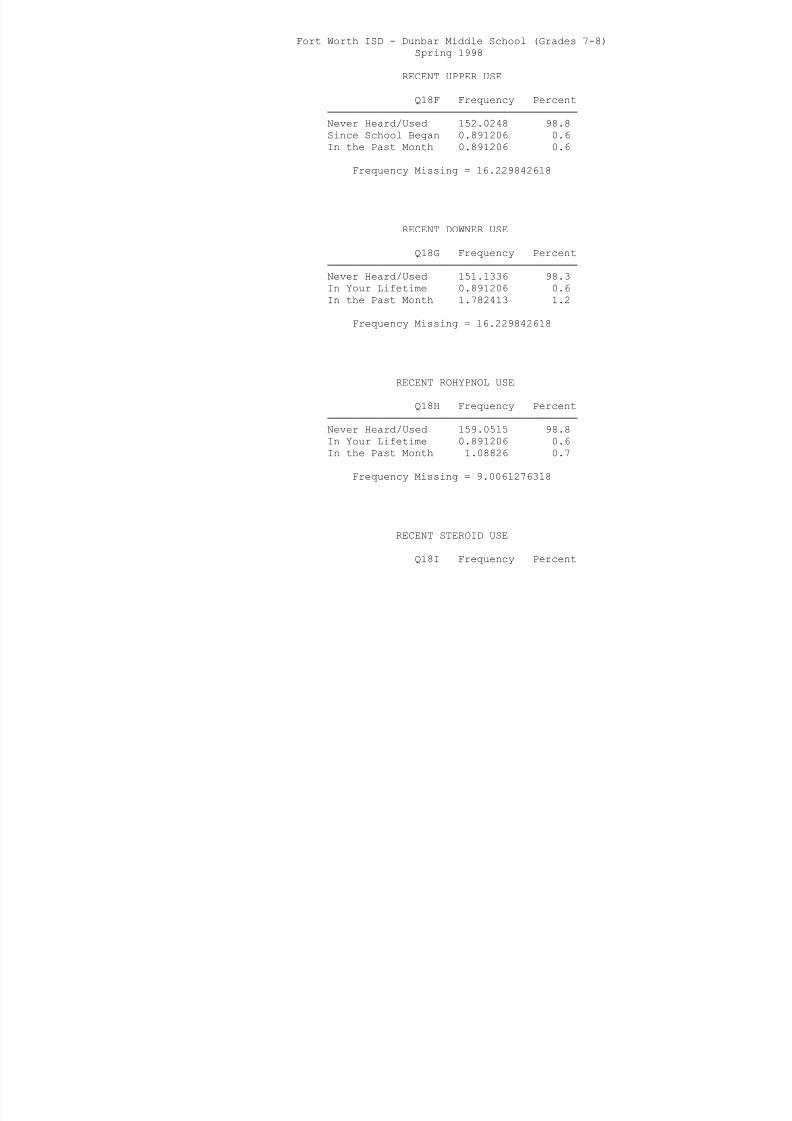
8/6/2019 fort worth isd - dunbar middle school (grades 7-8) - 1998 Texas School Survey of Drug and Alcohol Use
http://slidepdf.com/reader/full/fort-worth-isd-dunbar-middle-school-grades-7-8-1998-texas-school-survey 75/138
Spring 1998
RECENT UPPER USE
Q18F Frequency Percent
────────────────────────────────────────
Never Heard/Used 152.0248 98.8
Since School Began 0.891206 0.6
In the Past Month 0.891206 0.6
Frequency Missing = 16.229842618
RECENT DOWNER USE
Q18G Frequency Percent
────────────────────────────────────────
Never Heard/Used 151.1336 98.3
In Your Lifetime 0.891206 0.6In the Past Month 1.782413 1.2
Frequency Missing = 16.229842618
RECENT ROHYPNOL USE
Q18H Frequency Percent
────────────────────────────────────────
Never Heard/Used 159.0515 98.8
In Your Lifetime 0.891206 0.6
In the Past Month 1.08826 0.7
Frequency Missing = 9.0061276318
RECENT STEROID USE
Q18I Frequency Percent
────────────────────────────────────────
Never Heard/Used 150.7395 98.0
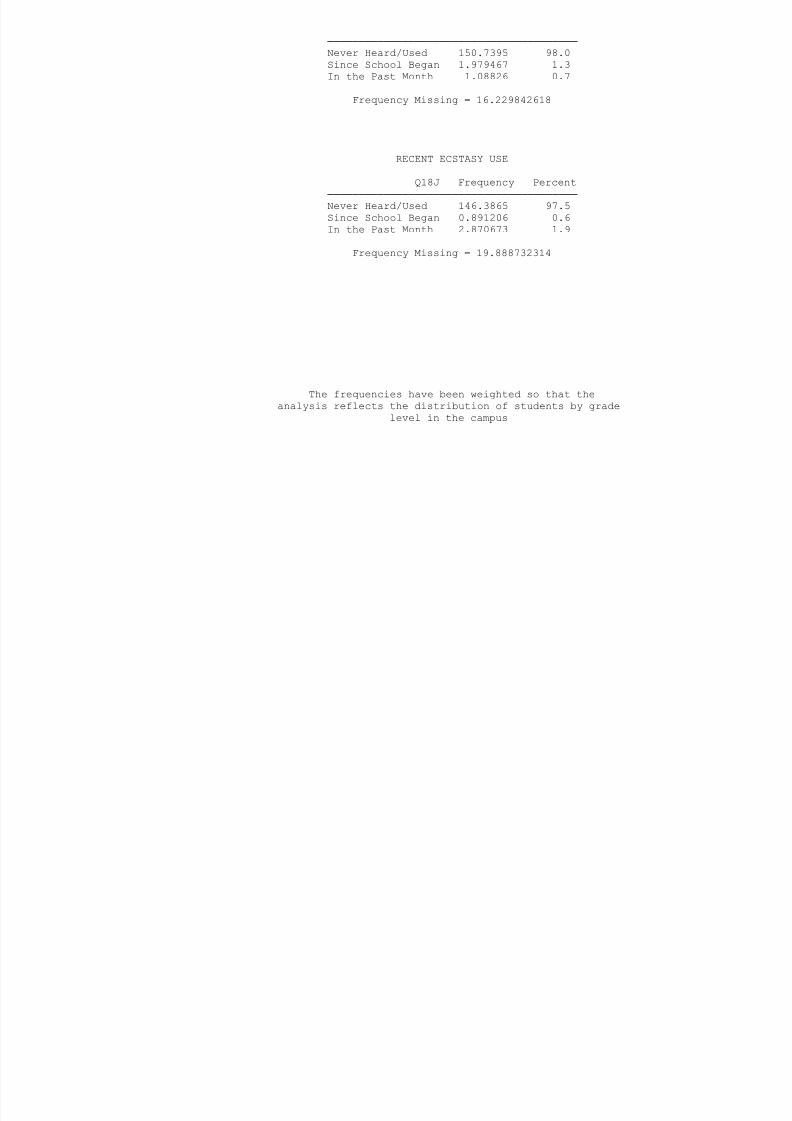
8/6/2019 fort worth isd - dunbar middle school (grades 7-8) - 1998 Texas School Survey of Drug and Alcohol Use
http://slidepdf.com/reader/full/fort-worth-isd-dunbar-middle-school-grades-7-8-1998-texas-school-survey 76/138
Never Heard/Used 150.7395 98.0
Since School Began 1.979467 1.3
In the Past Month 1.08826 0.7
Frequency Missing = 16.229842618
RECENT ECSTASY USE
Q18J Frequency Percent
────────────────────────────────────────
Never Heard/Used 146.3865 97.5
Since School Began 0.891206 0.6
In the Past Month 2.870673 1.9
Frequency Missing = 19.888732314
The frequencies have been weighted so that the
analysis reflects the distribution of students by grade
level in the campus
Fort Worth ISD - Dunbar Middle School (Grades 7-8)
Spring 1998
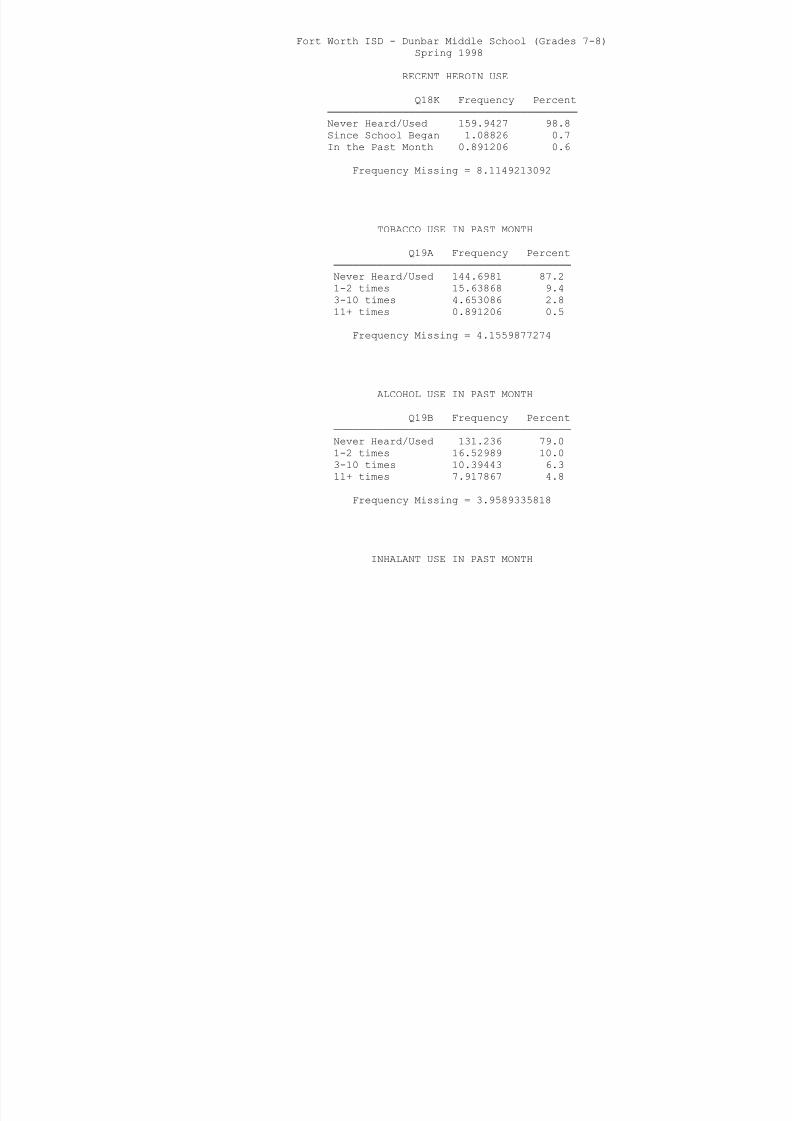
8/6/2019 fort worth isd - dunbar middle school (grades 7-8) - 1998 Texas School Survey of Drug and Alcohol Use
http://slidepdf.com/reader/full/fort-worth-isd-dunbar-middle-school-grades-7-8-1998-texas-school-survey 77/138
p g
RECENT HEROIN USE
Q18K Frequency Percent
────────────────────────────────────────
Never Heard/Used 159.9427 98.8
Since School Began 1.08826 0.7
In the Past Month 0.891206 0.6
Frequency Missing = 8.1149213092
TOBACCO USE IN PAST MONTH
Q19A Frequency Percent
──────────────────────────────────────
Never Heard/Used 144.6981 87.2
1-2 times 15.63868 9.43-10 times 4.653086 2.8
11+ times 0.891206 0.5
Frequency Missing = 4.1559877274
ALCOHOL USE IN PAST MONTH
Q19B Frequency Percent
──────────────────────────────────────
Never Heard/Used 131.236 79.0
1-2 times 16.52989 10.0
3-10 times 10.39443 6.3
11+ times 7.917867 4.8
Frequency Missing = 3.9589335818
INHALANT USE IN PAST MONTH
Q19C Frequency Percent
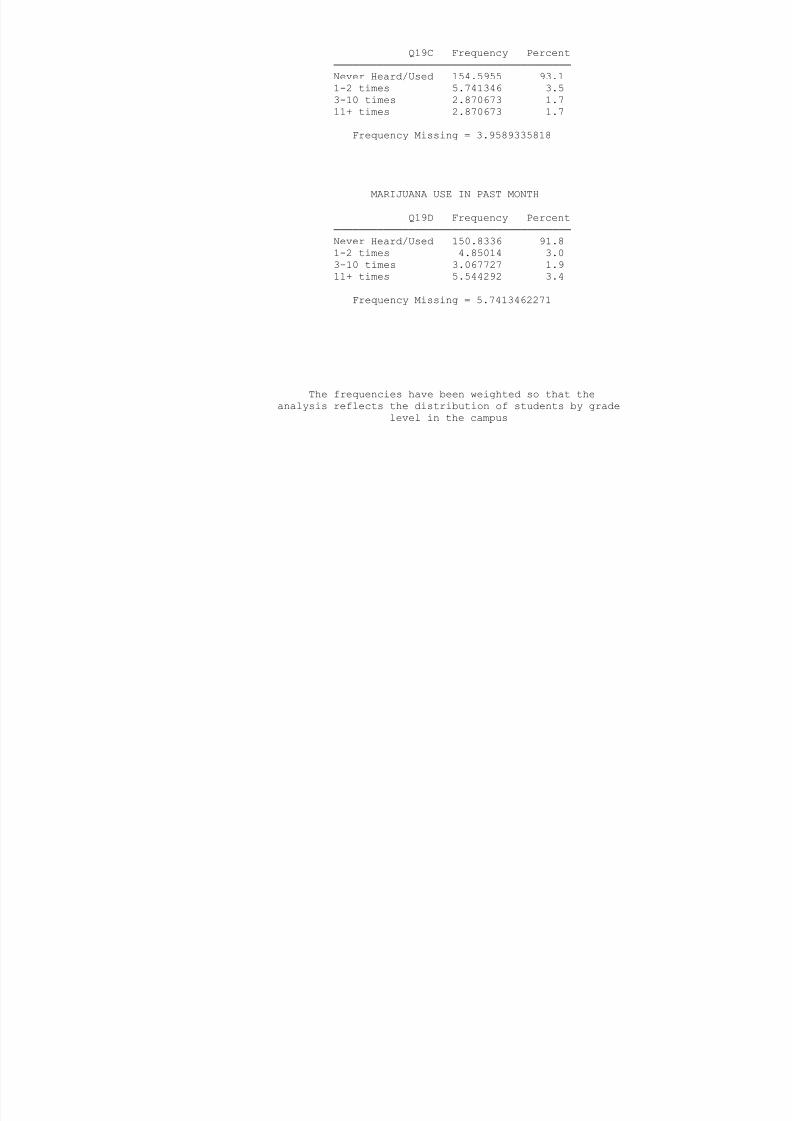
8/6/2019 fort worth isd - dunbar middle school (grades 7-8) - 1998 Texas School Survey of Drug and Alcohol Use
http://slidepdf.com/reader/full/fort-worth-isd-dunbar-middle-school-grades-7-8-1998-texas-school-survey 78/138
q y
──────────────────────────────────────
Never Heard/Used 154.5955 93.1
1-2 times 5.741346 3.5
3-10 times 2.870673 1.7
11+ times 2.870673 1.7
Frequency Missing = 3.9589335818
MARIJUANA USE IN PAST MONTH
Q19D Frequency Percent
──────────────────────────────────────
Never Heard/Used 150.8336 91.8
1-2 times 4.85014 3.0
3-10 times 3.067727 1.9
11+ times 5.544292 3.4
Frequency Missing = 5.7413462271
The frequencies have been weighted so that the
analysis reflects the distribution of students by grade
level in the campus
Fort Worth ISD - Dunbar Middle School (Grades 7-8)
Spring 1998
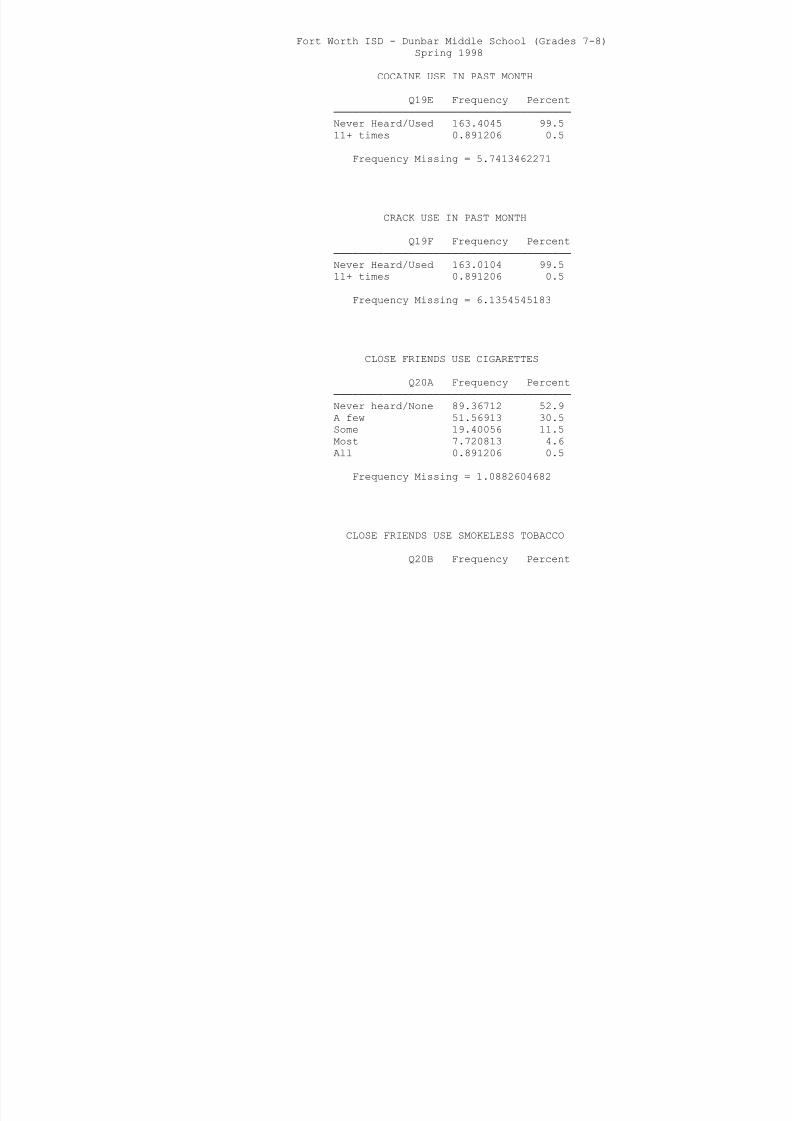
8/6/2019 fort worth isd - dunbar middle school (grades 7-8) - 1998 Texas School Survey of Drug and Alcohol Use
http://slidepdf.com/reader/full/fort-worth-isd-dunbar-middle-school-grades-7-8-1998-texas-school-survey 79/138
COCAINE USE IN PAST MONTH
Q19E Frequency Percent
──────────────────────────────────────
Never Heard/Used 163.4045 99.5
11+ times 0.891206 0.5
Frequency Missing = 5.7413462271
CRACK USE IN PAST MONTH
Q19F Frequency Percent
──────────────────────────────────────
Never Heard/Used 163.0104 99.5
11+ times 0.891206 0.5
Frequency Missing = 6.1354545183
CLOSE FRIENDS USE CIGARETTES
Q20A Frequency Percent
──────────────────────────────────────
Never heard/None 89.36712 52.9
A few 51.56913 30.5
Some 19.40056 11.5
Most 7.720813 4.6
All 0.891206 0.5
Frequency Missing = 1.0882604682
CLOSE FRIENDS USE SMOKELESS TOBACCO
Q20B Frequency Percent
──────────────────────────────────────
Never heard/None 140.7392 88.1
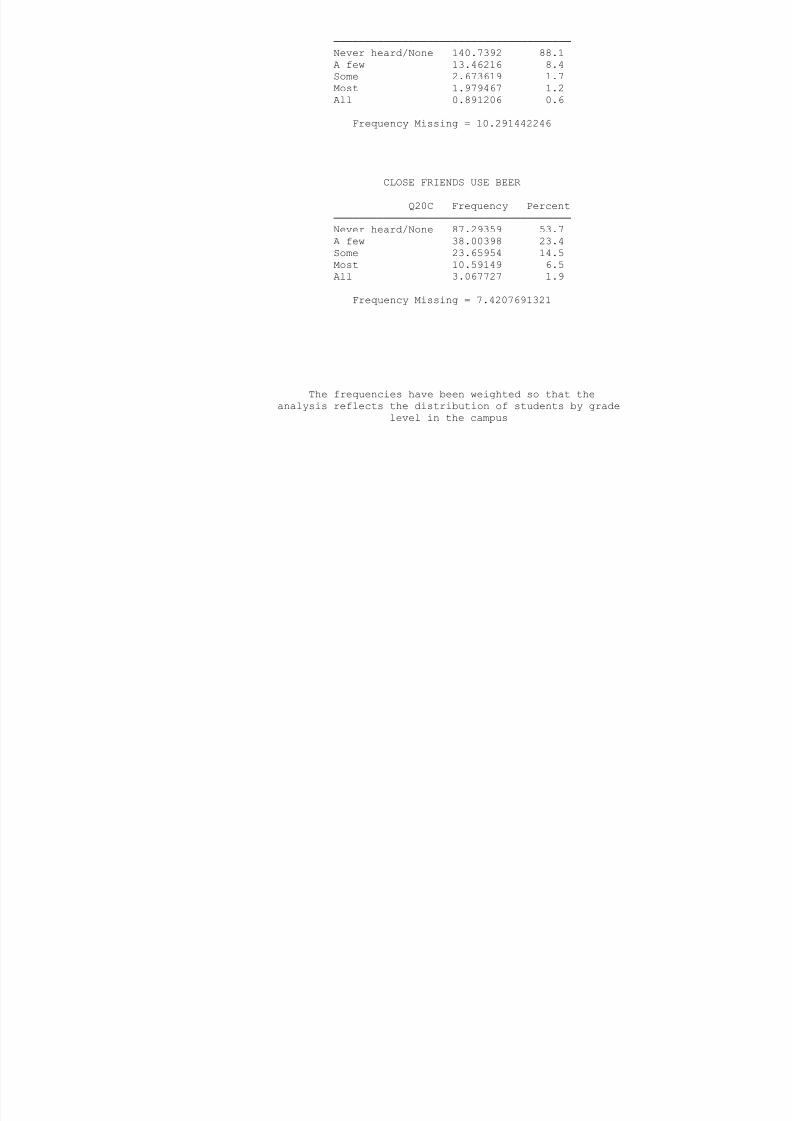
8/6/2019 fort worth isd - dunbar middle school (grades 7-8) - 1998 Texas School Survey of Drug and Alcohol Use
http://slidepdf.com/reader/full/fort-worth-isd-dunbar-middle-school-grades-7-8-1998-texas-school-survey 80/138
A few 13.46216 8.4
Some 2.673619 1.7
Most 1.979467 1.2
All 0.891206 0.6
Frequency Missing = 10.291442246
CLOSE FRIENDS USE BEER
Q20C Frequency Percent
──────────────────────────────────────
Never heard/None 87.29359 53.7
A few 38.00398 23.4
Some 23.65954 14.5
Most 10.59149 6.5
All 3.067727 1.9
Frequency Missing = 7.4207691321
The frequencies have been weighted so that the
analysis reflects the distribution of students by grade
level in the campus
Fort Worth ISD - Dunbar Middle School (Grades 7-8)
Spring 1998

8/6/2019 fort worth isd - dunbar middle school (grades 7-8) - 1998 Texas School Survey of Drug and Alcohol Use
http://slidepdf.com/reader/full/fort-worth-isd-dunbar-middle-school-grades-7-8-1998-texas-school-survey 81/138
CLOSE FRIENDS USE WINE COOLERS
Q20D Frequency Percent
──────────────────────────────────────
Never heard/None 83.72877 52.9
A few 36.52161 23.1
Some 19.20351 12.1Most 12.57095 7.9
All 6.135455 3.9
Frequency Missing = 11.876800745
CLOSE FRIENDS USE WINE
Q20E Frequency Percent
──────────────────────────────────────Never heard/None 109.8559 69.2
A few 23.16244 14.6
Some 13.95926 8.8
Most 7.720813 4.9
All 3.958934 2.5
Frequency Missing = 11.379702714
CLOSE FRIENDS USE LIQUOR
Q20F Frequency Percent
──────────────────────────────────────
Never heard/None 91.34659 62.7
A few 24.2507 16.6
Some 15.74167 10.8
Most 10.59149 7.3
All 3.761879 2.6
Frequency Missing = 24.344763928
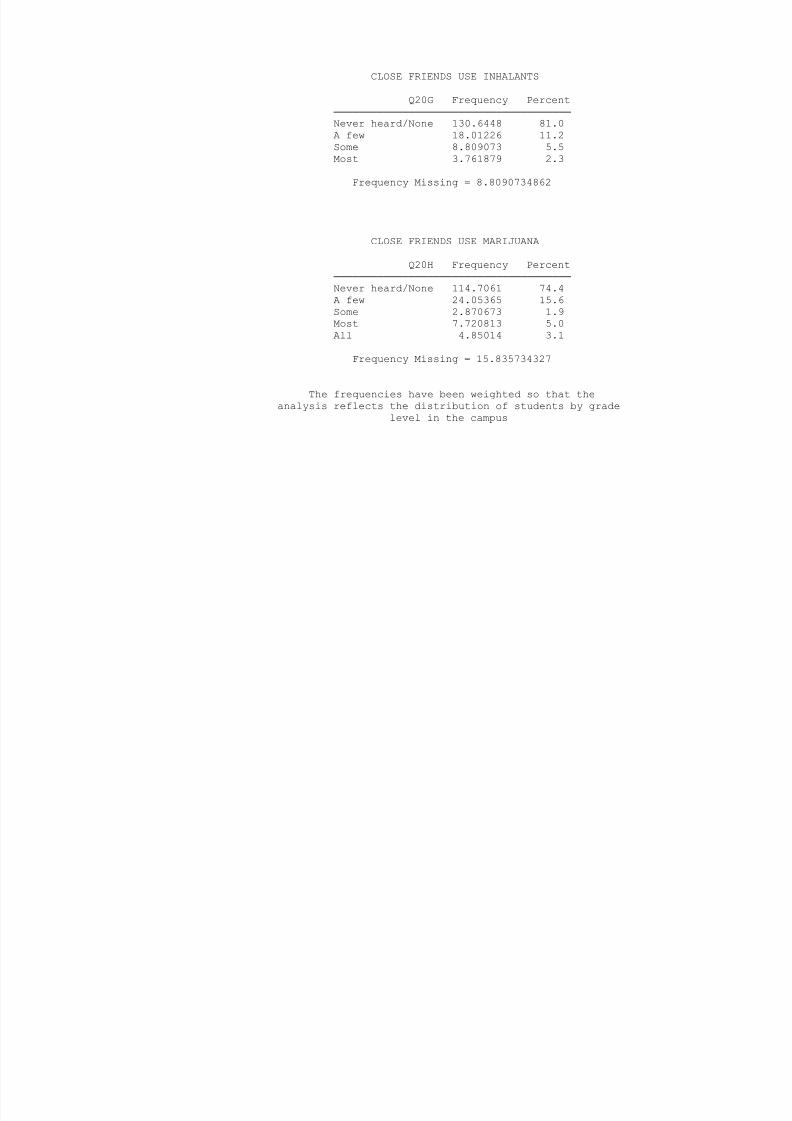
8/6/2019 fort worth isd - dunbar middle school (grades 7-8) - 1998 Texas School Survey of Drug and Alcohol Use
http://slidepdf.com/reader/full/fort-worth-isd-dunbar-middle-school-grades-7-8-1998-texas-school-survey 82/138
CLOSE FRIENDS USE INHALANTS
Q20G Frequency Percent
──────────────────────────────────────
Never heard/None 130.6448 81.0
A few 18.01226 11.2
Some 8.809073 5.5Most 3.761879 2.3
Frequency Missing = 8.8090734862
CLOSE FRIENDS USE MARIJUANA
Q20H Frequency Percent
──────────────────────────────────────
Never heard/None 114.7061 74.4A few 24.05365 15.6
Some 2.870673 1.9
Most 7.720813 5.0
All 4.85014 3.1
Frequency Missing = 15.835734327
The frequencies have been weighted so that the
analysis reflects the distribution of students by grade
level in the campus
Fort Worth ISD - Dunbar Middle School (Grades 7-8)
Spring 1998
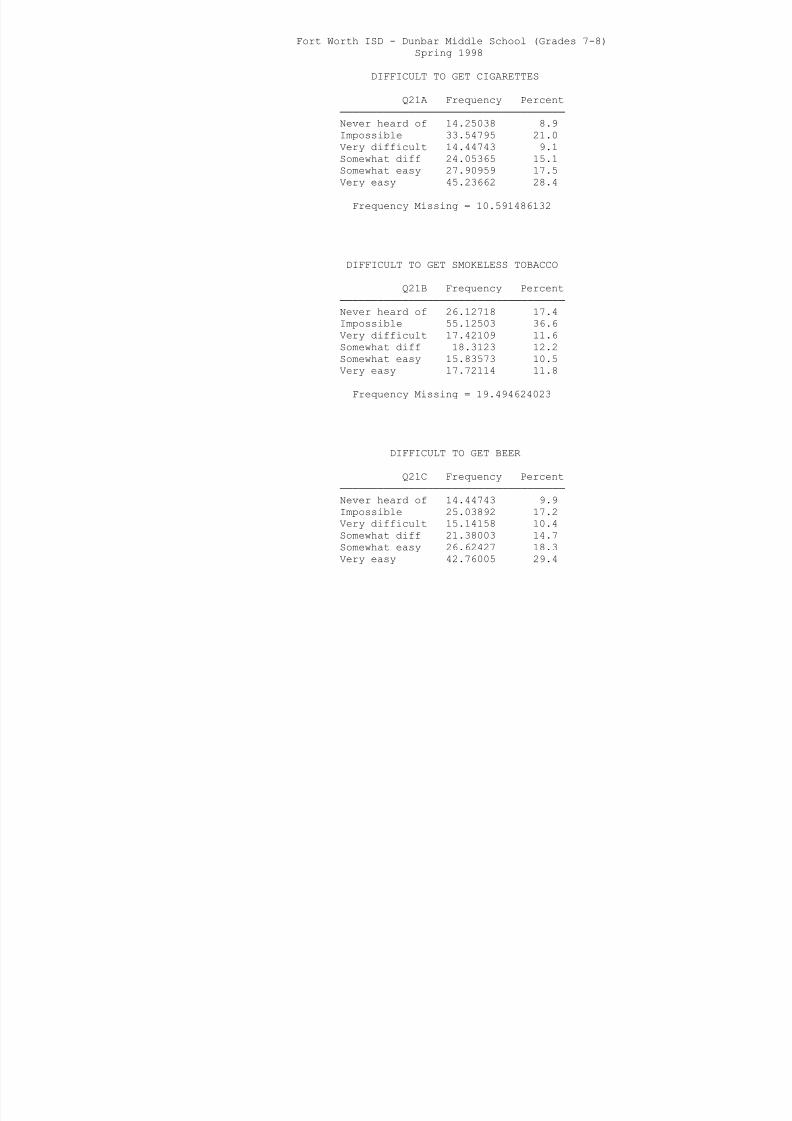
8/6/2019 fort worth isd - dunbar middle school (grades 7-8) - 1998 Texas School Survey of Drug and Alcohol Use
http://slidepdf.com/reader/full/fort-worth-isd-dunbar-middle-school-grades-7-8-1998-texas-school-survey 83/138
DIFFICULT TO GET CIGARETTES
Q21A Frequency Percent
────────────────────────────────────
Never heard of 14.25038 8.9
Impossible 33.54795 21.0
Very difficult 14.44743 9.1Somewhat diff 24.05365 15.1
Somewhat easy 27.90959 17.5
Very easy 45.23662 28.4
Frequency Missing = 10.591486132
DIFFICULT TO GET SMOKELESS TOBACCO
Q21B Frequency Percent────────────────────────────────────
Never heard of 26.12718 17.4
Impossible 55.12503 36.6
Very difficult 17.42109 11.6
Somewhat diff 18.3123 12.2
Somewhat easy 15.83573 10.5
Very easy 17.72114 11.8
Frequency Missing = 19.494624023
DIFFICULT TO GET BEER
Q21C Frequency Percent
────────────────────────────────────
Never heard of 14.44743 9.9
Impossible 25.03892 17.2
Very difficult 15.14158 10.4
Somewhat diff 21.38003 14.7
Somewhat easy 26.62427 18.3
Very easy 42.76005 29.4
Frequency Missing = 24.644807813
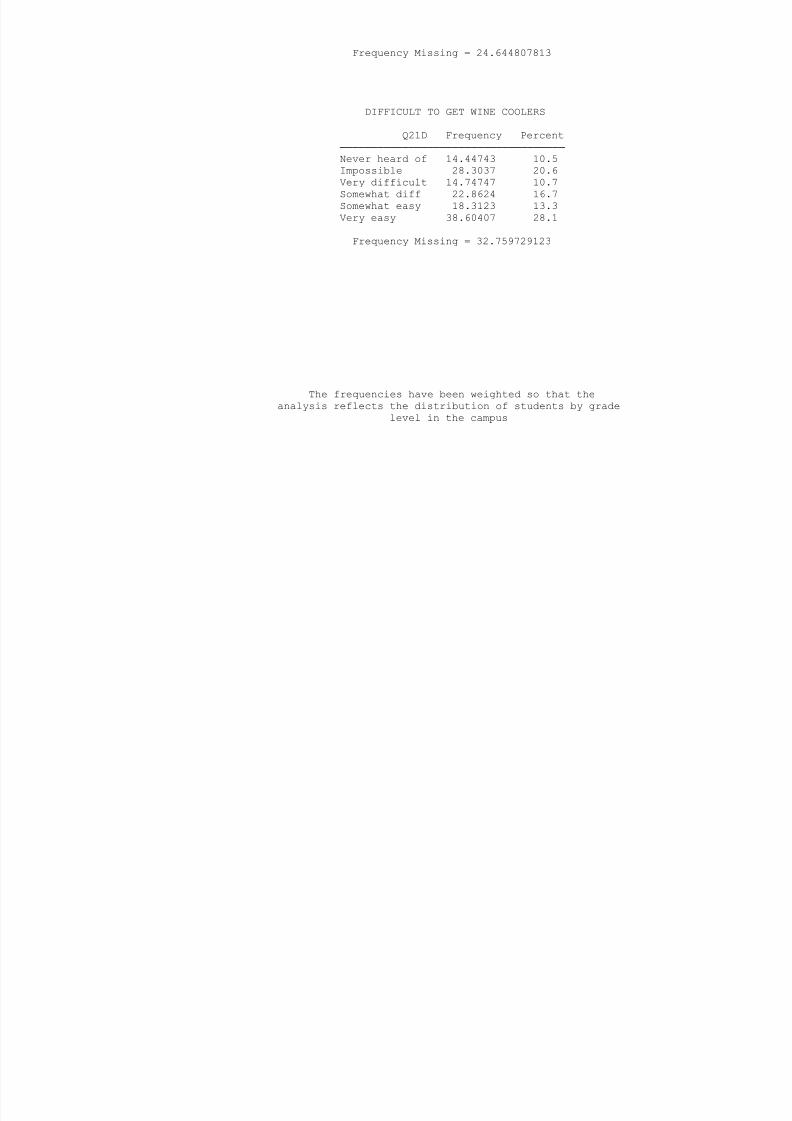
8/6/2019 fort worth isd - dunbar middle school (grades 7-8) - 1998 Texas School Survey of Drug and Alcohol Use
http://slidepdf.com/reader/full/fort-worth-isd-dunbar-middle-school-grades-7-8-1998-texas-school-survey 84/138
DIFFICULT TO GET WINE COOLERS
Q21D Frequency Percent
────────────────────────────────────Never heard of 14.44743 10.5
Impossible 28.3037 20.6
Very difficult 14.74747 10.7
Somewhat diff 22.8624 16.7
Somewhat easy 18.3123 13.3
Very easy 38.60407 28.1
Frequency Missing = 32.759729123
The frequencies have been weighted so that the
analysis reflects the distribution of students by grade
level in the campus

8/6/2019 fort worth isd - dunbar middle school (grades 7-8) - 1998 Texas School Survey of Drug and Alcohol Use
http://slidepdf.com/reader/full/fort-worth-isd-dunbar-middle-school-grades-7-8-1998-texas-school-survey 85/138
Frequency Missing = 25.141905845
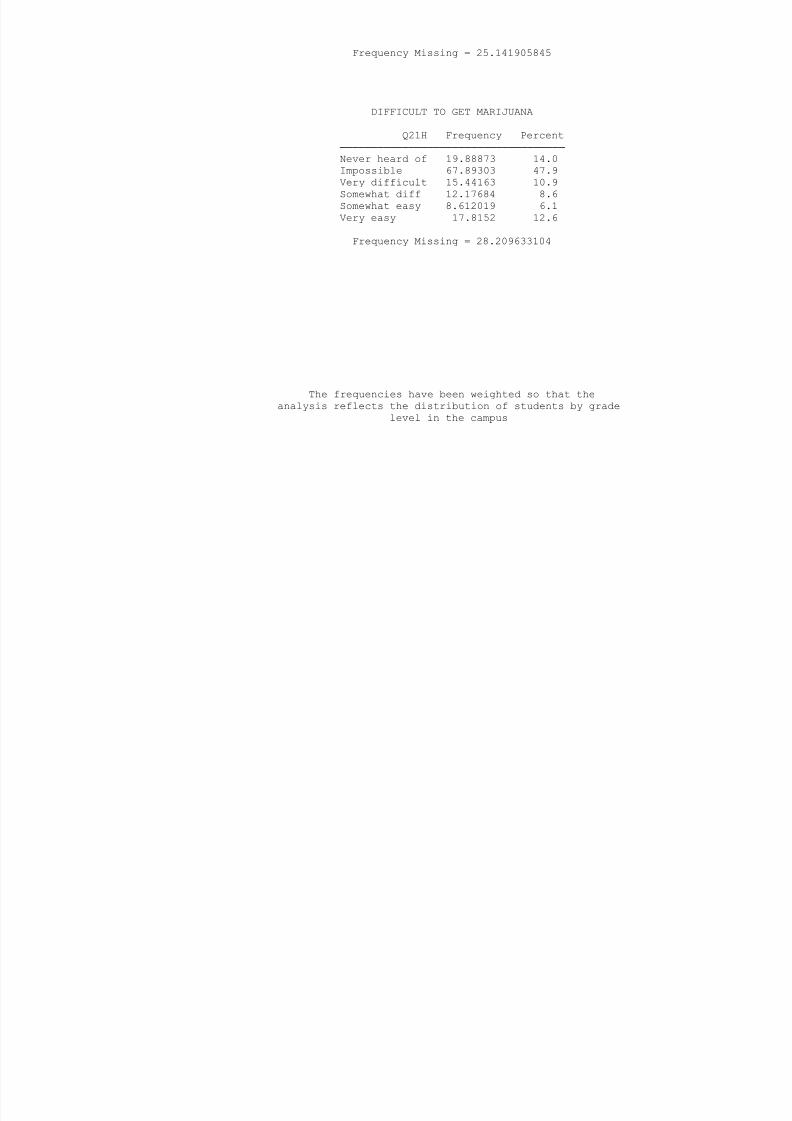
8/6/2019 fort worth isd - dunbar middle school (grades 7-8) - 1998 Texas School Survey of Drug and Alcohol Use
http://slidepdf.com/reader/full/fort-worth-isd-dunbar-middle-school-grades-7-8-1998-texas-school-survey 86/138
DIFFICULT TO GET MARIJUANA
Q21H Frequency Percent
────────────────────────────────────Never heard of 19.88873 14.0
Impossible 67.89303 47.9
Very difficult 15.44163 10.9
Somewhat diff 12.17684 8.6
Somewhat easy 8.612019 6.1
Very easy 17.8152 12.6
Frequency Missing = 28.209633104
The frequencies have been weighted so that the
analysis reflects the distribution of students by grade
level in the campus
Fort Worth ISD - Dunbar Middle School (Grades 7-8)
Spring 1998
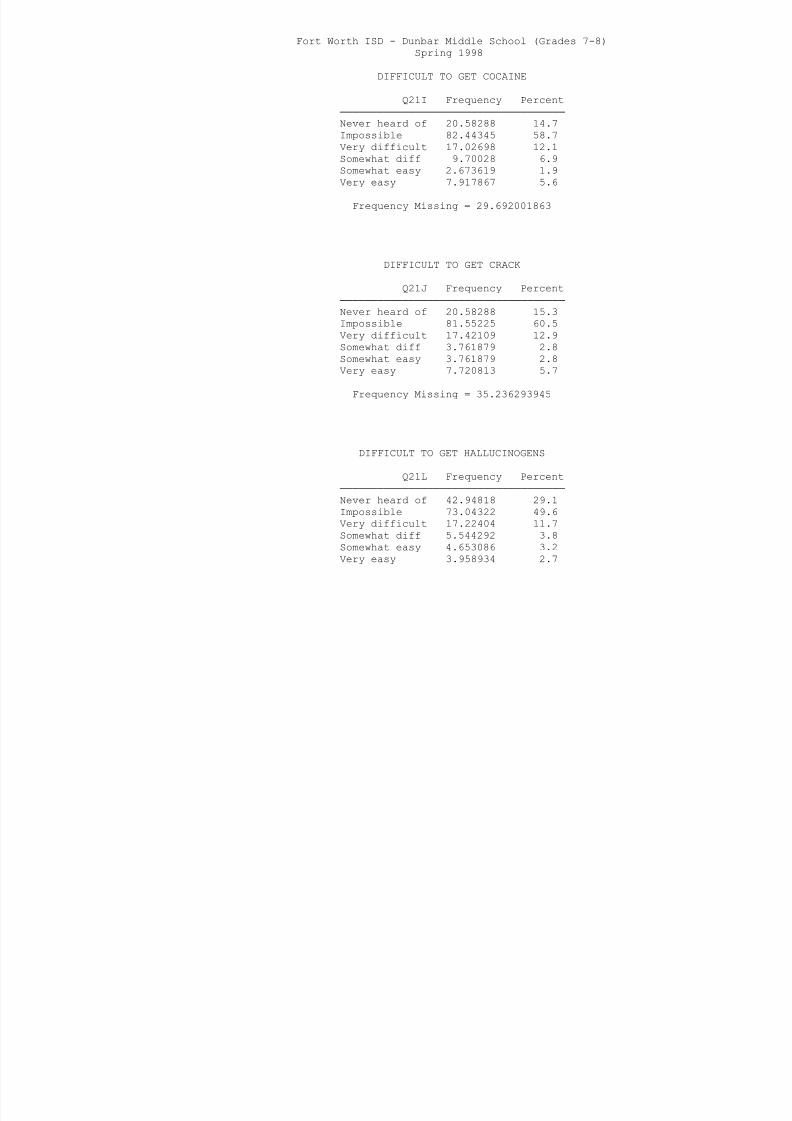
8/6/2019 fort worth isd - dunbar middle school (grades 7-8) - 1998 Texas School Survey of Drug and Alcohol Use
http://slidepdf.com/reader/full/fort-worth-isd-dunbar-middle-school-grades-7-8-1998-texas-school-survey 87/138
DIFFICULT TO GET COCAINE
Q21I Frequency Percent
────────────────────────────────────
Never heard of 20.58288 14.7
Impossible 82.44345 58.7
Very difficult 17.02698 12.1
Somewhat diff 9.70028 6.9
Somewhat easy 2.673619 1.9
Very easy 7.917867 5.6
Frequency Missing = 29.692001863
DIFFICULT TO GET CRACK
Q21J Frequency Percent────────────────────────────────────
Never heard of 20.58288 15.3
Impossible 81.55225 60.5
Very difficult 17.42109 12.9
Somewhat diff 3.761879 2.8
Somewhat easy 3.761879 2.8
Very easy 7.720813 5.7
Frequency Missing = 35.236293945
DIFFICULT TO GET HALLUCINOGENS
Q21L Frequency Percent
────────────────────────────────────
Never heard of 42.94818 29.1
Impossible 73.04322 49.6
Very difficult 17.22404 11.7
Somewhat diff 5.544292 3.8
Somewhat easy 4.653086 3.2
Very easy 3.958934 2.7
Frequency Missing = 22.665341023

8/6/2019 fort worth isd - dunbar middle school (grades 7-8) - 1998 Texas School Survey of Drug and Alcohol Use
http://slidepdf.com/reader/full/fort-worth-isd-dunbar-middle-school-grades-7-8-1998-texas-school-survey 88/138
DIFFICULT TO GET UPPERS
Q21M Frequency Percent
────────────────────────────────────
Never heard of 68.19308 51.2
Impossible 44.83358 33.6
Very difficult 7.917867 5.9
Somewhat diff 3.564825 2.7
Somewhat easy 3.958934 3.0
Very easy 4.85014 3.6
Frequency Missing = 36.718662704
The frequencies have been weighted so that the
analysis reflects the distribution of students by grade
level in the campus
Fort Worth ISD - Dunbar Middle School (Grades 7-8)
Spring 1998
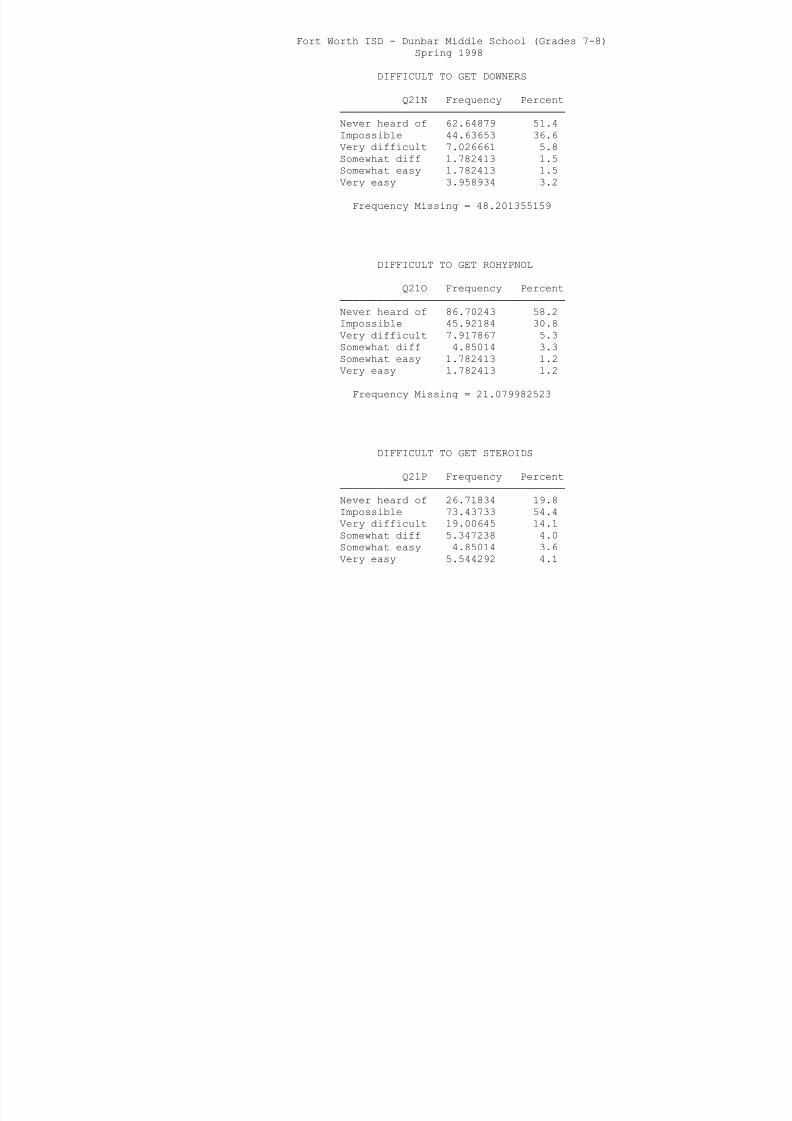
8/6/2019 fort worth isd - dunbar middle school (grades 7-8) - 1998 Texas School Survey of Drug and Alcohol Use
http://slidepdf.com/reader/full/fort-worth-isd-dunbar-middle-school-grades-7-8-1998-texas-school-survey 89/138
DIFFICULT TO GET DOWNERS
Q21N Frequency Percent
────────────────────────────────────
Never heard of 62.64879 51.4
Impossible 44.63653 36.6
Very difficult 7.026661 5.8
Somewhat diff 1.782413 1.5
Somewhat easy 1.782413 1.5
Very easy 3.958934 3.2
Frequency Missing = 48.201355159
DIFFICULT TO GET ROHYPNOL
Q21O Frequency Percent────────────────────────────────────
Never heard of 86.70243 58.2
Impossible 45.92184 30.8
Very difficult 7.917867 5.3
Somewhat diff 4.85014 3.3
Somewhat easy 1.782413 1.2
Very easy 1.782413 1.2
Frequency Missing = 21.079982523
DIFFICULT TO GET STEROIDS
Q21P Frequency Percent
────────────────────────────────────
Never heard of 26.71834 19.8
Impossible 73.43733 54.4
Very difficult 19.00645 14.1
Somewhat diff 5.347238 4.0
Somewhat easy 4.85014 3.6
Very easy 5.544292 4.1
Frequency Missing = 35.133304205

8/6/2019 fort worth isd - dunbar middle school (grades 7-8) - 1998 Texas School Survey of Drug and Alcohol Use
http://slidepdf.com/reader/full/fort-worth-isd-dunbar-middle-school-grades-7-8-1998-texas-school-survey 90/138
DIFFICULT TO GET ECSTASY
Q21Q Frequency Percent
────────────────────────────────────
Never heard of 76.308 53.6
Impossible 40.48054 28.4
Very difficult 14.15631 9.9
Somewhat diff 1.782413 1.3
Somewhat easy 1.979467 1.4
Very easy 7.720813 5.4
Frequency Missing = 27.609545332
The frequencies have been weighted so that the
analysis reflects the distribution of students by grade
level in the campus
Fort Worth ISD - Dunbar Middle School (Grades 7-8)
Spring 1998
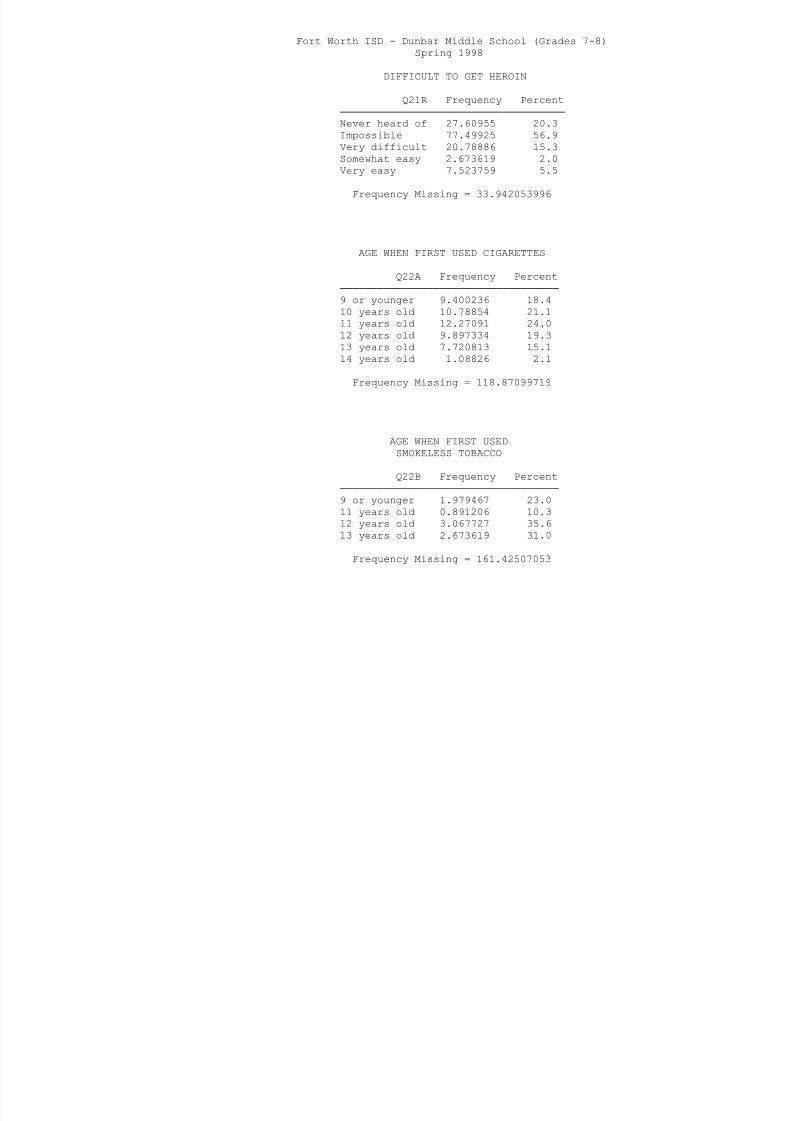
8/6/2019 fort worth isd - dunbar middle school (grades 7-8) - 1998 Texas School Survey of Drug and Alcohol Use
http://slidepdf.com/reader/full/fort-worth-isd-dunbar-middle-school-grades-7-8-1998-texas-school-survey 91/138
DIFFICULT TO GET HEROIN
Q21R Frequency Percent
────────────────────────────────────
Never heard of 27.60955 20.3
Impossible 77.49925 56.9
Very difficult 20.78886 15.3
Somewhat easy 2.673619 2.0
Very easy 7.523759 5.5
Frequency Missing = 33.942053996
AGE WHEN FIRST USED CIGARETTES
Q22A Frequency Percent
───────────────────────────────────9 or younger 9.400236 18.4
10 years old 10.78854 21.1
11 years old 12.27091 24.0
12 years old 9.897334 19.3
13 years old 7.720813 15.1
14 years old 1.08826 2.1
Frequency Missing = 118.87099719
AGE WHEN FIRST USED
SMOKELESS TOBACCO
Q22B Frequency Percent
───────────────────────────────────
9 or younger 1.979467 23.0
11 years old 0.891206 10.3
12 years old 3.067727 35.6
13 years old 2.673619 31.0
Frequency Missing = 161.42507053

8/6/2019 fort worth isd - dunbar middle school (grades 7-8) - 1998 Texas School Survey of Drug and Alcohol Use
http://slidepdf.com/reader/full/fort-worth-isd-dunbar-middle-school-grades-7-8-1998-texas-school-survey 92/138
AGE WHEN FIRST USED BEER
Q22C Frequency Percent
───────────────────────────────────
9 or younger 19.10052 29.8
10 years old 16.03279 25.0
11 years old 7.223715 11.3
12 years old 13.26511 20.7
13 years old 6.632553 10.4
14 years old 1.782413 2.8
Frequency Missing = 106.00000039
The frequencies have been weighted so that the
analysis reflects the distribution of students by grade
level in the campus
Fort Worth ISD - Dunbar Middle School (Grades 7-8)
Spring 1998
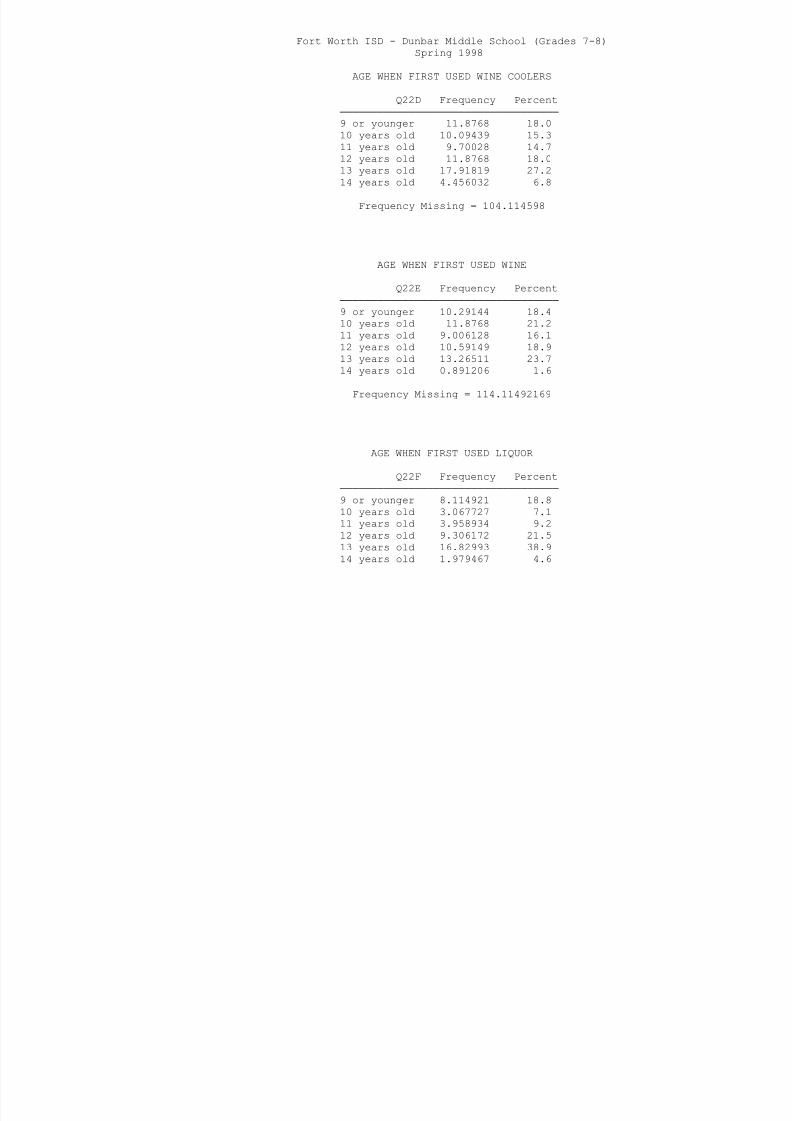
8/6/2019 fort worth isd - dunbar middle school (grades 7-8) - 1998 Texas School Survey of Drug and Alcohol Use
http://slidepdf.com/reader/full/fort-worth-isd-dunbar-middle-school-grades-7-8-1998-texas-school-survey 93/138
AGE WHEN FIRST USED WINE COOLERS
Q22D Frequency Percent
───────────────────────────────────
9 or younger 11.8768 18.0
10 years old 10.09439 15.3
11 years old 9.70028 14.7
12 years old 11.8768 18.0
13 years old 17.91819 27.2
14 years old 4.456032 6.8
Frequency Missing = 104.114598
AGE WHEN FIRST USED WINE
Q22E Frequency Percent───────────────────────────────────
9 or younger 10.29144 18.4
10 years old 11.8768 21.2
11 years old 9.006128 16.1
12 years old 10.59149 18.9
13 years old 13.26511 23.7
14 years old 0.891206 1.6
Frequency Missing = 114.11492169
AGE WHEN FIRST USED LIQUOR
Q22F Frequency Percent
───────────────────────────────────
9 or younger 8.114921 18.8
10 years old 3.067727 7.1
11 years old 3.958934 9.2
12 years old 9.306172 21.5
13 years old 16.82993 38.9
14 years old 1.979467 4.6
Frequency Missing = 126.77993902
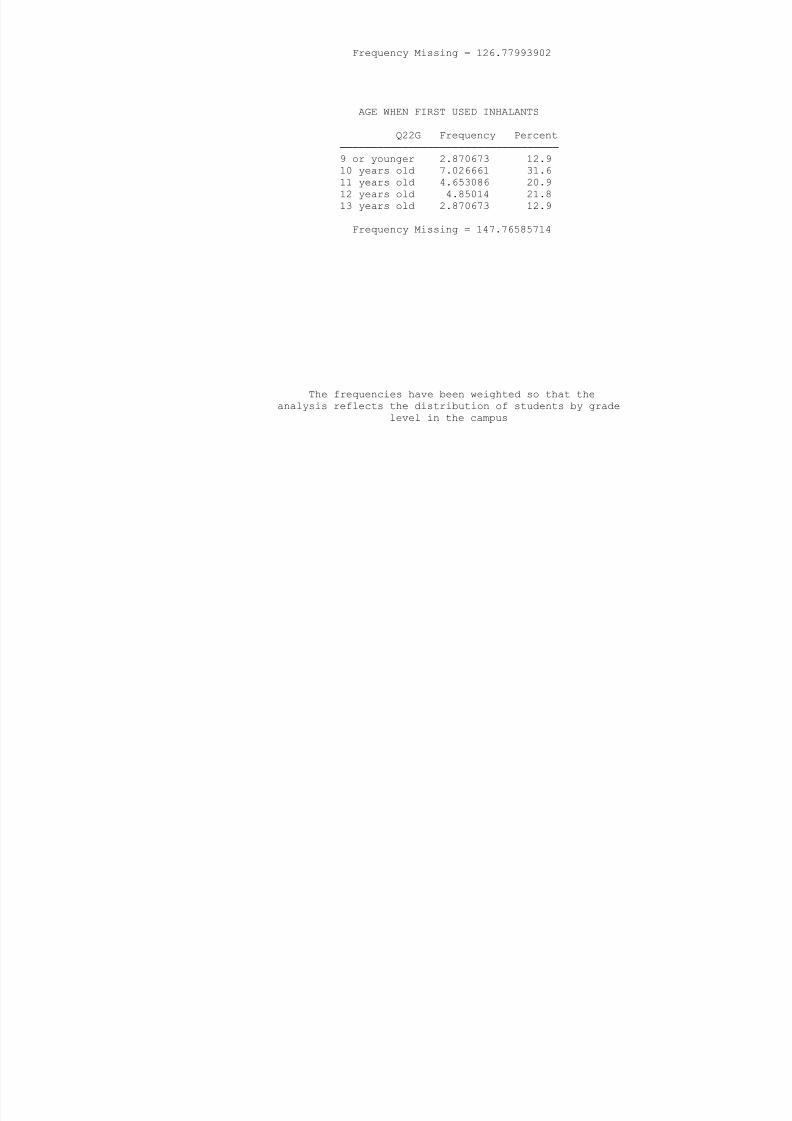
8/6/2019 fort worth isd - dunbar middle school (grades 7-8) - 1998 Texas School Survey of Drug and Alcohol Use
http://slidepdf.com/reader/full/fort-worth-isd-dunbar-middle-school-grades-7-8-1998-texas-school-survey 94/138
AGE WHEN FIRST USED INHALANTS
Q22G Frequency Percent
───────────────────────────────────
9 or younger 2.870673 12.9
10 years old 7.026661 31.6
11 years old 4.653086 20.9
12 years old 4.85014 21.8
13 years old 2.870673 12.9
Frequency Missing = 147.76585714
The frequencies have been weighted so that the
analysis reflects the distribution of students by grade
level in the campus
Fort Worth ISD - Dunbar Middle School (Grades 7-8)
Spring 1998
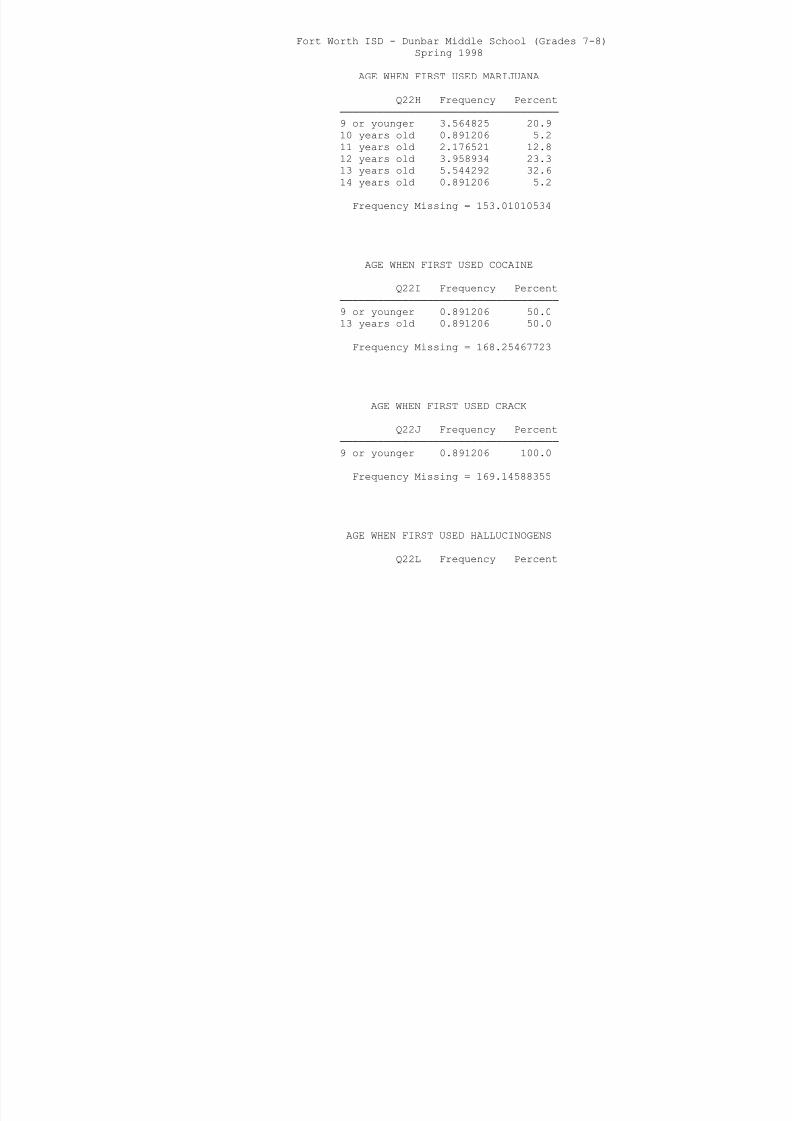
8/6/2019 fort worth isd - dunbar middle school (grades 7-8) - 1998 Texas School Survey of Drug and Alcohol Use
http://slidepdf.com/reader/full/fort-worth-isd-dunbar-middle-school-grades-7-8-1998-texas-school-survey 95/138
AGE WHEN FIRST USED MARIJUANA
Q22H Frequency Percent
───────────────────────────────────
9 or younger 3.564825 20.9
10 years old 0.891206 5.2
11 years old 2.176521 12.8
12 years old 3.958934 23.3
13 years old 5.544292 32.6
14 years old 0.891206 5.2
Frequency Missing = 153.01010534
AGE WHEN FIRST USED COCAINE
Q22I Frequency Percent───────────────────────────────────
9 or younger 0.891206 50.0
13 years old 0.891206 50.0
Frequency Missing = 168.25467723
AGE WHEN FIRST USED CRACK
Q22J Frequency Percent───────────────────────────────────
9 or younger 0.891206 100.0
Frequency Missing = 169.14588355
AGE WHEN FIRST USED HALLUCINOGENS
Q22L Frequency Percent
───────────────────────────────────
9 or younger 0.891206 100.0
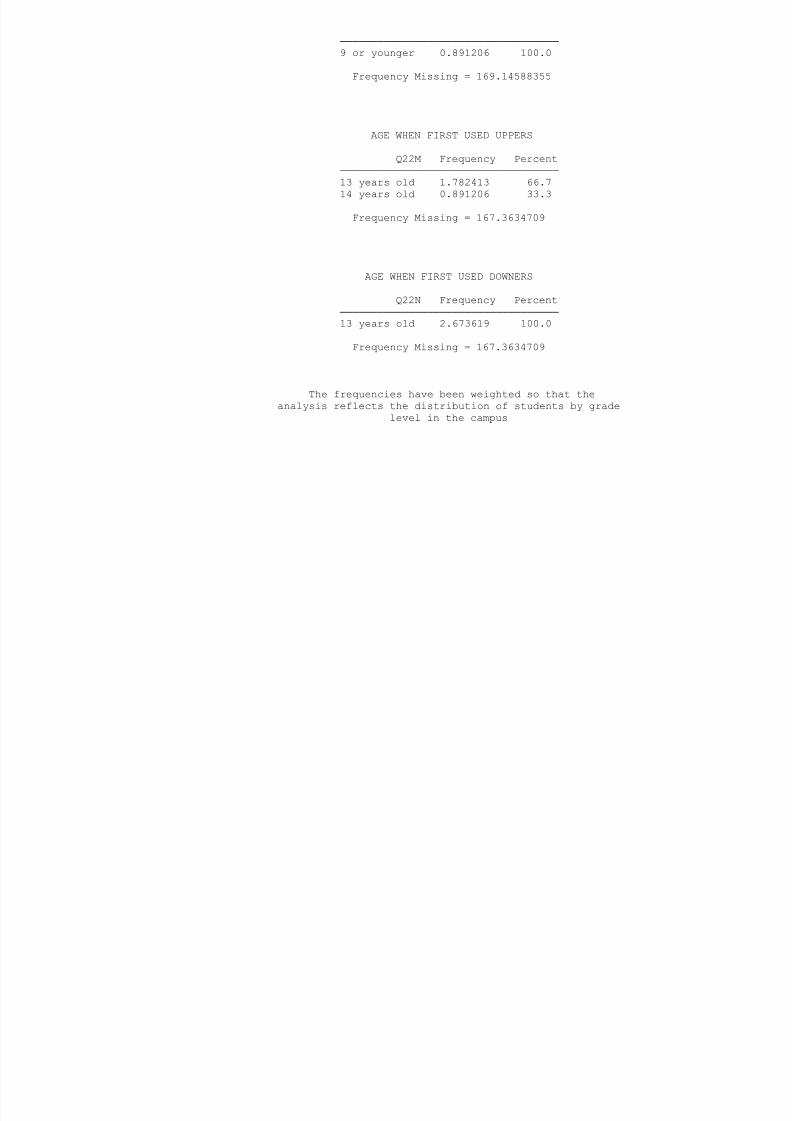
8/6/2019 fort worth isd - dunbar middle school (grades 7-8) - 1998 Texas School Survey of Drug and Alcohol Use
http://slidepdf.com/reader/full/fort-worth-isd-dunbar-middle-school-grades-7-8-1998-texas-school-survey 96/138
Frequency Missing = 169.14588355
AGE WHEN FIRST USED UPPERS
Q22M Frequency Percent
───────────────────────────────────
13 years old 1.782413 66.7
14 years old 0.891206 33.3
Frequency Missing = 167.3634709
AGE WHEN FIRST USED DOWNERS
Q22N Frequency Percent
───────────────────────────────────
13 years old 2.673619 100.0
Frequency Missing = 167.3634709
The frequencies have been weighted so that the
analysis reflects the distribution of students by grade
level in the campus
Fort Worth ISD - Dunbar Middle School (Grades 7-8)
Spring 1998
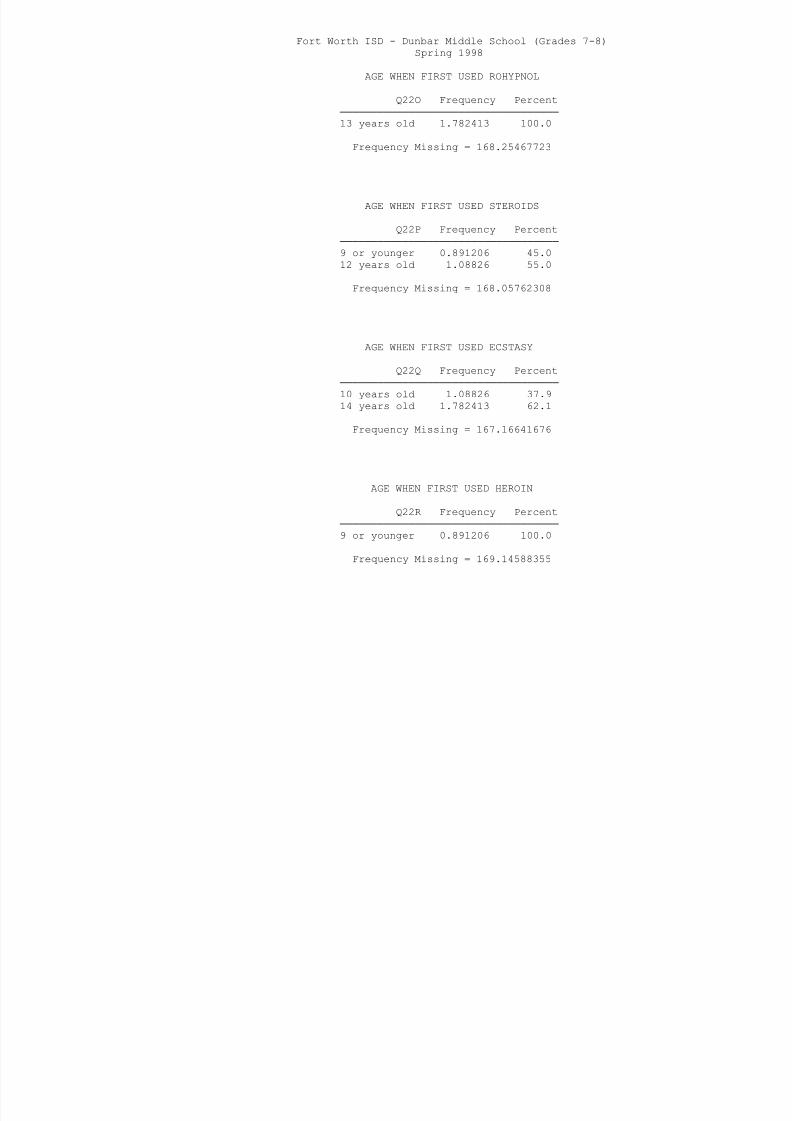
8/6/2019 fort worth isd - dunbar middle school (grades 7-8) - 1998 Texas School Survey of Drug and Alcohol Use
http://slidepdf.com/reader/full/fort-worth-isd-dunbar-middle-school-grades-7-8-1998-texas-school-survey 97/138
AGE WHEN FIRST USED ROHYPNOL
Q22O Frequency Percent
───────────────────────────────────
13 years old 1.782413 100.0
Frequency Missing = 168.25467723
AGE WHEN FIRST USED STEROIDS
Q22P Frequency Percent
───────────────────────────────────
9 or younger 0.891206 45.0
12 years old 1.08826 55.0
Frequency Missing = 168.05762308
AGE WHEN FIRST USED ECSTASY
Q22Q Frequency Percent
───────────────────────────────────
10 years old 1.08826 37.9
14 years old 1.782413 62.1
Frequency Missing = 167.16641676
AGE WHEN FIRST USED HEROIN
Q22R Frequency Percent
───────────────────────────────────
9 or younger 0.891206 100.0
Frequency Missing = 169.14588355
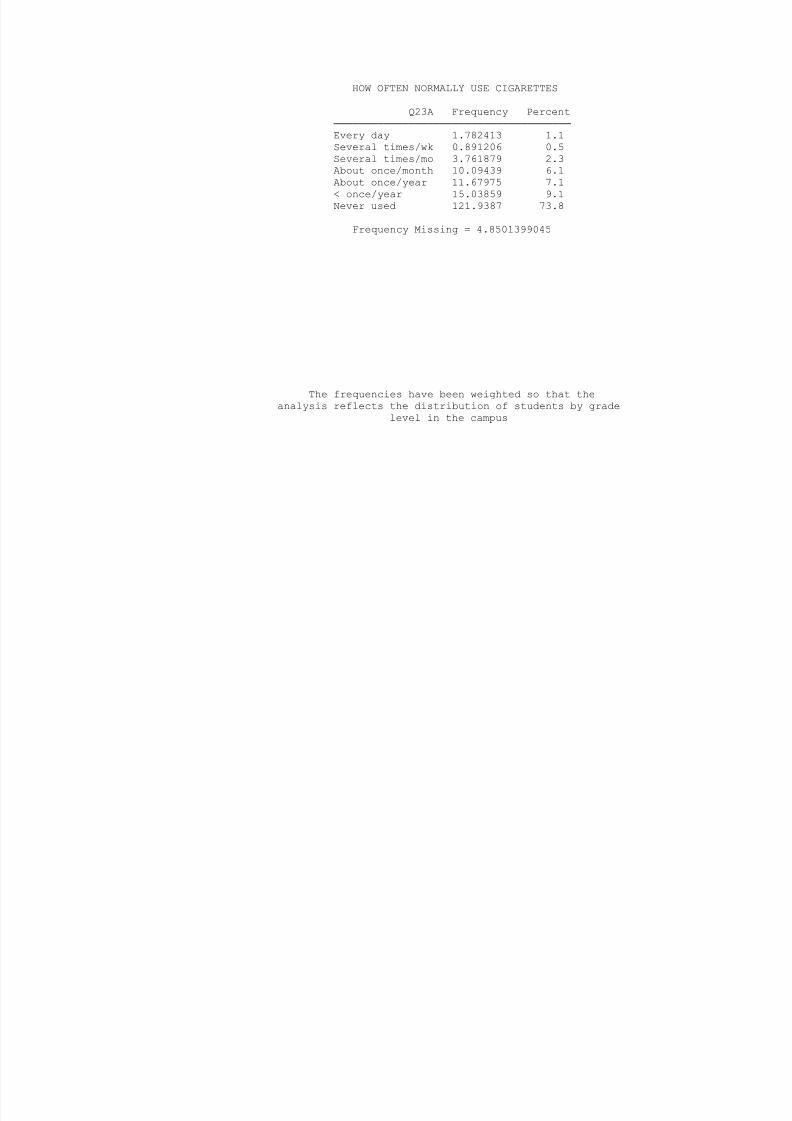
8/6/2019 fort worth isd - dunbar middle school (grades 7-8) - 1998 Texas School Survey of Drug and Alcohol Use
http://slidepdf.com/reader/full/fort-worth-isd-dunbar-middle-school-grades-7-8-1998-texas-school-survey 98/138
HOW OFTEN NORMALLY USE CIGARETTES
Q23A Frequency Percent
──────────────────────────────────────
Every day 1.782413 1.1
Several times/wk 0.891206 0.5
Several times/mo 3.761879 2.3
About once/month 10.09439 6.1
About once/year 11.67975 7.1
< once/year 15.03859 9.1
Never used 121.9387 73.8
Frequency Missing = 4.8501399045
The frequencies have been weighted so that the
analysis reflects the distribution of students by grade
level in the campus
Fort Worth ISD - Dunbar Middle School (Grades 7-8)
Spring 1998
O O O S
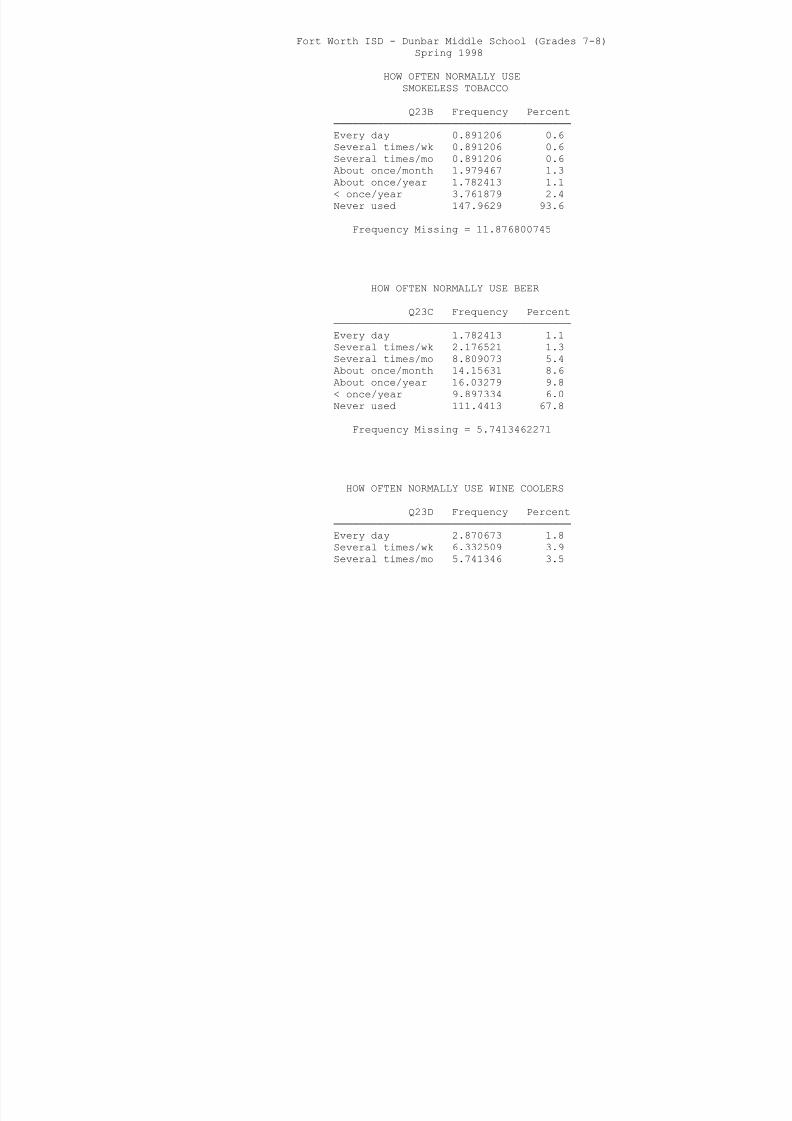
8/6/2019 fort worth isd - dunbar middle school (grades 7-8) - 1998 Texas School Survey of Drug and Alcohol Use
http://slidepdf.com/reader/full/fort-worth-isd-dunbar-middle-school-grades-7-8-1998-texas-school-survey 99/138
HOW OFTEN NORMALLY USE
SMOKELESS TOBACCO
Q23B Frequency Percent
──────────────────────────────────────
Every day 0.891206 0.6
Several times/wk 0.891206 0.6
Several times/mo 0.891206 0.6
About once/month 1.979467 1.3
About once/year 1.782413 1.1
< once/year 3.761879 2.4
Never used 147.9629 93.6
Frequency Missing = 11.876800745
HOW OFTEN NORMALLY USE BEER
Q23C Frequency Percent
──────────────────────────────────────
Every day 1.782413 1.1
Several times/wk 2.176521 1.3
Several times/mo 8.809073 5.4
About once/month 14.15631 8.6
About once/year 16.03279 9.8
< once/year 9.897334 6.0
Never used 111.4413 67.8
Frequency Missing = 5.7413462271
HOW OFTEN NORMALLY USE WINE COOLERS
Q23D Frequency Percent
──────────────────────────────────────
Every day 2.870673 1.8
Several times/wk 6.332509 3.9
Several times/mo 5.741346 3.5
About once/month 16.13578 10.0
About once/year 17.61815 10.9
< once/year 16.52989 10.2
N d 96 89088 59 8
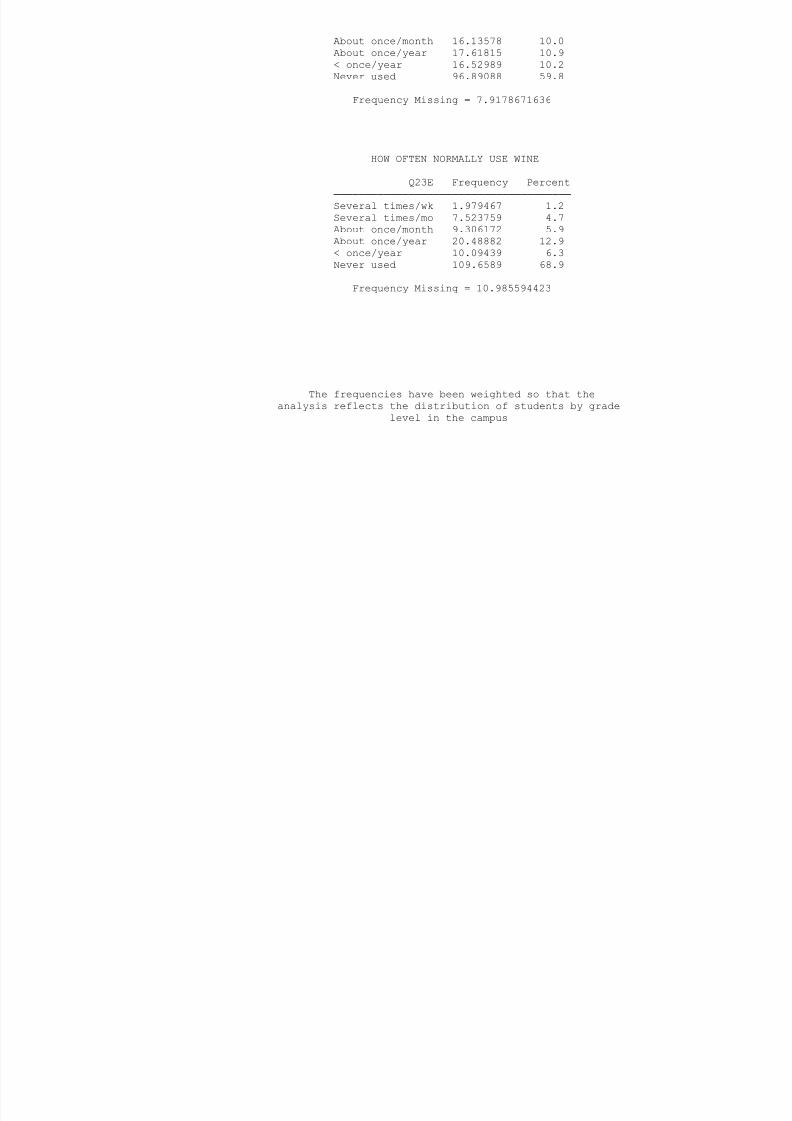
8/6/2019 fort worth isd - dunbar middle school (grades 7-8) - 1998 Texas School Survey of Drug and Alcohol Use
http://slidepdf.com/reader/full/fort-worth-isd-dunbar-middle-school-grades-7-8-1998-texas-school-survey 100/138
Never used 96.89088 59.8
Frequency Missing = 7.9178671636
HOW OFTEN NORMALLY USE WINE
Q23E Frequency Percent
──────────────────────────────────────
Several times/wk 1.979467 1.2
Several times/mo 7.523759 4.7
About once/month 9.306172 5.9
About once/year 20.48882 12.9
< once/year 10.09439 6.3
Never used 109.6589 68.9
Frequency Missing = 10.985594423
The frequencies have been weighted so that the
analysis reflects the distribution of students by grade
level in the campus
Fort Worth ISD - Dunbar Middle School (Grades 7-8)
Spring 1998
HOW OFTEN NORMALLY USE LIQUOR
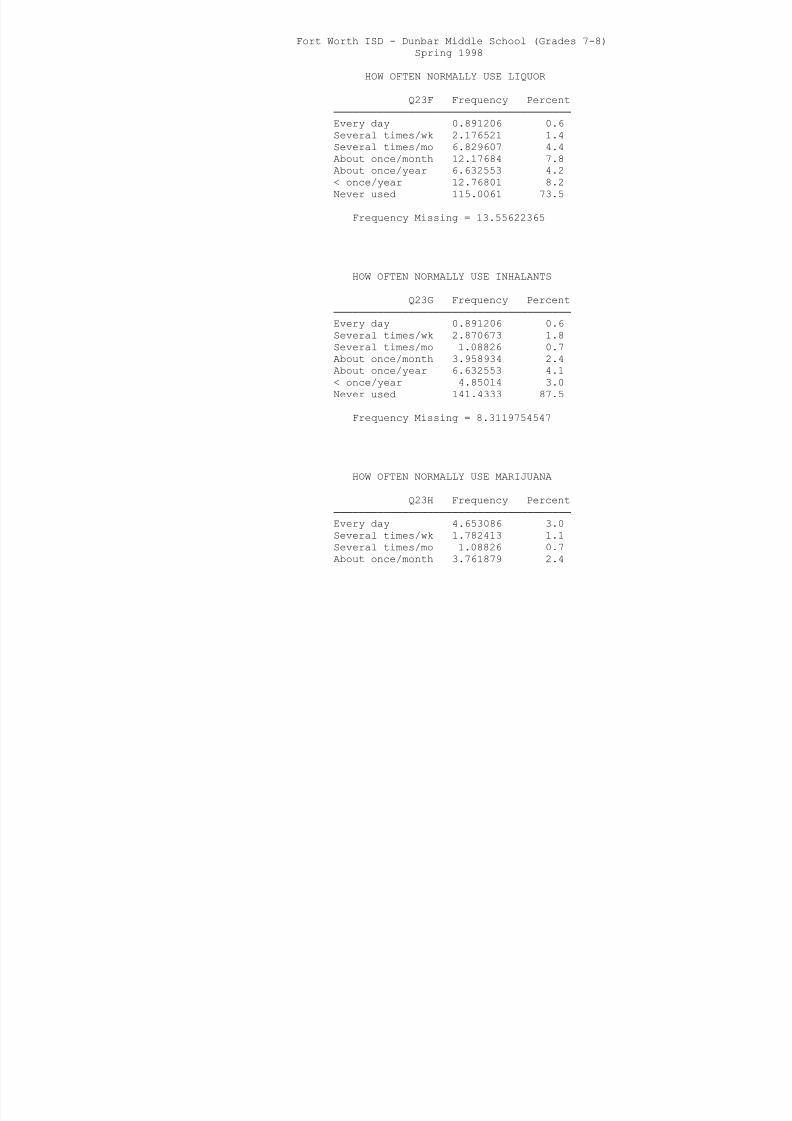
8/6/2019 fort worth isd - dunbar middle school (grades 7-8) - 1998 Texas School Survey of Drug and Alcohol Use
http://slidepdf.com/reader/full/fort-worth-isd-dunbar-middle-school-grades-7-8-1998-texas-school-survey 101/138
HOW OFTEN NORMALLY USE LIQUOR
Q23F Frequency Percent
──────────────────────────────────────
Every day 0.891206 0.6
Several times/wk 2.176521 1.4
Several times/mo 6.829607 4.4
About once/month 12.17684 7.8
About once/year 6.632553 4.2
< once/year 12.76801 8.2
Never used 115.0061 73.5
Frequency Missing = 13.55622365
HOW OFTEN NORMALLY USE INHALANTS
Q23G Frequency Percent
──────────────────────────────────────
Every day 0.891206 0.6
Several times/wk 2.870673 1.8
Several times/mo 1.08826 0.7
About once/month 3.958934 2.4
About once/year 6.632553 4.1
< once/year 4.85014 3.0
Never used 141.4333 87.5
Frequency Missing = 8.3119754547
HOW OFTEN NORMALLY USE MARIJUANA
Q23H Frequency Percent
──────────────────────────────────────
Every day 4.653086 3.0
Several times/wk 1.782413 1.1
Several times/mo 1.08826 0.7
About once/month 3.761879 2.4
About once/year 2.673619 1.7
< once/year 3.067727 2.0
Never used 138.7597 89.1
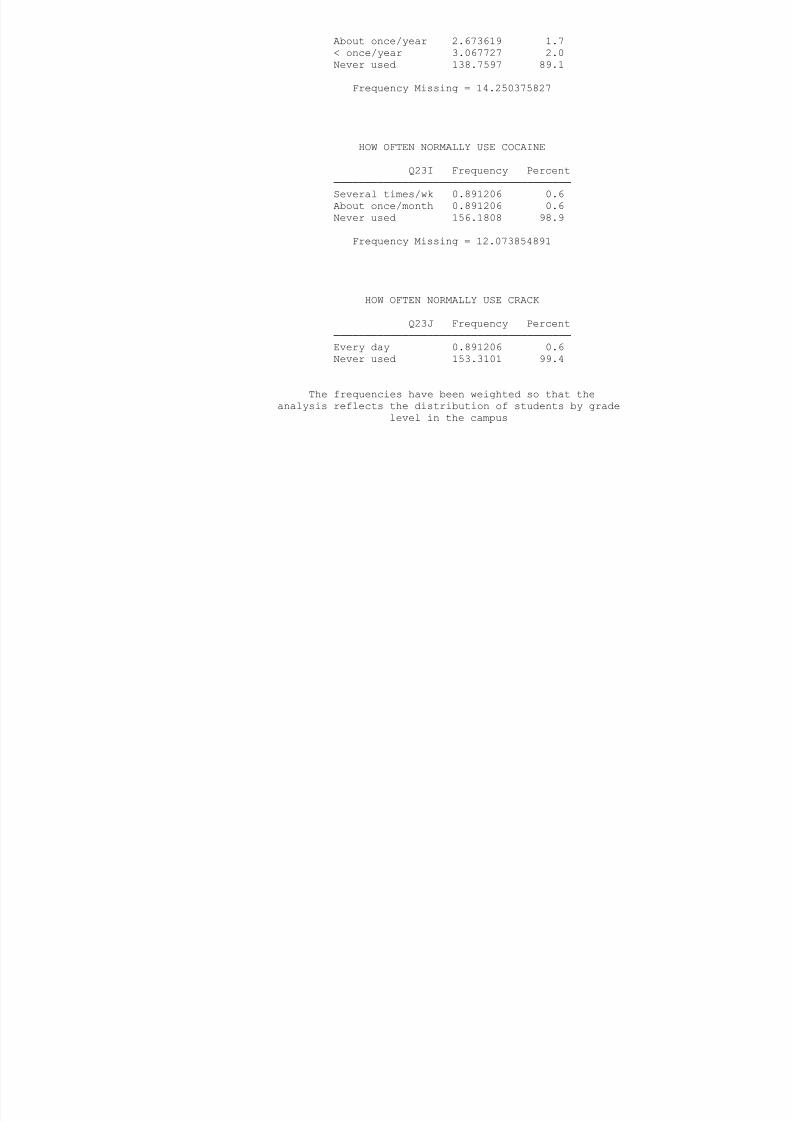
8/6/2019 fort worth isd - dunbar middle school (grades 7-8) - 1998 Texas School Survey of Drug and Alcohol Use
http://slidepdf.com/reader/full/fort-worth-isd-dunbar-middle-school-grades-7-8-1998-texas-school-survey 102/138
Frequency Missing = 14.250375827
HOW OFTEN NORMALLY USE COCAINE
Q23I Frequency Percent
──────────────────────────────────────
Several times/wk 0.891206 0.6
About once/month 0.891206 0.6
Never used 156.1808 98.9
Frequency Missing = 12.073854891
HOW OFTEN NORMALLY USE CRACK
Q23J Frequency Percent
──────────────────────────────────────
Every day 0.891206 0.6
Never used 153.3101 99.4
The frequencies have been weighted so that the
analysis reflects the distribution of students by grade
level in the campus
Fort Worth ISD - Dunbar Middle School (Grades 7-8)
Spring 1998
Frequency Missing = 15 835734327
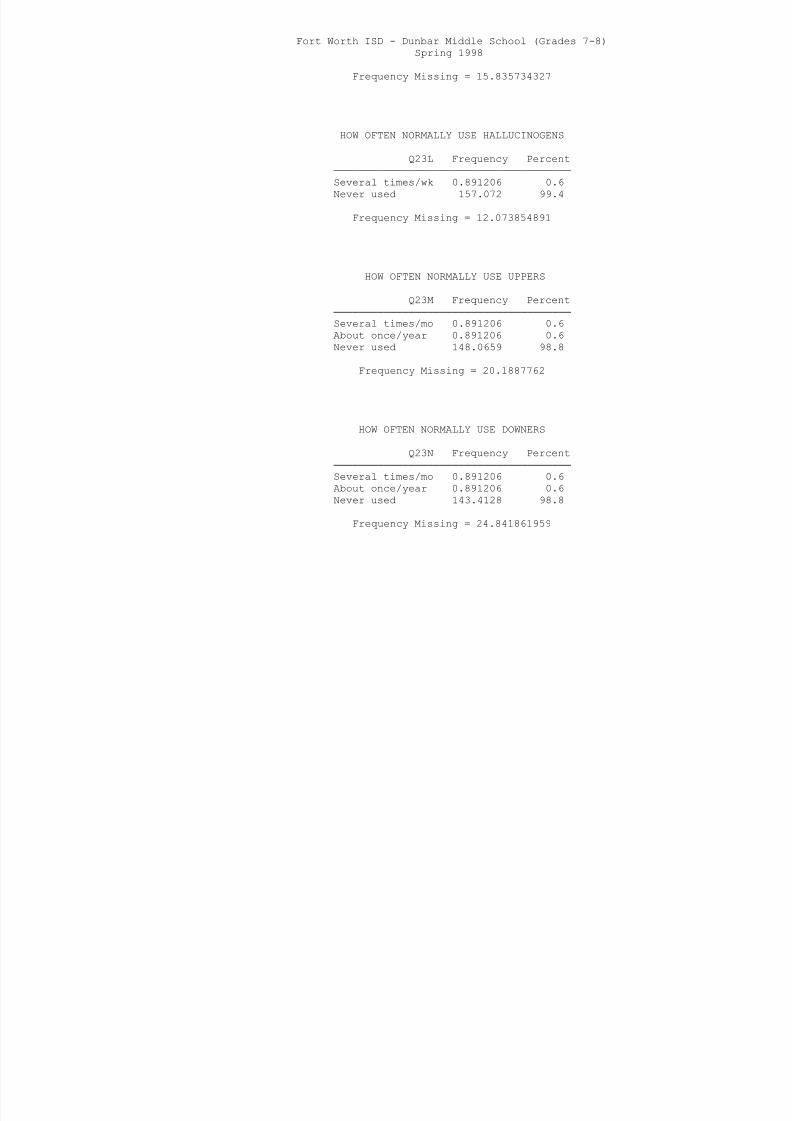
8/6/2019 fort worth isd - dunbar middle school (grades 7-8) - 1998 Texas School Survey of Drug and Alcohol Use
http://slidepdf.com/reader/full/fort-worth-isd-dunbar-middle-school-grades-7-8-1998-texas-school-survey 103/138
Frequency Missing = 15.835734327
HOW OFTEN NORMALLY USE HALLUCINOGENS
Q23L Frequency Percent
──────────────────────────────────────
Several times/wk 0.891206 0.6
Never used 157.072 99.4
Frequency Missing = 12.073854891
HOW OFTEN NORMALLY USE UPPERS
Q23M Frequency Percent
──────────────────────────────────────
Several times/mo 0.891206 0.6
About once/year 0.891206 0.6
Never used 148.0659 98.8
Frequency Missing = 20.1887762
HOW OFTEN NORMALLY USE DOWNERS
Q23N Frequency Percent
──────────────────────────────────────
Several times/mo 0.891206 0.6
About once/year 0.891206 0.6
Never used 143.4128 98.8
Frequency Missing = 24.841861959
HOW OFTEN NORMALLY USE ROHYPNOL
Q23O Frequency Percent
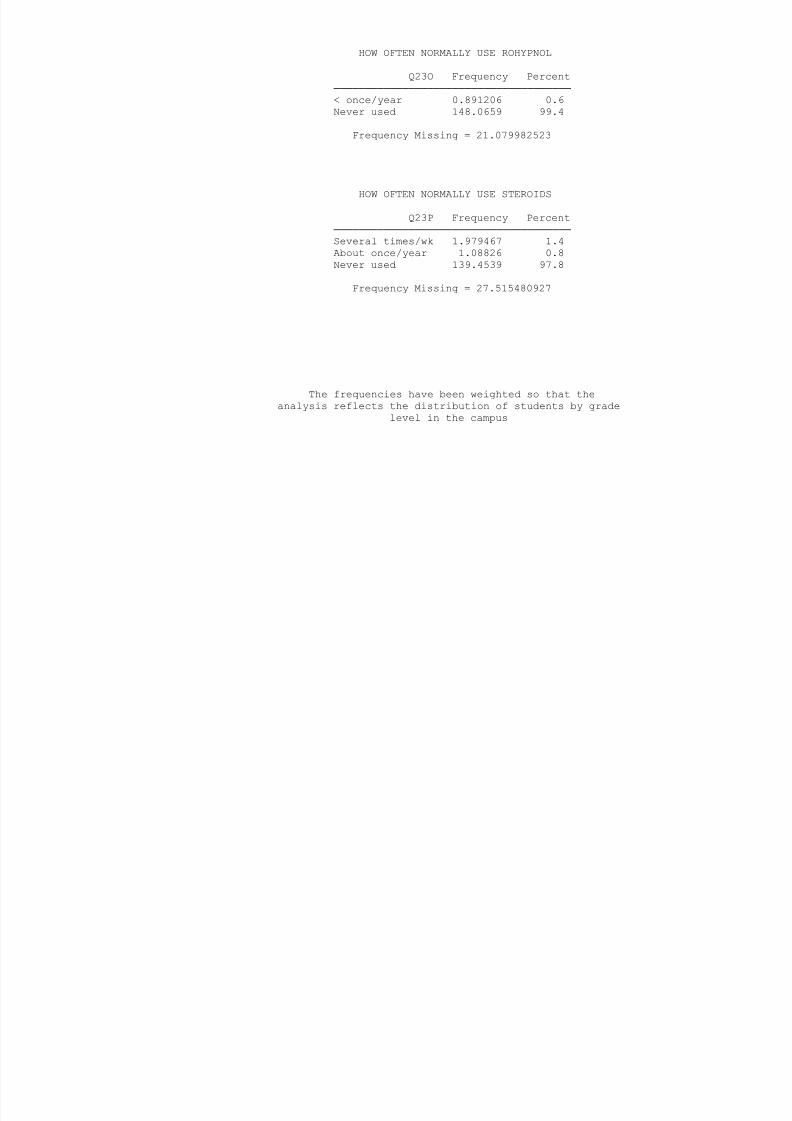
8/6/2019 fort worth isd - dunbar middle school (grades 7-8) - 1998 Texas School Survey of Drug and Alcohol Use
http://slidepdf.com/reader/full/fort-worth-isd-dunbar-middle-school-grades-7-8-1998-texas-school-survey 104/138
Q23O Frequency Percent
──────────────────────────────────────
< once/year 0.891206 0.6
Never used 148.0659 99.4
Frequency Missing = 21.079982523
HOW OFTEN NORMALLY USE STEROIDS
Q23P Frequency Percent
──────────────────────────────────────
Several times/wk 1.979467 1.4
About once/year 1.08826 0.8
Never used 139.4539 97.8
Frequency Missing = 27.515480927
The frequencies have been weighted so that the
analysis reflects the distribution of students by grade
level in the campus
Fort Worth ISD - Dunbar Middle School (Grades 7-8)
Spring 1998
HOW OFTEN NORMALLY USE ECSTASY
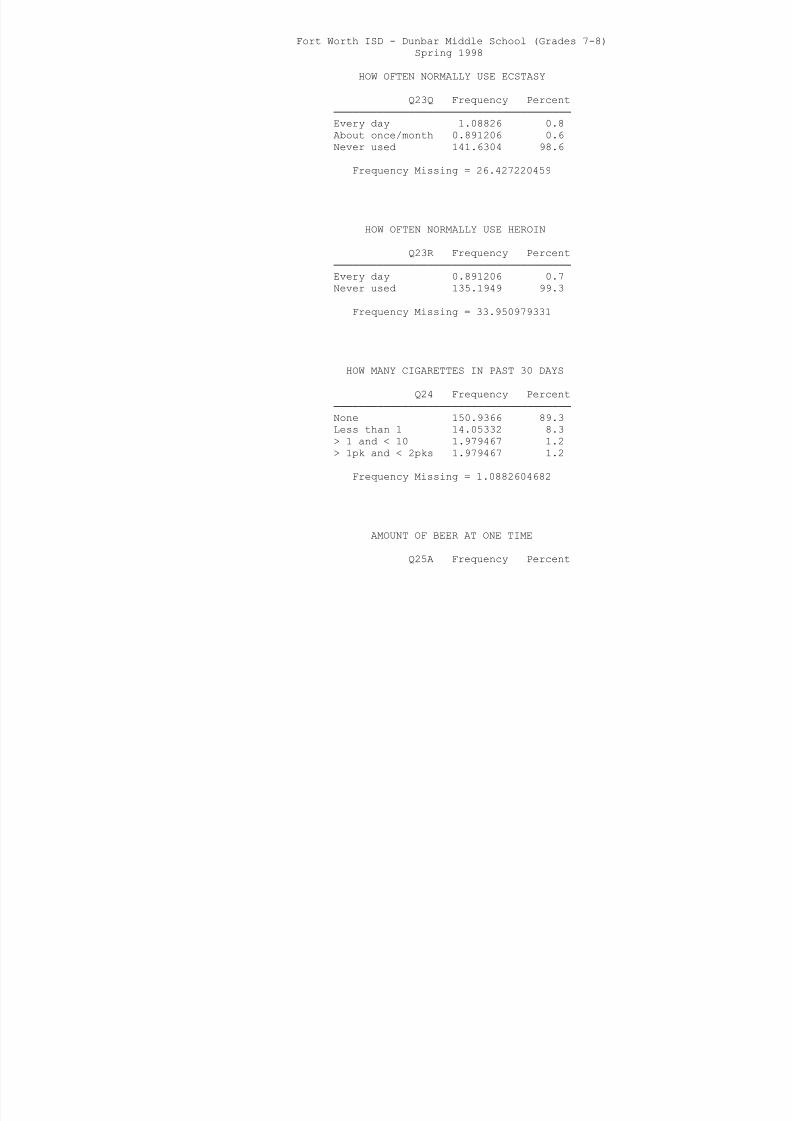
8/6/2019 fort worth isd - dunbar middle school (grades 7-8) - 1998 Texas School Survey of Drug and Alcohol Use
http://slidepdf.com/reader/full/fort-worth-isd-dunbar-middle-school-grades-7-8-1998-texas-school-survey 105/138
HOW OFTEN NORMALLY USE ECSTASY
Q23Q Frequency Percent
──────────────────────────────────────
Every day 1.08826 0.8
About once/month 0.891206 0.6
Never used 141.6304 98.6
Frequency Missing = 26.427220459
HOW OFTEN NORMALLY USE HEROIN
Q23R Frequency Percent
──────────────────────────────────────
Every day 0.891206 0.7
Never used 135.1949 99.3
Frequency Missing = 33.950979331
HOW MANY CIGARETTES IN PAST 30 DAYS
Q24 Frequency Percent
──────────────────────────────────────
None 150.9366 89.3
Less than 1 14.05332 8.3> 1 and < 10 1.979467 1.2
> 1pk and < 2pks 1.979467 1.2
Frequency Missing = 1.0882604682
AMOUNT OF BEER AT ONE TIME
Q25A Frequency Percent
──────────────────────────────────────
Never drink this 108.4766 65.7
12+ drinks 1.782413 1.1
5-8 drinks 1.979467 1.2
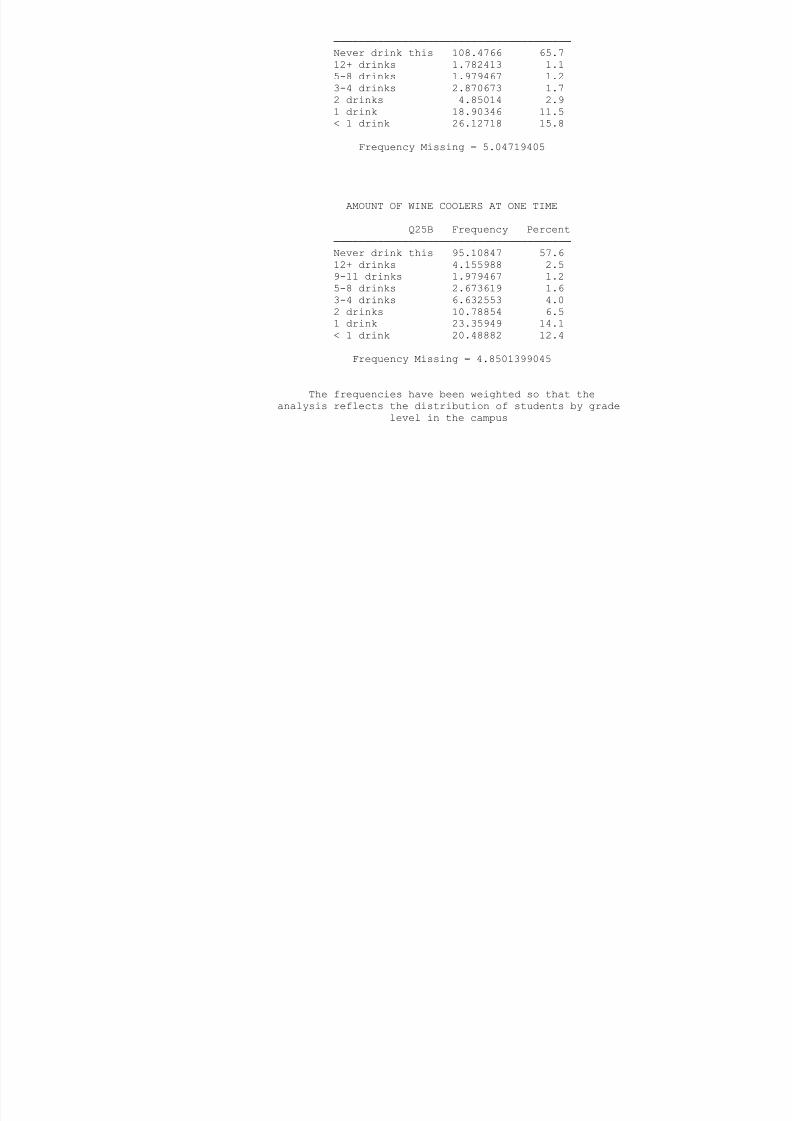
8/6/2019 fort worth isd - dunbar middle school (grades 7-8) - 1998 Texas School Survey of Drug and Alcohol Use
http://slidepdf.com/reader/full/fort-worth-isd-dunbar-middle-school-grades-7-8-1998-texas-school-survey 106/138
5 8 drinks 1.979467 1.2
3-4 drinks 2.870673 1.7
2 drinks 4.85014 2.9
1 drink 18.90346 11.5
< 1 drink 26.12718 15.8
Frequency Missing = 5.04719405
AMOUNT OF WINE COOLERS AT ONE TIME
Q25B Frequency Percent
──────────────────────────────────────
Never drink this 95.10847 57.6
12+ drinks 4.155988 2.5
9-11 drinks 1.979467 1.2
5-8 drinks 2.673619 1.63-4 drinks 6.632553 4.0
2 drinks 10.78854 6.5
1 drink 23.35949 14.1
< 1 drink 20.48882 12.4
Frequency Missing = 4.8501399045
The frequencies have been weighted so that the
analysis reflects the distribution of students by grade
level in the campus
Fort Worth ISD - Dunbar Middle School (Grades 7-8)
Spring 1998
AMOUNT OF WINE AT ONE TIME
8/6/2019 fort worth isd - dunbar middle school (grades 7-8) - 1998 Texas School Survey of Drug and Alcohol Use
http://slidepdf.com/reader/full/fort-worth-isd-dunbar-middle-school-grades-7-8-1998-texas-school-survey 107/138
OU O O
Q25C Frequency Percent
──────────────────────────────────────
Never drink this 108.1765 65.9
12+ drinks 0.891206 0.5
3-4 drinks 5.741346 3.5
2 drinks 6.829607 4.21 drink 19.59761 11.9
< 1 drink 22.8624 13.9
Frequency Missing = 5.9384003727
AMOUNT OF LIQUOR AT ONE TIME
Q25D Frequency Percent──────────────────────────────────────
Never drink this 110.353 68.2
12+ drinks 1.782413 1.1
3-4 drinks 7.223715 4.5
2 drinks 6.435498 4.0
1 drink 14.55042 9.0
< 1 drink 21.38003 13.2
Frequency Missing = 8.3119754547
BEERS, FIVE OR MORE AT ONE TIME
Q26A Frequency Percent
──────────────────────────────────────
Never drink this 114.1149 68.3
Never 5+ at time 25.14191 15.0
Several times/wk 2.870673 1.7
Several times/mo 4.155988 2.5
About once/month 4.85014 2.9
< once/month 7.026661 4.2
< once/year 9.006128 5.4
Frequency Missing = 2.8706731136
8/6/2019 fort worth isd - dunbar middle school (grades 7-8) - 1998 Texas School Survey of Drug and Alcohol Use
http://slidepdf.com/reader/full/fort-worth-isd-dunbar-middle-school-grades-7-8-1998-texas-school-survey 108/138
WINE COOLERS, FIVE OR MORE AT ONE TIME
Q26B Frequency Percent
──────────────────────────────────────Never drink this 100.2587 60.8
Never 5+ at time 26.53021 16.1
Every day 1.782413 1.1
Several times/wk 4.155988 2.5
Several times/mo 7.223715 4.4
About once/month 7.026661 4.3
< once/month 7.026661 4.3
< once/year 10.78854 6.5
Frequency Missing = 5.2442481956
The frequencies have been weighted so that the
analysis reflects the distribution of students by grade
level in the campus
Fort Worth ISD - Dunbar Middle School (Grades 7-8)
Spring 1998
WINE, FIVE OR MORE AT ONE TIME
8/6/2019 fort worth isd - dunbar middle school (grades 7-8) - 1998 Texas School Survey of Drug and Alcohol Use
http://slidepdf.com/reader/full/fort-worth-isd-dunbar-middle-school-grades-7-8-1998-texas-school-survey 109/138
Q26C Frequency Percent
──────────────────────────────────────
Never drink this 109.5648 68.6
Never 5+ at time 24.44775 15.3
Several times/wk 0.891206 0.6
Several times/mo 5.047194 3.2About once/month 6.829607 4.3
< once/month 6.829607 4.3
< once/year 6.135455 3.8
Frequency Missing = 10.291442246
LIQUOR, FIVE OR MORE AT ONE TIME
Q26D Frequency Percent
──────────────────────────────────────
Never drink this 114.509 70.8
Never 5+ at time 22.07418 13.6
Every day 0.891206 0.6
Several times/wk 1.782413 1.1
Several times/mo 5.047194 3.1
About once/month 7.917867 4.9
< once/month 3.564825 2.2
< once/year 5.9384 3.7
Frequency Missing = 8.3119754547
GET ALCOHOLIC BEVERAGES FROM HOME
Q27A Frequency Percent
──────────────────────────────────────
Do not Drink 89.66717 53.4
Never 35.43335 21.1
Seldom 28.99785 17.3
Most of the Time 10.00032 6.0
Always 3.761879 2.2
Frequency Missing = 2.1765209365
8/6/2019 fort worth isd - dunbar middle school (grades 7-8) - 1998 Texas School Survey of Drug and Alcohol Use
http://slidepdf.com/reader/full/fort-worth-isd-dunbar-middle-school-grades-7-8-1998-texas-school-survey 110/138
GET ALCOHOLIC BEVERAGES FROM FRIENDS
Q27B Frequency Percent──────────────────────────────────────
Do not Drink 85.51118 52.0
Never 27.21544 16.5
Seldom 28.20963 17.1
Most of the Time 18.11525 11.0
Always 5.544292 3.4
Frequency Missing = 5.4413023412
The frequencies have been weighted so that the
analysis reflects the distribution of students by grade
level in the campus
Fort Worth ISD - Dunbar Middle School (Grades 7-8)
Spring 1998
GET ALCOHOLIC BEVERAGES FROM A STORE
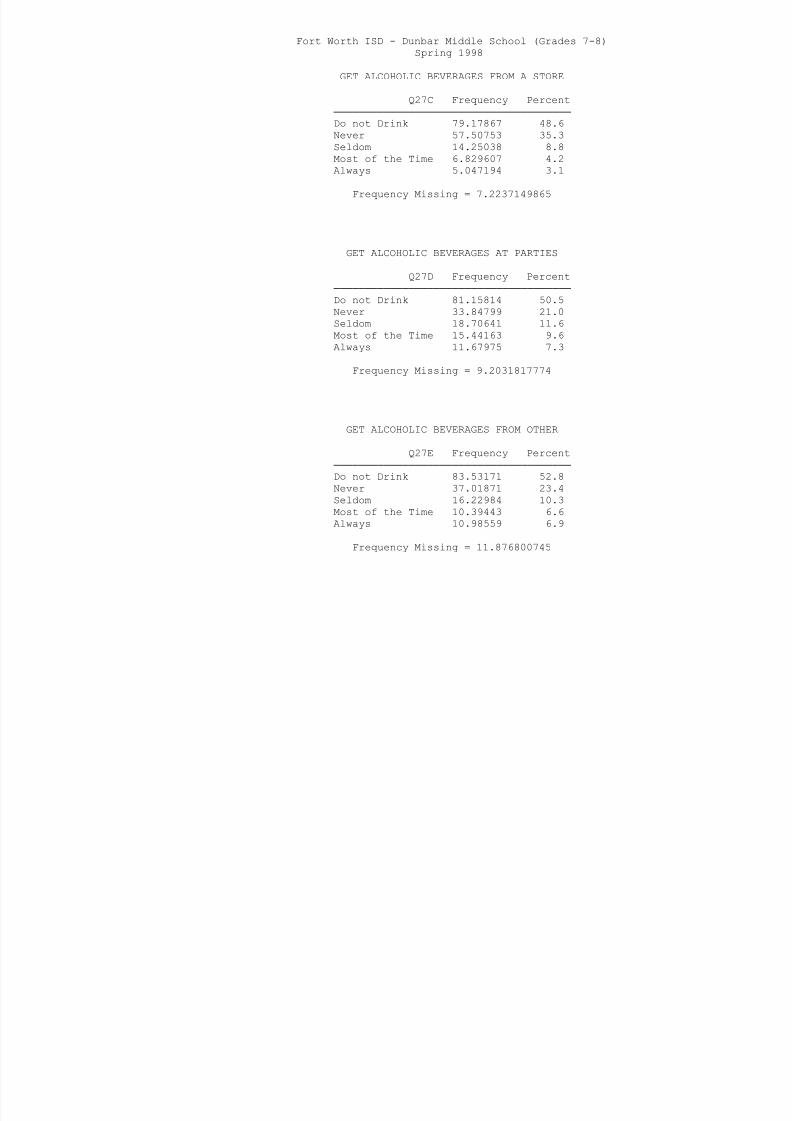
8/6/2019 fort worth isd - dunbar middle school (grades 7-8) - 1998 Texas School Survey of Drug and Alcohol Use
http://slidepdf.com/reader/full/fort-worth-isd-dunbar-middle-school-grades-7-8-1998-texas-school-survey 111/138
Q27C Frequency Percent
──────────────────────────────────────
Do not Drink 79.17867 48.6
Never 57.50753 35.3
Seldom 14.25038 8.8
Most of the Time 6.829607 4.2Always 5.047194 3.1
Frequency Missing = 7.2237149865
GET ALCOHOLIC BEVERAGES AT PARTIES
Q27D Frequency Percent
──────────────────────────────────────
Do not Drink 81.15814 50.5
Never 33.84799 21.0
Seldom 18.70641 11.6
Most of the Time 15.44163 9.6
Always 11.67975 7.3
Frequency Missing = 9.2031817774
GET ALCOHOLIC BEVERAGES FROM OTHER
Q27E Frequency Percent
──────────────────────────────────────
Do not Drink 83.53171 52.8
Never 37.01871 23.4
Seldom 16.22984 10.3
Most of the Time 10.39443 6.6
Always 10.98559 6.9
Frequency Missing = 11.876800745
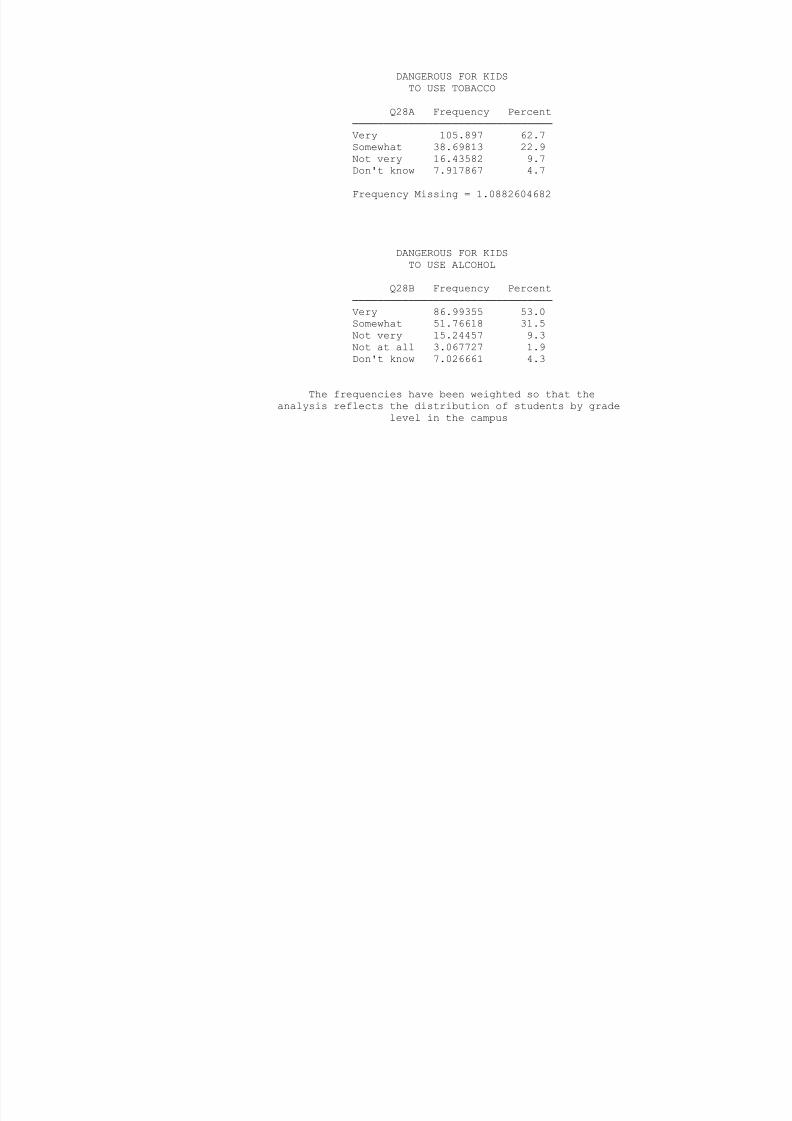
8/6/2019 fort worth isd - dunbar middle school (grades 7-8) - 1998 Texas School Survey of Drug and Alcohol Use
http://slidepdf.com/reader/full/fort-worth-isd-dunbar-middle-school-grades-7-8-1998-texas-school-survey 112/138
Fort Worth ISD - Dunbar Middle School (Grades 7-8)
Spring 1998
Frequency Missing = 5.9384003727
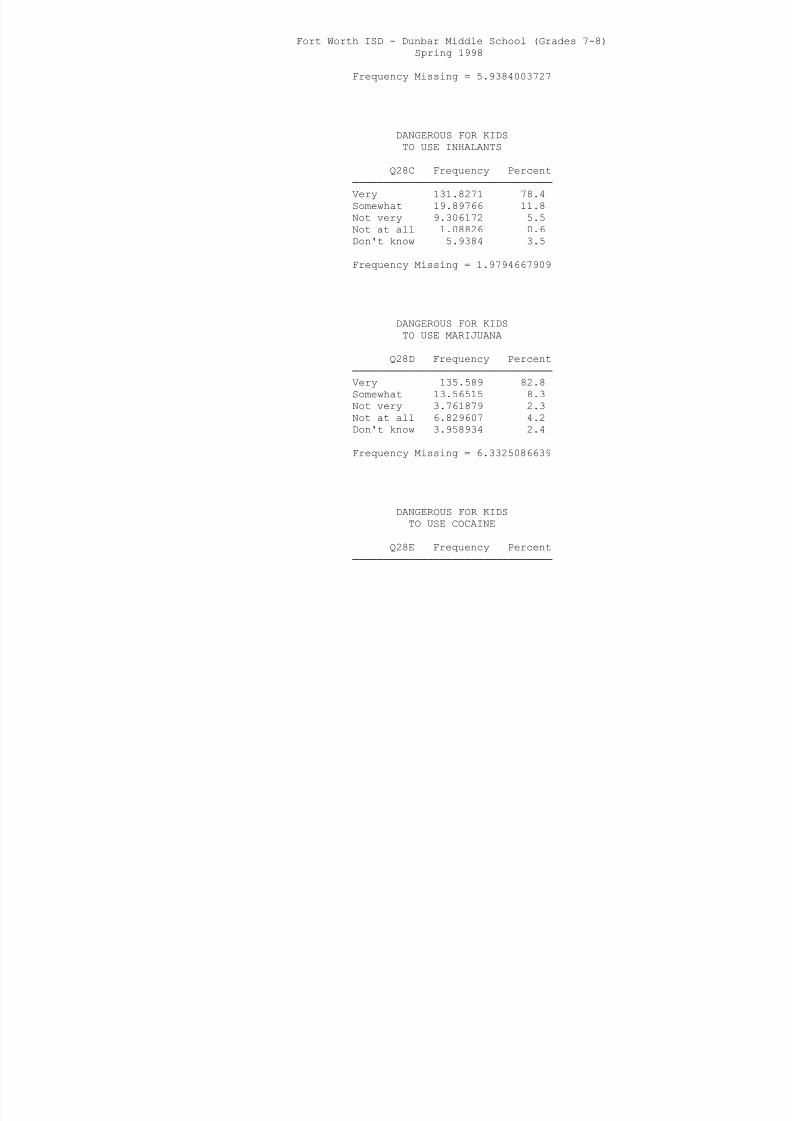
8/6/2019 fort worth isd - dunbar middle school (grades 7-8) - 1998 Texas School Survey of Drug and Alcohol Use
http://slidepdf.com/reader/full/fort-worth-isd-dunbar-middle-school-grades-7-8-1998-texas-school-survey 113/138
DANGEROUS FOR KIDS
TO USE INHALANTS
Q28C Frequency Percent
────────────────────────────────
Very 131.8271 78.4
Somewhat 19.89766 11.8
Not very 9.306172 5.5
Not at all 1.08826 0.6
Don't know 5.9384 3.5
Frequency Missing = 1.9794667909
DANGEROUS FOR KIDS
TO USE MARIJUANA
Q28D Frequency Percent
────────────────────────────────
Very 135.589 82.8
Somewhat 13.56515 8.3
Not very 3.761879 2.3
Not at all 6.829607 4.2
Don't know 3.958934 2.4
Frequency Missing = 6.3325086639
DANGEROUS FOR KIDS
TO USE COCAINE
Q28E Frequency Percent
────────────────────────────────
Very 151.9218 92.2
Somewhat 5.347238 3.2
Don't know 7.523759 4.6
i i 5 2442481956
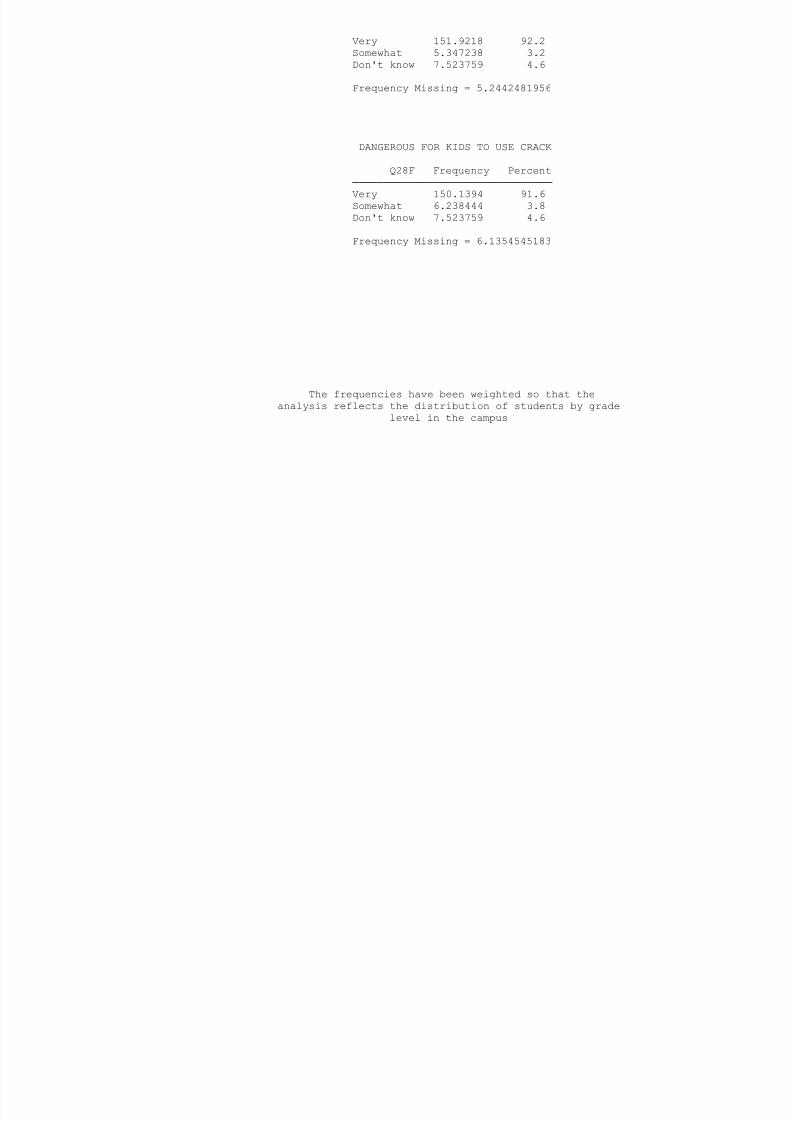
8/6/2019 fort worth isd - dunbar middle school (grades 7-8) - 1998 Texas School Survey of Drug and Alcohol Use
http://slidepdf.com/reader/full/fort-worth-isd-dunbar-middle-school-grades-7-8-1998-texas-school-survey 114/138
Frequency Missing = 5.2442481956
DANGEROUS FOR KIDS TO USE CRACK
Q28F Frequency Percent
────────────────────────────────
Very 150.1394 91.6
Somewhat 6.238444 3.8
Don't know 7.523759 4.6
Frequency Missing = 6.1354545183
The frequencies have been weighted so that the
analysis reflects the distribution of students by grade
level in the campus
Fort Worth ISD - Dunbar Middle School (Grades 7-8)
Spring 1998
DANGEROUS FOR KIDS
TO USE ECSTASY
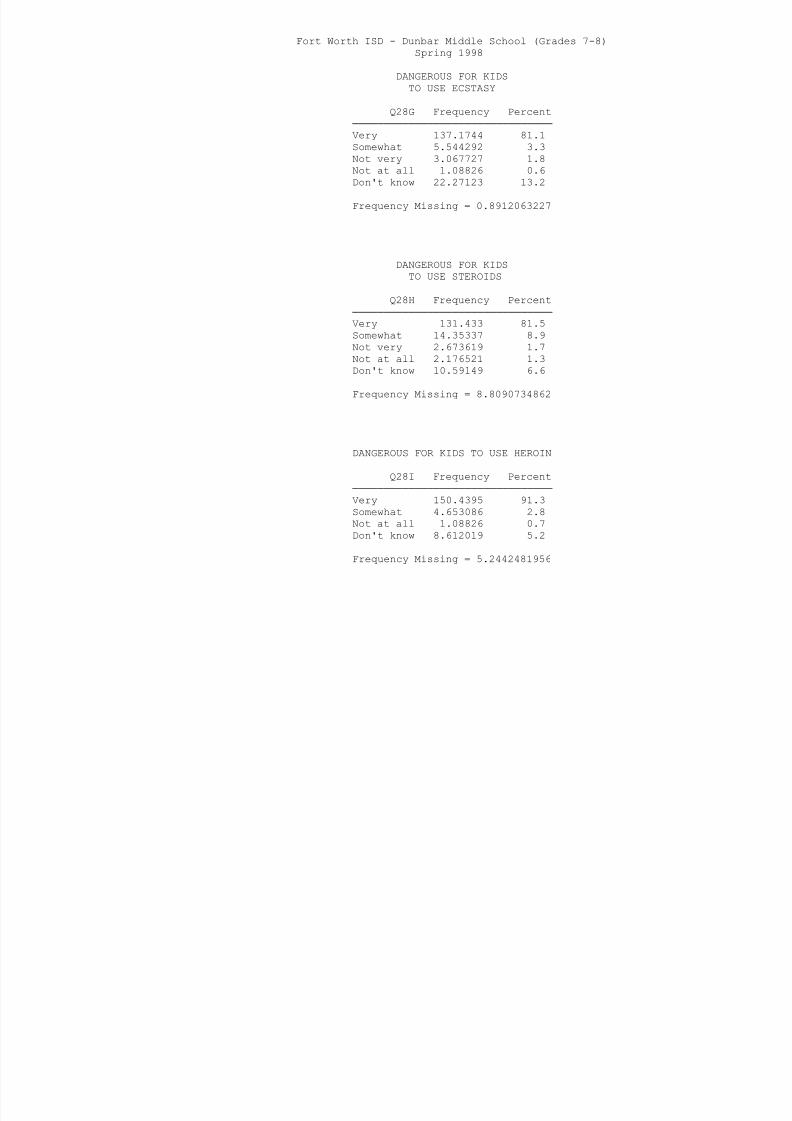
8/6/2019 fort worth isd - dunbar middle school (grades 7-8) - 1998 Texas School Survey of Drug and Alcohol Use
http://slidepdf.com/reader/full/fort-worth-isd-dunbar-middle-school-grades-7-8-1998-texas-school-survey 115/138
TO USE ECSTASY
Q28G Frequency Percent
────────────────────────────────
Very 137.1744 81.1
Somewhat 5.544292 3.3
Not very 3.067727 1.8Not at all 1.08826 0.6
Don't know 22.27123 13.2
Frequency Missing = 0.8912063227
DANGEROUS FOR KIDS
TO USE STEROIDS
Q28H Frequency Percent
────────────────────────────────
Very 131.433 81.5
Somewhat 14.35337 8.9
Not very 2.673619 1.7
Not at all 2.176521 1.3
Don't know 10.59149 6.6
Frequency Missing = 8.8090734862
DANGEROUS FOR KIDS TO USE HEROIN
Q28I Frequency Percent
────────────────────────────────
Very 150.4395 91.3
Somewhat 4.653086 2.8
Not at all 1.08826 0.7
Don't know 8.612019 5.2
Frequency Missing = 5.2442481956
USE MARIJUANA AS JOINTS
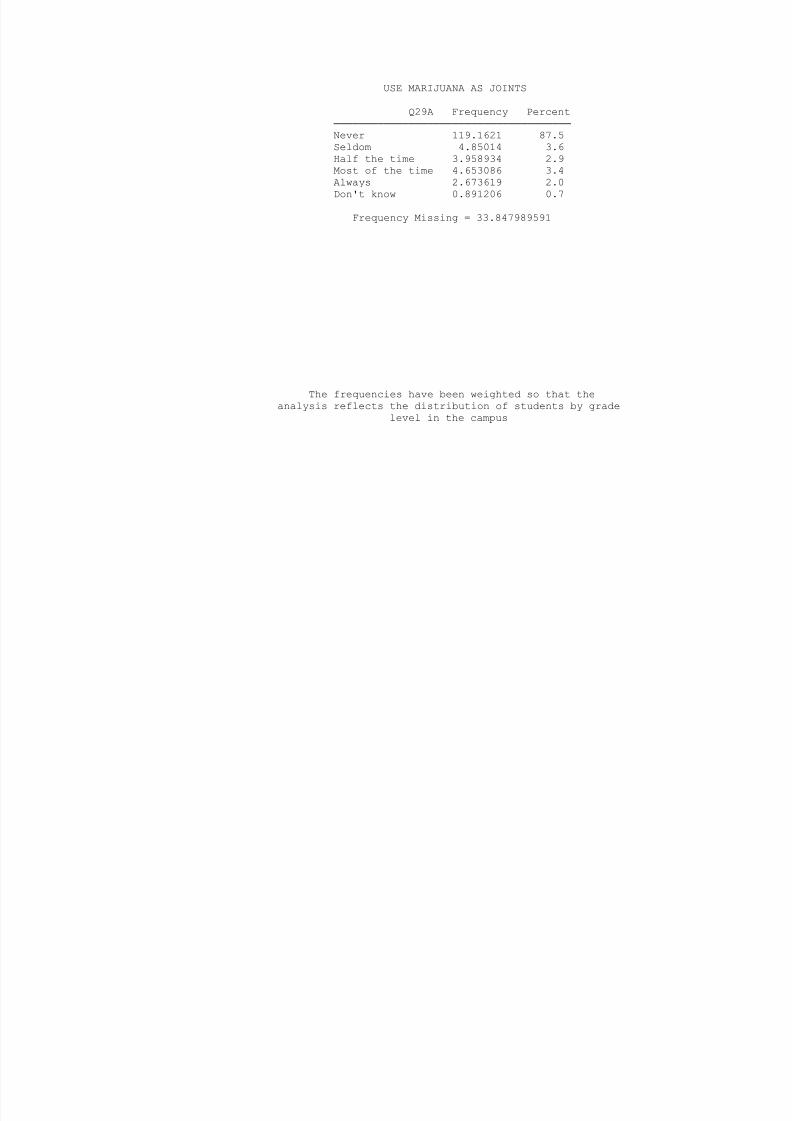
8/6/2019 fort worth isd - dunbar middle school (grades 7-8) - 1998 Texas School Survey of Drug and Alcohol Use
http://slidepdf.com/reader/full/fort-worth-isd-dunbar-middle-school-grades-7-8-1998-texas-school-survey 116/138
USE MARIJUANA AS JOINTS
Q29A Frequency Percent
──────────────────────────────────────
Never 119.1621 87.5
Seldom 4.85014 3.6
Half the time 3.958934 2.9Most of the time 4.653086 3.4
Always 2.673619 2.0
Don't know 0.891206 0.7
Frequency Missing = 33.847989591
The frequencies have been weighted so that the
analysis reflects the distribution of students by grade
level in the campus
Fort Worth ISD - Dunbar Middle School (Grades 7-8)
Spring 1998
USE MARIJUANA AS BLUNTS
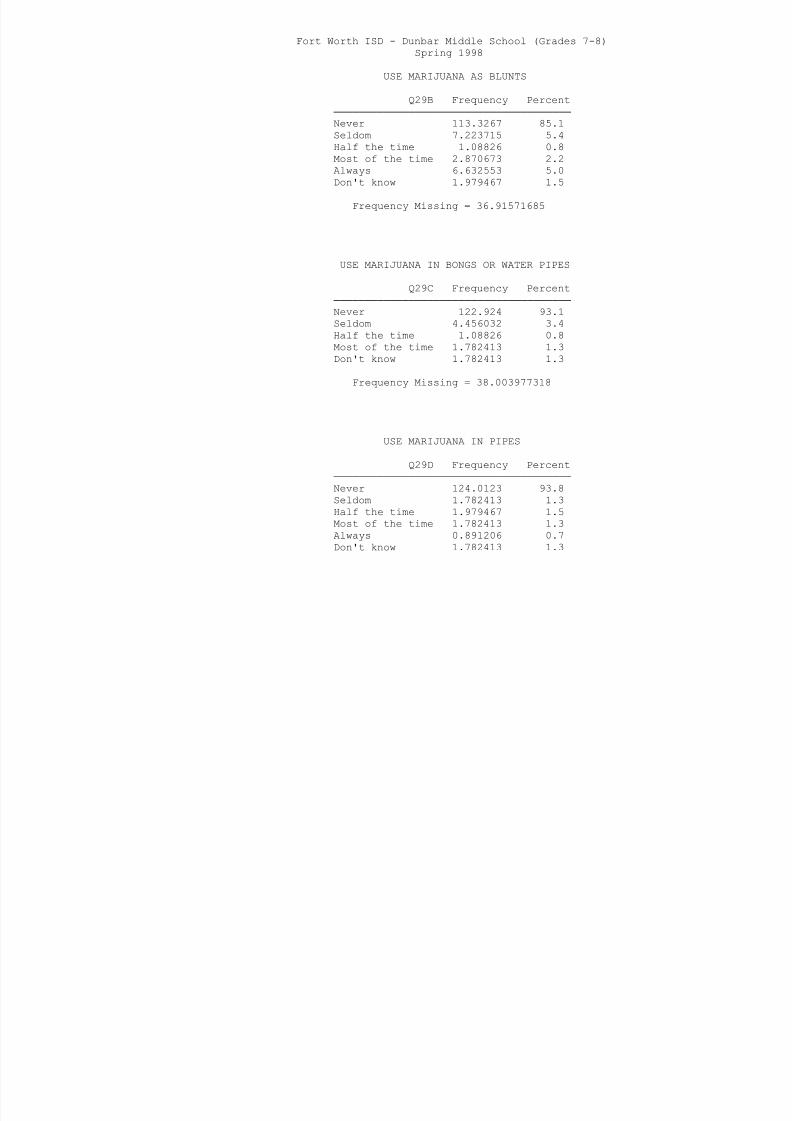
8/6/2019 fort worth isd - dunbar middle school (grades 7-8) - 1998 Texas School Survey of Drug and Alcohol Use
http://slidepdf.com/reader/full/fort-worth-isd-dunbar-middle-school-grades-7-8-1998-texas-school-survey 117/138
Q29B Frequency Percent
──────────────────────────────────────
Never 113.3267 85.1
Seldom 7.223715 5.4
Half the time 1.08826 0.8
Most of the time 2.870673 2.2Always 6.632553 5.0
Don't know 1.979467 1.5
Frequency Missing = 36.91571685
USE MARIJUANA IN BONGS OR WATER PIPES
Q29C Frequency Percent
──────────────────────────────────────
Never 122.924 93.1
Seldom 4.456032 3.4
Half the time 1.08826 0.8
Most of the time 1.782413 1.3
Don't know 1.782413 1.3
Frequency Missing = 38.003977318
USE MARIJUANA IN PIPES
Q29D Frequency Percent
──────────────────────────────────────
Never 124.0123 93.8
Seldom 1.782413 1.3
Half the time 1.979467 1.5
Most of the time 1.782413 1.3
Always 0.891206 0.7
Don't know 1.782413 1.3
Frequency Missing = 37.806923173

8/6/2019 fort worth isd - dunbar middle school (grades 7-8) - 1998 Texas School Survey of Drug and Alcohol Use
http://slidepdf.com/reader/full/fort-worth-isd-dunbar-middle-school-grades-7-8-1998-texas-school-survey 118/138
USE MARIJUANA OTHER WAYS
Q29E Frequency Percent
──────────────────────────────────────
Never 127.08 93.9
Seldom 2.870673 2.1Half the time 0.891206 0.7
Most of the time 0.891206 0.7
Always 1.782413 1.3
Don't know 1.782413 1.3
Frequency Missing = 34.739195913
The frequencies have been weighted so that the
analysis reflects the distribution of students by grade
level in the campus
Fort Worth ISD - Dunbar Middle School (Grades 7-8)
Spring 1998
DAYS SKIPPED SINCE SEPTEMBER
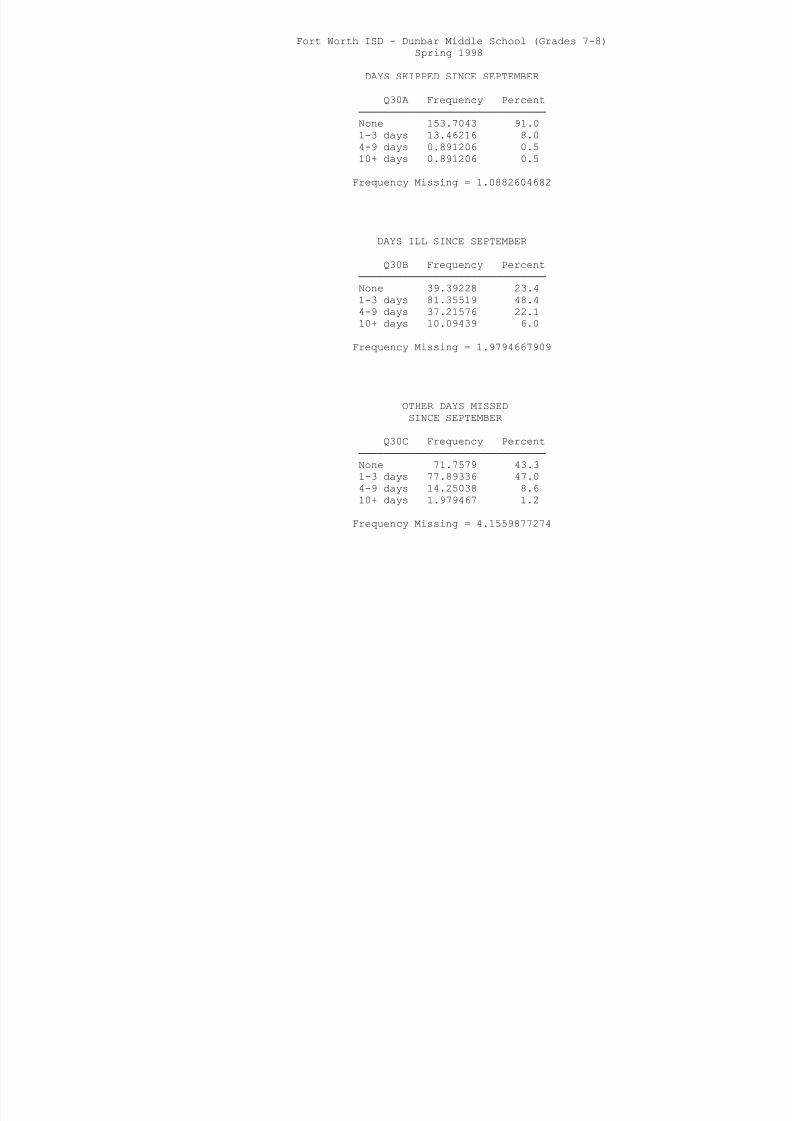
8/6/2019 fort worth isd - dunbar middle school (grades 7-8) - 1998 Texas School Survey of Drug and Alcohol Use
http://slidepdf.com/reader/full/fort-worth-isd-dunbar-middle-school-grades-7-8-1998-texas-school-survey 119/138
Q30A Frequency Percent
──────────────────────────────
None 153.7043 91.0
1-3 days 13.46216 8.0
4-9 days 0.891206 0.5
10+ days 0.891206 0.5
Frequency Missing = 1.0882604682
DAYS ILL SINCE SEPTEMBER
Q30B Frequency Percent
──────────────────────────────
None 39.39228 23.4
1-3 days 81.35519 48.4
4-9 days 37.21576 22.1
10+ days 10.09439 6.0
Frequency Missing = 1.9794667909
OTHER DAYS MISSED
SINCE SEPTEMBER
Q30C Frequency Percent
──────────────────────────────
None 71.7579 43.3
1-3 days 77.89336 47.0
4-9 days 14.25038 8.6
10+ days 1.979467 1.2
Frequency Missing = 4.1559877274
SENT TO PRINCIPAL/DEAN
SINCE SEPTEMBER
Q30D Frequency Percent
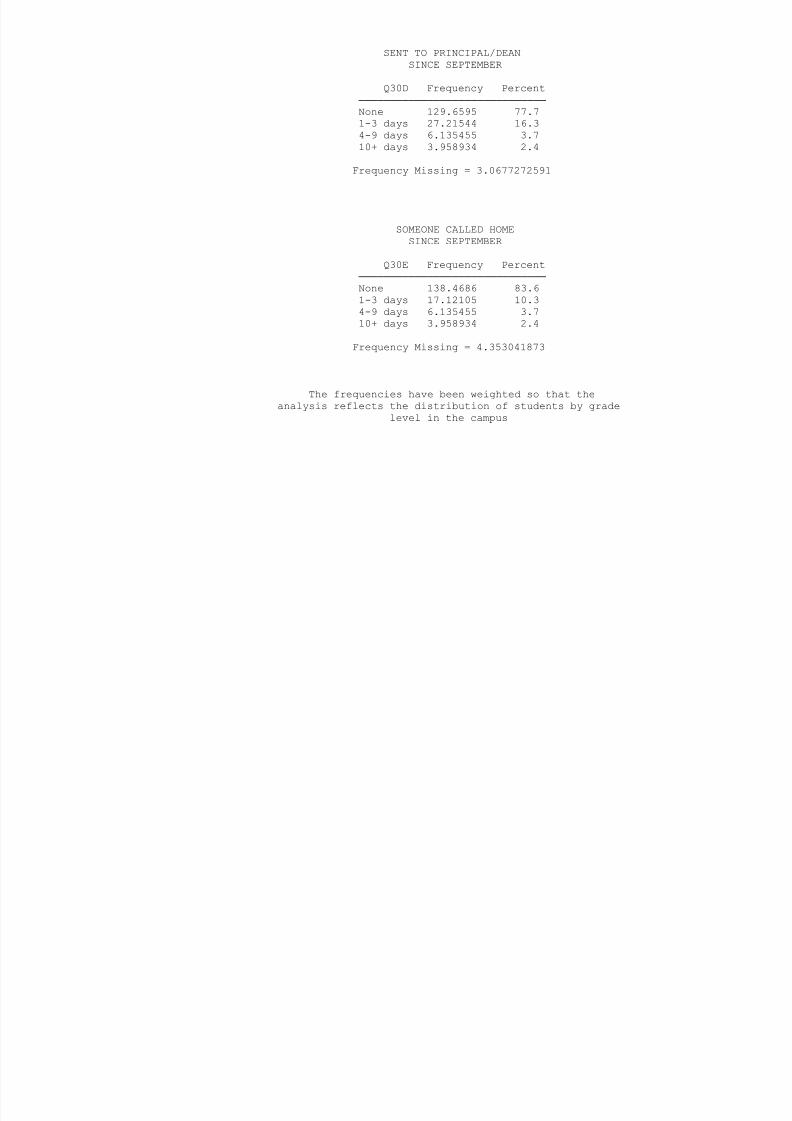
8/6/2019 fort worth isd - dunbar middle school (grades 7-8) - 1998 Texas School Survey of Drug and Alcohol Use
http://slidepdf.com/reader/full/fort-worth-isd-dunbar-middle-school-grades-7-8-1998-texas-school-survey 120/138
Q30D Frequency Percent
──────────────────────────────
None 129.6595 77.7
1-3 days 27.21544 16.3
4-9 days 6.135455 3.7
10+ days 3.958934 2.4
Frequency Missing = 3.0677272591
SOMEONE CALLED HOME
SINCE SEPTEMBER
Q30E Frequency Percent
──────────────────────────────
None 138.4686 83.6
1-3 days 17.12105 10.3
4-9 days 6.135455 3.7
10+ days 3.958934 2.4
Frequency Missing = 4.353041873
The frequencies have been weighted so that the
analysis reflects the distribution of students by grade
level in the campus
Fort Worth ISD - Dunbar Middle School (Grades 7-8)
Spring 1998
IN TROUBLE FOR DRINKING
SINCE SEPTEMBER
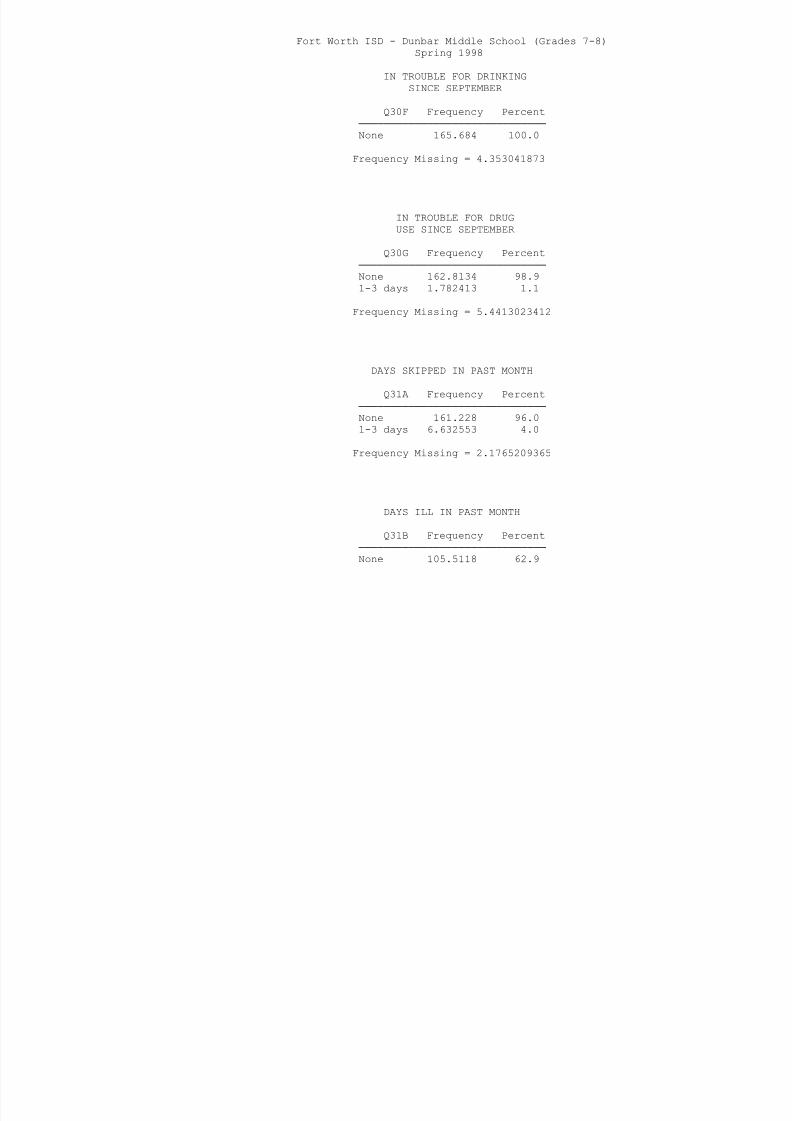
8/6/2019 fort worth isd - dunbar middle school (grades 7-8) - 1998 Texas School Survey of Drug and Alcohol Use
http://slidepdf.com/reader/full/fort-worth-isd-dunbar-middle-school-grades-7-8-1998-texas-school-survey 121/138
SINCE SEPTEMBER
Q30F Frequency Percent
──────────────────────────────
None 165.684 100.0
Frequency Missing = 4.353041873
IN TROUBLE FOR DRUG
USE SINCE SEPTEMBER
Q30G Frequency Percent
──────────────────────────────
None 162.8134 98.9
1-3 days 1.782413 1.1
Frequency Missing = 5.4413023412
DAYS SKIPPED IN PAST MONTH
Q31A Frequency Percent
──────────────────────────────
None 161.228 96.0
1-3 days 6.632553 4.0
Frequency Missing = 2.1765209365
DAYS ILL IN PAST MONTH
Q31B Frequency Percent
──────────────────────────────
None 105.5118 62.9
1-3 days 51.86024 30.9
4-9 days 8.311975 5.0
10+ days 2.176521 1.3
Frequency Missing = 2.1765209365

8/6/2019 fort worth isd - dunbar middle school (grades 7-8) - 1998 Texas School Survey of Drug and Alcohol Use
http://slidepdf.com/reader/full/fort-worth-isd-dunbar-middle-school-grades-7-8-1998-texas-school-survey 122/138
Frequency Missing 2.1765209365
OTHER DAYS MISSED
IN PAST MONTH
Q31C Frequency Percent
──────────────────────────────
None 116.1974 69.1
1-3 days 45.72479 27.2
4-9 days 5.244248 3.1
10+ days 0.891206 0.5
Frequency Missing = 1.9794667909
The frequencies have been weighted so that the
analysis reflects the distribution of students by grade
level in the campus
Fort Worth ISD - Dunbar Middle School (Grades 7-8)
Spring 1998
SENT TO PRINCIPAL/DEAN
IN PAST MONTH
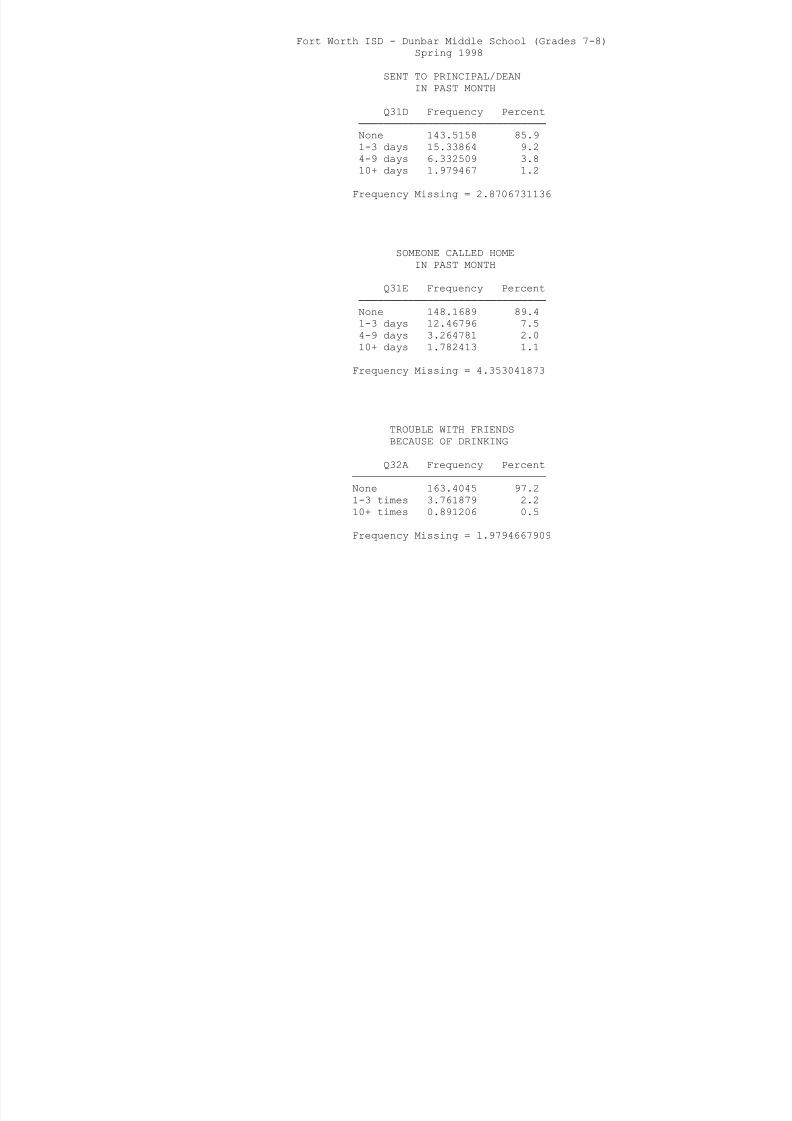
8/6/2019 fort worth isd - dunbar middle school (grades 7-8) - 1998 Texas School Survey of Drug and Alcohol Use
http://slidepdf.com/reader/full/fort-worth-isd-dunbar-middle-school-grades-7-8-1998-texas-school-survey 123/138
Q31D Frequency Percent
──────────────────────────────
None 143.5158 85.9
1-3 days 15.33864 9.2
4-9 days 6.332509 3.810+ days 1.979467 1.2
Frequency Missing = 2.8706731136
SOMEONE CALLED HOME
IN PAST MONTH
Q31E Frequency Percent
──────────────────────────────
None 148.1689 89.4
1-3 days 12.46796 7.5
4-9 days 3.264781 2.0
10+ days 1.782413 1.1
Frequency Missing = 4.353041873
TROUBLE WITH FRIENDSBECAUSE OF DRINKING
Q32A Frequency Percent
───────────────────────────────
None 163.4045 97.2
1-3 times 3.761879 2.2
10+ times 0.891206 0.5
Frequency Missing = 1.9794667909
DRIVEN A CAR AFTER
A GOOD BIT TO DRINK
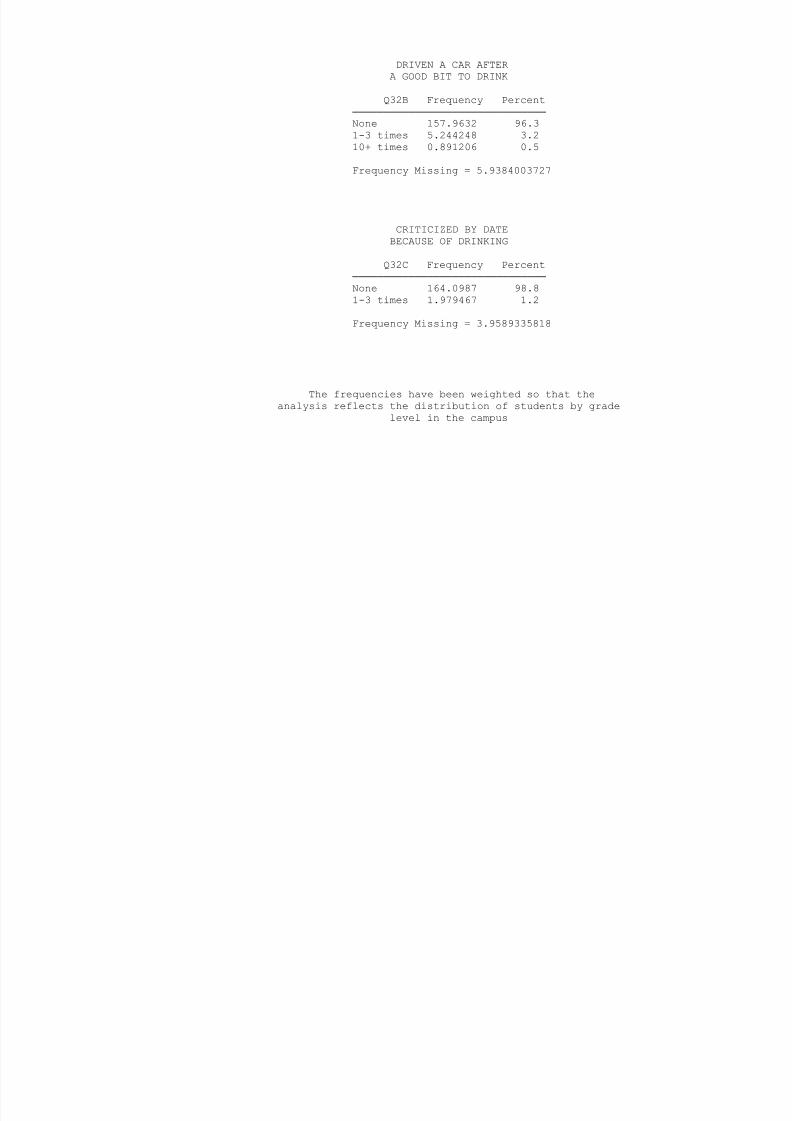
8/6/2019 fort worth isd - dunbar middle school (grades 7-8) - 1998 Texas School Survey of Drug and Alcohol Use
http://slidepdf.com/reader/full/fort-worth-isd-dunbar-middle-school-grades-7-8-1998-texas-school-survey 124/138
Q32B Frequency Percent
───────────────────────────────
None 157.9632 96.3
1-3 times 5.244248 3.2
10+ times 0.891206 0.5
Frequency Missing = 5.9384003727
CRITICIZED BY DATE
BECAUSE OF DRINKING
Q32C Frequency Percent
───────────────────────────────
None 164.0987 98.8
1-3 times 1.979467 1.2
Frequency Missing = 3.9589335818
The frequencies have been weighted so that the
analysis reflects the distribution of students by grade
level in the campus
Fort Worth ISD - Dunbar Middle School (Grades 7-8)
Spring 1998
TROUBLE WITH POLICE
BECAUSE OF DRINKING
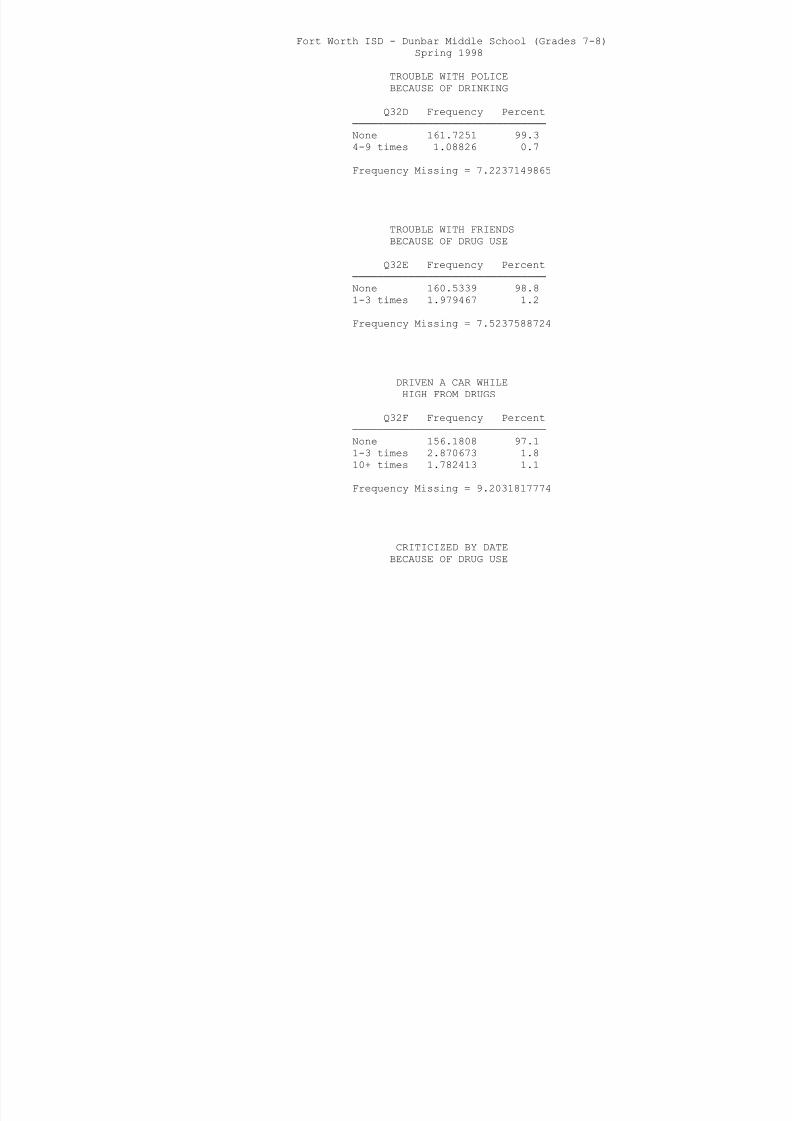
8/6/2019 fort worth isd - dunbar middle school (grades 7-8) - 1998 Texas School Survey of Drug and Alcohol Use
http://slidepdf.com/reader/full/fort-worth-isd-dunbar-middle-school-grades-7-8-1998-texas-school-survey 125/138
Q32D Frequency Percent
───────────────────────────────
None 161.7251 99.3
4-9 times 1.08826 0.7
Frequency Missing = 7.2237149865
TROUBLE WITH FRIENDS
BECAUSE OF DRUG USE
Q32E Frequency Percent
───────────────────────────────
None 160.5339 98.8
1-3 times 1.979467 1.2
Frequency Missing = 7.5237588724
DRIVEN A CAR WHILE
HIGH FROM DRUGS
Q32F Frequency Percent
───────────────────────────────None 156.1808 97.1
1-3 times 2.870673 1.8
10+ times 1.782413 1.1
Frequency Missing = 9.2031817774
CRITICIZED BY DATE
BECAUSE OF DRUG USE
Q32G Frequency Percent
───────────────────────────────
None 164.0987 99.3
1-3 times 1.08826 0.7
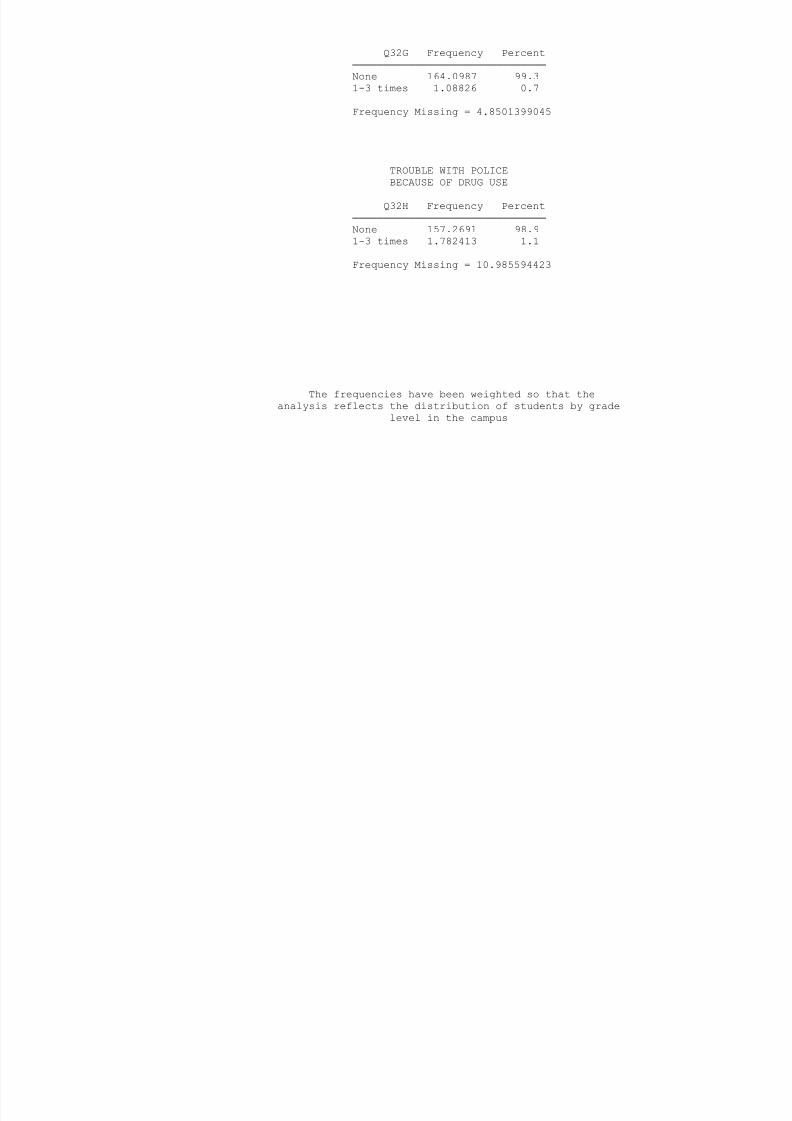
8/6/2019 fort worth isd - dunbar middle school (grades 7-8) - 1998 Texas School Survey of Drug and Alcohol Use
http://slidepdf.com/reader/full/fort-worth-isd-dunbar-middle-school-grades-7-8-1998-texas-school-survey 126/138
Frequency Missing = 4.8501399045
TROUBLE WITH POLICE
BECAUSE OF DRUG USE
Q32H Frequency Percent
───────────────────────────────
None 157.2691 98.9
1-3 times 1.782413 1.1
Frequency Missing = 10.985594423
The frequencies have been weighted so that the
analysis reflects the distribution of students by grade
level in the campus
Fort Worth ISD - Dunbar Middle School (Grades 7-8)
Spring 1998
CLASS DAYS DRUNK ON
ALCOHOL SINCE SEPT
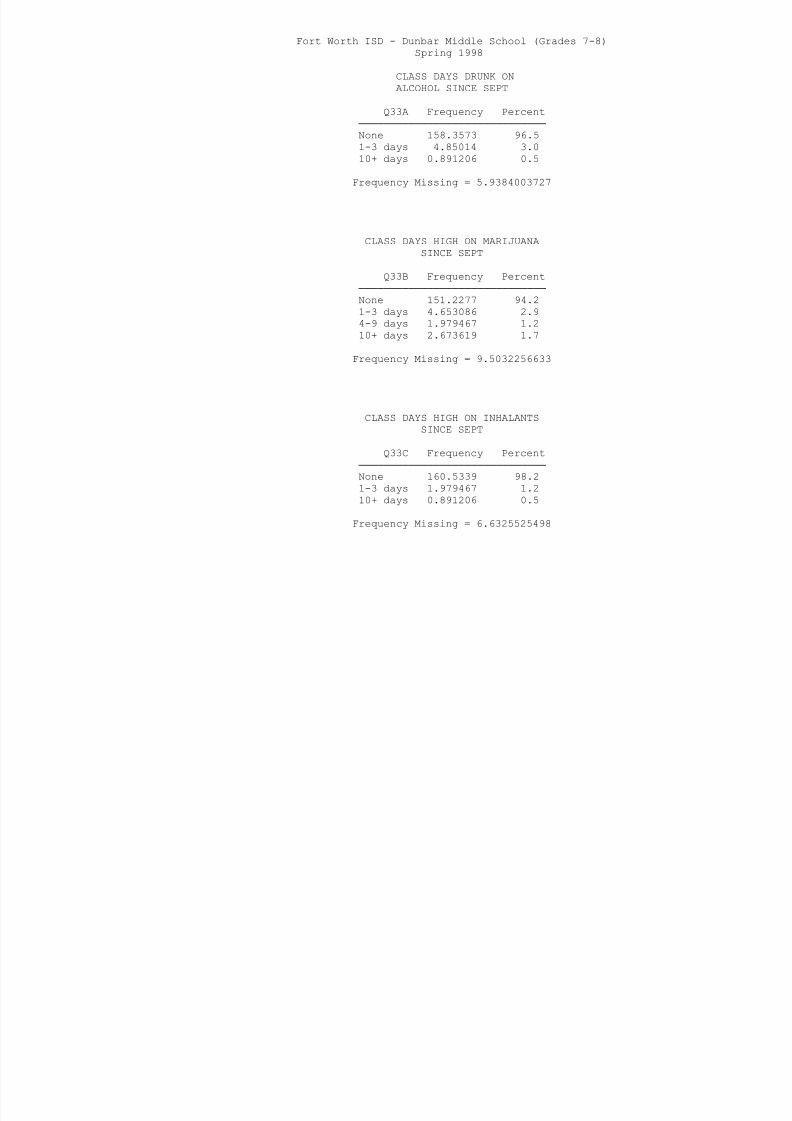
8/6/2019 fort worth isd - dunbar middle school (grades 7-8) - 1998 Texas School Survey of Drug and Alcohol Use
http://slidepdf.com/reader/full/fort-worth-isd-dunbar-middle-school-grades-7-8-1998-texas-school-survey 127/138
Q33A Frequency Percent
──────────────────────────────
None 158.3573 96.5
1-3 days 4.85014 3.0
10+ days 0.891206 0.5
Frequency Missing = 5.9384003727
CLASS DAYS HIGH ON MARIJUANA
SINCE SEPT
Q33B Frequency Percent
──────────────────────────────
None 151.2277 94.2
1-3 days 4.653086 2.9
4-9 days 1.979467 1.2
10+ days 2.673619 1.7
Frequency Missing = 9.5032256633
CLASS DAYS HIGH ON INHALANTS
SINCE SEPT
Q33C Frequency Percent
──────────────────────────────
None 160.5339 98.2
1-3 days 1.979467 1.2
10+ days 0.891206 0.5
Frequency Missing = 6.6325525498
CLASS DAYS HIGH
ON OTHER DRUG(S)
Q33D Frequency Percent

8/6/2019 fort worth isd - dunbar middle school (grades 7-8) - 1998 Texas School Survey of Drug and Alcohol Use
http://slidepdf.com/reader/full/fort-worth-isd-dunbar-middle-school-grades-7-8-1998-texas-school-survey 128/138
──────────────────────────────
None 161.228 99.5
10+ days 0.891206 0.5
Frequency Missing = 7.9178671636
ALCOHOL USE AT PARTIES
THIS SCHOOL YEAR
Q34A Frequency Percent
──────────────────────────────────────
Never 111.5354 66.6
Seldom 22.8624 13.7
Half the time 10.00032 6.0
Most of the time 7.720813 4.6Always 3.761879 2.2
Don't know 5.741346 3.4
Didn't attend 5.741346 3.4
Frequency Missing = 2.673618968
The frequencies have been weighted so that the
analysis reflects the distribution of students by grade
level in the campus
Fort Worth ISD - Dunbar Middle School (Grades 7-8)
Spring 1998
DRUG USE AT PARTIES THIS SCHOOL YEAR
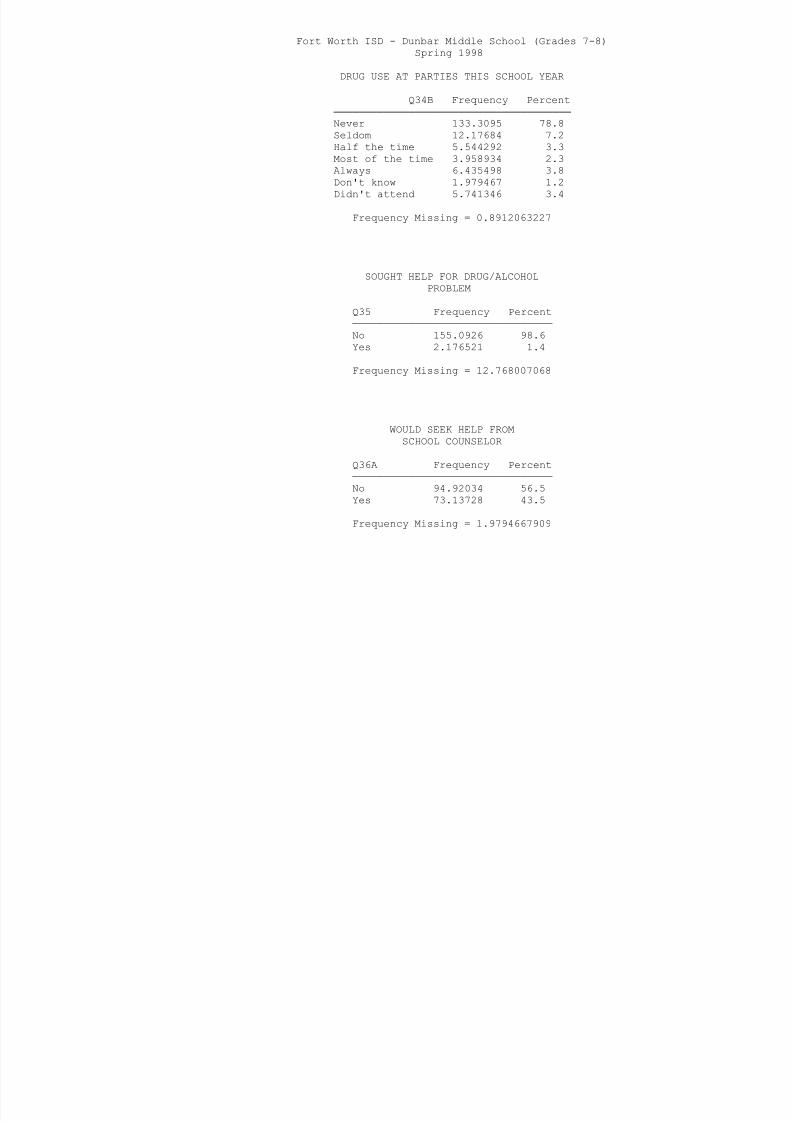
8/6/2019 fort worth isd - dunbar middle school (grades 7-8) - 1998 Texas School Survey of Drug and Alcohol Use
http://slidepdf.com/reader/full/fort-worth-isd-dunbar-middle-school-grades-7-8-1998-texas-school-survey 129/138
Q34B Frequency Percent
──────────────────────────────────────
Never 133.3095 78.8
Seldom 12.17684 7.2
Half the time 5.544292 3.3
Most of the time 3.958934 2.3Always 6.435498 3.8
Don't know 1.979467 1.2
Didn't attend 5.741346 3.4
Frequency Missing = 0.8912063227
SOUGHT HELP FOR DRUG/ALCOHOL
PROBLEM
Q35 Frequency Percent
────────────────────────────────
No 155.0926 98.6
Yes 2.176521 1.4
Frequency Missing = 12.768007068
WOULD SEEK HELP FROM
SCHOOL COUNSELOR
Q36A Frequency Percent
────────────────────────────────
No 94.92034 56.5
Yes 73.13728 43.5
Frequency Missing = 1.9794667909
WOULD SEEK HELP OUTSIDE
OF SCHOOL
Q36B Frequency Percent

8/6/2019 fort worth isd - dunbar middle school (grades 7-8) - 1998 Texas School Survey of Drug and Alcohol Use
http://slidepdf.com/reader/full/fort-worth-isd-dunbar-middle-school-grades-7-8-1998-texas-school-survey 130/138
────────────────────────────────
No 126.9859 77.0
Yes 38.00398 23.0
Frequency Missing = 5.04719405
WOULD SEEK HELP FROM
OTHER COUNSELOR
Q36C Frequency Percent
────────────────────────────────
No 87.79069 54.3
Yes 73.93442 45.7
Frequency Missing = 8.3119754547
The frequencies have been weighted so that the
analysis reflects the distribution of students by grade
level in the campus
Fort Worth ISD - Dunbar Middle School (Grades 7-8)
Spring 1998
WOULD SEEK HELP FROM PARENTS
Q36D F P t
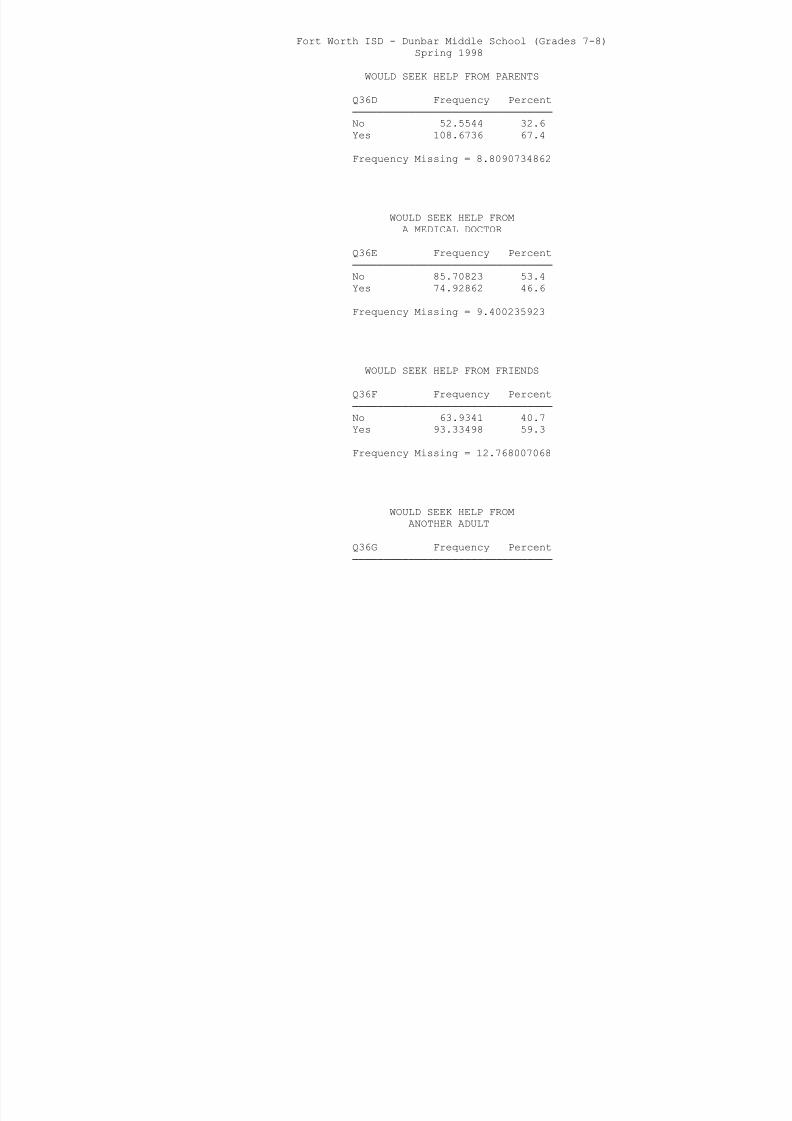
8/6/2019 fort worth isd - dunbar middle school (grades 7-8) - 1998 Texas School Survey of Drug and Alcohol Use
http://slidepdf.com/reader/full/fort-worth-isd-dunbar-middle-school-grades-7-8-1998-texas-school-survey 131/138
Q36D Frequency Percent
────────────────────────────────
No 52.5544 32.6
Yes 108.6736 67.4
Frequency Missing = 8.8090734862
WOULD SEEK HELP FROM
A MEDICAL DOCTOR
Q36E Frequency Percent
────────────────────────────────
No 85.70823 53.4
Yes 74.92862 46.6
Frequency Missing = 9.400235923
WOULD SEEK HELP FROM FRIENDS
Q36F Frequency Percent
────────────────────────────────
No 63.9341 40.7
Yes 93.33498 59.3
Frequency Missing = 12.768007068
WOULD SEEK HELP FROM
ANOTHER ADULT
Q36G Frequency Percent
────────────────────────────────
No 56.51333 35.2
Yes 104.1235 64.8
Frequency Missing = 9.400235923
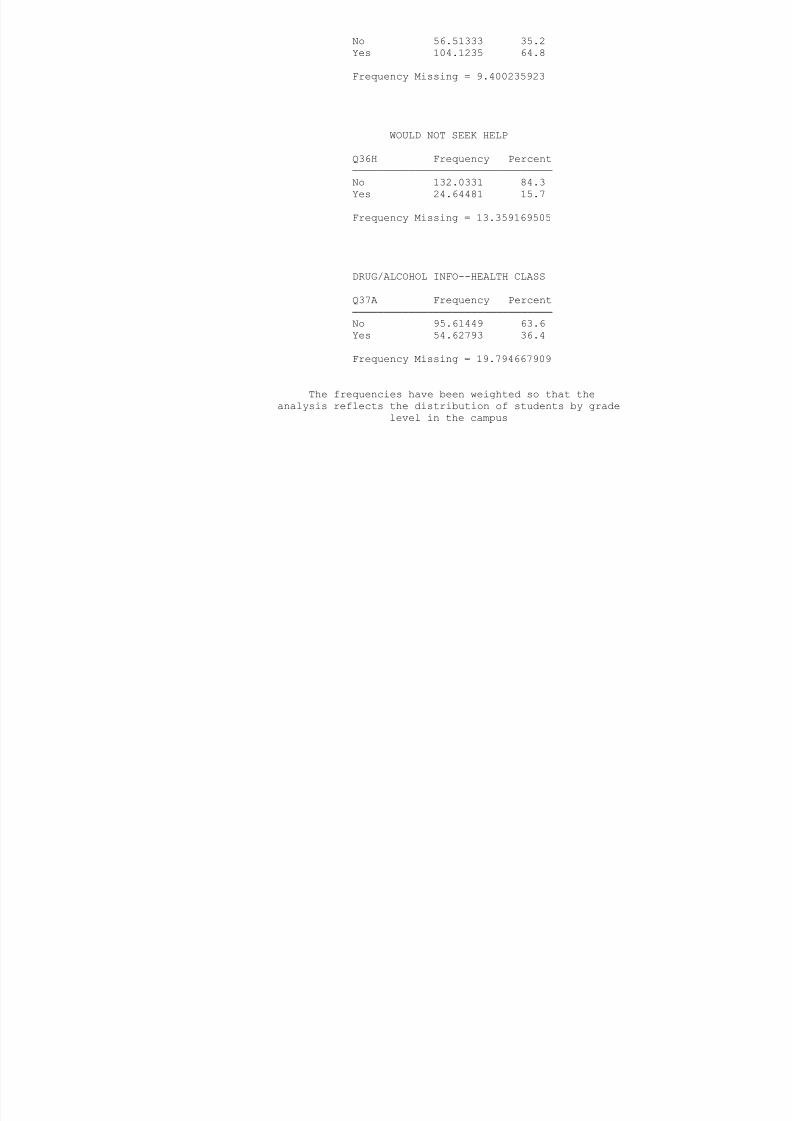
8/6/2019 fort worth isd - dunbar middle school (grades 7-8) - 1998 Texas School Survey of Drug and Alcohol Use
http://slidepdf.com/reader/full/fort-worth-isd-dunbar-middle-school-grades-7-8-1998-texas-school-survey 132/138
WOULD NOT SEEK HELP
Q36H Frequency Percent────────────────────────────────
No 132.0331 84.3
Yes 24.64481 15.7
Frequency Missing = 13.359169505
DRUG/ALCOHOL INFO--HEALTH CLASS
Q37A Frequency Percent────────────────────────────────
No 95.61449 63.6
Yes 54.62793 36.4
Frequency Missing = 19.794667909
The frequencies have been weighted so that the
analysis reflects the distribution of students by grade
level in the campus
Fort Worth ISD - Dunbar Middle School (Grades 7-8)
Spring 1998
DRUG/ALCOHOL INFO--ASSEMBLY
PROGRAM
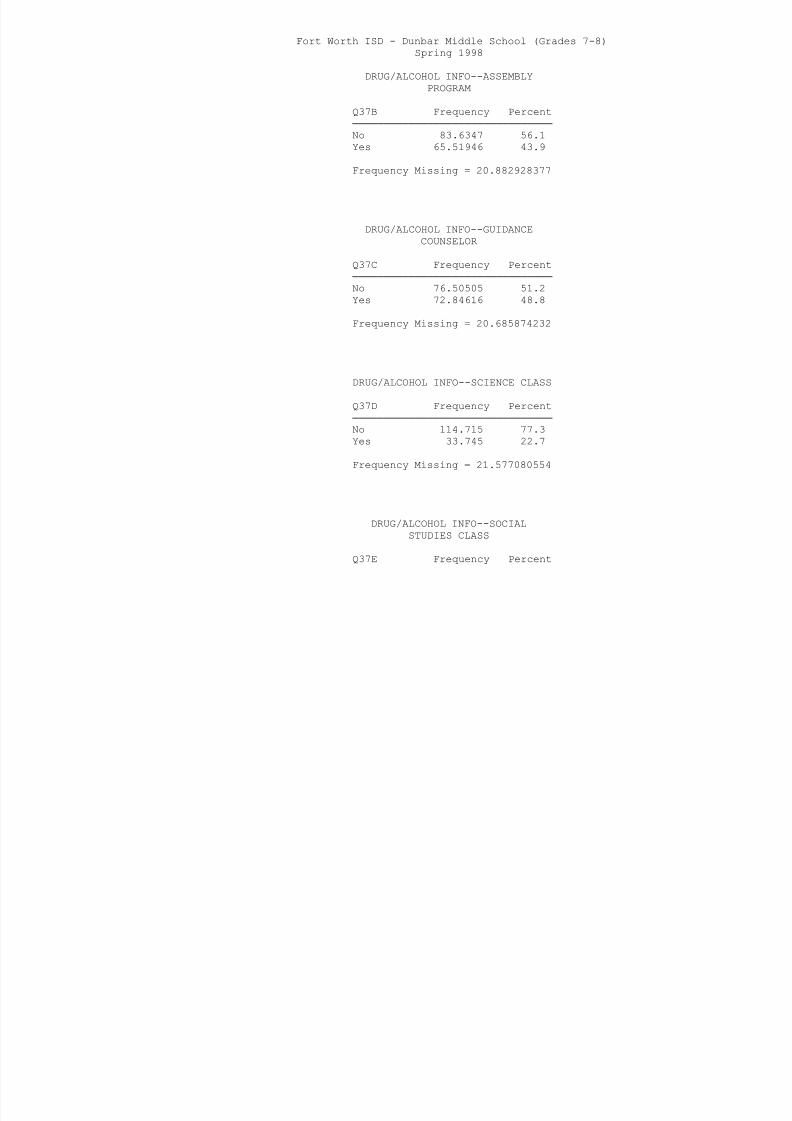
8/6/2019 fort worth isd - dunbar middle school (grades 7-8) - 1998 Texas School Survey of Drug and Alcohol Use
http://slidepdf.com/reader/full/fort-worth-isd-dunbar-middle-school-grades-7-8-1998-texas-school-survey 133/138
Q37B Frequency Percent
────────────────────────────────
No 83.6347 56.1
Yes 65.51946 43.9
Frequency Missing = 20.882928377
DRUG/ALCOHOL INFO--GUIDANCE
COUNSELOR
Q37C Frequency Percent
────────────────────────────────
No 76.50505 51.2
Yes 72.84616 48.8
Frequency Missing = 20.685874232
DRUG/ALCOHOL INFO--SCIENCE CLASS
Q37D Frequency Percent
────────────────────────────────
No 114.715 77.3
Yes 33.745 22.7
Frequency Missing = 21.577080554
DRUG/ALCOHOL INFO--SOCIAL
STUDIES CLASS
Q37E Frequency Percent
────────────────────────────────
No 119.3681 81.1
Yes 27.8066 18.9
Frequency Missing = 22.862395168
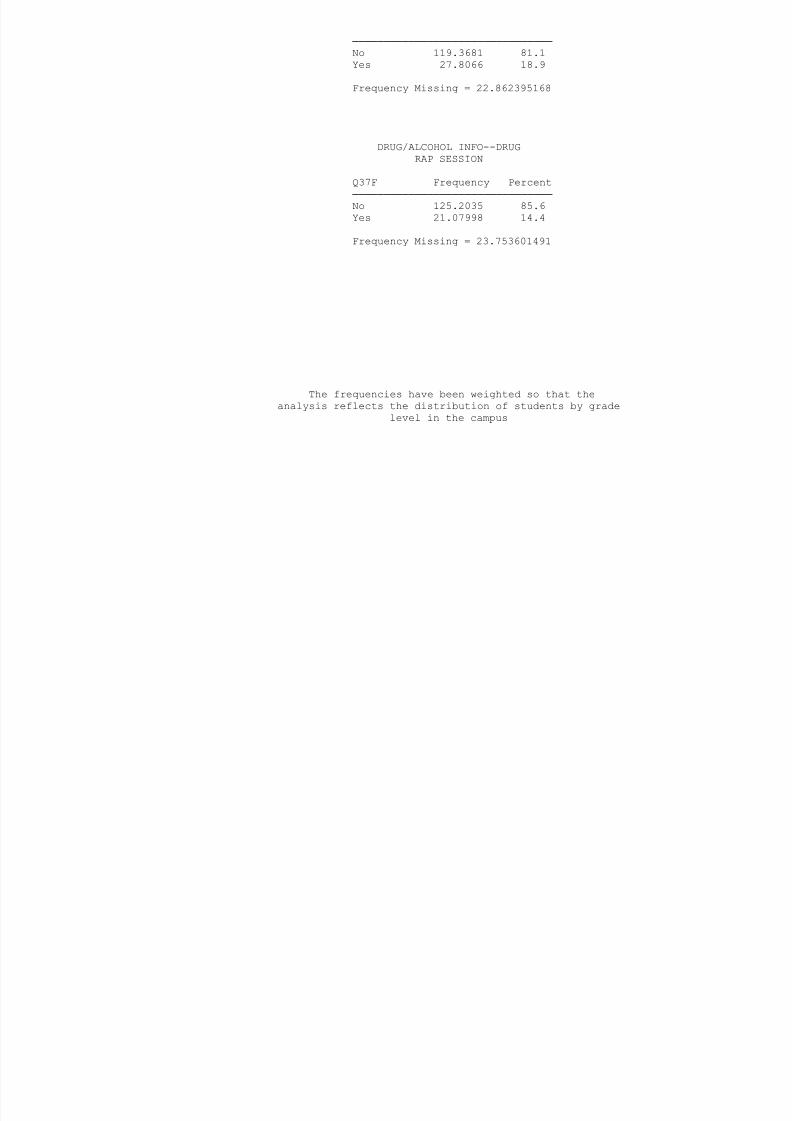
8/6/2019 fort worth isd - dunbar middle school (grades 7-8) - 1998 Texas School Survey of Drug and Alcohol Use
http://slidepdf.com/reader/full/fort-worth-isd-dunbar-middle-school-grades-7-8-1998-texas-school-survey 134/138
DRUG/ALCOHOL INFO--DRUG
RAP SESSION
Q37F Frequency Percent
────────────────────────────────
No 125.2035 85.6
Yes 21.07998 14.4
Frequency Missing = 23.753601491
The frequencies have been weighted so that the
analysis reflects the distribution of students by grade
level in the campus
Fort Worth ISD - Dunbar Middle School (Grades 7-8)
Spring 1998
DRUG/ALCOHOL INFO--INVITED
SCHOOL GUEST
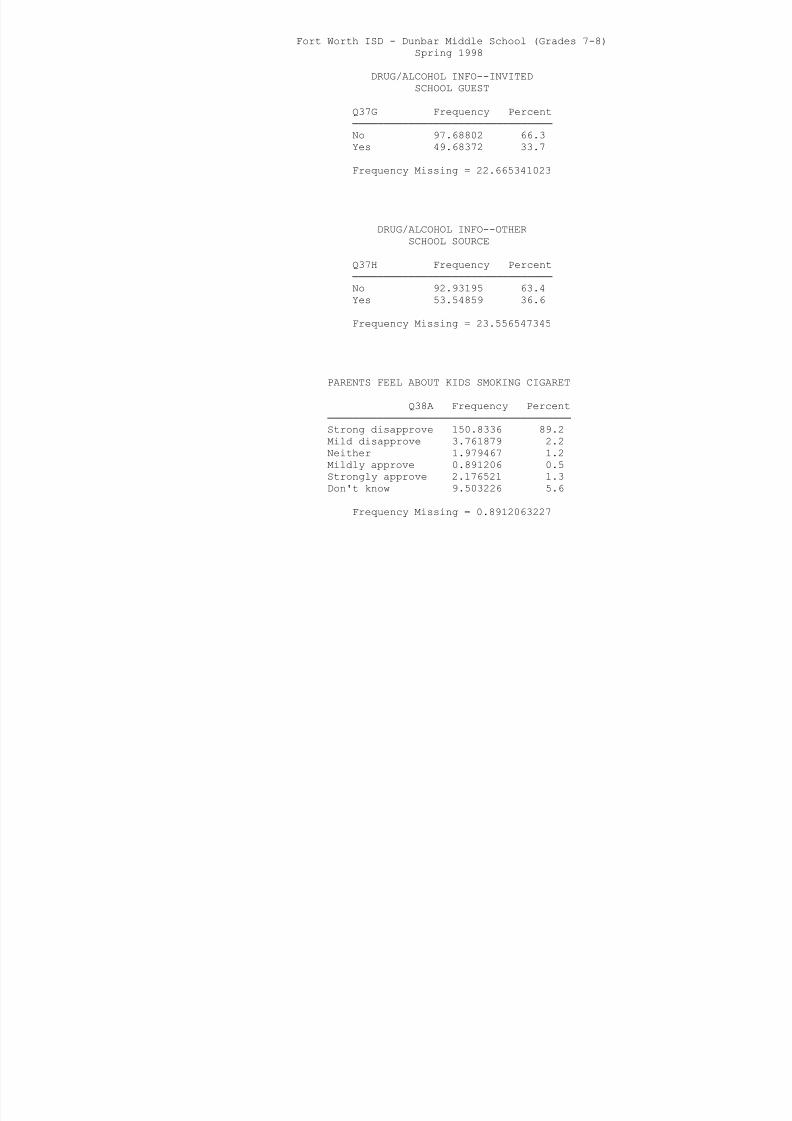
8/6/2019 fort worth isd - dunbar middle school (grades 7-8) - 1998 Texas School Survey of Drug and Alcohol Use
http://slidepdf.com/reader/full/fort-worth-isd-dunbar-middle-school-grades-7-8-1998-texas-school-survey 135/138
Q37G Frequency Percent
────────────────────────────────
No 97.68802 66.3
Yes 49.68372 33.7
Frequency Missing = 22.665341023
DRUG/ALCOHOL INFO--OTHER
SCHOOL SOURCE
Q37H Frequency Percent
────────────────────────────────
No 92.93195 63.4
Yes 53.54859 36.6
Frequency Missing = 23.556547345
PARENTS FEEL ABOUT KIDS SMOKING CIGARET
Q38A Frequency Percent
───────────────────────────────────────
Strong disapprove 150.8336 89.2
Mild disapprove 3.761879 2.2
Neither 1.979467 1.2
Mildly approve 0.891206 0.5
Strongly approve 2.176521 1.3
Don't know 9.503226 5.6
Frequency Missing = 0.8912063227
PARENTS FEEL ABOUT KIDS DRINKING BEER
Q38B Frequency Percent
───────────────────────────────────────
Strong disapprove 128.8624 78.6
Mild disapprove 15 83573 9 7
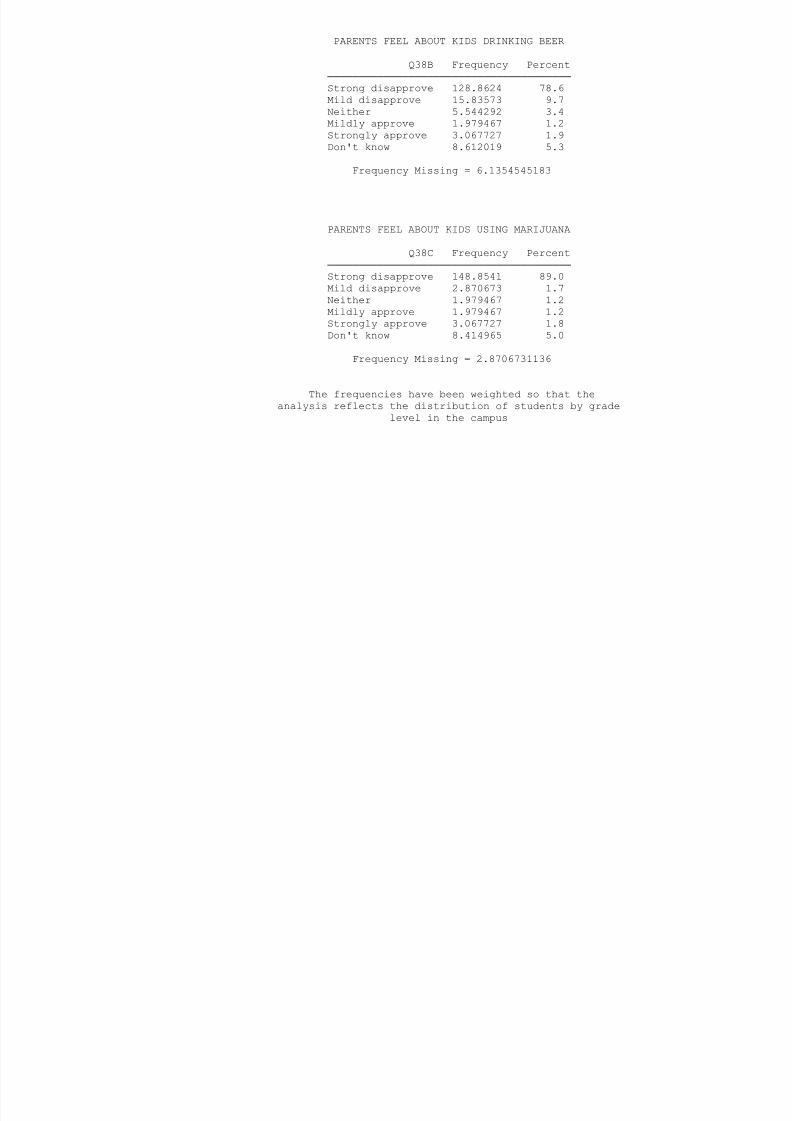
8/6/2019 fort worth isd - dunbar middle school (grades 7-8) - 1998 Texas School Survey of Drug and Alcohol Use
http://slidepdf.com/reader/full/fort-worth-isd-dunbar-middle-school-grades-7-8-1998-texas-school-survey 136/138
Mild disapprove 15.83573 9.7
Neither 5.544292 3.4
Mildly approve 1.979467 1.2
Strongly approve 3.067727 1.9
Don't know 8.612019 5.3
Frequency Missing = 6.1354545183
PARENTS FEEL ABOUT KIDS USING MARIJUANA
Q38C Frequency Percent
───────────────────────────────────────
Strong disapprove 148.8541 89.0
Mild disapprove 2.870673 1.7
Neither 1.979467 1.2Mildly approve 1.979467 1.2
Strongly approve 3.067727 1.8
Don't know 8.414965 5.0
Frequency Missing = 2.8706731136
The frequencies have been weighted so that the
analysis reflects the distribution of students by grade
level in the campus
Fort Worth ISD - Dunbar Middle School (Grades 7-8)
Spring 1998
PURCHASED LOTTERY TICKET
IN PAST YEAR
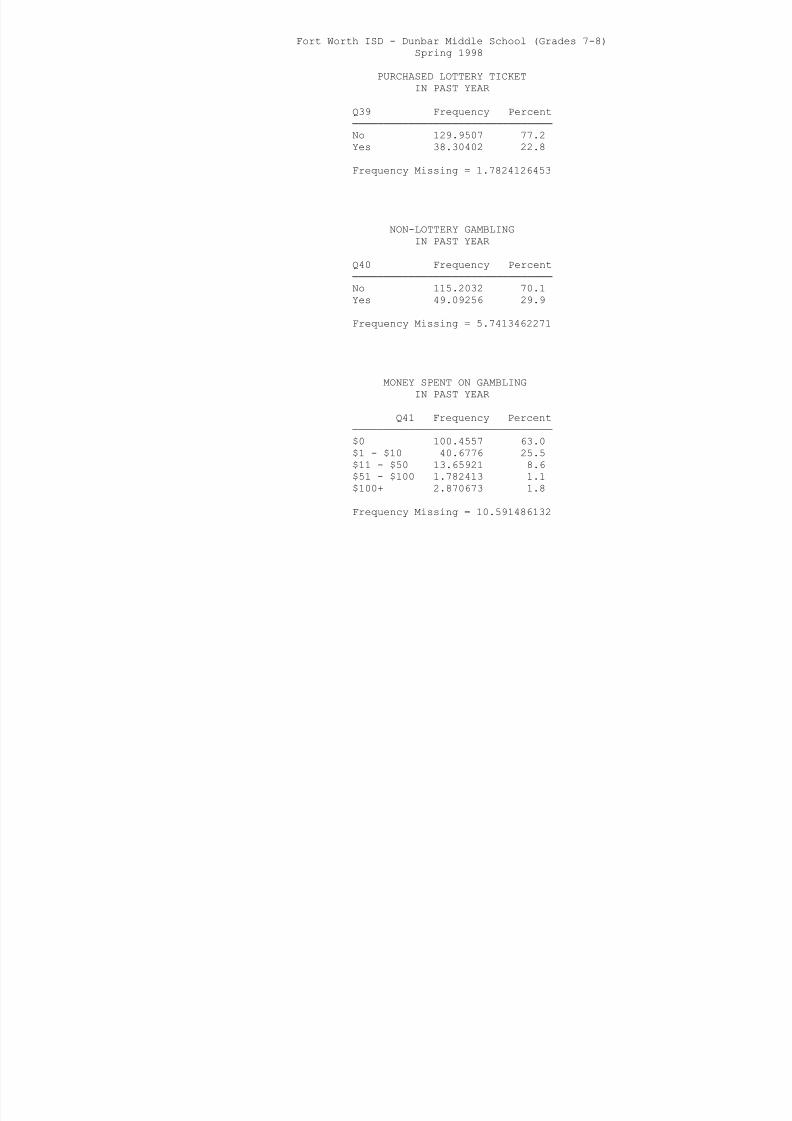
8/6/2019 fort worth isd - dunbar middle school (grades 7-8) - 1998 Texas School Survey of Drug and Alcohol Use
http://slidepdf.com/reader/full/fort-worth-isd-dunbar-middle-school-grades-7-8-1998-texas-school-survey 137/138
Q39 Frequency Percent
────────────────────────────────
No 129.9507 77.2
Yes 38.30402 22.8
Frequency Missing = 1.7824126453
NON-LOTTERY GAMBLING
IN PAST YEAR
Q40 Frequency Percent
────────────────────────────────
No 115.2032 70.1
Yes 49.09256 29.9
Frequency Missing = 5.7413462271
MONEY SPENT ON GAMBLING
IN PAST YEAR
Q41 Frequency Percent
────────────────────────────────
$0 100.4557 63.0
$1 - $10 40.6776 25.5
$11 - $50 13.65921 8.6
$51 - $100 1.782413 1.1
$100+ 2.870673 1.8
Frequency Missing = 10.591486132
8/6/2019 fort worth isd - dunbar middle school (grades 7-8) - 1998 Texas School Survey of Drug and Alcohol Use
http://slidepdf.com/reader/full/fort-worth-isd-dunbar-middle-school-grades-7-8-1998-texas-school-survey 138/138
The frequencies have been weighted so that the
analysis reflects the distribution of students by grade
level in the campus