Embed Size (px)
Citation preview
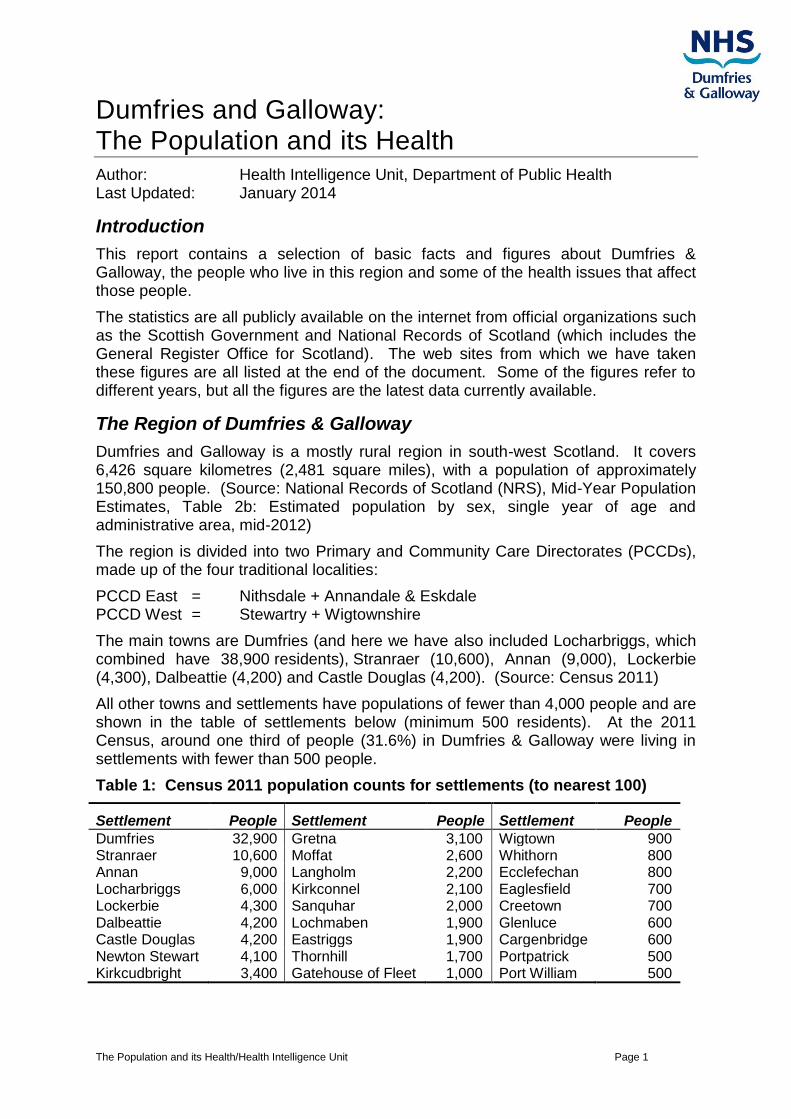
The Population and its Health/Health Intelligence Unit Page 1
Dumfries and Galloway: The Population and its Health Author: Health Intelligence Unit, Department of Public Health Last Updated: January 2014
Introduction
This report contains a selection of basic facts and figures about Dumfries & Galloway, the people who live in this region and some of the health issues that affect those people.
The statistics are all publicly available on the internet from official organizations such as the Scottish Government and National Records of Scotland (which includes the General Register Office for Scotland). The web sites from which we have taken these figures are all listed at the end of the document. Some of the figures refer to different years, but all the figures are the latest data currently available.
The Region of Dumfries & Galloway
Dumfries and Galloway is a mostly rural region in south-west Scotland. It covers 6,426 square kilometres (2,481 square miles), with a population of approximately 150,800 people. (Source: National Records of Scotland (NRS), Mid-Year Population Estimates, Table 2b: Estimated population by sex, single year of age and administrative area, mid-2012)
The region is divided into two Primary and Community Care Directorates (PCCDs), made up of the four traditional localities:
PCCD East = Nithsdale + Annandale & Eskdale PCCD West = Stewartry + Wigtownshire
The main towns are Dumfries (and here we have also included Locharbriggs, which combined have 38,900 residents), Stranraer (10,600), Annan (9,000), Lockerbie (4,300), Dalbeattie (4,200) and Castle Douglas (4,200). (Source: Census 2011)
All other towns and settlements have populations of fewer than 4,000 people and are shown in the table of settlements below (minimum 500 residents). At the 2011 Census, around one third of people (31.6%) in Dumfries & Galloway were living in settlements with fewer than 500 people.
Table 1: Census 2011 population counts for settlements (to nearest 100)
Settlement People Settlement People Settlement People
Dumfries 32,900 Gretna 3,100 Wigtown 900 Stranraer 10,600 Moffat 2,600 Whithorn 800 Annan 9,000 Langholm 2,200 Ecclefechan 800 Locharbriggs 6,000 Kirkconnel 2,100 Eaglesfield 700 Lockerbie 4,300 Sanquhar 2,000 Creetown 700 Dalbeattie 4,200 Lochmaben 1,900 Glenluce 600 Castle Douglas 4,200 Eastriggs 1,900 Cargenbridge 600 Newton Stewart 4,100 Thornhill 1,700 Portpatrick 500 Kirkcudbright 3,400 Gatehouse of Fleet 1,000 Port William 500
The Population and its Health/Health Intelligence Unit Page 2
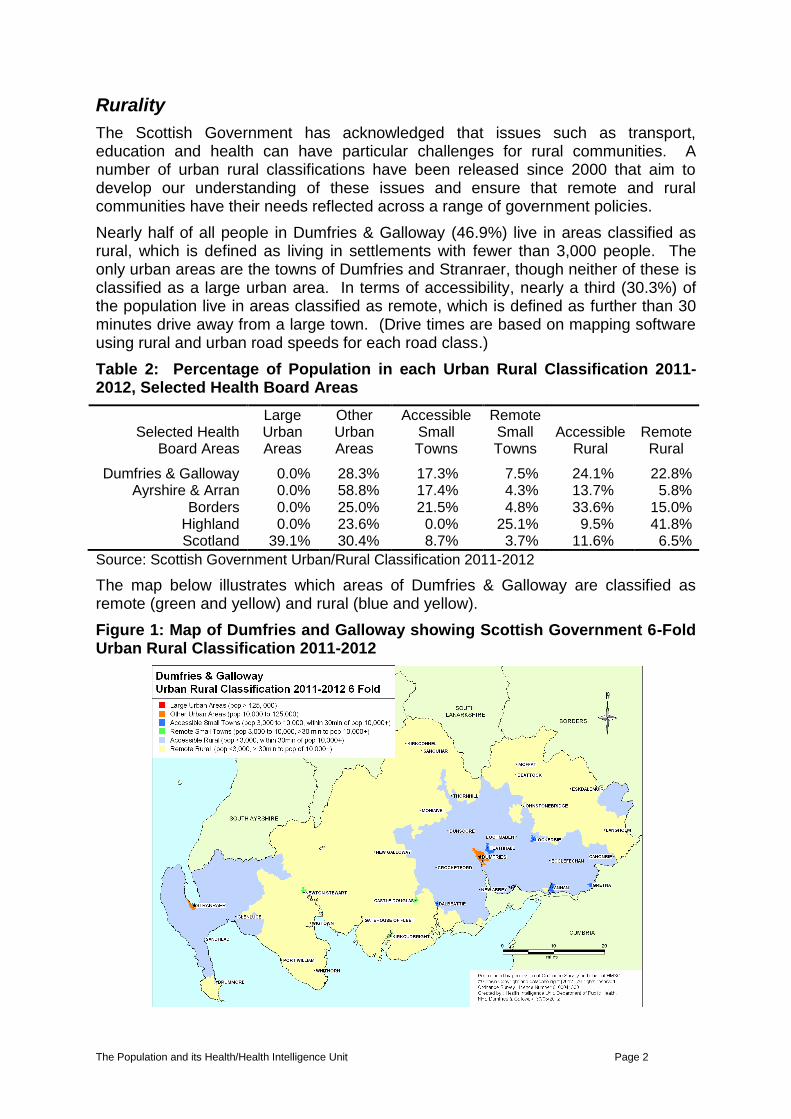
Rurality
The Scottish Government has acknowledged that issues such as transport, education and health can have particular challenges for rural communities. A number of urban rural classifications have been released since 2000 that aim to develop our understanding of these issues and ensure that remote and rural communities have their needs reflected across a range of government policies.
Nearly half of all people in Dumfries & Galloway (46.9%) live in areas classified as rural, which is defined as living in settlements with fewer than 3,000 people. The only urban areas are the towns of Dumfries and Stranraer, though neither of these is classified as a large urban area. In terms of accessibility, nearly a third (30.3%) of the population live in areas classified as remote, which is defined as further than 30 minutes drive away from a large town. (Drive times are based on mapping software using rural and urban road speeds for each road class.)
Table 2: Percentage of Population in each Urban Rural Classification 2011-2012, Selected Health Board Areas
Selected Health Board Areas
Large Urban Areas
Other Urban Areas
Accessible Small Towns
Remote Small Towns
Accessible Rural
Remote Rural
Dumfries & Galloway 0.0% 28.3% 17.3% 7.5% 24.1% 22.8% Ayrshire & Arran 0.0% 58.8% 17.4% 4.3% 13.7% 5.8%
Borders 0.0% 25.0% 21.5% 4.8% 33.6% 15.0% Highland 0.0% 23.6% 0.0% 25.1% 9.5% 41.8% Scotland 39.1% 30.4% 8.7% 3.7% 11.6% 6.5%
Source: Scottish Government Urban/Rural Classification 2011-2012
The map below illustrates which areas of Dumfries & Galloway are classified as remote (green and yellow) and rural (blue and yellow).
Figure 1: Map of Dumfries and Galloway showing Scottish Government 6-Fold Urban Rural Classification 2011-2012
The Population and its Health/Health Intelligence Unit Page 3
The Population of Dumfries & Galloway, Now and in the Future
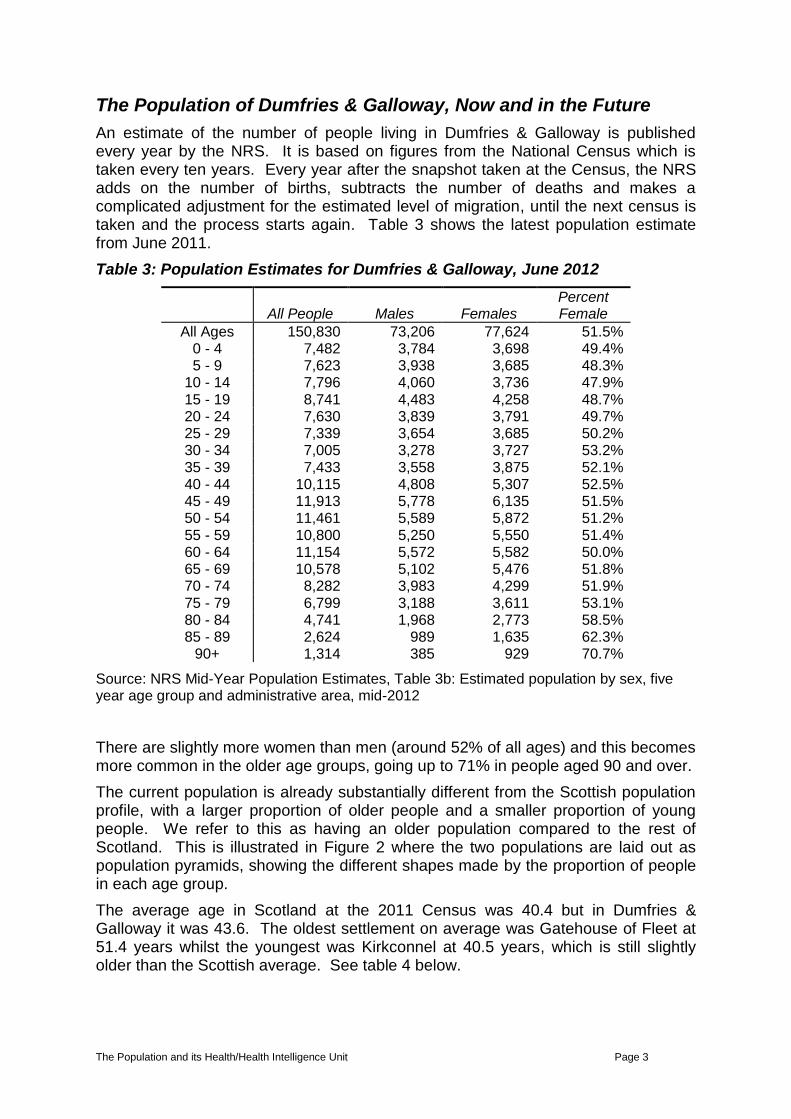
An estimate of the number of people living in Dumfries & Galloway is published every year by the NRS. It is based on figures from the National Census which is taken every ten years. Every year after the snapshot taken at the Census, the NRS adds on the number of births, subtracts the number of deaths and makes a complicated adjustment for the estimated level of migration, until the next census is taken and the process starts again. Table 3 shows the latest population estimate from June 2011.
Table 3: Population Estimates for Dumfries & Galloway, June 2012
All People Males Females
Percent Female
All Ages 150,830 73,206 77,624 51.5% 0 - 4 7,482 3,784 3,698 49.4% 5 - 9 7,623 3,938 3,685 48.3%
10 - 14 7,796 4,060 3,736 47.9% 15 - 19 8,741 4,483 4,258 48.7% 20 - 24 7,630 3,839 3,791 49.7% 25 - 29 7,339 3,654 3,685 50.2% 30 - 34 7,005 3,278 3,727 53.2% 35 - 39 7,433 3,558 3,875 52.1% 40 - 44 10,115 4,808 5,307 52.5% 45 - 49 11,913 5,778 6,135 51.5% 50 - 54 11,461 5,589 5,872 51.2% 55 - 59 10,800 5,250 5,550 51.4% 60 - 64 11,154 5,572 5,582 50.0% 65 - 69 10,578 5,102 5,476 51.8% 70 - 74 8,282 3,983 4,299 51.9% 75 - 79 6,799 3,188 3,611 53.1% 80 - 84 4,741 1,968 2,773 58.5% 85 - 89 2,624 989 1,635 62.3%
90+ 1,314 385 929 70.7%
Source: NRS Mid-Year Population Estimates, Table 3b: Estimated population by sex, five year age group and administrative area, mid-2012
There are slightly more women than men (around 52% of all ages) and this becomes more common in the older age groups, going up to 71% in people aged 90 and over.
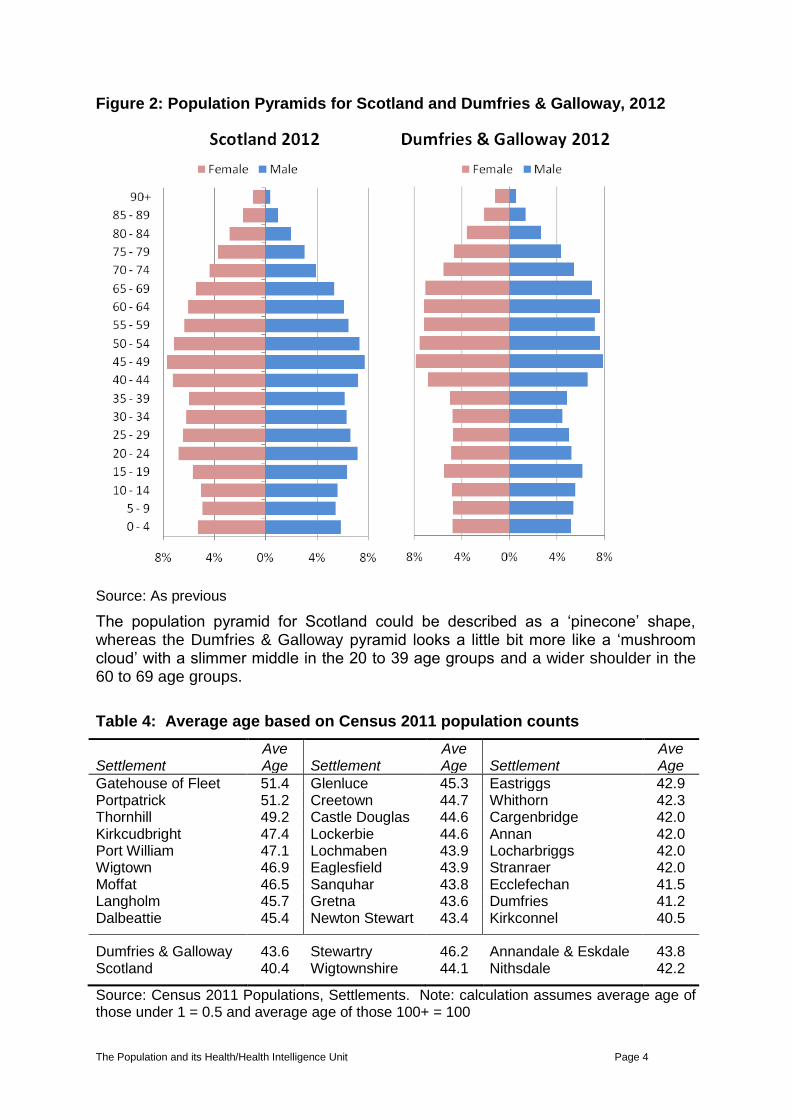
The current population is already substantially different from the Scottish population profile, with a larger proportion of older people and a smaller proportion of young people. We refer to this as having an older population compared to the rest of Scotland. This is illustrated in Figure 2 where the two populations are laid out as population pyramids, showing the different shapes made by the proportion of people in each age group.
The average age in Scotland at the 2011 Census was 40.4 but in Dumfries & Galloway it was 43.6. The oldest settlement on average was Gatehouse of Fleet at 51.4 years whilst the youngest was Kirkconnel at 40.5 years, which is still slightly older than the Scottish average. See table 4 below.
The Population and its Health/Health Intelligence Unit Page 4
Figure 2: Population Pyramids for Scotland and Dumfries & Galloway, 2012
Source: As previous
The population pyramid for Scotland could be described as a ‘pinecone’ shape, whereas the Dumfries & Galloway pyramid looks a little bit more like a ‘mushroom cloud’ with a slimmer middle in the 20 to 39 age groups and a wider shoulder in the 60 to 69 age groups.
Table 4: Average age based on Census 2011 population counts
Settlement Ave Age Settlement
Ave Age Settlement
Ave Age
Gatehouse of Fleet 51.4 Glenluce 45.3 Eastriggs 42.9 Portpatrick 51.2 Creetown 44.7 Whithorn 42.3 Thornhill 49.2 Castle Douglas 44.6 Cargenbridge 42.0 Kirkcudbright 47.4 Lockerbie 44.6 Annan 42.0 Port William 47.1 Lochmaben 43.9 Locharbriggs 42.0 Wigtown 46.9 Eaglesfield 43.9 Stranraer 42.0 Moffat 46.5 Sanquhar 43.8 Ecclefechan 41.5 Langholm 45.7 Gretna 43.6 Dumfries 41.2 Dalbeattie 45.4 Newton Stewart 43.4 Kirkconnel 40.5
Dumfries & Galloway 43.6 Stewartry 46.2 Annandale & Eskdale 43.8 Scotland 40.4 Wigtownshire 44.1 Nithsdale 42.2
Source: Census 2011 Populations, Settlements. Note: calculation assumes average age of those under 1 = 0.5 and average age of those 100+ = 100
The Population and its Health/Health Intelligence Unit Page 5
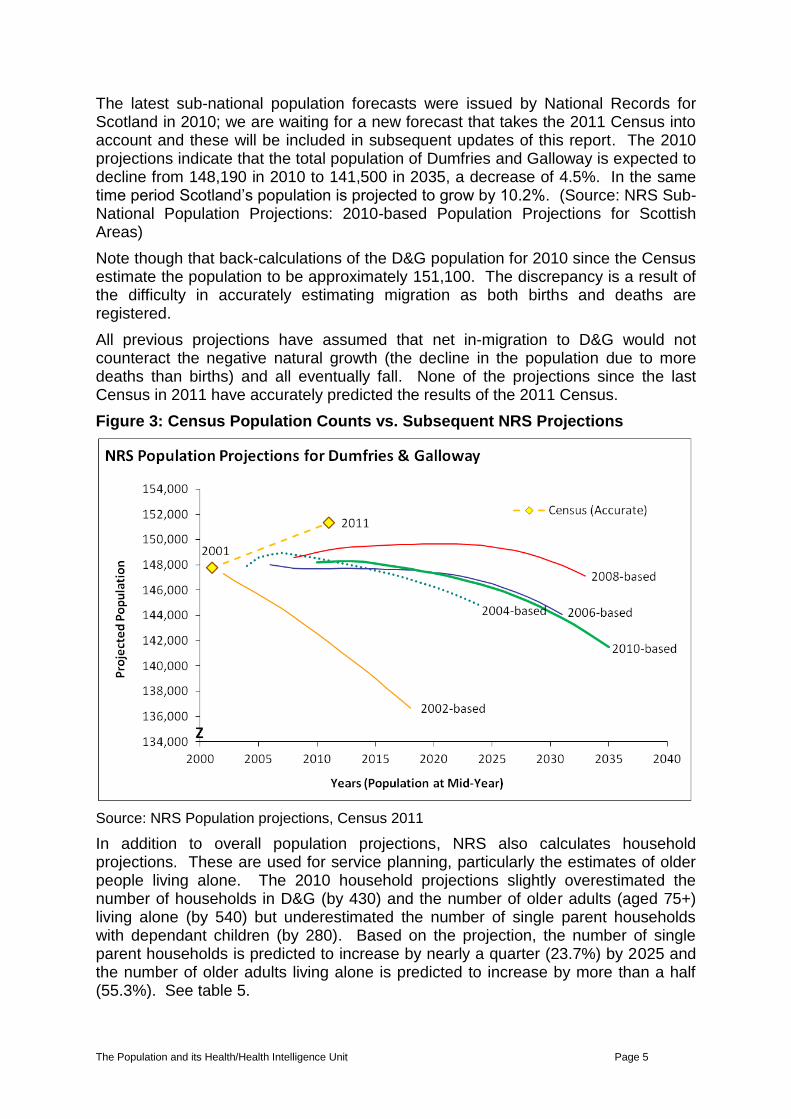
The latest sub-national population forecasts were issued by National Records for Scotland in 2010; we are waiting for a new forecast that takes the 2011 Census into account and these will be included in subsequent updates of this report. The 2010 projections indicate that the total population of Dumfries and Galloway is expected to decline from 148,190 in 2010 to 141,500 in 2035, a decrease of 4.5%. In the same time period Scotland’s population is projected to grow by 10.2%. (Source: NRS Sub-National Population Projections: 2010-based Population Projections for Scottish Areas)
Note though that back-calculations of the D&G population for 2010 since the Census estimate the population to be approximately 151,100. The discrepancy is a result of the difficulty in accurately estimating migration as both births and deaths are registered.
All previous projections have assumed that net in-migration to D&G would not counteract the negative natural growth (the decline in the population due to more deaths than births) and all eventually fall. None of the projections since the last Census in 2011 have accurately predicted the results of the 2011 Census.
Figure 3: Census Population Counts vs. Subsequent NRS Projections
Source: NRS Population projections, Census 2011
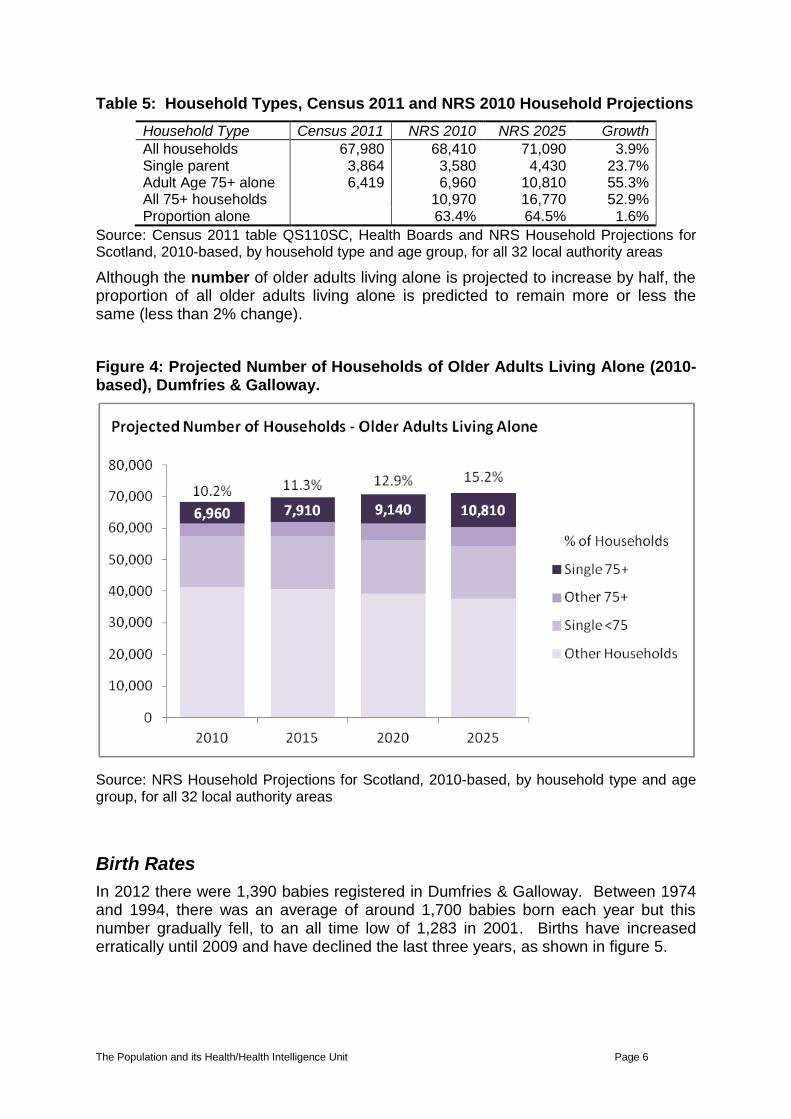
In addition to overall population projections, NRS also calculates household projections. These are used for service planning, particularly the estimates of older people living alone. The 2010 household projections slightly overestimated the number of households in D&G (by 430) and the number of older adults (aged 75+) living alone (by 540) but underestimated the number of single parent households with dependant children (by 280). Based on the projection, the number of single parent households is predicted to increase by nearly a quarter (23.7%) by 2025 and the number of older adults living alone is predicted to increase by more than a half (55.3%). See table 5.
The Population and its Health/Health Intelligence Unit Page 6
Table 5: Household Types, Census 2011 and NRS 2010 Household Projections
Household Type Census 2011 NRS 2010 NRS 2025 Growth
All households 67,980 68,410 71,090 3.9% Single parent 3,864 3,580 4,430 23.7% Adult Age 75+ alone 6,419 6,960 10,810 55.3% All 75+ households 10,970 16,770 52.9% Proportion alone 63.4% 64.5% 1.6%
Source: Census 2011 table QS110SC, Health Boards and NRS Household Projections for Scotland, 2010-based, by household type and age group, for all 32 local authority areas
Although the number of older adults living alone is projected to increase by half, the proportion of all older adults living alone is predicted to remain more or less the same (less than 2% change).
Figure 4: Projected Number of Households of Older Adults Living Alone (2010-based), Dumfries & Galloway.
Source: NRS Household Projections for Scotland, 2010-based, by household type and age group, for all 32 local authority areas
Birth Rates
In 2012 there were 1,390 babies registered in Dumfries & Galloway. Between 1974 and 1994, there was an average of around 1,700 babies born each year but this number gradually fell, to an all time low of 1,283 in 2001. Births have increased erratically until 2009 and have declined the last three years, as shown in figure 5.
The Population and its Health/Health Intelligence Unit Page 7
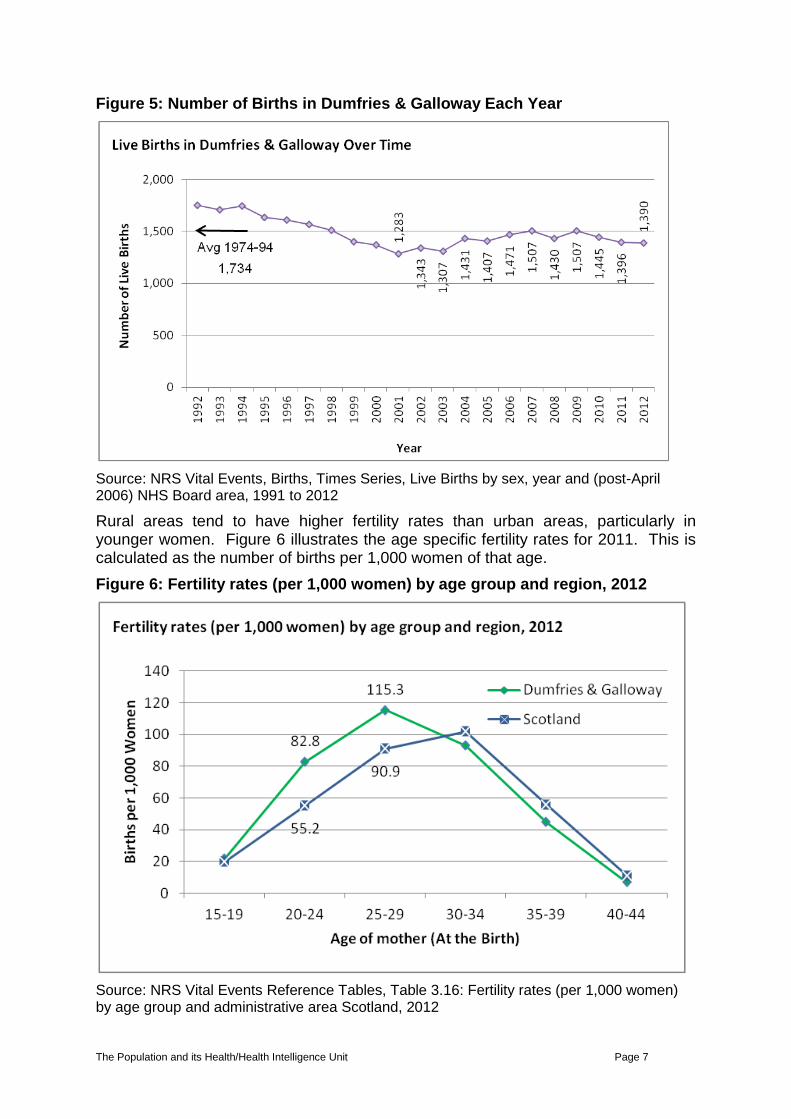
Figure 5: Number of Births in Dumfries & Galloway Each Year
Source: NRS Vital Events, Births, Times Series, Live Births by sex, year and (post-April 2006) NHS Board area, 1991 to 2012
Rural areas tend to have higher fertility rates than urban areas, particularly in younger women. Figure 6 illustrates the age specific fertility rates for 2011. This is calculated as the number of births per 1,000 women of that age.
Figure 6: Fertility rates (per 1,000 women) by age group and region, 2012
Source: NRS Vital Events Reference Tables, Table 3.16: Fertility rates (per 1,000 women) by age group and administrative area Scotland, 2012
The Population and its Health/Health Intelligence Unit Page 8
If the women of childbearing age in Dumfries & Galloway experienced throughout their childbearing years, the age-specific fertility rates from 2012, the average number of children (per woman) that would be born is 1.82; this is known as the Total Fertility Rate. The same figure for Scotland is 1.67. The replacement rate in societies with low mortality is just over 2, where adults have just enough total babies to replace themselves. The total fertility rate in most western countries has been below 2 for decades but rates have recently been rising.
Death Rates
In 2012 there were 1,829 deaths registered of people whose normal home address was in Dumfries & Galloway. If people for instance have a heart attack while visiting someone elsewhere in Scotland, but are normally resident in Dumfries & Galloway, their details are returned back to where they normally live.
For a long time the three most common causes of death in Scotland were cancer, heart disease and stroke, and they were dubbed the "big three". In 1996 the big three accounted for 60.9% of all deaths in Scotland (36,946 people). The death rates for these illnesses have been coming down and this is partly because fewer people are smoking and also because of better preventative treatments like statin medications. In 2012, the big three accounted for 50.7% of all deaths in Scotland (27,880 people). Source: NRS Vital Events Reference Tables, Table 6.5: Deaths by frequency of cause by sex, numbers and percentages, Scotland, 1986 to 2012
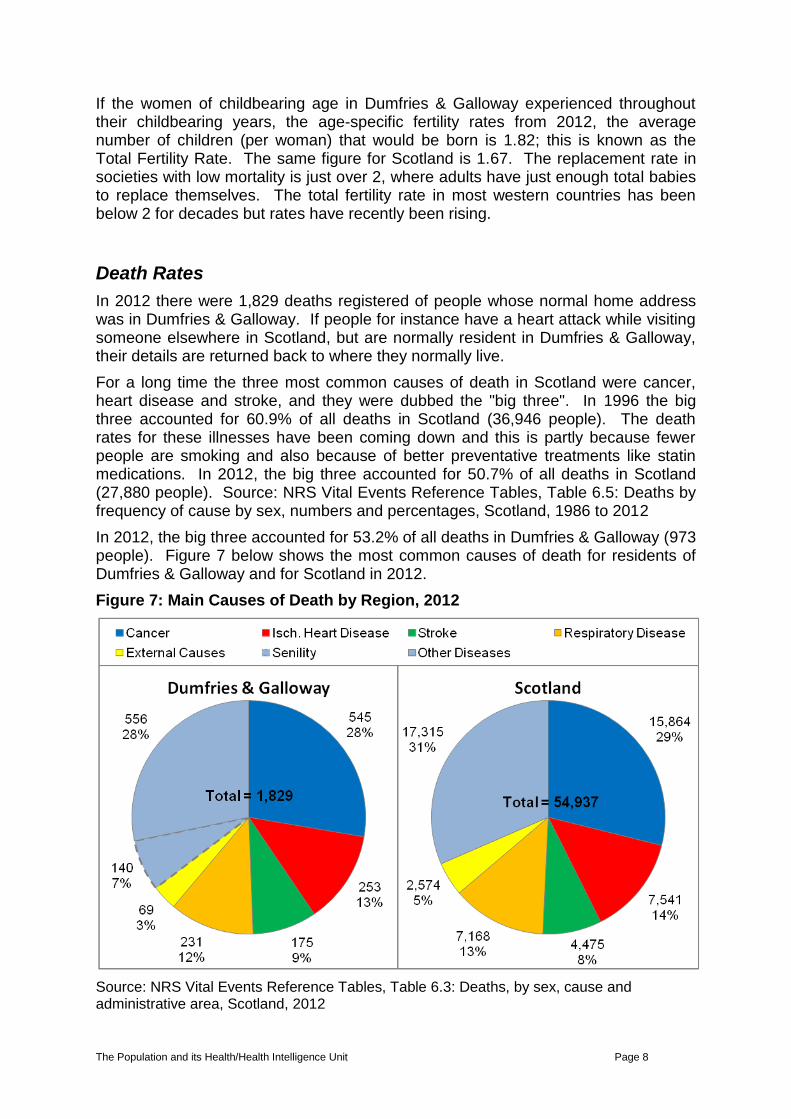
In 2012, the big three accounted for 53.2% of all deaths in Dumfries & Galloway (973 people). Figure 7 below shows the most common causes of death for residents of Dumfries & Galloway and for Scotland in 2012.
Figure 7: Main Causes of Death by Region, 2012
Source: NRS Vital Events Reference Tables, Table 6.3: Deaths, by sex, cause and administrative area, Scotland, 2012

The Population and its Health/Health Intelligence Unit Page 9
Also illustrated in figure 7 is the number of deaths attributed to senility and other organic mental disorders. These have been calculated from locally available data using a slightly different way of grouping the ICD10 (international classification of disease) death codes called CCS groups (clinical classifications software 2003 - group 68). Deaths attributed to senility are in the same order of magnitude as those attributed to stroke. Equivalent figures are not readily available for Scotland.
Pre-mature mortality - defined as death from all causes, in people aged under 75 - is an important indicator of the overall health of the population. Scotland has the highest rates of pre-mature mortality in the UK, as well as significant inequalities in pre-mature mortality within Scotland. Between 2006 and 2012, death rates amongst those aged under 75 years have decreased by 15.0% in Dumfries & Galloway and 16.0% across Scotland. Despite all Health Boards seeing similar decreases, around 20,400 people aged under 75 still die each year across Scotland.
Figure 8: Age Standardised Premature (Under 75’s) Death Rates for Cancer, Circulatory Disease and Respiratory Disease, Dumfries and Galloway, 2006-12
Source: NRS Age-standardised death rates, and numbers of deaths, for certain causes, people aged under 75, NHS Board areas, 2006 to 2012
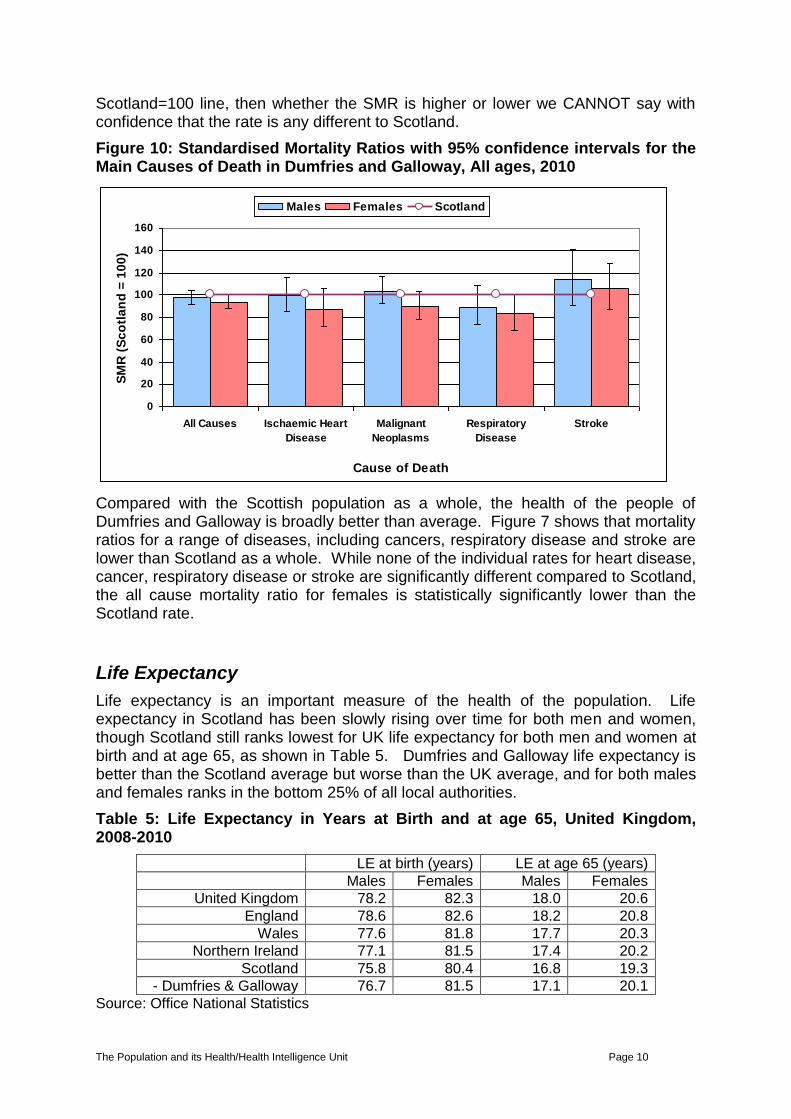
Standardised mortality ratios (SMRs) are used to compare local death rates with death rates in Scotland as a whole, taking account of the different population structure of each area. Scotland is given a SMR of 100. Where ratios are less than 100 it means there are fewer deaths locally than in Scotland, and where ratios are greater than 100 there are more deaths than in Scotland. We show these figures with 95% confidence intervals, which are a measure of the reliability of the calculation. Where the whole of the confidence interval bars are below (or above) 100, we can feel confident that the SMR is statistically significantly lower (or higher) than the Scottish rate. However, if the confidence interval bars intersect with the
The Population and its Health/Health Intelligence Unit Page 10
Scotland=100 line, then whether the SMR is higher or lower we CANNOT say with confidence that the rate is any different to Scotland.
Figure 10: Standardised Mortality Ratios with 95% confidence intervals for the Main Causes of Death in Dumfries and Galloway, All ages, 2010
Compared with the Scottish population as a whole, the health of the people of Dumfries and Galloway is broadly better than average. Figure 7 shows that mortality ratios for a range of diseases, including cancers, respiratory disease and stroke are lower than Scotland as a whole. While none of the individual rates for heart disease, cancer, respiratory disease or stroke are significantly different compared to Scotland, the all cause mortality ratio for females is statistically significantly lower than the Scotland rate.
Life Expectancy
Life expectancy is an important measure of the health of the population. Life expectancy in Scotland has been slowly rising over time for both men and women, though Scotland still ranks lowest for UK life expectancy for both men and women at birth and at age 65, as shown in Table 5. Dumfries and Galloway life expectancy is better than the Scotland average but worse than the UK average, and for both males and females ranks in the bottom 25% of all local authorities.
Table 5: Life Expectancy in Years at Birth and at age 65, United Kingdom, 2008-2010
LE at birth (years) LE at age 65 (years)
Males Females Males Females
United Kingdom 78.2 82.3 18.0 20.6
England 78.6 82.6 18.2 20.8
Wales 77.6 81.8 17.7 20.3
Northern Ireland 77.1 81.5 17.4 20.2
Scotland 75.8 80.4 16.8 19.3
- Dumfries & Galloway 76.7 81.5 17.1 20.1
Source: Office National Statistics
0
20
40
60
80
100
120
140
160
All Causes Ischaemic Heart
Disease
Malignant
Neoplasms
Respiratory
Disease
Stroke
Cause of Death
SM
R (
Sc
otl
an
d =
10
0)
Males Females Scotland
The Population and its Health/Health Intelligence Unit Page 11
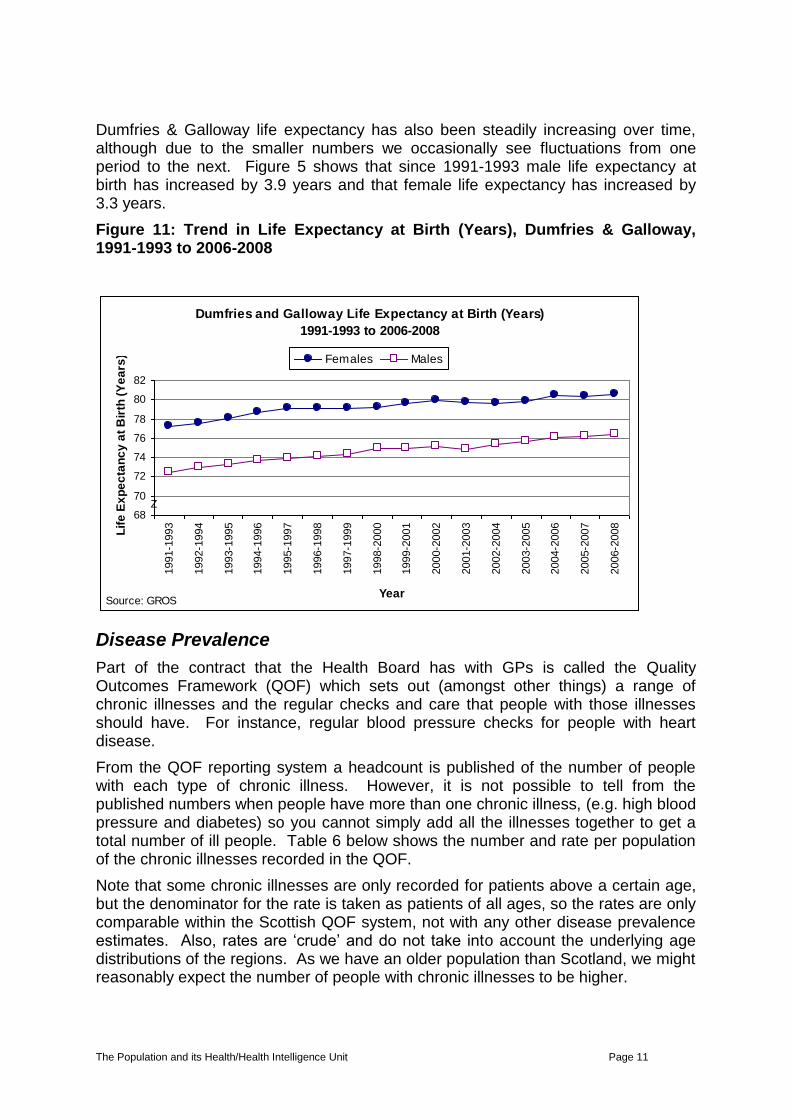
Dumfries & Galloway life expectancy has also been steadily increasing over time, although due to the smaller numbers we occasionally see fluctuations from one period to the next. Figure 5 shows that since 1991-1993 male life expectancy at birth has increased by 3.9 years and that female life expectancy has increased by 3.3 years.
Figure 11: Trend in Life Expectancy at Birth (Years), Dumfries & Galloway, 1991-1993 to 2006-2008
Disease Prevalence
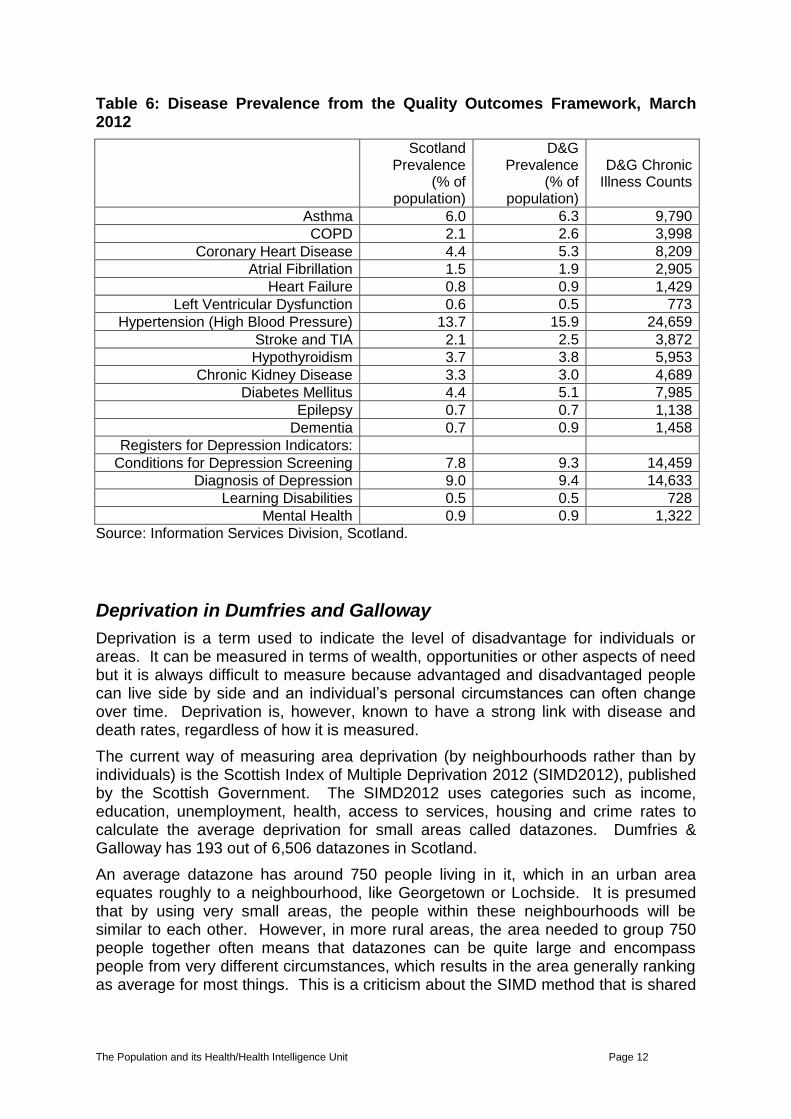
Part of the contract that the Health Board has with GPs is called the Quality Outcomes Framework (QOF) which sets out (amongst other things) a range of chronic illnesses and the regular checks and care that people with those illnesses should have. For instance, regular blood pressure checks for people with heart disease.
From the QOF reporting system a headcount is published of the number of people with each type of chronic illness. However, it is not possible to tell from the published numbers when people have more than one chronic illness, (e.g. high blood pressure and diabetes) so you cannot simply add all the illnesses together to get a total number of ill people. Table 6 below shows the number and rate per population of the chronic illnesses recorded in the QOF.
Note that some chronic illnesses are only recorded for patients above a certain age, but the denominator for the rate is taken as patients of all ages, so the rates are only comparable within the Scottish QOF system, not with any other disease prevalence estimates. Also, rates are ‘crude’ and do not take into account the underlying age distributions of the regions. As we have an older population than Scotland, we might reasonably expect the number of people with chronic illnesses to be higher.
Dumfries and Galloway Life Expectancy at Birth (Years)
1991-1993 to 2006-2008
68
70
72
74
76
78
80
82
1991-1
993
1992-1
994
1993-1
995
1994-1
996
1995-1
997
1996-1
998
1997-1
999
1998-2
000
1999-2
001
2000-2
002
2001-2
003
2002-2
004
2003-2
005
2004-2
006
2005-2
007
2006-2
008
Year
Lif
e E
xp
ec
tan
cy
at
Bir
th (
Ye
ars
) Females Males
Source: GROS
Z
The Population and its Health/Health Intelligence Unit Page 12
Table 6: Disease Prevalence from the Quality Outcomes Framework, March 2012
Scotland Prevalence
(% of population)
D&G Prevalence
(% of population)
D&G Chronic Illness Counts
Asthma 6.0 6.3 9,790
COPD 2.1 2.6 3,998
Coronary Heart Disease 4.4 5.3 8,209
Atrial Fibrillation 1.5 1.9 2,905
Heart Failure 0.8 0.9 1,429
Left Ventricular Dysfunction 0.6 0.5 773
Hypertension (High Blood Pressure) 13.7 15.9 24,659
Stroke and TIA 2.1 2.5 3,872
Hypothyroidism 3.7 3.8 5,953
Chronic Kidney Disease 3.3 3.0 4,689
Diabetes Mellitus 4.4 5.1 7,985
Epilepsy 0.7 0.7 1,138
Dementia 0.7 0.9 1,458
Registers for Depression Indicators:
Conditions for Depression Screening 7.8 9.3 14,459
Diagnosis of Depression 9.0 9.4 14,633
Learning Disabilities 0.5 0.5 728
Mental Health 0.9 0.9 1,322
Source: Information Services Division, Scotland.
Deprivation in Dumfries and Galloway
Deprivation is a term used to indicate the level of disadvantage for individuals or areas. It can be measured in terms of wealth, opportunities or other aspects of need but it is always difficult to measure because advantaged and disadvantaged people can live side by side and an individual’s personal circumstances can often change over time. Deprivation is, however, known to have a strong link with disease and death rates, regardless of how it is measured.
The current way of measuring area deprivation (by neighbourhoods rather than by individuals) is the Scottish Index of Multiple Deprivation 2012 (SIMD2012), published by the Scottish Government. The SIMD2012 uses categories such as income, education, unemployment, health, access to services, housing and crime rates to calculate the average deprivation for small areas called datazones. Dumfries & Galloway has 193 out of 6,506 datazones in Scotland.
An average datazone has around 750 people living in it, which in an urban area equates roughly to a neighbourhood, like Georgetown or Lochside. It is presumed that by using very small areas, the people within these neighbourhoods will be similar to each other. However, in more rural areas, the area needed to group 750 people together often means that datazones can be quite large and encompass people from very different circumstances, which results in the area generally ranking as average for most things. This is a criticism about the SIMD method that is shared
The Population and its Health/Health Intelligence Unit Page 13
by all rural areas, and the Government are looking into how they might improve the measurement of deprivation in rural areas.
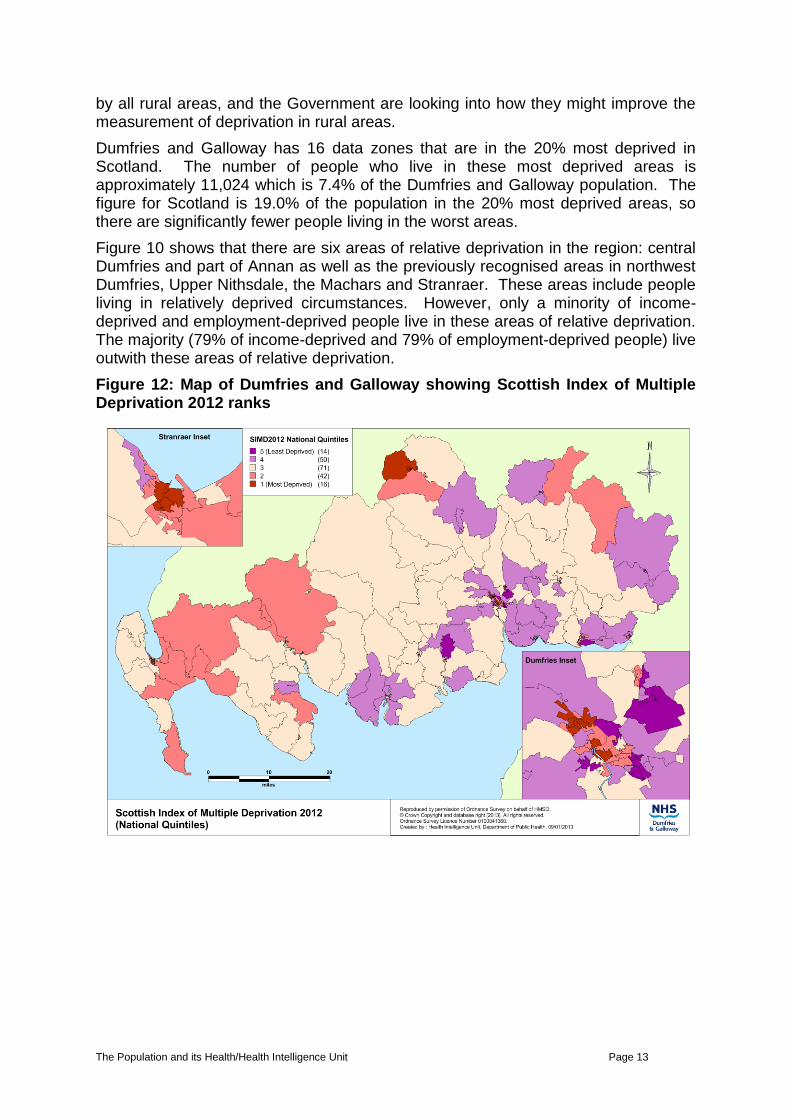
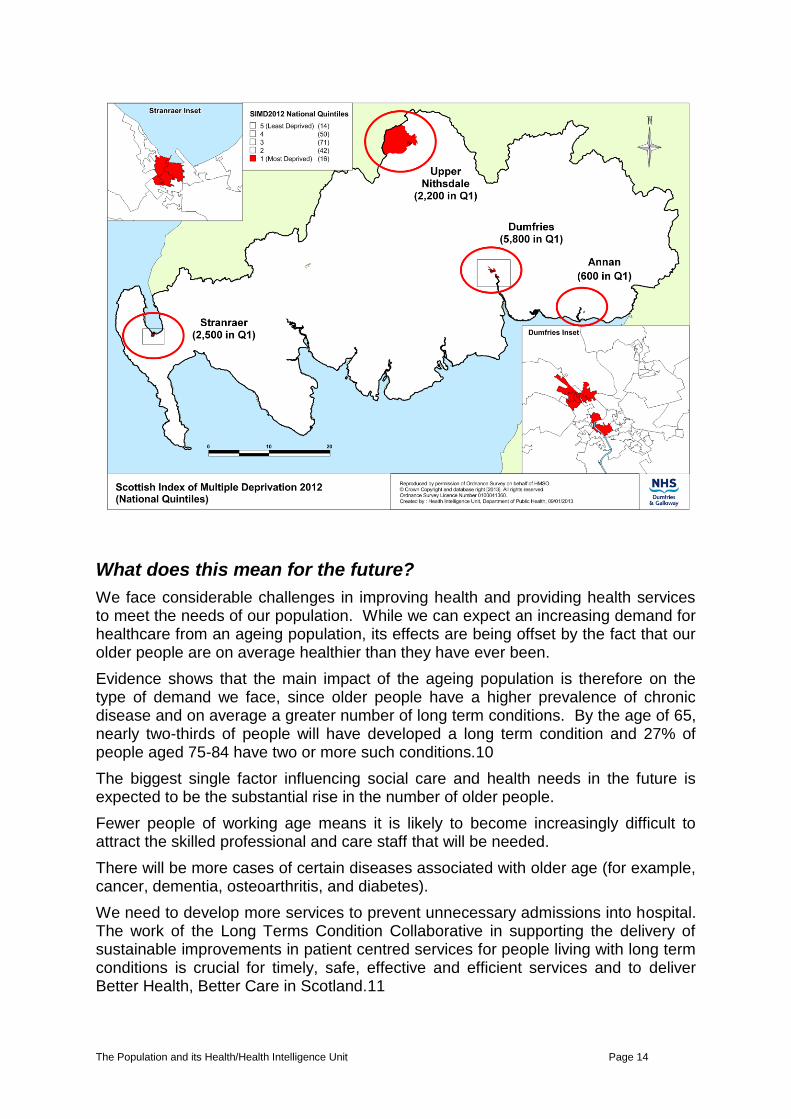
Dumfries and Galloway has 16 data zones that are in the 20% most deprived in Scotland. The number of people who live in these most deprived areas is approximately 11,024 which is 7.4% of the Dumfries and Galloway population. The figure for Scotland is 19.0% of the population in the 20% most deprived areas, so there are significantly fewer people living in the worst areas.
Figure 10 shows that there are six areas of relative deprivation in the region: central Dumfries and part of Annan as well as the previously recognised areas in northwest Dumfries, Upper Nithsdale, the Machars and Stranraer. These areas include people living in relatively deprived circumstances. However, only a minority of income-deprived and employment-deprived people live in these areas of relative deprivation. The majority (79% of income-deprived and 79% of employment-deprived people) live outwith these areas of relative deprivation.
Figure 12: Map of Dumfries and Galloway showing Scottish Index of Multiple Deprivation 2012 ranks
The Population and its Health/Health Intelligence Unit Page 14
What does this mean for the future?
We face considerable challenges in improving health and providing health services to meet the needs of our population. While we can expect an increasing demand for healthcare from an ageing population, its effects are being offset by the fact that our older people are on average healthier than they have ever been.
Evidence shows that the main impact of the ageing population is therefore on the type of demand we face, since older people have a higher prevalence of chronic disease and on average a greater number of long term conditions. By the age of 65, nearly two-thirds of people will have developed a long term condition and 27% of people aged 75-84 have two or more such conditions.10
The biggest single factor influencing social care and health needs in the future is expected to be the substantial rise in the number of older people.
Fewer people of working age means it is likely to become increasingly difficult to attract the skilled professional and care staff that will be needed.
There will be more cases of certain diseases associated with older age (for example, cancer, dementia, osteoarthritis, and diabetes).
We need to develop more services to prevent unnecessary admissions into hospital. The work of the Long Terms Condition Collaborative in supporting the delivery of sustainable improvements in patient centred services for people living with long term conditions is crucial for timely, safe, effective and efficient services and to deliver Better Health, Better Care in Scotland.11
The Population and its Health/Health Intelligence Unit Page 15
We also need to continue to tackle other lifestyle factors, including smoking, diet, physical activity, alcohol and drug use, in order to help prevent disease and disability in older people, so that as people live longer they do so in good health
We need to tackle specific health issues, such as continuing to improve the death rates for cancer and stroke towards the United Kingdom and European average.
Web Resources
National Records of Scotland. http://www.nrscotland.gov.uk/ General Register Office for Scotland http://www.gro-scotland.gov.uk/index.html Information Services Division. Information and Statistics http://www.isdscotland.org/Health-Topics/General-Practice/Quality-And-Outcomes-Framework/ General Register Office for Scotland. Population Projections Scotland (2008-based): Population projections by sex, age and administrative area [online]. GROS; 2010. Available from http://www.gro-scotland.gov.uk/statistics/publications-and-data/popproj/2008-based-pop-proj-scottish-areas/index.html [last accessed 23.02.2010] General Register Office for Scotland. Household Projections for Scotland (2008-based) [online]. Edinburgh: GROS; 2010. Available from http://www.gro-scotland.gov.uk/statistics/publications-and-data/household-projections-statistics/hproj-08-based/tables.html [last accessed 20.07.2010] Office for National Statistics. Life expectancy at birth and at age 65 by local areas in the United Kingdom. [online]. London: ONS; 2010. Available from http://www.statistics.gov.uk/statbase/Product.asp?vlnk=8841 [last accessed 18.11.2009] General Register Office for Scotland. Vital Events Reference Tables 2010. [online]. Available from www.gro-scotland.gov.uk/statistics/theme/vital-events/general/ref-tables/2010/index.html [last accessed 18.08.2011] Information Services Division. Information and Statistics. [online]. Available from http://www.isdscotland.org/isd/3347.html [last accessed 18.08.2011] Scottish Government. Urban Rural Classification 2009-2010. [online]. Edinburgh: Scottish Government; 2010. Available from http://www.scotland.gov.uk/Publications/2010/08/2010UR [last accessed 18.10.2010] Scottish Government. Scottish Index of Multiple Deprivation. [online]. Edinburgh: Scottish Government; 2009. Available from http://www.scotland.gov.uk/Topics/Statistics/SIMD/ [last accessed 22.02.2010] Scottish Government. Improving the Health & Wellbeing of People with Long Term Conditions in Scotland: A National Action Plan. [online]. Scottish Government: 2009. Available from http://www.sehd.scot.nhs.uk/mels/CEL2009_23.pdf [last accessed 18.11.2009] Scottish Government. Better Health, Better Care: Action Plan. [online]. Scottish Government: 2007. Available from http://www.scotland.gov.uk/Publications/2007/12/11103453/0 [last accessed 18.11.2009]