Embed Size (px)
Citation preview

DU Strategic Issues Program
December 16, 2010
Colorado PERA’s Mission StatementTo promote long-term financial security for our membership while maintaining the stability of the fund.
www.copera.org l 303-832-9550 l 1-800-759-PERA (7372) l 1301 Pennsylvania Street, Denver

0
50,000
100,000
150,000
200,000
250,000
Total: 472,436
PERA MembershipOctober 31, 2010
State School Local Gov't Judicial DPS Total
Benefit Recipients 32,204 49,728 4,996 291 6,265 93,484
Active Members 57,517 120,121 17,264 314 13,819 209,035
Inactive Members 58,763 92,537 17,133 12 1,472 169,917
2

PERA Financial Recap
3

Colorado PERA Without DC plansIn billions
Beginning Balance January 1, 1985 $4.5
Employer Contributions 11.8
Member and other contributions 11.9
Investment Income 35.9
Benefit and refund payments (30.7)
Administrative Expenses (0.5)
Ending Balance December 31, 2009 $32.9

Investment Asset AllocationDecember 14, 2010
Global Stocks59.5%
Alternative Investments
8.4%
Cash & Short Term1.0%
Fixed Income22.2%
Real Estate6.8%
Opportunity Fund2.1%
$37.7 Billion Market Value
5

PERA Assets vs. Liabilities Market Value as of December 31 for each year
19911992
19931994
19951996
19971998
19992000
20012002
20032004
20052006
20072008
2009$0.0
$10.0
$20.0
$30.0
$40.0
$50.0
$60.0
Assets Liabilities
In B
illi
on
s
6

School Division Actuarial Projection
December 31, 2009, Valuation Results 7
10 11 12 13 14 15 16 17 18 19 20 21 22 23 24 25 26 27 28 29 30 31 32 33 34 35 36 37 38 39 40
Pessimistic Return (6.50%)
0.692303872959287
0.648573329608519
0.590834677131216
0.593076506464711
0.582863560965863
0.573355176087003
0.564185222511081
0.555407952365016
0.546676484632772
0.538052162566062
0.528920992437281
0.519167824215043
0.508983515553383
0.498413575490918
0.487463237285267
0.47617488009646
0.464388838057628
0.452296616618143
0.439982050267245
0.427480695830334
0.414871612448256
0.402034483803738
0.389311325699151
0.376844491309642
0.364773887681627
0.353232587119747
0.3421498016342
0.332046558311695
0.323230414402768
0.31599367505116
0.310600182654632
Expected Return (8.00%)
0.692303872959287
0.650697712662632
0.597760544649386
0.607264301503083
0.606628706345326
0.607032422550005
0.608155800702652
0.610090839182676
0.612539718944421
0.615609957181929
0.618738222428745
0.621889375114924
0.625277729252664
0.629001379654929
0.633124792300316
0.63775604690738
0.642868865250701
0.648684565541545
0.655367665946459
0.663044274274819
0.671887278699463
0.681980040682099
0.693670801259945
0.707197851913314
0.722808433559169
0.740762547431099
0.76127373113704
0.784798170381617
0.811700894350566
0.842354456085313
0.877119706783627
Optimistic Return (9.50%)
0.692303872959287
0.652907417419061
0.604838516769332
0.621814262774354
0.631189511259954
0.642244453759287
0.654736331837529
0.668829144523157
0.684313476882508
0.701387111417136
0.719587312133886
0.739019236207647
0.759980839808745
0.782693275320475
0.807359492747687
0.83424205575793
0.863562108049553
0.89567379843102
0.930947007603542
0.969738236845081
1.01246856199149
1.05963219274246
1.07939654334744
1.10106604297425
1.12469982689852
1.15036491058981
1.17824851806122
1.20845887356889
1.24114465487734
1.27646514839194
1.31459045578675
2008 Projection
0.637010107525961
0.568113965078657
0.501791853668141
0.492429260991696
0.482832769560567
0.472229247023601
0.460308745055406
0.447033178846613
0.432335858278294
0.416147472179161
0.398399135530075
0.379026099052709
0.357942730314066
0.335039817350984
0.310172510432163
0.283206722068659
0.253986399218917
0.222357847096294
0.188120135914922
0.151038822086802
0.110893063581764
0.067457531423800
6
0.020510069072095
7
0 0 0 0 0 0 0 0
10%
30%
50%
70%
90%
110%
130%
Pessimistic Return (6.50%) Expected Return (8.00%) Optimistic Return (9.50%) 2008 Projection
Year Beginning
Fu
nd
ed
R
atio
%

Senate Bill 10-001Shared Sacrifices
Modifies annual increase or “COLA” Increases member/employer contribution rates Increases retirement age (Rule of 90 with minimum
age 60 for new hires in 2017) Includes funding corridor between 90 percent and
103 percent Actuaries state that projections show full funding
achieved under current assumptions
8

PERA’s Economic Engine
$3 billion in benefits paid annually 93,000 retirees – 90 percent Colorado residents 2.7 percent of the State’s wage income 20,000 jobs created $2,885 average monthly benefit paid $186 million in State and local tax receipts
$315 million in Colorado investments One in 13 Coloradans is a PERA member
9
Source: Pacey Economics Group

Benefit Recipients in ColoradoDecember 31, 2009 –72,998
Moffat194
Rio Blanco154
Garfield552
Mesa2,926
Delta702
Montrose794
San Miguel46
Dolores33
Montezuma457 La Plata
916
San Juan
8
Ouray70
Routt244
Jackson31
Larimer5,638
Weld3,877
Logan540
Sedgwick69
Phillips77
Morgan590
Washington105
Yuma220
Adams4,058
Arapahoe6,319
Kit Carson157
Cheyenne39
Kiowa39
Prowers317
Bent97
Baca96
Las Animas457
Lincoln126
Elbert276
El Paso8,884
Pueblo5,286
Otero514
Crowley85
Grand223
Boulder4,800
Eagle202
Pitkin86
Gunnison280
Saguache72
Archuleta136
Conejos225
Costilla91
Huerfano210
Custer111
Alamosa431
Rio Grande294
Mineral16
Hinsdale10
Fremont1,574
Park192
Teller367
Douglas2,360
Chaffee577
Lake111
Summ
it
170
Clear Creek175
Gilpin 64
Je
ffe
rso
n8
,961
Broomfield739
Denver5,209
10

PERA Recipient Payments as a Percentage of Wage Income
Metro Denver: 1.9%
Northern Colorado:
4.9%
Eastern Colorado: 8.8%
Pueblo/Southern Mountains:
13.5%
Southwest Mountain:
4.7%
Western Colorado: 4.7% Mountain:
2.1%
San Luis Valley: 11.6%
Colorado Springs:
3.5%
11
State of Colorado Total: 2.7%
Source: Pacey Economics Group, 2008 data
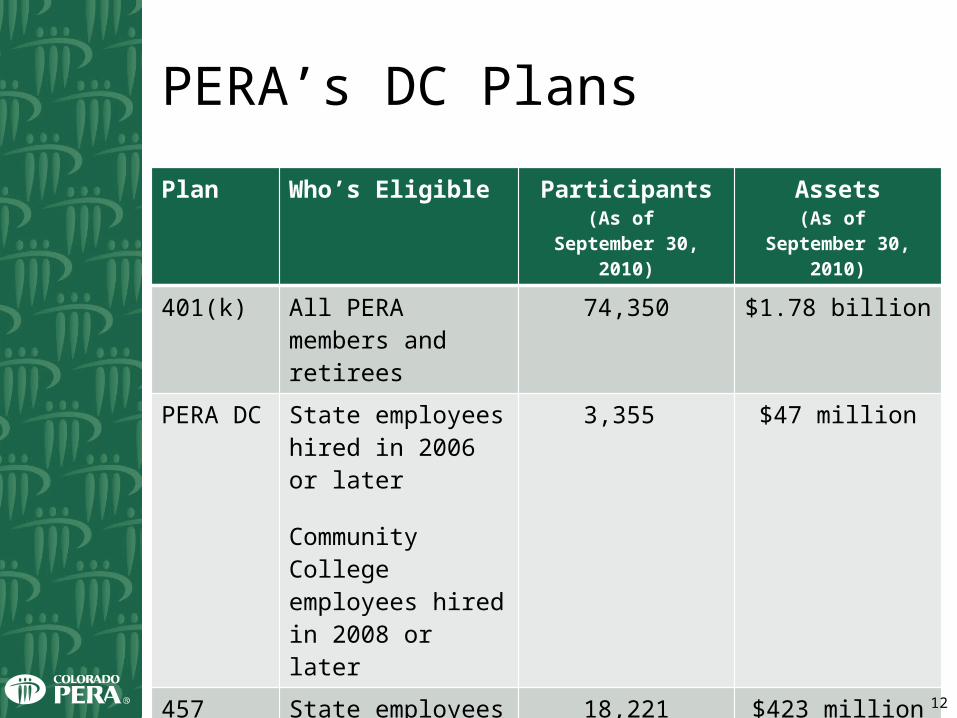
PERA’s DC Plans
Plan Who’s Eligible Participants(As of
September 30, 2010)
Assets(As of
September 30, 2010)
401(k) All PERA members and retirees
74,350 $1.78 billion
PERA DC State employees hired in 2006 or later
Community College employees hired in 2008 or later
3,355 $47 million
457 State employees and employees in some school districts
18,221 $423 million
12