Embed Size (px)
Citation preview
71 =
___
TECHNICAL REPORT 8203
0"jw TREATMENT OF PESTICIDE-LADEN WASTEWATERS FROMARMYf PEST CONTROL FACILITIES BY ACTIVATED CARBONI FILTRATION USING THE CARBOLATOR TREATMENT SYSTEM
WILLIAM H. DENNIS, JR., Sc.D.ALAN B. ROSENCRANCETHERESA M. TRYBUSCLARENCE W.R. WADE, Ph.D.EDMUND A. KOBYLINSKI, CPT, MSC
[IS ARMY MEDICAL BIOENGINEERING RESEARCH and DEVELOPMENT LABORATORYFort DetrickFredeick, MD 2171)
AUGUST 1983
DTICMAR 0 1 198
Approved for public release; $ L C 4distribution unlimited
lU US ARMY MEDICAL RESEARCH and DEVELOPMENT COMMANDI __ Fort DetrickLi..Frederick, MD 21701
84 03 01 "0172
REPRODUCTION QUALITY NOTICE
This document is the best quality available. The copy furnishedto DTIC contained pages that may have the following qualityproblems:
* Pages smailer or larger than normal.
* Pages with background color or light colored printing.
- Pages with smail type or poor printing; and or
* Pages with continuous tone material or colorphotographs.
Due to various output media available these conditions may ormay not cause poor legibility in the microfiche or hardcopy outputyou receive.
7 If this block is checked, the copy furnished to DTICcontained pages with color printing, that when reproduced inBlack and White, may change detail of the original copy.
This document containsblank pages that were S
not filmed
NOTICE
Disclaimer
The findings in thin report are not to be construed as an official
Department of the Army positiod unless so designated by other authorized
documents.
Disposition
Destroy this report when it is no longer needed. Do not return it to the
originator.
, [
!
UNCLASSIFIEDSEUIYCLASSIFICATION OF THIS PAGE (Whi.n Doe Et..ered)
REPORT DOCUMENTATION PAGE READ fINSTRUC'TIONSI. REPOR~T NUMBER 2. GOVT ACCESSION No. 3. RECIPIENT*S CATALOG N4UMBER
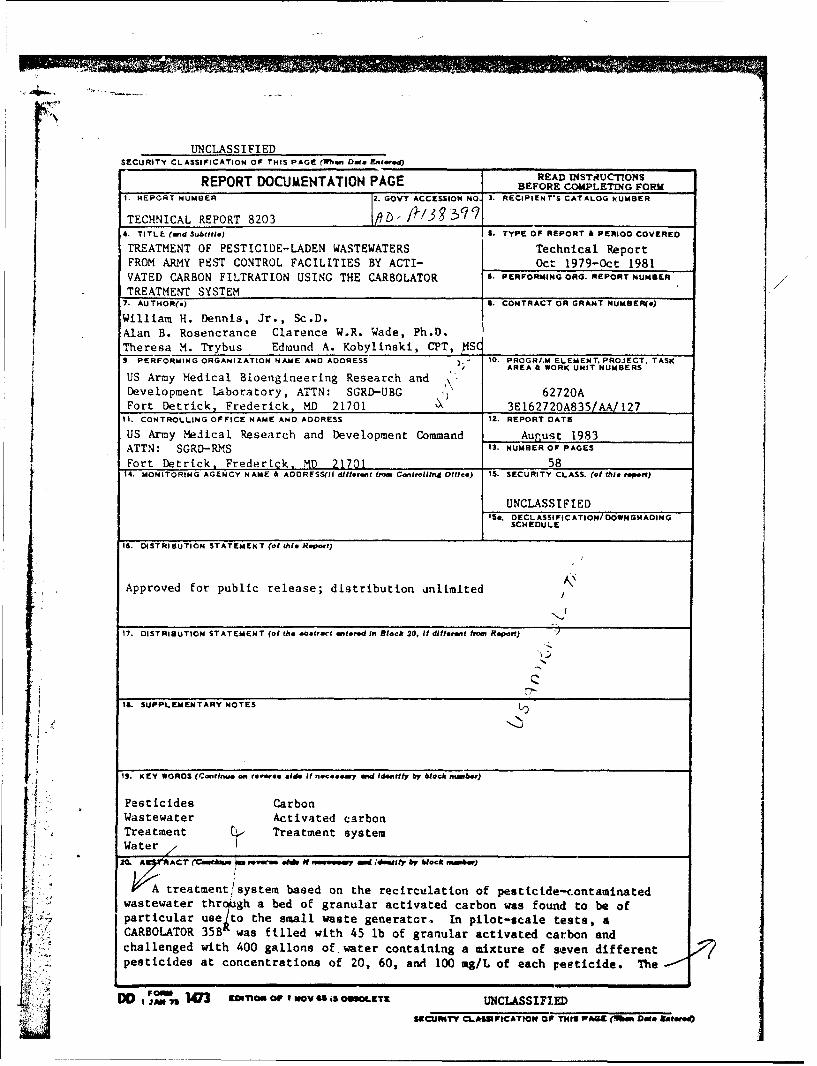
TECHNICAL REPORT 8203 9D/ 3"'394. TITLE (and Subtitle) S. TYPE OF REPORT & PERIOD COVERED
TREATMENT OF PESTICIDE-LADEN WASTEWATERS Technical ReportFROM ARMY PEST CONTROL FACILITIES BY ACTI- Oct 1979-Oct 1981VATED CARBON FILTRATION USING THE CARBOL.ATOR 6. PERFORMING ORG. REPORT NUMBER
TREATMENT SYSTEM_______________7. AUTHOR(.) 4. CONTRACT OR GRANT NUMBER(*)
William H. Dennis, Jr., Sc.D.___________________________
Alan B. Rosencrance Clarence W.R. Wade, Ph.D.Theresa M. Trybus Edraund A. Kobylinski, CPT, S_____________9. PERFORMING ORGANIZATION NAME ANO ADORESS 10 RG/M ELEMENT. PROJECT, TASK
US Army Medical Bloengineering Research andARA&OKUINMBSDevelopment Laboratory, ATTN: SGRD-UBG 270Fort Detrick, Frederick, MD 21701 3E162720A835/A 12711. CONTROLLING OFFICE NAME AND ADDRESS12REOTDE
US Army Medical Research and Development Command August 1983ATTN: SGRD-RMS1.NUBROPAEFort Detrick, Frederick, MD 2701514. MONITORING AGENCY NAME & AODRESS(If ditffe,,t fh Con~trolit"n Office) IS. SECURITY CLASS. (of thi. report)
UNCLASSIFIED1S.. DECL ASSI FICATION/ DOWN GRADING
SCH EDULE
15. DISTRIBUTION STATEMENGT (of this. Report)
Approved for public release; distribution unlimited
17. DISTRI13UTION STATEMENT (of the .OeIraet en~tered in Block 20, If different ftoe. Report) j
14. SUPPI.EMIENTARY NOTESI-
19. KEY WORDS (ronitnue on tre..re aide It necessay wid Identify by block flmuber)
Pesticides CarbonWastewater Activated carbonTreatment Treatment systemWater
120.. A! ACT(Cont~e reerve, eodd N awrovey ad.4ew~itr by black member)
tre:atment system based on the recirculation of pest tcide--contaminatedwastewater thrT gh a bed of granular activated carbon was found to be ofparticular Use t o the small waste generator. In pilot-scale tests, a)CARBOLATOR 35B was filled with 45 lb of granular activated carbon andchallenged with 400 gallons of water containing a mixture of seven differentpesticides at concentrations of 20, 60, and 100 mg/I. of each yeeticide. The
4 W43 aminisNFiwvaisocaDD I~ JAN Nv65. 0L UNCLASSIFIED
SECIUmTY ML*I0FICATION OF THIS PAGZ (%amo Dete 8afaede
UNCLASSIFIEDSECURITY CLASSIFICATION Of THIS PAGOE(Wham Data EaMfeie)
20. Abstract (continued)
, decltine in pesticide concentration was exponential with pesticides showingvarying affinity for the carbon. Following successful pilot runs, two"successful field tests were made with the system using pesticide-Ladenwastewater from a pest control facilty at Fort Eustis, VA.
/V
I/
UNqCLASSIFIE
, , gumY I I~RW~~. I I I-
77.
TABLE OF CONTENTS
BACKGROUND ................................................................... 5
OBJECTIVE ..................................................................... 8
METHODS AND MATERIALS ........................................................ 8
Description and Operation of the CARBOLATOR 35B Carbon FiltrationSystem ................................................................... 8Evaluation of Activated Carbons for Diazinon Adsorption .................. 10Synthetic Pesticide-Laden Wastewater .................................... 12Gas Chromatographic Analysis of Water for Pesticides .................... 13On-Site Analysis of WastewaterE by Thin-Layer Chromatography ............ 13Experimental Procedure for Laboratory-Scale Simulation of theCARBOLATOR .............................................................. 17
RESULTS ...................................................................... 20
Full-Scale Taboratory Tests of the CARBOLATOR 35B ........................ 20Testing of the CARBOLATOR 35B at Fort Eustis, VA ........................ 24Results ot Laboratory-Simulation of CARBOLATOR .......................... 27Capacity of Calgon F-300 for Pesticide Adsorption ....................... 32Leach Testing of the Pesticide-Contaminated Carbon ...................... 32
DISCUSSION ..................... ............................................ 36
CONCLUSIONS AND RECOMMENDATIONS ............................................. 38
DISTRIBUTION LIST ........................................................... 57
APPENDIXES
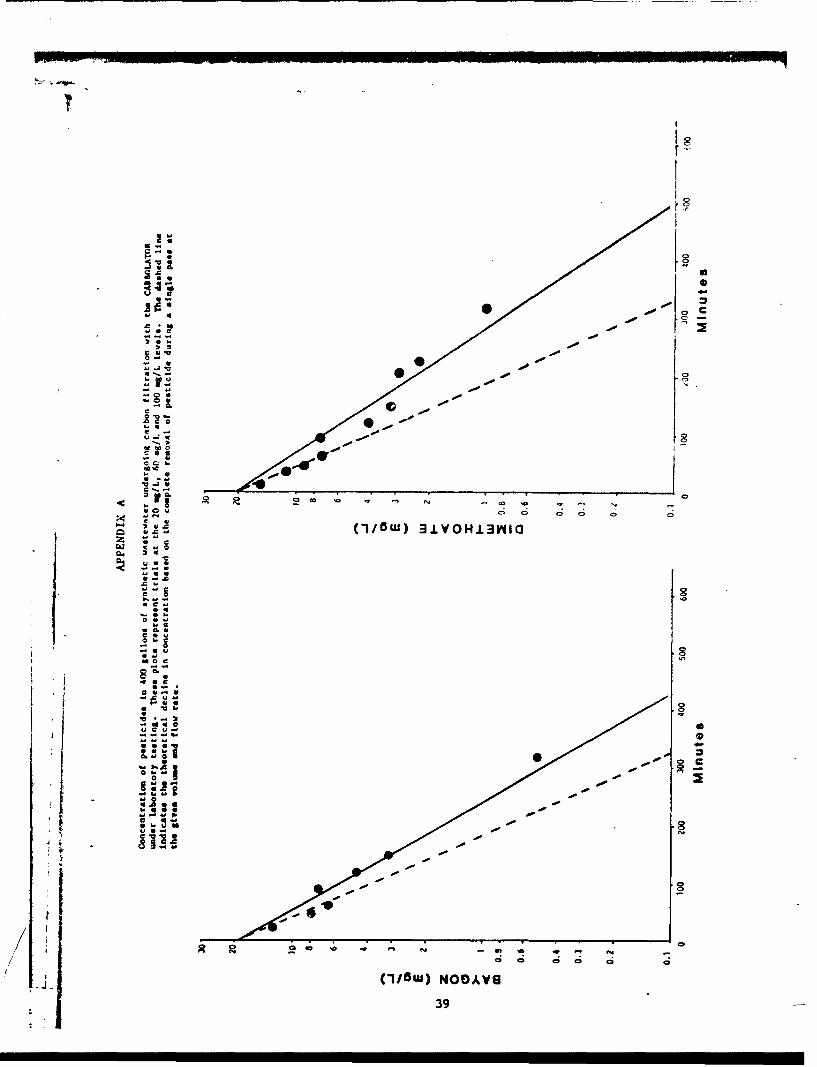
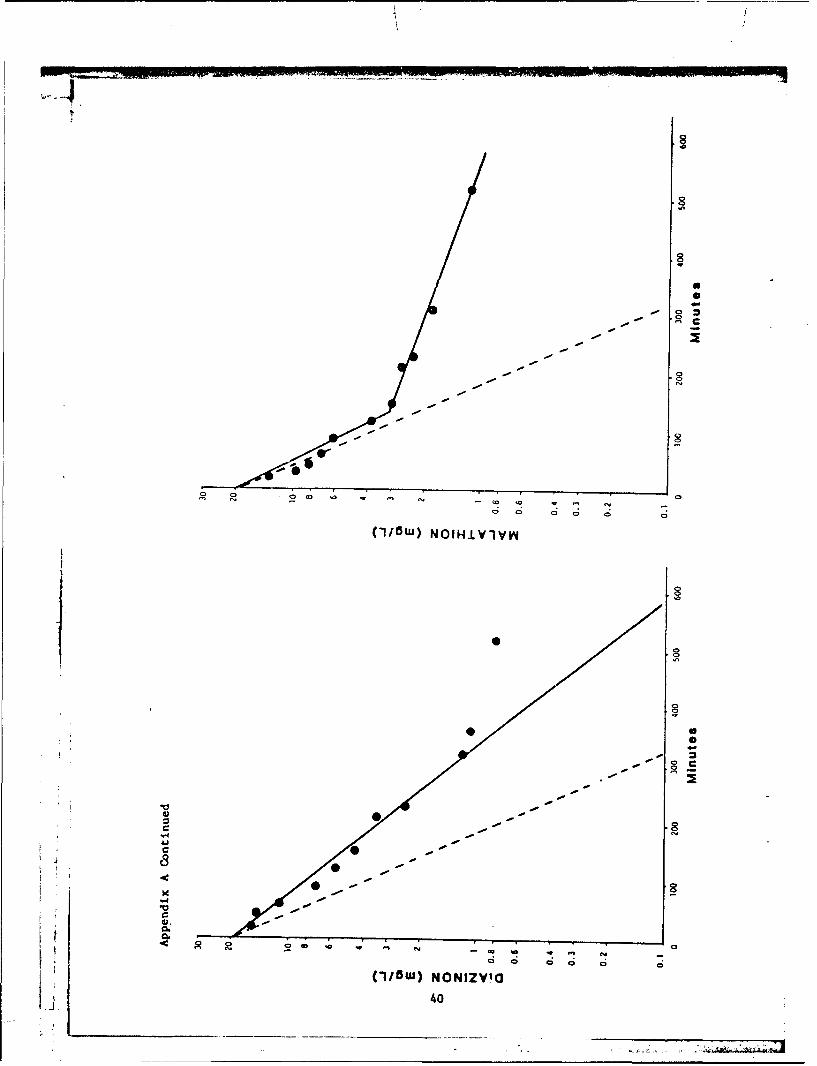
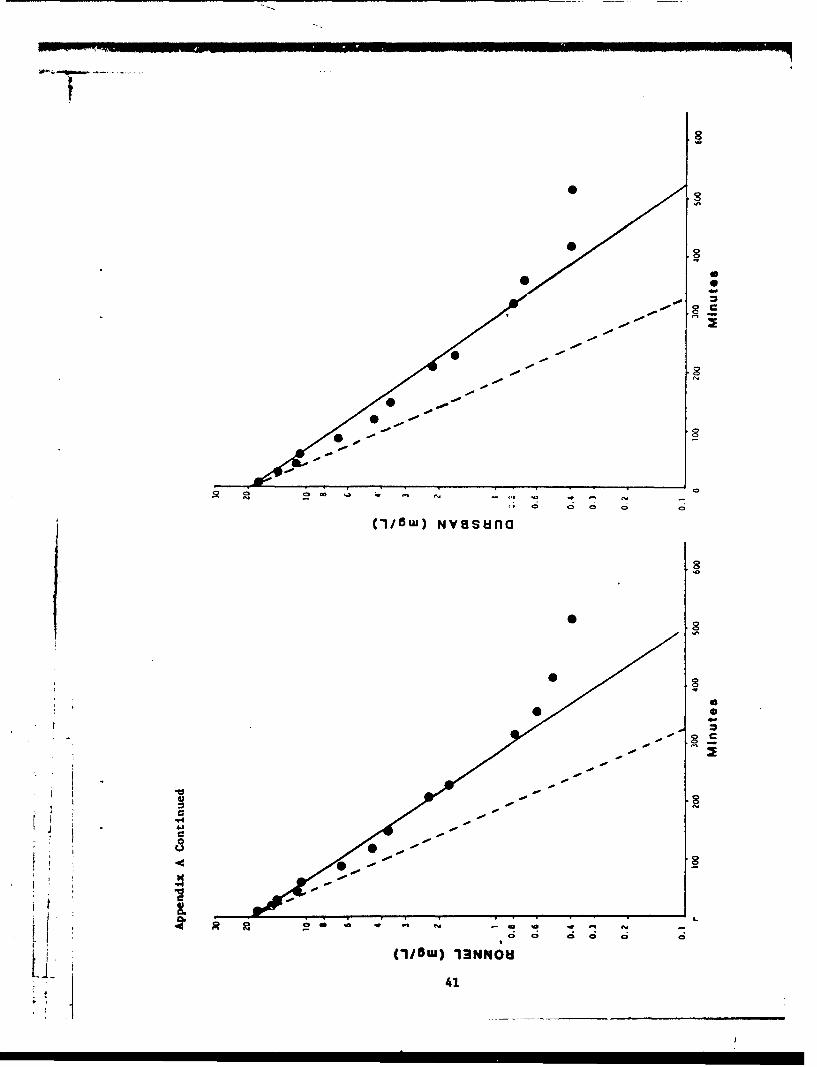
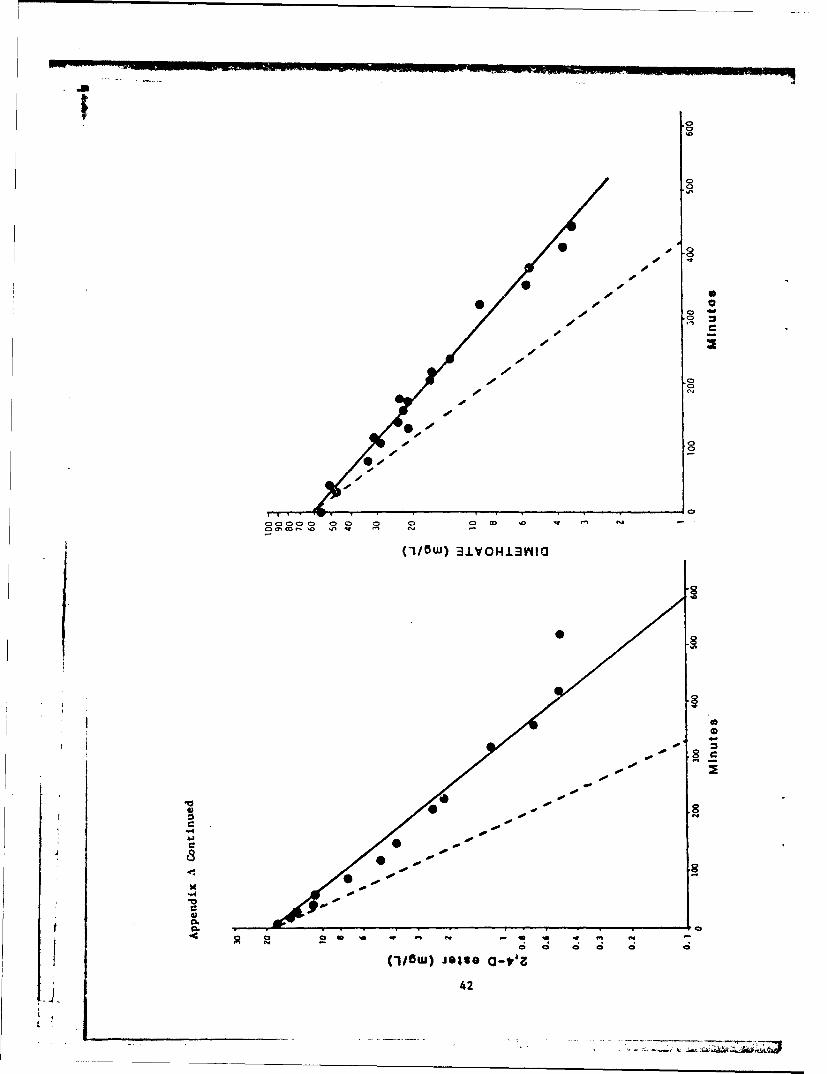
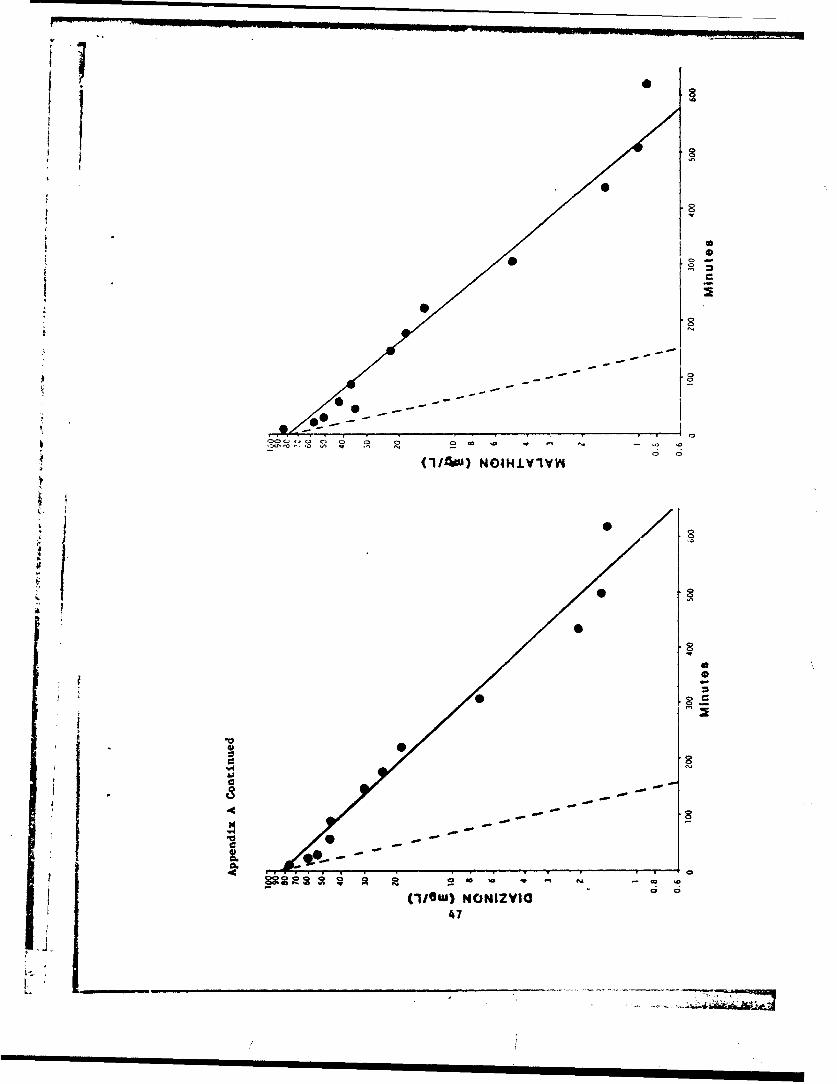
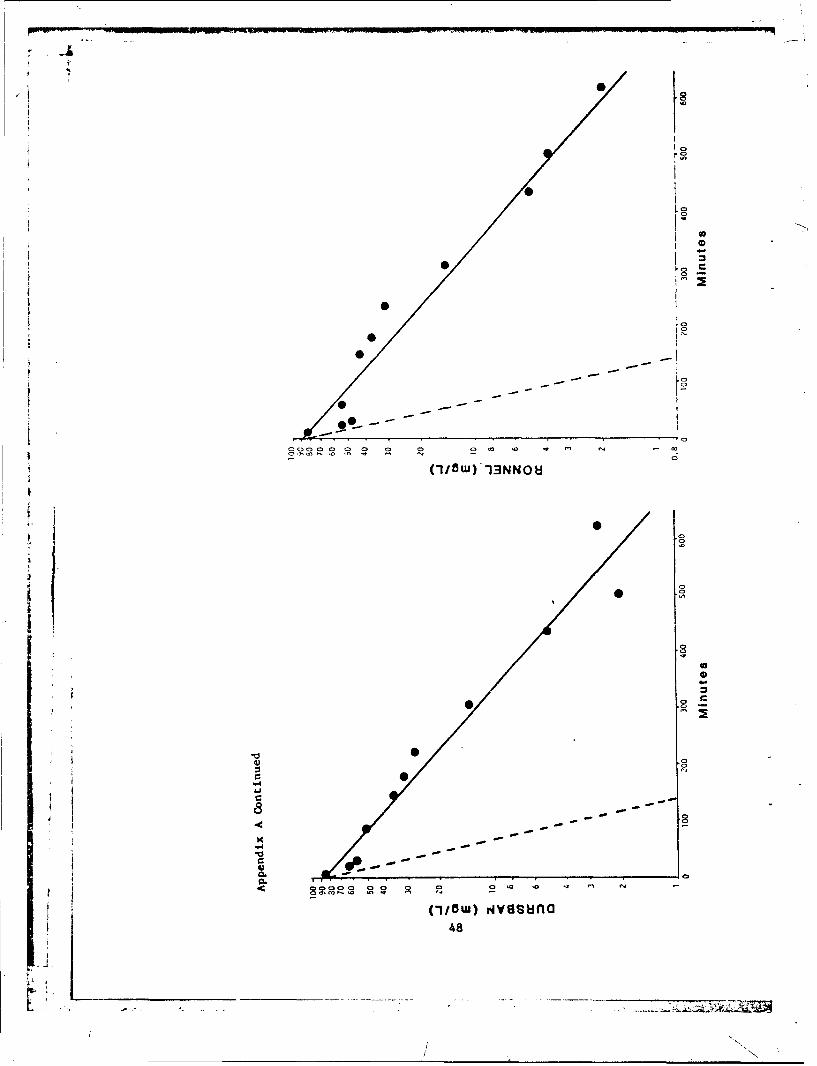
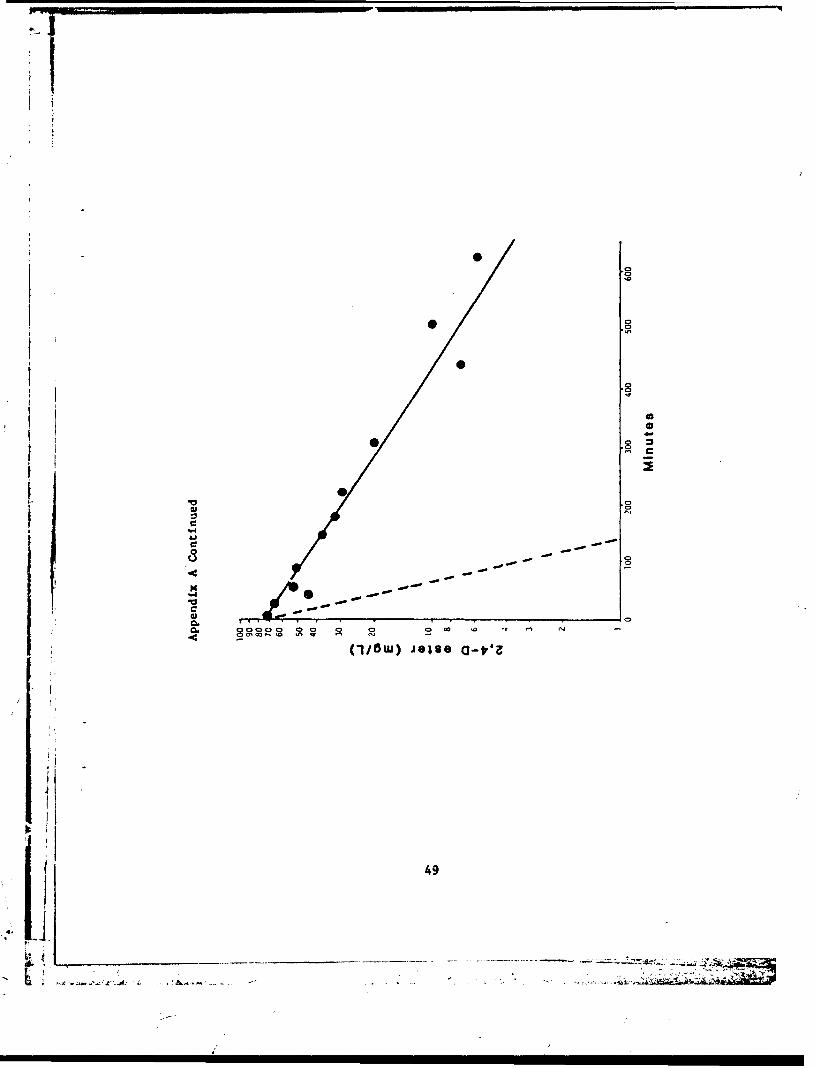
A. Concentration of Pesticides in 400 Gallons of Synthetic WastewaterUndergoing Carbon Filtration with the CARBOLATOR under LaboratoryTesting .................................................................. 39
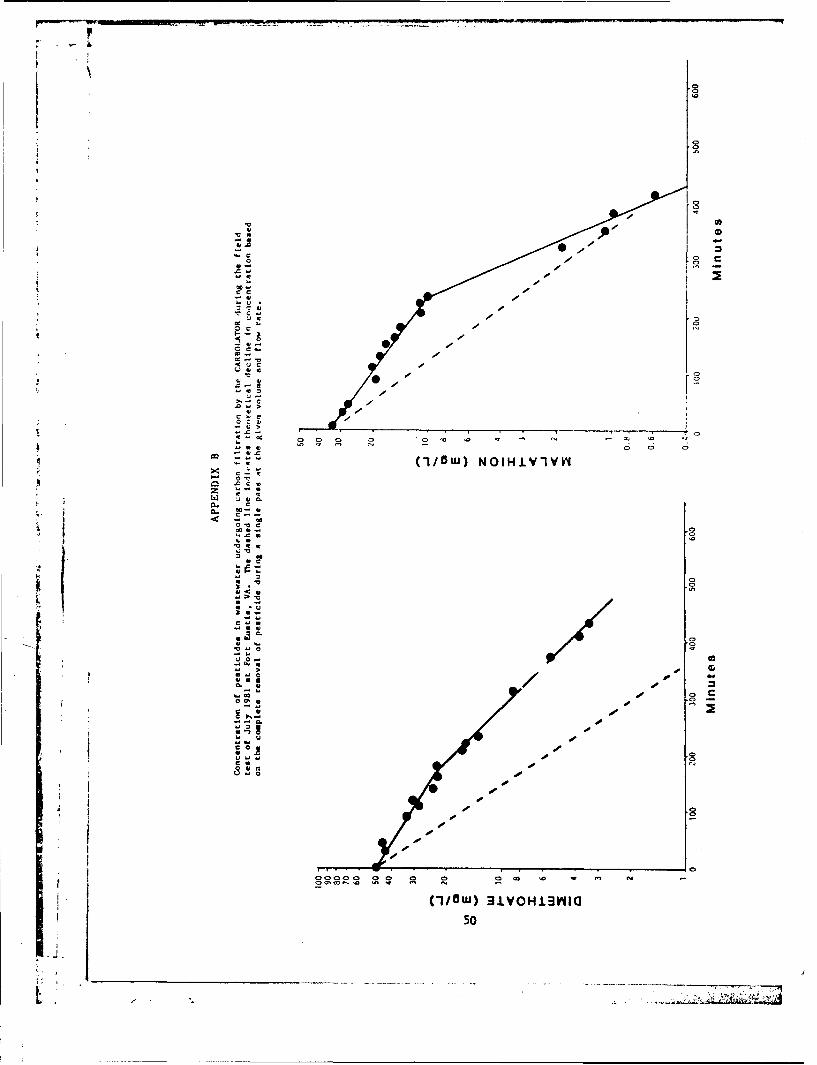
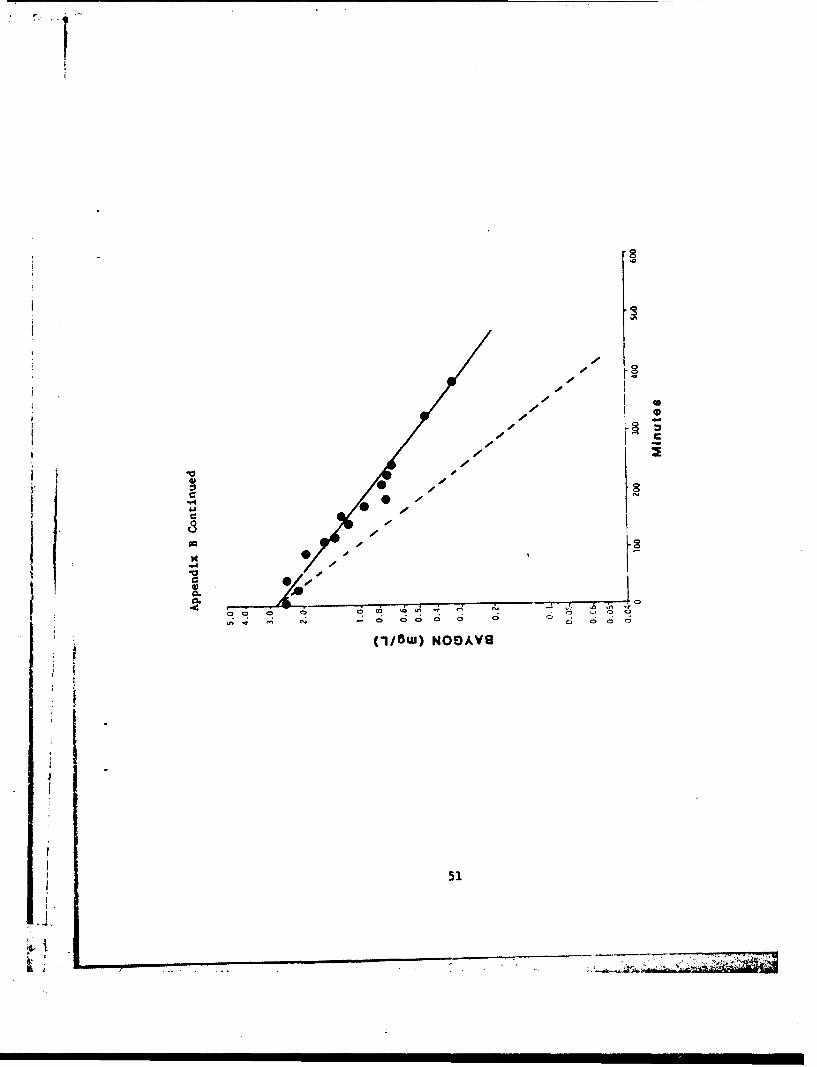
B. Concentration of Pesticides in Wastewater Undergoing Carbon Filtrationby the CARBOLATOR During the Field Test of July 1981 atFort Eustis, VA ........................ 0..........0.. 0.. 0..0...... .0 .0.0.0..50
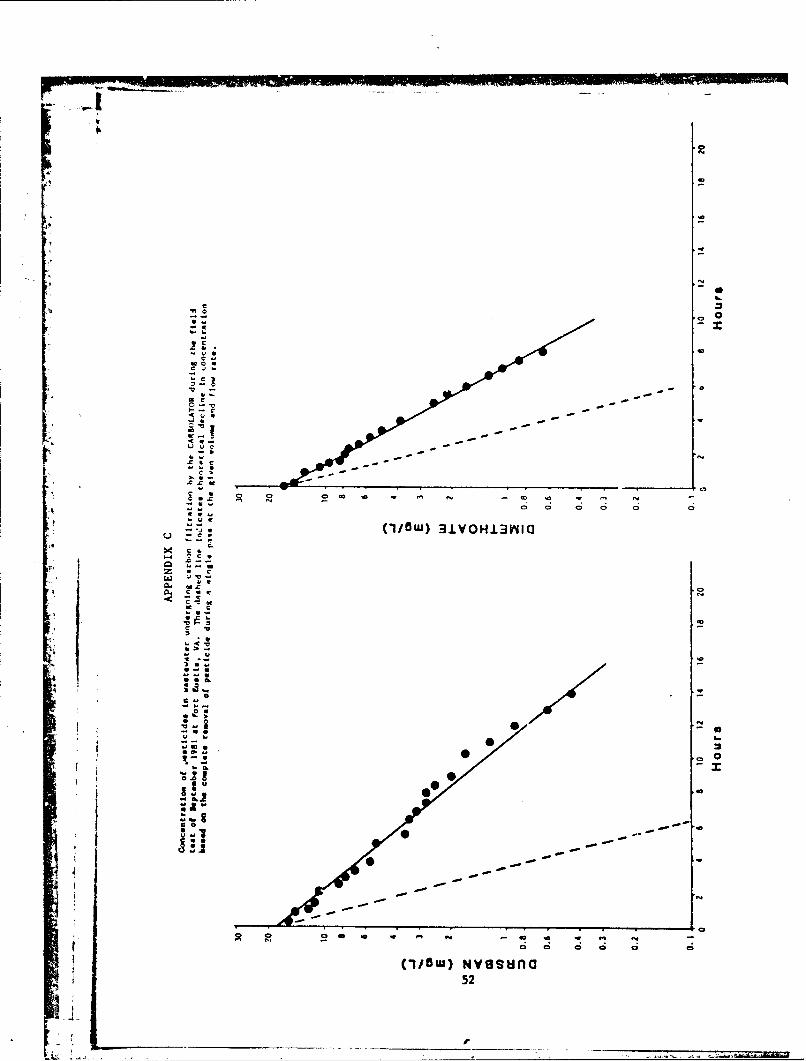
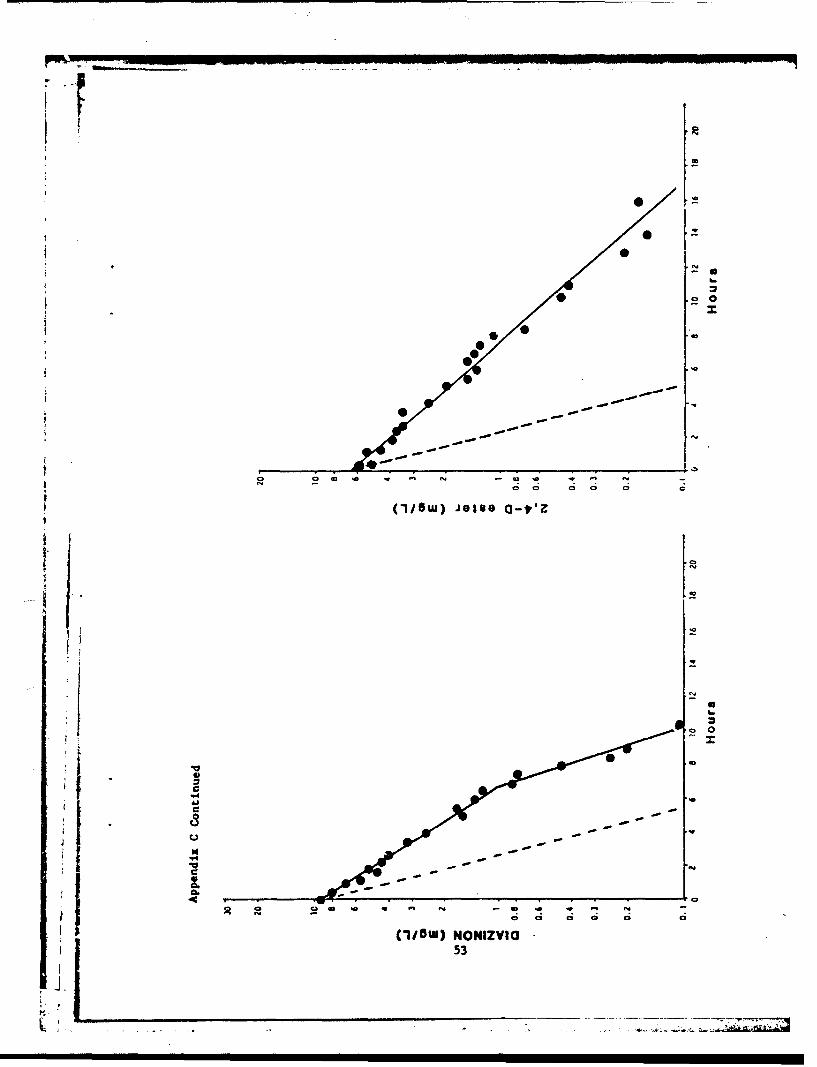
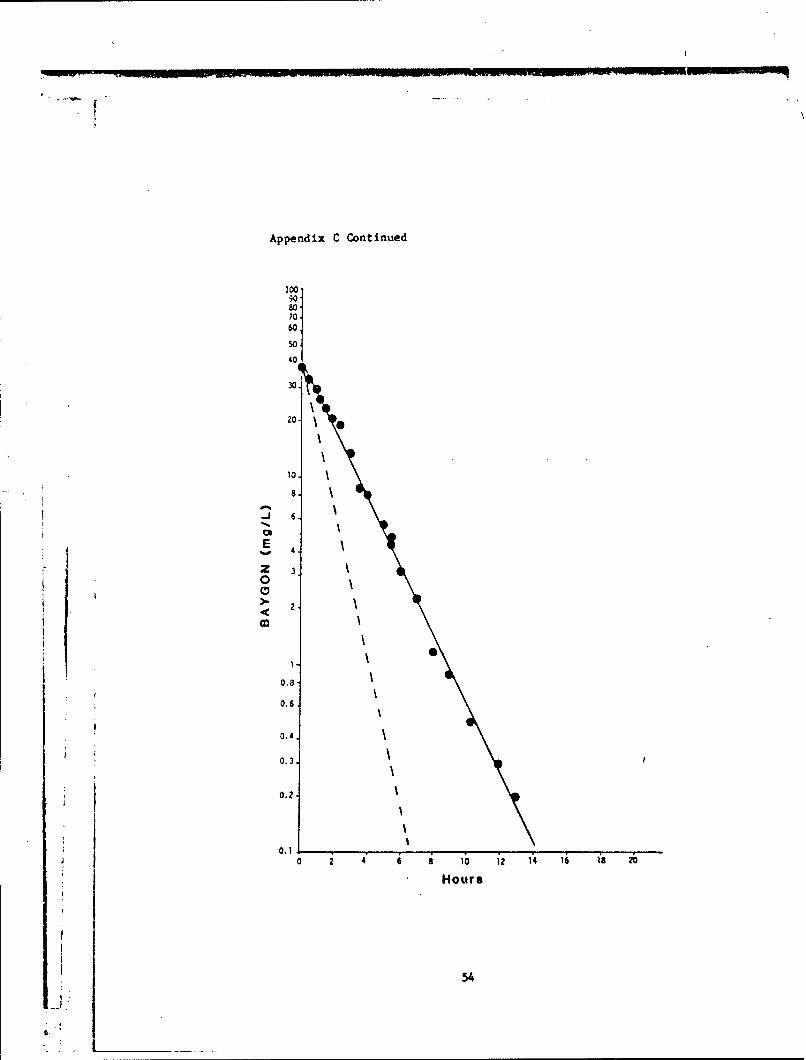
C. Concentration of Pesticides in Wastewater Undergoing Carbon Filtration
by the CARBOLATOR During the rield Test of Septerber 1981 atFort Eustis, VA ........................... .............. . .52
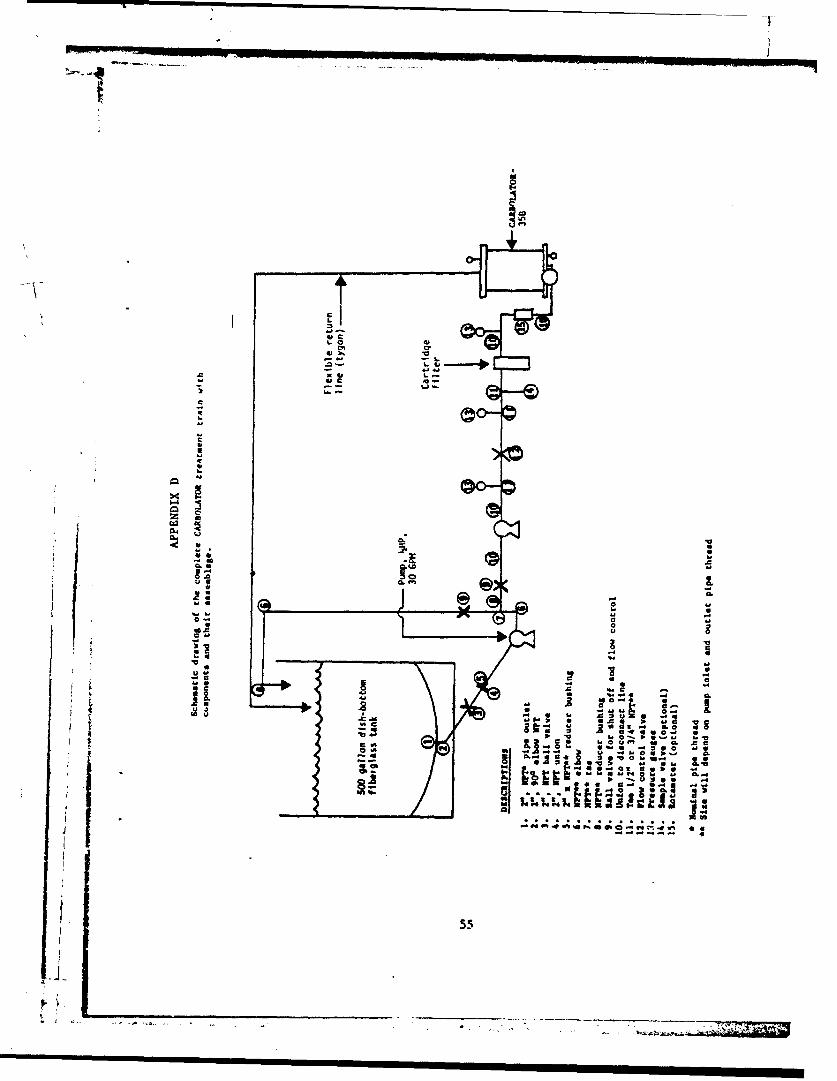
D. Schematic Drawing of the Complete CARBOLATOR Treatment Train withCoponents and their Assemblage ...... .. .... . .0. ... . . ...... . ...... .... .55
"--ST OF FIGURES
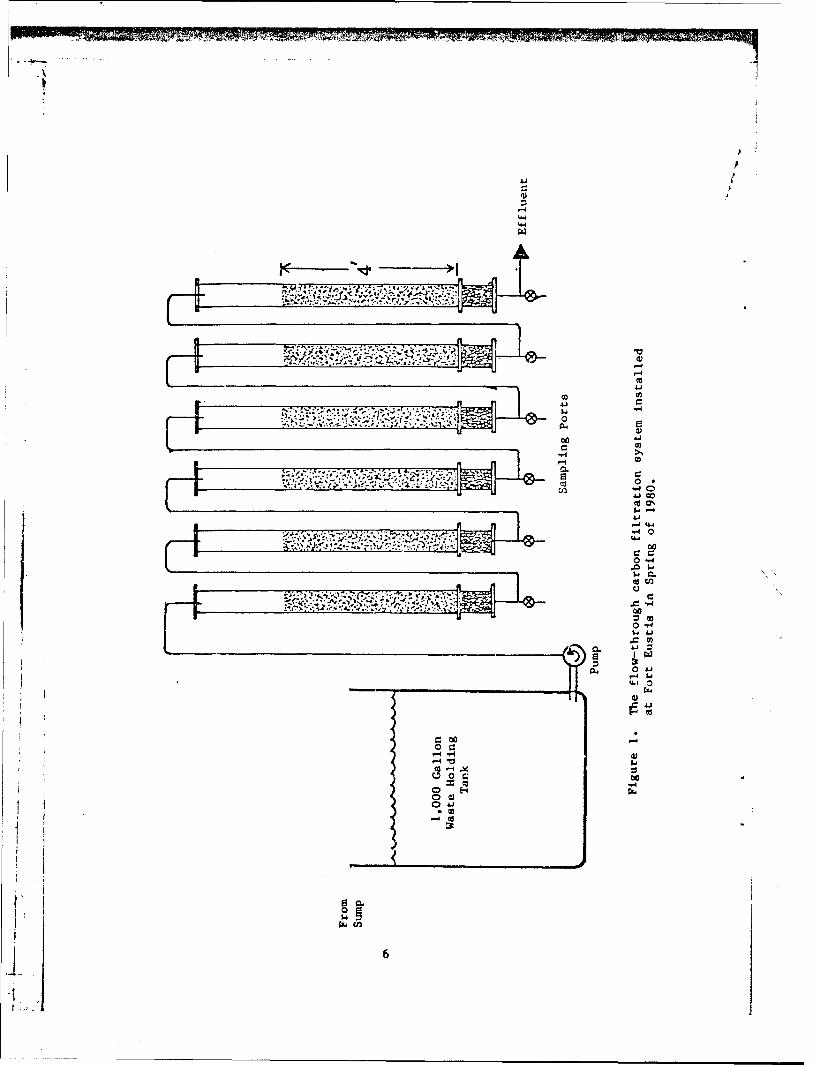
1. The flow-through carbon filtration system installed at Fort Eustisin Spring of 1980 ....................................................... 6
2. CARBOLATOR 35B .......................................................... 7
3. The CARBOLATOR system ...... ... ................................ 9
4. Adsorption isotherm of Calgon F-300 powdered carbon .................... 12
5. Gas chromatogram showing separation of seven pesticides ................ 15
6. Flow chart showing the qualitative and quantitative analysis ofFort Eustis wastewater ................................................. 16
7. Thin-layer chromatogram of a mixture of six pesticides ................. 18
8. Apparatus designed to simulate the CARBOLATOR concept of watertreatment ............................................................... 19
9. Schematic drawing of CARROLATOR system tested at Fort Eustis, VA ....... 25
10. Removal of the diethylamine salt of 2,4-D from 4 liters of waterusing the apparatus shown in Figure 9 .................................. 33
11. Removal of chlordane from 4 liters of water using the apparatusshown in Figure 9 ...................................................... 34
LIST OF TABLES
1. Activated Carbons Evaluat6d In Isotherm Studies with Diazinon .......... 11
2. Composition of Wastewaters from Peit Control Operations at TwoSites Between 1977 and 1981 ..................... 13
3. Names and Structures of Pesticides Used to Prepare a SyntheticWastewater ................... ......................................... 14
4. Pesticide Concentration in 400 Gallons of Water During Treatment withCARBOLATOR 35B ............................ ........................ 21
5. Pesticide Concentration in 400 Gallons of Water During Treatment withCARBOLATOR 35B .............................. . .............. .......... 22
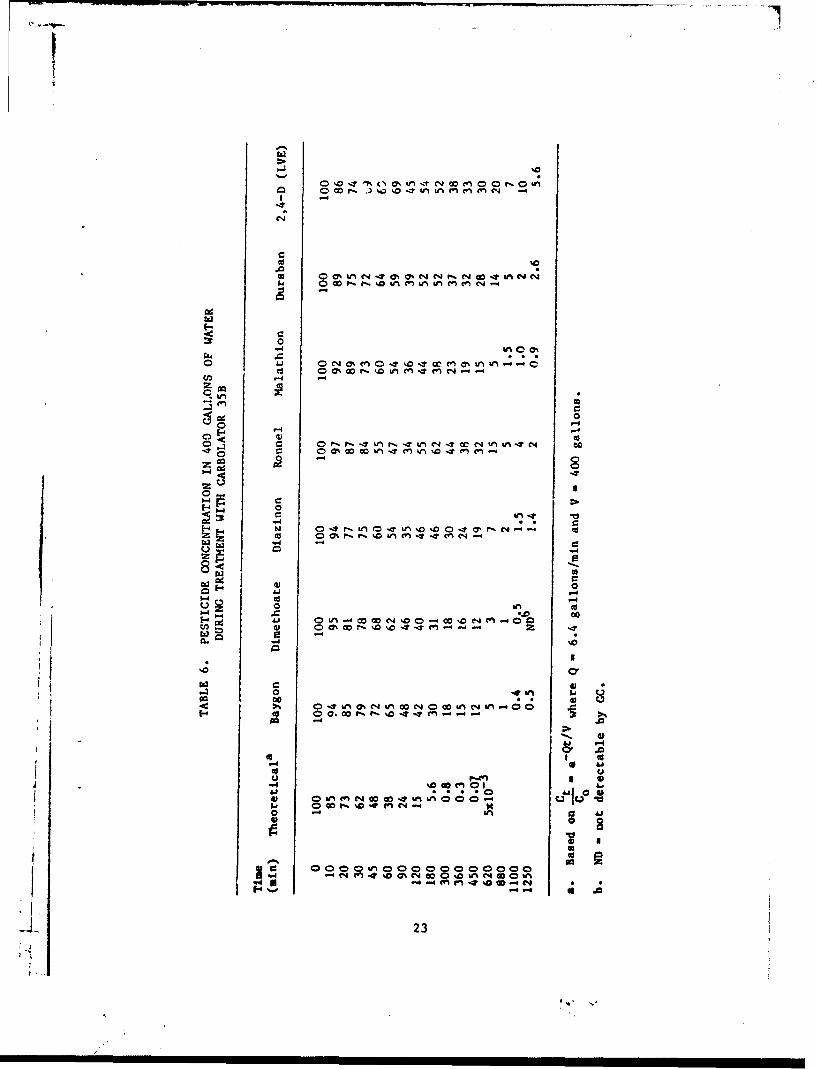
6. Pesticide Concentration in 400 Gallons of Water During Treatment withCARBOLATOR 35B ..................... s.................. .. .......... .... 23
7. Values of k that w.-e Determined Graphically from Experimental DataCovering 95 Percent Removal of the Pesticide from Water.*............. 24
2B .-----------------------..----
I7
8. Pressure and Flow Gharacteristics of the CARBOLATOR FiltrationSystem During the Field Test of July 1981 .............................. 26
9. Pesticide Concentration in Fort Eustis Wastewater as CARBOLATORTreatment Progressed ................................................... 28
10. Pressure and Flow Characteristics of the CARBOLATOR FiltrationSystem During the Field Test of September 1981 ......................... 29
ii. Pesticide Concentration in Fort Eustis Wastewater as CRBOLATORTreatment Progressed ................................................... 30
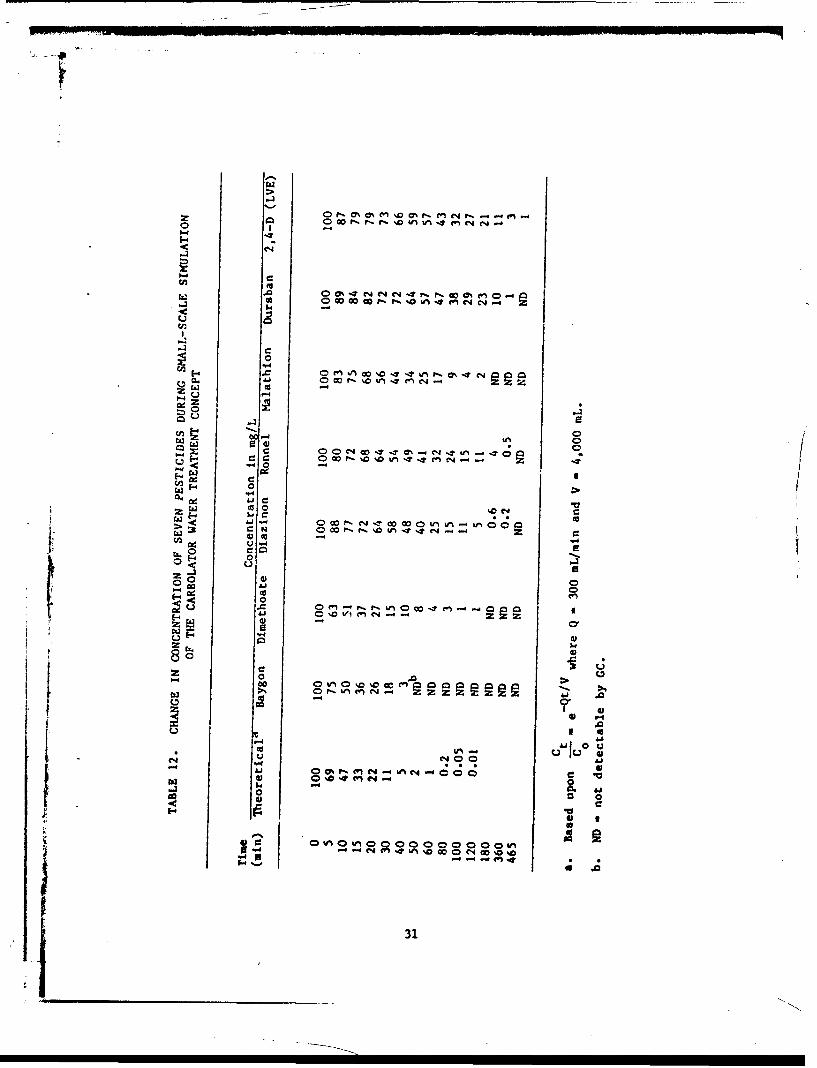
12. Change in Concentration of Seven Pesticides During Small-ScaleSimulation of the Carbolator Water Treatment Concept ................... 31
13. Experiment to Determine the Adsorptive Capacity of Calgon F-300
Granular Activated Carbon .............................................. 35
14. Leach Test of Spent Carbon from CARBOLATOR ............................. 36
Accession For
NTTq G7A&IDTIC TABUij:•'ounced [
Justif etion_
By--Di stribu tion/ _____.
Availa'bility Codes
3
i-
BACKGROUND
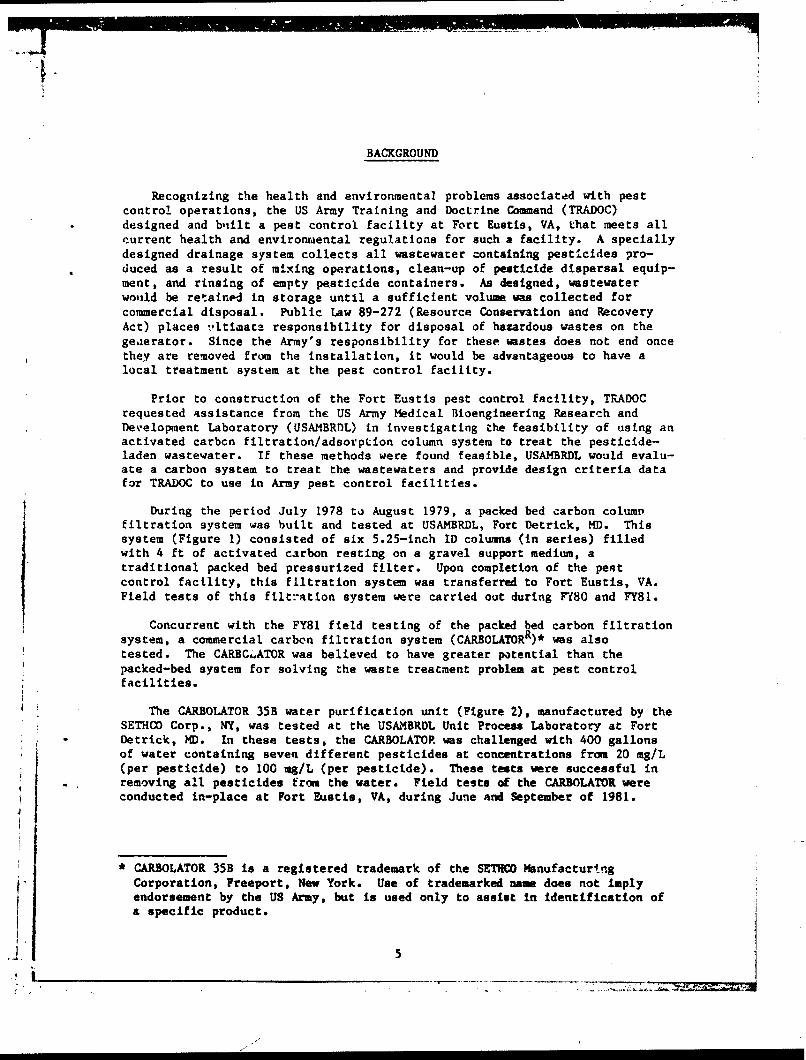
Recognizing the health and environmental problems associated with pestcontrol operations, the US Army Training and Doctrine Command (TRADOC)designed and btilt a pest control facility at Fort Eustis, VA, that meets allcurrent health and environmdental regulations for such a facility. A speciallydesigned drainage system collects all wastewater containing pesticides pro-duced as a result of mixing operations, clean-up of pesticide dispersal equip-ment, and rinsing of empty pesticide containers. As designed, wastewaterwould be retained in storage until a sufficient volume was collected forcommercial disposal. Public Law 89-272 (Resource Conservation and RecoveryAct) places ',ltiaace responsibility for disposal of hazardous wastes on thegeaerator. Since the Army's responsibility for these wastes does not end oncethey are removed from the installation, it would be advantageous to have alocal treatment system at the pest control facility.
Prior to construction of the Fort Eustis pest control facility, TRADOCrequested assistance from the US Army Medical Rioengineering Research andDevelopment Laboratory (USAMBRDL) in investigating the feasibility of using anactivated carbcn filtration/adsorpLion column system to treat the pesticide-laden wastewater. If these methods were found feasible, USAMBRDL would evalu-ate a carbon system to treat the wastewaters and provide design criteria datafor TRADOC to use in Army pest control facilities.
During the period July 1978 to August 1979, a packed bed carbon colum.filtration system was built and tested at USAMBRDL, Fort Detrick, MD. Thissystem (Figure 1) consisted of six 5.25-inch ID columns (in series) filledwith 4 ft of activated carbon resting on a gravel support medium, atraditional packed bed pressurized filter. Upon completion of the pestcontrol facility, this filtration system was transferred to Fort Eustis, VA.Field tests of this filtration system were carried out during Ff80 and FY81.
Concurrent with the FY81 field testing of the packed bed carbon filtrationsystem, a commercial carbon filtration system (CARBOLATORR)* was alsotested. The CARBC"ATOR was believed to have greater potential than thepacked-bed system for solving the waste treatment problem at pest controlfacilities.
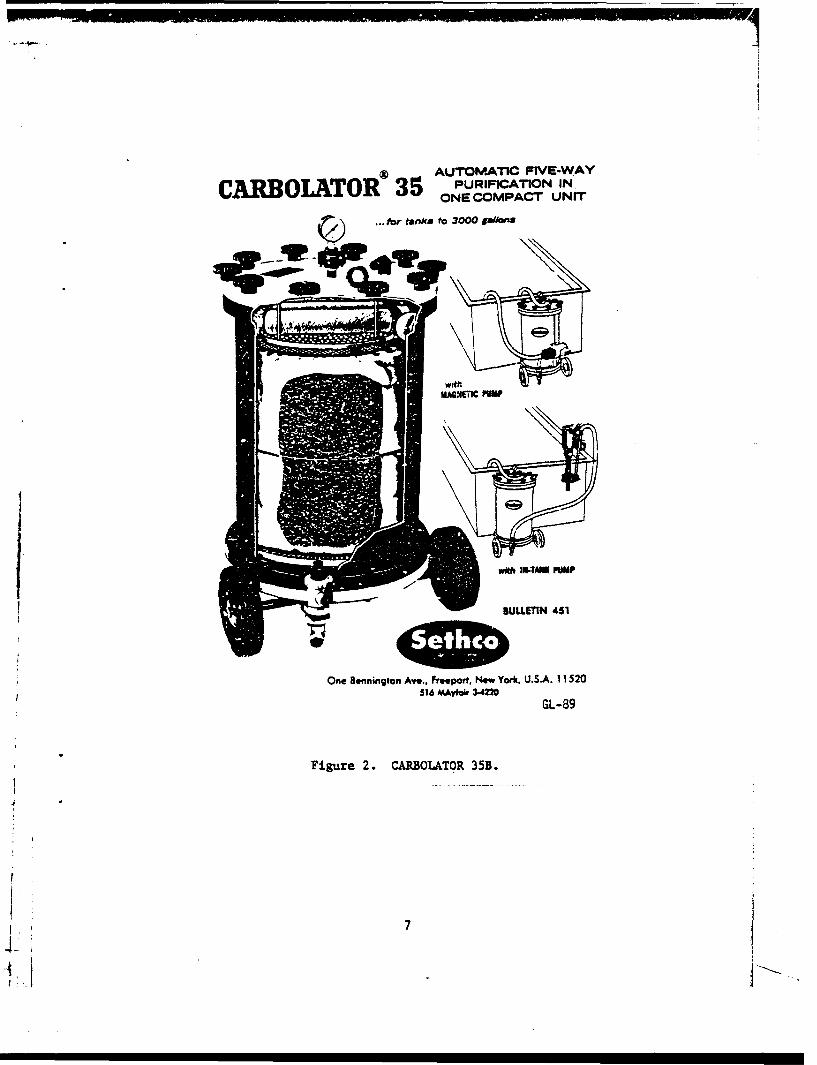
The CARBOLATOR 35B water purification unit (Figure 2), manufactured by theSETHCO Corp., NY, was tested at the USAMBRDL Unit Process Laboratory at FortDetrick, MD. In these tests, the CARBOLATOP. was challenged with 400 gallonsof water containing seven different pesticides at concentrations from 20 mg/L(per pesticide) to 100 mg/L (per pesticide). These tests were successful inremoving all pesticides from the water. Field tests of the CARBOLATOR wereconducted in-place at Fort Eustis, VA, during June and September of 1981.
* CARBOLATOR 35B is a registered trademark of the SETCO ManufacturingCorporation, Freeport, New York. Use of trademarked name does not implyendorsement by the US Army, but is used only to assist in identification ofa specific product.
5 _ _ __ _ _ _ _ _ _
PollIII 1!Fmj:; vý
'Ii)
-4D
A.'
.... .. to
000
C0
-4 -4
44
0 b0
AAUTOMATIC FIVE-WAYCAMBOIATOR® 35 •,, PURFICTIO I
ONE COMPACT UNIT
for tanks to 3000 OO ns
with
i •• ft II&.TANK PUMP
S~BULLETIN 451
One Bennington Ave.. Freeport, New York, U.S.A. 11520
516 MAyfar 34220
GL-89
Figure 2. CARBOLATOR 35B.
.17

OBJECTIVE
It is the objective of this report to present the results obtained fromtesting a carbon filtration system based on the commercial CARBOLATOR. Thesystem was u'ed for the removal of pesticides from contaminated wastewater.Both laboratory tests and on-site trials of this system are presented anddiscussed.
METHODS AND MATERIALS
DESCRIPTION AND OPERATION OF THE CARBOLATOR 35B CARBON FILTRATION SYSTEM
The CARBOLATOR, a commercial unit, operates by the recirculation of ivolume of wastewater through a bed of carbon (Figures 2 and 3). This systemhas several advantagcs when ccmpared to a flow-through system of carbon col-umns. One of the advantages is found in its design. The CARBOLATOR is light-weight and portable, consisting of 3n 18-gallon reinforced epoxy tank with anO-ring seal cover. Two porous polypropylene bags, which hold the granularcarbon, are placed in the tank and the top is sealed. Pesticide-contaminatedwater is pumped continuously iato the bottom of the CARBOLATOR and upwardthrough the carbon bed. The water ia returned to the waste holding tank. Thefluidized system tends to eliminate channeling and improves the contactbetween the carbon and contaminated wastewater. Moreover, the bed does notcompact and induce a large prassure drop. In contrast, a pressurized packedbed filter, Figure 1, tends to induce large pressure drops and channelingthrough bed compaction. Furthermore, the packed bed system requires continualmonitoring for breakthrough to ensure a pesticide-free effluent. TheCARBOLATOR continually recirculates water back to the holding tank, eliminat-ing the need for continuous monitoring. After a specified time, the tank canbe sampled for residual pesticides.
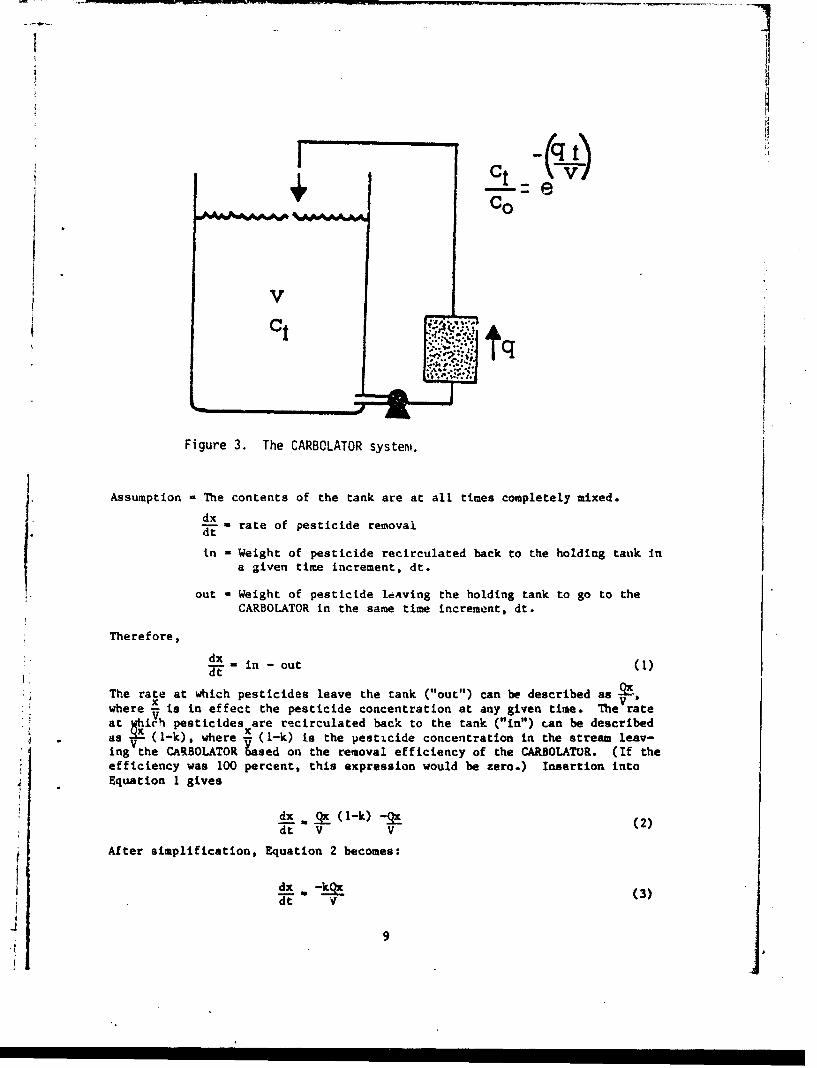
Operation of the CARBOLATOR system can be mathematically described byusing a differential mass balance. With regard to the flow diagram ofFigure 3, the following nomenclatnre will be used:
Q - Flow rate through the carbon bed. This value is constant.
V - Volume of solution in the holding Lank. This value is alsoconstant.
x - Amount of pesticides in the bolution at any given time (absoluteweight).
k - Pesticide fraction renoved across the carbon bed (removal"efficiency").
1-k - Pesticide fraction remaining in the recirculation stream.
J8
V i
tqq
Figure 3. The CARBOLATOR systen.
Assumption = The contents of the tank are at all times completely mixed.
d- dx rate of pesticide removal
in = Weight of pesticide recirculated back to the holding tauk ina given time increment, dt.
out - Weight of pesticide leAving the holding tank to go to theCARBOLATOR in the same time increment, dt.
Therefore,
dLx - in - out (1)dt
The rate at which pesticides leave the tank ("out") can be described asx~V'where 2 is in effect the pesticide concentration at any given time. The rate
* at which pesticides are recirculated back to the tank ("in") can be describedS~xas ~V (1-k) , where x (1-k) is the pesticide concentration in the stream leav-ing the CARBOLATOR Lased on the removal efficiency of the CARBOLATOR. (If theefficiency was 100 percent, this expression would be zero.) Insertion intoEquation 1 gives
dx_. Qx (1-k) -_x (2)dt V V
After simplification, Equation 2 becomes:
d (3)dt V
9
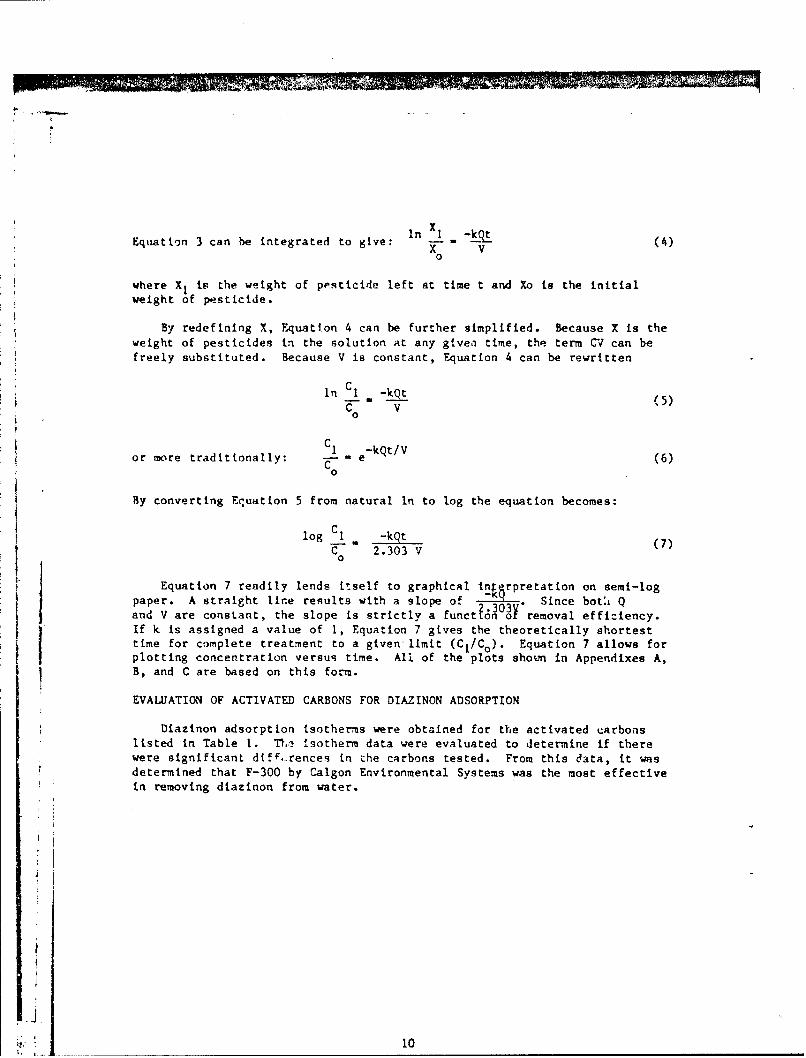
xEquation 3 can be integrated to give: in I (4)x V
0
where X is the weight of pesticide left at time t and Xo Is the initialweight of pesticide.
By redefining X, Equation 4 can be further simplified. Because X is theweight of pesticides in the solution at any givea time, the term CV can befreely substituted. Because V is constant, Equation 4 can be rewritten
InCI . -kQtC V
0
C, -kQt/Vor more tradittonally: - e (6)
C0
By converting Equation 5 from natural In to log the equation becomes:
log CI -kQtC- 2.303 V (7)
Equation 7 readily lends itself to graphical inrpretation on semi-logpaper. A straight line results with a slope of J6303. * Since bot:i Qand V are constant, the slope is strictly a functt n0o removal efficiency.If k is assigned a value of 1, Equation 7 gives the theoretically shortesttime for complete treatment to a given limit (Ci/Co). Equation 7 allows forplotting concentration versus time. All of the plots shown in Appendixes A,B, and C are based on this form.
EVALUATION OF ACTIVATED CARBONS FOR DIAZINON ADSORPTION
Diazinon adsorption isotherms were obtained for the activated carbonslisted in Table 1. t,,- isotherm data were evaluated to determine if therewere significant diff.rences in the carbons tested. From this data, it wasdetermined that F-300 by Calgon Environmental Systems was the most effectivein removing diazinon from water.
10
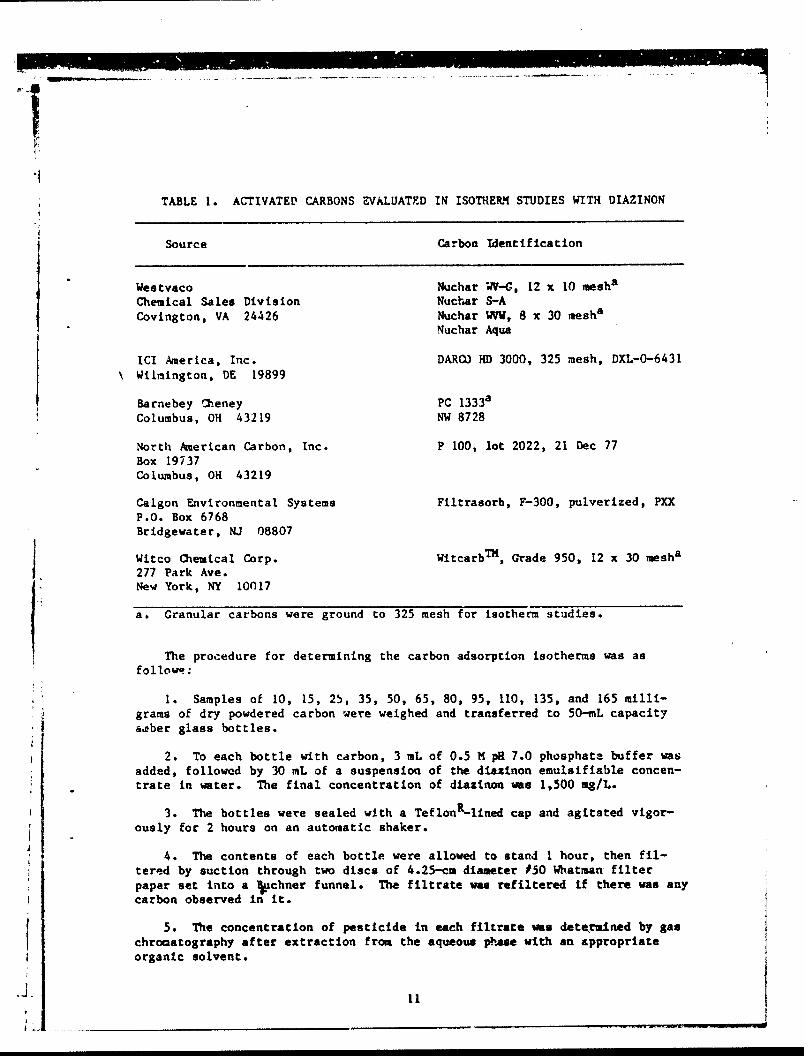
TABLE 1. ACTIVATED CARBONS EVALUATED IN ISOTHERM STUDIES WITH DIAZINON
Source Carbon Identification
Westvaco Nuchar W-G, 12 x 10 meshaChemical Sales Division Nuchar S-ACovington, VA 24426 Nuchar WV1, 8 x 30 mesha
Nuchar Aqua
ICI America, Inc. DARO) HD 3000, 325 mesh, DXL-O-6431\ Wilmington, DE 19899
Barnebey .eney PC 1333a
Columbus, OH 43219 NW 8728
North American Carbon, Inc. P 100, lot 2022, 21 Dec 77Box 19737Columbus, OH 43219
Calgon Environmental Systems Filtrasorb, F-300, pulverized, PXXP.O. Box 6768Bridgewater, NJ 08807
Witco Chemical Corp. WitcarbTH, Grade 950, 12 x 30 mesha277 Park Ave.
New York, NY 10017
a. Granular carbons were ground to 325 mesh for isotherm studies.
The procedure for determining the carbon adsorption isotherms was asfollow*:
1. Samples of 10, 15, 25, 35, 50, 65, 80, 95, 110, 135, and 165 milli-grams of dry powdered carbon were weighed and transferred to 50-ML capacity
a&ber glass bottles.
2. To each bottle with carbon, 3 mL of 0.5 M pI 7.0 phosphate buffer wasadded, followed by 30 mL of a suspension of the diazinon emulsifiable concen-trate in water. The final concentration of diazinon was 1,500 mg/L.
3. The bottles were sealed with a TeflonR-lined cap and agitated vigor-ously for 2 hours on an automatic shaker.
4. The contents of each bottle were allowed to stand 1 hour, then fil-tered by suction through two discs of 4.25-cm diameter P50 Whatman filterpaper set into a •Ichner funnel. The filtrate was refiltered if there was anycarbon observed in it.
5. The concentration of pesticide in each filtrate was detekrmined by gaschrocatography after extraction from the aqueous pbhase with an &ppropriateorganic solvent.
4 11
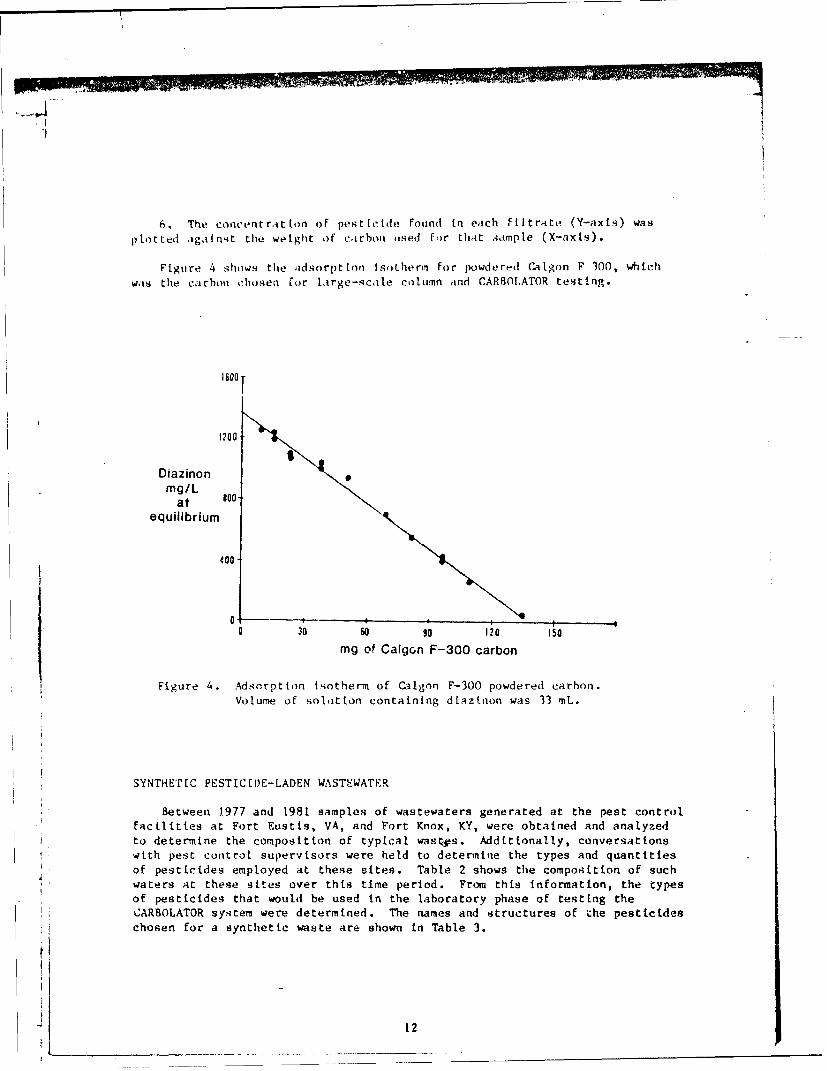
6. The concentnrtion of pesticide Found ta each fittrate (Y-axis) was
plotted against the weight of carbon used for that aample (X-axls).
Figure 4 shows the adsorpt[on fsotherm for powdered ('Cagon F 300, whichwas the carbon chosen [or large-sccale column and CARBOILATOR testing.
1200
Diazinonmg/I
at 0-equilibrium
400
0 30 60 90 120 ISOmg of Calgon F-300 carbon
Figure 4. Adsorption isotherm of Calgon F-300 powdered carbon.
Volume of solation containing diAzttnon was 33 mL.
SYNTHEITIC PESTICIDE-LADEN WASTINATER
Between 1977 and 1981 samples of wastewaters generated at the pest controlFacilities at Fort Eustis, VA, and Fort Knox, KY, were obtained and analyzed
to determine the composition of typical wastps. Additionally, conversationswith pest control supervisors were held to determine the types and quantities
of pesticides employed at these sites. Table 2 shows the composition of suchwaters at these sites over this time period. From this information, the typesof pesticides that would be used in the laboratory phase of testing theCARBOLATOR system were determined. The names and structures of Zhe pesticideschosen for a synthetic waste are shown in Table 3.
12
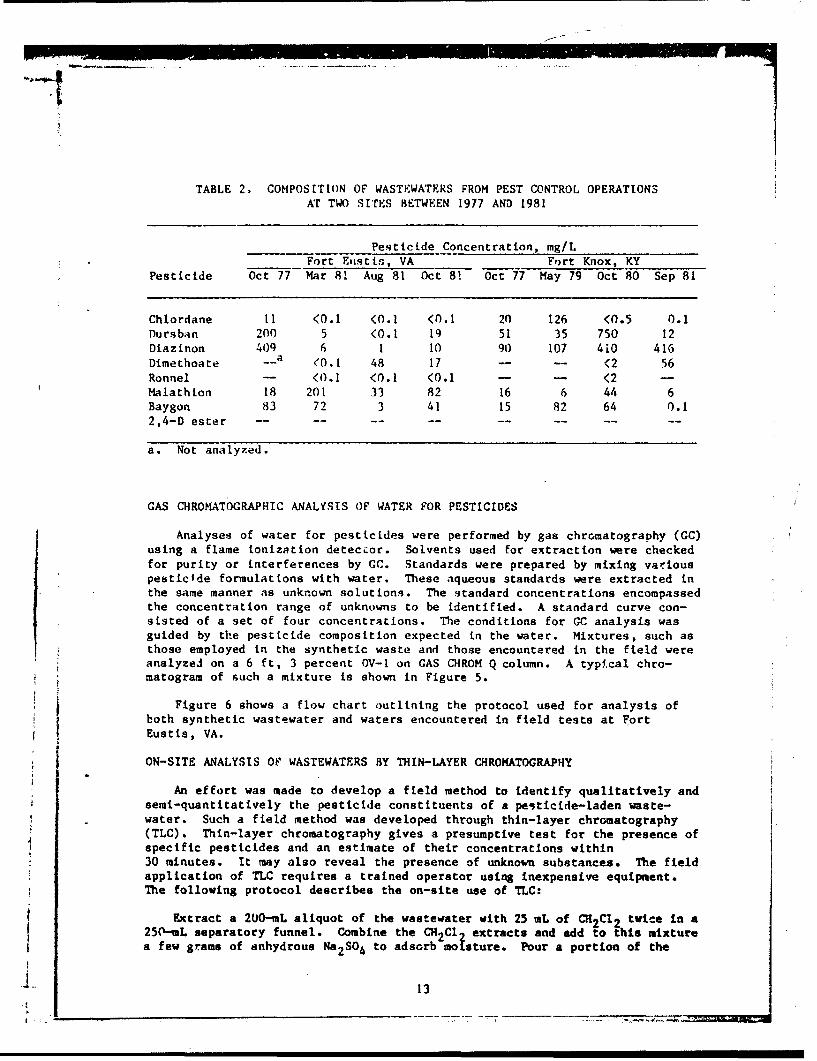
TABLE 2. COMPOSETION OF WASTEWATERS FROM PEST CONTROL OPERATIONSAT TWO SITES BETWEEN 1977 AND 1981
Pesticide Concentration, mg/LFort Etistis, VA Fort Knox, KY
Pesticide Oct 77 Mar 81 Aug 81 Oct 81 Oct 77 May 79 Oct 80 Sep 81
Chlordane 11 <0.1 (0.1 <0.1 20 126 <0.5 0.1Dursban 200 5 <0.1 19 51 35 750 12Diazinon 409 6 1 10 90 107 4i0 416Dimethoate --a (0.1 48 17 - - < (2 56Ronnel -- <0.1 <0.1 (0.1 - - <2 -
Malathion 18 201 33 82 16 6 44 6Baygon 83 72 3 41 15 82 64 0. 12 ,4- D e s te r - .. .. .. ........
a. Not analyzed.
GAS CHROMATOGRAPHIC ANALYSIS OF WATER FOR PESTICIDES
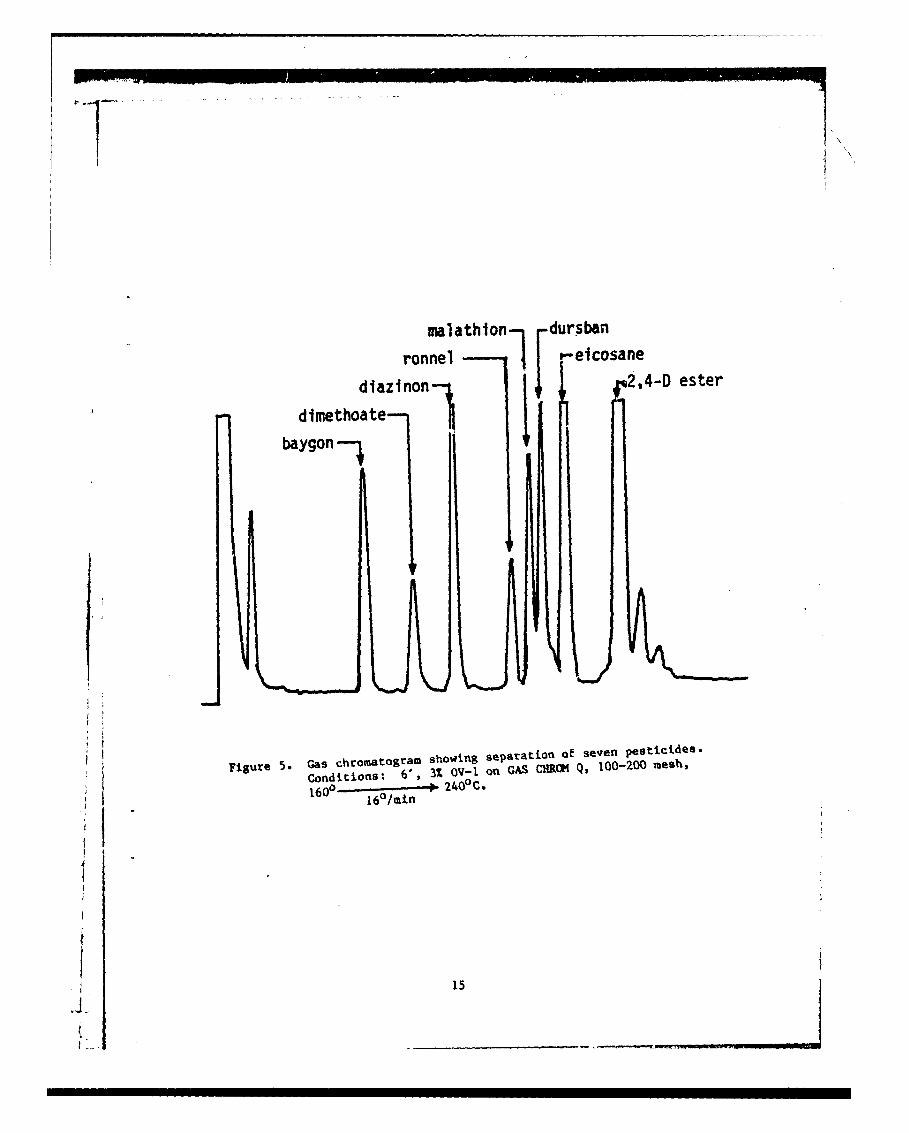
Analyses of water for pesticides were performed by gas chromatography (GC)using a flame ionization detecror. Solvents used for extraction were checkedfor purity or interferences by GC. Standards were prepared by mixing variouspesticide formulations with water. These aqueous standards were extracted inthe same manner as unknown solutions. The standard concentrations encompassedthe concentration range of unknowns to be identified. A standard curve con-sisted of a set of four concentrations. The conditions for GC analysis wasguided by the pesticide composition expected in the water. Mixtures, such asthose employed in the synthetic waste and those encountered in the field wereanalyzed on a 6 ft, 3 percent OV-1 on GAS CHROM Q column. A typical chro-matogram of such a mixture is shown in Figure 5.
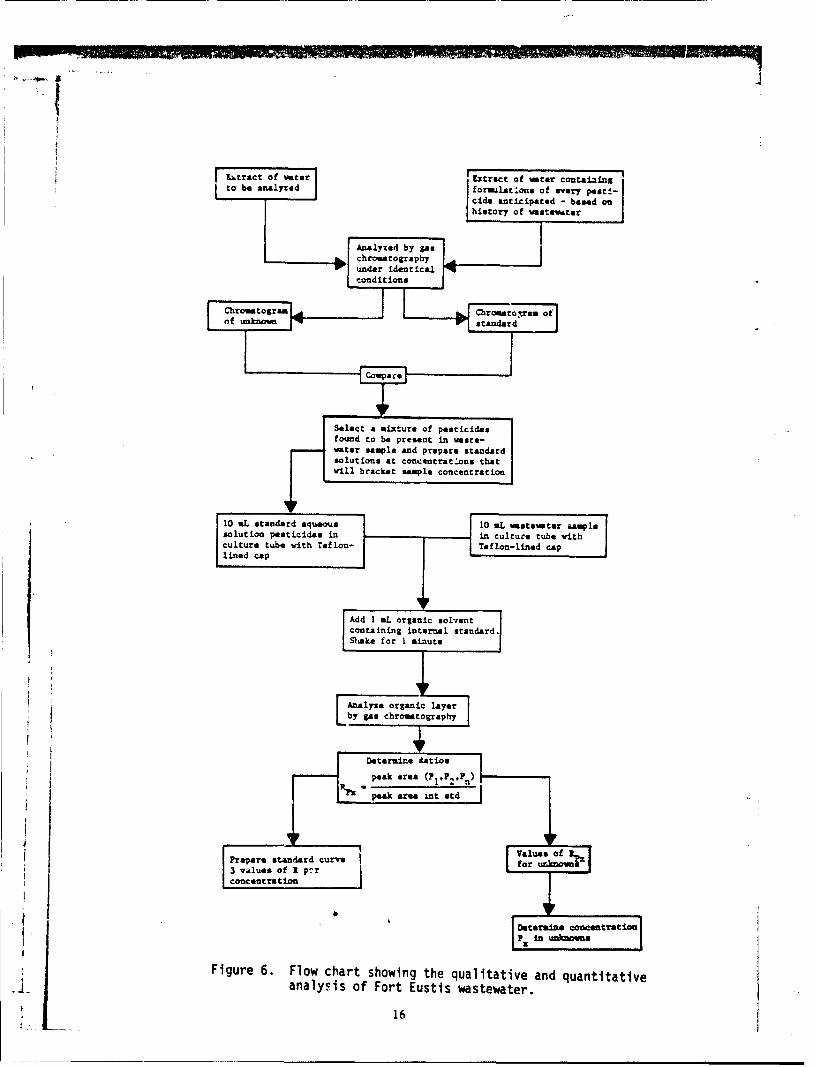
Figure 6 shows a flow chart outlining the protocol used for analysis ofboth synthetic wastewater and waters encountered in field tests at FortEustis, VA.
ON-SITE ANALYSIS OF WASTEWATERS BY THIN-LAYER CHROMATOGRAPHY
An effort was made to develop a field method to identify qualitatively andsemi-quantitatively the pesticide constituents of a pesticide-laden waste-water. Such a field method was developed through thin-layer chromatography(TLC). Thin-layer chromatography gives a presumptive test for the presence ofspecific pesticides and an estimate of their concentrations within30 minutes. It may also reveal the presence of unknown substances. The fieldapplication of TLC requires a trained operator using inexpensive equipment.The following protocol describes the on-site use of TLC:
Extract a 2UO-mL aliquot of the wastewater with 25 mL of CH2 Cl 2 twice in a25e-mL separatory funnel. Combine the CH2 Cl2 extracts and add to this mixturea few grams of anhydrous Na2 SO4 to adsorb moisture. Pour a portion of the
1 13
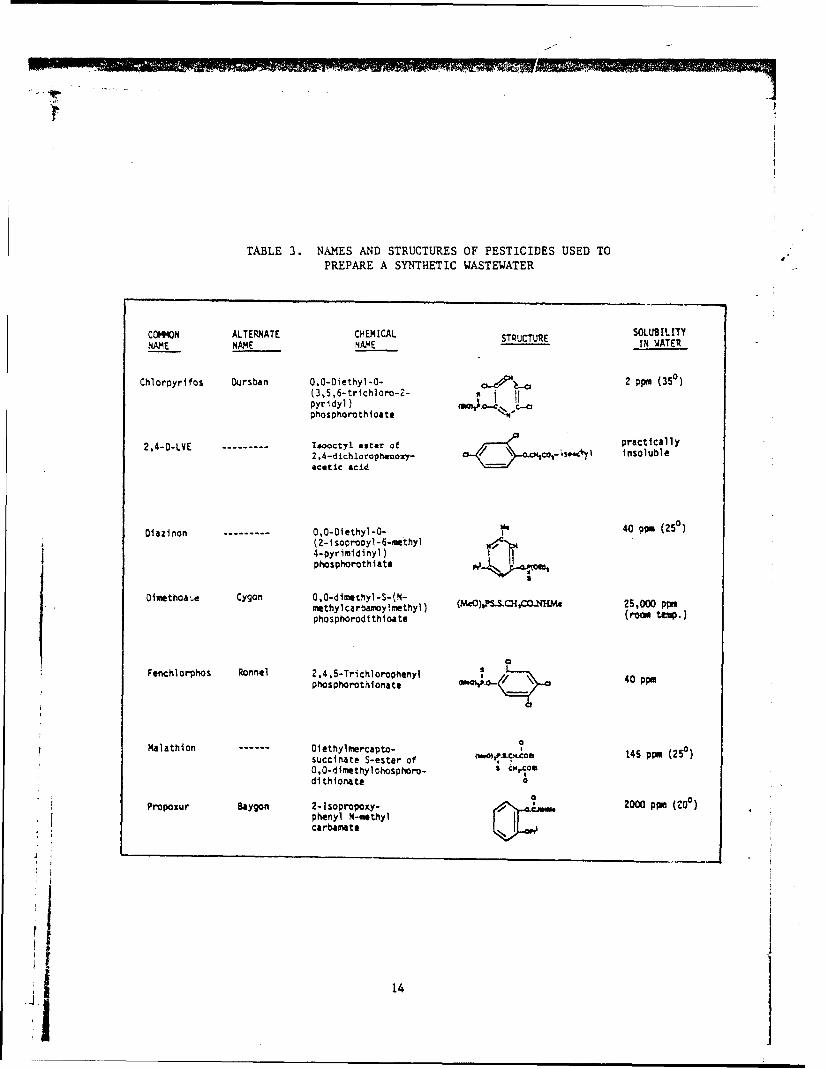
TABLE 3. NAMES AND STRUCTURES OF PESTICIDES USED TOPREPARE A SYNTHETIC WASTEWATER
COMMON ALTERNATE CH4EMICAL STRUCTURE SOLUBILITYNAMqE NAME NAM~E IN WATER
Chlorpyrifos Dursban 0.0-Diethyl -0- 2 ppm (350)(3,5,6-trichloro-2-pyridyl)
phosphorathioate
2,4-0-LVE ----- sooctyl *star of practically2,la-dichlorophanoxy- O..'jOcNCi*Y insolubleacetic acid
Diazinon ----- ,0-Olethyl-0- 40 pp. (250(2- 1sopropyl -6-foethyl NC4-pyrimidinyl)phosphorothiate
Oimethoa,-e Cygon 0,0-dlmethyl-S-(N- (e)P..~C-Hs2,0 pmethylcarbaamylmethyl) ~2,0 pj phosphorodi thioaete (mom to*p.
Fenchlorphos Ronflel 2.,-rclrpey 40pp
Malathion ---- Olethylmercapto- 0succinate S-ester of .0PSCCIn145 ppm (2500.0-dimethyiphosphoro- S cm~coftdl thionate 0
Propoxur Baygon 2-Isopropoxy- 2000 ppm (200o)phenyl N-methylcarbamaet
14
malathion dursban
ronnel -- elcosane
diazdnon--1 2,4-D esterdimethoate-- |
baygon
Figure 5. Gas chromatogram showing separation of seven pesticides.
Conditions: 6, 3% OV-L on GAS CHROC Q, 100-200 mesh,
1600o-°-- - 240PC.
15
I I ilA - I I IIIIII I I
Extract of wat er] Extract of water con 'aIj gto be analyzed Iforinilat.ons Of eVery eti- IIcide anticipated - bsdohistory of wastswte
L Compare
Select a mixture of pesticidesfound to be present in waste-water sample and prepare standardsolutions at con..entrat~ons thatwill bracket asample concentration
10 *L standard aqueous 10 mL wastewater seiqplssolution pesticides in in culture tube withculture tube vith Teflon- Tsf ion-lined caplined cap
Add I aL ogncsolventcontaining internal standsr.
Sasfor 1 minute
concentration
Determine comttroio
Figuree 6.anFlow charte shwn heqaiaiv n uatttv
analysis of Fort Eustis wastewater. at aiv
16
CH2 C12 extract tnto a 20-mL scintillation vial and allow the CH2 C12 to evapo-rate in the open air. As the CH2 C12 evaporates, add more of the extract untilthe entire CH2 CI2 extract has been reduced to an oily residue. This residuewill contain the pesticides that were suspended or dissolved in the waste-water. A heat gun (hair dryer) may be used to hasten evaporation of theCH2C1 2 , but cara must be used to prevent loss of the extract by too vigorousboiling. Prior to analysis by TLC, reconstitute the residue in the vial withI mL of fresh CH2 C12. Place 10 UL of this solution in a small spot, I cmabove the bottom of a TLC plate (E. Merck, Silica gel 60, GF-254). At I to 2cm to either side of this spot, place 10 uL of a solution containing severalpesticides of known concentration. Then place the TLC plate into a developingjar containing a suitable solvent. When the solvent has risen about 12 cm bycapillary movement, remove the TLC plate from the jar, air dry, and observeunder UV light. Although the silica gel contains a fluorescent substance, anyUV-absorbing substances will show up as dark spots. Outline any observed darkspots in pencil. Finally, spray the TLC plate with an acetone solution of TCQ(N,2,6-trichloro-p_-benzoquinoneimine) and heat with the heat gun until coloredspots appear. Spraying with TCQ and the heating of the TLC plate should bedone in the open air to minimize the irritancy of this reagent.
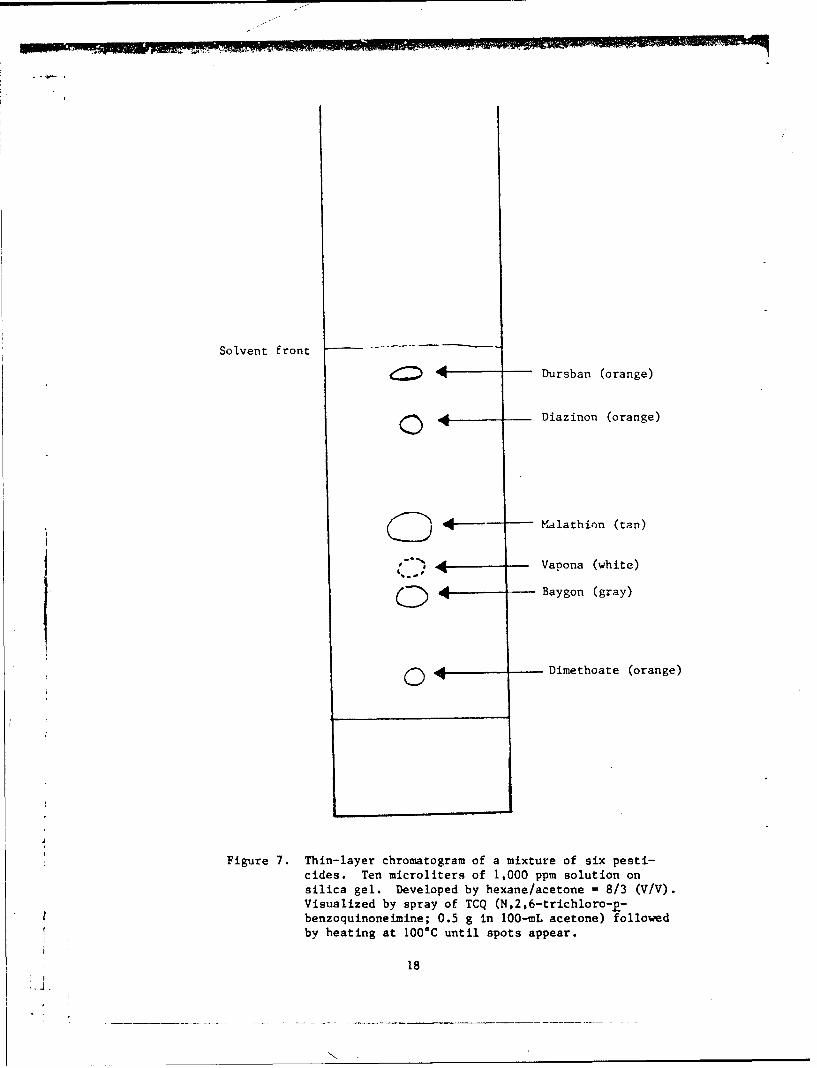
The TLC spots found in the wastewater extract are matched with those ofthe known pesticide mixture. This gives qualitative information regarding thewastewater extract. The relative sizes of matching spots gives a semi-quantitative estimate of the concentration of pesticide in the extract. A TLCplate where six pesticides have been separated and made visible by thisprocedure is shown in Figure 7.
EXPERIMENTAL PROCEDURE FOR LABORATORY-SCALE SIMULATION OF THE CARBCEATOR
It was desirable to evaluate the effectiveness of the CARBOLATOR concepton a solution containing one or more pesticides without resorting to the full-scale (400 gallons of wastewater) treatment system. In order to simulate therecirculation of a pesticide-laden wastewater through a bed of carbon, thebench-scale apparatus shown in Figure & was assembled. By treating watercontaining several pesticides simultaneously in this apparatus, it was pos-sible to determine their relative rates of adsorption by carbon. It was alsopossible to evaluate various types of granular carbon with this apparatus.The following procedure was used:
Measured amounts of various pesticide formulations are poured into the5-liter Erlenmeyer flask containing 4 liters of tapwater at room tempera-ture. While this mixture is being stirred, 100 grams (dry weight) of wetcarbon is placed into the glass column. This carbon is soaked in water24 hours prior to use. Clean water (about 500 mL) is passed through the
from the carbon column, and a connection is made between the stirred reservoirand the bottom of the carbon column ihrough a peristaltic pump. The neoprenestopper is placed at the top of the glass column, and the rubber hose attachedto a glass tube in this stopper is led into the flask. The pump is turned onand adjusted to the desired flow. When the water has passed the top of thecarbon bed, the carbon column is tapped to dislodge air pockets. When thewater begins to spill back into the reservoir, a timer is started (to). Priorto starting of the pump, an aliquot (3 mL) of the test water is removed. This
17
Solvent front
Dursban (orange)
4.. Diazinon (orange)
O-Malathion (tan)
-, -: Vapona (white)
CD -Baygon (gray)
-•Dimethoate (orange)
Figure 7. Thin-layer chromatogram of a mixture of six pesti-cides. Ten microliters of 1,000 ppm solution onsilica gel. Developed by hexane/acetone - 8/3 (V/V).Visualized by spray of TCQ (N,2,6-trichloro-p-benzoquinoneimine; 0.5 g in 100-mL acetone) followedby heating at 100*C until spots appear.
18
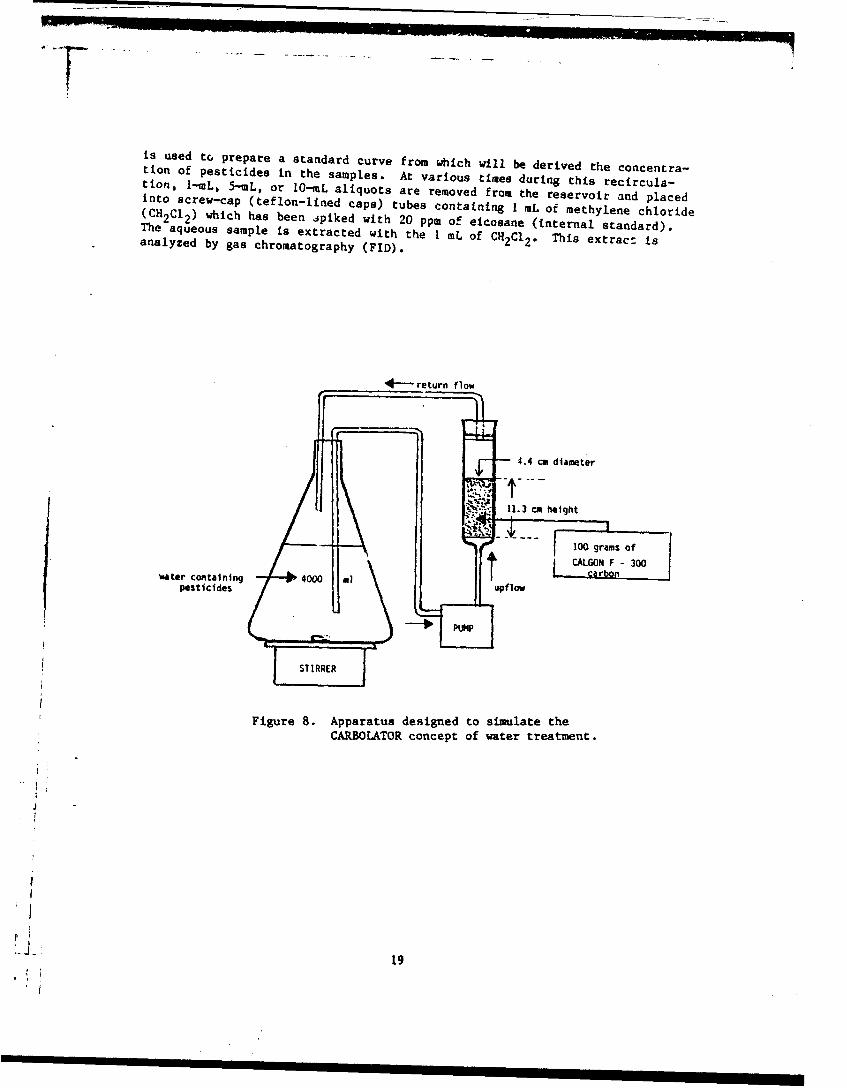
is used to prepare a standard curve from which will be derived the concentra-tion of pesticides in the samples. At various times during this recircula-tion, 1-wL, 5-mL, or 10-nL aliquots are removed from the reservoir and placedinto screw-cap (teflon-lined caps) tubes containing I mL of methylene chloride(CH2 Cl 2 ) which has been spiked with 20 ppm of eicosane (internal standard).The aqueous sample is extracted with the I mL of CH2CI 2 . This extrac: isanalyzed by gas chromatography (FID).
-return flow
4.4 ca diameter
1 1.3 cm height
100 grams ofCALGON F -300
water containing 4000 a] .Lcrpesticides
Figure 8. Apparatus designed to simulate theCARBOLATOR concept of water treatment.
•'J " 19
RESULTS
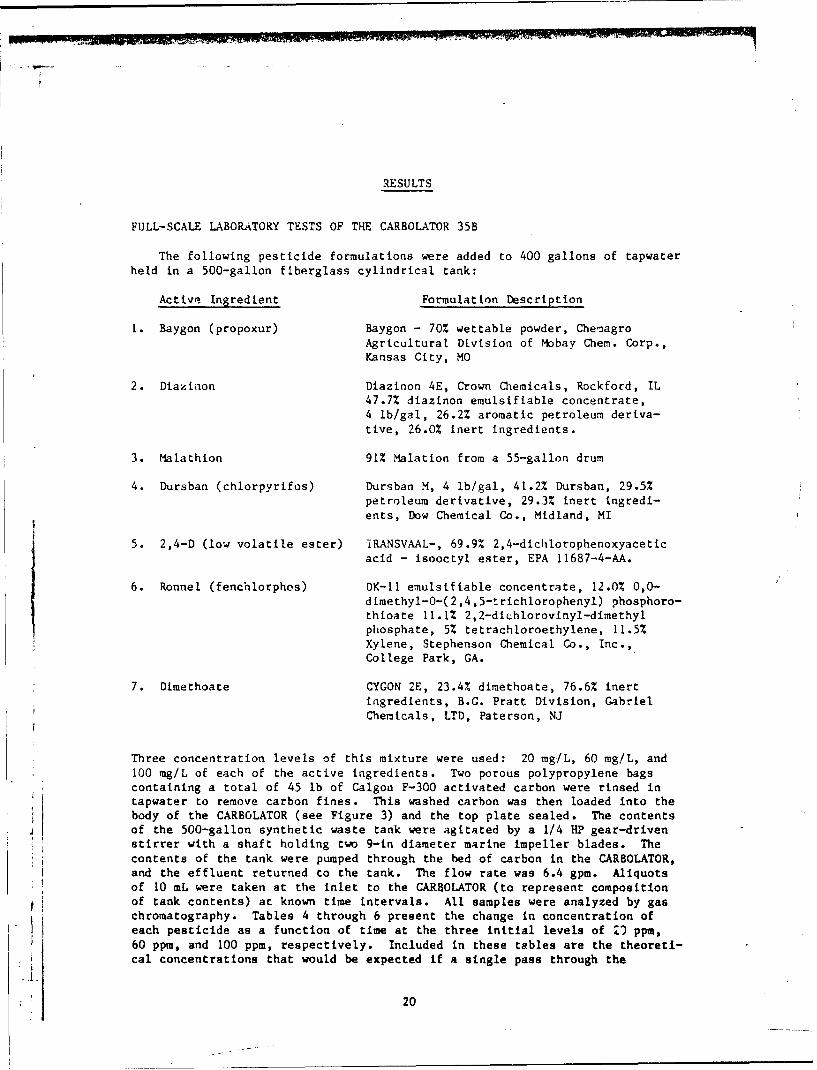
FULL-SCALE LABORATORY TESTS OF THE CARBOLATOR 35B
The following pesticide formulations were added to 400 gallons of tapwaterheld in a 500-gallon fiberglass cylindrical tank:
Active Ingredient Formulation Description
1. Baygon (propoxur) Baygon - 70% wettable powder, ChemagroAgricultural Division of Mlobay Chem. Corp.,Kansas City, MO
2. Diaxinon Diazinon 4E, Crown Chemicals, Rockford, IL
47.7% diazinon emulsifiable concentrate,4 lb/gal, 26.2% aromatic petroleum deriva-
tive, 26.0% inert ingredients.
3. Malathion 91% Malation from a 55-gallon drum
4. Dursban (chlorpyrifos) Dursban M, 4 lb/gal, 41.2% Dursban, 29.5%petroleum derivative, 29.3% inert ingredi-
ents, Dow Chemical Co., Midland, MI
5. 2,4-D (low volatile ester) IRANSVAAL-, 69.9% 2,4-dichlorophenoxyaceticacid - isooctyl ester, EPA 11687-4-AA.
6. Ronnel (fenchlorphos) DK-11 emulsifiable concentrate, 12.0% 0,0-dimethyl-O-(2,4,5-trichlorophenyl) phosphoro-thioate 11.1% 2,2-dichlorovinyl-dimethylphosphate, 5% tetrachloroethylene, 11.5%
Xylene, Stephenson Chemical Co., Inc.,College Park, GA.
7. Dimethoate CYGON 2E, 23.4% dimethoate, 76.6% inert
ingredients, B.G. Pratt Division, GabrielChemicals, LTD, Paterson, NJ
Three concentration levels of this mixture were used: 20 mg/L, 60 mg/L, and
100 mg/L of each of the active ingredients. Two porous polypropylene bagscontaining a total of 45 lb of Calgon F-300 activated carbon were rinsed intapwater to remove carbon fines. This washed carbon was then loaded into thebody of the CARBOLATOR (see Figure 3) and the top plate sealed. The contentsof the 500-gallon synthetic waste tank were agitated by a 1/4 HP gear-drivenstirrer with a shaft holding two 9-in diameter marine impeller blades. Thecontents of the tank were pumped through the bed of carbon in the CARBOLATOR,and the effluent returned to the tank. The flow rate was 6.4 gpm. Aliquotsof 10 mL were taken at the inlet to the CARBOLATOR (to represent composition
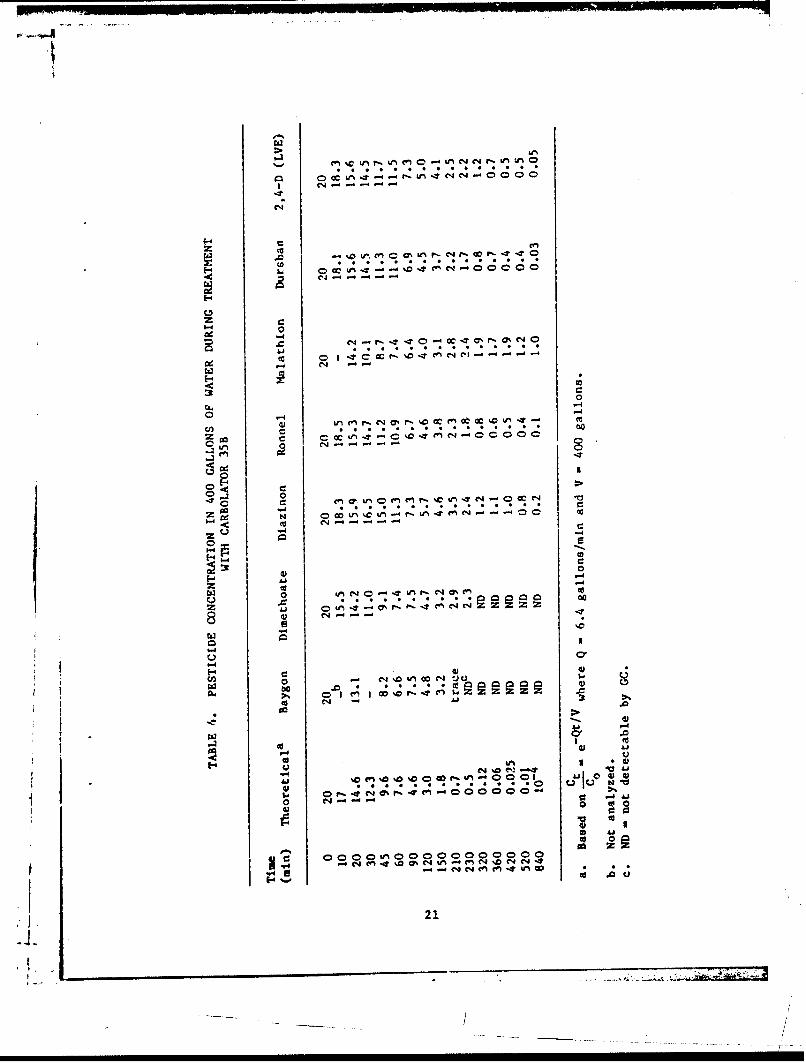
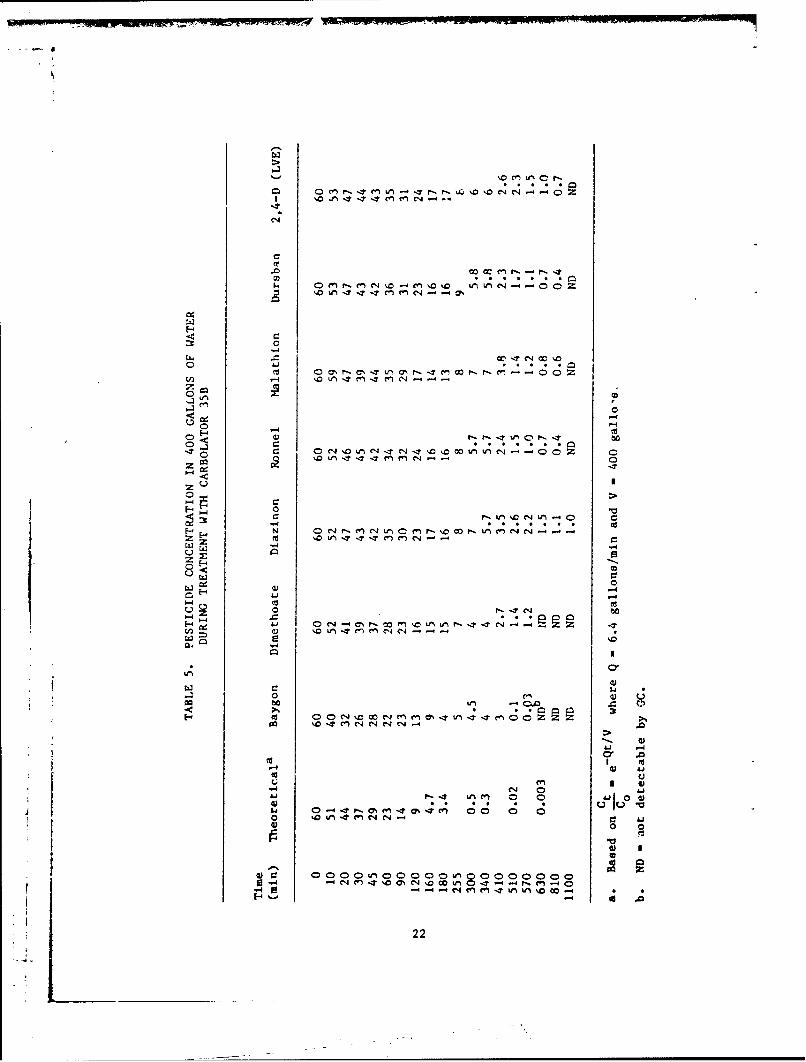
of tank contents) ac known time intervals. All samples were analyzed by gaschromatography. Tables 4 through 6 present the change in concentration ofeach pesticide as a function of time at the three initial levels of Z' ppm,60 ppm, and 100 ppm, respectively. Included in these tables are the theoreti-cal concentrations that would be expected if a single pass through the
20
X .4 . % * . . . . . .
14 0 4 4 ~ .. 0 O
00
I-4
z C
c 4 0 I
C).
en, 47 &M M nP0
Cd
CC
444
0 0 )zt w1
-4
DODOMO00000 0Ug L0)21
511 E
5 c..
0
cr m .0
00
00
0 * 0Co LM z0' CQ0 nUNCIz
Zcc
>
'-4 0
w z
00
43
o 0 )
0 ro -n M C1
W '001
-4u
0 43
C44 M T0 ' 104,C4 0 l % ,e 4en M eN % z G
224
0 '.D -Tft ?4 C7i% If) It eq Go n 0 a 4l 0 in~0 0 ts co -,- 0% 0LML nMm
c CXu'0 C40%en ' ý T C % M n- .
Cu 0%0%I0 00in T Min 0 1M
$-4 a:
ý4 co r -M Cn Or4~ ~ l C4
8to
--4 1 . to
cmu 00% c '. %0 t'.cn z -
020
Cu -4
am
-P4 0
02
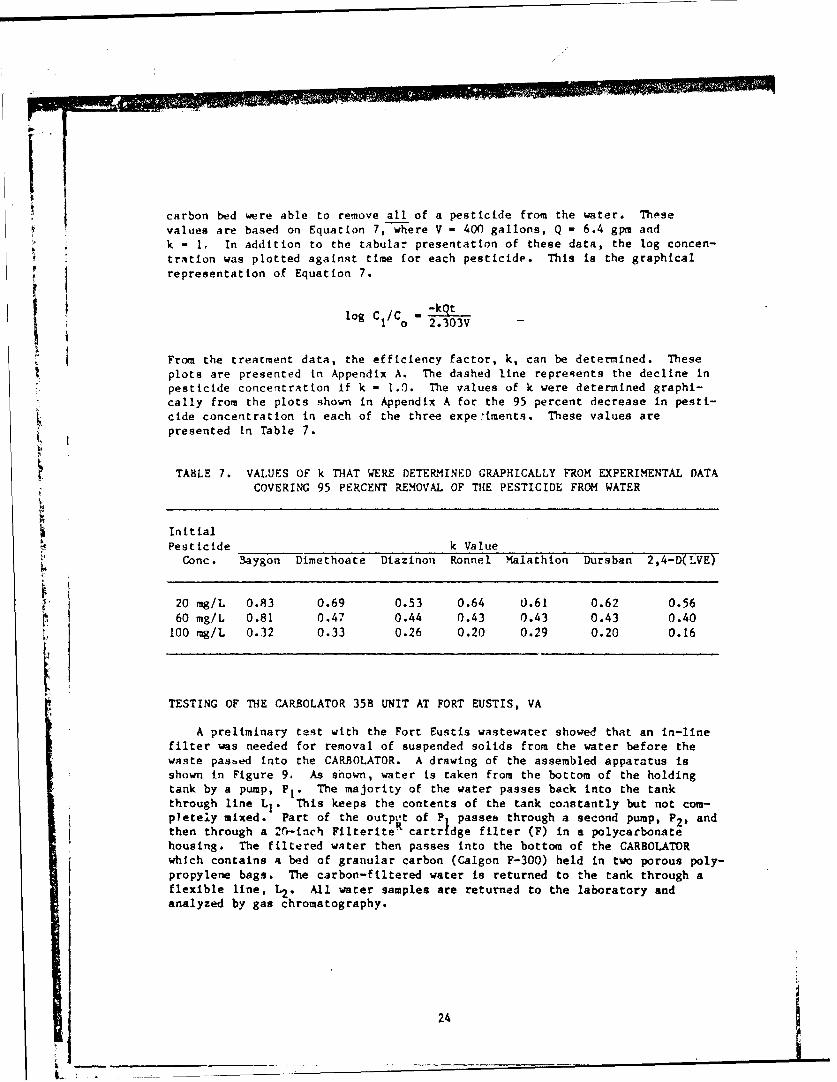
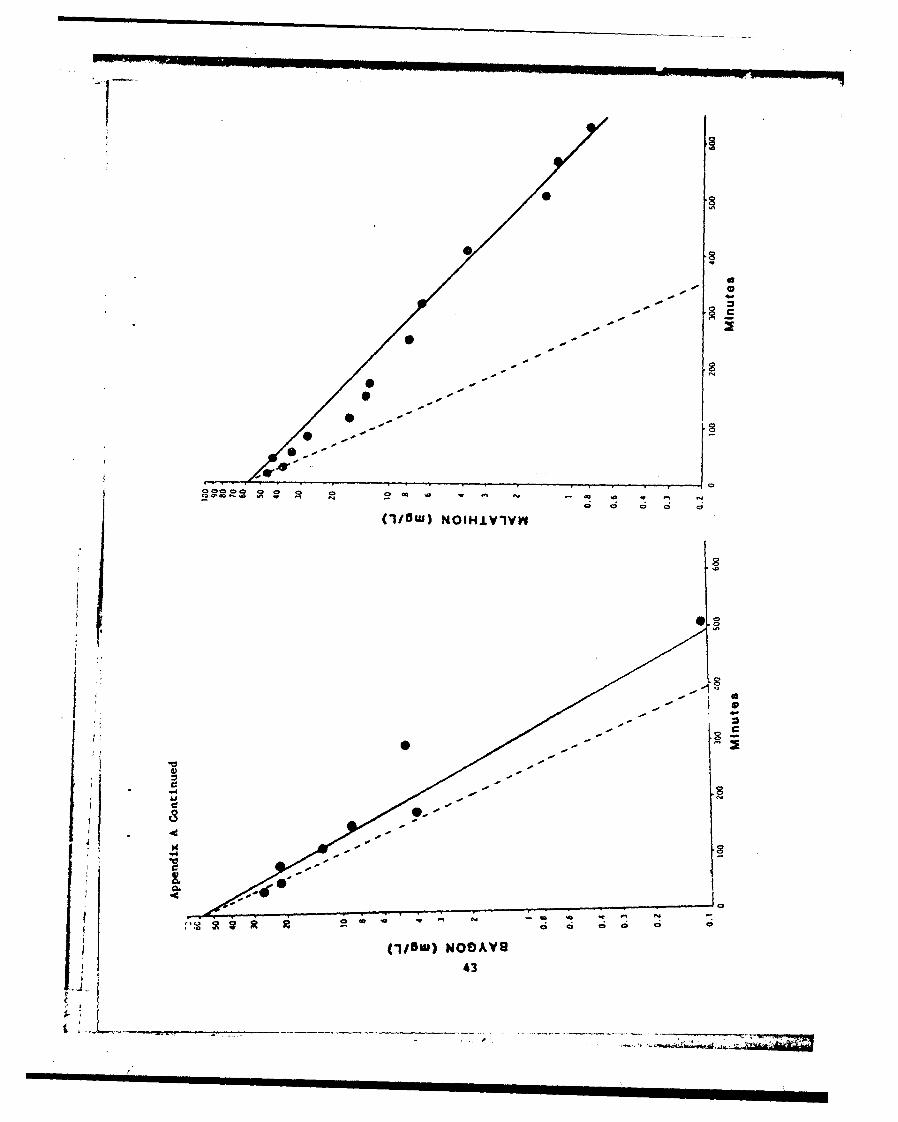
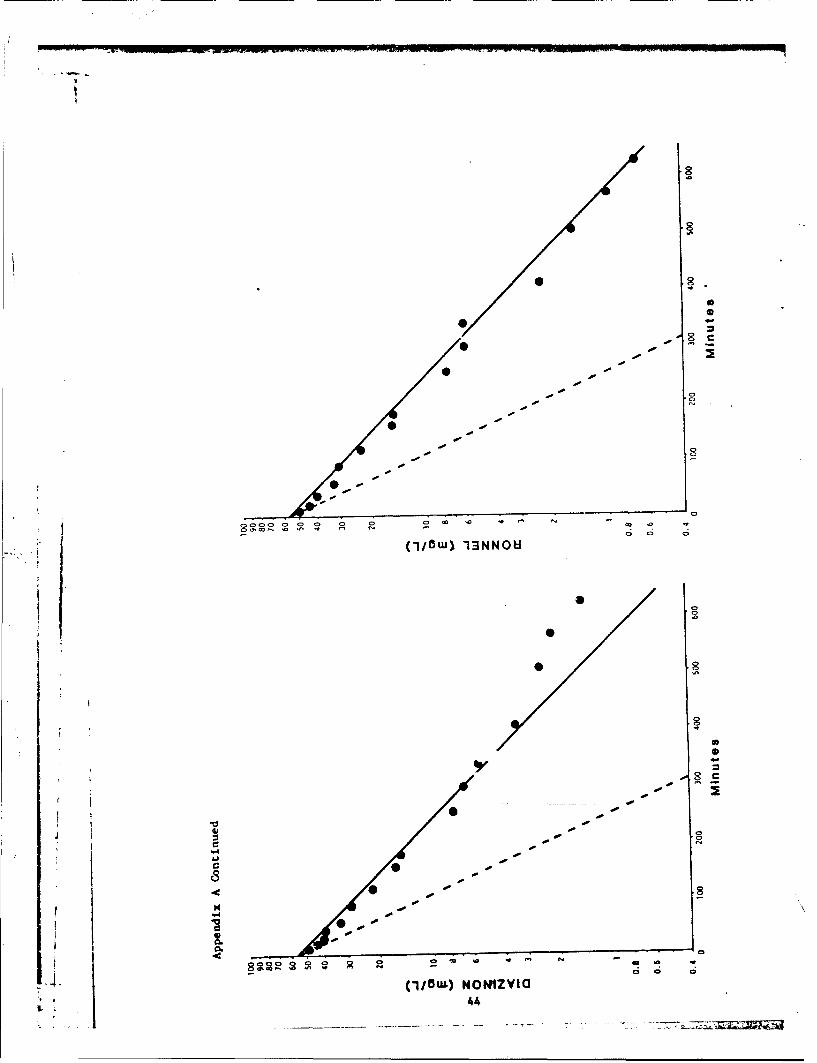
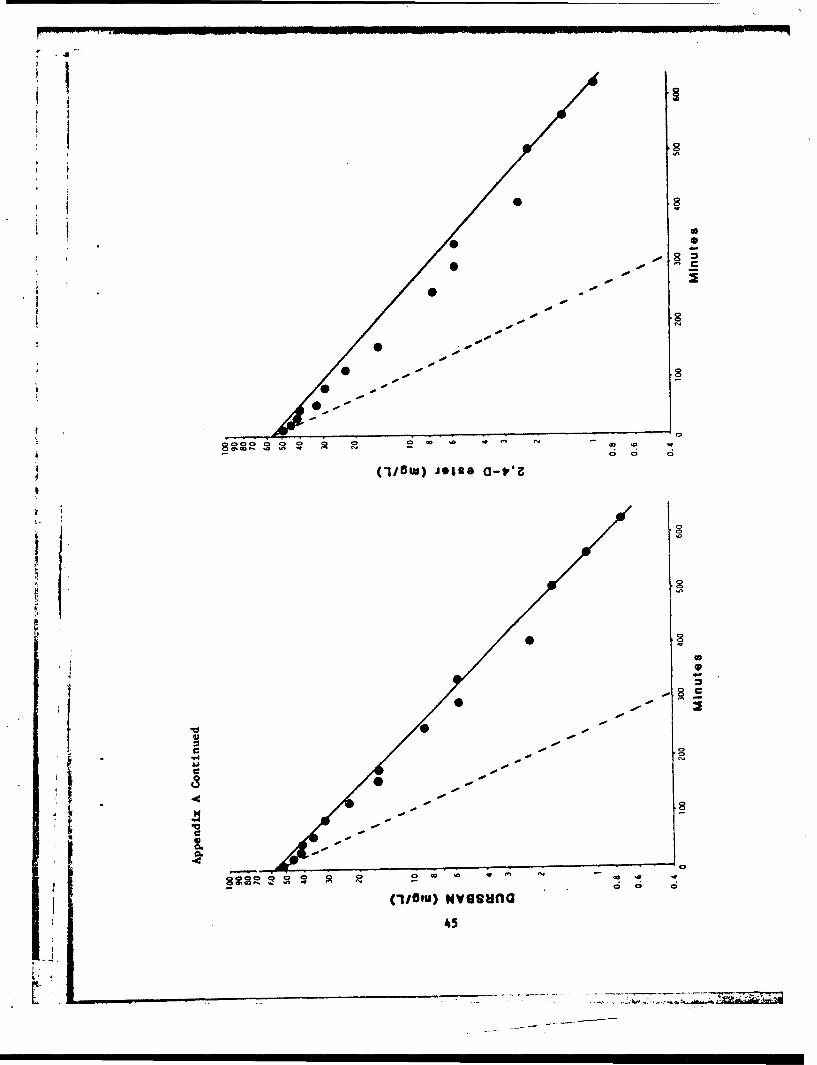
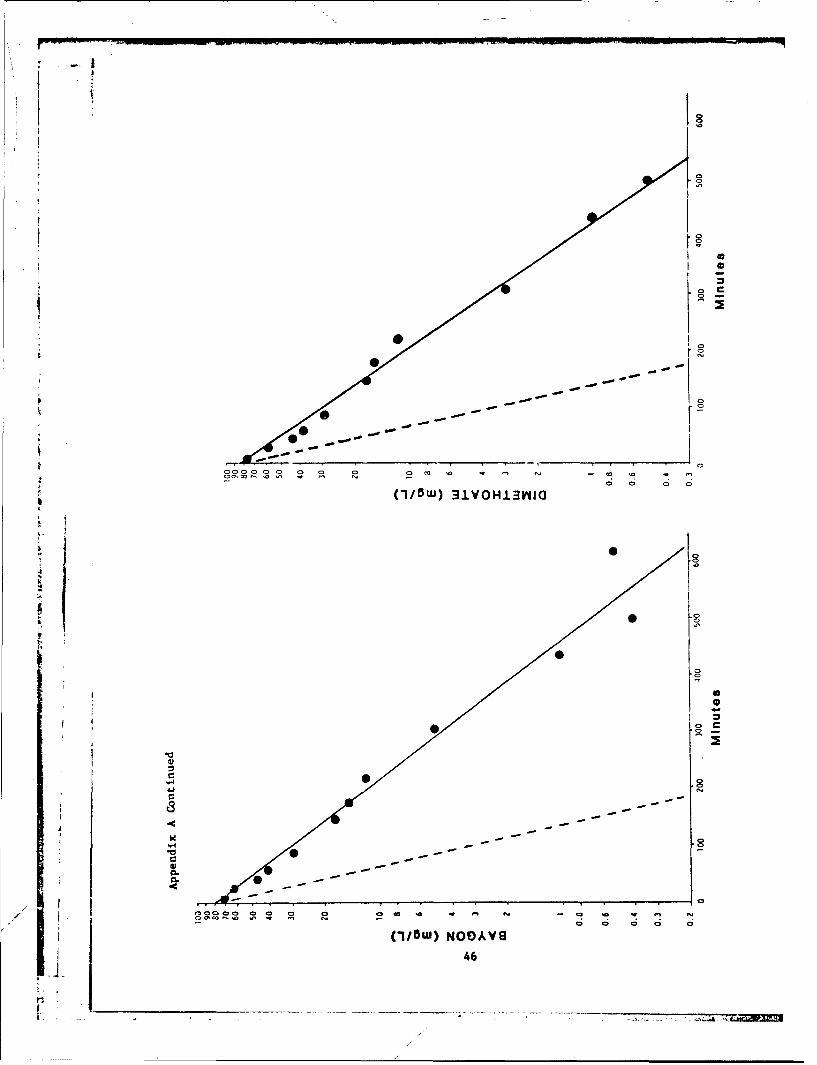
carbon bed were able to remove all of a pesticide from the water. Thesevalues are based on Equation 7, where V - 400 gallons, Q - 6.4 gpm andk - 1, In addition to the tabular presentation of these data, the log concen-tration was plotted against time for each pesticide. This is the graphicalrepresentation of Equation 7.
F I~log C/C 2"S i1 2.303V
From the treatment data, the efficiency factor, k, can be deternined. Theseplots are presented in Appendix A. The dashed line represents the decline inpesticide concentration if k - 1.0. The values of k were determined graphi-cally from the plots shown in Appendix A for the 95 percent decrease in pesti-cide concentration in each of the three experiments. These values arepresented in Table 7.
TABLE 7. VALUES OF k THAT WERE DETERMINED GRAPHICALLY FROM EXPERIMENTAL DATACOVERING 95 PERCENT REMOVAL OF THE PESTICIDE FROM WATER
InitialPesticide k Value
Conc. Baygon Dimethoate Diazinon Ronnel Malathion Dursban 2,4-D(LVE)
20 mg/L 0.83 0.69 0.53 0.64 0.61 0.62 0.5660 mg/L 0.81 0.47 0.44 0.43 0.43 0.43 0.40
100 mg/L 0.32 0.33 0.26 0.20 0.29 0.20 0.16
TESTING OF THE CARBOLATOR 35B UNIT AT FORT EUSTIS, VA
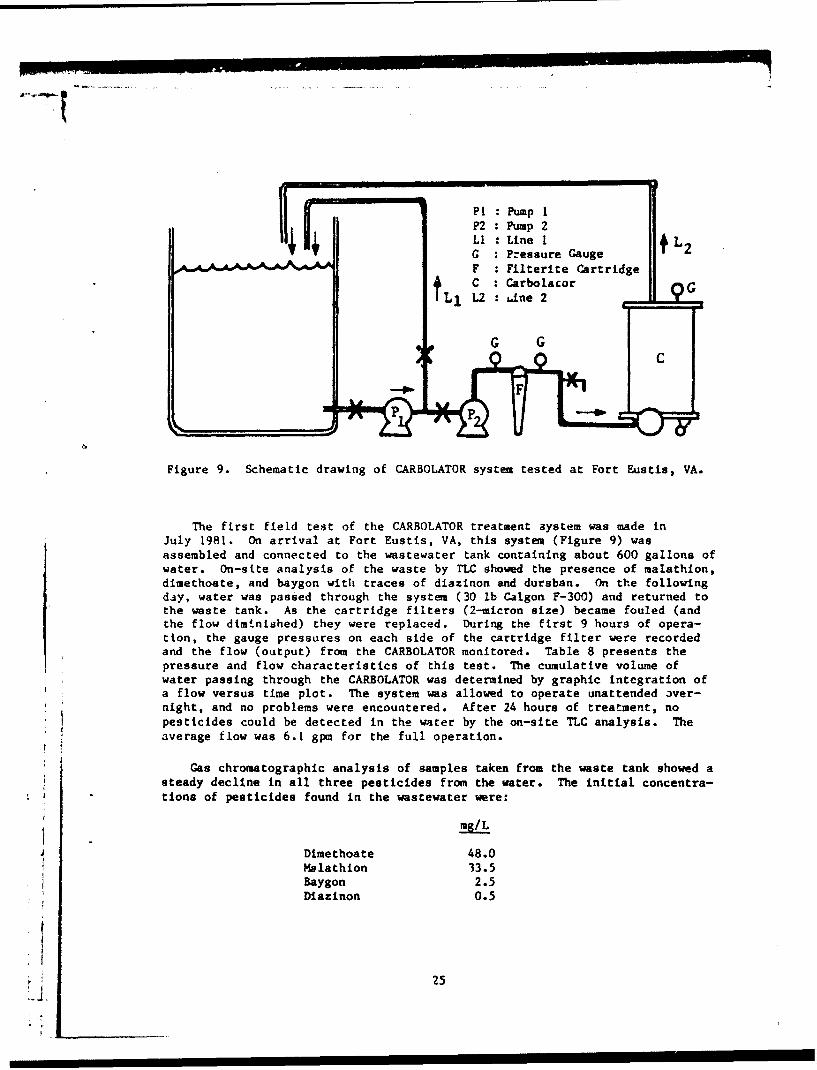
A preliminary test with the Fort Eustis wastewater showed that an in-linefilter was needed for removal of suspended solids from the water before thewaste passed into the CARBOLATOR. A drawing of the assembled apparatus isshown in Figure 9. As shown, water is taken from the bottom of the holdingtank by a pump, Pt. The majority of the water passes back into the tankthrough line L1 . This keeps the contents of the tank constantly but not com-pletely mixed. Part of the outpit of P passes through a second pump, P2, andthen through a 20-inch FilteriteR cartridge filter (F) in a polycarbonatehousing. The filtered water then passes into the bottom of the CARBOLATORwhich contains a bed of granular carbon (Calgon F-300) held in two porous poly-propylene bags. The carbon-filtered water is returned to the tank through aflexible line, L2. All water samples are returned to the laboratory andanalyzed by gas chromatography.
24
k
P1 : Pump 1
P2 :Pump 2LI : Line I L2C : Pressure GaugeF : Filterite CartridgeC : Carbolacor i GtL1 L2 : Utne 2
SG G
Figure 9. Schematic drawing of CARBOLATOR system tested at Fort Eustis, VA.
The first field test of the CARBOLATOR treatment aystem was made inJuly 1981. On arrival at Fort Eustis, VA, this system (Figure 9) wasassembled and connected to the wastewater tank containing about 600 gallons ofwater. On-site analysis of the waste by TLC showed the presence of malathion,dimethoate, and baygon with traces of diazinon and dursban. On the followingday, water was passed through the system (30 lb Calgon F-300) and returned tothe waste tank. As the cartridge filters (2-micron size) became fouled (andthe flow diminished) they were replaced. During the first 9 hours of opera-tion, the gauge pressures on each side of the cartridge filter were recordedand the flow (output) from the CARBOLATOR monitored. Table 8 presents thepressure and flow characteristics of this test. The cumulative volume ofwater passing through the CARBOLATOR was determined by graphic integration ofa flow versus time plot. The system was allowed to operate unattended aver-night, and no problems were encountered. After 24 hours of treatment, nopesticides could be detected in the water by the on-site TLC analysis. Theaverage flow was 6.1 gpm for the full operation.
Gas chromatographic analysis of samples taken from the waste tank showed asteady decline in all three pesticides from the water. The initial concentra-tions of pesticides found in the wastewater were:
mg/ L
Dimethoate 48.0Malathion 33.5Baygon 2.5Diazinon 0.5
25
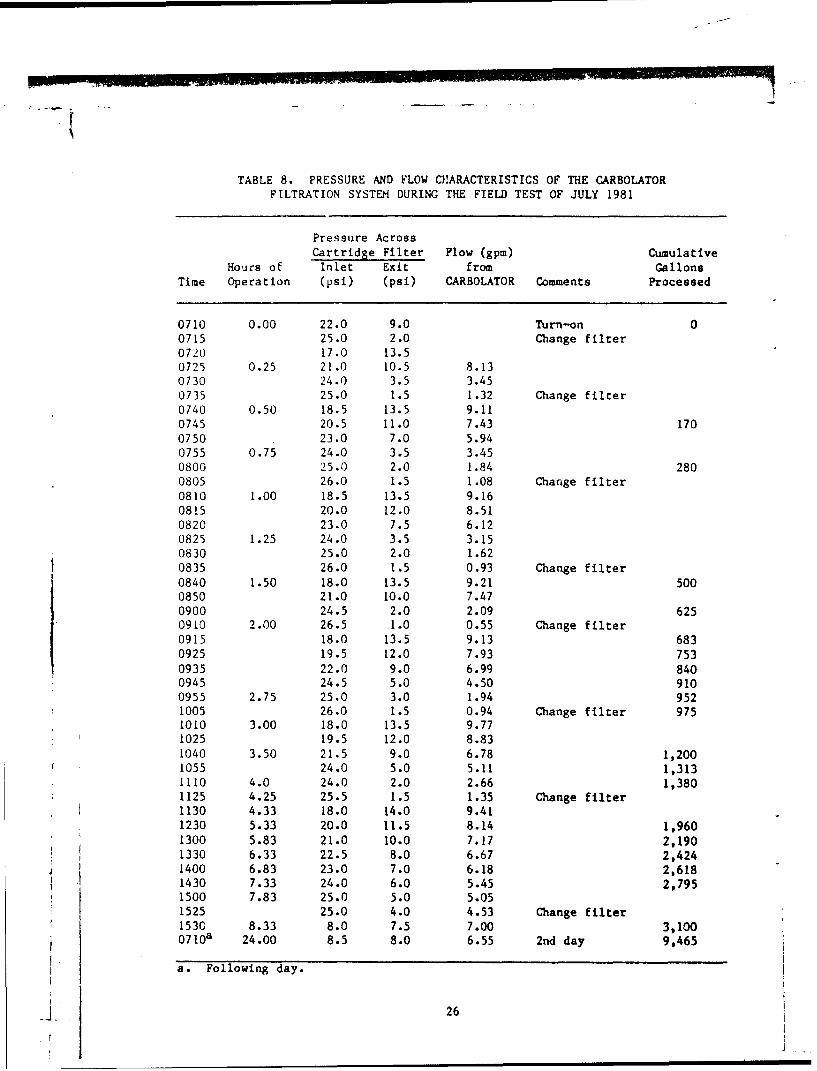
TABLE 8. PRESSURE AND FLOW ChARACTERISTICS OF THE CARBOLATORFILTRATION SYSTEM DURING THE FIELD TEST OF JULY 1981
Pressure Across
Cartridge Filter Flow (gpm) CumulativeHours of Inlet Exit from Gallons
Time Operation (psi) (psi) CARBOLATOR Comments Processed
0710 0.00 22.0 9.0 Turn-on 00715 25.0 2.0 Change filter0720 17.0 13.50725 0.25 21.0 10.5 8.130730 24.0 3.5 3.450735 25.0 1.5 1.32 Change filter
0740 0.50 18.5 13.5 9.110745 20.5 11.0 7.43 1700750 23.0 7.0 5.940755 0.75 24.0 3.5 3.450800 25.0 2.0 1.84 2800805 26.0 1.5 1.08 Change filter
0810 1.00 18.5 13.5 9.160815 20.0 12.0 8.510820 23.0 7.5 6.120825 1.25 24.0 3.5 3.15
0830 25.0 2.0 1.620835 26.0 1.5 0.93 Change filter0840 1.50 18.0 13.5 9.21 5000850 21.0 10.0 7.47
0900 24.5 2.0 2.09 6250910 2.00 26.5 1.0 0.55 Change filter
0915 18.0 13.5 9.13 683
0925 19.5 12.0 7.93 7530935 22.0 9.0 6.99 8400945 24.5 5.0 4.50 9100955 2.75 25.0 3.0 1.94 952
1005 26.0 1.5 0.94 Change filter 9751010 3.00 18.0 13.5 9.77
1025 19.5 12.0 8.831040 3.50 21.5 9.0 6.78 1,200
1055 24.0 5.0 5.11 1,3131110 4.0 24.0 2.0 2.66 1,3801125 4.25 25.5 1.5 1.35 Change filter1130 4.33 18.0 14.0 9.411230 5.33 20.0 11.5 8.14 1,960
1300 5.83 21.0 10.0 7.17 2,190
1330 6.33 22.5 8.0 6.67 2,4241400 6.83 23.0 7.0 6.18 2,618
1430 7.33 24.0 6.0 5.45 2,7951500 7.83 25.0 5.0 5.051525 25.0 4.0 4.53 Change filter
1530 8.33 8.0 7.5 7.00 3,100
0 7 1 0 a 24.00 8.5 8.0 6.55 2nd day 9,465
a. Following day.
26
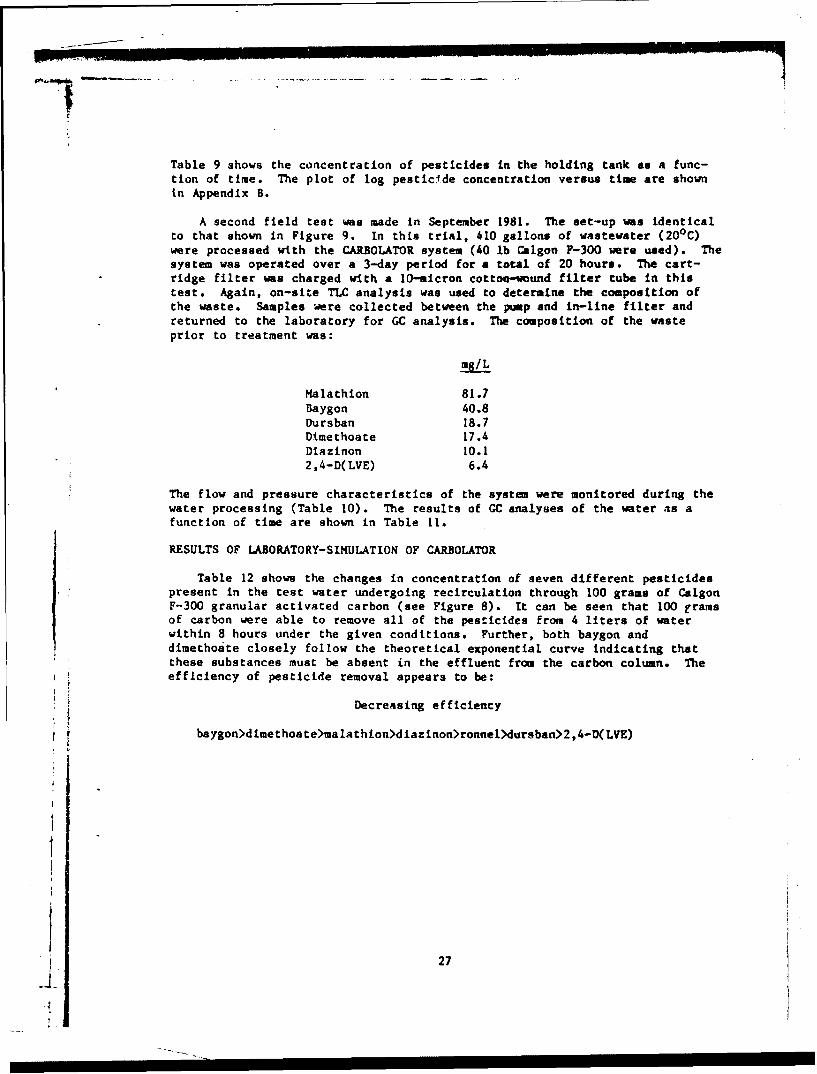
Table 9 shows the concentration of pesticides in the holding tank as a func-tion of time. The plot of log pesticide concentration versus time are shownin Appendix B.
A second field test was made in September 1981. The set-up was identicalto that shown in Figure 9. In this trial, 410 gallons of wastewater (20 0 C)were processed with the CARBOLATOR system (40 lb Calgon F-300 were used). Thesystem was operated over a 3-day period for a total of 20 hours. The cart-ridge filter was charged with a 10-micron cotton-vound filter tube in thistest. Again, on-site TLC analysis was used to determine the composition ofthe waste. Samples were collected between the pump and in-line filter andreturned to the laboratory for GC analysis. The composition of the wasteprior to treatment was:
mg/ L
Malathion 81.7Baygon 40.8Dursban 18.7Dimethoate 17.4Diazinon 10.12,4-D(LVE) 6.4
The flow and pressure characteristics of the system were monitored during thewater processing (Table 10). The results of GC analyses of the water as afunction of time are shown in Table 11.
RESULTS OF LABORATORY-SIMULATION OF CARBOLATOR
Table 12 shows the changes in concentration of seven different pesticidespresent in the test water undergoing recirculation through 100 grams of CalgonF-300 granular activated carbon (see Figure 8). It can be seen that 100 tramsof carbon were able to remove all of the pesticides from 4 liters of waterwithin 8 hours under the given conditions. Further, both baygon anddimethoate closely follow the theoretical exponential curve indicating thatthese substances must be absent in the effluent from the carbon column. Theefficiency of pesticide removal appears to be:
Decreasing efficiency
baygon>dimethoate>malathion>diazinon>ronnel)dursban>2,4-D(LVE)
27
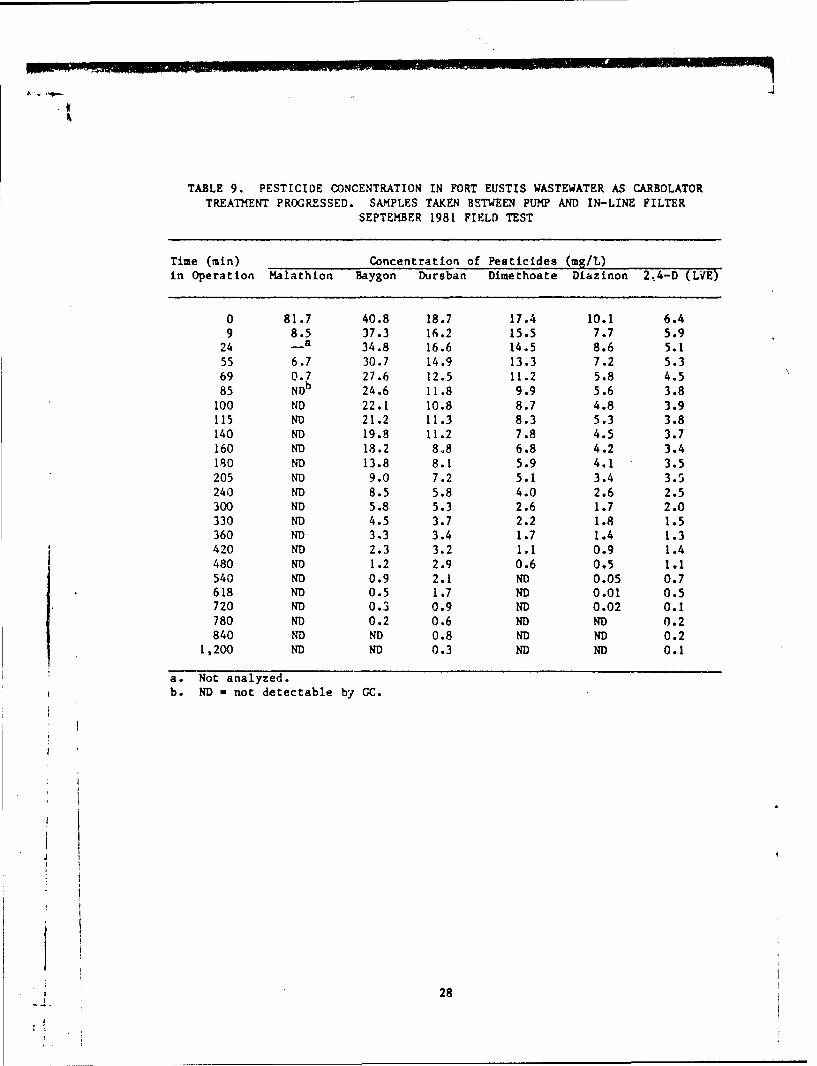
TABLE 9. PESTICIDE CONCENTRATION IN FORT EUSTIS WASTEWATER AS CARBOLATORTREATMENT PROGRESSED. SAMPLES TAKEN BETWEEN PUMP AND IN-LINE FILTER
SEPTEMBER 1981 FIELD TEST
Time (min) Concentration of Pesticides (mg/L)in Operation Malathion Baygon Dursban Dimethoate Diazinon 2.4-D (LVE)
0 81.7 40.8 18.7 17.4 10.1 6.49 8.5 37.3 16.2 15.5 7.7 5.9
24 -a 34.8 16.6 14.5 8.6 5.155 6.7 30.7 14.9 13.3 7.2 5.369 0.7 27.6 12.5 11.2 5.8 4.585 NDb 24.6 11.8 9.9 5.6 3.8
100 ND 22.1 10.8 8.7 4.8 3.9115 ND 21.2 11.3 8.3 5.3 3.8140 ND 19.8 11.2 7.8 4.5 3.7160 ND 18.2 8.8 6.8 4.2 3.4180 ND 13.8 8.1 5.9 4.1 3.5205 ND 9.0 7.2 5.1 3.4 3.5240 ND 8.5 5.8 4.0 2.6 2.5300 ND 5.8 5.3 2.6 1.7 2.0330 ND 4.5 3.7 2.2 1.8 1.5360 ND 3.3 3.4 1.7 1.4 1.3420 ND 2.3 3.2 1.1 0.9 1.4480 ND 1.2 2.9 0.6 0.5 1.1540 ND 0.9 2.1 ND 0.05 0.7618 ND 0.5 1.7 ND 0.01 0.5720 ND 0.3 0.9 ND 0.02 0.1780 ND 0.2 0.6 ND ND 0.2840 ND ND 0.8 ND ND 0.2
1,200 ND ND 0.3 ND ND 0.1
a. Not analyzed.b. ND - not detectable by GC.
i 28
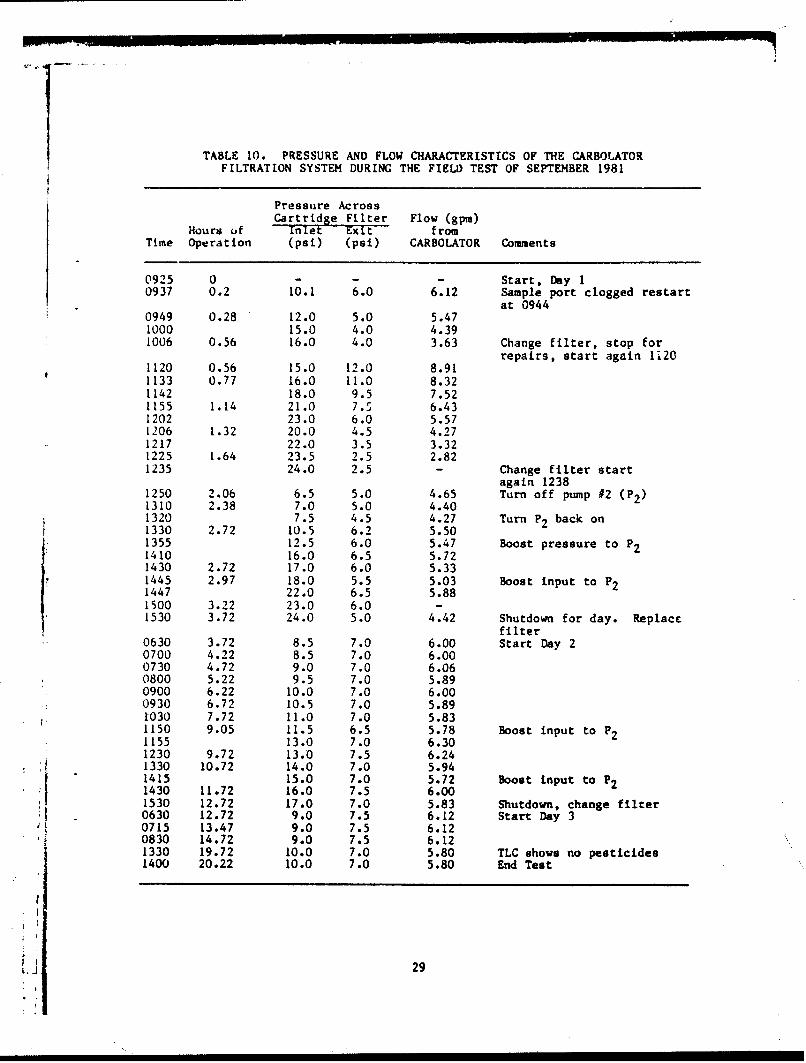
TABLE 10. PRESSURE AND FLOW CHARACTERISTICS OF THE CARBOLATORFILTRATION SYSTEM DURING THE FIELD TEST OF SEPTEMBER 1981
Pressure AcrossCartridge Filter Flow (gpm)
Hours of inlet Exit fromTime Operation (psi) (psi) CARBOLATOR Comments
0925 0 - - - Start, Day I0937 0.2 10.1 6.0 6.12 Sample port clogged restart
at 09440949 0.28 12.0 5.0 5.47
1000 15.0 4.0 4.391006 0.56 16.0 4.0 3.63 Change filter, stop for
repairs, start again 1i201120 0.56 15.0 12.0 8.911133 0.77 16.0 11.0 8.321142 18.0 9.5 7.521155 1.14 21.0 7.5 6.431202 23.0 6.0 5.571206 1.32 20.0 4.5 4.271217 22.0 3.5 3.321225 1.64 23.5 2.5 2.821235 24.0 2.5 - Change filter start
again 12381250 2.06 6.5 5.0 4.65 Turn off pump #2 (P2)1310 2.38 7.0 5.0 4.401320 7.5 4.5 4.27 Turn P 2 back on1330 2.72 10.5 6.2 5.501355 12.5 6.0 5.47 Boost pressure to P 21410 16.0 6.5 5.721430 2.72 17.0 6.0 5.331445 2.97 18.0 5.5 5.03 Boost input to P21447 22.0 6.5 5.881500 3.22 23.0 6.0 -1530 3.72 24.0 5.0 4.42 Shutdown for day. Replace
filter
0630 3.72 8.5 7.0 6.00 Start Day 2070U 4.22 8.5 7.0 6.000730 4.72 9.0 7.0 6.060800 5.22 9.5 7.0 5.890900 6.22 10.0 7.0 6.00
0930 6.72 10.5 7.0 5.89103U 7.72 17.0 7.0 5.831150 9.05 11. .5 5.78 Boost input to P21155 13.0 7.0 6.301230 9.72 13.0 7.5 6.241330 10.72 14.0 7.0 5.941415 15.0 7.0 5.72 Boost input to P21430 11.72 16.0 7.5 6.001530 12.72 17.0 7.0 5.83 Shutdown, change filter0630 12.72 9.0 7.5 6.1t2 Start Day 30715 13.47 9.0 7.5 6.120830 14.72 9.0 7.5 6.121330 19.72 10.0 7.0 5.80 TLC shows no pesticides1400 20.22 10.0 7.0 5.80 End Test
J, 29
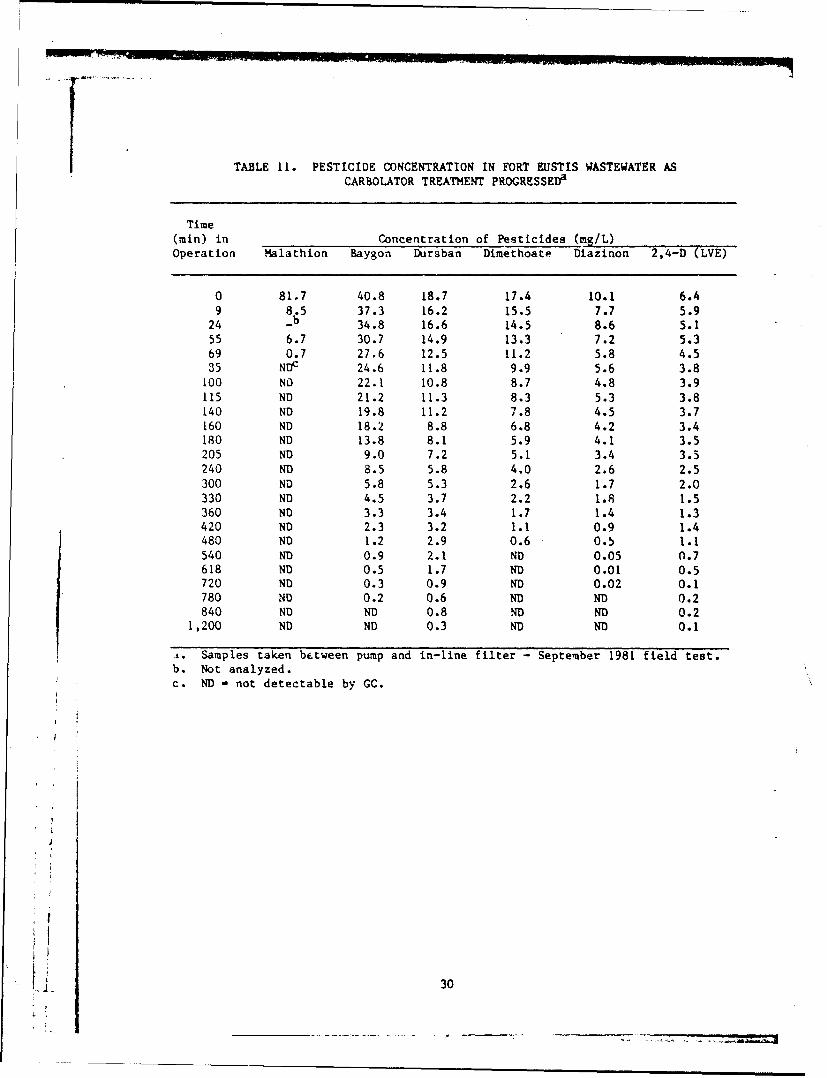
TABLE 11. PESTICIDE CONCENTRATION IN FORT EUSTIS WASTEWATER ASCARBOLATOR TREATMENT PROGRESSEDa
Time(min) in Concentration of Pesticides (mg/L)
Operation Malathion Baygon Dursban Dimethoate Diazinon 2,4-D (LVE)
0 81,7 40.8 18.7 17.4 10.1 6.4
9 8.5 37.3 16.2 15.5 7.7 5.924 34.8 16.6 14.5 8.6 5.155 6.7 30.7 14.9 13.3 7.2 5.369 0.7 27.6 12.5 11.2 5.8 4.535 NDc 24.6 11.8 9.9 5.6 3.8
100 NO 22.1 10.8 8.7 4.8 3.9115 ND 21.2 11.3 8.3 5.3 3.8140 ND 19.8 11.2 7.8 4.5 3.7160 ND 18.2 8.8 6.8 4.2 3.4180 ND 13.8 8.1 5.9 4.1 3.5205 ND 9.0 7.2 5.1 3.4 3.5240 ND 8.5 5.8 4.0 2.6 2.5300 ND 5.8 5.3 2.6 1.7 2.0330 ND 4.5 3.7 2.2 1.8 1.5360 ND 3.3 3.4 1.7 1.4 1.3420 ND 2.3 3.2 1.1 0.9 1.4480 ND 1.2 2.9 0.6 0.5 1.1540 ND 0.9 2.1 ND 0.05 0.7618 ND 0.5 1.7 ND 0.01 0.5720 ND 0.3 0.9 ND 0.02 0.1780 ND 0.2 0.6 ND ND 0.2840 ND ND 0.8 ND ND 0.2
1,200 ND ND 0.3 ND ND 0.1
Samples taken between pump and in-line filter - September 1981 field test.b. Not analyzed.c. ND - not detectable by GC.
Ii 30
-- - - - - -
0 ia- 0% P, fý V)0 r-. C" -
wo4( 4ý ýP o0.4co 0 0 OaD?ýfý-46N * n 4 -
CO O0 T ( T N 0%4 .'
16o C:
z C,
00
t4. AI
W~ C
0 00i611% o o*,
31-
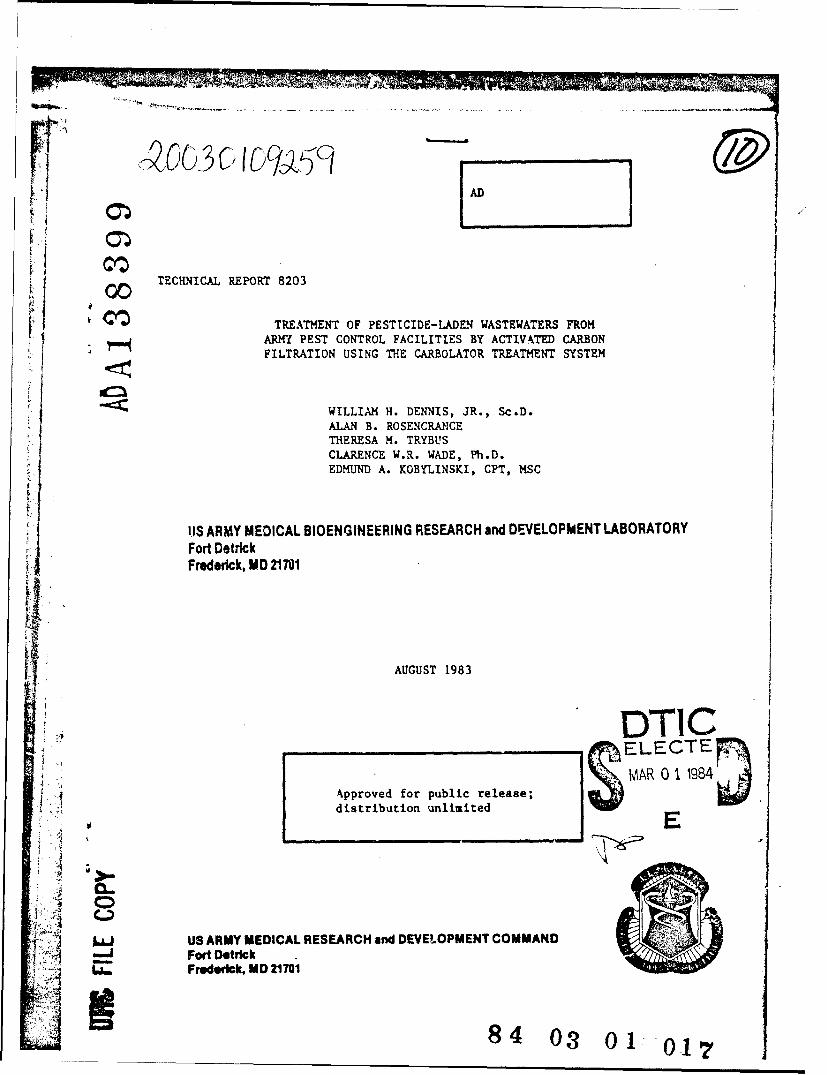
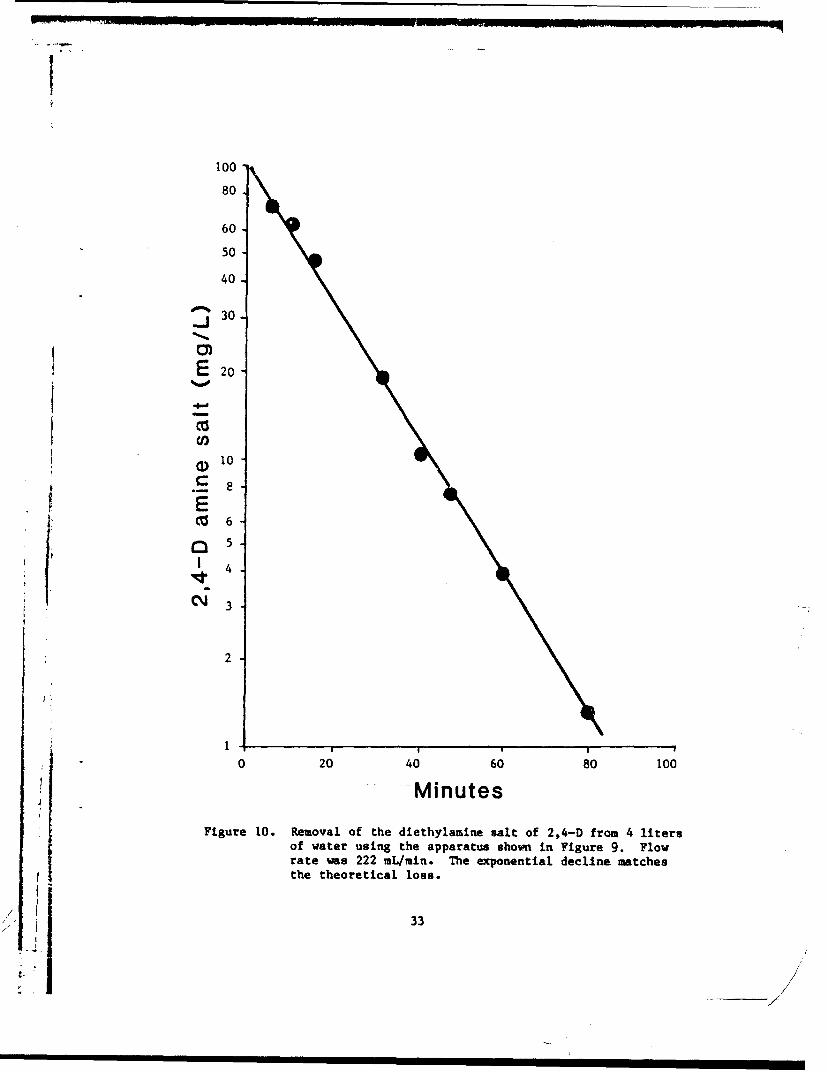
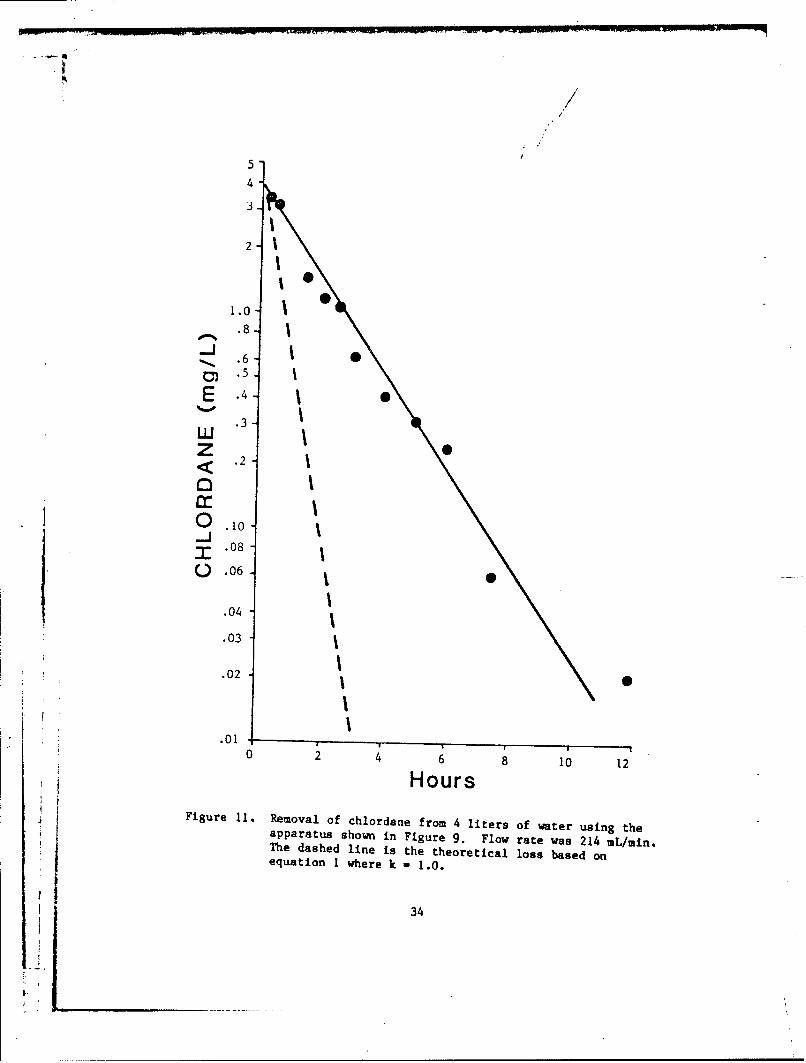
Since some pesticides are not amenable to gas chromatographic analysis inthe presence of other pesticides, it is possible to study such compounds inwater alone. Two such compounds are the 2,4-D diethylamine salt and chlor-dane. Figure 10 shows that the 2,4-D salt is removed from water by carbonwith high efficiency. Chlordane removal, as shown in Figure 11, is very slow.
CAPACITY OF CALGON F-300 FOR PESTICIDE ADSORPTION
It is of great importance to know what mass of pesticides can be adsorbedfrom water by a given quantity of Calgon F-300 granular carbon. To determinethis, 20 grams of Calgun "r-30 were gently shaken with 300 mL of water con-taining four pesticides (suspensions of the emulsifiable concentrates ofdiazinon, baygon, dursban, and malathion at concentrations of 200 mg/L each).
The 20 grams of carbon and 300 mL of suspension were placed in a 600-mLbeaker and mixed with a metal paddle in a jar-test apparatus. Aliquots of thesolution were removed at 5 min, 10 min, 30 min, I hr, 2 hr, and 24 hr. After24 hr the supetnatant liquid was decanted from the 20 grams of carbon. Thissame carbon was then challenged again with 300 mL of a fresh aqueous 3uspen-sion of pesticides, and samples were taken for analysis. This same 20 gramsof carbon was used this way from I day to another for a total of 11 times.The results of these multiple challenges to the same carbon are presented inTable 13. It can be seen that even after nine repetitions, the 20 grams ofcarbon is still able to efficiently remove the pesticides from the water. Atthis point, the carbon is holding about 10 percent of its weight in pesti-cides. Beyond this, the ability of the carbon to bind further amounts ofpesticides declines. On the l1th challenge, the carbon has adsorbed 12.5percent of its weight in pesticides, which Lpears to be the limit.
LEACH TESTING OF THE PESTICIDE-CONTAMINATED CARBON
The use of activated carbon to adsorb pesticidce from wastewaters trans-fers the pollutant from a large volume to a solid, dry, compact form. Theultimate disposal of this spent carbon must be considered. Since the Armypesticide facilities are generators of relatively small quantities of waste,the most practical method would be disposal of the spent carbon in land-fills. This may be done if the material can be shown not to be a "hazardouswaste" as defined by the Environmental Protection Agency (EPA). A test hasbeen published by EPA (Federal Register, Rules and Regulations, Vol. 45, No.98, May 19, 1980) to measure the degree to which hazardous pollutants mayleach from a solid waste in a landfill. Two spent carbons, generated duringlaboratory CARBOLATOR evaluations with Calgon F-300 granular activated carbonand synthetic wastewaters laden with pesticides, were subjected to this EPAleaching test.
A quantity of air-dried spent carbon (25 g) containing a known amount ofpesticide was mixed with 400 mL of glass-distilled water adjusted to pH 5 withacetic acid. This was placed in a screw cap bottle and shaken vigorously on awrist-action shaker for 24 hours. After 24 hours of agitation, the contentsof the flask was filtered through a 0.45 micron filter and diluted to 500 mLwith water. This solution was extracted with CH2 CI 2 (three 25-mL portions),the CH2 CI 2 extract concentrated in a Kuderna-Danish apparatus, and the cnncen-trated CH2 C12 analyied for pesticides by gas chromatography using a nitrogen-piosphorus (NP) detector. (An NP detector is used in order to measure pesti-cides in water when concentration is below I mg/L.) Table 14 shows the
32
100
80
60
50
40
30
E 20
CIO
10C 8i ECO 6
a 5
I 4
2
1~0 20 40 60 80 100
Minutes
Figure 10. Removal of the diethylamine salt of 2,4-D from 4 litersof water using the apparatus shown in Figure 9. Flowrate was 222 mL/min. The exponential decline matchesthe theoretical loss.
33
7/-
t~/
54
2 -
1.0
.8 -
%% .6-J IC• .5 I
E .4 I%f.0 , l.3
z<• .2
0 .10-Jr .08
0 .06
I.04 1.03
.02 I
I.01
0 2 4 6 8 10 12
HoursFigure 11. Removal of chlordane from 4 liters of wter using theapparatus shown in Figure 9. Flow rate was 214 mL/min.
The dashed line is the theoretical loss based onequation I where k - 1.0.
34
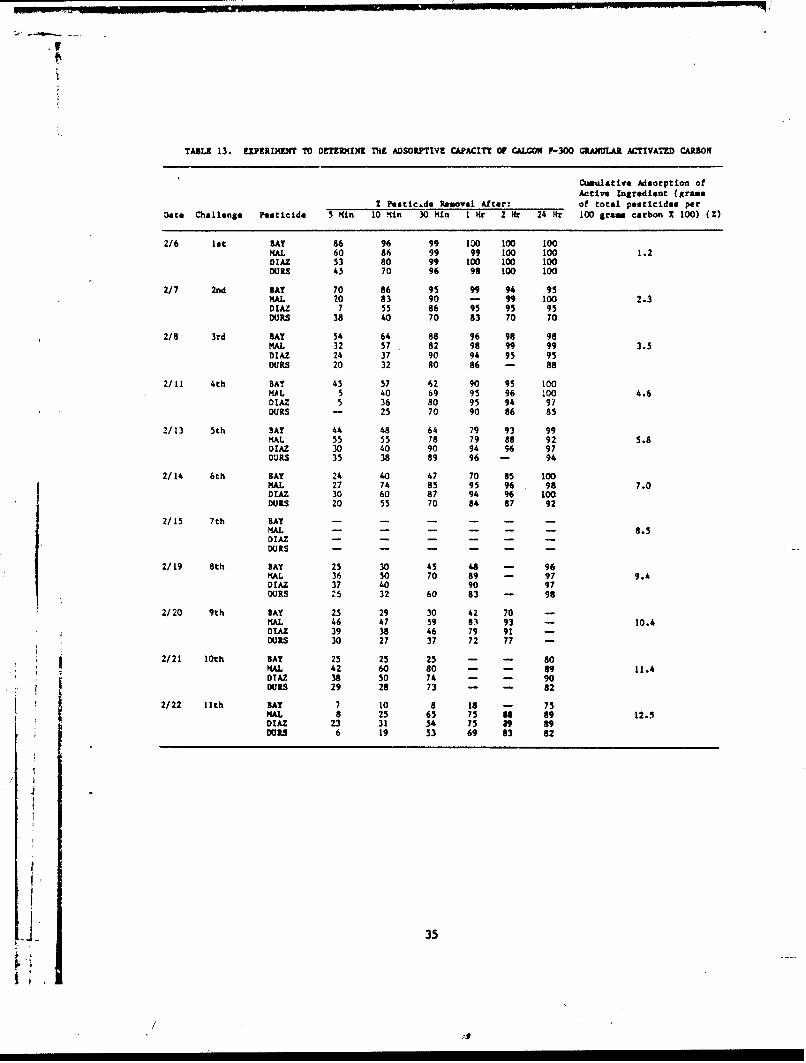
TABLE 13. EXPERIME4NT TO DETEIRMINE THE ADSOPIVE CAPACITY OF CALGOW F-300 GRAULAR. ACTIVATED CARBON
Cumulative Adsorption ofActive Ingredient (Arans
2 Ptstic~de Removal Ater: of total pesticides perDate Challenge Psuticide 5 Min 10 Min 30 Min I Hr 2 Hr 24 Hr 100 gram carbon X 100) (2)
2/6 ltt RAY 86 96 99 130 100 100HAL 60 86 99 99 100 100 1.2DIAZ 53 80 99 100 100 100OURS 45 70 96 98 100 100
2/7 2nd SAY 70 86 95 99 94 95MAL 20 83 90 - 100 2.3DIAZ 7 55 86 95 95 95OURS 38 40 70 83 70 70
2/8 3rd BAY 54 64 88 96 98 98HAL 32 57. 82 98 99 99 3.5DIAZ 24 37 90 94 95 95OURS 20 32 RO 86 - 88
2/11 4th BAY 45 57 62 90 95 100MAL 5 40 69 95 96 :00 4.6DIAZ 5 36 80 95 94 97OURS - 25 70 90 86 85
2/13 5th BAY 44 48 64 79 93 99HAL 55 55 78 79 88 92 5.8DIAZ 30 40 90 94 96 97OURS 35 38 89 96 - 94
2/14 6th BAY 24 40 47 70 85 100HAL 27 74 85 95 96. 98 7.0DIAO 30 60 87 94 96 100DUKS 20 55 70 84 87 92
2/15 7th BAY - - - - - -HAL - - - - - - 8.5DIAZ - - - - - -OURS - - - - - -
2/19 8th BAY 25 30 45 48 - 96HAL 36 50 70 89 - 97 9.4DIAZ 37 40 90 97OURS 15 32 60 83 - 98
2/20 9th SAY 25 29 30 42 70 -KAL 46 47 59 83 93 - 10.4DIAZ 39 38 46 79 91 -DURS 30 27 37 72 77 -
2/21 10th BAY 25 25 25 - - 80MAL 42 60 80 - - 89 11.4DTAZ 38 50 74 - - 90OURS 29 28 73 - - 82
2/22 l1th BAY 7 10 8 18 - 75HAL 8 25 65 75 U 89 12.5DIAZ 23 31 54 75 9 89OURS 6 19 53 69 83 82
/I
1. 3
1;t
/
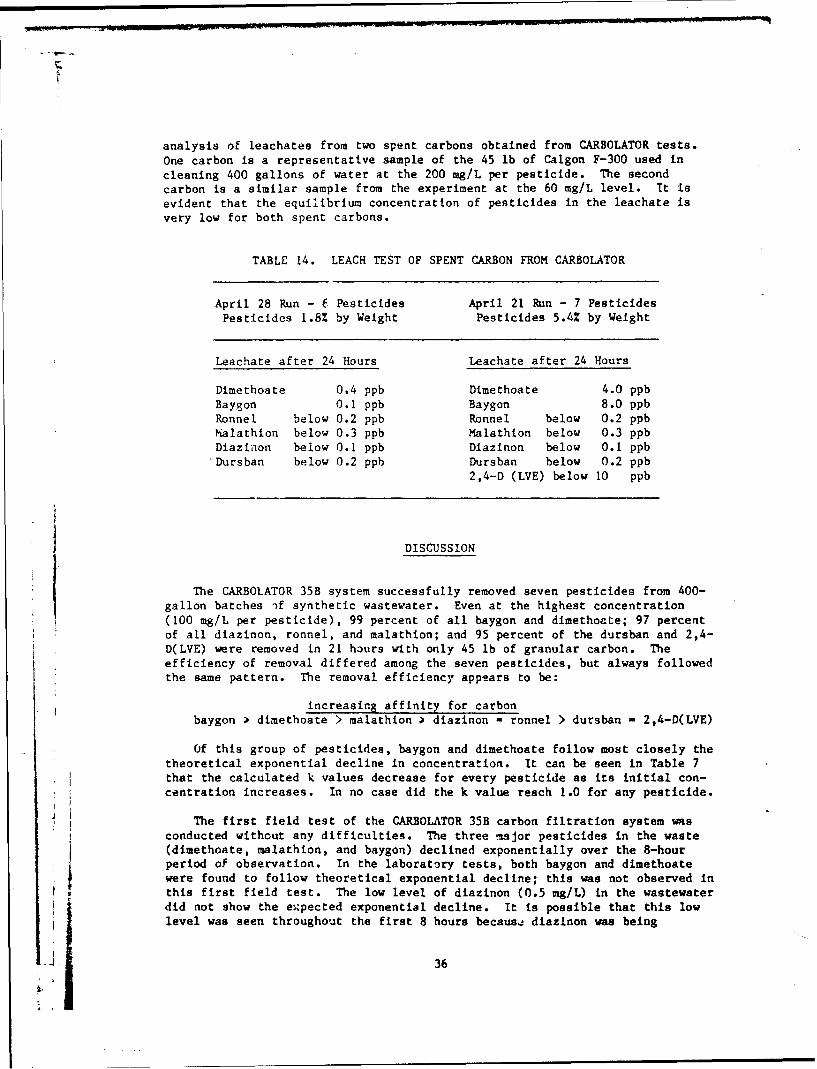
analysis of leachates from two spent carbons obtained from CARBOLATOR tests.One carbon is a representative sample of the 45 lb of Calgon F-300 used incleaning 400 gallons of water at the 200 mg/L per pesticide. The secondcarbon is a similar sample from the experiment at the 60 mg/L level. It isevident that the equilibrium concentration of pesticides in the leachate isvery low for both spent carbons.
TABLE 14. LEACH TEST OF SPENT CARBON FROM CARBOLATOR
April 28 Run - f Pesticides April 21 Run - 7 PesticidesPesticides 1.8% by Weight Pesticides 5.4% by Weight
Leachate after 24 Hours Leachate after 24 Hours
Dimethoate 0.4 ppb Dimethoate 4.0 ppbBaygon 0.1 ppb Baygon 8.0 ppbRonnel below 0.2 ppb Ronnel below 0.2 ppbMalathion below 0.3 ppb Malathion below 0.3 ppbDiazinon below 0.1 ppb Diazinon below 0.1 ppbDursban below 0.2 ppb Dursban below 0.2 ppb
2,4-D (LVE) below 10 ppb
DISCUSSION
The CARBOLATOR 35B system successfully removed seven pesticides from 400-gallon batches if synthetic wastewater. Even at the highest concentration(100 mg/L per pesticide), 99 percent of all baygon and dimethoate; 97 percentof all diazinon, ronnel, and malathion; and 95 percent of the dursban and 2,4-D(LVE) were removed in 21 hours with only 45 lb of granular carbon. Theefficiency of removal differed among the seven pesticides, but always followedthe same pattern. The removal efficiency appears to be:
increasirg affinity for carbonbaygon > dimethoate > malathion > diazinon = ronnel > dursban - 2,4-D(LVE)
Of this group of pesticides, baygon and dimethoate follow most closely thetheoretical exponential decline in concentration. It can be seen in Table 7
* that the calculated k values decrease for every pesticide as its initial con-centration increases. In no case did the k value reach 1.0 for any pesticide.
The first field test of the CARBOLATOR 35B carbon filtration system was
conducted without any difficulties. The three major pesticides in the waste(dimethoate, malathion, and baygon) declined exponentially over the 8-hourperiod of observation. In the laboratory tests, both baygon and dimethoatewere found to follow theoretical exponential decline; this was not observed inthis first field test. The low level of diazinon (0.5 mg/L) in the wastewaterdid not show the expected exponential decline. It is possible that this lowlevel was seen throughout the first 8 hours becausi diazinon was being
36
continuously released from material deposited at the bottom of the tank.Nevertheless, after 24 hours of treatment all pesticides were below the limitof detection.
The second field test was also successful. The plots in Appendix C showdefinite exponential decline in pesticide concentrations. These declines wereslower than the theoretical decline that would be expected based on the flowrate and volume of wastewater. The rapid loss of malathion (more rapid thantheoretical, Table 11) was due to the heterogeneity of the waste. It wasobse'rved during the first few minutes of operation that a heavy oil hadaccumulated in the cartridge filter housing; this was apparently undissolvedmalathion that had been at the bottom of the holding tank. It was revealedlater, that on the day before arrival for this test, an empty 55-gallon drumof 95 percent malathion was rinsed into the sump. This imiscible malathionwas transferred to the holding tank by the sump 'ump. This insoluble materialwas pumped directly into the carbon bed (where it was retained) at the startof the operation. The aqueous phase of the waste contained very little dis-solved malathion. The overall test gave a processed water with no detectablemalathion, baygcn, dirnethoate, or diazinon. At the termination of this test(20 hours), the levels of dursban and 2,4-D ester were 0.3 mg/L and 0.1 mg/T,respectively. Based on previous results, continued operation beyond 20 hourswould have undoubtedly brought these levels to their limits of detection.
In both of these field tests, the application of thin-layer chromatographywas considered to be essential for characterIzing the pesticides in the waterand in monitoring the progress of their removal by the carbon filtrationsystem.
The ability to simulate the CARBOLATOR treatnent system in the laboratoryprovides a tool to predict the behavior of the full-scale system in thefield. With the apparatus shown in Figure 8, the adsorptive behavior of anypesticide with any granular activated carbon in water can be measured. Sev-eral pesticides may be compared simultaneously under a given set of parameterssuch as carbon type, flow rate, loading rate, ceaperature, and carbon bedgeometry. Moreover, these parameters can be varied .iile the aqueous phase isheld constant.
_7
CONCLUSIONS AND RECOMMENDATIONS
1. Pesticide-laden wastewaters generated at US Army Pest Control facilitiescan be successfully treated by carbon filtration through a CARBOLATOR 35BRtreatment system used in a recirculation mode. A pound of Calgon F-300
9 can retain a maximum of 0.1 lb pesticide.
2. The entire system can be assembled from commercial items at a capital cost
of about $3,000.
"3. Waters containing baygon, diazinon, dimethoate, dursban, ronnel, mala-thion, 2,4-D isooctyester and mixtures thereof, are amenable to thistreatment method. Laboratory-scale simulations indicate that 2,4-Ddiethylamine salt, parathion, carbaryl, and chlordane may also be removedfrom water by this method.
4. With the exception of chlordane, 99 percent of all pesticides describedabove can be removed from a 400-gallon batch of water having an initial
concentration of 420 mg/L total pesticides in 24 hours, when theCARBOLATOR is charged with 45 lb of Calgon F-300 carbon and operated
6.4 gpm at ambient temperature.
5. Thin-layer chomatography (TLC) is a simple, cheap, and valuable tool forcharacterizing a wastewater on-site, monitoring the progress of treatment,
Ii and assessing the quality of product water.
6. A spent carbon containing 5.4 percent pesticides by weight shows verylittle leaching of pesticide into water after a 24-hour leach test. Theequilibrium concentration of pesticides in the leachate is in the1-10 ug/L range.
7. The bench-scale model of the CARBOLATOR allows one to predict the behaviorof vatious carbons that could be used in a filtration system as well asthe behavior of pesticides other than those studied in this work.
8. Recommend that all US Army pest control facilities that nave a problemwith pesticide-wastewater disposal consider carbon-filtration as describedabove for the effective treatment of these wastes prior to discharge or
reuse of these waters. A schematic drawing describing the components o2the treatment train and showing their assemblage is given in Appendix 1D.
i
38
.' 00Ii'000 *
o le
- cI- c
C6-
0 6deocu
-U..
* -l
.i -i cic
CSOu NDV,. - -39
J
S
Se
S-. o�- 0
- S
-0
-
0
-�00 0
00� -0 � * 04 - W '0 0� 04 -
0 0 0 0 0 0
(1/5w) NOIH1V1yv�
I 0
S*
SS00
0 .- -
J.J 0.4
0
0��-.
a. 0 0 � � -04 -
0
(1/Ow) NONIZV'a40
i/
CI/UJ NveSSuna
08
o° 8•
;S
In ci o
I " -
(' 0 C '0 .0 ' a-- ' '0 .0 * -~~
0/5w) 13NNOU
41
.00
100, *
x doo
0)0
(VoWj) J910 a-*,aI
420
00
NOH.V 8V
71
- 0
Maw) ODA-
430
0
_______�---�'--�.--�
¶
*a
*-
*
0 -
- 0
*-
-v
* -
000 0 0 0 0 0 0 � 'C t fl - �
� � -. 0 0 0
(i/SW) 1�NNOU
a
0
*
0
V
-4&.1C 0 - - - - - - - -
4 0* - - - - -
-4
a -. -C
e0Q0q�0 � - * 0 V
C 0 0
Cl/OW) NoInzvIa44I
_____ *-------------- - -� - -�*-- --. - - -
ii §
* S
U
0 0
* - -'C
- 2
0 - - -
0 - - S*
0
Oem.- *0 � t r� C%
0000 3 0 0 0 0 *�
(1/SW) Jell. u-t�9
IS
* 0 2
0 - -.41 -
JJ - -. 0
- 0
A 0 -.
A 4 - -.- S
-.a - -
40
0 � 00 �
0 0 0
(,iflw) MYSSUflO
45
-I
0
0I SI -
C
0
- -
- - -
K
00000 0 0 0 0 0 � '0 'fl C'J - C t 'fl
0C*'0f. 0 4' W - 0 0 0 0
(1/Ow) 3±YoH±3vdIa
1F
C0
0
S
0
cC
V
S S
- -
bC
'I 00000 0 CC - - - - - - - - - - - - - - - - - - S�C'"0�fl�'I C '0 * - � -
(1/OW) NODAYG46
,�
F.1§
0
8
* Io�
i* 8
- - ---I
* S -
KOOC'cao C, 0 0 0 0 *0 t '-1 a.. - '0 .0.0a�g,-.,O *0 W .� a...
(1/fJ) NOIH1Y�VV4 0II * 8
* 0
08
0
0
4'
0 8
a - - - -- - 8
14 - -'.4 -S
0.
(�iGW) NONIZYIO - 0
47
K ___________________________
/
O(Do0 -
o/aw) vasu0
04
,� J
I
0
0
0
00
*
i0
@1 0
-- .-
4 -
p4 -
A:----.a.� '0 *� -
(1/Ow) �ei'e a-t'�
I
49
."
___________________________ -a
500
000
400
o Cl
0,..0
00 ~o ~ *~ 00,
(I/Ow) NOIHJ.i~vii- oso
'Il
4)4
(,/Bw) NODAYS
51
.1a
S
C,, 0
U- -z
C-�0 U
- - 0
U- -o - -I-- r
* -- - -
- 4%-
-- U
>. S -
.c�C -0 0 0 0 * - .. - 0 0 t fl �0
0 0 0 0 0 0
-t
o (�i8w) 3LVOHI3flIOX4-4 C5
-- U
Z S C
4 0.0
0
- C
U'U-U-.-- S* S �S
* 2bl....0
C-- I. -
OS
S
., - 4%4-- -S
* C..
.0.00
- g
4J -. - - 'C
0 -. - - -. 0
.0�-
0� * w -, '� a- U 'C 0 9 'U -
0 0 0 0 0 a
(�/BW) NV9S�fl�52
--I-
U
V
0
*0
b.
* cCz
000
00 '0
-
* �0'�
- -- -
----- '0.--- -
o 0 W 0 * 1' CS - *3 0 9" CS -CS - 0 0 0 0 0 C
II* I' F:
CS
SI-
I:*3
ED
.1
U
w - --.4 --U - -
0
a a a a a C
(�/Sui) NONiZYIO
III - --
f
Appendix C Continued
100
80.70.60.
50.
40
30.
20
10.8,
2. 6.
E \%,- 4,
Z 3 \0
2 \
\01a
0.8-
0.6
0.4
0.3.
0.2..\
I" ~0.1
0 2 4 6 a' 10 12 14 1 8 2
Hours
54
4J4P
414
z M
- aJ
,,..-
CC
qC6
S'. 4• %oo.4 . . .....
I.
II
m m l l I'
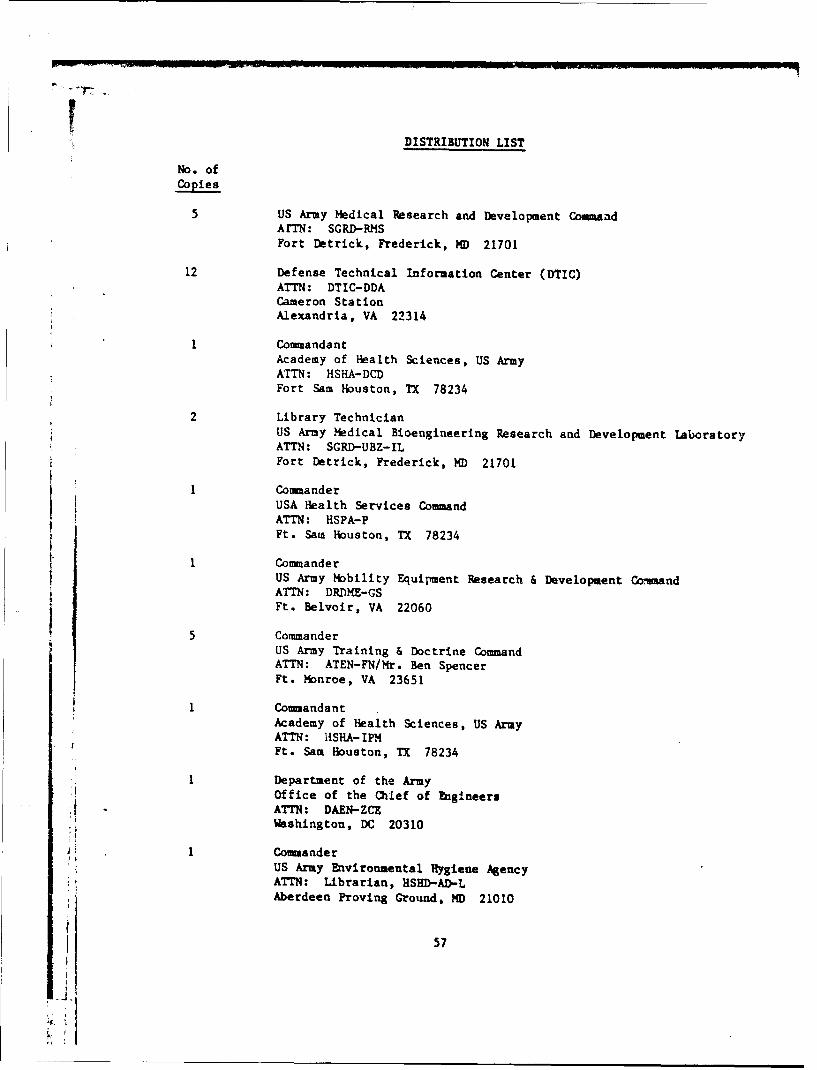
DISTRIBUTION LIST
No. ofCopies
5 US Army Medical Research and Development CouaaadArTN: SGRD-RMSFort Detrick, Frederick, MD 21701
12 Defense Technical Information Center (DTIC)ATTN: DTIC-DDACameron StationAlexandria, VA 22314
1 ConmandantAcademy of Health Sciences, US ArmyATTN: HSHA-DCDFort Sam Houston, TX 78234
2 Library TechnicianUS Army Medical Bioengineering Research and Development LaboratoryATTN: SGRD-UBZ-ILFort Detrick, Frederick, MD 21701
I CommanderUSA Health Services CommandATTN: HSPA-PFt. Sam Houston, TX 78234
1 CommanderUS Army Mobility Equipment Research & Development ComnandATTN: DRDME-GSFt. Belvoir, VA 22060
5 CommanderUS Army Training & Doctrine CommandATTN: ATEN-FN/Mr. Ben SpencerFt. Monroe, VA 23651
I CommandantAcademy of Health Sciences, US ArmyATTN: IISHA-IPMFt. Sam Houston, TX 78234
I Department of the ArmyOffice of the Chief of FItgineersATTN: DAEN-ZCEWashington, DC 20310
1 CommanderUS Army Environmental Hygiene Agency
ATTN: Librarian, HSHD--AD-LAberdeen Proving Ground, MD 21010
57
I
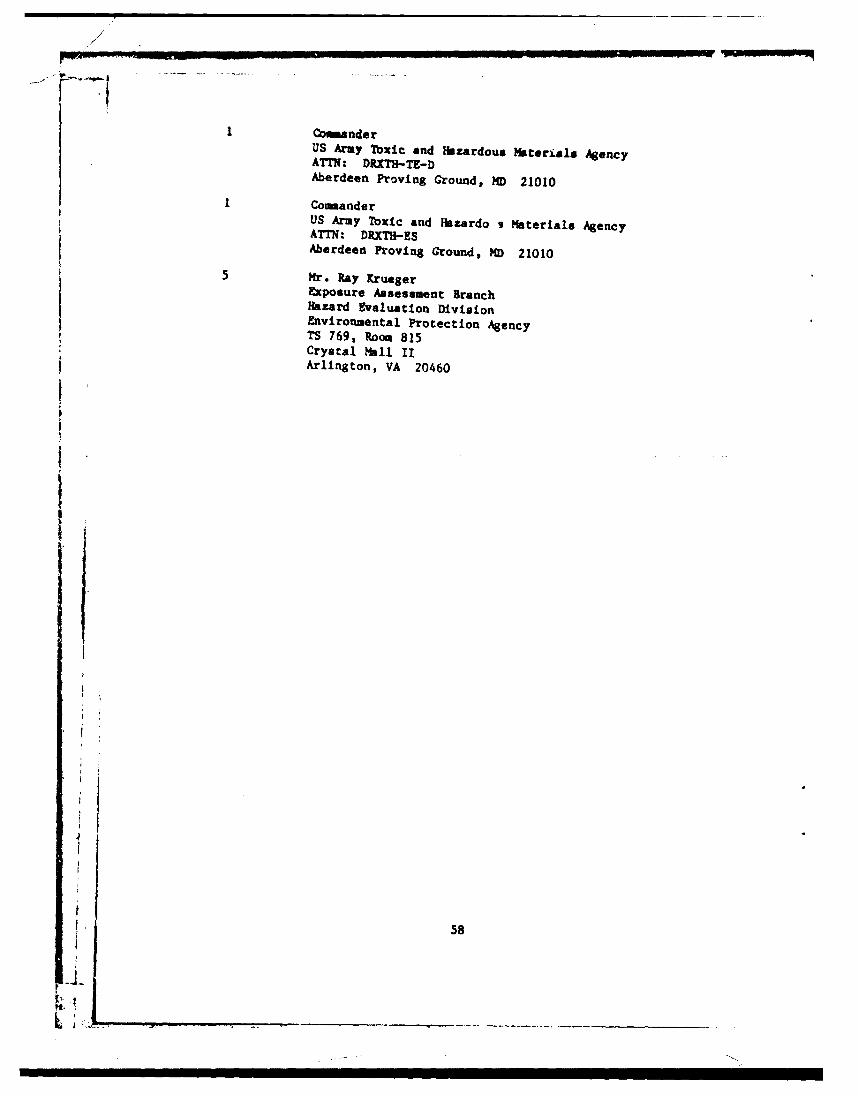
I CowmnderUS Army Toxic and Hazardous Materials AgencyATTN: DRXTH-TE-DAberdeen Proving Ground, MD 21010
1 CommanderUS Army Toxic and Hazardo s Materials AgencyATTN: DRXTH-ESAberdeen Proving Ground, MD 21010
5 Mlr. Ray Krueger
Exposure Assessment BranchHazard Evaluation Division
Environmental Protection AgencyTS 769, Room 815Crystal Mall IIArlington, VA 20460
i
}I
58
I