Embed Size (px)
Citation preview
Acrylamide testing at CFSANExploratory survey results
Lauren M. Posnick, Sc.D.
Public Meeting
September 30, 2002

Outline• Goals of exploratory testing program
• CFSAN method for acrylamide analysis
• Exploratory testing and overall sampling
strategy
• Results of testing to date
• Summary

Goals of exploratory acrylamide testing program
• Initial survey of levels of acrylamide in U.S. foods
• Identify the types of foods that need to be examined in the future

CFSAN acrylamide method
• CFSAN method developed byDr. Steven Musser and colleagues
• Liquid chromatography/tandem mass spectrometry method (LC/MS/MS)
• Method posted on CFSAN website June 20 and updated July 23

CFSAN acrylamide method
• Limit of quantitation (LOQ):– 10 parts per billion (ppb)
• Validation process ongoing– Single-lab validation being completed– Interlaboratory validations being planned– International proficiency testing study
• 33 international laboratories• FDA value within 3.5% of “assigned” value
How did we select samples:Overall Sampling Strategy
1. Starting point
– Foods identified previously
– Determine results for US foods
2. Expand sampling set based on:
– Wide breadth of foods
– Mechanistic insights
– Consumption rates

Overall sampling strategy for U.S. foods
3. Evaluate variability in foods
4. Evaluate exposure in Total Diet Study samples

Where we are now
• FDA is now partway through sampling strategy– Confirmation, breadth, mechanisms
• More than 150 food products
• About 500 analyses

Categories tested• Baby foods• Canned vegetables• Cereals• Chocolate products• Coffee• Cookies• Crackers• French fries
• Gravies and seasonings• Infant formulas• Miscellaneous• Nuts/nut butters• Potato chips• Protein foods
– Meat, Fish, Chicken, Soy• Snack foods (other)

Keep in mind . . .
• These data cover:– A limited number of food categories– A limited number of products in those
categories– A limited number of brands
• These data do not address:– Lot to lot variation– Unit to unit variation
Keep in mind . . .
• We consider the data an initial set of
data.
• We need to test more samples.

What’s in a level?
• Data on acrylamide levels alone do not indicate exposure or risk:
– How many grams of a food are in a serving?
– How much of this food do people eat?
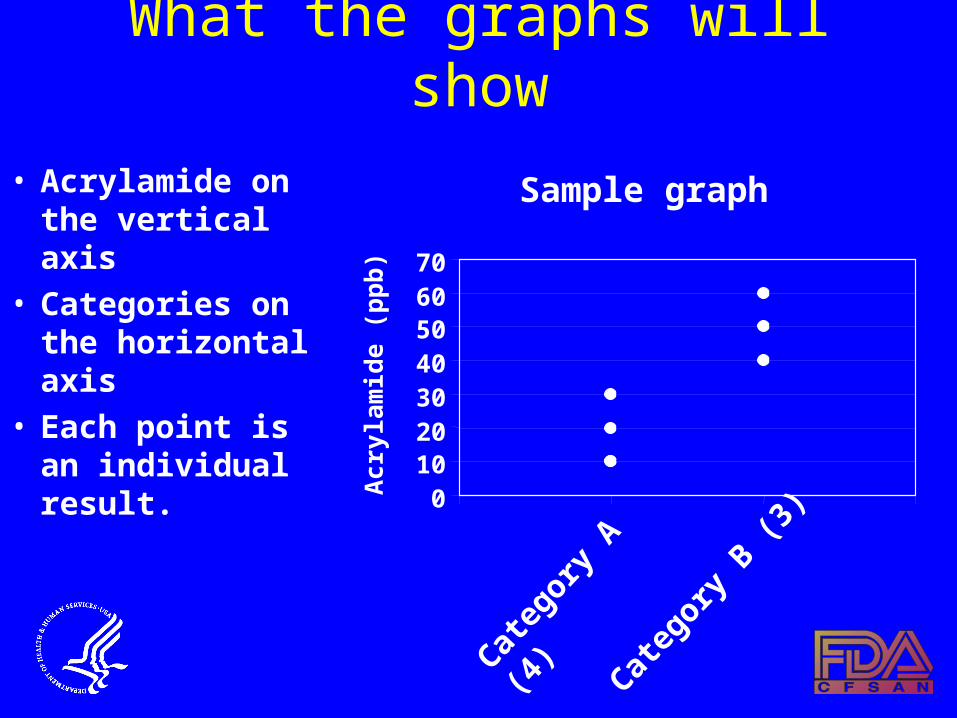
What the graphs will show
• Acrylamide on the vertical axis
• Categories on the horizontal axis
• Each point is an individual result.
Sample graph
010203040506070
Acr
ylam
ide
(pp
b)
Categ
ory A
(4)
Categ
ory B
(3)

What the graphs will show• Some points will
overlap.• The number of
products is given after the category name.
• The categories are grouped on graphs by number of products tested.
Sample graph
010203040506070
Acr
ylam
ide
(pp
b)
Categ
ory A
(4)
Categ
ory B
(3)
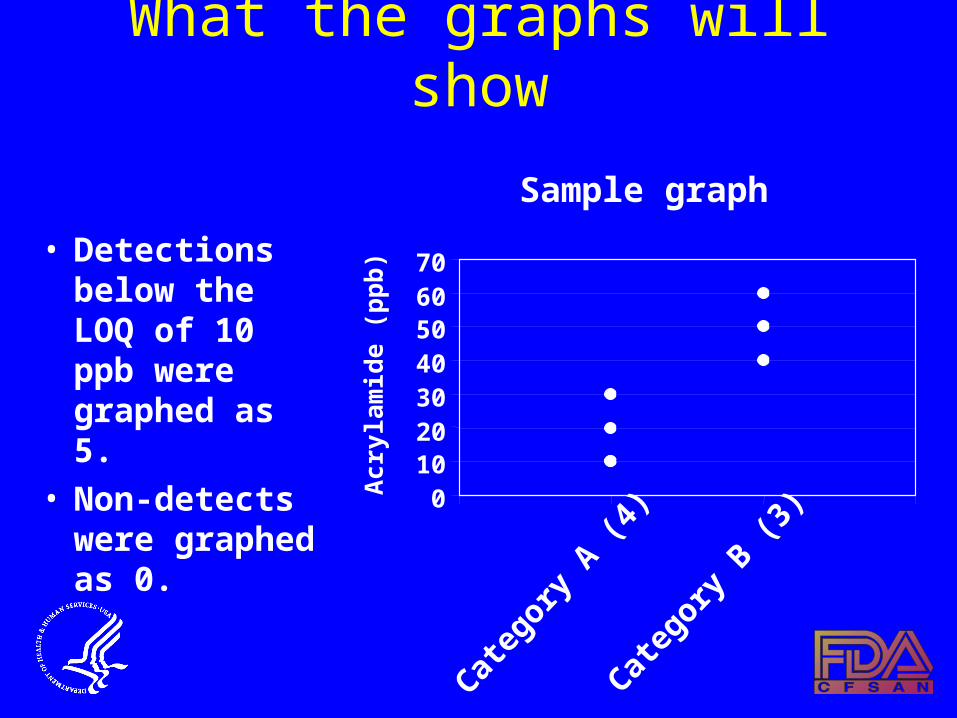
What the graphs will show
• Detections below the LOQ of 10 ppb were graphed as 5.
• Non-detects were graphed as 0.
Sample graph
010203040506070
Acr
ylam
ide
(pp
b)
Categ
ory A
(4)
Categ
ory B
(3)
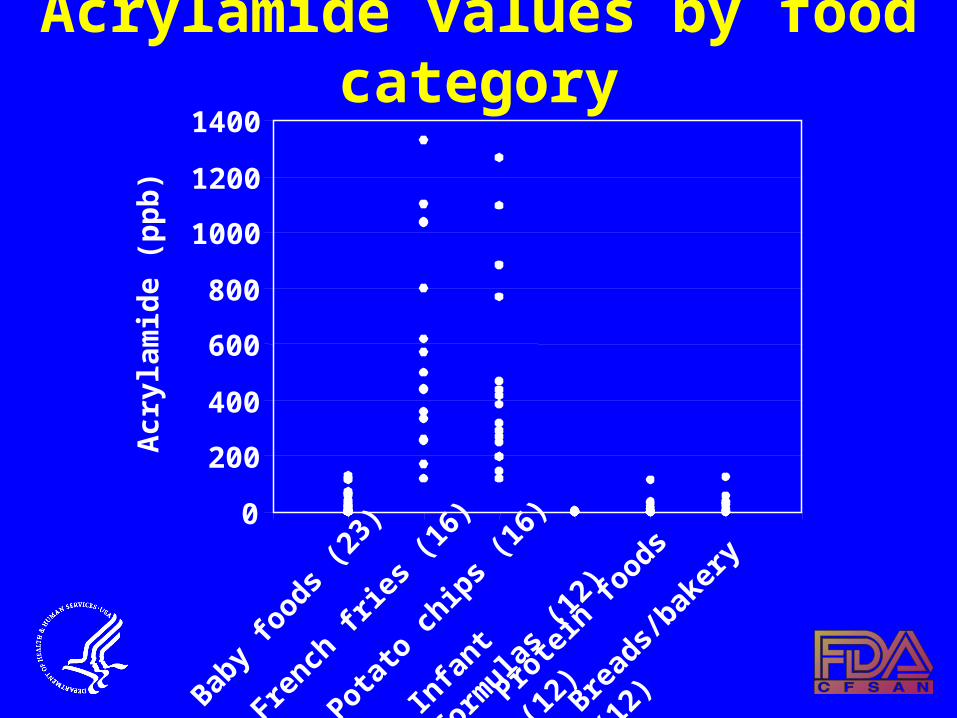
0
200
400
600
800
1000
1200
1400A
cryl
amid
e (p
pb
)
Acrylamide values by food category
Bread
s/ba
kery
(12)Pr
otei
n fo
ods
(12)In
fant
form
ulas
(12)Po
tato
chi
ps (1
6)
Baby
food
s (2
3)
Fren
ch fr
ies (1
6)
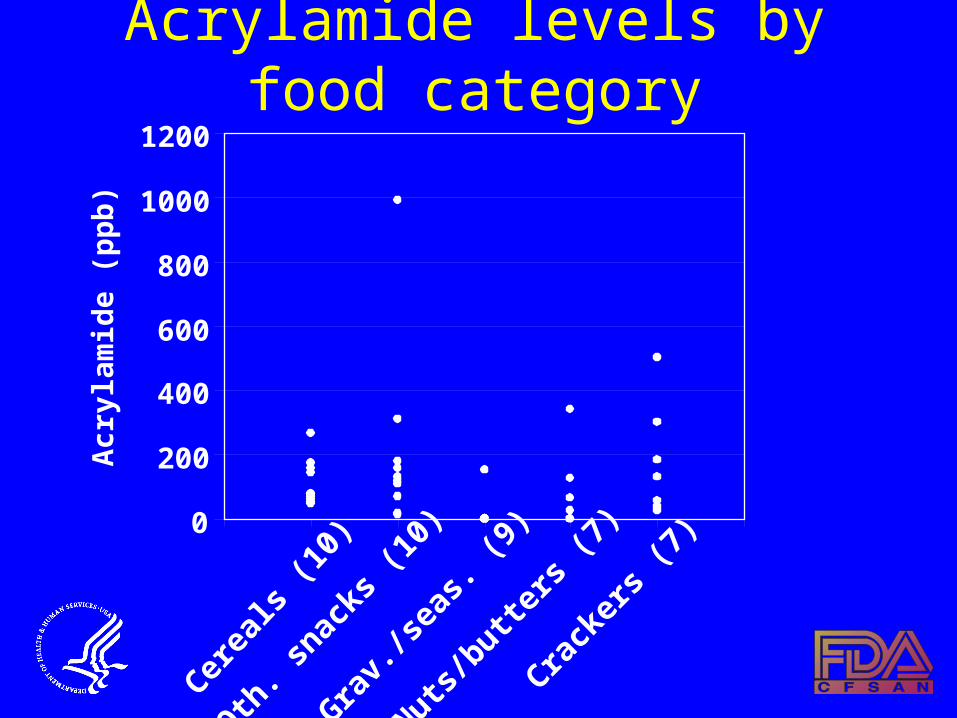
0
200
400
600
800
1000
1200A
cryl
amid
e (p
pb
)Acrylamide levels by food category
Cere
als (1
0)
Oth
. sna
cks (1
0)
Gra
v./sea
s. (9
)
Nut
s/bu
tter
s (7
)Cr
acke
rs (7
)
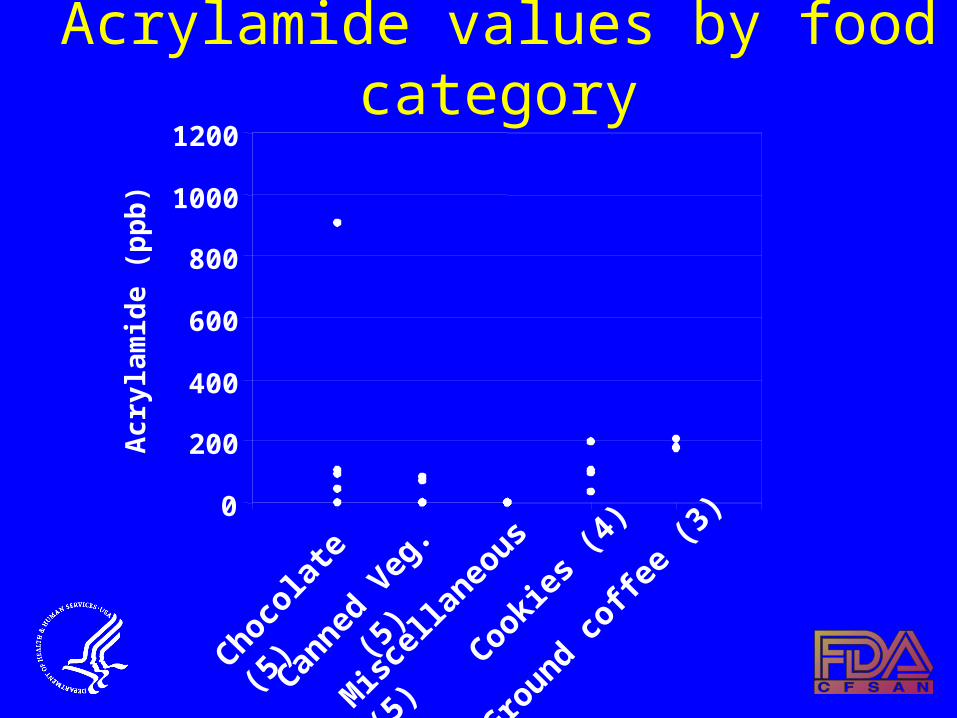
0
200
400
600
800
1000
1200A
cryl
amid
e (p
pb
)
Acrylamide values by food category
Choc
olat
e
(5) Co
okie
s (4
)
Cann
ed V
eg.
(5)
Misce
llane
ous
(5)
Groun
d co
ffee (3
)
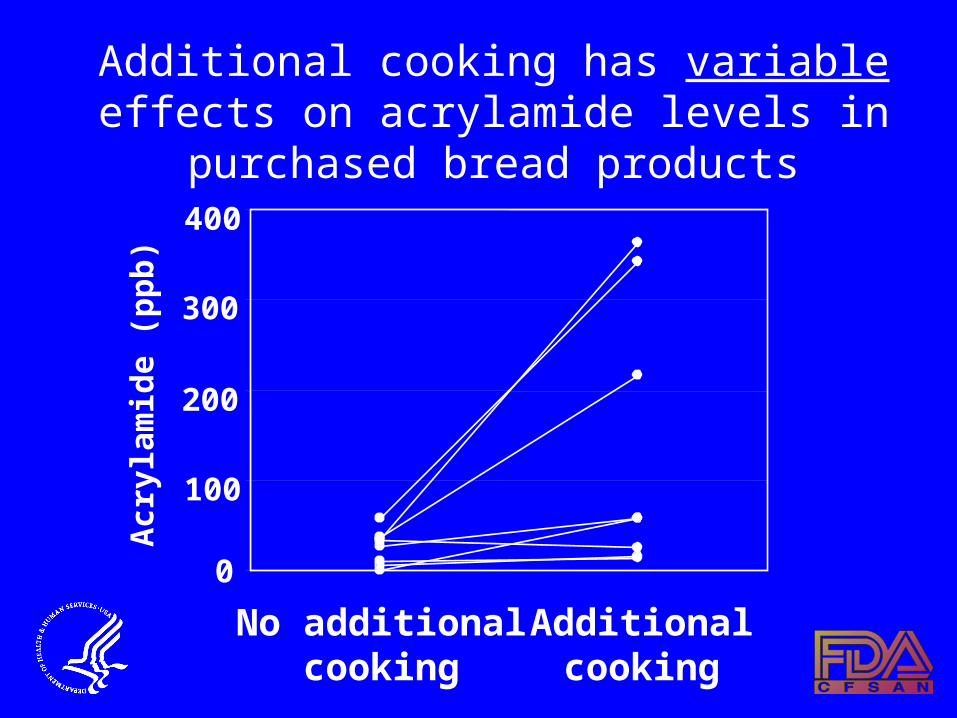
Mechanistic research
• FDA is doing mechanistic research
– Time
– Temperature
– Ingredients
0
100
200
300
400
Acr
ylam
ide
(pp
b)
Additional cooking has variable effects on acrylamide levels in purchased bread products
No additionalcooking
Additionalcooking
Summary
• FDA has measured acrylamide levels in a broad range of products.
• Acrylamide was detected in a variety of foods and at a variety of levels. In some foods, no acrylamide was detected.
• We are finding variability between food categories, within food categories, and between different brands.

Conclusions
• We need to test more and different kinds of foods, as specified in the Action Plan.
• Research on mechanisms has begun.
• More mechanistic research is needed, as specified in the Action Plan.