Embed Size (px)
Citation preview
1
DT Report - Pivot Table Training Manual
Purpose: In this example, user will learn how to run a PS/nVision Detail Transaction (DT) Transdata Report using
Layout: DT_Transdata_Budget_Report for an Executive Area.
1. Navigation to Ps/nVision: Reporting Tools> PS/nVision> Define Report Request
2. Click on Find an Existing Value. And enter the following information:
a. Enter the Business Unit: FIU01
b. Enter the Report ID: DT + first 6 digits of deptID
c. Click Search
3. On the nVision Report Request tab input the following information:
d. Type a Report Title: free form
e. Layout: DT_Transdata_Budget_Report
a
b
c c
2
f. As of Reporting Date: “As of today”
g. Click on “Scope and Delivery Templates”.
4. Type in or look up the Activity Nbr or Project on the Report Scope field. Then click OK.
d
f
e
g

3
5. Click Run Report.
6. Select PSNT.

4
7. Click on Save and then go to Process Monitor.
8. Refresh the Process and then click on Go back to Report Request.

5
9. Click on Report Manager to open the report.
10. Go to the Administration Tab, and click on the report link under the Description section.

6
1. Enable Content and click “Yes”.

7
The DT report main components:
When first run, the report will appear as follow:
Filters
Rows
Columns
Values
Field List

8
The Rows:
a
b
c d
e f
a
b
c d
e
f
By default the DT will be delivered as shown
above with subtotals broken down by:
a- Organizational department
b- Activity Nbr
c- Expense/Revenues Rollup (Rollup3)
d- Budget Rollup (OCO, OPS, OOE, SAL)
e- Budget Account
f- Detail Account (Account2)

9
Row Collapsing or Expanding:
Row Subtotals:
Before:
Rows can be expanded or collapsed at any
level of detail. For example, in this report,
Activity Nbr 1104130006 was collapsed to
show one subtotal for all transactions under
the Activity Nbr.
WARNING: When collapsing rows please be
aware that the revenues and expenses will be
summed together to show one total. To see
your expense available balances, please see
the filter section on page 13.
To avoid confusion due to duplicate subtotals,
you may want sometimes to remove subtotals
from any of the rows that have been selected.
To do so, you can click on the field in the row
box as shown and then click on” Field
Settings…”
10
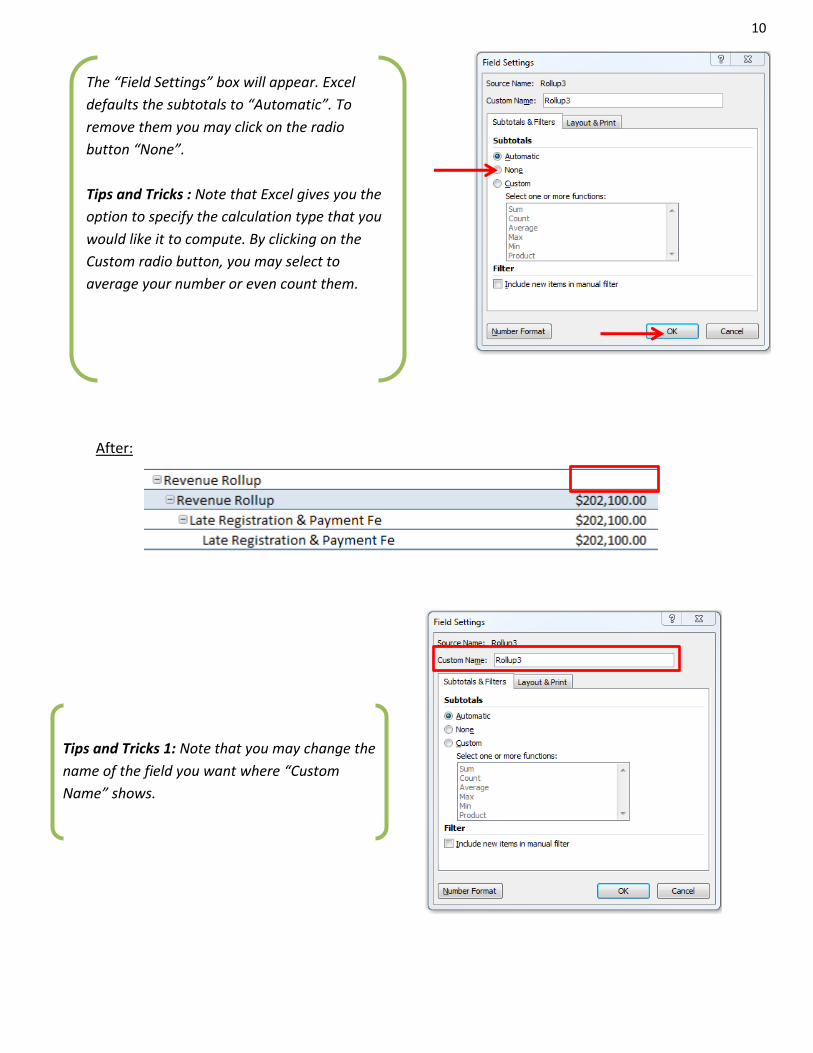
After:
The “Field Settings” box will appear. Excel
defaults the subtotals to “Automatic”. To
remove them you may click on the radio
button “None”.
Tips and Tricks : Note that Excel gives you the
option to specify the calculation type that you
would like it to compute. By clicking on the
Custom radio button, you may select to
average your number or even count them.
Tips and Tricks 1: Note that you may change the
name of the field you want where “Custom
Name” shows.
11
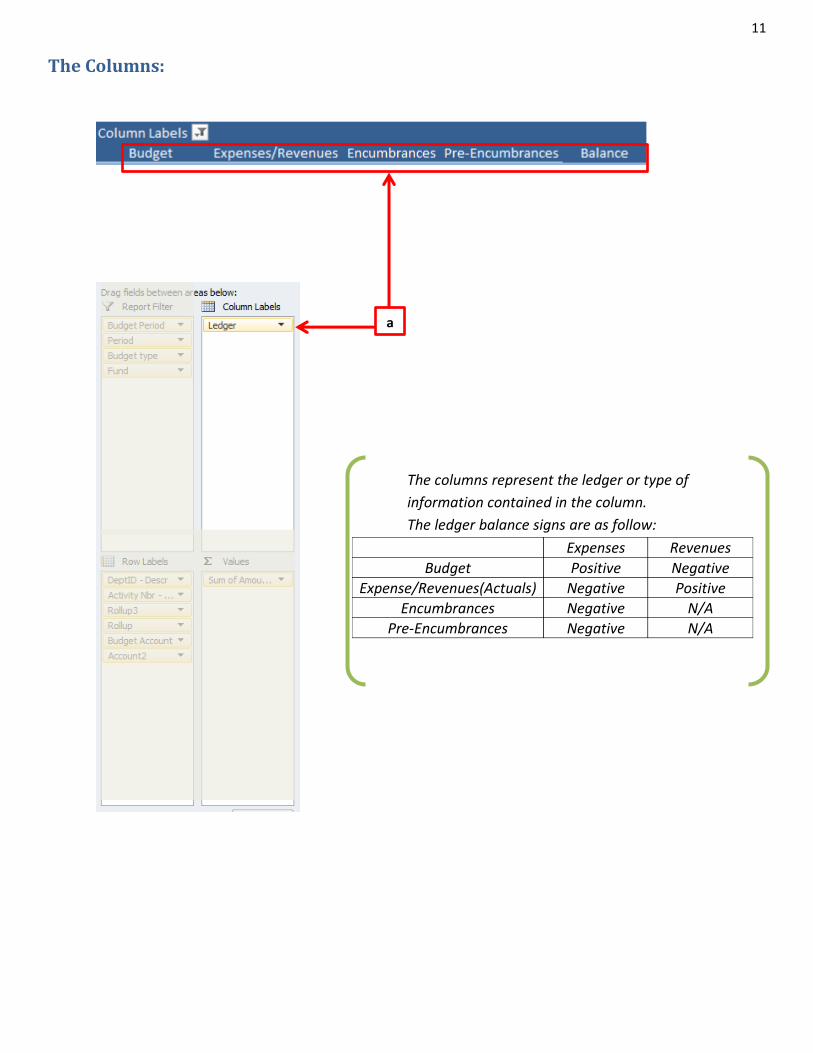
The Columns:
a
The columns represent the ledger or type of
information contained in the column.
The ledger balance signs are as follow:
Expenses Revenues
Budget Positive Negative
Expense/Revenues(Actuals) Negative Positive
Encumbrances Negative N/A
Pre-Encumbrances Negative N/A

12
The Values
Drilling to the data
A value will appear anywhere that there are data for
the intersection between row and column.
Excel allows you to retrieve the source data behind
each value by simply double clicking on it. In this
case the source data is the TRANDATA.
WARNING: To get back to the report click the
“PivotTable” tab at the bottom.

13
The Filters
This section allows the user to apply filter to the
entire report. The DT report defaults the Budget
Period to the current one (in this case 2013) by
applying a filter.
WARNING: This is one of the most common
sources of error when manipulating Pivot tables as
it is not easily visible. Make sure to keep track of
the filters applied.
To apply a filter, simply click on the arrow next to
the field that you want to select and make your
selection. You may select more than one value by
clicking on the “select Multiple Items” check box.
WARNING: Never uncheck the (blank) value.

14
The Field List:
These are all the fields available to the user to filter
or/and expand the columns or rows in the report.
To do so all you need to do is drag and drop the
desired field in the appropriate box.
Tips and Tricks 1: Note that any field that has a
filter applied to it will show a funnel next to it in
the list.
15
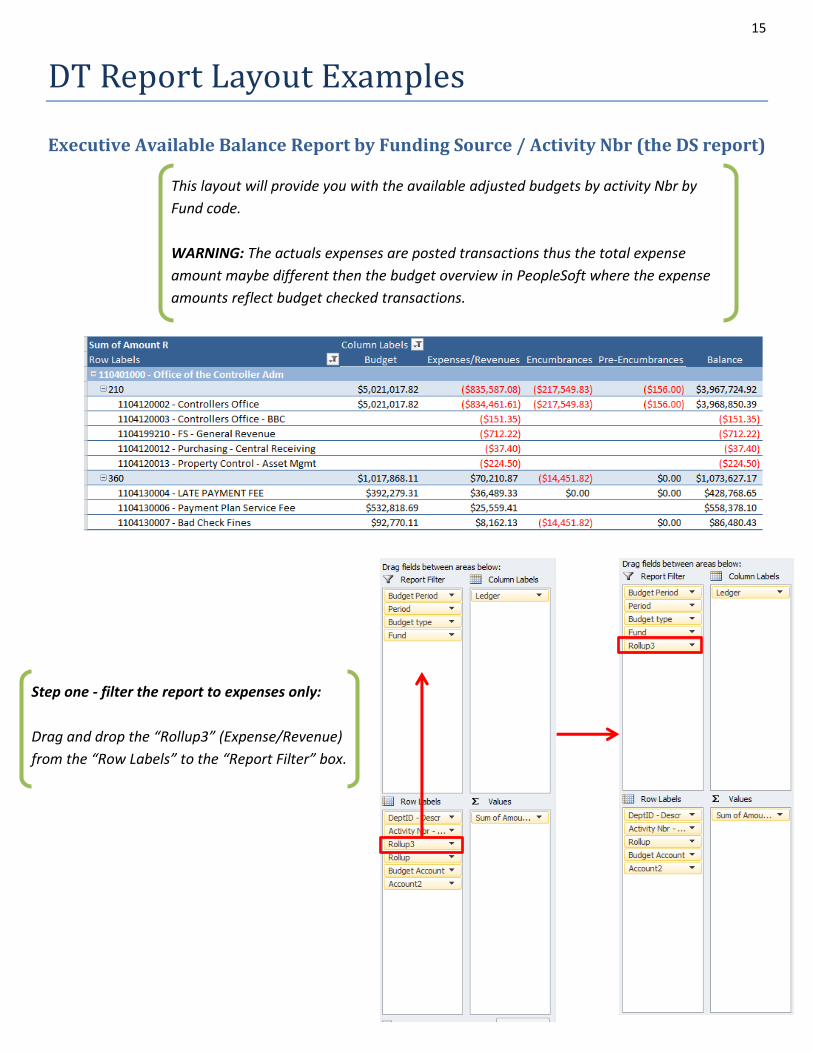
DT Report Layout Examples
Executive Available Balance Report by Funding Source / Activity Nbr (the DS report)
Step one - filter the report to expenses only:
Drag and drop the “Rollup3” (Expense/Revenue)
from the “Row Labels” to the “Report Filter” box.
This layout will provide you with the available adjusted budgets by activity Nbr by
Fund code.
WARNING: The actuals expenses are posted transactions thus the total expense
amount maybe different then the budget overview in PeopleSoft where the expense
amounts reflect budget checked transactions.
16
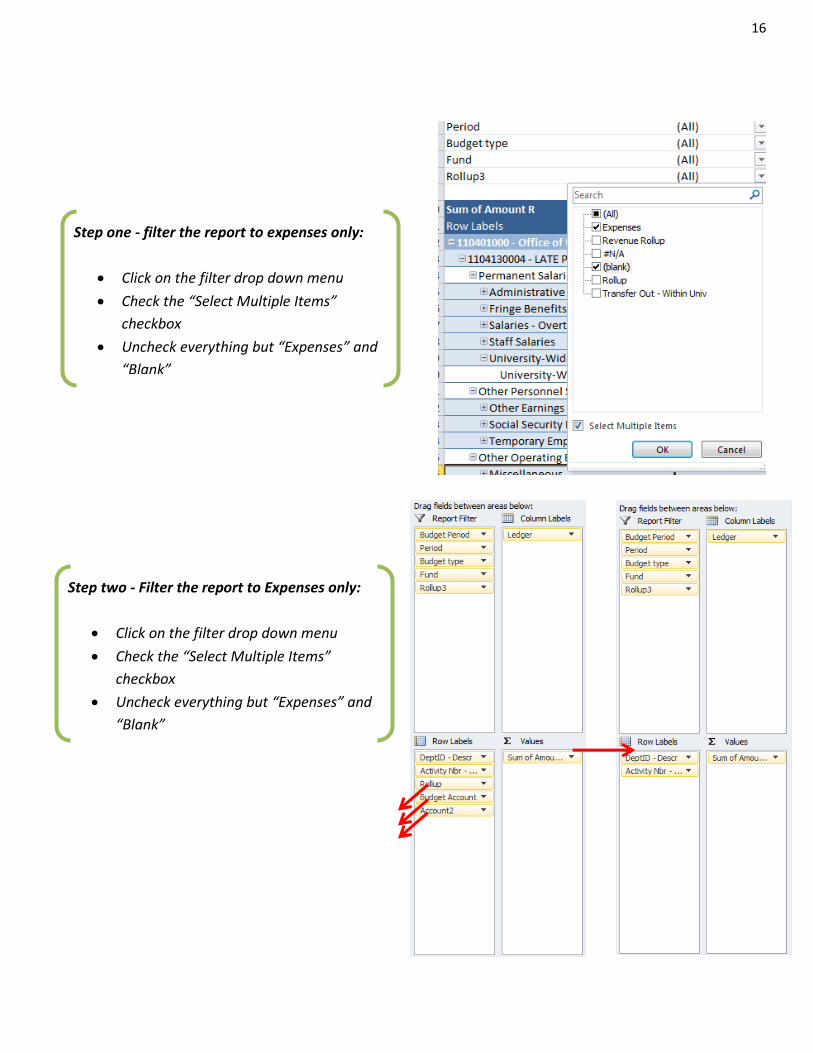
Step one - filter the report to expenses only:
Click on the filter drop down menu
Check the “Select Multiple Items”
checkbox
Uncheck everything but “Expenses” and
“Blank”
Step two - Filter the report to Expenses only:
Click on the filter drop down menu
Check the “Select Multiple Items”
checkbox
Uncheck everything but “Expenses” and
“Blank”

17
Executive Available Balance For Non-Salaries Expenses Report by Funding Source /
Activity Nbr
Step one – Getting to the executive available
balance
Please follow the steps in the previous section to
obtain executive available balance.
Step three – adding fund code subtotals:
Move the fund code from the “Report Filter” to
the “Row Labels” between DeptID and Activity
Nbr.
……Et voila!
18
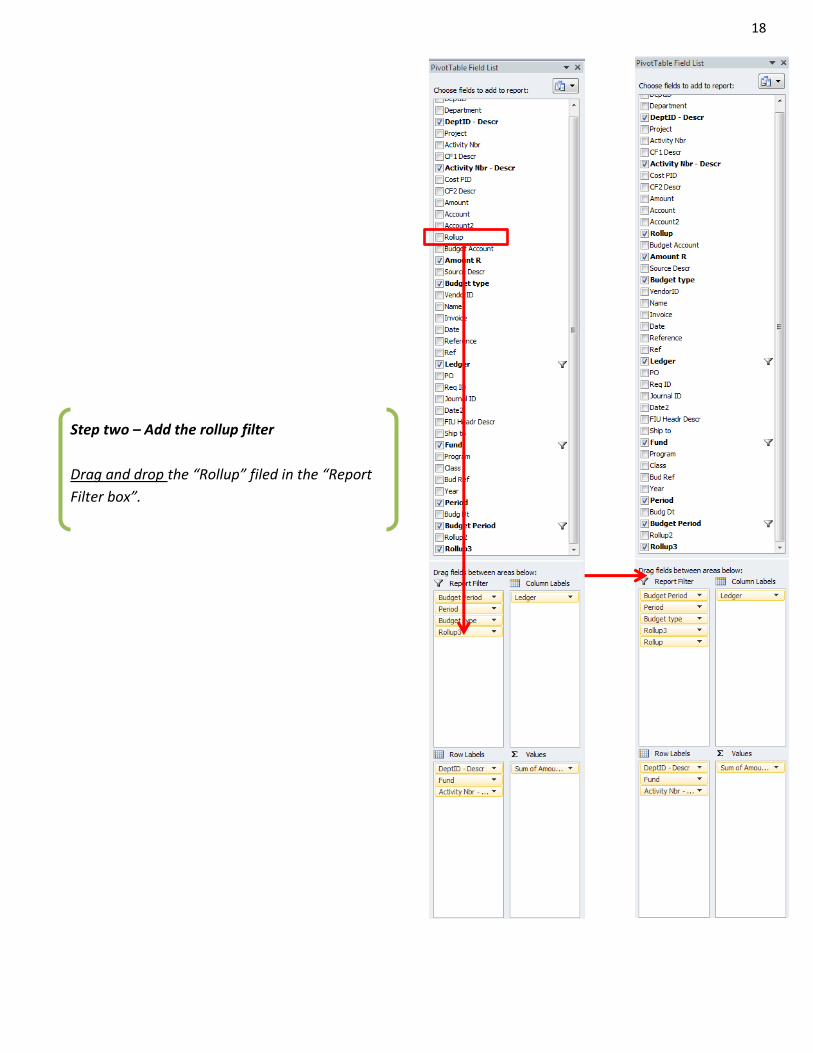
Step two – Add the rollup filter
Drag and drop the “Rollup” filed in the “Report
Filter box”.
19
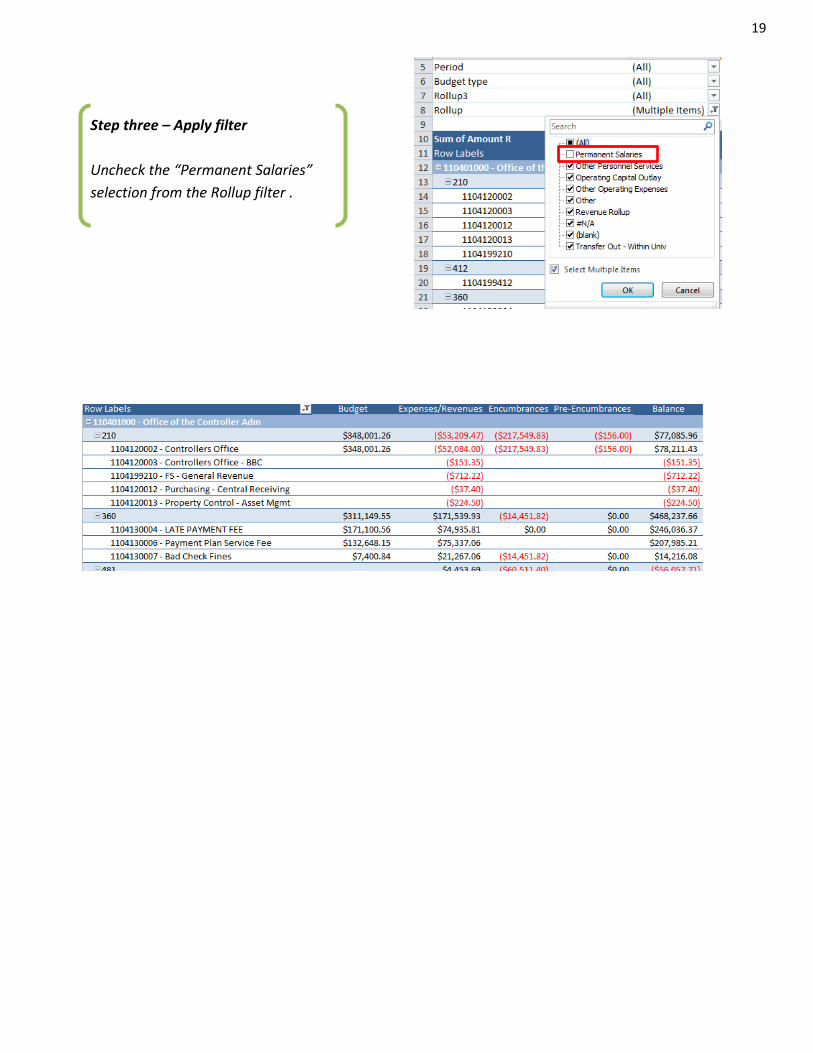
Step three – Apply filter
Uncheck the “Permanent Salaries”
selection from the Rollup filter .