Embed Size (px)
Citation preview

CUED/D-SoilsITR289 title paqe
Drum centrifuge study ofthree-leg jackup models on clay
E.T.R.Dean’, R.G.James2’3, A.N.Schofield2’3,and Y.Tsukamoto4
Technical Report CUED/D-SoiWTR289Cambridge University Engineering Department
January 1996
1 Soil Models Limited2 Cambridge University Engineering Department3 Andrew N Schofield & Associates Limited4 Science University of Tokyo

CUED/D-SoiMTR289 Abstract
Drum centrifuge study of
three-leg jackup models on clay
E.T.R.Dean, R.G.James, A.N.Schofield, and Y.Tsukamoto
Abstract
This paper reports and discusses centrifuge test data of model three-leg jackups on
kaolin clay. The tests modelled one prototype jackup with 6.5 metre diameter 13”
conical spudcans, one with 6.5 metre diameter flat-based spudcans, and one with
13.0 metre diameter flat-based spudcans.
Keywords: bearing capacity, footing, foundation, plasticity, clay
CUED/D-SoiWTR289 Contents
Contents
Abstract
Contents
1. Introduction . . . . . . . . . . . . . . . . . . . . . . . . . . . . . . . . . . . . . . . . . . . . . . . . . . . . . . . . . . . . . . . . . . . . . . . . . . . . . . . . . . . . . . . . . . . . . . . . . . . . . . .1
2. Experimental apparatus and procedures .......................................................... 2
2.1 Drum centrifuge ....................................................................................... 2
2.2 Clay specimen preparation ...................................................................... 2
2.3 Jackup and spudcan models ................................................................... 4
2.4 Soil states ................................................................................................ 5
3. Experimental results ......................................................................................... 6
3.1 Preloading ............................................................................................... 6
3.2 Slow cyclic horizontal loading .................................................................. 7
3.3 Rapid cyclic horizontal loading .............................................................. 10
3.4 Pullout ................................................................................................... 12
4. Conclusions . . . . . . . . . . . . . . . . . . . . . . . . . . . . . . . . . . . . . . . . . . . . . . . . . . . . . . . . . . . . . . .. . . . . . . . . . . . . . . . . . . . . . . . . . . . . . . . . . . . . 13
Acknowledgements
References
Tables
Figures
Appendix 1. Notation
CUED/D-Soils/TR289 paae 1
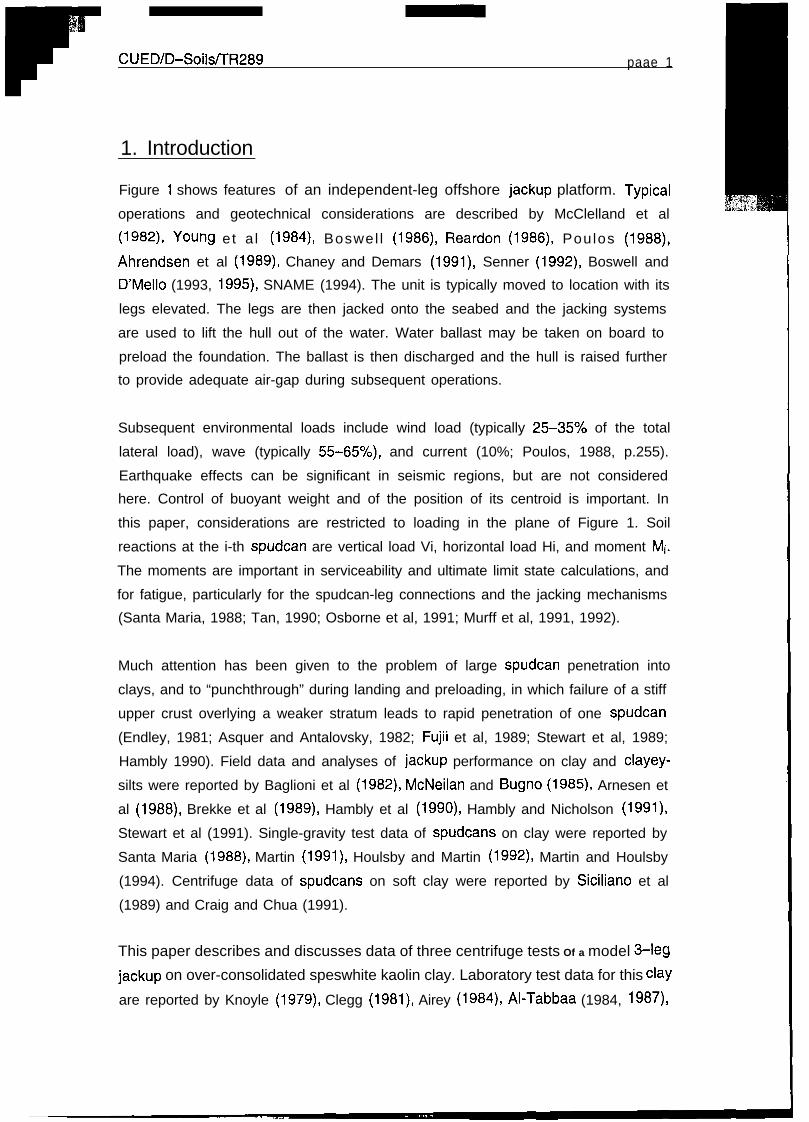
1. Introduction
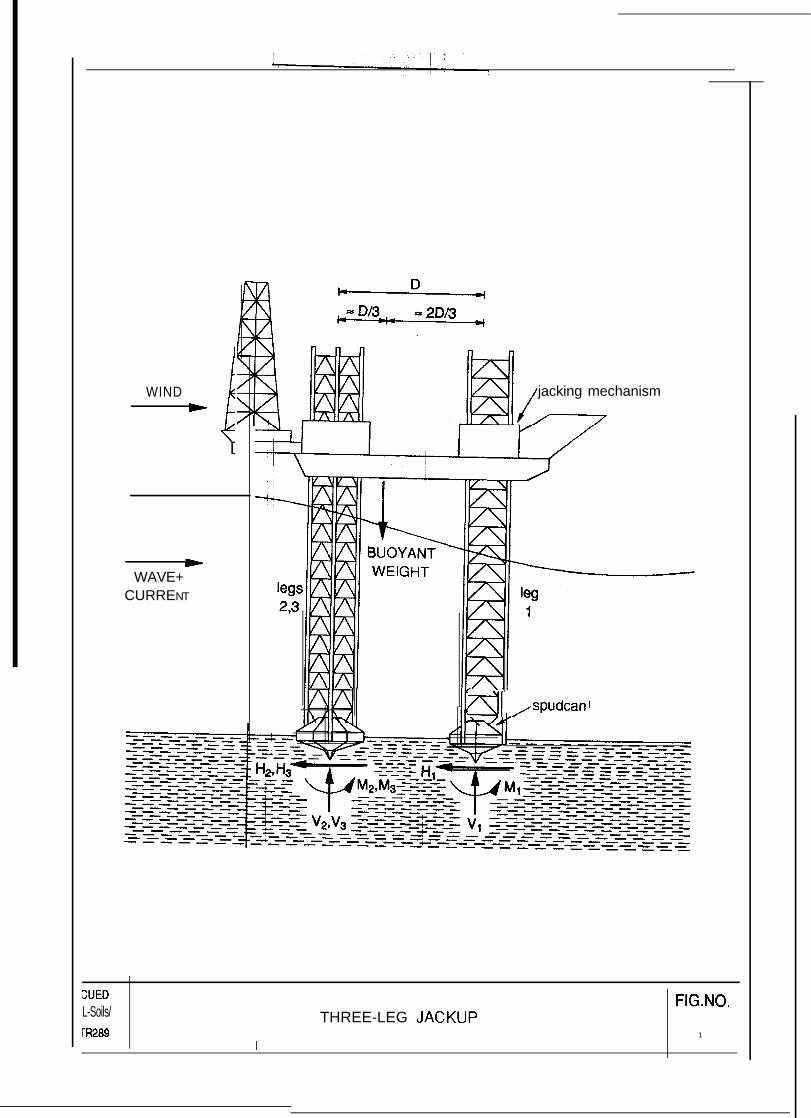
Figure 1 shows features of an independent-leg offshore jackup platform. Typical
operations and geotechnical considerations are described by McClelland et al
(1982), Young et a l (1984), Boswel l (1986), Reardon (1986), Poulos (1988),
Ahrendsen et al (1989), Chaney and Demars (1991), Senner (1992) Boswell and
D’Mello (1993, 1995), SNAME (1994). The unit is typically moved to location with its
legs elevated. The legs are then jacked onto the seabed and the jacking systems
are used to lift the hull out of the water. Water ballast may be taken on board to
preload the foundation. The ballast is then discharged and the hull is raised further
to provide adequate air-gap during subsequent operations.
Subsequent environmental loads include wind load (typically 25-35% of the total
lateral load), wave (typically 55-65%), and current (10%; Poulos, 1988, p.255).
Earthquake effects can be significant in seismic regions, but are not considered
here. Control of buoyant weight and of the position of its centroid is important. In
this paper, considerations are restricted to loading in the plane of Figure 1. Soil
reactions at the i-th spudcan are vertical load Vi, horizontal load Hi, and moment Mi.
The moments are important in serviceability and ultimate limit state calculations, and
for fatigue, particularly for the spudcan-leg connections and the jacking mechanisms
(Santa Maria, 1988; Tan, 1990; Osborne et al, 1991; Murff et al, 1991, 1992).
Much attention has been given to the problem of large spudcan penetration into
clays, and to “punchthrough” during landing and preloading, in which failure of a stiff
upper crust overlying a weaker stratum leads to rapid penetration of one spudcan
(Endley, 1981; Asquer and Antalovsky, 1982; Fujii et al, 1989; Stewart et al, 1989;
Hambly 1990). Field data and analyses of jackup performance on clay and clayey-
silts were reported by Baglioni et al (1982), McNeilan and Bugno (1985), Arnesen et
al (1988), Brekke et al (1989), Hambly et al (1990), Hambly and Nicholson (1991),
Stewart et al (1991). Single-gravity test data of spudcans on clay were reported by
Santa Maria (1988), Martin (1991), Houlsby and Martin (1992), Martin and Houlsby
(1994). Centrifuge data of spudcans on soft clay were reported by Sicilian0 et al
(1989) and Craig and Chua (1991).
This paper describes and discusses data of three centrifuge tests Of a model s-leg
jackup on over-consolidated speswhite kaolin clay. Laboratory test data for this clay
are reported by Knoyle (1979), Clegg (1981), Airey (1984), Al-T&baa (1984, 1987),

CUED/D-Soils/TR289 paae 2
Elmes (1986), Al-Tabbaa and Wood (1987), Phillips (1989), Springman (1993).
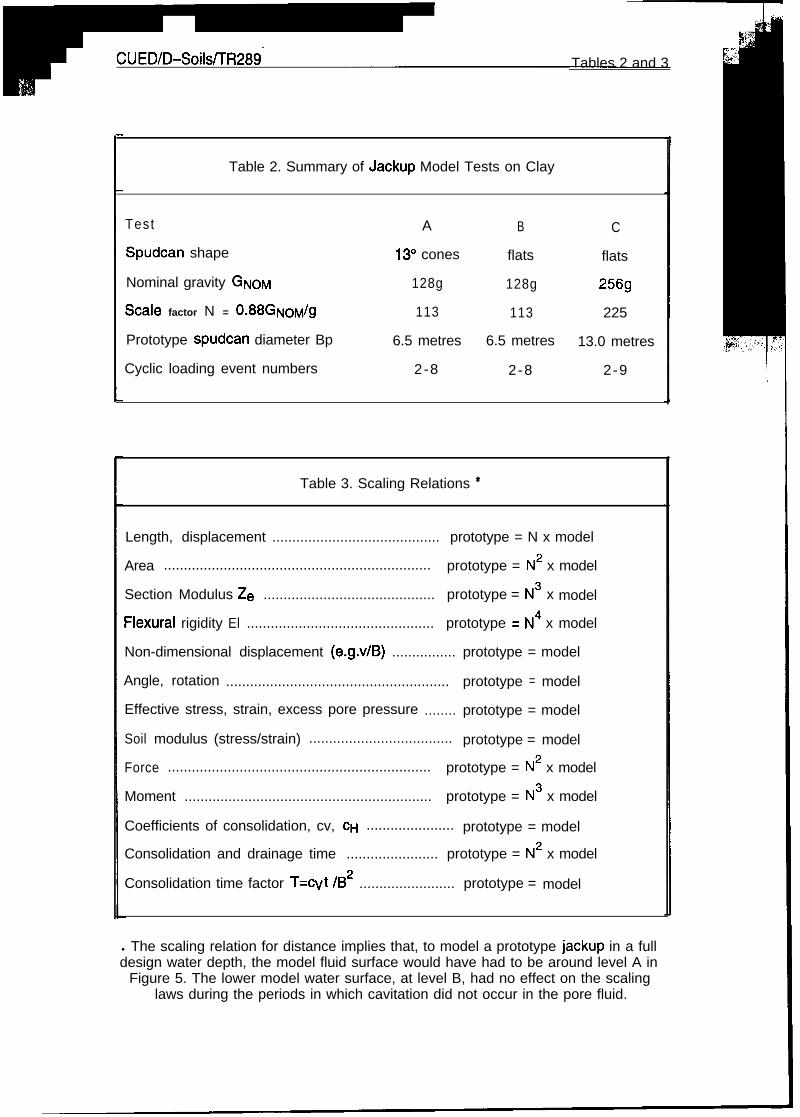
Table 1 lists some of its properties. Table 2 lists details of the three jackup model
tests. Moment-fixity aspects of these data were previously reported by Wong et al
(1993). This paper focuses on preloading, cyclic loading, and pullout.
2. Experimental apparatus and procedures
2.1 Drum centrifuge
Centrifuge modelling plays a major role in resolving geotechnical issues relating to
offshore structures (Rowe et al, 1975, 1976, 1983). Principles and practice of
centrifuge modelling for a variety of onshore and offshore geotechnical applications
are described by Schofield (1980, 1981), Craig (1983, 1984), Craig et al (1988),
Corte (1988), Ko and McLean (1991), Taylor (1994), Leung et al (1994), and others.
Figure 2 shows features of the Cambridge 2-metre geotechnical drum centrifuge
configured for jackup and single-spudcan tests on clay. The model container
consists of a cylindrical drum 2 metres in diameter and 1 metre high. The inner
circumference of 27~ = 6.3 metres supports a cylindrical ring of sand which is held
against the drum wall by the centrifuge “gravity” created by spinning the drum. Two
clay samples, prepared as described below and held within steel frames, were
placed at opposite positions on the drum wall. Apparatus mounted on the central
column was used to carry out single-spudcan and jackup model tests on the clay
specimens under elevated centrifuge gravities. Data signals from transducers on the
specimens and the testing apparatuses passed through slip rings to automated
model control and data acquisition systems in the control room.
In Table 2, the nominal gravity level GNOM is the centrifugal acceleration at the drum
wall. Because the centrifuge gravity varies linearly from the soil surface to the drum
wall, there is a different gravity level at the inner clay surface, which was at 880mm
radius in these tests. For simplicity, the scale factors in Table 2 have been
computed from the acceleration Ng=0.88GNoM at the clay surface.
2.2 Clay specimen preparation
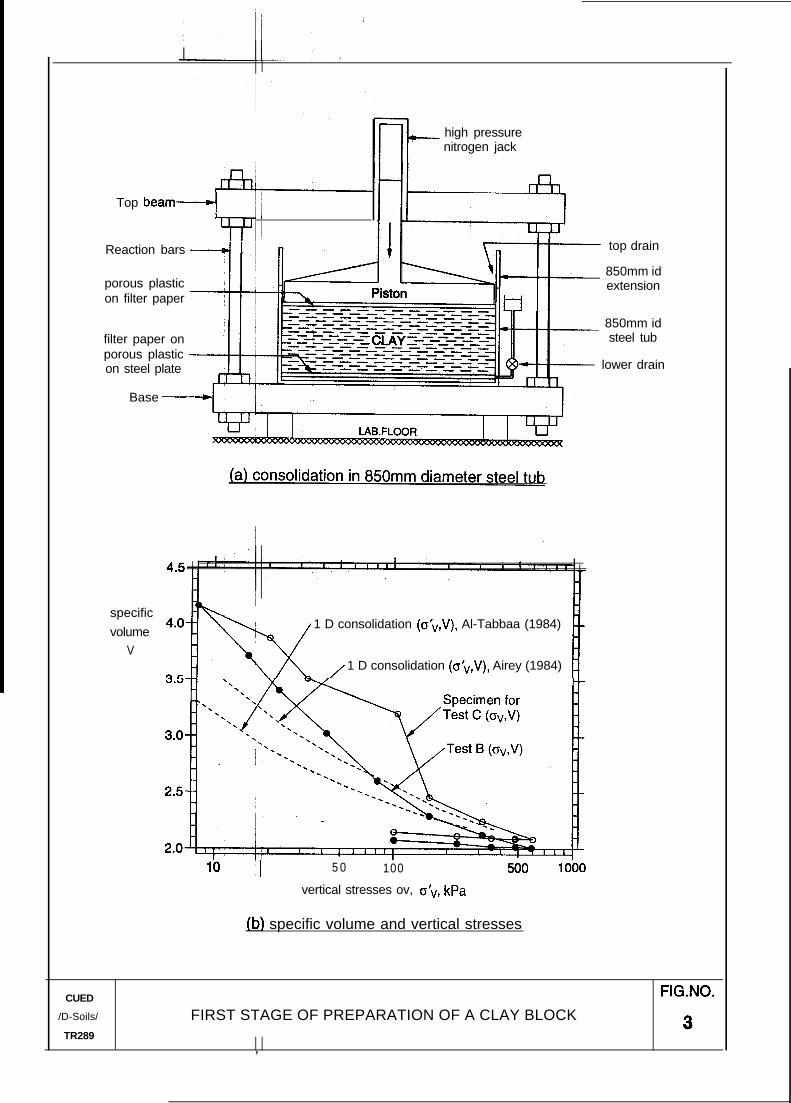
The first stage of sample preparation is shown in Figure 3. Speswhite kaolin clay
powder was mixed with de-ionised water under a partial vacuum for two hours to
CUED/D-SoilsiTR289 paae 3
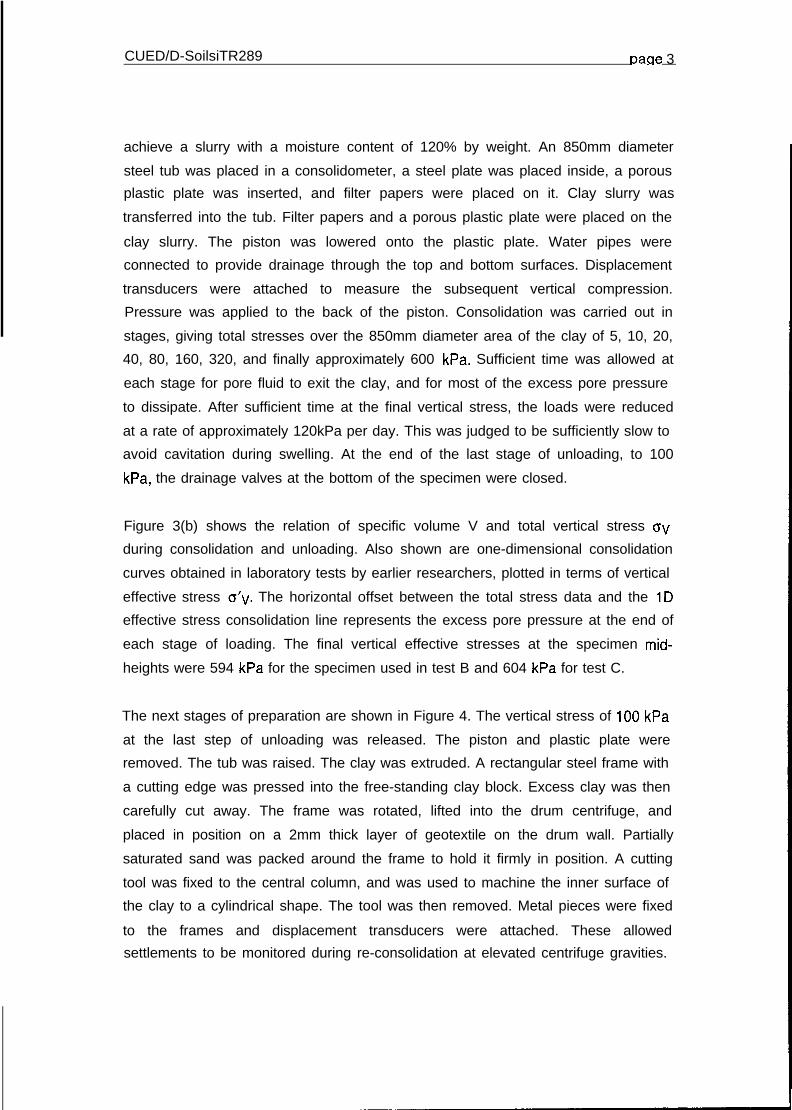
achieve a slurry with a moisture content of 120% by weight. An 850mm diameter
steel tub was placed in a consolidometer, a steel plate was placed inside, a porous
plastic plate was inserted, and filter papers were placed on it. Clay slurry was
transferred into the tub. Filter papers and a porous plastic plate were placed on the
clay slurry. The piston was lowered onto the plastic plate. Water pipes were
connected to provide drainage through the top and bottom surfaces. Displacement
transducers were attached to measure the subsequent vertical compression.
Pressure was applied to the back of the piston. Consolidation was carried out in
stages, giving total stresses over the 850mm diameter area of the clay of 5, 10, 20,
40, 80, 160, 320, and finally approximately 600 kPa. Sufficient time was allowed at
each stage for pore fluid to exit the clay, and for most of the excess pore pressure
to dissipate. After sufficient time at the final vertical stress, the loads were reduced
at a rate of approximately 120kPa per day. This was judged to be sufficiently slow to
avoid cavitation during swelling. At the end of the last stage of unloading, to 100
kPa, the drainage valves at the bottom of the specimen were closed.
Figure 3(b) shows the relation of specific volume V and total vertical stress ov
during consolidation and unloading. Also shown are one-dimensional consolidation
curves obtained in laboratory tests by earlier researchers, plotted in terms of vertical
effective stress o’v. The horizontal offset between the total stress data and the 1D
effective stress consolidation line represents the excess pore pressure at the end of
each stage of loading. The final vertical effective stresses at the specimen mid-
heights were 594 kPa for the specimen used in test B and 604 kPa for test C.
The next stages of preparation are shown in Figure 4. The vertical stress of 100 kPa
at the last step of unloading was released. The piston and plastic plate were
removed. The tub was raised. The clay was extruded. A rectangular steel frame with
a cutting edge was pressed into the free-standing clay block. Excess clay was then
carefully cut away. The frame was rotated, lifted into the drum centrifuge, and
placed in position on a 2mm thick layer of geotextile on the drum wall. Partially
saturated sand was packed around the frame to hold it firmly in position. A cutting
tool was fixed to the central column, and was used to machine the inner surface of
the clay to a cylindrical shape. The tool was then removed. Metal pieces were fixed
to the frames and displacement transducers were attached. These allowed
settlements to be monitored during re-consolidation at elevated centrifuge gravities.

CUED/D-SoiNTR289 paae 4
2.3 Jackup and spudcan models
Figure 5 shows details of the model jackup. The vertical downwards direction in this
figure corresponds to the radial outwards direction in Figure 2(a). The model
consisted of a rigid hull with three tubular legs. A 57.8mm diameter instrumented
model spudcan was fitted to the end of each leg. The model was hung from a
support frame attached to the central column of the drum centrifuge. Because the
total weight W* of the model in the centrifuge gravity was larger than needed, part
of the weight was taken by an upthrust U applied to the underside of the hull by the
hanger. Thus the sum of the total vertical loads on the three spudcans was W*-U.
Horizontal load H~pp was applied to the model by cables from actuators on the
support frame to the hull reference point “HRP”. In end elevation, Figure 2(b), legs
numbered 2 and 3 were splayed at f7”. This meant that the direction along the
centreline of these legs corresponded to the local direction of the centrifuge gravity.
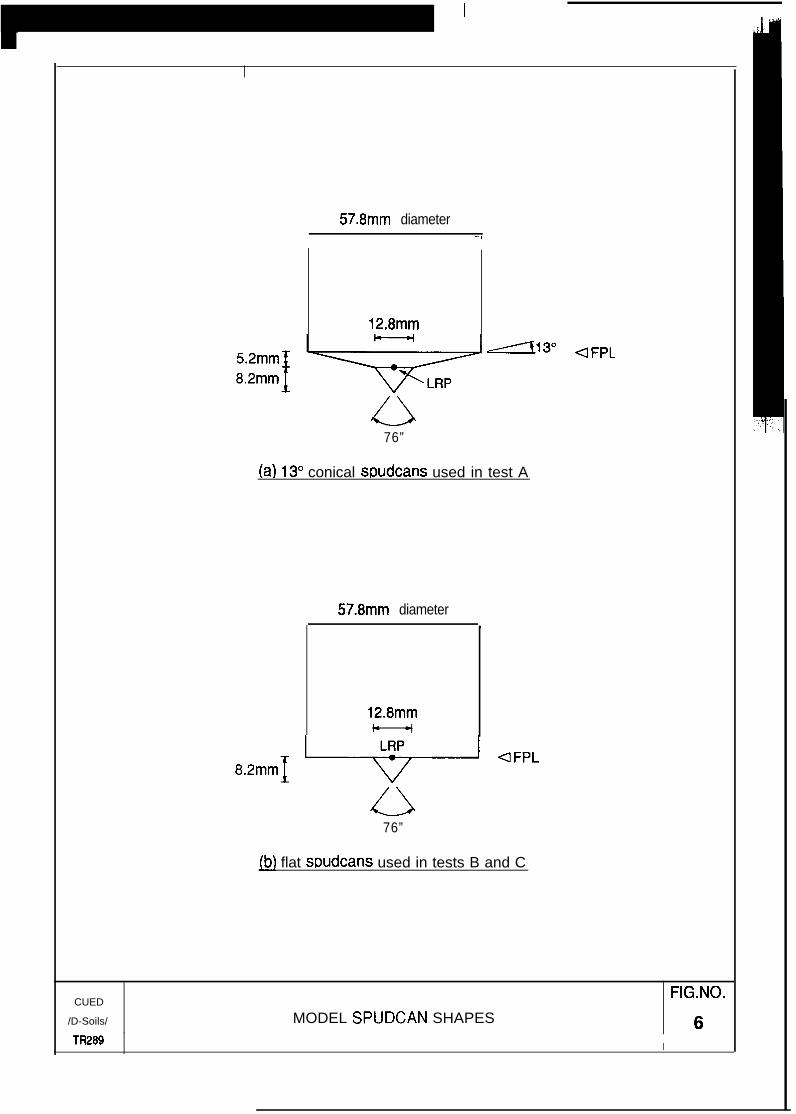
In test A, conical model spudcans shown in Figure 6(a) were fitted to the model
jackup. In tests B and C, the flat-based spudcans shown in Figure 6(b) were used.
The spudcan on the i-th leg housed a loadcell to measure axial load (Pi), shear load
(at), and moment (Mt). The axial and shear loads could be resolved to obtain the
spudcan vertical loads (Vi) and spudcan horizontal loads (Hi) as follows:
Vi = Pi.cosei + Qi.sin6i - Bi . . . . . . . . . . . . . . . . . . . . . . . . . . . . . . . . . . . . . . . . . . . . . . . . . . . . . . . . . . . . . . . . . . . . . .(1)
Hi = Qi.CO&i - Pi.SiflC$ . . . . . . . . . . . . . . . . . . . . . . . . . . . . . . . . . . . . . . . . . . . . . . . . . . . . . . . . . . . . . . . . . . . . . . . . . . . . . . (2)
where 6i is the rotation of the i-th spudcan and Bi is the buoyancy upthrust on it.
The reason for subtracting Bi is as follows. In the field, Figure 1, the spudcan loads
Vi are differences between total loads before and after contact with the seabed.
Buoyancy acts both before and after contact, so Vi are equilibrated by the sum of
effective stresses at the soil-spudcan interface and excess pore pressure in the soil.
In the model test, Figure 5, the fluid surface was at level B, due to apparatus limits.
The model spudcans were only partially submerged, and the buoyancy upthrust on
them varied with vertical spudcan displacement. The measured loads included
buoyancy effects. To obtain the correct relation to a full-size prototype jackup, the
buoyancy forces are subtracted in equation 1.
In the following descriptions, vertical and horizontal displacements vHULL and hHuLL
represent displacements of the hull reference point HRP located as shown in Figure
CUED/D-SoiMR289 oaue 5
5. Zeroes for these values are described below. The hull rotation 9HULL is taken as
zero when the model jackup is vertical in the centrifuge gravity. The sum of the
spudcan vertical loads Vi was taken to be the net buoyant rig weight W. The sum of
the spudcan horizontal loads Hi was taken to be the net horizontal load HNE=.
Spudcan vertical and horizontal displacements (vj,hj) and rotations Bi were inferred
by combining the measured hull motions with spudcan motions relative to the hull.
These relative motions were calculated from the measured spudcans loads
assuming the legs deformed in bending with flexural rigidity El = 0.234~10~ kN.mm2.
2.4 Soil states
At the start of each day of testing, the centrifuge was started and the speed
increased to a low speed. Water was then introduced into the partially saturated
sand. The phreatic surface moved inwards from the drum wall until the sand and the
clay were covered by l-5 mm of water. The speed was then increased to achieve
the desired gravity level for the first test. Settlements of the clay were monitored
until primary re-consolidation was complete. The model test was then started.
Dean et al (1992) show that in-situ vertical effective stresses in a drum centrifuge
depend slightly on the value of the lateral earth pressure Ko. Consideration of an
element of soil between radii r and r+dr from the centrifuge axis, assuming that pore
pressures are in equilibrium so that no excess pore pressures occur, gives:
do’” 0’” -de
dr + r= p’.02.r . . . . . . . . . . . . . . . . . . . . . . . . . . . . . . . . . . . . . . . . * . . . . . . . . . . . . . . . . . . . .(3)
where o’v is the radial effective stress, 0’8 is the circumferential effective stress, p’
is the buoyant mass density of the soil, and o is the angular speed of the drum in
radians per second. Assuming Ko=o’e/o’v is constant with model depth ZM=(r-Ro),
where R. is the radius at the inner soil surface, the solution is:
For Ko z 3 : o’v = pt.co2.{ ? - ( ROAN’/ rlvKo ) } / ( 3-Ko) . . . . . . . . . . . . . . . . . . . . . . . (4)
For Ko = 3 : o’v = p’.w2.r2.1n( r/R0 ) . . . . . . . . . . . . . . . . . . . . . . . . . . . . . . . . . . . . . . . . . . . . . . . . . . . . . . . . . .(5)
Although this indicates that the relation between effective stress and depth in the
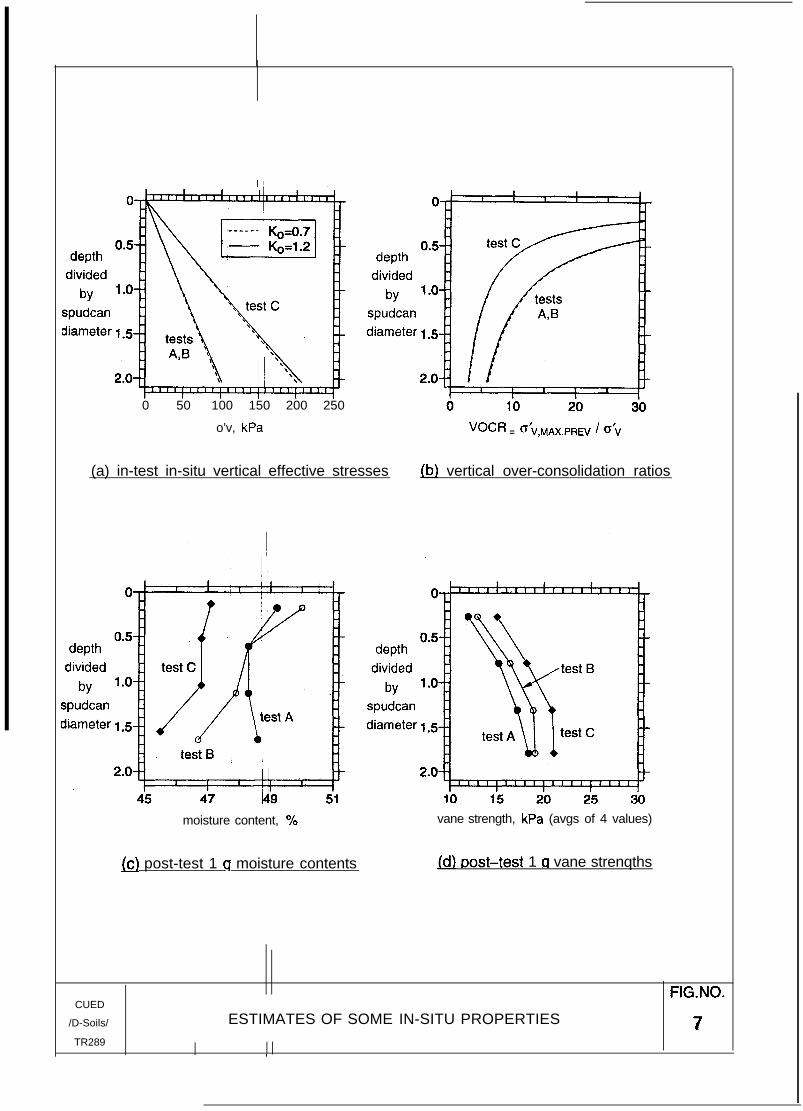
model is not linear, the amount of non-linearity is not great. Figure 7(a) shows the
CUED/D-Soils/TR289 oaae 6
vertical effective stresses for the three tests, each calculated for two values of Ko.
Figure 7(b) shows the implied initial vertical over-consolidation ratios, based on the
previous maximum effective vertical stresses attained during consolidation in the
850 mm diameter tub.
At the end of each day of testing, the centrifuge was slowed. Water was drained
away from the sand to give a partially saturated sand specimen with some effective
cohesive strength. The centrifuge was then stopped. Figure 7(c) shows moisture
content profiles obtained from samples taken after the centrifuge had been stopped.
Figure 7(d) shows undrained strengths obtained from a miniature vane. Based on
Almeida (1984) and Springman (1993), actual undrained strengths during the tests
at elevated gravities are expected to have been larger than these post-test values.
3. Experimental Results
3.1 Preloading
In the first event of each test, the model jackup was landed onto the soil surface,
preloaded vertically, and then partially unloaded.
Figures 8(a-c) show the responses during preloading and unloading. In each
diagram, the horizontal axis represents a vertical spudcan load Vspu~ divided by
the spudcan area A=zB2/4 at its widest section. The vertical axis represents
spudcan penetration vSpUD divided by spudcan diameter B. In Figures 8(a,b),
vspu~=O represents a best estimate of when the full spudcan diameter penetrated
the clay surface. The origins for VSpUD in Figure 8(c) have been adjusted slightly so
as to match the response of the spudcan on leg 1, denoted as Ll, with those of the
spudcans on legs 2 and 3, denoted as L23. The total times from the start of
preloading and to the end of unloading are given at model scale (TM) and prototype
scale (Tp=N2xT~). The prototype times are longer than typical preloading times at
field scale. If an appropriate order-of-magnitude estimate for cv is 0.5mm2/sec,
based on Al-Tabbaa (1987) and Springman (1993), then the time factor T=cvt/B2 is
in the range 0.03-0.07 for model loading periods t=TM of 220-450 seconds. A little
drainage of the clay is expected to have occurred during the model preloading,
whereas a typical field preloading event on clay would be almost fully undrained.

CUED/D-Soils/WI289 paae 7
The data show that large vertical penetrations occurred, and still larger penetrations
would have been needed to reach the bearing capacity of the footings. The data of
tests B and C include unload-reload excursions prior to reaching the final vertical
preload. These excursions show some hysteresis. In Figure 8(d), the vertical axis
represents prototype spudcan penetration, equal to N times model penetration. The
results for tests B (prototype diameter 6.5 metres) and C (prototype diameter twice
as large) are almost identical. At model scale, this indicates that the vertical stress
required to achieve a given model penetration was proportional to the rate of
increase of vertical stress with model depth. At prototype scale, it indicates the
absence of a footing size effect. The vertical stress required to achieve a given
prototype penetration was the same for a 13.0 metre diameter spudcan on this clay
as for a 6.5 metre diameter spudcan.
3.2 Slow cyclic horizontal loading
After landing and preloading, a sequence of episodes of either rapid or slow cyclic
horizontal loading was applied. Table 4 lists the events for each test, together with
maximum and minimum values of HNET/~A, where A=nB*/4 is the cross-sectional
area of a spudcan at its largest diameter Cycle times at model scale (TM) and
prototype scale (Tp=N*xTr,,t) are also listed. The adjectives “low” and “rapid” here
relate to the capabilities of the model actuation system for these tests. Cycle times
for the “slow” cyclic loading events were such that some drainage and consolidation
is expected to have occurred during cycling. Prototype times for the “rapid” events
were also long compared to typical field cyclic periods for an extreme wave.
Figures 9(a-c) shows data of hull responses during “events 3”, in which cycles of
horizontal load of increasing amplitude were applied. Two cycles were applied in
test A. Three cycles were applied in tests B and C. For each test, the upper diagram
shows the average spudcan shear stress HNET/~A, where HNET is the sum of the
spudcan horizontal loads Hi, plotted versus dimensionless hull horizontal movement
AhHuLL/B, where AhHuLL is the change of hull horizontal position since the start of
the event. The lower diagram shows dimensionless hull vertical movements
AVHULLIB. The data show noticeable hysteresis in the horizontal load-displacement
responses, with no clear yield points. The unloading responses are non-linear. Net
plastic vertical settlements increase with increasing horizontal load amplitude.
CUED/D-SoiWTR289 paue 8
In Figure 9(d), the secant normalised stiffness (AHNET/3A)/(AhHuLL/B) is plotted
versus normalised horizontal load amplitude AHr&3A, where AHNET is the change
of HNET from peak positive to peak negative value, and AhHuLL is the change of hull
horizontal position from peak positive HNET to peak negative HNE=. Comparison of
the data of tests A and B indicate that the global response was stiffer for the cones
than for the flat spudcans. Comparison of the data for tests B and C for the flat
spudcans indicates that, at a given normalised load amplitude AHNET/~A, the value
of (AHNET/3A)/(AhHuLL/B) was smaller in test B, with 6.5 metre diameter prototype
spudcans, than in test C, for a prototype rig twice as large with 13.0 metre diameter
spudcans.
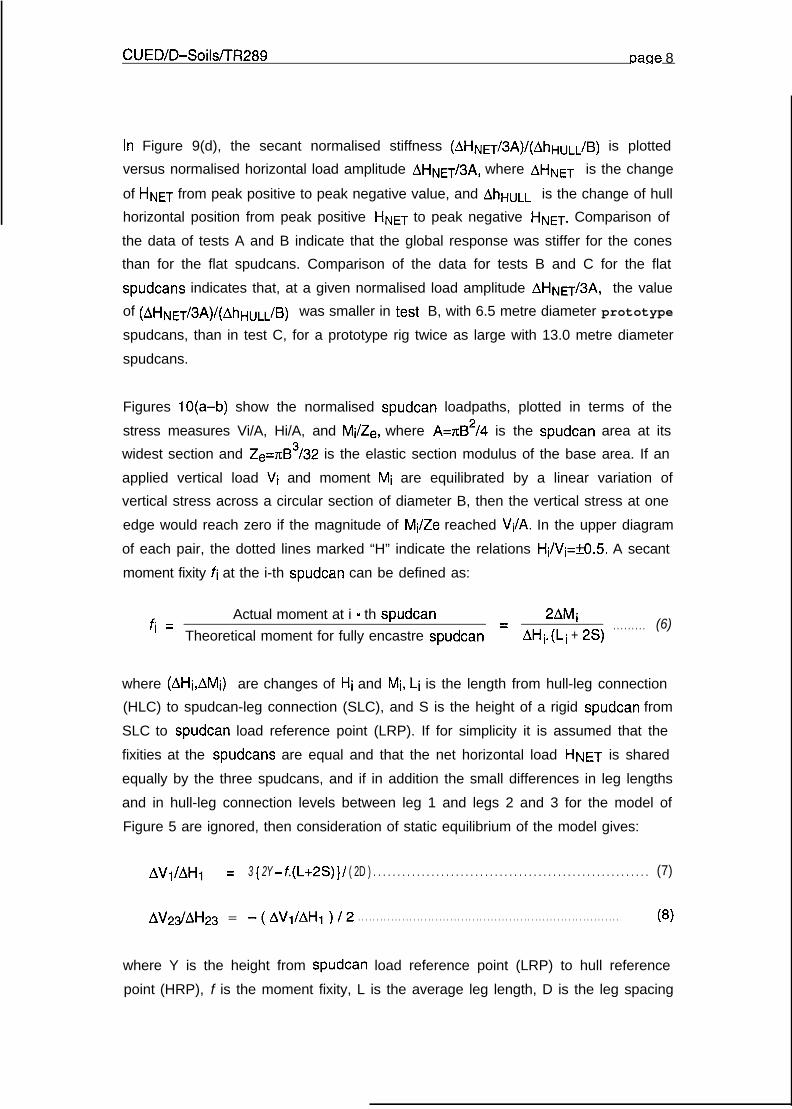
Figures lO(a-b) show the normalised spudcan loadpaths, plotted in terms of the
stress measures Vi/A, Hi/A, and Mf/Ze, where A=nB*/4 is the spudcan area at its
widest section and Ze=nB3/32 is the elastic section modulus of the base area. If an
applied vertical load Vi and moment Mi are equilibrated by a linear variation of
vertical stress across a circular section of diameter B, then the vertical stress at one
edge would reach zero if the magnitude of Mi/Ze reached Vi/A. In the upper diagram
of each pair, the dotted lines marked “H” indicate the relations Hi/Vi=f0.5. A secant
moment fixity fi at the i-th spudcan can be defined as:
fi =Theoretical moment for fully encastre spudcan
Actual moment at i - th spudcan 2AMi= AHi.(Li + 2s)
. . . . . . . . . (6)
where (AHi,AMi) are changes of Hi and Mi, Lf is the length from hull-leg connection
(HLC) to spudcan-leg connection (SLC), and S is the height of a rigid spudcan from
SLC to spudcan load reference point (LRP). If for simplicity it is assumed that the
fixities at the spudcans are equal and that the net horizontal load HNET is shared
equally by the three spudcans, and if in addition the small differences in leg lengths
and in hull-leg connection levels between leg 1 and legs 2 and 3 for the model of
Figure 5 are ignored, then consideration of static equilibrium of the model gives:
AVj/AHl = 3 { 2Y - f.(L+2S) } / ( 2D ) . . . . . . . . . . . . . . . . . . . . . . . . . . . . . . . . . . . . . . . . . . . . . . . . . . . . . . . . . (7)
AV2$AH23 = -(AVj/AHj)/2 . . . . . . . . . . . . . . . . . . . . . . . . . . . . . . . . . . . . . . . . . . . . . . . . . . . . . . . . . . . . . . . . . . . . . . . (8)
where Y is the height from spudcan load reference point (LRP) to hull reference
point (HRP), f is the moment fixity, L is the average leg length, D is the leg spacing

CUED/D-SoiWTR289 oaue 9
in elevation, and suffix 23 denotes leg 2 or leg 3. Taking Y=352mm, L=248mm,
S=71.4mm, and D=186mm, this gives AVl/AH1=5.68 and AV&AH23= -2.84 for
pinned conditions (f=O) and AVl/AH1=2.53 and AV&AH23= -1.26 for encastre
conditions (f=l). It is clear from the slopes marked on the diagrams in Figure 10 that
the spudcan responses were closer to pinned than encastre.
Figures 11 (a-c) and 12(a-c) show normalised horizontal load-displacement and
moment-rotation responses for the spudcans, where Ahi/B is the change of
spudcan horizontal position since the start of the event and A0i is the change of
spucan rotation. The horizontal load-displacement responses include some signal
noise in the Ahl/B values. However, typical shapes of hysteresis loops can be
discerned. The data in Figure 11 (b) for test B suggest that a sliding condition was
reached at negative Ht during the second and third cycles. Such a condition can be
expected at this spudcan, due to the reduction in vertical load as Ht increases
negatively. However, it is conceivable that an instrumentation limit was reached in
these cycles, and that the magnitude of Ht at which slip occurred was larger than
indicated. The moment-rotation data in Figure 12 for the spudcans on legs 2 and 3
also suggest conventional hysteresis loops. However, the moment-rotation data in
Figure 11 for the spudcan on leg 1 show more complex shapes.
Figures 13(a-c) show how horizontal loads and moments were shared between
spudcans. In each diagram, the horizontal axis represents a quantity for the
spudcan on leg 1, the vertical axis represents the corresponding average for the
spudcans on legs 2 and 3. The lines E-E mark where the responses would be
equal. The data show that larger fractions of the changes of the net horizontal load
were taken on the spudcans on legs 2 and 3. The sharing of moments is more
complex, but by considering the average slopes from largest negative to largest
positive values, it may be concluded that larger cyclic changes of moment occurred
at the spudcans on legs 2 and 3 compared to the spudcan on leg 1.
A feature of the data examined above is that moments Ml at the spudcan on leg 1
were biased negatively, and moments M23 at the other two spudcans were biased
positively. Figure 14 shows data of event 9 in test C. The hull load-displacement
and rotation responses are shown in Figure 14(a). The LVDT displacement
transducers measuring horizontal hull displacement malfunctioned at AhHuLL/B =
0.055. The data of hull rotations, which were measured by a separate set of
transducers, show that there was continuity of response beyond this value. Figures

CUED/D-SoildTR289 pacle 10
14(bl ,b2) show the moment responses at the spudcans. In each diagram, the
vertical axis represents the vertical spudcan load Vf,total for the i-th spudcan divided
by spudcan area A=xB2/4, where Vf,totaf=Vi+Bf includes the buoyancy force Bi. The
horizontal axis represents moment, plotted as stress Mi/Ze. The dotted lines marked
T show where the magnitudes of (Vi+Bi)/A and Mi/Ze are equal. The loadpaths are
approximately bounded by the lines Mt/Ze = -(Vl+Bt)/A for the spudcan on leg 1,
and M&Ze = (V2s+B2s)/A for the spudcans on legs 2 and 3. The data suggest that
the spudcan on leg 1 had become incapable of sustaining significant positive
moment, and that the spudcans on legs 2 and 3 had become incapable of
sustaining significant negative moment.
A potential starting point towards an explanation for this unexpected moment
biasing might be in terms of cyclic opening and closing of a crack down one vertical
side of the spudcan, and development of a softened region of soil beneath the
spudcan near the crack tip. The crack might limit moments approximately to IMi/Zel
less than Vi/A. The softer region might throw the centre of vertical force to the other
half of the spudcan bearing area. Further work would be needed to determine
whether this or another process caused the development of moment bias.
3.3 Rapid cyclic horizontal loading
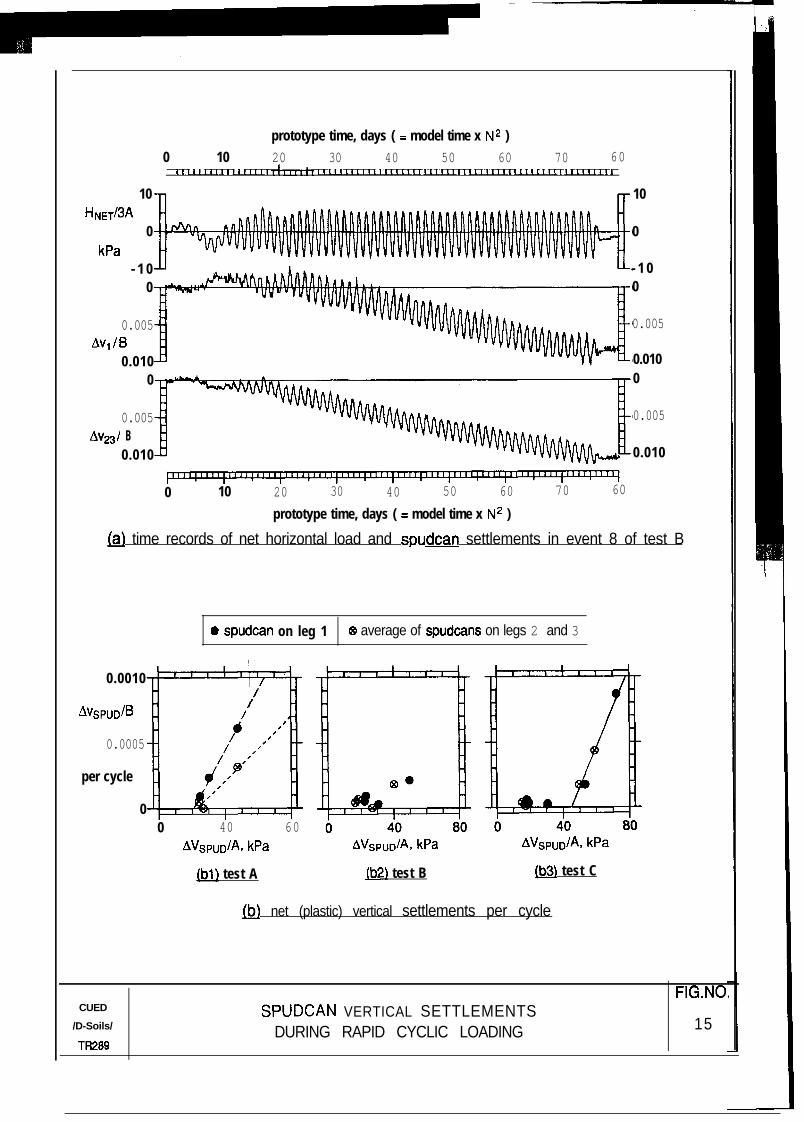
Figure 15(a) shows selected time records for one of the rapid loading events in test
B. The data are plotted against prototype time Tp, equal to N2 times model time.
The record for the normalised total horizontal load Hr&3A shows an initial period
during which the model actuation system was started and the load cycles increased
in magnitude, followed by a period of uniform cycling. The data of spudcan
settlements show an initial period in which there was upwards movement at the
spudcan on leg 1, followed by a period of approximately constant rate of settlement
per cycle. Detailed inspection of the data for the spudcans on legs 2 and 3 suggests
that there was a slight reduction of settlement rate towards the end of the event.
Figure 15(b) shows relations between the plastic settlement per cycle, plotted as
AVSPUD/B on the vertical axes, versus cyclic amplitude of spudcan vertical load,
plotted as AVsp&A, where AVspu~ represents the change in vertical load on a
spudcan between the times of peak positive and peak negative net horizontal load
HNET in a cycle. The data include all the rapid cyclic loading tests listed in Table 4,
and are for the periods of uniform cycling in these events, excluding the start-up

CUED/D-SoWTR289 oaue 11
period of the model cyclic loading actuation system. The data for tests A and C
indicate that there are threshold values of cyclic vertical spudcan load amplitude
below which negligible plastic settlements occur. The threshold values of AVsp&A
were about 20kPa in test A and about 46kPa in test C. The existence of a threshold
is consistent in general terms with the idea of a spudcan yield locus, described for
clays by Santa Maria (1988) and Houlsby and Martin (1992). Continuing settlements
in uniform load cycles indicates the settlements may be due to sub-yield plasticity.
In Figure 16(a), the hull horizontal load-displacement data for three events in test A
are shown. The data are for negatively biased cyclic loading in event 4, two-way
loading in event 2, and positively biased loading in event 6. In all three events there
is hysteresis in individual cycles. The drifts show there was a steady accumulation
of hull horizontal displacements for two-way cycling and positively-biased cycling.
Figure 16(b) shows spudcan settlements during these events. All six diagrams are
to the same scales. There were very small settlements in one-way cycling. There
were large cyclic settlements in the two-way cycling, with the spudcan on leg 1
settling more than the spudcans on legs 2 and 3. For the positively biased cycles,
there were downwards plastic settlements for the spudcan on leg 1, and slight
upwards movements for the spudcans on legs 2 and 3. A differential settlement of
the spudcans causes a rotation A~D~FsET of the jackup given by:
A0 DIFSET = (Avl-Av&/D . . . . . . . . . . . . . . . . . . . . . . . . . . . . . . . . . . . . . . . . . . . . . . . . . . . . . . . . . . . . . . . . . . . . . . . (9)
where D is the leg spacing in elevation. Figure 5 shows that D=186mm for the
model in these tests. The rotation contributes a horizontal drift AhHuLL,DtFsET of the
hull load reference point given by:
AhHULL,DIFSET = y. ABDIFSET = ( Y / D ). ( AVI - A~23 ) . . . . . . . . . . . . . . . . . . . . . . . . . . . . (10)
where Y is the height from the spudcan load reference points (LRP’s) to the hull
reference point HRP at which the hull horizontal displacements are measured. As
noted earlier, Y=352mm for the model of Figure 5. In Figure 16(c), the normalised
net horizontal load HNET/~A is plotted versus an adjusted normalised hull horizontal
displacement Ah*HuLL/B, where:
Ah*HuLL = AhHuLL - AhHuLL,DtFsET . . . . . . . . . . . . . . . . . . . . . . . . . . . . . . . . . . . . . . . . . . . . . . . . . . . . . . . . . .(1 1)

CUED/D-SoildTR289 13aue 12
Three results may be observed. First, the horizontal drift is virtually eliminated.
Second, the hysteresis is virtually eliminated. This indicates that a major fraction of
soil-related damping is associated with plastic vertical settlements. Third, normalised
secant stiffnesses (AHNET/3A)/(Ah*HuLL/B) in Figure 16(c) can be estimated, and
are around 20% higher in two-way cycling and 30% higher in positively-biased
cycling than corresponding values estimated from Figure 16(a). This indicates that a
significant fraction of the horizontal flexibility seen at hull level was due to plastic
differential settlements of the spudcans.
3.4 Pullout
At the end of the tests, the model jackup was reloaded vertically in tests B and C. In
all three tests, the model was finally unloaded and pulled out of the clay at a steady
rate of upwards displacement.
Figures 17(a-c) show data for these final events. In each diagram, the normalised
spudcan vertical displacement VSPUD/B is plotted on the vertical axis versus the
average spudcan vertical stress Vspu~/A over the full spudcan area A=xB*/4.
Symbol Ll stands for the spudcan on leg 1. Symbol L23 stands for the average of
the spudcans on legs 2 and 3. The vertical displacement origins are the same as
those for the preloading data in Figures 8(a-c), and these data are also shown in
Figures 17(a-c). The dotted lines C-C show estimates of the average stress
Vspu~/A at which cavitation would be expected to occur, computed as follows:
Vsp&A at cavitation = - { 1 OOkPa + pw.Gws.( 1 +(ZMWS/~RWS)).ZMWS } . (12)
where pw=1000kg/m3 is the mass density of water, Gws is the centrifuge gravity at
the model water surface, ZMWs is depth below the water surface, and Fiws is the
radius of the water surface from the centrifuge axis. The first component, -lOOkPa,
is an estimate of the excess pore pressure estimated to induce cavitation in the
pore water when the equilibrium pressure is atmospheric. The second component
takes account of the increase in hydrostatic water pressure with depth in the
centrifuge model. The low fluid level in the model tests (level B in Figure 5) means
that limits represented by the dotted lines C-C in Figures 17(a-c) are smaller than
would have been the case for a model of a full-scale prototype in a water depth
corresponding to level A in Figure 5.

CUED/D-SoiWTR289 oaue 13
The data in Figures 17(b,c) show that, in vertical reloading, the load-displacement
responses moved towards, and became continuations of, the previous elasto-plastic
preloading curves. This suggests that plastic damage to the soil during the previous
cyclic loading events listed in Table 4 may haven been partially erased by sufficient
additional settlements under pure vertical load. However, the yield points marked
“X” in Figures 17(b,c) are less sharp than the yield points at the end of the
unloading-reloading excursions in the preloading phases of the tests.
On vertical unloading, the data show marked changes of response associated with
the change of vertical spudcan load Vspu~ from positive to negative. The times at
model and prototype scale from the time of this change to the times when the
spudcans broke away from the soil are listed in the diagrams. Some water may
have been sucked into the soil over these time periods. In all cases, breakout began
at values of Vsp&A less than estimated cavitation limits. Further analysis or
experiments would be needed to determine whether breakout stresses would have
been larger if the fluid surface in the model tests had been at level A in Figure 5,
rather than level B.
4. Conclusions
This paper has reported and discussed centrifuge test data of models of three-leg
jackups on kaolin clay. The tests modelled one prototype jackup with 6.5 metre
diameter 13” conical spudcans, one with 6.5 metre diameter flat-based spudcans,
and one with 13.0 metre diameter flat-based spudcans.
The vertical preloading data confirmed that large vertical plastic settlements were
required to attain significant vertical strength. Results for the flat-based spudcans
indicated that the vertical spudcan stress Vsp&A required to achieve a given
prototype penetration VspUD would be sensibly the same for a 6.5 metre diameter
spudcan as for a 13.0 metre diameter spudcan.
The data of slow cyclic horizontal loading showed significant hysteresis in the hull
horizontal load-displacement responses. Secant horizontal stiffnesses were larger
when the jackup was fitted with 13” conical spudcans compared to flat spudcans of
the same diameter. Spudcan loadpaths indicated that responses were close to
pinned. Spudcan horizontal load-displacement and moment-rotation responses

CUED/D-SoilsITR289 paoe 14
showed marked hysteresis and plasticity. In these tests, the spudcans on legs 2 and
3 generally took a larger share of changes of horizontal load and experienced larger
changes of moment compared to the spudcan on leg 1, for both spudcan shapes
and both sizes. A bias developed in the moment responses, with the spudcan on
leg 1 appearing to become incapable of sustaining significant positive moment, and
the spudcans on legs 2 and 3 appearing to become incapable of sustaining
significant negative moments.
The data of rapid cyclic horizontal loading indicated that there may be thresholds
below which significant spudcan vertical displacement do not occur. Threshold
values will depend on a variety of factors including rig geometry and size and soil
characteristics. Differential spudcan settlements had three effects. They were
largely responsible for an apparent horizontal drift of the hull in two-way cycling and
in positively-biased one-way cycling. They increased the amount of energy
absorbed during individual cycles, leading to increased overall damping. They
decreased the secant horizontal stiffnesses seen at hull level.
In the final events, it was found that vertical re-loading responses moved towards,
and became continuations of, the previous preloading curves. This suggests that
settlements associated with pure vertical reloading may erase effects of prior cyclic
loading. During pullout, significant changes of response occurred as the spudcan
loads Vspu~ changed from compressive to tensile. Breakout occurred at average
spudcan vertical stresses that were less than the estimated cavitation-limited
stresses. It is not possible to know from these data whether higher breakout loads
might have been achieved if the cavitation limits had been higher.
Acknowledaements
The tests reported here were part of a series of tests on sand and clay soils funded
by Esso Exploration and Production UK Limited (EEPUK) and carried out with the
help of staff of Andrew N Schofield & Associates Limited at Cambridge University’s
Geotechnical Centrifuge Centre. Dr RPhillips, now at the Centre for Cold Ocean
Resources Engineering, advised on the clay specimen preparation. We would also
like to thank N.R.Sosdian of EEPUK and J.D.Murff and P.C.Wong of Exxon
Production Research Company. Opinions in this paper do not necessarily represent
opinions of the acknowledgees or organisations involved.
CUED/D-Soils/TR289 References-l
References
1.
2.
3.
4.
5.
6.
7.
8.
9.
Ahrendesen, B.K., Dutt, R.N., and Ingram, W.B., 1989, “Jackup footingperformance: an integrated approach to geotechnical assessment”, Paper OTC6027, Offshore Technology Conference
Airey, D.W., 1984, “Clays in simple shear apparatus”, Ph.D thesis, CambridgeUniversity
Almeida, M.S.S., 1984, “Staged construction of embankments on soft clay”,Ph.D thesis, Cambridge University
Al-Tabbaa, A., 1984, “Anisotropy of clay”, M.Phil thesis, Cambridge University
Al-Tabbaa, A., 1987, “Permeability and stress-strain response of speswhitekaolin”, Ph.D thesis, Cambridge University
Al-Tabbaa, A., and Wood, D.M., 1987, “Some measurements of thepermeability of kaolin”, Geotechnique, 37(4), 499-503
Arnesen, K., Dahlberg, R., Hjesy, K., and Karlsen, C.A., 1988, “Soil-structureinteraction aspects for jackup platforms”, Behaviour of Offshore Structures,
BOSS 88, eds T.Moan, N.Janbu, and O.Faltinsen, Tapir Publishers, Trondheim,Vol. 1, 259-277
Asquer, P.F., and Antalovsky, S.A. 1982, “Rig jacking on soft soil foundations:improvements in safety and speed by monitoring leg loads”, Paper OTC 4408,Offshore Technology Conference
Baglioni, V.P., Chow, G.S., and Endley, S.N., 1982, “Jackup rig foundationstability in stratified soil deposits”, Paper OTC 4409, Offshore Technology
Conference
10. Boswell, L.F. (ed), 1986, The Jackup Drilling Platform, Collins
11. Boswell, L.F., and D’Mello, C., (eds), 1993, The Jackup Platform: Design,
Construction, and Operation, Proc 4th Int Conf, Bentham Press, London
12. Boswell, L.F., and D’Mello, C., (eds), 1995, The Jackup Platform: Design,Construction, and Operation, Proc 5th Int Conf, Bentham Press, London
13. Brekke, J.N., Murff, J.D.,Campbell, R.B., and Lamb, W.C., 1989, “Calibration ofa jackup leg foundation model using full-scale structural measurements”, PaperOTC 6127, Offshore Technology Conference

CUED/D-Soils/TR289 References-2
14. Chaney, R.C., and Demars, K.R., 1991, “Offshore Structure Foundations”,Chapter 18 of Foundation Engineering Handbook, Second Edition, ed.H-Y.Fang, Chapman & Hall, 679-734
15. Clegg, D., 1981, “Model piles in stiff clay”, Ph.D thesis, Cambridge University
16. Corte, J-F., (ed), 1988, Centrifuge 88, Proc Int Conf Geotechnical CentrifugeModelling, Balkema
17. Craig, W.H., 1983, “Simulation of foundations for offshore structures usingcentrifuge modelling”, Developments in Soil Mechanics and FoundationEngineering - I, Model Studies, eds.P.K.Banerjee and R.Butterfield, AppliedScience Publishers, Chapter 1, 1-27
18. Craig, W.H., (ed), 1984, Application of Centrifuge Modeling Techniques to
Geotechnical Design, Balkema
19. Craig, W.H., and Chua, K., 1991, “Large displacement performance of jackupspudcans”, Centrifuge 97, eds.H-Y.Ko and F.G.McLean, Balkema, 139-144
20. Craig, W.H., James, R.G., and Schofield, A.N., (eds), 1988, Centrifuges in Soil
Mechanics, Balkema
21. Dean, E.T.R., James, R.G., Schofield, A.N., Tan, F.S.C., and Tsukamoto, Y.,1992, “Combined vertical, horizontal, and moment loading of circular spuds ondense sand foundations: Data report for drum centrifuge tests YTl-1 L-A thru- G a n d YT2-IL-G t h r u -Y”, Technical Report CUED/D-Soils/TR244,Cambridge University Engineering Department
22. Elmes, D., 1986, “Creep and viscocity in two kaolin clays”, Ph.D thesis,Cambridge University
23. Endley, S.N., Rapoport, V., Thompson, P.J., and Baglioni, V.P., 1981,“Prediction of jackup rig footing penetration”, Paper OTC 4144, OffshoreTechnology Conference
24. Fujii, T., Kobayashi, T., and Tagaya, K., 1989, “Punchthrough encountered inIndia and Indonesia”, Paper OTC 6124, Offshore Technology Conference
25. Hambly, E.C., 1990, “Overturning Instability”, ASCE Journal of GeotechnicalEngineering, 116(4), 704-709
26. Hambly, EC., and Nicholson, B.A., 1991, “Jackup dynamic stability under
extreme storm conditions”, Paper OTC 6590, Offshore Technology Conference
CUED/D-Soils/TR289 References-3
27. Hambly, E.C., Imm, G.R., and Stahl, B., 1990, “Jackup performance andfoundation fixity under developing storm conditions”, Paper OTC 6466, OffshoreTechnology Conference
28. Houlsby, G.T., and Martin, C.M., 1992, “Modelling the behaviour of foundationsof jackup units on clay”, Predictive Soil Mechanics, Proc Wroth Mem Symp,Thomas Telford, 339-358
29. Knoyle, D.S., 1979, “The influence of pore-water tension on the undrainedshear strength of kaolin”, Part III Project Report, Cambridge UniversityEngineering Department
30. Ko, H-Y., and McLean, F.G., (eds), 1991, Centrifuge 91, Proc Int ConfGeotechnical Centrifuge Modelling, Balkema
31. Leung, C.F., Lee, F.H., and Tan, G.T.S., 1994, Centrifuge 94, Proc Int ConfGeotechnical Centrifuge Modelling, Balkema
32. Martin, C.M., 1991, “The behaviour of jackup rig foundations on clay”, First YearResearch Report, Department of Engineering Science, Oxford University
33. Martin, C.M., and Houlsby, G.T., 1994, “Combined loading tests of scale modelspudcan footings on soft clay: experimental data”, Technical Report 2029/94,Department of Engineering Science, Oxford University
34. McClelland, B., Young, A.G., and Remmes, B.D., 1982, “Avoiding jackup rigfoundation failures”, Geotechnical Engineering, 13, 151-l 88; also Proc SyrnpGeotechnical Aspects of Offshore and Nearshore Structures, Balkema
35. McNeilan, T.W. and Bugno, W.T., 1985, “Jackup rig performance inpredominantly silty soils”, Paper OTC 5082, Offshore Technology Conference
36. Osborne, J.J., Trickey, J.C., Houlsby, G.T., and James, R.G., 1991, “Findingsfrom a joint industry study on foundation fixity of jackup units”, Paper OTC6615, Offshore Technology Conference
37. Phillips, R., 1989, “Centrifuge lateral pile tests in clay (Exhibit PR-10592), Task1 - Final Report”, Report by Lynxvale Limited to Exxon Production ResearchCompany
38. Poulos, H.G., 1988, Marine Geotechnics, Unwin Hyman
39. Reardon, M.J., 1986, “Review of the geotechnical aspects of jackup unitoperations”, Ground Engineering, Vol.1 9, No.7

CUED/D-Soils/TR289 References-4
40. Rowe, P.W., 1975, “Displacements and failure modes of model offshore gravityplatforms founded on clay”, Proc Offshore Europe ‘75
41. Rowe, P.W., 1983, “Use of large centrifugal models for offshore and nearshoreworks”, Proc Int Symp Geotechnical Aspects of Coastal and Offshore
Structures, Bangkok, eds.Yudbhir and A.S.Balasubrananiam, Balkema, 21-33
42. Rowe, P.W., Craig, W.H., and Procter, D.C., 1976, “Model studies of offshoregravity structures founded on clay”, Behaviour of Offshore Structures BOSS 76,Vol. 1, 439-448
43. Santa Maria, P.E.L.de, 1988, “Behaviour of footings for offshore structuresunder combined loading”, Ph.D thesis, Oxford University
44. Schofield, A.N., 1980, “Cambridge geotechnical centrifuge operations”,Geotechnique, 30(3), 227-268
45. Schofield, A.N., 1981, “Dynamic and earthquake geotechnical centrifugemodelling”, Proc Int Conf Recent Advances in Soil Dynamics and EarthquakeEngineering, Missouri
46. Senner, D.W.F., 1992, “Analysis of long-term jackup rig foundationperformance”, Offshore Site lnves tiga tion and Foundation Behaviour,
eds.D.A.Ardus, D.Clare, A.HiII, R.Hobbs, R.J.Jardine, and J.M.Squire, Societyfor Underwater Technology, Kluwer Academic Publishers, 691-716
47. Siciliano, R.J., Hamilton, J.M., Murff, J.D., and Phillips, R., 1990, “Effect ofjackup spudcans on piles”, Paper OTC 6467, Offshore Technology Conference
48. SNAME, 1994, Site Specific Assessment of Mobile Jackup Units, Technical andResearch Bulletin 5-5A, Society of Naval Architects and Marine Engineers,Jersey City, NJ
49. Springett, C.N., Stonor, R.W.P., and Wu, X., 1993, “Results of a jackupmeasurement programme in the North Sea and the comparison with thestructural analysis”, Proc 4th Int Conf The Jackup Platform, eds.L.F.Boswell andCD’Mello, Bentham Press, London
50. Springman, S.M., 1993, “Centrifuge modelling in clay marine applications”,
Keynote Address, 4th Canadian Marine Geotechnical Conference, St.Johns,Newfoundland
51. Stewart, W.P., White, R.M., Rapoport, V., and Devoy, S.D., 1989, “On-bottomstability of jackups”, Paper OTC 6125, Offshore Technology Conference
CUED/D-Soils/TR289 References-5
52. Stewart, W.P., Rapoport, V., and Oser, M., 1991, “Observed storm stability ofjackup boats (liftboats)“, Paper OTC 6611, Offshore Technology Conference
53. Tan, F.S.C., 1990, “Centrifuge and theoretical modelling of conical footings onsand”, Ph.D thesis, Cambridge University
54. Taylor, R.N., (ed), 1994, Geotechnical Centrifuge Technology, BlackieAcademic & Scientific
55. Wong, P.C., Chao, J.C., Murff, J.D., Dean, E.T.R., James, R.G., and Schofield,A.N., 1993, “Jackup rig foundation modeling II”, Paper OTC 7303, OffshoreTechnology Conference
56. Young, A.G., Remmes, B.D., and Meyer, B.J., 1984, “Foundation performanceof offshore jackup rig drilling ships”, ASCE Journal of Geotechnical Engineering,
11 O(7), 841-859

CUED/D-SoilsITR289 Table 1
Table 1. Some Material Properties of Speswhite Kaolin
Specific Gravity Gs ......................... 2.61 ............ Clegg (1981), Elmes (1986)2.64 ............. Al-Tabbaa (1984)
MC at Plastic and Liquid Limits .. 38%, 69% ........ Clegg (1981), Airey (1984)31%, 64% ........ Phillips (1989)
Kc, normally consolidated ............... 0.69 ............ Airey (1984), Al-Tabbaa (1984)
Critical state stress ratio M . O.S(comp), 0.68(ext) Al-Tabbaa (1984)0.82 (camp) . . . . . . . Elmes (1986)
Critical state model, h . . . . . . . . . . . . . . . . 0.31-0.21 . . . . . . . . Airey (1984)0.14 . . . . . . . . . . . . . Elmes (1986)
0.187 . . . . . . . . . . . . Al-Tabbaa (1987), Phillips (1989)
critical State model, K ..................... 0.03 ............ Elmes (1986)0.03-0.06 ........ Al-Tabbaa (1987)
Critical state model, r . . . . . . . . . . . . . . . . . . . . . 3.44 . . . . . . . . . . . . Clegg (1981)2.87 . . . . . . . . . . . . . Elmes (1986)3.00 . . . . . . . . . . . . Al-Tabbaa (1987)
cu, isotropically consolidated . . . . . 0.23p’max . . . . . . . . Clegg (1981)
Permeability of 1 D consolidated samples at specific volume V=l +voids ratio :
vertical direction . . . . . . . . 0.53 (V-l)3’16 xl O-s mm/set Al-Tabbaa and Wood (1987)0.34-2.9 x lO& mm/set . . . Springman (1993)
horizontal direction . . . . 1.49 (V-1)2.o3 xl O-c mm/set Al-Tabbaa and Wood (1987)
The clay specimens were created by mixing kaolin powder with de-ionised water.The powder was obtained from English China Clays PLC, St.Austell, Cornwall.Parameter variations may be due to differences between batches over time, and/orto different methods of fitting straight lines to curved data over different ranges ofstress or specific volume, etc.
CUED/D-SoiWTR289 Tables 2 and 3
Table 2. Summary of Jackup Model Tests on Clay
Test
Spudcan shape
Nominal gravity GNOM
SCak factor N = 0.88GNoM/g
Prototype spudcan diameter Bp
Cyclic loading event numbers
A B C
13” cones flats flats
128g 128g 2569
113 113 225
6.5 metres 6.5 metres 13.0 metres
2-8 2-8 2-9
Table 3. Scaling Relations *
Length, displacement .......................................... prototype = N x model
Area ................................................................... prototype = N* x model
Section Modulus Ze ........................................... prototype = N3 x model
Flexural rigidity El ............................................... prototype = N4 x model
Non-dimensional displacement (e.g.v/B) ................ prototype = model
Angle, rotation ........................................................ prototype = model
Effective stress, strain, excess pore pressure ........ prototype = model
Soil modulus (stress/strain) .................................... prototype = model
Force .................................................................. prototype = N* x model
Moment .............................................................. prototype = N3 x model
Coefficients of consolidation, cv, cH ...................... prototype = model
Consolidation and drainage time ....................... prototype = N* x model
Consolidation time factor T=cvt /B* ........................ prototype = model
l The scaling relation for distance implies that, to model a prototype jackup in a fulldesign water depth, the model fluid surface would have had to be around level A in
Figure 5. The lower model water surface, at level B, had no effect on the scalinglaws during the periods in which cavitation did not occur in the pore fluid.

CUED/D-SoiWTR289 Table 4
Table 4. Cyclic Horizontal loading events at model and prototype scales
Event HNET/~A, kPa idcycle Tp/cycleTest No. Description max.neg max.pos seconds days
ABc
ABC
ABC
ABC
A
:
ABC
A
:
C
2 Rapid, 2-way - 8.4 + 7.5 8.8 1.32 Rapid, 2-way - 5.2 + 5.4 8.8 1.32 Rapid, 2-way - 5.3 + 4.6 9.7 5.7
333
444
555
666
777
888
9
Slow, 2-waySlow, 2-waySlow, 2-way
Rapid, 1 -way, negativeRapid, 1 -way, negativeRapid, 1 -way, negative
Slow, l-way, negativeSlow, 1 -way, negativeSlow, l-way, negative
Rapid, l-way, positiveRapid, 1 -way, positiveRapid, l-way, positive
Slow, 1 -way, positiveSlow, 1 -way, positiveSlow, 1 -way, positive
Slow, 1 -way, negativeRapid, 2-wayRapid, 2-way
Slow, 2-way
- 11.0- 9.6- 8.3
- 9.6- 5.8- 6.4
- 15.2- 11.2- 11.0
- 2.6- 2.0- 2.1
- 4.0- 2.4- 2.7
- 16.6- 7.2- 11.7
- 19.2
+ 9.2+ 9.3+ 6.9
+ 2.5+ 1.1+ 2.4
+ 0.3+ 1.3 *+0.7
+ 6.8+ 4.5+ 5.1
+ 12.8+ 10.8+ 8.9
+ 0.0+ 6.6+ 8.7
+ 11.6
9 08 0125
8.88.810
6 56 58 0
8.88.810
6 08 08 0
3 08.810
180
13.311.87 3
1.31.35.9
9.69.647
1.31.35.9
8.911.847
4.41.35.9
105
* event 5 of test B ended with one l-way positive cycle to t-i~~=/3A=+11.2kPa
WIND
-i
wWAVE+
CURRENT
jacking mechanism
a ,spudcan
XED
L-Soils/rR289
FIG.NO.THREE-LEG JACKUP
1
I I I

1
b2 metres diameter, I
s
1metre
1
(a) elevation view
k
i
7 ”
7O
in end view
/b) plan view
C U E D FIG.NO.CAMBRIDGE 2-METRE DRUM CENTRIFUGE CONFIGURED FOR
ID-Soils/JACKUP/SPUDCAN TESTS ON OVER-CONSOLIDATED CLAY 2
TR289
Top beam--/W1 1I
Reaction bars
porous plasticon filter paper
filter paper onporous plasticon steel plate
Base --
specific
volumeV
t
high pressurenitrogen jack
top drain
850mm idextension
850mm idsteel tub
lower drain
1 D consolidation (o’,,,V), Al-Tabbaa (1984)
1 D consolidation (og,V), Airey (1984)
lo II 5 0 100 500 1000
vertical stresses ov, o’,,, kPa
lb) specific volume and vertical stresses
I I II I
CUED FIG.NO.
/D-Soils/ FIRST STAGE OF PREPARATION OF A CLAY BLOCK 3TR289 /
,

I
627mmt- -I
steel frame with lower cutting edges
0 n- - - - - --------___-_- - - - -- - - - - -cL/jy-r------------I,-z-z==- - -===-iL-L---------__-- - - - - - - - - - - - -A-Lz-~~-------zkrL..-~-~~~- - - - - - - - - - - -
,
:a) extrusion from 850mm diameter steel tub /b) cutting a block
50 mmAxis LVDT displacement
/d) settlement aauqe fittedIc) installation in centrifuge after machinina inner surface
FIG.NO.C U E D
‘D-Soils/ SECOND STAGE OF PREPARATION OF A CLAY BLOCK 4TR289

Support frame for actuators and displacement transducers (schematic)
Posts + 62mm -, 124mm
4
Postd-1
1
70mm
30mm
f6.6mm
IHLC
S=71.4mm
diameter B=57.8mm
----z-----L
c
118mm
l- geotextile tcylindrical wall of drum centrifuge
2mm
C U E D 3-LEG MODEL JACKUP AND SUPPORT FRAME, MODEL‘D-Soils! PROPERTIES, DIRECTIONS OF POSITIVE LOADS HAPP, W*, AND U,TR289 AND DIRECTIONS OF POSITIVE SOIL REACTIONS Pi, Qi, AND Mi
FIG.NO.
5
57.8mm diameter
5.2mm8.2mm
12.8mm
-13” aFPL
4h76”
(aI 13” conical spudcans used in test A
57.8mm diameter
12.8mm
8.2mmI-yj- aFPL
76”
lb) flat spudcans used in tests B and C
CUEDFIG.NO.
/D-Soils/ MODEL SPUDCAN SHAPES 6TFI289
I
II
~ ~
0 50 100 150 200 250
o’v, kPa V°CR = (fV,MAX.PREV / O’V
(a) in-test in-situ vertical effective stresses /b) vertical over-consolidation ratios
moisture content, % vane strength, kPa (avgs of 4 values)
(c) post-test 1 cI moisture contents /d) Dost-test 1 g vane strenqths
I ~
CUEDFIG.NO.
/D-Soils/ ESTIMATES OF SOME IN-SITU PROPERTIES 7TR289
1 I

nominal vertical stress Vspuo / ( nB*/4 ) nominal vertical stress VspUD / ( nB*/4 )
0 5 0 100 150-0.10 -0.10
-0.05 -0.05
0 0
0.05 0.05
“SPUD/B “SPUD/B
0.10 0.10
0.15 0.15
0.20 0.20
ia) test A, 13” cones, Bp=6.5 metres /b) test B, flats, Bp=6.5 metres
nominal vertical stress VspuD / ( 7cB2/4 ) nominal vertical stress Vspu~ / ( x8*/4 )
-0.3
F:opi 0adE&
E g 0.3g5;D 22%v) d, 0.63’.o .cr .o, --+-F-m____.. -2 .g 0.9tin2 bJ2aJg E 1.2
- - - .--..-__c_ a’
Q.G
1.5
(c) test C, flats, Bp=l3.0 metres Id) Comparison of tests B and C
I I
CUED ~FIG.NO.
/D-Soils/ PRELOADING DATA 8TR289 I
I 1

A”t-wL /B AhtiuLL/Bla) test A, 13” cones, BP=65 metres lb) test B, flats, BP=65 metres
600AHNET/~AA”HuLL/B
400
kPa
200
-0 .06 -0 .03 0 0.03 0.06At-w-L/B
(c) test C, flats, Bp=13.0 metres
At+,&3A (amplitude from largestpositive value to largest negative value)
id) comparison of normalisedsecant horizontal stiffnesses
C U E DFIG.NO.
ID-Soils/ EVENTS N0.3. SLOW TWO-WAY CYCLING. HULL RESPONSES 9TR289

-10 -5 0 5 -10 -5 0 5 10 -10 -5 0 5 10HI /A, kPa HI /A, kPa HI/A, kPa
ia) Loadpaths at the spudcan on leq 1
-10 -5 0 5 10 - 1 0 - 5 0 5 10Hz3/A, kPa H&A, kPa H&A, kPa
/b) Averages of loadpaths at the spudcans on leqs 2 and 3
C U E DFIGNO.
/D-Soils/ EVENTS N0.3. SPUDCAN LOADPATHS 10TR289
I I II

CUEDFIGNO.
EVENTS N0.3. HORIZONTAL DISPLACEMENTSID-Soils/
AND ROTATIONS AT THE SPUDCAN ON LEG 1 11TR299
L
I

I
(D %6
iiE
(? 0
OY) ti
m.8
2
% as0
s sIN
G 4.
!zI2
B (9 zd 0
ssE
0
wm01
$2
g4(v67 0
‘i s5 s8
K-i 5. am
I Jj3 Y
%cod i?
ELc!
z 0a sN”.ci
1
FIG.NO.C U E D EVENTS N0.3. HORIZONTAL DISPLACEMENTS ANDO-Soils/
ROTATIONS AT THE SPUDCANS ON LEG 2 AND 3 12TR299

0 w 0 y 0-? a
I
KiI 3
- 0 a”Y
-Y if
0-7
I
CUEDFIG.NO.
ID-Soils/ EVENTS N0.3. LOADSHARING BETWEEN SPUDCANS 13TFl289
I I

I
LVDT malfunction here
A~HULL, degrees
A”‘wLLIB(a) hull resoonses
Mj/Ze, kPa M&Ze, kPa
(bl) swdcan on lea 1 /b2) averaae at spudcans on leas 2 and 3
/b) soudcan moment-axial load resoonses
CUEDFIG.NO.
‘D-Soils/ ASPECTS OF SLOW CYCLIC LOADING IN EVENT 9 OF TEST C 14TFl289
1
prototype time, days ( = model time x N* )0 10 20 30 40 50 60 70 60
II1111II11111IIII 1111111111111111,111111111111111111111111111111111~11
10 10HNET/~A
0 0kPa
- 1 0 - 1 00 0
0.005 0.005Av,/B
0.010 0.0100 0
0.005 0.005Av& B
0.010 0.010
l1111~11111111’!1~11~‘~~‘!““l”“~””~””!””~””~””~““!““f”“!“”~0 10 20 30 40 50 60 70 60
prototype time, days ( = model time x N* )
(a) time records of net horizontal load and spudcan settlements in event 8 of test B
0 spudcan on leg 1 @ average of spudoans on legs 2 and 3
0.0010
A’JsPuD/B
0.0005
per cycle
00 40 60
AVsp&A, kPa AVspuoIA, kPa AVsp&A, kPa
[bbl) test A lb21 test B /b31 test C
/b) net (plastic) vertical settlements per cycle
FIG.NO.CUED SPUDCAN VERTICAL SETTLEMENTS
/D-Soils/ DURING RAPID CYCLIC LOADING 15TR289
I

/
event 4 event 2 event 6one-way negative two-way one-way positive
A”‘HuLL/B A”HULL/B A’-‘HuLL/B
la) hull horizontal load-displacement responses
A”HULLIB A”HuLLIB A”twLL/B
/b) spudcan vertical displacements
8
~HNET- 03A
-8-0.02 0 0.02 -0.02 0 0.02 -0.02 0 0.02
Ah*tiuLL/B A’-‘*iiuLLIB Ah*HuLL/B
@) hull horizontal responses with effect of differential spudcan settlements extracted
CUED ANALYSIS OF EFFECT OF MEAN HORIZONTAL LOAD AND DIFFERENTIAL FIG.NO.
/D-Soils/ SElTLEMENTS IN 34 CYCLES OF RAPID LOADING. TEST A, 13” CONES. 16TR289 GNOM=128g, Bp=6.5 METRES, T~z8.8 SECS/CYCLE, Tpzl.3 DAYS/CYCLE

nominal vertical stress VsPUD! ( xB2/4 ) nominal vertical stress Vspuo / ( zB2/4 )-100 0 100 200
Tension times:
[a) test A. 13” cones, Bp=6.5 metres /b) test B, flats, BP=65 metres
nominal vertical stress Vsp”~ / ( xB2/4 )
-100 0 100 200
&) test C, flats, Bp=13.0 metres
FIG.NO.CUED
‘D-Soils/ PRELOADING, VERTICAL RE-LOADING, AND PULLOUT DATA 17TR289
I

CUED/D-SoiWTR289 Appendix 1
Appendix 1. Notation
A
B
Bi
CVv CH
D
e
El
f
9
%wvI
GSh
Hi
HNET
HLC
H R P
KoL
LRP
M
N
P
Q
r
R
Rws
S
SLC
T
Q
U
v
v
footing area at largest section, = nB2/4
footing diameter at largest section (Bp=prototype diameter)
buoyancy upthrust on the spudcan on leg i
coefficient of consolidation, vertical, horizontal
distance between leg 1 and legs 2 and 3 in side elevation
voids ratio
leg flexural rigidity
moment fixity, ratio of actual spudcan moment divided by theoretical value
for a fully encastre foundation
acceleration of earth’s gravity, = 9.81 metres/sec2
centrifugal acceleration at 1 metre radius from the drum axis
average specific gravity of soil particles
horizontal displacement
horizontal load on spudcan on leg i
sum Hl+Hz+Hs of spudcan horizontal loads
hull-leg connection
hull reference point
coefficient of lateral earth pressure
leg length, hull-leg connection (HLC) to spudcan-leg connection (SLC)
load reference point on spudcan
moment
scale factor
axial load
shear load
radius from centrifuge axis
radius of centrifuge
radius at model water surface
height of idealised rigid spudcan
spudcan-leg connection
time (TM, Tp) or time factor (T=cvt/B2)
shear load
upthrust applied to centrifuge model (Figure 5)
vertical displacement
specific volume, =l +e
AODIFSET jackup rotation due to differential spudcan settlement
AhHULL,DIFSET hull horizontal displacement due to differential settlement
Ah*wLL hull horizontal movement adjusted to exclude effect of differential
spudcan settlement (equation 11)
r&K constants in critical state model
8 rotation
P’ buoyant mass density of soil, =(Gs-l)./(l+e)
PW mass density of water, approximately 1000 kg/m3
ov, cr’v vertical total and effective stresses
o’e circumferential effective stress
Subscripts
APP applied to the model (HApp = horizontal load applied to model, Figure 5)
DIFSET due to spudcan differential settlement
H horizontal
HULL of the hull, at the hull load reference point
i quantity for the spudcan on leg i
M model (TM = model time period)
MAX.PREV maximum previous value
NET total, net (HNE= = total horizontal load)
N O M nominal (GNOM= centrifuge gravity at inner drum wall)
P prototype (BP = prototype diameter, Tp=prototype time period)
SPUD quantity for a spudcan
V vertical
1 quantity for the spudcan on leg 1
23 average of quantities for the spudcans on legs 2 and 3
CUED/D-Soils/TR289 Appendix 1
Vi
Vi,totalw
W*
Y
Z
zMWS
Ze
A
vertical load on spudcan on leg i equilibrated by the sum of soil effective
stresses and excess pore pressure at the spudcan-soil interface.
total vertical load on spudcan on leg i, =Vi+Bi
buoyant rig weight, Vt+V2+V3
weight of model in centrifuge gravity (Figure 5)
height from spudcan LRP’s to HRP, approx 352mm for the model here
depth below soil surface
depth below model water surface
footing equivalent elastic section modulus at largest section, = 7cB3/32
change of