Embed Size (px)
Citation preview
HEUNI Paper No.13
Drug Offenders in the Global Criminal Justice System
Sheryl Van Horne*
Graham Farrell**
The European Institute for Crime Prevention and Control,affiliated with the United Nations
Helsinki, 1999
* Doctoral candidate, School of Criminal Justice, Rutgers University** Deputy research director, The Police Foundation, Washington D.C.Correspondence to Graham Farrell, The Police Foundation, 1201 Connecticut Ave NW, Washington DC 20036.
HEUNI Paper No.13 Van Horne & Farrell2
This document is available electronically from:http://www.vn.fi/om/heuni/
HEUNIThe European Institute for Crime Prevention and Control,affiliated with United NationsP.O.Box 161FIN-00131 HelsinkiFinlandTel: +358-9-18257880Fax: +358-9-18257890e-mail: [email protected]://www.vn.fi/om/heuni
ISSN 1236-8245
HEUNI Paper No.13 Van Horne & Farrell3
Table of Contents
Summary ..............................................................................................................................................4Introduction ..........................................................................................................................................5Data Source and Methodological Issues ..............................................................................................5
Previous analyses of UNCJS............................................................................................................5Why so little UNCJS drug offence analysis? ...................................................................................6A Preliminary Typology of Between-Country Differences .............................................................6
Country A prosecutes all drug offences but Country B does not. ........................................................8Types of analysis conducted and indicators used.............................................................................9
Analysis and Findings ........................................................................................................................10Recorded Offences .........................................................................................................................11Suspects ..........................................................................................................................................12Prosecutions....................................................................................................................................12Convictions.....................................................................................................................................13Prison Admissions..........................................................................................................................13Average Prison Sentence for Drug Offences .................................................................................14
Discussion and suggestions for further research ................................................................................14General International Trends over Time ........................................................................................14Further investigation of the statistically deviant countries.............................................................15Further International Analysis of UNCJS ......................................................................................16Comparison to Other Data and Source of Information ..................................................................16Attrition and Retention Rates .........................................................................................................16Examining Extent of Change over Time........................................................................................17The Development and Comparison of Different Indicators ...........................................................17Comparison of Trends in Drug Offences to Other Offences..........................................................17
Conclusions ........................................................................................................................................17References ..........................................................................................................................................19Annex .................................................................................................................................................21
HEUNI Paper No.13 Van Horne & Farrell4
Summary
The present work assesses the extent, varia-tion and changes in drug trafficking, drugpossession and all drug offences in criminaljustice systems around the world between.Across the five years of study there was astrong international trend over time, showingrelatively small but widespread increases indrug offenders for each stage from suspectsarrested by law enforcement, through prose-cutions and convictions, to prison admis-sions. The international mean for all drug of-fences as a percentage of all offences was 7%of suspects, 7% of prosecutions, 6% of con-victions, and 11% of prison admissions in themost recent year for which data was avail-able. The non-parametric sign-test is used toshow that the international trends were sta-tistically significant in terms of the number ofcountries increasing or decreasing the pro-portion of drug offenders. It seems that, ingeneral, criminal justice systems around theworld are characterised more by the similari-ties than differences in the proportions ofdrug offenders at different stages. However,several statistically deviant countries areidentifiable at different criminal justice stagesand at different times. Some specific issuesare worthy of further examination. In par-ticular there is the possibility that the UnitedStates is not particularly more punitive atsentencing or imprisonment than othercountries when it comes to drug offenders,but rather, that it has a relatively greater ten-dency to prosecute drug offences cases. Fur-ther, at the stage of imprisonment, drug of-fenders constitute a larger proportion of alloffenders imprisoned in Belgium, Italy andGermany, than they do in the United States.Although people are often quick to identifythe US the world's penal sadist when it comesto drug offenders, the present data set sug-gests that for the early 1990's at least, there isno conclusive evidence that this is the case.The further investigation of these and otherissues may provide information of relevanceto drug policy or criminal justice policy at thenational or international level. Variations in
sentence lengths for drug offences are alsoexamined, although the data is more frag-mented. For those countries that responded,the international median sentence length forpossession offences is around one year com-pared to somewhere between three and fiveyears for trafficking. The findings and theirinterpretation should be viewed with cautiondue to the limitations of the data. However,the analysis suggests that the United Nationscrime survey has been under-utilised as ameans of developing knowledge and infor-mation of relevance to national and interna-tional drug policy and criminal justice policy.A range of possibilities for furthering the pre-sent work is suggested.
HEUNI Paper No.13 Van Horne & Farrell5
Introduction
In the middle to late 1980's and early 1990's,the global illicit drug trade expanded signifi-cantly. Opium poppy and coca leaf cultiva-tion approximately trebled in the 1980’s,leading to huge increases in the illicit manu-facture of heroin and cocaine (Stares 1995).The illicit industry relating to the ampheta-mine-type stimulants experienced rapidgrowth, with much production occurringwithin the large consumer markets of thewestern industrialised world (Pietschmann1997). As a result, law enforcement agenciesin more countries than ever before seizedeach of these illicit drugs and made relatedarrests (Keh and Farrell 1997). At the sametime, and partly as a response to this change,some countries began to further gear theirlaw enforcement machinery towards greaterefforts against the illicit drug trade. Thechanges were reflected in the internationalcommunity with the passing of the 1988 Vi-enna convention (United Nations 1990).
Other things equal, it would be expected thatan expanded illicit drug industry at the sametime as increased law enforcement wouldlead to an increase in the proportion of drug-related offenders at different stages of thecriminal justice systems for the countries in-volved. Yet, despite some country-levelanalyses, there appears to be a relative dearthof cross-national and international analysesof this phenomenon. As James Lynch, andauthor well versed in cross-national analysis,recently noted:
"… [V]irtually all of the cross-national studies ofprison use have compared nations on their re-sponse to serious common law crimes and specifi-cally crimes similar to UCR index crimes. Manyof the most dramatic changes in prison use, how-ever, seem to be occurring in the area of drug of-fences." (Lynch 1995: 35-6)
This leaves a fairly broad and significant gapin knowledge relating to drug offenders inthe global criminal justice system – an areawhich is potentially one of the most impor-
tant areas of global criminal justice of recenttimes. Or is it? What proportion of offences incriminal justice systems are related tobreaches of drug laws in different countries?Has significant change really occured incriminal justice systems worldwide due todrug-related offences? If change occurred,were different criminal justice systems simi-larly affected? To what extent? Which coun-tries were unaffected or were marginally af-fected? Did drug offences begin to placestrain upon criminal justice systems every-where, or only in a small minority of coun-tries? If there was change, what was thespeed of change and the variation over timeand place? This work begins to address someof these questions.
Data Source and MethodologicalIssues
Previous analyses of UNCJSThe data source used is the Fifth United Na-tions Survey of Crime Trends and CriminalJustice Systems (UNCJS). Since 1977, the sur-vey has been sent every five years to all UNmember states, with the data collected cov-ering back to 1970. The content of the surveyhas changed considerably over time andmore recent sweeps have focused uponcriminal justice systems (see Burnham 1999for a short history of the survey). In their re-cent overview of the survey, Graeme New-man and Greg Howard observe that"There are many difficulties, for researchers andpolicy makers alike, in using and interpreting theUNCJS statistics. These statistics are, first andforemost, official statistics of member countries.They are, in fact, probably the most official statis-tics of international crime and justice that arepublished anywhere. One need only observe theways in which countries behave internationally asentities - the ritual care with which they makestatements in the international arena - to realizethat a country's open announcement of the extentof its crime problem and its processing of offendersthrough the criminal justice system is a majorpolitical event. Countries do not reveal such in-formation to other countries (and often to their
HEUNI Paper No.13 Van Horne & Farrell6
own citizens) unless this information has beenrigorously checked, not only for its 'validity' butalso for the impression that it creates." (Newmanand Howard 1999; 8, emphasis in original)
The Global Report on Crime and Justice ed-ited by Newman (1999) contained a range ofchapters that analyse various aspects of the5th UNCJS including one with elements thatare a precursor to the present report (Farrell1999). In addition, the European Institute ofCrime Prevention and Control, affiliated withthe United Nations (HEUNI) recently pub-lished a series of analyses of the Fifth UNCJSsurvey (Kangaspunta et al 1998a, 1998b). TheKangaspunta et al. work makes significantinnovative steps forward by integrating theUNCJS survey with the International CrimeVictim Survey (ICVS). The United Nationshas produced a series of official publicationsbased on UNCJS over the years, and therehas been a range of relevant academic publi-cations including: Nalla and Newman (1994)who compared crime in the USSR and theUSA in the first half of the 1980’s; Harvey etal. (1992) who examined gender differencesin criminal justice; Pease (1994) who used thesurvey as part of his critique of per capitaimprisonment rates as a cross-national meas-ure of punitiveness, and; Pease and Tseloni(1994) who examined juvenile justice in theinternational arena and used the non-parametric sign test in a similar fashion to itsuse herein. Although this is far from, and notintended to be, a comprehensive review ofcross-national comparative work, homicidestatistics are commonly recognised to be themost reliable cross-national crime data andthey are one of the most studied. Homicidestatistics derive from a number of sourcesincluding UNCJS, Interpol, and the WorldHealth Organisation, and have been the focusfor a series of research papers by authors in-cluding Neapolitan (e.g. Neapolitan 1996)and Messner (e.g. Messner 1997).
Why so little UNCJS drug offence analysis?
Despite the range of published UNCJS analy-ses, it is apparent that work relating to drugoffences using UNCJS is sparse. Pease and
Hukkila (1990) looked at drug crimes usingthe third UNCJS data for 1980-1986. Theyfound that, amid generally increasing crimerates, drug crimes had the most precipitousincreases. It is possible to speculate that thedearth of drug offence analyses using UNCJSis due to a Catch-22 situation: the drug-related offences would not be analysed untilthey were known to exist among drug re-searchers, and they would not be known toexist until they were analysed and published.The UNCJS survey is conducted by the Cen-tre for International Crime Prevention (UN-CICP), whose main focus is non-drug crimes.Drug possession and trafficking have tradi-tionally been outside the sphere of interest ofwhat is now UNCICP, not least because thereare UN sister agencies that specialise indrugs.1 At the same time, it is possible thatthe drug-related aspects of UNCJS remainedlargely unknown among UN agencies con-centrating on international drug policy andamong independent drug researchers whowould not naturally turn to UNCJS as asource of information. These factors couldcombine with a frequent pre-occupation withthe technical aspects and alleged methodo-logical difficulties of the survey among re-searchers. It is possible that such a mundaneexplanation accounts for the lack of exploita-tion of a unique resource for comparativedrug policy research.
A Preliminary Typology of Between-CountryDifferences
At the time of writing, the most recent surveysweep covers the period 1990 to 1994 inclu-sive. Response rates to the survey are lessthan 100% (see Kangaspunta 1998a; Newmanand Howard 1999), and there are often in-complete responses to specific data items.The UNCJS data on drug offences relates to
1 Prior to 1990, the Division on Narcotic Drugs (DND),the International Narcotics Control Board (INCB), andthe UN Fund for Drug Abuse Control (UNFDAC) (seeBruun, Pan and Rexed 1975), and post-1990, the UnitedNations International Drug Control Programme (seeUNDCP 1997). At the same time, other UN agenciessuch as the UNRISD have published on a range of drugpolicy issues (see e.g. Tullis 1996).
HEUNI Paper No.13 Van Horne & Farrell7
drug trafficking and possession offences anda third broad category of 'all drug offences'.Crimes that are indirectly related to drugsbut not breaches of drug laws, such as ac-quisitive crime to fund drug use, drug-related shootings and assaults, are not classedas drug offences. This is not to minimise theirsignificance, but is simply due to the natureof the data set, which only contains informa-tion on breaches of specific drug laws. TheUNCJS questionnaire asks how many drugoffence cases there were for suspects, thenumbers prosecuted, convicted, and admit-ted to prison. Two questions ask the averagesentence length in that country for possessionand trafficking offences.
The questions relating to drug offences varyin their specifics for each stage of the criminaljustice system. Data relating to traffickingand possession are available in relation torecorded offences and average sentencelength. In relation to suspects and prosecu-tions, data for the number of all drug offencesis also available. For convictions and prisonadmissions, information on possession andall drug offences is available. No formal ex-planation is offered here for these apparentdiscrepancies. It may simply reflect difficul-ties in maintaining consistency in a lengthyquestionnaire that has been revised severaltimes over the years (Burnham 1999). FutureUNCJS sweeps might consider harmonising
these classifications for questions relating todrug offences, preferably asking for all threedata points at each stage.
With respect to methodological issues, MattiJoutsen summarises the key issues as part ofhis more detailed analysis:
“The major problems in regards to data analysisare the imprecise definition of the terms, improperclassifications, ambiguous coding structures, anddifferences in the units of count used.” (Joutsen,1998; 3)
Joutsen also recognises that“These are problems that, to a large extent, arecommon to all efforts in gathering internationalcriminal justice statistics.” (Joutsen, 1998; 3)
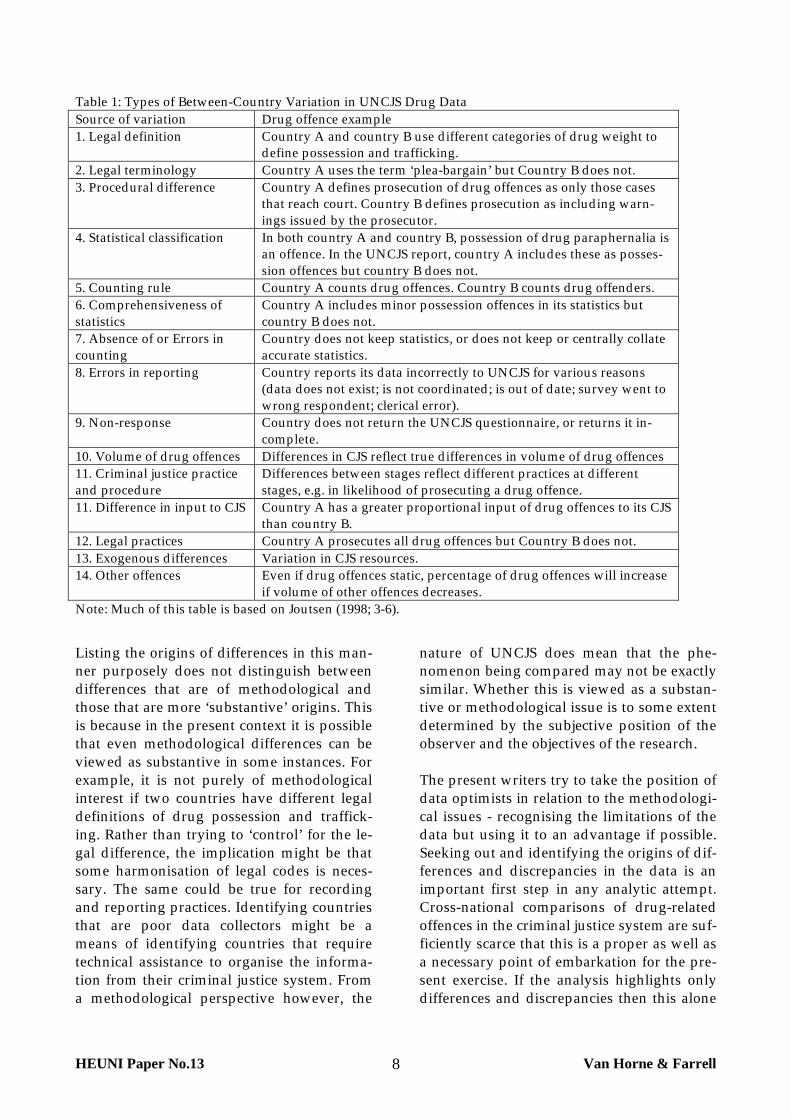
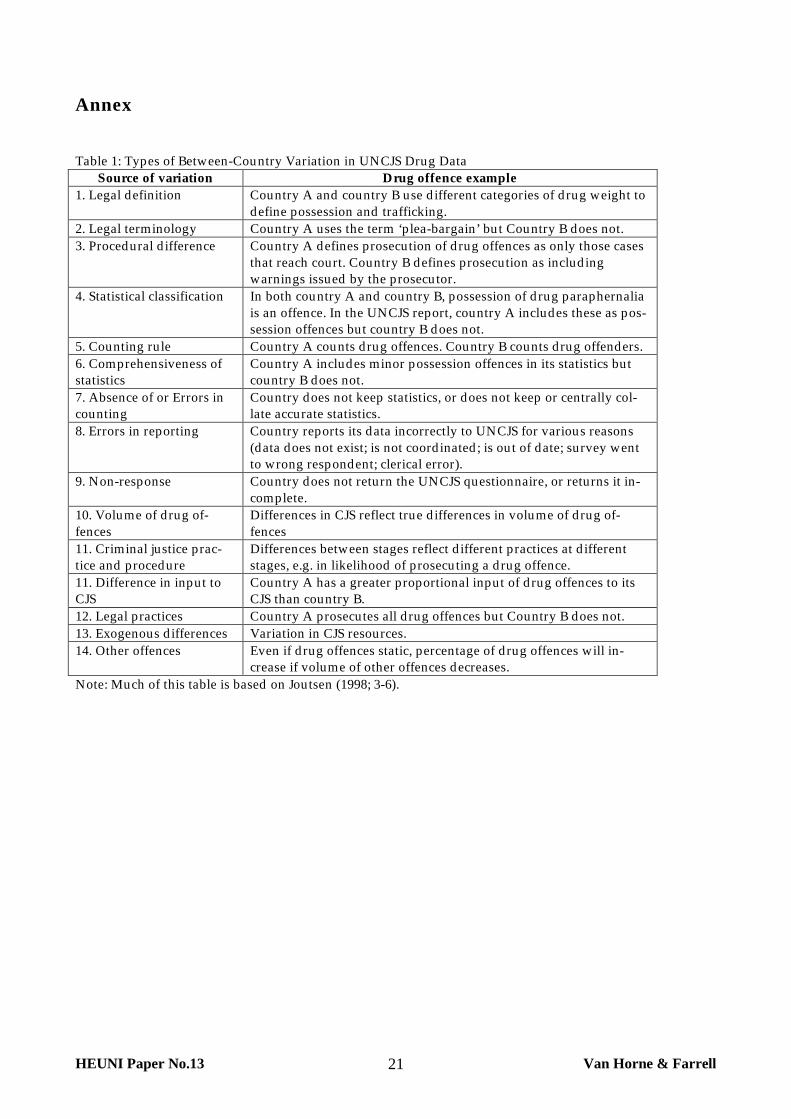
Although the same survey questions on drugoffences are asked of each country, this doesnot mean that UNCJS can be said to utilisestandardised measures. Definitions andterms vary from country to country, as dorecording and reporting procedures. Exam-ining the UNCJS data can lead to the identifi-cation of the origins of between-country dif-ferences. The potential origins of differencesare wide and varied. Table 1 attempts to listthe reasons as a preliminary typology, muchof it summarising the methodological issuesdescribed by Joutsen (1998: 3-6). .
HEUNI Paper No.13 Van Horne & Farrell8
Table 1: Types of Between-Country Variation in UNCJS Drug DataSource of variation Drug offence example1. Legal definition Country A and country B use different categories of drug weight to
define possession and trafficking.2. Legal terminology Country A uses the term ‘plea-bargain’ but Country B does not.3. Procedural difference Country A defines prosecution of drug offences as only those cases
that reach court. Country B defines prosecution as including warn-ings issued by the prosecutor.
4. Statistical classification In both country A and country B, possession of drug paraphernalia isan offence. In the UNCJS report, country A includes these as posses-sion offences but country B does not.
5. Counting rule Country A counts drug offences. Country B counts drug offenders.6. Comprehensiveness ofstatistics
Country A includes minor possession offences in its statistics butcountry B does not.
7. Absence of or Errors incounting
Country does not keep statistics, or does not keep or centrally collateaccurate statistics.
8. Errors in reporting Country reports its data incorrectly to UNCJS for various reasons(data does not exist; is not coordinated; is out of date; survey went towrong respondent; clerical error).
9. Non-response Country does not return the UNCJS questionnaire, or returns it in-complete.
10. Volume of drug offences Differences in CJS reflect true differences in volume of drug offences11. Criminal justice practiceand procedure
Differences between stages reflect different practices at differentstages, e.g. in likelihood of prosecuting a drug offence.
11. Difference in input to CJS Country A has a greater proportional input of drug offences to its CJSthan country B.
12. Legal practices Country A prosecutes all drug offences but Country B does not.13. Exogenous differences Variation in CJS resources.14. Other offences Even if drug offences static, percentage of drug offences will increase
if volume of other offences decreases.Note: Much of this table is based on Joutsen (1998; 3-6).
Listing the origins of differences in this man-ner purposely does not distinguish betweendifferences that are of methodological andthose that are more ‘substantive’ origins. Thisis because in the present context it is possiblethat even methodological differences can beviewed as substantive in some instances. Forexample, it is not purely of methodologicalinterest if two countries have different legaldefinitions of drug possession and traffick-ing. Rather than trying to ‘control’ for the le-gal difference, the implication might be thatsome harmonisation of legal codes is neces-sary. The same could be true for recordingand reporting practices. Identifying countriesthat are poor data collectors might be ameans of identifying countries that requiretechnical assistance to organise the informa-tion from their criminal justice system. Froma methodological perspective however, the
nature of UNCJS does mean that the phe-nomenon being compared may not be exactlysimilar. Whether this is viewed as a substan-tive or methodological issue is to some extentdetermined by the subjective position of theobserver and the objectives of the research.
The present writers try to take the position ofdata optimists in relation to the methodologi-cal issues - recognising the limitations of thedata but using it to an advantage if possible.Seeking out and identifying the origins of dif-ferences and discrepancies in the data is animportant first step in any analytic attempt.Cross-national comparisons of drug-relatedoffences in the criminal justice system are suf-ficiently scarce that this is a proper as well asa necessary point of embarkation for the pre-sent exercise. If the analysis highlights onlydifferences and discrepancies then this alone
HEUNI Paper No.13 Van Horne & Farrell9
is arguably a substantive contribution to thefield of cross-national drug research. Specificexamples should make this point clearer asthe findings are presented.
Types of analysis conducted and indicatorsusedSeveral types of analysis are possible usingthe UNCJS data. Cross-national comparisonallows the identification of countries that areanomalous with respect to any or all aspectsof the drug offence data. A simple statisticaltechnique is used herein to highlight some ofthe between-country anomalies.
A second type of analysis that can be con-ducted with the drug offence data is theidentification of international trends overtime and across stages of the criminal justicesystem. This is termed international trendanalysis to distinguish it from cross-nationalanalysis. International trend analysis is pos-sible so long as any between-country defini-tional differences remain fairly consistentover time. Consider the hypothetical casewhere forty-five countries use different legaldefinitions of drug trafficking but all reportan increase in the proportion of drug traf-ficking offenders prosecuted in 1994 com-pared to 1990. Such a trend is almost cer-tainly independent of definitional discrepan-cies. Similarly, what if, for a given year, allreporting countries retain a greater propor-tion of drug possession offences at the laterstages of the criminal justice system? Again,this may reasonably be taken as a trend thatis independent of definitional discrepancieseven if the specific causes vary betweencountries. Such a strong pattern would cer-tainly warrant further investigation.
Despite specific legal definitional differencesbetween countries, the findings presentedbelow often demonstrate that, in relation todrug trafficking and possession, the globalcriminal justice system is often characterisedby similarities rather than differences be-tween countries. It is sometimes possible tooverlook such a basic issue in the search foranomalies, trends over time, and trends be-tween stage of the system. The present work
merely scratches the surface of a huge andlargely unexplored area of cross-national andinternational analysis, and a range of possi-bilities for further research are suggested inthe penultimate section of this work.
In what follows, the main quantitative indi-cator used is percentages. For example, thenumber of drug trafficking suspects are ex-amined as a percent of all suspects in thecriminal justice system, and the number oftrafficking convictions as a percentage of allconvictions for that country. Like any indi-cator this has strengths and weaknesses. Themain advantage is that percentages are acommon metric. They are comparable acrosscountries whereas absolute numbers are notsince percentages are independent of the ab-solute number of trafficking or possessionoffences in the country. This strength can alsobe a weakness. It becomes absurd to compareand give similar weight to countries ofgreatly varying size and criminological con-text: some countries are so small that theyrecord only a relative handful of crimes peryear for instance, so that percentage shiftsmay be small absolute changes. Per capitarates are frequently used in cross-nationalcomparisons of this sort since population is areadily available denominator, but they havealso been criticised since 'population' is tosome extent a denominator of conveniencerather than of relevance to the issue in ques-tion (see for example, Pease 1996). However,if the denominators remained reasonablyconstant across years, any trend analysis ofthe sort conducted here would be identical(however sign-test trend analysis based onthe raw numbers of drug offences would beequally valid). Perhaps the single main rea-son for selecting all offences rather thanpopulation or another numerator is that thepercentage which result are in terms of a unitof analysis of relevance to the criminal justicesystem (offences). In short, no indicator isperfect, and the one used here is arguably atleast as useful as any other immediatelyavailable. It is acknowledged that there ismuch scope for further investigation.
HEUNI Paper No.13 Van Horne & Farrell10
From the rates for individual countries, inter-national mean and median rates are also pre-sented. These are not weighted by the size ofthe country. This means that, as discussedabove, countries of varying size and contextcontribute equally to the international means.Again, this is not perfect, and the 'interna-tional means' presented here are a differentmeasure from what might be termed a 'globalmean' based on the individual case or of-fender as the unit of interest rather than thecountry. The two measures are simply of dif-ferent phenomena. The international meanand medians presented here give crude indi-cators of international average tendencies as abasis for comparison. Once again, the poten-tial for the development of this work utilisingadditional, different and complementarymeasures does not go unrecognised.
Analysis and Findings
Findings are presented sequentially by stageof the criminal justice system, followed byaverage sentence lengths. Within stages, alldrug offences are discussed first where thatinformation is available, followed by posses-sion then trafficking offences. Within eachstage, individual country similarities and dif-ferences are followed by international trendsover time. The set of findings by stage arefollowed by a section examining overall in-ternational trends.
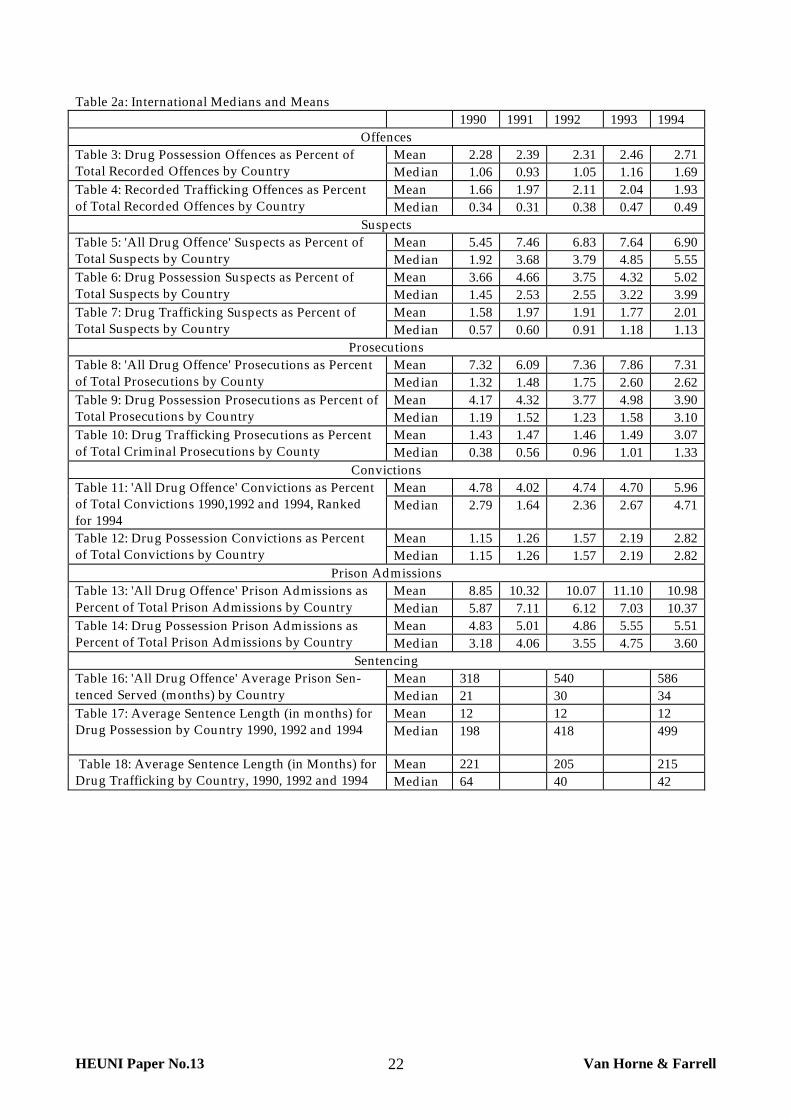
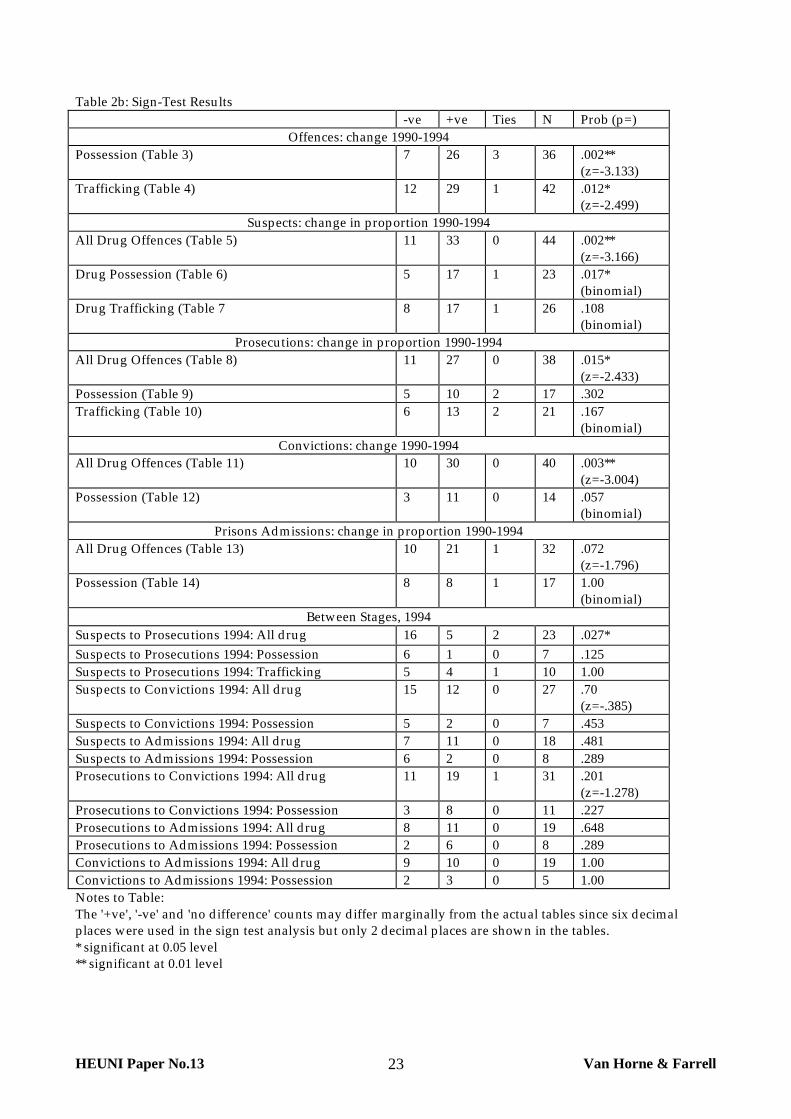
Tables 2a to 2c present summary informationthat are referred to in different sections of thefindings. Table 2a contains the internationalmeans and medians of the country-level dataof Tables 3 to 17, purely for ease of reference.Table 2b presents the results of the non-parametric sign tests that are used to look forinternational trends as described below. Withless than or equal to 25 observations the exactmethod was used with reference to the tablesof the normal distribution; with more than 25observations the normal approximation wasused, giving the respective z-scores. Specificresults are discussed in the relevant sections.The first column of Table 2b also details the
Table (3 to 17) to which the statistical test re-fers.
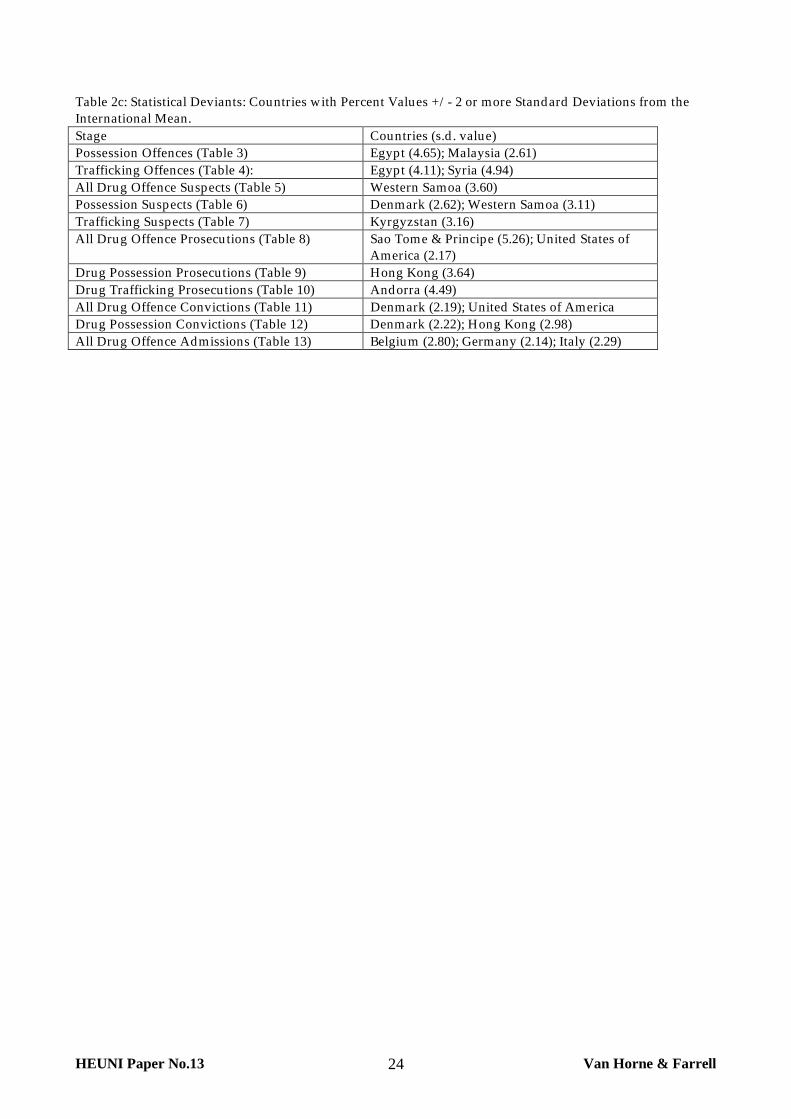
Table 2c shows a list of countries identified as'statistical deviants' for each different stage ofthe criminal justice system. It is impossible todiscuss every country in the data set for eachyear and each stage of the criminal justicesystem and in relation to the others. Instead,a cut-off criterion was used to identify ex-treme countries. If the percentage of cases fora country was more than two standard de-viations above the international mean then itwas identified as a statistical deviant. The z-scores are shown in the final column of eachof Tables 3 to 17. Although the data are typi-cally skewed towards the lower end of therange, standard deviation is still a reasonablemeasure to identify statistical outliers at theupper end of the range. While this means thatmany of the most deviant countries aretouched on in the text, it is clear that thereremains rich potential for further analysis tobe undertaken. Closer scrutiny of Tables 3 to17 reveal a range of interesting variations andpatterns which are not fully described in thebody of the text.
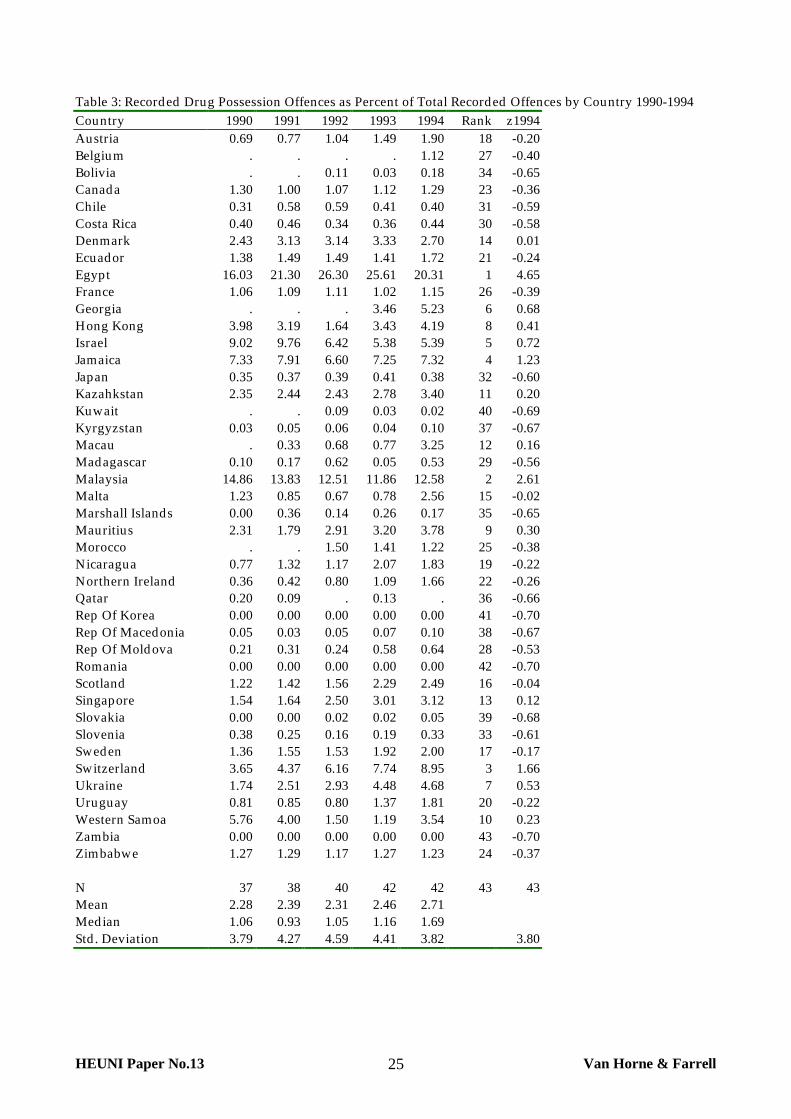
Tables 3 to 17, discussed in the following sec-tions, have several common features that willbenefit from prior description. Each tablepresents an alphabetised list of countries foreach of the five years, showing all availabledata points provided by governments. Thepenultimate column shows the rank of thatcountry's 1994 value. In the absence of 1994data, the most recent year with data wasutilised. This means that every country thatprovided data for any year was ranked andits z-score calculated. Ranks are in descend-ing order. Hence Egypt is ranked 1 in Table 3since it has the highest percentage of re-corded crime attributable to recorded drugpossession offences. The z-score for 1994 (ormost recent available year) represents thenumber of standard deviations the countrieslie from the international mean. Many of theanalytic tables presented in Kangaspunta etal. (1998a) presented the overall standard de-viation as well as the international mean and
HEUNI Paper No.13 Van Horne & Farrell11
this analysis simply takes that one step fur-ther.
Recorded OffencesIn relation to volume of offences, data wasonly requested on drug possession and traf-ficking. Perhaps more so than the remainderof the data, that relating to recorded offencesof trafficking and possession is likely to bemisleading. Whereas data for each of thestages of the criminal justice system purportto represent the population, that relating torecorded offences is a sample of uncertainrepresentativeness. This is because manydrug trafficking and possession offences donot come to the attention of the police since,as they are victimless crimes (there is no di-rect victim in all normal senses of the word),there are few incentives for persons to contactthe police. Consequently, trafficking and pos-session offences can only be expected to beofficially recorded as such when they come tothe attention of the police in instances wherean arrest is made or there is some formalcontact with the police.
As potentially the limiting worst case ofUNCJS data, recorded drug offences areworthy of examination. The data can stillprovide a partial and indirect cross-nationalcomparative indicator of interest. For exam-ple, if rates of under-recording of traffickingand possession crimes are either similar be-tween countries or at least remain fairly con-stant over time, then some useful patternsmay still be evident. Similarly, by examiningthe relationship between the proportion ofrecorded crimes compared to suspects,prosecutions and other stages, some patternsmight be apparent that shed light upon dif-ferent processes in different locales.
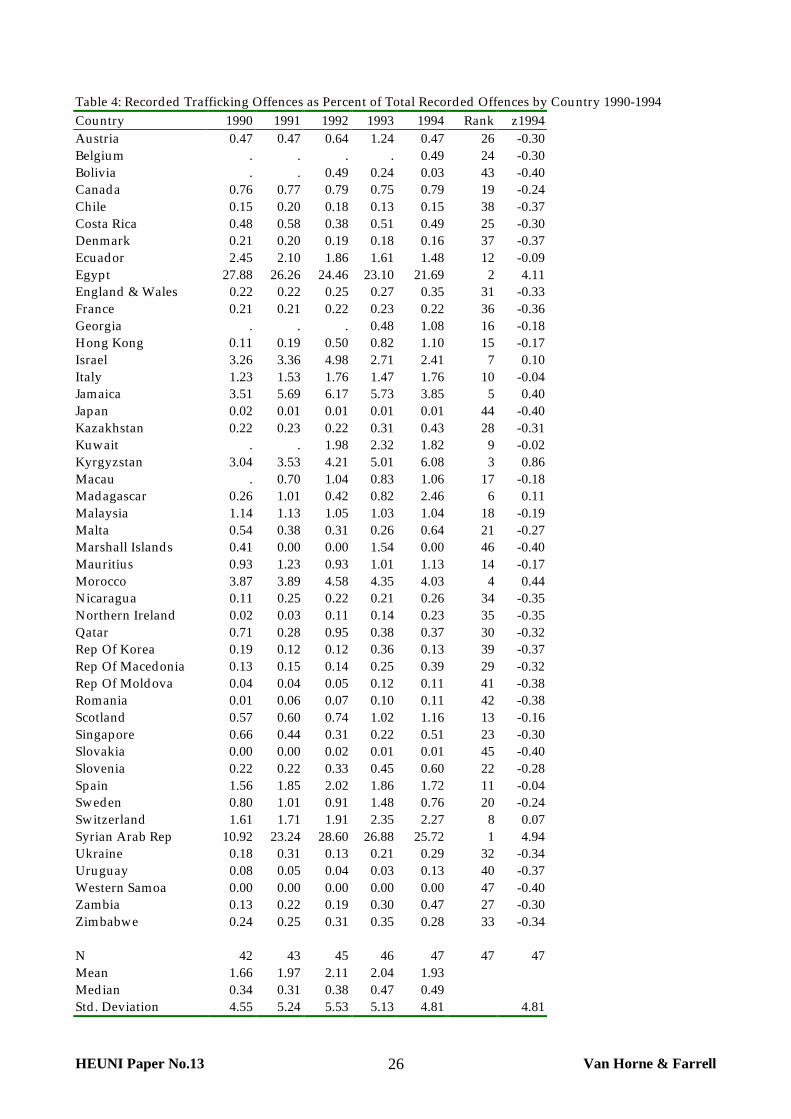
The proportion of all recorded crimes that aretrafficking and possession offences is typi-cally very low. The international mean andmedian never exceed 3% for possession and2% for trafficking in any given year (Table 1).These averages largely reflect the fact thatpossession and trafficking offences consti-tuted less than one percent of all recorded
crime in many countries. Some anomalies areevident. The most extreme is Egypt with z-scores greater than 4 for each of possessionand trafficking. The Egyptian governmentreported that possession offences (Table 3)are between 16 and 26 percent of all recordedcrime, and trafficking offences (Table 4) be-tween 22 and 28 percent of all crime. If re-corded possession and trafficking offences inEgypt are mutually exclusive (they may beeven if the offenders are not) then the sug-gestion is that together they could account forclose to half of all recorded offences. In Ma-laysia, possession offences represented be-tween 12 and 15% of recorded offences in allyears, although trafficking offences werenever more than 1% annually. In Israel, Ja-maica and Switzerland, drug possession of-ten accounted for between 5% and 10% of allrecorded crimes. In each of these three coun-ties, trafficking offences always accounted fora smaller proportion of all recorded crime butin Israel and Jamaica these were still abovethe international mean. In Jamaica, Kyrgystanand Morocco, at some point between 1990and 1994, at least 5% of all recorded offenceswere drug trafficking. The proportion of traf-ficking offences in Kyrgystan increasedsteadily over time, to double from 3% to 6%of all offences. The Syrian Arab Republic wasthe only country that topped Egypt in rela-tion to trafficking offences, peaking in 1992when drug trafficking represented 29% of allrecorded crime.
What about international trends over time?For possession offences, 26 countries reportedan increase in the proportion of recorded of-fences between 1990 and 1994, compared toonly 7 with a decrease (Table 2b). This differ-ence was highly statistically significant usingthe non-parametric sign test (p=0.002). Itshows an international tendency to increasethe recording of drug possession offencesrelative to other crimes across the five-yearperiod. The same increasing trend was evi-dent for recorded trafficking offences, with 29countries increasing compared to 12 coun-tries decreasing the proportion of traffickingoffences recorded (p=0.012).

HEUNI Paper No.13 Van Horne & Farrell12
An increasing proportion of drug offences,and a significant international trend, do notnecessarily mean that countries in general arepaying more attention to drug offences. Itcould mean that they are recording less ofother types of offence. This is an empiricalquestion that might be addressed throughfurther manipulation of the UNCJS data, butthe present writers suspect it would prove anunfounded hypothesis. In relation to what isknown about the increasing size of the illicitdrug industry during this period, it is likelythat the trend reflects a combination of actualincreases in drug offences together withgreater attention being paid to such offencesby law enforcement agencies. The specificswill vary between countries.
SuspectsIn general, the number of suspects for 'alldrug offences' is slightly larger than the ad-dition of trafficking and possession offences.This is consistent with the expectation thatcountries include other offences within anoverall 'all drug offence' category. To specu-late in the absence of specific information,this probably reflects the inclusion of offencessuch as the laundering of drug money, anddrug-related corruption.
The international mean for suspects of 'alldrug offences' varied between 5 and 8 per-cent of all suspects across the five years, thatfor possession offences between 3 and 5 per-cent, and that for trafficking between 1 and 2percent (Table 1). In relation to the number ofsuspects, between 1990 and 1994, there was astatistically significant international trend forcountries to increase the proportion of drug-related suspects for both 'all drug offence'suspects (p=0.002) and possession offences(p=0.017) (Table 2b). The result for traffickingoffences was close to statistical significanceand is indicative of a general increasingtrend, with 17 countries increasing comparedto less than half that, 8, decreasing the per-centage of trafficking suspects (p=0.108).
At the individual country level, Western Sa-moa was a statistical deviant in relation to alldrug suspects and possession suspects. All
drug suspects were never less than a third,and sometimes two-thirds of all suspects peryear, and possession suspects in 1994 repre-sented around a quarter of all suspects. Den-mark had unusually high percentages of pos-session suspects with them constituting be-tween 20 and 25 percent of all suspects ineach year. Further investigation of this anom-aly might prove informative since Denmarkhas a reputation for fairly lenient drug poli-cies but reported high proportions of drugsuspects relative to its western Europeancounterparts.
In 1994, Kyrgyzstan reported that traffickingsuspects comprised nearly 10 percent of allsuspects, a rate statistically deviant in the in-ternational context and representing a dou-bling of their percentage from 1990. Thiscould reflect various changes in a country intransition, including possible changes in legaldefinitions, real changes in the volume ofdrug trafficking, increased attention given totrafficking by law enforcement, or a combi-nation of these factors.
ProsecutionsSao Tome and Principe and the United Statesof America were the two principal statisticaldeviants in relation to prosecutions for alldrug offences. Sao Tome and Principe re-ported around 80 percent of all prosecutionsbeing related to all drug offences, and theUSA around 40 percent (Table 8). These com-pare to an international mean of 7 percent,although this was skewed by the extremehigh cases since the median never rose above3 percent of all prosecutions. For possessionoffences, the international mean percentageof prosecutions was around 4 to 5 percent,whereas that for drug trafficking varied be-tween 1 and 3 percent. The principal deviantfor possession offences was Hong Kong. Thehigh percentage of prosecutions for traffick-ing in Andorra in 1994 could be an error inthe source data (the rate is ten times that ofAndorra in every other year), an instance of arelatively small absolute change producing adistorted picture as a percentage, a change inlegal definition, or a change in practice.
HEUNI Paper No.13 Van Horne & Farrell13
With respect to international trends in prose-cutions, there was a statistically significantincrease in the likelihood that a country re-ported an increased percentage of prosecu-tions for all drug offences in 1994 comparedto 1990 (p=0.015). Over the five years, 27countries increased and 11 countries de-creased drug offence prosecutions relative toother offences. Although the trend analysisfor drug possession and trafficking offencesdid not achieve statistical significance, thisprobably only reflects the small number ofcountries for which information was avail-able, since in each case more than twice asmany countries reported increases in drugprosecutions than reported decreases (Table2a).
ConvictionsFor convictions as with prosecutions, theUnited States of America was statistically de-viant. The US government reported the high-est percentage of convictions for 'all drug of-fences' at around a third of all convictions. Ofall drug offence convictions in the US, morethan a third were for possession. Denmarkwas the second ranking country for convic-tions, with around a quarter related to drugoffences, although data was only providedfor a single year and does not coincide withthe prosecution data like that of the UnitedStates. It might be expected that countrieswith a high percentage of prosecutions fordrug offences would have similarly high per-centages of drug offence convictions unlessthere is an unusual rate of attrition or reten-tion of drug offences between the two stages.
The international mean percentage of convic-tions accounted for by all drug offences wasbetween 4 and 5 percent, and between 1 and3 percent for possession offences. Thirtycountries (75%) recorded an increased per-centage of drug convictions in 1994 comparedto 1990 (p=0.003), and of the fourteen coun-tries for which information was available inrelation to possession convictions, 11 (79%)reported an increase (p=0.057).
Prison AdmissionsThe international mean percentage of prisonadmissions accounted for by all drug offencesincreased from around 8 to 11 percent from1990 to 1994, and possession offences from 4to 5 percent. This meant that possession of-fences constituted between 40 and 45 percentof all prison admissions, in terms of an un-weighted international mean rate. Between1990 and 1994, 21 countries reported an in-crease in prison admissions for 'all drug of-fences', compared to 10 reporting a decrease(p=0.072), although only slightly more coun-tries reported increasing than decreasing per-centages of cases for drug possession.
Three western European countries were themost statistically deviant in relation to ad-missions to prison. In Belgium, Germany andItaly, drug offenders represented a third ormore of all admissions. In the United Statesand Zambia they represented over a quarterof all admissions. With respect to prison ad-missions for drug possession the picture wassomewhat different, with Hong Kong andKuwait reporting 22 and 16 percent respec-tively. Both of these countries doubled thepercentage of possession offenders in theircriminal justice systems between 1990 and1994.
These findings are almost certainly worthy offurther investigation. Common perception ofEuropean criminal justice systems comparedto those of the United States are that the USimprisons, relatively speaking, far more drugoffenders. That Belgium, Germany and Italyhave the highest rates in this respect may beof particular interest to policy makers anddrug researchers around the world. It isworth re-iterating that the government ofeach country reports its own data, so the re-porting of Belgium, Germany and Italy is in-dependent. It is also worth reiterating thatthe finding could represent differences due todefinitional or other discrepancies. However,any definitional or other methodological dif-ference must be peculiar to imprisonmentsince the same finding was not evident at

HEUNI Paper No.13 Van Horne & Farrell14
other stages. Although people are often quickto identify the US the world's penal sadistwhen it comes to drug offenders, the presentdata set suggests that for the early 1990's atleast, there is no conclusive evidence that thisis the case.
Average Prison Sentence for Drug OffencesThe data on average length of prison sen-tences for drug offences is pauce, but somepatterns and anomalies are apparent. Tables15 through 17 show the available informationfor each of all drug offences, possession andtrafficking respectively, in terms of the num-ber of months for the average sentence. Thequestions were asked for 1990, 1992 and 1994only. For each of the three categories of drugoffences, the international mean rates are soskewed by the data reported by Egypt as tobe almost useless, and the median is a prefer-able indicator. The Egyptian government re-ported sentence lengths that were 28, 121 and13 times longer than the next more severecountry for all drug offences, possession andtrafficking respectively. The second rankedcountry was Kuwait for the first two catego-ries, a country which had sentence lengthsseveral times greater than the internationalmedian. Egyptian average sentence lengthsalso increased greatly between 1990 and 1994.There is no immediately apparent explana-tion for the fact that average sentence lengthfor drug possession were reported by Egyptas longer than those for trafficking. One pos-sibility is that it is linked to drug traffickingincurring the death penalty in that country.As suggested in the following discussion,anomalies such as Egypt could prove worthyof further investigation by an interested in-ternational body. For example, in relation tosentencing, the international drug controlconventions appear to encourage punitiveapproaches to control drugs and impose'lower limits' (i.e. prohibition is compulsory).Yet the conventions do not appear to defineor recommend upper-limits to severity be-yond which a country transgresses theboundaries of appropriate punishment (al-though a broader examination of the relation-
ship to international sentencing law is be-yond the scope of this paper).
Perhaps surprisingly, and in itself an inter-esting finding, the Egyptian exceptionseemed to prove the rule that, relativelyspeaking, most countries were characterisedby the relative similarity of their averagesentencing practice for drug offences. In rela-tion to all drug offences, the internationalmedian varied from two to three years for alldrug offences, was steady at one year forpossession, and from around three to fiveyears for trafficking offences.
Discussion and suggestions forfurther research
This section discusses the general interna-tional trends over time, and makes severalsuggestions for further research.
General International Trends over TimeTable 1 shows that many stages of the crimi-nal justice system had a higher proportion ofdrug offenders in 1994 compared to 1990. Ex-amining the trends over time for all stagestogether (Table 2a), is quite illuminating.Even where the differences were not statisti-cally significant (Table 2b), at all stages of thecriminal justice system there were morecountries with an increase in the proportionof drug offenders - whether trafficking, pos-session or all drug crimes - than there werecountries with a decrease. Hence it can rea-sonably be concluded that the available evi-dence suggests a general international trendtowards greater proportions of drug-relatedoffenders in criminal justice systems, for theperiod concerned. Such findings make goodintuitive sense, concurring with evidence re-lating to what is known about changes in theinternational illicit drug trade, and the lawenforcement and criminal justice response tothose changes.
HEUNI Paper No.13 Van Horne & Farrell15
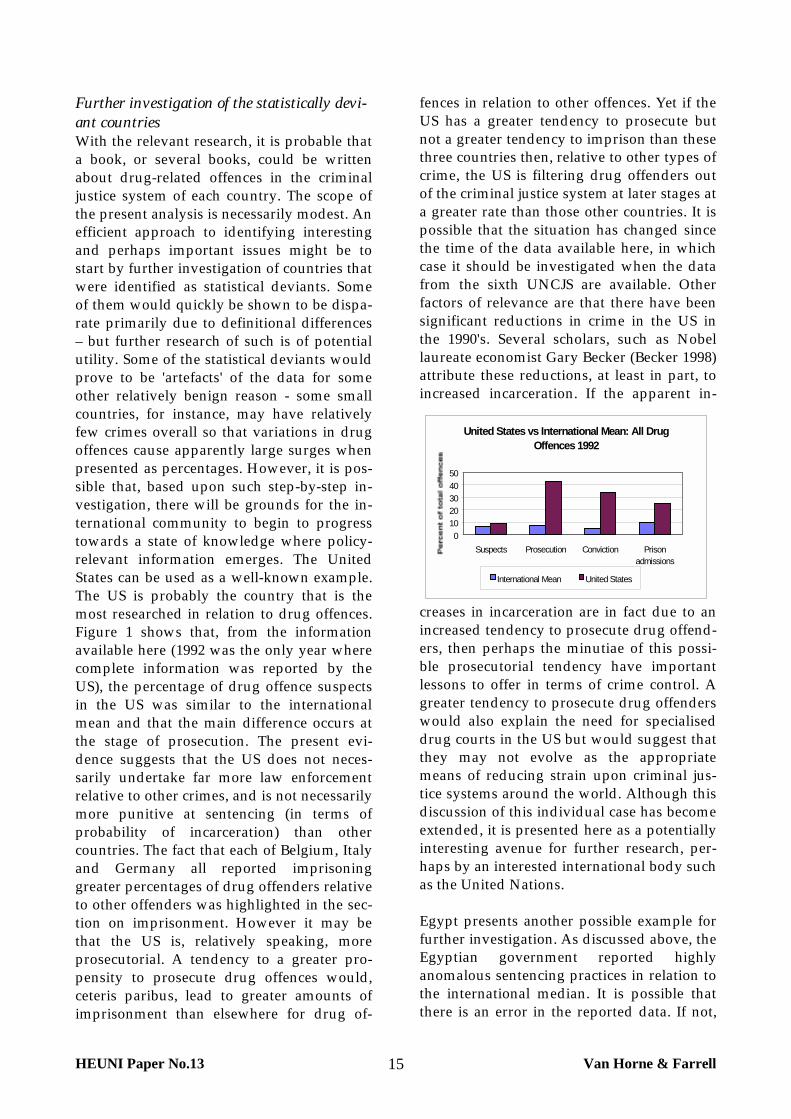
Further investigation of the statistically devi-ant countriesWith the relevant research, it is probable thata book, or several books, could be writtenabout drug-related offences in the criminaljustice system of each country. The scope ofthe present analysis is necessarily modest. Anefficient approach to identifying interestingand perhaps important issues might be tostart by further investigation of countries thatwere identified as statistical deviants. Someof them would quickly be shown to be dispa-rate primarily due to definitional differences– but further research of such is of potentialutility. Some of the statistical deviants wouldprove to be 'artefacts' of the data for someother relatively benign reason - some smallcountries, for instance, may have relativelyfew crimes overall so that variations in drugoffences cause apparently large surges whenpresented as percentages. However, it is pos-sible that, based upon such step-by-step in-vestigation, there will be grounds for the in-ternational community to begin to progresstowards a state of knowledge where policy-relevant information emerges. The UnitedStates can be used as a well-known example.The US is probably the country that is themost researched in relation to drug offences.Figure 1 shows that, from the informationavailable here (1992 was the only year wherecomplete information was reported by theUS), the percentage of drug offence suspectsin the US was similar to the internationalmean and that the main difference occurs atthe stage of prosecution. The present evi-dence suggests that the US does not neces-sarily undertake far more law enforcementrelative to other crimes, and is not necessarilymore punitive at sentencing (in terms ofprobability of incarceration) than othercountries. The fact that each of Belgium, Italyand Germany all reported imprisoninggreater percentages of drug offenders relativeto other offenders was highlighted in the sec-tion on imprisonment. However it may bethat the US is, relatively speaking, moreprosecutorial. A tendency to a greater pro-pensity to prosecute drug offences would,ceteris paribus, lead to greater amounts ofimprisonment than elsewhere for drug of-
fences in relation to other offences. Yet if theUS has a greater tendency to prosecute butnot a greater tendency to imprison than thesethree countries then, relative to other types ofcrime, the US is filtering drug offenders outof the criminal justice system at later stages ata greater rate than those other countries. It ispossible that the situation has changed sincethe time of the data available here, in whichcase it should be investigated when the datafrom the sixth UNCJS are available. Otherfactors of relevance are that there have beensignificant reductions in crime in the US inthe 1990's. Several scholars, such as Nobellaureate economist Gary Becker (Becker 1998)attribute these reductions, at least in part, toincreased incarceration. If the apparent in-
creases in incarceration are in fact due to anincreased tendency to prosecute drug offend-ers, then perhaps the minutiae of this possi-ble prosecutorial tendency have importantlessons to offer in terms of crime control. Agreater tendency to prosecute drug offenderswould also explain the need for specialiseddrug courts in the US but would suggest thatthey may not evolve as the appropriatemeans of reducing strain upon criminal jus-tice systems around the world. Although thisdiscussion of this individual case has becomeextended, it is presented here as a potentiallyinteresting avenue for further research, per-haps by an interested international body suchas the United Nations.
Egypt presents another possible example forfurther investigation. As discussed above, theEgyptian government reported highlyanomalous sentencing practices in relation tothe international median. It is possible thatthere is an error in the reported data. If not,
United States vs International Mean: All Drug Offences 1992
01020304050
Suspects Prosecution Conviction Prisonadmissions
International Mean United States
HEUNI Paper No.13 Van Horne & Farrell16
and if the data is accurate and can be inter-preted in this manner, it could raise the issueof whether there could or should be any sen-tencing length limits that the internationalcommunity deem to be excessively harsh fordrug offences.
Further International Analysis of UNCJSThe incorporation of previous sweeps ofUNCJS would provide a longer-term per-spective upon some of the processes at workin the global criminal justice system. The1980's were a period of particular change inthe global illicit drug industry in relation toproduction and trafficking. It would un-doubtedly prove fascinating to track how thechanges influenced criminal justice systemsaround the world at varying speeds and tovarious extents at different times. Over time,is there a clear geographical 'spread' of theinfluence of drug offences upon criminal jus-tice systems?, and how does this compare toother drug-related indicators? By comparingindicators at different stages in differentyears, as well as sentencing practices, it maybe possible to tease out changes due to thevolume of drug offence cases incoming tocriminal justice systems, and changes due topractices within the criminal justice systems.Similarly, when more recent sweeps ofUNCJS become available, linking them to thepresent analysis is an interesting prospect:Has the rate of change of drug offences in-creased or decreased?, and where and when?
Comparison to Other Data and Source of In-formationIt might be possible to compare the UNCJSdata to the drug seizure data collated by theUnited Nations International Drug ControlProgramme (UNDCP). It might be hypothe-sized that there would be a positive relation-ship between the two, particularly in relationto recorded offences. A second avenue of ex-ploration of different sources of informationmight be to undertake case studies for par-ticular countries where additional criminaljustice system information was available. In-formation relating specifically to drug of-fences was not generally available in the ex-
cellent reference source compiled by Kangas-punta et al. (1998b). Such research might intime proceed towards the development ofguidelines for countries to develop more so-phisticated data collection to allow thetracking of drug-related offences throughtheir criminal justice systems, breaking in-formation down into specific drug types, forexample. This would allow more intricateanalysis that in turn might inform policy.How do cannabis, heroin, cocaine and theamphetamine possession and traffickingcases (and other drug types) fare in relationto each other and over time, by country, andinternationally?
A third and perhaps natural extension of thepresent work might be to try to introducefactors relating to the laws and criminal jus-tice systems of different countries, particu-larly in relation to the processing of drug of-fences. Do countries with laws or processeswith particular statistical signatures processdrug offenders in a different manner? Howdo these compare to other crime types?
Attrition and Retention RatesWith the aim of being realistic and concen-trating upon comparative percentages ofthree types of drug offence category at differ-ent stages of the criminal justice system, in-ternationally and in particular countries, overtime, some types of analysis have necessarilybeen excluded from the present work. Farrell(1999) presented a preliminary analysis of aninternational mean attrition rate betweenstages of the criminal justice system. Fur-thering that type of analysis for differentyears, and as a comparison between coun-tries, could prove fruitful. At what stage ofthe processing of drug offenders does thegreatest attrition or retention takes place?How does this compare to other crime types?,how does it vary between countries?, overtime?, and between countries with differentdrug laws and tendencies to pursue drugcases of different types?
In relation to attrition or retention rates, thedefinition of 'statistically deviant' countries
HEUNI Paper No.13 Van Horne & Farrell17
could be somewhat different. If drug offencesprogressed at a similar rate to the averageoffence in a country's justice system, then thepercentage of drug offence cases would bethe same at each stage. Countries with an in-creasing percentage of drug offences at laterstages are those that retain drug offencesrelative to other offences, and countries withdecreasing percentages of drug offenders arethose that filter such offences out. To accountfor variations in the levels of other offences ofvarying severity, such an exercise might bemore appropriately conducted in relation to aparticular other offence or a basket of of-fences which have relatively well establishedinternational patterns.
Examining Extent of Change over TimeThe present analysis concentrated on devel-oping a metric that was common betweencountries to allow comparison. It concen-trated upon the direction rather than themagnitude of change. Among countries re-porting increased proportions of drug of-fenders at different stages, how large werethe increases? Which countries experiencedthe largest increases and why? Do these pat-terns of increase reflect patterns found inother data sets such as drug seizures? Howdo these vary between all drug offences, pos-session and trafficking?
The Development and Comparison of Differ-ent IndicatorsThe present analysis used drug offences as apercentage of all offences as the key indica-tor. The analysis could also be developed interms of per capita rates. Other indicators areavailable: Although almost too obvious tostate, absolute numbers are important since apopulous country with a harsh prosecutionpolicy for drug offences (for example), influ-ences the lives of more people than a smallercountry. It is possible to overlook such issueswhen developing common metrics to facili-tate comparison.
Comparison of Trends in Drug Offences toOther OffencesThe present analysis has touched only ondrug offences. How do patterns, trends andvariations in drug offences compare to thoseof other crimes, and at different stages of thecriminal justice system? It might be expectedthat they would vary greatly since the inter-national illicit drug trade, as well as enforce-ment and criminal justice responses, under-went significant change during the period oftime in question. It might prove informativeto place drug offences in this type of com-parative crime-type perspective to determinethe extent of those changes and their impactupon criminal justice systems at differentstages.
Conclusions
The suggestions for further research listedabove are far from exhaustive. Like the ap-parently summit-less mountain, the nextanalytic ridge often becomes apparent onlywhen the present one has been ascended. Atthe outset of this work the writers were pri-marily interested in exploring the utility ofthe UNCJS data relating to drug offences. Theaim quickly progressed to the examination ofsubstantive research questions, and the taskbecame to restrain the research to realisticparameters as new avenues and possibilitiesrapidly emerged. The writers would claim asuccess if the analysis demonstrates some ofthe potential of the data in a largely unex-plored area of comparative drug research.The primary areas are the extent and impactof drug offences in the criminal justice sys-tems of different countries and internation-ally, and changes and variations in such overtime, space, and the definition of offence. It isconcluded that the drug-related aspects of theUNCJS data set have been under-utilized.Some formal effort should be made to ensurethis does not continue. A more ambitioushope for the present work would be that ithelps stimulate the development of a broaderresearch agenda in this arena that may in-
HEUNI Paper No.13 Van Horne & Farrell18
form international drug policy and criminaljustice policy.
The present analysis suggested that, withsome individual variation, criminal justicesystems around the world were often char-acterised by their similarities rather than theirdifferences in relation to the proportion ofdrug offenders. Overall, in 1994, the interna-tional mean for 'all drug offences' as a per-centage of all offences was 7% of suspects, 7%of prosecutions, 6% of convictions, and 11%of prison admissions. In relation to the inter-national mean in 1994, possession offencesaccounted for 73% of all drug related sus-pects, 53% of prosecutions, 47% of convic-tions, and 50% of prison admissions.2
Countries with proportions of drug offendersthat differed significantly from the interna-tional mean were typically the exceptionsthat proved the rule. However, as such, theymay prove worthy of further investigation.Strong international trends over time wereidentified: Statistically significant numbers ofcountries reported increasing drug offendersas a proportion of all offences between 1990and 1994. This was almost but not entirelyirrespective of the stage of the criminal justicesystem or the category of the drug offence. Inlight of the expansion of the illicit drug in-dustry during the later 1980's and early 1990'sthis might not sound surprising to some, butit is important if only to confirm what manyonly suspected. The research may benefitgreatly from pursuit of some of the avenuesof investigation outlined above, such as theaddition of further UNCJS surveys to allowthe examination of possible changes in thesetrends. As such, the present work might bestbe viewed as a preliminary investigation in alargely undeveloped area of cross-nationalcomparative drug policy and criminal justiceresearch.
2 Calculated as: (International mean percentage for alldrug offences / International mean for possession of-fences) x 100
HEUNI Paper No.13 Van Horne & Farrell19
References
Becker, G. S. 1998. ‘How the US Handcuffed the Crime Rate’ Business Weekly, 28th December.
Bruun, K., L. Pan and I. Rexed. 1975. The Gentlemen's Club: International Control of Drugs and Alcohol. Chicago:The University of Chicago Press.
Burnham, R.W. 1999. 'A short history of the collection of UN crime and justice statistics at the internationallevel' in G. Newman (Ed.) Global Report on Crime and Justice, published for the United Nations Center for In-ternational Crime Prevention. New York, Oxford: Oxford University Press.
Farrell, Graham. 1999. 'Drugs and drug control' in G. Newman (ed) Global Report on Crime and Justice, pub-lished for the United Nations Center for International Crime Prevention. Oxford and New York: OxfordUniversity Press.
Harvey, Linda; R.W. Burnham; Kathy Kendall; Ken Pease. 1992. Gender differences in criminal justice. Brit-ish Journal of Criminology, 32 (2), 208-217.
Kangaspunta, Kristiina; Matti Joutsen; Natalia Ollus (eds.) 1998a. Crime and criminal justice systems in Europeand North America 1990-1994. Monsey, NY: European Institute for Crime Prevention and Control; CriminalJustice Press.
Kangaspunta, Kristiina, Matti Joutsen, Natalia Ollus and Sami Nevala (eds.) 1998b. Profiles of Criminal JusticeSystems in Europe and North America 1990-1994. Monsey, NY: European Institute for Crime Prevention andControl; Criminal Justice Press.
Keh, Douglas and Graham Farrell. 1997. 'Trafficking drugs in the global village' Transnational OrganizedCrime, 3, 2.
Lynch , James. 1995. 'Crime in international perspective' in J.Q. Wilson and J. Petersilia (Eds.), Crime, SanFransisco, ICS Press.
Messner, Steven E. and Richard Rosenfeld. 1997. 'Political restraint of the market and levels of criminalhomicide: a cross-national application of institutional-anomie theory' Social Forces, 74, 4, 1393-1416.
Nalla, Mahesh K. and Graeme R. Newman. 1994. Crime in the U.S and the Former U.S.S.R.: a comparison ofcrime trends from the third United Nations Survey. International Journal of Comparative and Applied CriminalJustice 18 (1), pp. 85-94.
Neapolitan, Jerome L. 1996. 'Cross-national crime data: some unaddressed problems' Journal of Crime andJustice, XIX, 1, 95-112.
Newman, Graeme (ed.). 1999. Global Report on Crime and Justice. Published for the United Nations Center forInternational Crime Prevention. Oxford and New York: Oxford University Press.
Newman, Graeme, and Greg Howard. 1999. 'Introduction: data sources and their use' in in G. Newman (ed)Global Report on Crime and Justice, published for the United Nations Center for International Crime Preven-tion. Oxford and New York:.Oxford University Press.
Pease, Ken and Kristiina Hukkila. 1990. Criminal justice systems in Europe and North America. HelsinkiInstitute for Crime Prevention & Control publication no. 17. Helsinki, Finland.
Pease,Ken and Andromachi Tseloni. 1994. 'Juvenile-adult differences in criminal justice: evidence from theUnited Nations Crime Survey' Howard Journal of Criminal Justice, 35, (1): pp. 40-60.

HEUNI Paper No.13 Van Horne & Farrell20
Pease, Ken. 1994. 'Cross-national imprisonment rates: limitations of method and possible conclusions' BritishJournal of Criminology, 34, 116-130.
Pietschmann, Thomas. 1997. 'Economic forces driving manufacture, trafficking and consumption of am-phetamine-type stimulants' in H. Klee (Ed.) Amphetamine Misuses: International Perspectives on Current Trends.Switzerland: Harwood Press.
Stares, Paul B. 1995. 'The Global Drug Phenomenon: Implications for Policy' in Georges Estievenart (Ed.)Policies and Strategies to Combat Drugs in Europe. Netherlands: Martinus Nijhoff. pp. 7-14.
Tullis, LaMond. 1996. Unintended Consequences: Illegal Drugs and Drug Policy in nine Countries. UNRISDStudies of the Illegal Drug Trade. UNRISD.
United Nations Asia and Far East Institute for the Prevention of Crime and Treatment of Offenders; Austra-lian Institute of Criminology. 1995. Crime Trends in Asia and the Pacific. Tokyo, Japan.
United Nations. 1991. United Nations Convention Against Illicit Traffic in Narcotic Drugs and Psychotropic Sub-stances, 1998. New York: United Nations.
United Nations International Drug Control Programme. 1997. World Drug Report. Oxford, UK: OxfordUniversity Press.
White House. 1999. The National Drug Control Strategy 1999. Washington DC.
HEUNI Paper No.13 Van Horne & Farrell21
Annex
Table 1: Types of Between-Country Variation in UNCJS Drug DataSource of variation Drug offence example
1. Legal definition Country A and country B use different categories of drug weight todefine possession and trafficking.
2. Legal terminology Country A uses the term ‘plea-bargain’ but Country B does not.3. Procedural difference Country A defines prosecution of drug offences as only those cases
that reach court. Country B defines prosecution as includingwarnings issued by the prosecutor.
4. Statistical classification In both country A and country B, possession of drug paraphernaliais an offence. In the UNCJS report, country A includes these as pos-session offences but country B does not.
5. Counting rule Country A counts drug offences. Country B counts drug offenders.6. Comprehensiveness ofstatistics
Country A includes minor possession offences in its statistics butcountry B does not.
7. Absence of or Errors incounting
Country does not keep statistics, or does not keep or centrally col-late accurate statistics.
8. Errors in reporting Country reports its data incorrectly to UNCJS for various reasons(data does not exist; is not coordinated; is out of date; survey wentto wrong respondent; clerical error).
9. Non-response Country does not return the UNCJS questionnaire, or returns it in-complete.
10. Volume of drug of-fences
Differences in CJS reflect true differences in volume of drug of-fences
11. Criminal justice prac-tice and procedure
Differences between stages reflect different practices at differentstages, e.g. in likelihood of prosecuting a drug offence.
11. Difference in input toCJS
Country A has a greater proportional input of drug offences to itsCJS than country B.
12. Legal practices Country A prosecutes all drug offences but Country B does not.13. Exogenous differences Variation in CJS resources.14. Other offences Even if drug offences static, percentage of drug offences will in-
crease if volume of other offences decreases.Note: Much of this table is based on Joutsen (1998; 3-6).
HEUNI Paper No.13 Van Horne & Farrell22
Table 2a: International Medians and Means1990 1991 1992 1993 1994
OffencesMean 2.28 2.39 2.31 2.46 2.71Table 3: Drug Possession Offences as Percent of
Total Recorded Offences by Country Median 1.06 0.93 1.05 1.16 1.69Mean 1.66 1.97 2.11 2.04 1.93Table 4: Recorded Trafficking Offences as Percent
of Total Recorded Offences by Country Median 0.34 0.31 0.38 0.47 0.49Suspects
Mean 5.45 7.46 6.83 7.64 6.90Table 5: 'All Drug Offence' Suspects as Percent ofTotal Suspects by Country Median 1.92 3.68 3.79 4.85 5.55
Mean 3.66 4.66 3.75 4.32 5.02Table 6: Drug Possession Suspects as Percent ofTotal Suspects by Country Median 1.45 2.53 2.55 3.22 3.99
Mean 1.58 1.97 1.91 1.77 2.01Table 7: Drug Trafficking Suspects as Percent ofTotal Suspects by Country Median 0.57 0.60 0.91 1.18 1.13
ProsecutionsMean 7.32 6.09 7.36 7.86 7.31Table 8: 'All Drug Offence' Prosecutions as Percent
of Total Prosecutions by County Median 1.32 1.48 1.75 2.60 2.62Mean 4.17 4.32 3.77 4.98 3.90Table 9: Drug Possession Prosecutions as Percent of
Total Prosecutions by Country Median 1.19 1.52 1.23 1.58 3.10Mean 1.43 1.47 1.46 1.49 3.07Table 10: Drug Trafficking Prosecutions as Percent
of Total Criminal Prosecutions by County Median 0.38 0.56 0.96 1.01 1.33Convictions
Mean 4.78 4.02 4.74 4.70 5.96Table 11: 'All Drug Offence' Convictions as Percentof Total Convictions 1990,1992 and 1994, Rankedfor 1994
Median 2.79 1.64 2.36 2.67 4.71
Mean 1.15 1.26 1.57 2.19 2.82Table 12: Drug Possession Convictions as Percentof Total Convictions by Country Median 1.15 1.26 1.57 2.19 2.82
Prison AdmissionsMean 8.85 10.32 10.07 11.10 10.98Table 13: 'All Drug Offence' Prison Admissions as
Percent of Total Prison Admissions by Country Median 5.87 7.11 6.12 7.03 10.37Mean 4.83 5.01 4.86 5.55 5.51Table 14: Drug Possession Prison Admissions as
Percent of Total Prison Admissions by Country Median 3.18 4.06 3.55 4.75 3.60Sentencing
Mean 318 540 586Table 16: 'All Drug Offence' Average Prison Sen-tenced Served (months) by Country Median 21 30 34
Mean 12 12 12Table 17: Average Sentence Length (in months) forDrug Possession by Country 1990, 1992 and 1994 Median 198 418 499
Mean 221 205 215 Table 18: Average Sentence Length (in Months) forDrug Trafficking by Country, 1990, 1992 and 1994 Median 64 40 42
HEUNI Paper No.13 Van Horne & Farrell23
Table 2b: Sign-Test Results-ve +ve Ties N Prob (p=)
Offences: change 1990-1994Possession (Table 3) 7 26 3 36 .002**
(z=-3.133)Trafficking (Table 4) 12 29 1 42 .012*
(z=-2.499)Suspects: change in proportion 1990-1994
All Drug Offences (Table 5) 11 33 0 44 .002**(z=-3.166)
Drug Possession (Table 6) 5 17 1 23 .017*(binomial)
Drug Trafficking (Table 7 8 17 1 26 .108(binomial)
Prosecutions: change in proportion 1990-1994All Drug Offences (Table 8) 11 27 0 38 .015*
(z=-2.433)Possession (Table 9) 5 10 2 17 .302Trafficking (Table 10) 6 13 2 21 .167
(binomial)Convictions: change 1990-1994
All Drug Offences (Table 11) 10 30 0 40 .003**(z=-3.004)
Possession (Table 12) 3 11 0 14 .057(binomial)
Prisons Admissions: change in proportion 1990-1994All Drug Offences (Table 13) 10 21 1 32 .072
(z=-1.796)Possession (Table 14) 8 8 1 17 1.00
(binomial)Between Stages, 1994
Suspects to Prosecutions 1994: All drug 16 5 2 23 .027*Suspects to Prosecutions 1994: Possession 6 1 0 7 .125Suspects to Prosecutions 1994: Trafficking 5 4 1 10 1.00Suspects to Convictions 1994: All drug 15 12 0 27 .70
(z=-.385)Suspects to Convictions 1994: Possession 5 2 0 7 .453Suspects to Admissions 1994: All drug 7 11 0 18 .481Suspects to Admissions 1994: Possession 6 2 0 8 .289Prosecutions to Convictions 1994: All drug 11 19 1 31 .201
(z=-1.278)Prosecutions to Convictions 1994: Possession 3 8 0 11 .227Prosecutions to Admissions 1994: All drug 8 11 0 19 .648Prosecutions to Admissions 1994: Possession 2 6 0 8 .289Convictions to Admissions 1994: All drug 9 10 0 19 1.00Convictions to Admissions 1994: Possession 2 3 0 5 1.00Notes to Table:The '+ve', '-ve' and 'no difference' counts may differ marginally from the actual tables since six decimalplaces were used in the sign test analysis but only 2 decimal places are shown in the tables.* significant at 0.05 level** significant at 0.01 level
HEUNI Paper No.13 Van Horne & Farrell24
Table 2c: Statistical Deviants: Countries with Percent Values +/- 2 or more Standard Deviations from theInternational Mean.Stage Countries (s.d. value)Possession Offences (Table 3) Egypt (4.65); Malaysia (2.61)Trafficking Offences (Table 4): Egypt (4.11); Syria (4.94)All Drug Offence Suspects (Table 5) Western Samoa (3.60)Possession Suspects (Table 6) Denmark (2.62); Western Samoa (3.11)Trafficking Suspects (Table 7) Kyrgyzstan (3.16)All Drug Offence Prosecutions (Table 8) Sao Tome & Principe (5.26); United States of
America (2.17)Drug Possession Prosecutions (Table 9) Hong Kong (3.64)Drug Trafficking Prosecutions (Table 10) Andorra (4.49)All Drug Offence Convictions (Table 11) Denmark (2.19); United States of AmericaDrug Possession Convictions (Table 12) Denmark (2.22); Hong Kong (2.98)All Drug Offence Admissions (Table 13) Belgium (2.80); Germany (2.14); Italy (2.29)
HEUNI Paper No.13 Van Horne & Farrell25
Table 3: Recorded Drug Possession Offences as Percent of Total Recorded Offences by Country 1990-1994Country 1990 1991 1992 1993 1994 Rank z1994Austria 0.69 0.77 1.04 1.49 1.90 18 -0.20Belgium . . . . 1.12 27 -0.40Bolivia . . 0.11 0.03 0.18 34 -0.65Canada 1.30 1.00 1.07 1.12 1.29 23 -0.36Chile 0.31 0.58 0.59 0.41 0.40 31 -0.59Costa Rica 0.40 0.46 0.34 0.36 0.44 30 -0.58Denmark 2.43 3.13 3.14 3.33 2.70 14 0.01Ecuador 1.38 1.49 1.49 1.41 1.72 21 -0.24Egypt 16.03 21.30 26.30 25.61 20.31 1 4.65France 1.06 1.09 1.11 1.02 1.15 26 -0.39Georgia . . . 3.46 5.23 6 0.68Hong Kong 3.98 3.19 1.64 3.43 4.19 8 0.41Israel 9.02 9.76 6.42 5.38 5.39 5 0.72Jamaica 7.33 7.91 6.60 7.25 7.32 4 1.23Japan 0.35 0.37 0.39 0.41 0.38 32 -0.60Kazahkstan 2.35 2.44 2.43 2.78 3.40 11 0.20Kuwait . . 0.09 0.03 0.02 40 -0.69Kyrgyzstan 0.03 0.05 0.06 0.04 0.10 37 -0.67Macau . 0.33 0.68 0.77 3.25 12 0.16Madagascar 0.10 0.17 0.62 0.05 0.53 29 -0.56Malaysia 14.86 13.83 12.51 11.86 12.58 2 2.61Malta 1.23 0.85 0.67 0.78 2.56 15 -0.02Marshall Islands 0.00 0.36 0.14 0.26 0.17 35 -0.65Mauritius 2.31 1.79 2.91 3.20 3.78 9 0.30Morocco . . 1.50 1.41 1.22 25 -0.38Nicaragua 0.77 1.32 1.17 2.07 1.83 19 -0.22Northern Ireland 0.36 0.42 0.80 1.09 1.66 22 -0.26Qatar 0.20 0.09 . 0.13 . 36 -0.66Rep Of Korea 0.00 0.00 0.00 0.00 0.00 41 -0.70Rep Of Macedonia 0.05 0.03 0.05 0.07 0.10 38 -0.67Rep Of Moldova 0.21 0.31 0.24 0.58 0.64 28 -0.53Romania 0.00 0.00 0.00 0.00 0.00 42 -0.70Scotland 1.22 1.42 1.56 2.29 2.49 16 -0.04Singapore 1.54 1.64 2.50 3.01 3.12 13 0.12Slovakia 0.00 0.00 0.02 0.02 0.05 39 -0.68Slovenia 0.38 0.25 0.16 0.19 0.33 33 -0.61Sweden 1.36 1.55 1.53 1.92 2.00 17 -0.17Switzerland 3.65 4.37 6.16 7.74 8.95 3 1.66Ukraine 1.74 2.51 2.93 4.48 4.68 7 0.53Uruguay 0.81 0.85 0.80 1.37 1.81 20 -0.22Western Samoa 5.76 4.00 1.50 1.19 3.54 10 0.23Zambia 0.00 0.00 0.00 0.00 0.00 43 -0.70Zimbabwe 1.27 1.29 1.17 1.27 1.23 24 -0.37
N 37 38 40 42 42 43 43Mean 2.28 2.39 2.31 2.46 2.71Median 1.06 0.93 1.05 1.16 1.69Std. Deviation 3.79 4.27 4.59 4.41 3.82 3.80
HEUNI Paper No.13 Van Horne & Farrell26
Table 4: Recorded Trafficking Offences as Percent of Total Recorded Offences by Country 1990-1994Country 1990 1991 1992 1993 1994 Rank z1994Austria 0.47 0.47 0.64 1.24 0.47 26 -0.30Belgium . . . . 0.49 24 -0.30Bolivia . . 0.49 0.24 0.03 43 -0.40Canada 0.76 0.77 0.79 0.75 0.79 19 -0.24Chile 0.15 0.20 0.18 0.13 0.15 38 -0.37Costa Rica 0.48 0.58 0.38 0.51 0.49 25 -0.30Denmark 0.21 0.20 0.19 0.18 0.16 37 -0.37Ecuador 2.45 2.10 1.86 1.61 1.48 12 -0.09Egypt 27.88 26.26 24.46 23.10 21.69 2 4.11England & Wales 0.22 0.22 0.25 0.27 0.35 31 -0.33France 0.21 0.21 0.22 0.23 0.22 36 -0.36Georgia . . . 0.48 1.08 16 -0.18Hong Kong 0.11 0.19 0.50 0.82 1.10 15 -0.17Israel 3.26 3.36 4.98 2.71 2.41 7 0.10Italy 1.23 1.53 1.76 1.47 1.76 10 -0.04Jamaica 3.51 5.69 6.17 5.73 3.85 5 0.40Japan 0.02 0.01 0.01 0.01 0.01 44 -0.40Kazakhstan 0.22 0.23 0.22 0.31 0.43 28 -0.31Kuwait . . 1.98 2.32 1.82 9 -0.02Kyrgyzstan 3.04 3.53 4.21 5.01 6.08 3 0.86Macau . 0.70 1.04 0.83 1.06 17 -0.18Madagascar 0.26 1.01 0.42 0.82 2.46 6 0.11Malaysia 1.14 1.13 1.05 1.03 1.04 18 -0.19Malta 0.54 0.38 0.31 0.26 0.64 21 -0.27Marshall Islands 0.41 0.00 0.00 1.54 0.00 46 -0.40Mauritius 0.93 1.23 0.93 1.01 1.13 14 -0.17Morocco 3.87 3.89 4.58 4.35 4.03 4 0.44Nicaragua 0.11 0.25 0.22 0.21 0.26 34 -0.35Northern Ireland 0.02 0.03 0.11 0.14 0.23 35 -0.35Qatar 0.71 0.28 0.95 0.38 0.37 30 -0.32Rep Of Korea 0.19 0.12 0.12 0.36 0.13 39 -0.37Rep Of Macedonia 0.13 0.15 0.14 0.25 0.39 29 -0.32Rep Of Moldova 0.04 0.04 0.05 0.12 0.11 41 -0.38Romania 0.01 0.06 0.07 0.10 0.11 42 -0.38Scotland 0.57 0.60 0.74 1.02 1.16 13 -0.16Singapore 0.66 0.44 0.31 0.22 0.51 23 -0.30Slovakia 0.00 0.00 0.02 0.01 0.01 45 -0.40Slovenia 0.22 0.22 0.33 0.45 0.60 22 -0.28Spain 1.56 1.85 2.02 1.86 1.72 11 -0.04Sweden 0.80 1.01 0.91 1.48 0.76 20 -0.24Switzerland 1.61 1.71 1.91 2.35 2.27 8 0.07Syrian Arab Rep 10.92 23.24 28.60 26.88 25.72 1 4.94Ukraine 0.18 0.31 0.13 0.21 0.29 32 -0.34Uruguay 0.08 0.05 0.04 0.03 0.13 40 -0.37Western Samoa 0.00 0.00 0.00 0.00 0.00 47 -0.40Zambia 0.13 0.22 0.19 0.30 0.47 27 -0.30Zimbabwe 0.24 0.25 0.31 0.35 0.28 33 -0.34
N 42 43 45 46 47 47 47Mean 1.66 1.97 2.11 2.04 1.93Median 0.34 0.31 0.38 0.47 0.49Std. Deviation 4.55 5.24 5.53 5.13 4.81 4.81

HEUNI Paper No.13 Van Horne & Farrell27
Table 5: 'All Drug Offence' Suspects as Percent of Total Suspects by Country 1990-1994Country 1990 1991 1992 1993 1994 Rank z1994Austria 2.11 2.48 3.37 4.85 5.53 25 -0.22Azerbaijan 3.40 4.71 5.30 10.91 13.43 9 0.80Bahamas 28.84 30.32 26.85 29.36 20.54 5 1.72Belarus 0.61 0.82 1.01 1.33 1.44 32 -0.75Canada 5.91 5.39 5.67 5.72 6.22 21 -0.13Chile 0.91 1.43 1.34 1.18 1.25 35 -0.77Columbia 16.36 19.68 21.97 27.74 22.27 2 1.94Costa Rica . . . . 7.62 16 0.05Croatia 0.29 0.52 0.60 0.81 1.05 37 -0.80Cyprus 11.51 11.47 11.53 14.44 14.48 8 0.94Denmark . 25.17 24.29 25.64 21.64 4 1.86Ecuador 19.13 18.97 18.20 15.48 18.83 6 1.50Estonia 0.17 0.29 0.22 0.19 0.12 47 -0.92Finland 0.88 1.48 1.11 1.98 2.76 29 -0.57France 5.95 6.36 7.15 6.84 7.15 19 -0.01Georgia 3.36 4.98 3.79 8.23 9.35 13 0.28Greece 1.09 1.07 0.91 0.89 1.36 34 -0.76Hong Kong 10.06 8.44 5.25 11.24 10.49 11 0.42Hungary 0.04 0.04 0.09 0.20 0.22 42 -0.90India 0.30 0.33 0.36 0.33 0.38 41 -0.88Italy 6.94 7.94 8.44 6.25 6.75 20 -0.06Jamaica 19.68 21.04 20.93 20.14 16.71 7 1.23Japan 4.45 6.02 5.96 5.92 5.58 24 -0.21Kazakhstan 4.18 4.50 4.89 5.53 6.17 22 -0.13Kyrgyzstan 5.56 5.78 6.22 6.09 9.97 12 0.36Latvia 0.40 0.35 0.45 0.48 0.89 38 -0.82Lithuania 0.34 0.34 0.90 0.76 1.15 36 -0.78Madagascar 1.24 3.38 2.77 1.75 7.40 18 0.02Marshall Islands 0.41 0.36 0.14 1.80 0.17 46 -0.91Mauritius 4.25 4.00 5.73 6.67 5.91 23 -0.17Nicaragua 1.59 3.27 3.79 5.44 4.98 26 -0.29Panama . 21.72 . . . 3 1.87Qatar 1.63 0.51 1.23 0.75 0.61 40 -0.85Rep Of Korea 0.21 0.15 0.14 0.33 0.17 45 -0.91Rep Of Macedonia 0.33 0.38 0.38 0.54 0.75 39 -0.83Rep Of Moldova 1.03 0.59 0.79 1.15 1.42 33 -0.75Romania 0.01 0.07 0.09 0.13 0.18 44 -0.91Russian Federation 1.29 1.42 1.64 2.36 3.31 28 -0.50Slovakia 0.03 0.04 0.00 0.00 0.19 43 -0.91Slovenia 0.75 0.73 0.86 1.02 1.49 31 -0.74Spain 8.93 9.73 10.99 9.67 8.74 14 0.20Sweden 6.61 6.51 6.55 6.05 7.84 15 0.08Syrian Arab Rep 9.63 9.10 9.72 4.36 4.92 27 -0.30Turkey 1.73 1.41 1.18 1.09 1.75 30 -0.71Ukraine 2.68 3.98 4.83 7.12 7.60 17 0.05United States Of America 9.68 9.40 8.97 9.57 11.38 10 0.54Western Samoa 35.19 76.53 60.91 71.43 35.11 1 3.60
N 44 46 45 45 46 47 47Mean 5.45 7.46 6.83 7.64 6.90Median 1.92 3.68 3.79 4.85 5.55Std. Deviation 7.75 12.79 10.73 12.22 7.52 7.75

HEUNI Paper No.13 Van Horne & Farrell28
Table 6: Drug Possession Suspects as Percent of Total Suspects by Country 1990-1994Country 1990 1991 1992 1993 1994 Rank z1994Austria 1.61 1.88 2.59 3.72 4.43 13 -0.13Canada 3.77 3.10 3.24 3.22 3.69 15 -0.25Chile 0.45 0.84 0.85 0.73 0.70 20 -0.76Costa Rica . . . . 4.76 12 -0.07Denmark . 23.77 23.02 24.46 20.49 2 2.62Ecuador 2.31 2.53 2.51 2.47 3.08 16 -0.36France 4.61 5.06 5.57 5.30 5.58 10 0.07Georgia . . . 7.30 8.33 6 0.54Hong Kong 9.77 7.93 3.96 9.22 8.03 7 0.49Hungary 0.02 0.02 0.04 0.14 0.09 25 -0.87Jamaica 13.30 12.24 10.82 11.25 11.02 3 1.00Japan 1.45 1.94 2.07 2.15 2.02 18 -0.54Kazakhstan 3.50 3.90 4.24 4.44 4.95 11 -0.04Kyrgyzstan 0.02 0.01 0.00 0.00 0.10 24 -0.87Madagascar 0.40 0.42 1.79 0.40 2.08 17 -0.53Marshall Islands 0.00 0.36 0.14 0.26 0.17 22 -0.85Nicaragua 1.38 2.79 3.21 4.81 4.30 14 -0.15Panama . 9.13 . . . 4 0.68Qatar 0.24 0.07 0.00 0.15 0.00 27 -0.88Rep Of Macedonia 0.07 0.06 0.08 0.09 0.11 23 -0.86Rep Of Moldova 0.69 0.49 0.63 0.91 1.14 19 -0.69Romania 0.00 0.00 0.00 0.00 0.00 26 -0.88Slovenia 0.42 0.38 0.24 0.26 0.48 21 -0.80Sweden 5.63 5.66 5.69 5.23 6.94 8 0.30Ukraine 2.04 3.24 3.99 5.89 6.29 9 0.19United States Of America 6.62 6.26 6.12 6.73 8.34 5 0.54Western Samoa 25.93 24.49 9.09 8.79 23.40 1 3.11
N 23 25 24 25 26 27 27Mean 3.66 4.66 3.75 4.32 5.02Median 1.45 2.53 2.55 3.22 3.99Std. Deviation 5.94 6.68 5.05 5.36 5.92 5.85
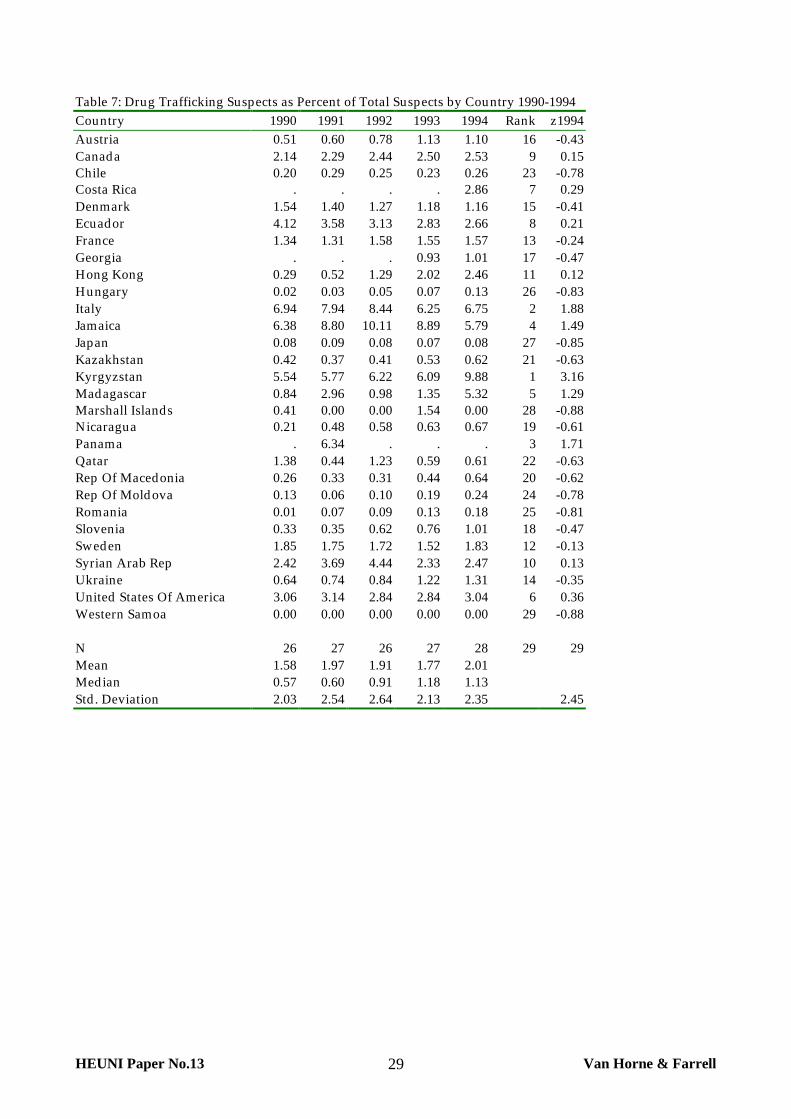
HEUNI Paper No.13 Van Horne & Farrell29
Table 7: Drug Trafficking Suspects as Percent of Total Suspects by Country 1990-1994Country 1990 1991 1992 1993 1994 Rank z1994Austria 0.51 0.60 0.78 1.13 1.10 16 -0.43Canada 2.14 2.29 2.44 2.50 2.53 9 0.15Chile 0.20 0.29 0.25 0.23 0.26 23 -0.78Costa Rica . . . . 2.86 7 0.29Denmark 1.54 1.40 1.27 1.18 1.16 15 -0.41Ecuador 4.12 3.58 3.13 2.83 2.66 8 0.21France 1.34 1.31 1.58 1.55 1.57 13 -0.24Georgia . . . 0.93 1.01 17 -0.47Hong Kong 0.29 0.52 1.29 2.02 2.46 11 0.12Hungary 0.02 0.03 0.05 0.07 0.13 26 -0.83Italy 6.94 7.94 8.44 6.25 6.75 2 1.88Jamaica 6.38 8.80 10.11 8.89 5.79 4 1.49Japan 0.08 0.09 0.08 0.07 0.08 27 -0.85Kazakhstan 0.42 0.37 0.41 0.53 0.62 21 -0.63Kyrgyzstan 5.54 5.77 6.22 6.09 9.88 1 3.16Madagascar 0.84 2.96 0.98 1.35 5.32 5 1.29Marshall Islands 0.41 0.00 0.00 1.54 0.00 28 -0.88Nicaragua 0.21 0.48 0.58 0.63 0.67 19 -0.61Panama . 6.34 . . . 3 1.71Qatar 1.38 0.44 1.23 0.59 0.61 22 -0.63Rep Of Macedonia 0.26 0.33 0.31 0.44 0.64 20 -0.62Rep Of Moldova 0.13 0.06 0.10 0.19 0.24 24 -0.78Romania 0.01 0.07 0.09 0.13 0.18 25 -0.81Slovenia 0.33 0.35 0.62 0.76 1.01 18 -0.47Sweden 1.85 1.75 1.72 1.52 1.83 12 -0.13Syrian Arab Rep 2.42 3.69 4.44 2.33 2.47 10 0.13Ukraine 0.64 0.74 0.84 1.22 1.31 14 -0.35United States Of America 3.06 3.14 2.84 2.84 3.04 6 0.36Western Samoa 0.00 0.00 0.00 0.00 0.00 29 -0.88
N 26 27 26 27 28 29 29Mean 1.58 1.97 1.91 1.77 2.01Median 0.57 0.60 0.91 1.18 1.13Std. Deviation 2.03 2.54 2.64 2.13 2.35 2.45
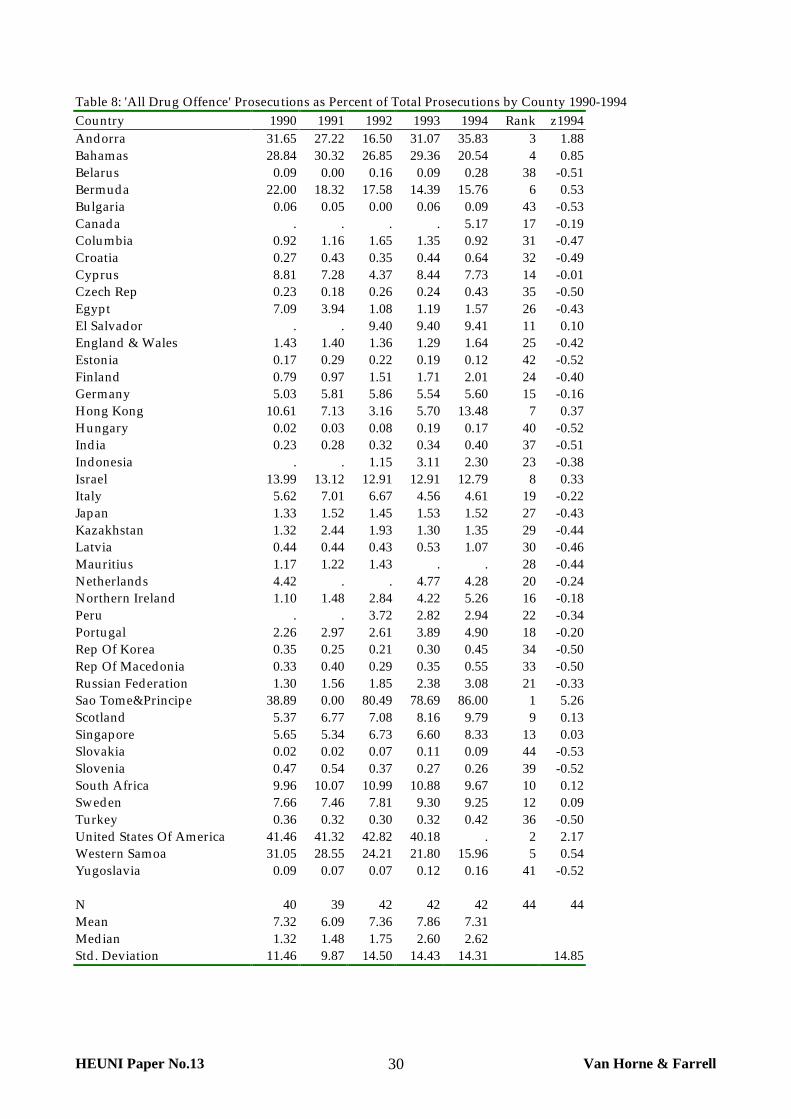
HEUNI Paper No.13 Van Horne & Farrell30
Table 8: 'All Drug Offence' Prosecutions as Percent of Total Prosecutions by County 1990-1994Country 1990 1991 1992 1993 1994 Rank z1994Andorra 31.65 27.22 16.50 31.07 35.83 3 1.88Bahamas 28.84 30.32 26.85 29.36 20.54 4 0.85Belarus 0.09 0.00 0.16 0.09 0.28 38 -0.51Bermuda 22.00 18.32 17.58 14.39 15.76 6 0.53Bulgaria 0.06 0.05 0.00 0.06 0.09 43 -0.53Canada . . . . 5.17 17 -0.19Columbia 0.92 1.16 1.65 1.35 0.92 31 -0.47Croatia 0.27 0.43 0.35 0.44 0.64 32 -0.49Cyprus 8.81 7.28 4.37 8.44 7.73 14 -0.01Czech Rep 0.23 0.18 0.26 0.24 0.43 35 -0.50Egypt 7.09 3.94 1.08 1.19 1.57 26 -0.43El Salvador . . 9.40 9.40 9.41 11 0.10England & Wales 1.43 1.40 1.36 1.29 1.64 25 -0.42Estonia 0.17 0.29 0.22 0.19 0.12 42 -0.52Finland 0.79 0.97 1.51 1.71 2.01 24 -0.40Germany 5.03 5.81 5.86 5.54 5.60 15 -0.16Hong Kong 10.61 7.13 3.16 5.70 13.48 7 0.37Hungary 0.02 0.03 0.08 0.19 0.17 40 -0.52India 0.23 0.28 0.32 0.34 0.40 37 -0.51Indonesia . . 1.15 3.11 2.30 23 -0.38Israel 13.99 13.12 12.91 12.91 12.79 8 0.33Italy 5.62 7.01 6.67 4.56 4.61 19 -0.22Japan 1.33 1.52 1.45 1.53 1.52 27 -0.43Kazakhstan 1.32 2.44 1.93 1.30 1.35 29 -0.44Latvia 0.44 0.44 0.43 0.53 1.07 30 -0.46Mauritius 1.17 1.22 1.43 . . 28 -0.44Netherlands 4.42 . . 4.77 4.28 20 -0.24Northern Ireland 1.10 1.48 2.84 4.22 5.26 16 -0.18Peru . . 3.72 2.82 2.94 22 -0.34Portugal 2.26 2.97 2.61 3.89 4.90 18 -0.20Rep Of Korea 0.35 0.25 0.21 0.30 0.45 34 -0.50Rep Of Macedonia 0.33 0.40 0.29 0.35 0.55 33 -0.50Russian Federation 1.30 1.56 1.85 2.38 3.08 21 -0.33Sao Tome&Principe 38.89 0.00 80.49 78.69 86.00 1 5.26Scotland 5.37 6.77 7.08 8.16 9.79 9 0.13Singapore 5.65 5.34 6.73 6.60 8.33 13 0.03Slovakia 0.02 0.02 0.07 0.11 0.09 44 -0.53Slovenia 0.47 0.54 0.37 0.27 0.26 39 -0.52South Africa 9.96 10.07 10.99 10.88 9.67 10 0.12Sweden 7.66 7.46 7.81 9.30 9.25 12 0.09Turkey 0.36 0.32 0.30 0.32 0.42 36 -0.50United States Of America 41.46 41.32 42.82 40.18 . 2 2.17Western Samoa 31.05 28.55 24.21 21.80 15.96 5 0.54Yugoslavia 0.09 0.07 0.07 0.12 0.16 41 -0.52
N 40 39 42 42 42 44 44Mean 7.32 6.09 7.36 7.86 7.31Median 1.32 1.48 1.75 2.60 2.62Std. Deviation 11.46 9.87 14.50 14.43 14.31 14.85
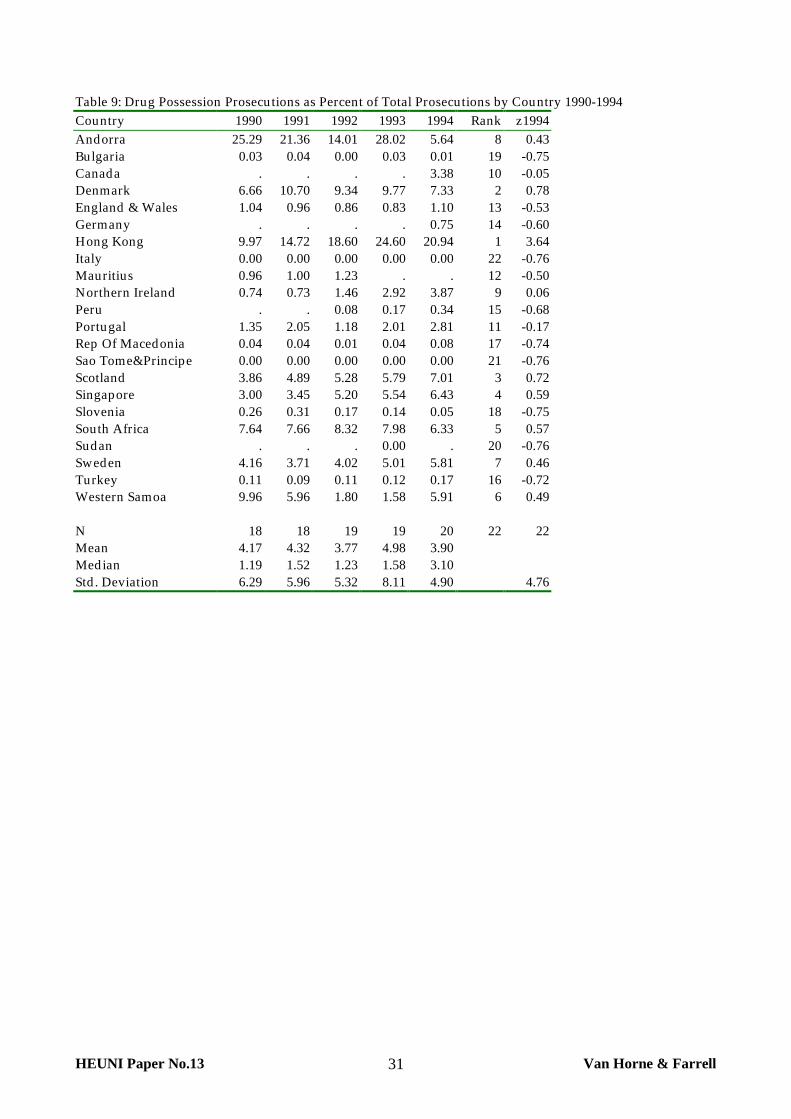
HEUNI Paper No.13 Van Horne & Farrell31
Table 9: Drug Possession Prosecutions as Percent of Total Prosecutions by Country 1990-1994Country 1990 1991 1992 1993 1994 Rank z1994Andorra 25.29 21.36 14.01 28.02 5.64 8 0.43Bulgaria 0.03 0.04 0.00 0.03 0.01 19 -0.75Canada . . . . 3.38 10 -0.05Denmark 6.66 10.70 9.34 9.77 7.33 2 0.78England & Wales 1.04 0.96 0.86 0.83 1.10 13 -0.53Germany . . . . 0.75 14 -0.60Hong Kong 9.97 14.72 18.60 24.60 20.94 1 3.64Italy 0.00 0.00 0.00 0.00 0.00 22 -0.76Mauritius 0.96 1.00 1.23 . . 12 -0.50Northern Ireland 0.74 0.73 1.46 2.92 3.87 9 0.06Peru . . 0.08 0.17 0.34 15 -0.68Portugal 1.35 2.05 1.18 2.01 2.81 11 -0.17Rep Of Macedonia 0.04 0.04 0.01 0.04 0.08 17 -0.74Sao Tome&Principe 0.00 0.00 0.00 0.00 0.00 21 -0.76Scotland 3.86 4.89 5.28 5.79 7.01 3 0.72Singapore 3.00 3.45 5.20 5.54 6.43 4 0.59Slovenia 0.26 0.31 0.17 0.14 0.05 18 -0.75South Africa 7.64 7.66 8.32 7.98 6.33 5 0.57Sudan . . . 0.00 . 20 -0.76Sweden 4.16 3.71 4.02 5.01 5.81 7 0.46Turkey 0.11 0.09 0.11 0.12 0.17 16 -0.72Western Samoa 9.96 5.96 1.80 1.58 5.91 6 0.49
N 18 18 19 19 20 22 22Mean 4.17 4.32 3.77 4.98 3.90Median 1.19 1.52 1.23 1.58 3.10Std. Deviation 6.29 5.96 5.32 8.11 4.90 4.76
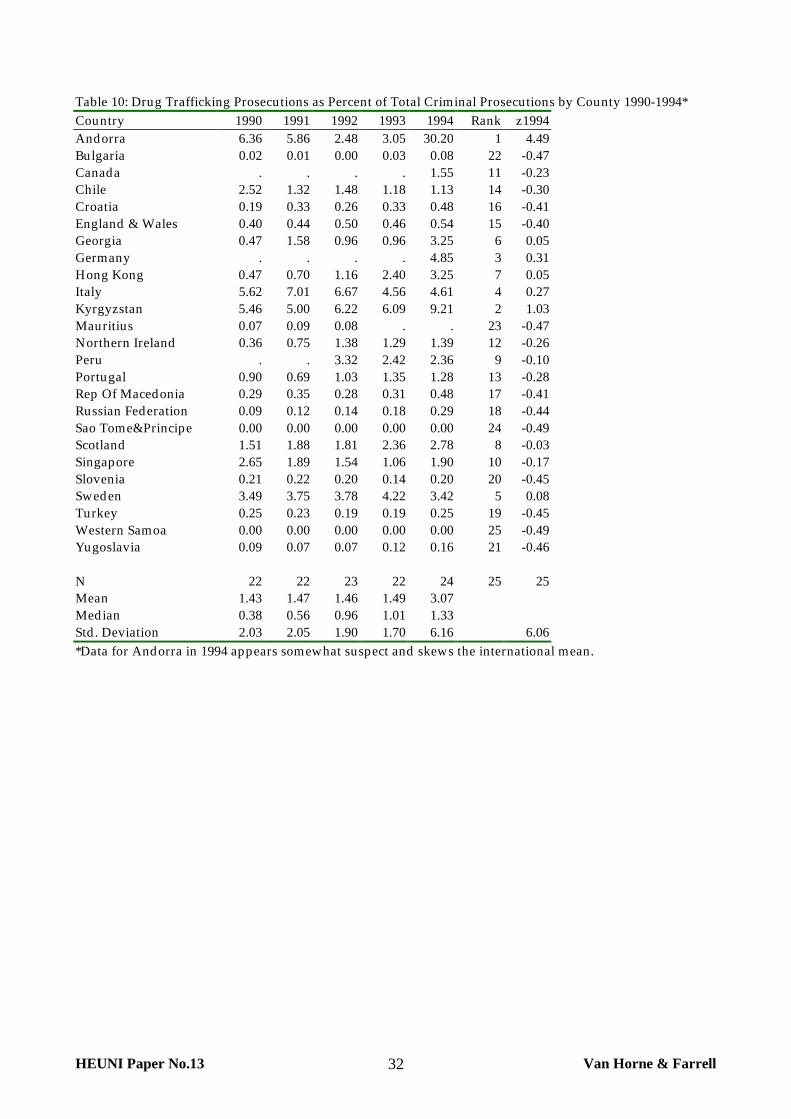
HEUNI Paper No.13 Van Horne & Farrell32
Table 10: Drug Trafficking Prosecutions as Percent of Total Criminal Prosecutions by County 1990-1994*Country 1990 1991 1992 1993 1994 Rank z1994Andorra 6.36 5.86 2.48 3.05 30.20 1 4.49Bulgaria 0.02 0.01 0.00 0.03 0.08 22 -0.47Canada . . . . 1.55 11 -0.23Chile 2.52 1.32 1.48 1.18 1.13 14 -0.30Croatia 0.19 0.33 0.26 0.33 0.48 16 -0.41England & Wales 0.40 0.44 0.50 0.46 0.54 15 -0.40Georgia 0.47 1.58 0.96 0.96 3.25 6 0.05Germany . . . . 4.85 3 0.31Hong Kong 0.47 0.70 1.16 2.40 3.25 7 0.05Italy 5.62 7.01 6.67 4.56 4.61 4 0.27Kyrgyzstan 5.46 5.00 6.22 6.09 9.21 2 1.03Mauritius 0.07 0.09 0.08 . . 23 -0.47Northern Ireland 0.36 0.75 1.38 1.29 1.39 12 -0.26Peru . . 3.32 2.42 2.36 9 -0.10Portugal 0.90 0.69 1.03 1.35 1.28 13 -0.28Rep Of Macedonia 0.29 0.35 0.28 0.31 0.48 17 -0.41Russian Federation 0.09 0.12 0.14 0.18 0.29 18 -0.44Sao Tome&Principe 0.00 0.00 0.00 0.00 0.00 24 -0.49Scotland 1.51 1.88 1.81 2.36 2.78 8 -0.03Singapore 2.65 1.89 1.54 1.06 1.90 10 -0.17Slovenia 0.21 0.22 0.20 0.14 0.20 20 -0.45Sweden 3.49 3.75 3.78 4.22 3.42 5 0.08Turkey 0.25 0.23 0.19 0.19 0.25 19 -0.45Western Samoa 0.00 0.00 0.00 0.00 0.00 25 -0.49Yugoslavia 0.09 0.07 0.07 0.12 0.16 21 -0.46
N 22 22 23 22 24 25 25Mean 1.43 1.47 1.46 1.49 3.07Median 0.38 0.56 0.96 1.01 1.33Std. Deviation 2.03 2.05 1.90 1.70 6.16 6.06*Data for Andorra in 1994 appears somewhat suspect and skews the international mean.
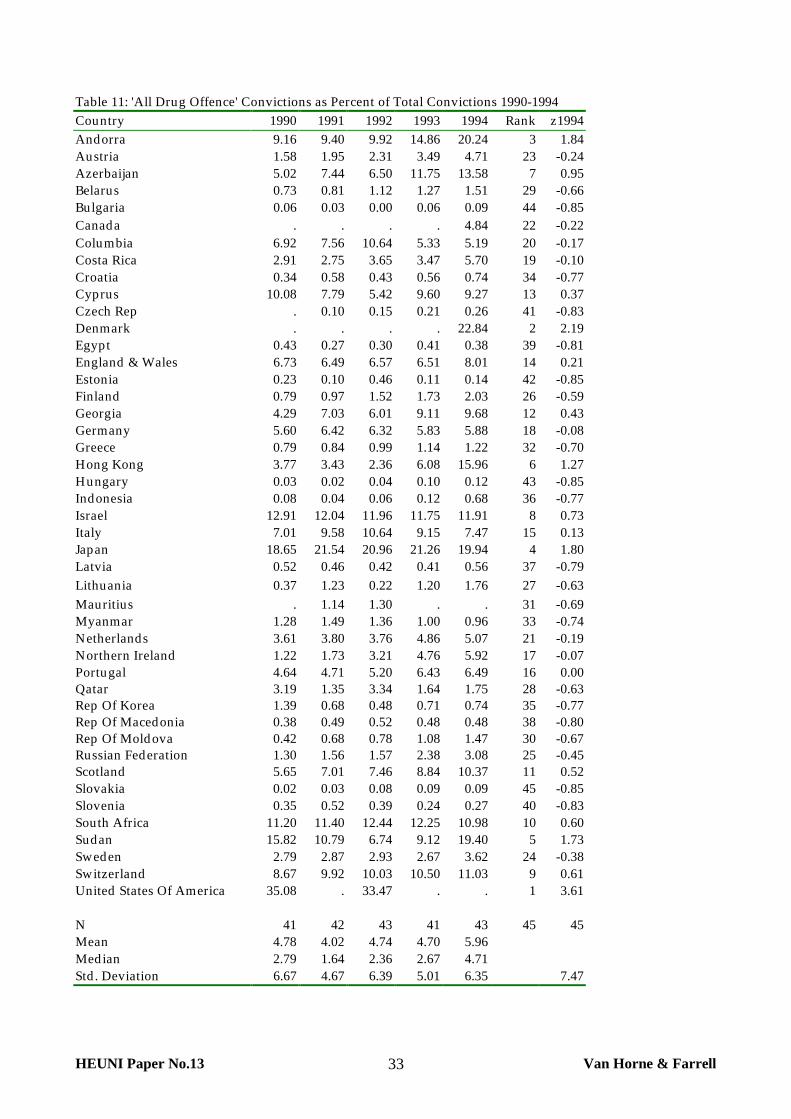
HEUNI Paper No.13 Van Horne & Farrell33
Table 11: 'All Drug Offence' Convictions as Percent of Total Convictions 1990-1994Country 1990 1991 1992 1993 1994 Rank z1994Andorra 9.16 9.40 9.92 14.86 20.24 3 1.84Austria 1.58 1.95 2.31 3.49 4.71 23 -0.24Azerbaijan 5.02 7.44 6.50 11.75 13.58 7 0.95Belarus 0.73 0.81 1.12 1.27 1.51 29 -0.66Bulgaria 0.06 0.03 0.00 0.06 0.09 44 -0.85Canada . . . . 4.84 22 -0.22Columbia 6.92 7.56 10.64 5.33 5.19 20 -0.17Costa Rica 2.91 2.75 3.65 3.47 5.70 19 -0.10Croatia 0.34 0.58 0.43 0.56 0.74 34 -0.77Cyprus 10.08 7.79 5.42 9.60 9.27 13 0.37Czech Rep . 0.10 0.15 0.21 0.26 41 -0.83Denmark . . . . 22.84 2 2.19Egypt 0.43 0.27 0.30 0.41 0.38 39 -0.81England & Wales 6.73 6.49 6.57 6.51 8.01 14 0.21Estonia 0.23 0.10 0.46 0.11 0.14 42 -0.85Finland 0.79 0.97 1.52 1.73 2.03 26 -0.59Georgia 4.29 7.03 6.01 9.11 9.68 12 0.43Germany 5.60 6.42 6.32 5.83 5.88 18 -0.08Greece 0.79 0.84 0.99 1.14 1.22 32 -0.70Hong Kong 3.77 3.43 2.36 6.08 15.96 6 1.27Hungary 0.03 0.02 0.04 0.10 0.12 43 -0.85Indonesia 0.08 0.04 0.06 0.12 0.68 36 -0.77Israel 12.91 12.04 11.96 11.75 11.91 8 0.73Italy 7.01 9.58 10.64 9.15 7.47 15 0.13Japan 18.65 21.54 20.96 21.26 19.94 4 1.80Latvia 0.52 0.46 0.42 0.41 0.56 37 -0.79Lithuania 0.37 1.23 0.22 1.20 1.76 27 -0.63Mauritius . 1.14 1.30 . . 31 -0.69Myanmar 1.28 1.49 1.36 1.00 0.96 33 -0.74Netherlands 3.61 3.80 3.76 4.86 5.07 21 -0.19Northern Ireland 1.22 1.73 3.21 4.76 5.92 17 -0.07Portugal 4.64 4.71 5.20 6.43 6.49 16 0.00Qatar 3.19 1.35 3.34 1.64 1.75 28 -0.63Rep Of Korea 1.39 0.68 0.48 0.71 0.74 35 -0.77Rep Of Macedonia 0.38 0.49 0.52 0.48 0.48 38 -0.80Rep Of Moldova 0.42 0.68 0.78 1.08 1.47 30 -0.67Russian Federation 1.30 1.56 1.57 2.38 3.08 25 -0.45Scotland 5.65 7.01 7.46 8.84 10.37 11 0.52Slovakia 0.02 0.03 0.08 0.09 0.09 45 -0.85Slovenia 0.35 0.52 0.39 0.24 0.27 40 -0.83South Africa 11.20 11.40 12.44 12.25 10.98 10 0.60Sudan 15.82 10.79 6.74 9.12 19.40 5 1.73Sweden 2.79 2.87 2.93 2.67 3.62 24 -0.38Switzerland 8.67 9.92 10.03 10.50 11.03 9 0.61United States Of America 35.08 . 33.47 . . 1 3.61
N 41 42 43 41 43 45 45Mean 4.78 4.02 4.74 4.70 5.96Median 2.79 1.64 2.36 2.67 4.71Std. Deviation 6.67 4.67 6.39 5.01 6.35 7.47
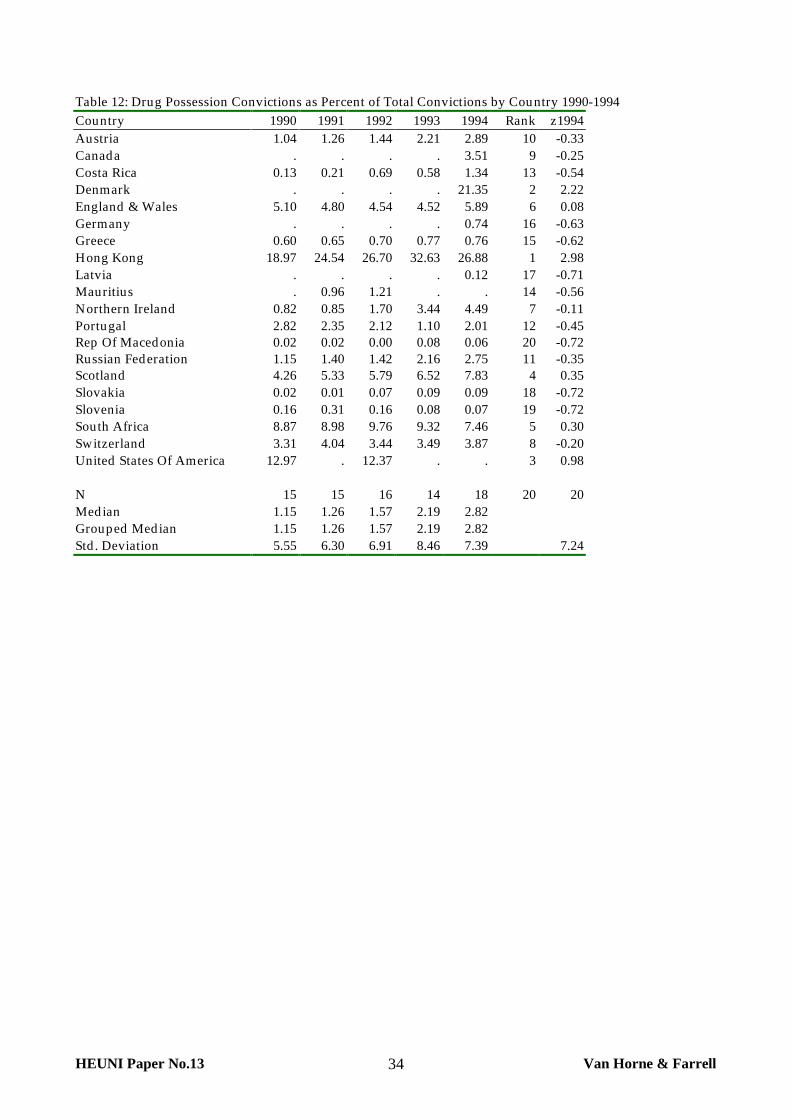
HEUNI Paper No.13 Van Horne & Farrell34
Table 12: Drug Possession Convictions as Percent of Total Convictions by Country 1990-1994Country 1990 1991 1992 1993 1994 Rank z1994Austria 1.04 1.26 1.44 2.21 2.89 10 -0.33Canada . . . . 3.51 9 -0.25Costa Rica 0.13 0.21 0.69 0.58 1.34 13 -0.54Denmark . . . . 21.35 2 2.22England & Wales 5.10 4.80 4.54 4.52 5.89 6 0.08Germany . . . . 0.74 16 -0.63Greece 0.60 0.65 0.70 0.77 0.76 15 -0.62Hong Kong 18.97 24.54 26.70 32.63 26.88 1 2.98Latvia . . . . 0.12 17 -0.71Mauritius . 0.96 1.21 . . 14 -0.56Northern Ireland 0.82 0.85 1.70 3.44 4.49 7 -0.11Portugal 2.82 2.35 2.12 1.10 2.01 12 -0.45Rep Of Macedonia 0.02 0.02 0.00 0.08 0.06 20 -0.72Russian Federation 1.15 1.40 1.42 2.16 2.75 11 -0.35Scotland 4.26 5.33 5.79 6.52 7.83 4 0.35Slovakia 0.02 0.01 0.07 0.09 0.09 18 -0.72Slovenia 0.16 0.31 0.16 0.08 0.07 19 -0.72South Africa 8.87 8.98 9.76 9.32 7.46 5 0.30Switzerland 3.31 4.04 3.44 3.49 3.87 8 -0.20United States Of America 12.97 . 12.37 . . 3 0.98
N 15 15 16 14 18 20 20Median 1.15 1.26 1.57 2.19 2.82Grouped Median 1.15 1.26 1.57 2.19 2.82Std. Deviation 5.55 6.30 6.91 8.46 7.39 7.24
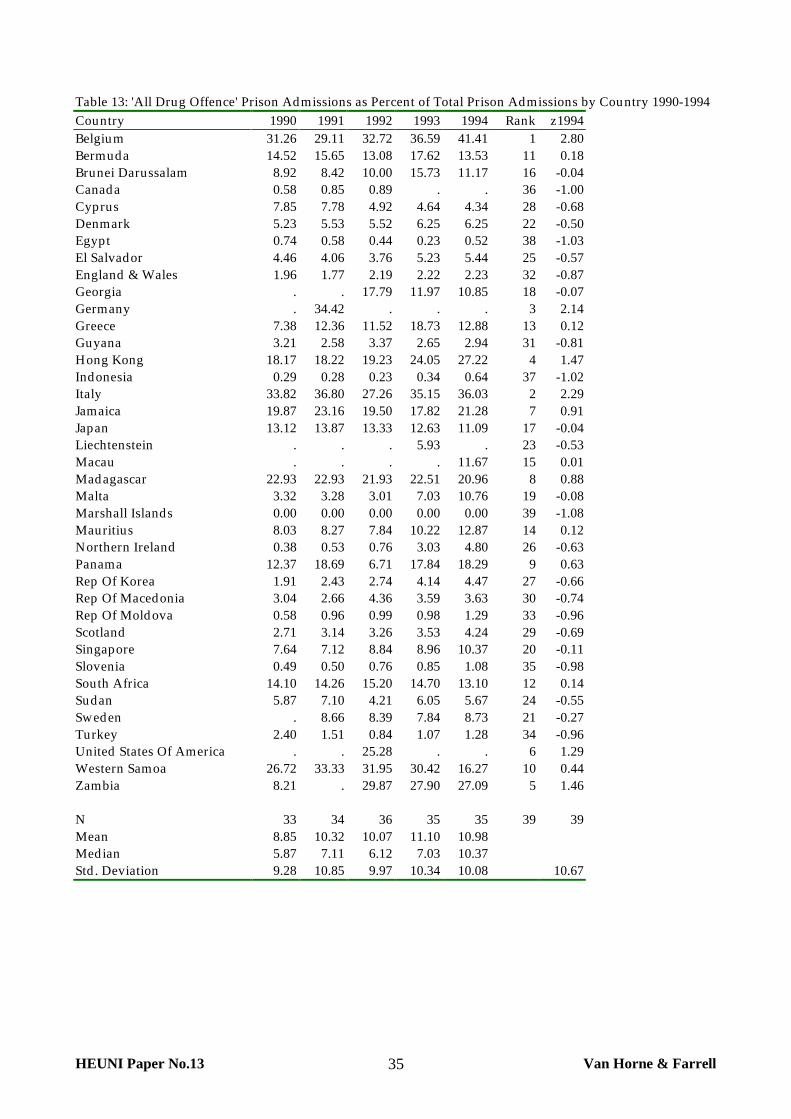
HEUNI Paper No.13 Van Horne & Farrell35
Table 13: 'All Drug Offence' Prison Admissions as Percent of Total Prison Admissions by Country 1990-1994Country 1990 1991 1992 1993 1994 Rank z1994Belgium 31.26 29.11 32.72 36.59 41.41 1 2.80Bermuda 14.52 15.65 13.08 17.62 13.53 11 0.18Brunei Darussalam 8.92 8.42 10.00 15.73 11.17 16 -0.04Canada 0.58 0.85 0.89 . . 36 -1.00Cyprus 7.85 7.78 4.92 4.64 4.34 28 -0.68Denmark 5.23 5.53 5.52 6.25 6.25 22 -0.50Egypt 0.74 0.58 0.44 0.23 0.52 38 -1.03El Salvador 4.46 4.06 3.76 5.23 5.44 25 -0.57England & Wales 1.96 1.77 2.19 2.22 2.23 32 -0.87Georgia . . 17.79 11.97 10.85 18 -0.07Germany . 34.42 . . . 3 2.14Greece 7.38 12.36 11.52 18.73 12.88 13 0.12Guyana 3.21 2.58 3.37 2.65 2.94 31 -0.81Hong Kong 18.17 18.22 19.23 24.05 27.22 4 1.47Indonesia 0.29 0.28 0.23 0.34 0.64 37 -1.02Italy 33.82 36.80 27.26 35.15 36.03 2 2.29Jamaica 19.87 23.16 19.50 17.82 21.28 7 0.91Japan 13.12 13.87 13.33 12.63 11.09 17 -0.04Liechtenstein . . . 5.93 . 23 -0.53Macau . . . . 11.67 15 0.01Madagascar 22.93 22.93 21.93 22.51 20.96 8 0.88Malta 3.32 3.28 3.01 7.03 10.76 19 -0.08Marshall Islands 0.00 0.00 0.00 0.00 0.00 39 -1.08Mauritius 8.03 8.27 7.84 10.22 12.87 14 0.12Northern Ireland 0.38 0.53 0.76 3.03 4.80 26 -0.63Panama 12.37 18.69 6.71 17.84 18.29 9 0.63Rep Of Korea 1.91 2.43 2.74 4.14 4.47 27 -0.66Rep Of Macedonia 3.04 2.66 4.36 3.59 3.63 30 -0.74Rep Of Moldova 0.58 0.96 0.99 0.98 1.29 33 -0.96Scotland 2.71 3.14 3.26 3.53 4.24 29 -0.69Singapore 7.64 7.12 8.84 8.96 10.37 20 -0.11Slovenia 0.49 0.50 0.76 0.85 1.08 35 -0.98South Africa 14.10 14.26 15.20 14.70 13.10 12 0.14Sudan 5.87 7.10 4.21 6.05 5.67 24 -0.55Sweden . 8.66 8.39 7.84 8.73 21 -0.27Turkey 2.40 1.51 0.84 1.07 1.28 34 -0.96United States Of America . . 25.28 . . 6 1.29Western Samoa 26.72 33.33 31.95 30.42 16.27 10 0.44Zambia 8.21 . 29.87 27.90 27.09 5 1.46
N 33 34 36 35 35 39 39Mean 8.85 10.32 10.07 11.10 10.98Median 5.87 7.11 6.12 7.03 10.37Std. Deviation 9.28 10.85 9.97 10.34 10.08 10.67
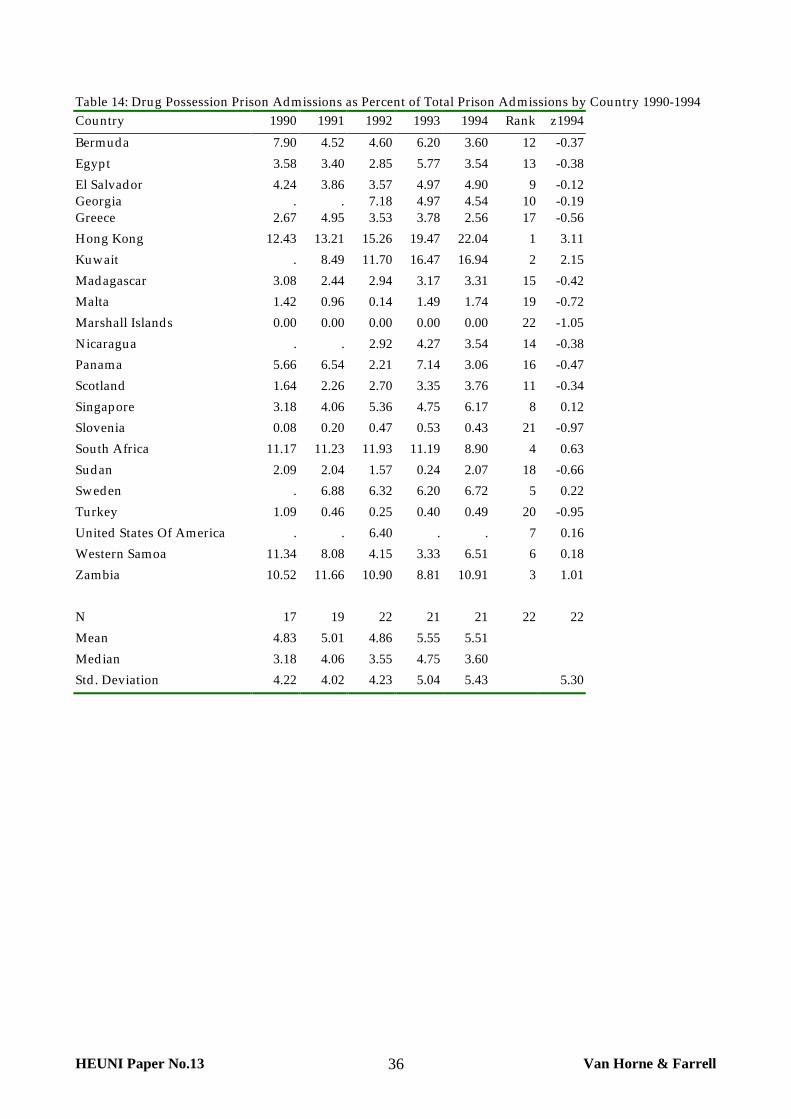
HEUNI Paper No.13 Van Horne & Farrell36
Table 14: Drug Possession Prison Admissions as Percent of Total Prison Admissions by Country 1990-1994Country 1990 1991 1992 1993 1994 Rank z1994
Bermuda 7.90 4.52 4.60 6.20 3.60 12 -0.37
Egypt 3.58 3.40 2.85 5.77 3.54 13 -0.38
El Salvador 4.24 3.86 3.57 4.97 4.90 9 -0.12Georgia . . 7.18 4.97 4.54 10 -0.19Greece 2.67 4.95 3.53 3.78 2.56 17 -0.56
Hong Kong 12.43 13.21 15.26 19.47 22.04 1 3.11
Kuwait . 8.49 11.70 16.47 16.94 2 2.15
Madagascar 3.08 2.44 2.94 3.17 3.31 15 -0.42
Malta 1.42 0.96 0.14 1.49 1.74 19 -0.72
Marshall Islands 0.00 0.00 0.00 0.00 0.00 22 -1.05
Nicaragua . . 2.92 4.27 3.54 14 -0.38
Panama 5.66 6.54 2.21 7.14 3.06 16 -0.47
Scotland 1.64 2.26 2.70 3.35 3.76 11 -0.34
Singapore 3.18 4.06 5.36 4.75 6.17 8 0.12
Slovenia 0.08 0.20 0.47 0.53 0.43 21 -0.97
South Africa 11.17 11.23 11.93 11.19 8.90 4 0.63
Sudan 2.09 2.04 1.57 0.24 2.07 18 -0.66
Sweden . 6.88 6.32 6.20 6.72 5 0.22
Turkey 1.09 0.46 0.25 0.40 0.49 20 -0.95
United States Of America . . 6.40 . . 7 0.16
Western Samoa 11.34 8.08 4.15 3.33 6.51 6 0.18
Zambia 10.52 11.66 10.90 8.81 10.91 3 1.01
N 17 19 22 21 21 22 22
Mean 4.83 5.01 4.86 5.55 5.51
Median 3.18 4.06 3.55 4.75 3.60
Std. Deviation 4.22 4.02 4.23 5.04 5.43 5.30
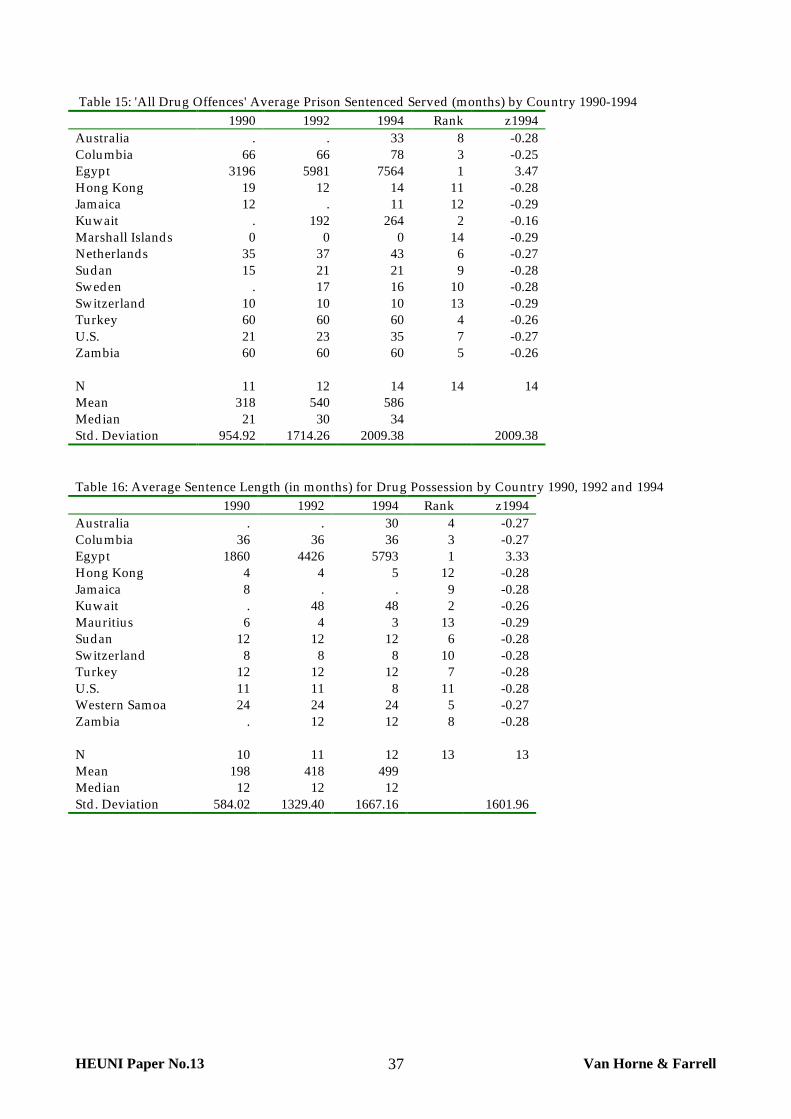
HEUNI Paper No.13 Van Horne & Farrell37
Table 15: 'All Drug Offences' Average Prison Sentenced Served (months) by Country 1990-19941990 1992 1994 Rank z1994
Australia . . 33 8 -0.28Columbia 66 66 78 3 -0.25Egypt 3196 5981 7564 1 3.47Hong Kong 19 12 14 11 -0.28Jamaica 12 . 11 12 -0.29Kuwait . 192 264 2 -0.16Marshall Islands 0 0 0 14 -0.29Netherlands 35 37 43 6 -0.27Sudan 15 21 21 9 -0.28Sweden . 17 16 10 -0.28Switzerland 10 10 10 13 -0.29Turkey 60 60 60 4 -0.26U.S. 21 23 35 7 -0.27Zambia 60 60 60 5 -0.26
N 11 12 14 14 14Mean 318 540 586Median 21 30 34Std. Deviation 954.92 1714.26 2009.38 2009.38
Table 16: Average Sentence Length (in months) for Drug Possession by Country 1990, 1992 and 19941990 1992 1994 Rank z1994
Australia . . 30 4 -0.27Columbia 36 36 36 3 -0.27Egypt 1860 4426 5793 1 3.33Hong Kong 4 4 5 12 -0.28Jamaica 8 . . 9 -0.28Kuwait . 48 48 2 -0.26Mauritius 6 4 3 13 -0.29Sudan 12 12 12 6 -0.28Switzerland 8 8 8 10 -0.28Turkey 12 12 12 7 -0.28U.S. 11 11 8 11 -0.28Western Samoa 24 24 24 5 -0.27Zambia . 12 12 8 -0.28
N 10 11 12 13 13Mean 198 418 499Median 12 12 12Std. Deviation 584.02 1329.40 1667.16 1601.96
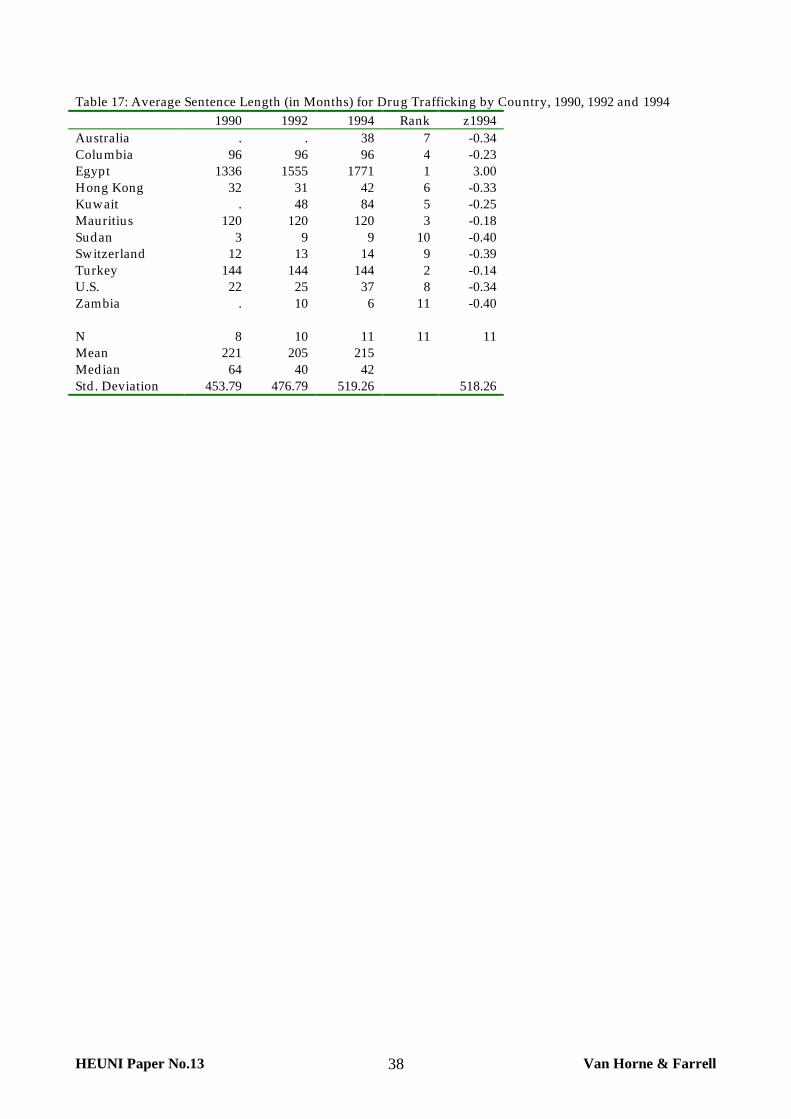
HEUNI Paper No.13 Van Horne & Farrell38
Table 17: Average Sentence Length (in Months) for Drug Trafficking by Country, 1990, 1992 and 19941990 1992 1994 Rank z1994
Australia . . 38 7 -0.34Columbia 96 96 96 4 -0.23Egypt 1336 1555 1771 1 3.00Hong Kong 32 31 42 6 -0.33Kuwait . 48 84 5 -0.25Mauritius 120 120 120 3 -0.18Sudan 3 9 9 10 -0.40Switzerland 12 13 14 9 -0.39Turkey 144 144 144 2 -0.14U.S. 22 25 37 8 -0.34Zambia . 10 6 11 -0.40
N 8 10 11 11 11Mean 221 205 215Median 64 40 42Std. Deviation 453.79 476.79 519.26 518.26