Embed Size (px)
Citation preview

Dro
wni
ngs
and
Nea
r Dro
wni
ngs
187
Drownings and Near Drownings (Residents and Non-residents)
0
25
50
75
3 4 3 6 15
8 4
82
males: 277 (83%)
females: 55 (17%)
total: 332 victims
1 to 4
<1 yr.
15 to 24
5 to 14
35 to 44
25 to 34
55 to 64
45 to 54
75 to 84
65 to 74
85 +
yrs.
4 4 3 6 4
29 37 36
52
67
26 17
3 1 10 8
32 41 39
58
34
21
6 0
0
25
50
75
12 13 14 6
12
32 23
30 33 38
10 10 13 6 8 9 13 12
17 21
2007 2008 2009 2010 2011
state Haw aii (57, 17%) Honolulu (156, 47%) Kaua i (47, 14%) Maui (72 , 22%)
63 59 69
62
79
Hawaii (57, 17%) Kauai (47, 14%)
Fatal injuries
The previous chapter on drownings included only informa-tion on victims who were residents of Hawaii; this chapter also incor-porates information from drownings among non-residents. There were 332 drownings over the 5-year pe-riod, with by far the highest total (79) in 2011 (Figure 179). The 79 deaths in 2011 was the highest total since at least 1993, surpassing the 2005 total of 77 drownings. Figure 179 also shows most of the high total in 2011 was due to drownings on Honolulu and Maui counties. There were 67 drownings on the island of Maui, 3 on Molokai, and 2 on the island of Lanai. The 332 drownings included 175 (53%) Hawaii residents, and 157 (47%) non-residents. Most of the non-residents (75%, or 118) were from other U.S. states, with the remaining 39 victims residing in foreign countries.
Figure 179. Annual number of drownings (including non-residents) in Hawaii, by county, 2007-2011.
Drownings occurred among victims of all ages, with a large peak of victims in the 45 to 64 year age range (42%, or 140 of the victims) (Figure 180). Non-resident victims were significantly older, on average, than resident victims (53 vs. 43 years of age), with proportionally more 55 to 74 year-old victims among the former (48% vs. 30% among resi-dent victims). Only 55 of the victims (17%) were females; males outnum-bered females by a 5-to-1 ratio. That gender ratio was closer among the very young and very old victims.
Figure 180. Age and gender distribution of drowning victims (including non-residents) in Hawaii, 2007-2011.

Drow
nings and Near D
rownings
188
Drownings and Near Drownings (Residents and Non-residents)
9
136
123
12 (4%)
0 50 100
150
200
250
other
bathtubs
riv ers/streams
swimming pools
ocean/sal twater
HI residents: 175 (53%)
non-residents: 157 (47%)
total: 332 victims
1
1
10 11
11
27
4 (1%)
21 (6%)
36 (11%)
259 (78%)
3
Overall, 78% (259) of the drownings occurred in the ocean or other saltwater environments (Figure 181), although that proportion was significantly higher for non-resident victims (87%), compared to residents (70%). Drownings in swimming pools (11%, or 36), and rivers and other freshwater bodies (6%, or 21) made up most of the remaining drownings. There were also 12 victims who drowned in bathtubs and 4 in “other” environments.
Only 3 (8%) of the 36 victims who drowned in swimming pools were under 5 years of age, as victim age was widely distributed in this environment. There were at least 2 such deaths in each county, although most (75%, or 27) occurred on Oahu. Nine of these 36 drownings oc-curred at single family homes, 13 in apartment buildings/condominiums, 11 in hotel pools, and the remaining 3 at community pools.
Figure 181. Drownings in Hawaii, by environment and residency, 2007-2011.
Almost all the 21 freshwater drowning victims were young to middle-aged adults; 18 (86%) were 20 to 53 years of age. These deaths were widely dispersed geographically with county totals varying between 3 to 7 deaths. However, there were 4 drownings in Kipu Falls on Kauai, 1 each year from 2008 to 2011. All 7 of the fresh-water drownings in Hawaii County were in the Hilo area, between the Wailuku River (4 drownings) and Papaikou. The 12 victims who drowned in bathtubs included 4 (33%) who were under 4 years of age (all of whom were Hawaii residents), and 6 (50%) who were 57 years or older. All but 1 of the older victims drowned on Oahu. (The saltwater drownings will be discussed in more detail, including data that was linked to Honolulu County autopsy records from 2007 to 2010.)

Dro
wni
ngs
and
Nea
r Dro
wni
ngs
189
0
20
40
60
29
57
40 38
17 23
45
34 31
12
Hawaii Kauai Maui NI* Honolulu Hawaii Kauai Maui NI* Honolulu ocean
*N.I. = Neighbor Islands (combine d totals for Hawaii, Kau ai, and Maui coun ties.)
saltwater drownings all drownings
*N.I.=Neighbor Islands (combined totals for Hawaii, Kauai, and Maui counties.)
unknown activity
other activity
surfing/body boarding
scuba diving
free diving
snorkeling
swimming
boat accident
picking opihi
fishing, shorecasting
fell in/swept in
13
6
2
6
1
0
0
8
16
8
5
6
25
12 20 (8%)
0 25 50 75
HI re sident s: 123 (47%)
non-resident s: 136 (53%)
total: 259 victims
51 49
0
15
23
2 (1%)
29 (11%)
14 (5%)
17 (7%)
11 (4%) 24 (9%)
57 (22%)
74 (29%)
3 (1%)
8 (3%)
Drowning rates were sig-nificantly lower for Honolulu County compared to any other county, for all drownings as well as for those that occurred in saltwater environments (Figure 182). The highest rates were computed for Kauai, approximately twice as high as rates for Hawaii County and more than 3 times the rates for Honolulu County. Rates for Hawaii County were intermediate, significantly lower than the rates for Maui (saltwater drownings only) and Kauai counties (either type of drown-ing). If all the Neighbor Islands are considered together, the rates of drownings (both total and saltwater) are significantly higher than the rates for Honolulu County.
Figure 182. Rate for all types of drownings (left side) and for saltwater drownings (right side) in Hawaii,
by county of injury, 2007-2011.
(Rate is per 100,000 de facto population. Crude rates are shown, unadjusted for age distribution.)
The most common activity among the 259 victims of saltwater drownings was swimming, accounting for almost one quarter (74, or 29%) of the total (Figure 183). Most of these victims (66%, or 49) were non-resi-dents. Snorkeling was the next most common activity (22%, or 57 victims) overall, and the most common activity among non-residents who drowned (51 victims, or 38% of the 136 total non-resident victims). There were 33 drownings resulting from uninten-tional immersions including people who fell in or were swept in (20), fish-ing (8) or gathering (3) from shore, or who drowned after boat accidents (2). Most (76%, or 25) of those 33 victims were residents. All but 1 of the 24 victims who were free diving were residents, while there were near-ly equal numbers of residents (5) and non-residents (6) among those who were scuba diving. Activity could not be determined for 11% (29) of the vic-tims.
Figure 183. Ocean drownings in Hawaii, by activity and residency of victim, 2007-2011.

Drow
nings and Near D
rownings
190
0%
25%
50% 38
55
46
19
3
12 11 3
7 6 5 6 4 5 5
C D A I O
I=injury A= alcohol C=circulatory dis.
C D A I O C D A I O
O=other
HI re sident s: 60% (28 of 47) w/i ntrin sic
non -resident s: 63% (24 of 38) w/i ntrin sic
all victims : 61% (52 of 85) w/i ntrin sic
D=drug re lated
HI residents: 60%(28 of 47) w/intrinsic
C=circulatory dis. D=drug related
non-residents: 63%(24 of 38) w/intrinsic
all victims: 61%(52 of 85) w/intrinsic
Autopsy records were reviewed for all but 1 of the 86 saltwater drownings in Honolulu County over the 2007 to 2010 period. More than half (61%, or 52) of the 85 ocean drownings were at least somewhat related to intrinsic or personal factors among victims (Figure 184). Intrinsic or personal factors were significantly equally common among resident vic-tims (60%) and non-residents (63%). However, non-resident victims were more likely to have had contributing circulatory diseases (55%, vs. 38% for residents), while drownings among residents were more likely to have been drug- or alcohol-related. Circulatory diseases were the most common type of intrinsic factor, contributing to nearly one-half (46%) of the drownings. Circulatory diseases were documented for most (69%, or 35 of 51) of victims aged 50 and older, and all 16 of the senior-aged victims.
Figure 184. Prevalence of intrinsic factors in saltwater drownings on Oahu, by residence of victims, 2007-2010.

Dro
wni
ngs
and
Nea
r Dro
wni
ngs
191
Resident (69 victims) outnumbered non-residents (47 victims) among the 116 ocean drowning victims on Oahu from 2007-2011 (Figure 185). More than half (57%, or 66) of these drownings occurred on the eastern part of the island, from Sand Island, around Hanauma and Makapuu to Kailua Bay. There were 8 drownings from Kewalo Basin to the Ala Wai Yacht Harbor, including 4 at Ala Moana Beach Park. Five of these victims were residents. In contrast, non-resident comprised most (67%, or 12) of the 18 drowning victims in Waikiki (from Hilton Village to Kapahulu Ave.). All but 1 of the 9 drownings in Hanauma Bay were among non-residents, including 5 among residents of foreign countries, and 3 from other U.S. states. There were also 6 drownings (including 5 residents) on the eastern end of the island from the Makai Pier to Makapuu Head. There were 19 drownings along the length of the Waianae Coast, including 5 between Makaha and Pokai Bay Beach Parks, and 10 between Nanakuli and Ko Olina Beach Parks. The 10 drownings along the North Shore (from Haleiwa to Kahuku Point) included mostly (70%, or 7) residents. Five of these drownings occurred in 2011.
Figure 185. Ocean drownings on Oahu, by residence status of victims, 2007-2011.

Drow
nings and Near D
rownings
192
Residents comprised two-thirds (66%, or 29) of the 44 ocean drowning victims in Hawaii County. Figure 186 shows that most (80%, or 12) of the 15 non-resident victims drowned along the western coast, including 6 from Kailua-Kona to Kahaluu Bay. All but 1 of the 12 victims who drowned on the eastern part of the island from Hilo to Puna were Hawaii residents. About three-quarters of the ocean drowning victims on Kauai and Maui counties were non-residents. Although there were drownings on most parts of Kauai, the 2 biggest concentrations were from Kolopa Cape to Waiohai Beach on the south shore (8 drownings), and from Kee Beach to Kilauea Point on the north coast (15 drownings). Most (92%, or 57) of the 62 ocean drownings on Maui County were on the island of Maui. There were 16 drownings (including 15 non-residents) from Kaanapali Beach to Hanakaoo Beach Park on the western coast, including 6 in 2011. There were 9 drownings (including 8 non-residents) from Makena Bay to Big Beach (Oneloa Beach), and another 4 drownings near Molokini Island. (The approximate location for five of the drownings could not be determined and therefore do not appear in the Figure: 2 each on Hawaii and Maui counties, and 1 on Kauai.)
Figure 186. Ocean drownings on Neighbor Islands, by residence status of victims, 2007-2011.
Dro
wni
ngs
and
Nea
r Dro
wni
ngs
193
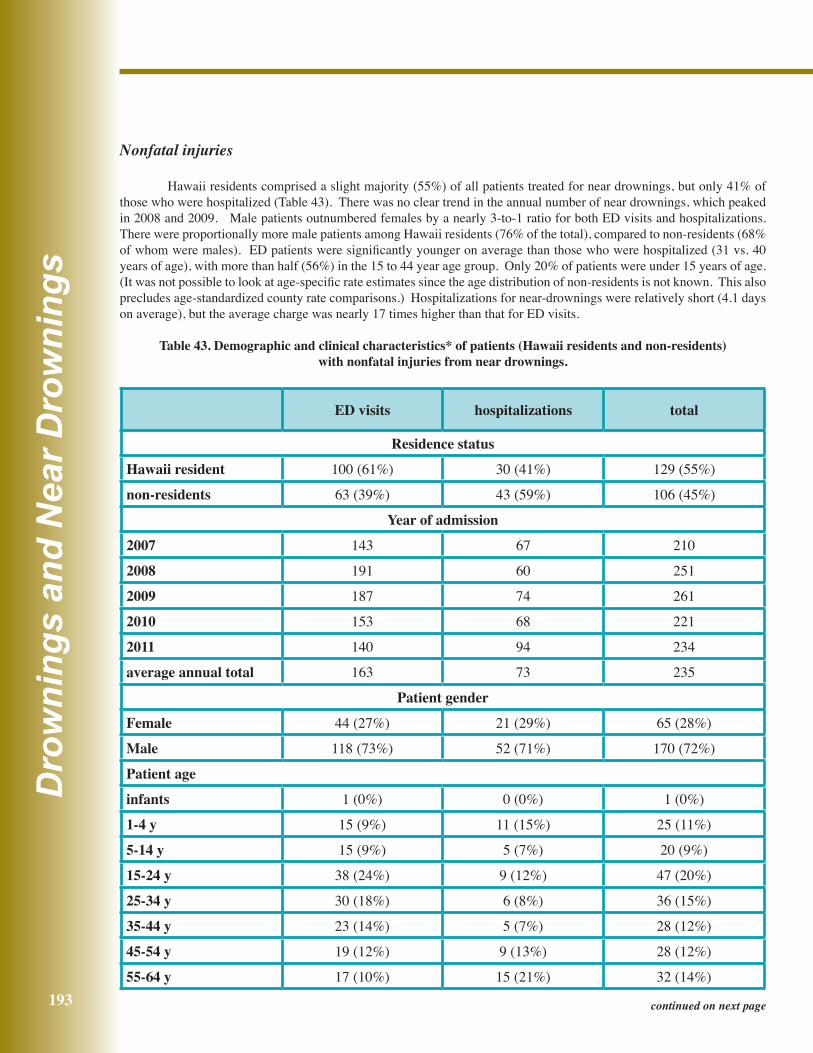
Nonfatal injuries
Hawaii residents comprised a slight majority (55%) of all patients treated for near drownings, but only 41% of those who were hospitalized (Table 43). There was no clear trend in the annual number of near drownings, which peaked in 2008 and 2009. Male patients outnumbered females by a nearly 3-to-1 ratio for both ED visits and hospitalizations. There were proportionally more male patients among Hawaii residents (76% of the total), compared to non-residents (68% of whom were males). ED patients were significantly younger on average than those who were hospitalized (31 vs. 40 years of age), with more than half (56%) in the 15 to 44 year age group. Only 20% of patients were under 15 years of age. (It was not possible to look at age-specific rate estimates since the age distribution of non-residents is not known. This also precludes age-standardized county rate comparisons.) Hospitalizations for near-drownings were relatively short (4.1 days on average), but the average charge was nearly 17 times higher than that for ED visits.
Table 43. Demographic and clinical characteristics* of patients (Hawaii residents and non-residents)
with nonfatal injuries from near drownings.
ED visits hospitalizations total
Residence status
Hawaii resident 100 (61%) 30 (41%) 129 (55%)
non-residents 63 (39%) 43 (59%) 106 (45%)
Year of admission
2007 143 67 210
2008 191 60 251
2009 187 74 261
2010 153 68 221
2011 140 94 234
average annual total 163 73 235
Patient gender
Female 44 (27%) 21 (29%) 65 (28%)
Male 118 (73%) 52 (71%) 170 (72%)
Patient age
infants 1 (0%) 0 (0%) 1 (0%)
1-4 y 15 (9%) 11 (15%) 25 (11%)
5-14 y 15 (9%) 5 (7%) 20 (9%)
15-24 y 38 (24%) 9 (12%) 47 (20%)
25-34 y 30 (18%) 6 (8%) 36 (15%)
35-44 y 23 (14%) 5 (7%) 28 (12%)
45-54 y 19 (12%) 9 (13%) 28 (12%)
55-64 y 17 (10%) 15 (21%) 32 (14%)
continued on next page

Drow
nings and Near D
rownings
194
other activity
personal bathing and showering
rowing, canoeing, kayaking
diving, jumping off
walking, hiking, running
other water and watercraft
underwater diving and snorkeling
surfing, windsurfing and boogie boarding
swimming
9
4
39
0
22
22
45
12
40
0% 10% 20% 30% 40%
HI residents: 112 (57%)
non-residents: 85 (43%)
total: 197 patients
1
3
3
36
0
1
1
7
5
1
2
2
6
32
4
Activity codes were includ-ed in 43% (197) of the 455 records related to near drownings for the 2010 to 2011 period. This propor-tion was significantly greater for ED records (50%) compared to inpatient records (31%). Records from Kauai hospitals were significantly more likely to contain activity codes (74%, based on only 35 records) compared to hospitals in any other county (33% to 43% of records).
Swimming (40%) and “surf-ing, windsurfing and boogie board-ing” (32%) were the most common activities for the patients overall, al-though swimming was a more likely cause among non-residents, while the latter activities were more common among residents (Figure 187). Near drownings related to underwater div-ing and snorkeling were significantly more common among non-residents (22%) compared to residents (4%). “Surfing, windsurfing and boogie boarding” were more common activi-ties for near drownings treated in the ED setting (36%), compared to those requiring hospitalization (20%). About one-quarter (24%) of the hospitalizations were associated with “underwater diving and snorkeling”, compared to 8% of the ED visits. Male patients were twice as likely to have been “surfing, windsurfing and boogie boarding” (39%), compared to female patients (18%). Patients who had been “surfing, windsurfing and boogie boarding” were significantly older than those who had been swimming (36 vs. 25 years of age, on average), but significantly younger than those who had been “underwater diving and snorkeling” (50 years of age).
Figure 187. Activity of patients treated for near drownings in Hawaii, 2010-2011.
*Includes only hospital records with specific Activity codes, approximately 43% (197) of 455 total records for 2010 through 2011. Codes were more likely to be present in ED records (50%) compared to inpatient records (31%). Number in parentheses is annual average number of patients.
65-74 y 4 (3%) 7 (10%) 12 (5%)
75-84 y 1 (1%) 3 (5%) 4 (2%)
85+ y 0 (0%) 1 (2%) 1 (1%)
Length of care and financial chargesAve. length of stay (days) 1.0 4.1 1.9
Total number of days 163 295 457
Average charge $1,679 $28,508 $9,954
Total charges $0.3 million $2.1 million $2.3 million
*Statistics are annual averages over the 2007-2011 period.
continued from previous page

Dro
wni
ngs
and
Nea
r Dro
wni
ngs
195
0%
4%
8%
12%
6am 7 8 9 10 11 12 13 14 15 16 17 18 19 20 21 22 23 0 1 2 3 4 5am 0 0
1
3
8 10 9
11 12
11 10
9
5
3 2
1 1 1 0 0 0 0 0 0
all patien ts Haw aii residents non -residents
12 12
7
10
13 14
EMS responded to 921 near drownings over the 5-year period, including 544 (59%) among Hawaii residents and 377 (41%) non-residents. (Excluding 41 records for patients with unknown resident status, 18 who were transferred to other EMS units (to avoid double-counting of injuries), and 86 patients who were described as dead on arrival.) These were 896 separate incidents, as 97% involved a single near drowning. The non-resident group consisted mostly of patients from other United States (82%, or 308), and 69 (18%) residents of foreign countries.
Almost all (94%) of the incidents occurred during day time hours, including 80% between 9:31 a.m. and 5:29 p.m. (Figure 188). The most common time for incidents among non-residents was between 9:31 a.m. and 11:29 a.m. (27%), while the peak time for residents was 12:31 p.m. to 4:29 p.m. (46%). Sunday was the most common day of the week (21%), followed by Saturday (16%); the total varied between 12% and 13% for weekdays. About 43% of the near drownings occurred in bodies of water, which could include both freshwater and saltwater envi-ronments. About one-third (30%) were in patient residences (10%), public buildings (12%), hotels (5%), and health care facilities (3%). Most (69%, or 36) of the 52 night time incidents occurred in these types of environments. Another 16% were in “recreation areas”, which could presumably include both indoor and outdoor settings.
Figure 188. Time distribution of EMS-attended near drownings, by patient residence, 2007-2011.
(Horizontal scale indicates time of EMS dispatch, rounded up to nearest hour (military time scale, starting at 6:00am). Vertical scale indicates percent of all incidents, rounded to nearest whole number.)

Drow
nings and Near D
rownings
196
The distribution of incidents on Oahu was similar to that among Hawaii residents (page 130), with high numbers in the Waikiki, North Shore, Hawaii Kai, Ala Moana, and Waianae areas (Figure 189). The North Kona district again had the highest total in Hawaii County, while the incidents on Kauai were widely distributed (Figure 190). About half (53%) of the incidents on the island of Maui were in the Lahaina district. There were also 10 incidents on the island of Lanai and 8 on Molokai (not shown on the Figure).
Figure 189. Number of EMS-attended drownings and near-drownings on Oahu and eastern Oahu (bottom map), by Neighborhood Board, 2007-2011.
(Percent of all EMS-attended drownings/near-drownings in the state is shown in parentheses.)

Dro
wni
ngs
and
Nea
r Dro
wni
ngs
197
Figure 190. Number of EMS-attended drownings and near-drownings on Neighbor Islands, by district, 2007-2011.
(Percent of all EMS-attended drownings/near-drownings in the state is shown in parentheses.)

Drow
nings and Near D
rownings
198
0%
25%
50%
75%
8 9 5 7 13 13
25 25 18 18
39 39
67 66 77 75
48 48
all adult patients (n=87)
non-residents (n=56, 64%)
Hawaii residents (n=31, 36%)
alcohol drugs alcohol drugs alcohol drugs
positi ve negative unknown positive
(n=31, 36%)
0%
10%
20%
30%
40%
50%
15 9
46
31
14 10
44
32
16
7
47
29
all patients (n=921)
Hawaii residents (n=5 44, 59%)
non-residents (n=377, 41%)
no transport
minor/mo derate serious critical minor/moderate
Most (77%) of the patients were either transported in “serious” (46%) or “critical” (32%) condition (Figure 191). There were no signifi-cant differences in the distribution of patient condition between residents and non-residents. Patient condi-tion was not associated with gender, incident location, or the time of day of the near drowning or the day of week. There was a clear association with patient age, however, as pa-tients who were released at the scene or transported in “minor” condition were significantly younger (31 years, on average) than those transported in “serious” condition (38 years). The latter were significantly younger than patient who were transported in “critical” condition (47 years, on av-erage).
Probable alcohol use was noted for only 4% (33) of the patients. This proportion did not vary significantly by patient gender, residence status, or by county or day of week of incident. There were also no significant associations be-tween patient age or disposition and their use of alcohol, although these comparisons are limited by small numbers. Near drownings that occurred during night time hours were significantly more likely to involve alcohol consumption than day time incidents, however (21% vs. 3%).
Figure 191. Distribution of injury severity/transport status of EMS-attended near drownings, by patient residence, 2007-2011.
Trauma Registry data
Only 8% of the adult-aged (18 years and older) HTR near drowning patients were positive for alcohol, and only 9% tested positive for illicit drugs, although there was no toxicological testing for about two-thirds of the patients (Figure 192). Substance use was somewhat higher among resident patients, al-though this comparison is limited by the small sample sizes and the lack of testing. Five patients tested positive for narcotics, 4 for THC, and 1 for amphetamines. Considered together, 14% (12 of 87) of the patients tested positive for either alcohol or drugs. All 7 of the patients who had used alcohol were males. Only 3 of these patients had a BAC over 0.08%. It was not possible to examine the association between alcohol use and risk of mortality since the former was known for only 19% (5) of the 27 patients who ultimately died.
Figure 192. Alcohol and/or drug use (percent) among adult-aged patients treated for near drownings in the Hawaii Trauma
Registry, by residence, 2008-2011.