Embed Size (px)
Citation preview
Updates to Printed Version5/24/2016 Summary Table 4: NR added for one community due to <5 cell count Table4-5:NRaddedforonecommunityandconfidenceintervalssupressedforcellcounts<20 Map3-11:Colortemplatereversed Maps4-3,4-4,4-5,4-6,5-1:Mapsrevisedduetoinnacurateneighborislanddepictionforsomecommunities
State of Hawai‘i Primary Care Needs Assessment Data Book 2016 i
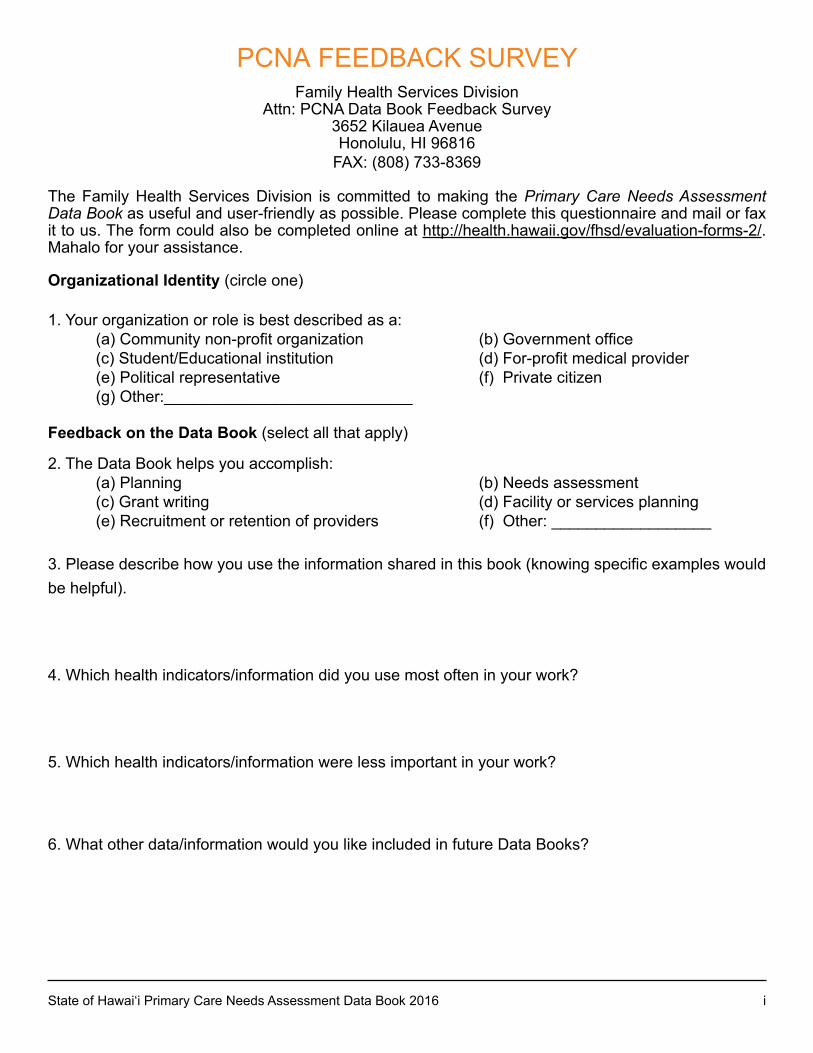
PCNA FEEDBACk SuRVEY Family Health Services Division
Attn: PCNA Data Book Feedback Survey 3652 kilauea Avenue Honolulu, HI 96816
FAX: (808) 733-8369
The Family Health Services Division is committed to making the Primary Care Needs Assessment Data Book as useful and user-friendly as possible. Please complete this questionnaire and mail or fax it to us. The form could also be completed online at http://health.hawaii.gov/fhsd/evaluation-forms-2/.Mahalo for your assistance.
Organizational Identity (circle one)
1. Your organization or role is best described as a: (a) Community non-profit organization (b) Government office (c) Student/Educational institution (d) For-profit medical provider (e) Political representative (f) Private citizen (g) Other:____________________________
Feedback on the Data Book (select all that apply)
2. The Data Book helps you accomplish: (a) Planning (b) Needs assessment (c) Grant writing (d) Facility or services planning (e) Recruitment or retention of providers (f) Other: __________________
3. Please describe how you use the information shared in this book (knowing specific examples would be helpful).
4. Which health indicators/information did you use most often in your work?
5. Which health indicators/information were less important in your work?
6. What other data/information would you like included in future Data Books?
ii State of Hawai‘i Primary Care Needs Assessment Data Book 2016
State of Hawai‘i Primary Care Needs Assessment Data Book 2016 iii
FOREWORD
The Hawai‘i Department of Health is pleased to present this edition of the Primary Care Needs Assessment Data Book (Data Book). This version has been substantially revised based on input from community stakeholders to better characterize the scope of primary care in Hawai‘i. In particular, I would like to thank the community health centers, the Hawai‘i Primary Care Association, and Papa Ola Lōkahi for their guidance and suggestions.
This revision includes a presentation of the Native Hawaiian Health Care System to highlight the culturally appropriate services provided to address health disparities often experienced by Native Hawaiians and their families. There were also some new indicators including public health coverage, uninsured, preventable oral health emergency room visits, overall mortality and overall hospitalization rates.
The Data Book is intended to serve as a source of comparative health statistics on primary care service areas in the State of Hawai‘i. By presenting information on small areas, the document shows the variation among communities in terms of selected risk and resource indicators. This enables communities not only to examine their specific needs, but also to have a sense of their needs within the larger context of their county and the state.
It is my hope that this document will be a useful source of quantitative information for health policy makers, planners and all of us in the community who share a common desire to improve access to primary care, especially for the underserved and vulnerable populations of Hawai‘i.
Your feedback on the information in the Data Book is important to us. Please take a moment and tell us how you used the information in your work.
Danette Wong Tomiyasu, M.B.A. Deputy Director, Health Resources Administration
iv State of Hawai‘i Primary Care Needs Assessment Data Book 2016
Table of ContentsSuMMARY 1
Overview 1Organization of Data Book 1
CHAPTER 1: INTRODuCTION 10Purpose 10History of the Data Book 10Data Sources 11Health Disparities 12Risk Indicators 13Delineation of Primary Care Service Areas 13Map development 17Data Limitations and Interpretation 17
CHAPTER 2: PRIMARY CARE OFFICE, FEDERAL DESIGNATIONS, AND CLINICAL SYSTEMS 19Primary Care Office 19Background on Federal Designations 20Community Health Centers and Clinics 25Native Hawaiian Health Care System 28Hawai‘i Health Systems Corporation and Critical Access Hospitals 30
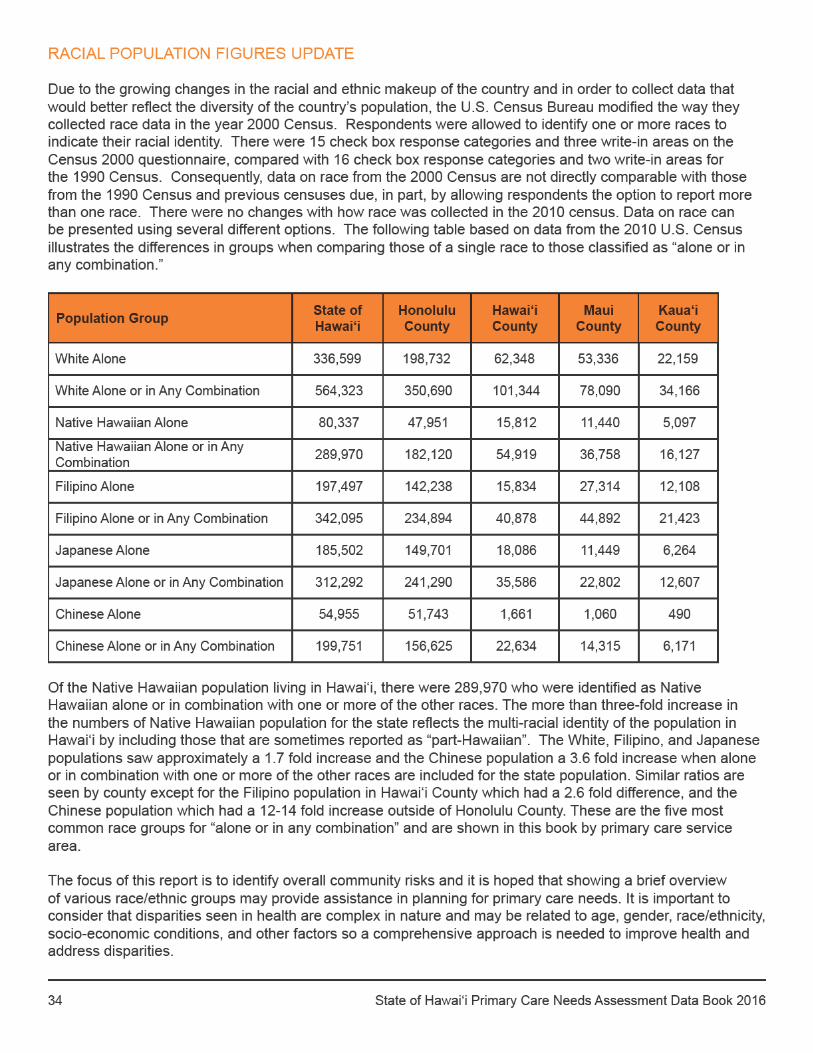
CHAPTER 3: POPuLATION AND SOCIO-ECONOMIC 32Population Indicators 32Socio-economic Indicators 33Racial Population Figures update 34
CHAPTER 4: MATERNAL AND INFANT HEALTH 70Maternal and Infant Health Indicators 70
CHAPTER 5: MORBIDITY 84Morbidity Indicators 85
CHAPTER 6: MORTALITY 98Mortality Indicators 99
CHAPTER 7: ORAL HEALTH 110Oral Health Indicators 111
CHAPTER 8: MENTAL HEALTH & SuBSTANCE RELATED ADMISSIONS 118Mental Illness and Substance Related Indicators 119
LIST OF TABLES 132LIST OF MAPS 133ACKNOWLEDGMENTS 134
State of Hawai‘i Primary Care Needs Assessment Data Book 2016 1
SuMMARY
OVERVIEW
This document provides information for over 50 health and socio-economic indicators spanning the life course by geographic communities in Hawai‘i. There are significant differences between communities and it is important to examine data to better understand why these differences exist. Some differences are pronounced and lend themselves to developing interventions to eliminate disparities and help decrease the overall burden of disease. However, these issues are complex and require multiple strategies to effectively make a difference. This report serves to bring awareness to disparities to help frame future activities to characterize why they exist and what can be done to resolve them.
Recommendations include:1. Further analysis looking at relationships between indicators, particularly variations due to distributions
of poverty and other indicators of socio-economic determinants of health; 2. Improved access and availability of services; 3. Promotion of utilization of primary care services; 4. Development and use of effective culturally appropriate interventions through collaborations with
community partners; and5. Developing collaboration across many sectors and multi-disciplinary approaches to better understand
and raise awareness of the differences.
ORGANIzATION OF DATA BOOK
This section provides summary tables for all the indicators used in this Data Book. The reader is encouraged to review the first chapter of the Data Book to learn how the primary care service areas were defined along with some historical perspective on previous editions and changes with the current edition which has included some new indicators. Each indicator chapter includes information on how the various indicators were defined along with presentation of prevalence estimates or rates in detailed tables and on maps. Specifically, the first chapter defines the primary care service areas, introduces the concept of risk indicators, and identifies key limitations inherent with the data available and their impact on interpretation of the data. The second chapter highlights the Family Health Services Division’s Office of Primary Care and Rural Health and its role in working with community providers to ensure those most at need have access to services. The third chapter summarizes population and socio-economic status indicators for each of the primary care service areas. Chapters four through eight focus on maternal and infant health risk, adult morbidity, the leading causes of death, adult oral health, and mental health.
2 State of Hawai‘i Primary Care Needs Assessment Data Book 2016
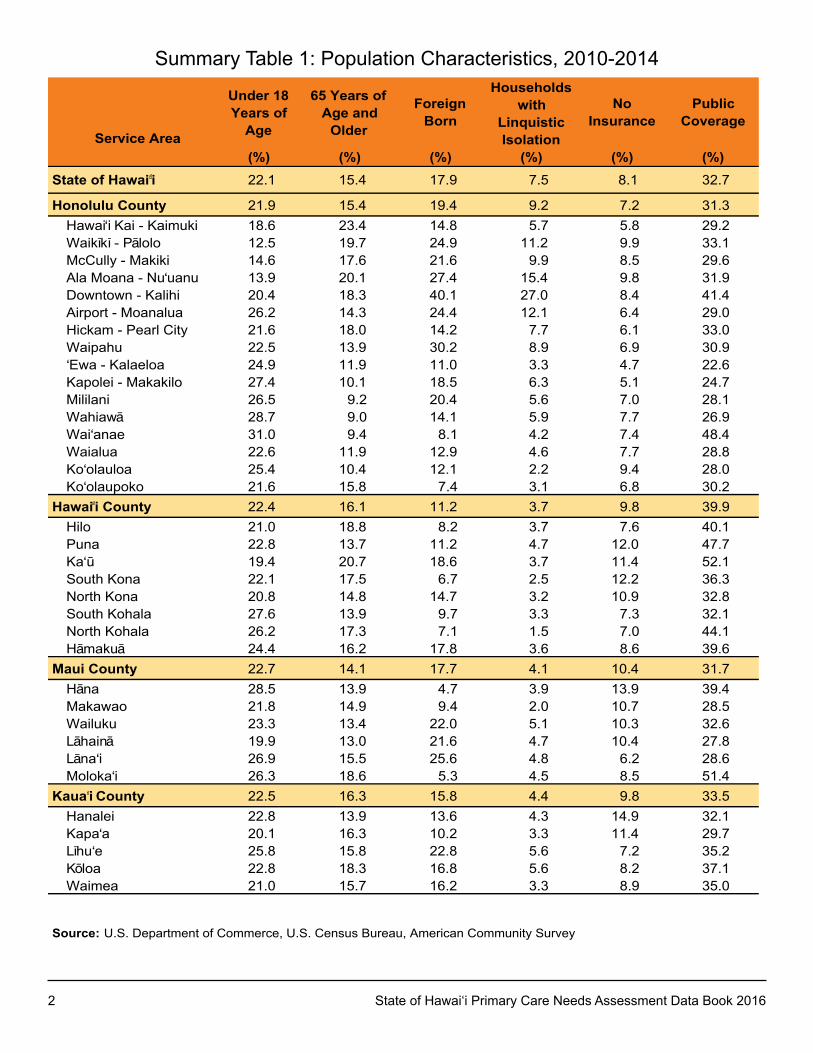
Summary Table 1: Population Characteristics, 2010-2014
Service Area
Under 18Years ofAge
65 Years ofAge andOlder
ForeignBorn
Householdswith
LinquisticIsolation
NoInsurance
PublicCoverage
(%) (%) (%) (%) (%) (%)State of Hawai i 22.1 15.4 17.9 7.5 8.1 32.7
Honolulu County 21.9 15.4 19.4 9.2 7.2 31.3Hawai‘i Kai - Kaimuki 18.6 23.4 14.8 5.7 5.8 29.2Waikïkï - Pälolo 12.5 19.7 24.9 11.2 9.9 33.1McCully - Makiki 14.6 17.6 21.6 9.9 8.5 29.6Ala Moana - Nu‘uanu 13.9 20.1 27.4 15.4 9.8 31.9Downtown - Kalihi 20.4 18.3 40.1 27.0 8.4 41.4Airport - Moanalua 26.2 14.3 24.4 12.1 6.4 29.0Hickam - Pearl City 21.6 18.0 14.2 7.7 6.1 33.0Waipahu 22.5 13.9 30.2 8.9 6.9 30.9‘Ewa - Kalaeloa 24.9 11.9 11.0 3.3 4.7 22.6Kapolei - Makakilo 27.4 10.1 18.5 6.3 5.1 24.7Mililani 26.5 9.2 20.4 5.6 7.0 28.1Wahiawä 28.7 9.0 14.1 5.9 7.7 26.9Wai‘anae 31.0 9.4 8.1 4.2 7.4 48.4Waialua 22.6 11.9 12.9 4.6 7.7 28.8Ko‘olauloa 25.4 10.4 12.1 2.2 9.4 28.0Ko‘olaupoko 21.6 15.8 7.4 3.1 6.8 30.2
Hawai i County 22.4 16.1 11.2 3.7 9.8 39.9Hilo 21.0 18.8 8.2 3.7 7.6 40.1Puna 22.8 13.7 11.2 4.7 12.0 47.7Ka‘ü 19.4 20.7 18.6 3.7 11.4 52.1South Kona 22.1 17.5 6.7 2.5 12.2 36.3North Kona 20.8 14.8 14.7 3.2 10.9 32.8South Kohala 27.6 13.9 9.7 3.3 7.3 32.1North Kohala 26.2 17.3 7.1 1.5 7.0 44.1Hämakuä 24.4 16.2 17.8 3.6 8.6 39.6
Maui County 22.7 14.1 17.7 4.1 10.4 31.7Häna 28.5 13.9 4.7 3.9 13.9 39.4Makawao 21.8 14.9 9.4 2.0 10.7 28.5Wailuku 23.3 13.4 22.0 5.1 10.3 32.6Lähainä 19.9 13.0 21.6 4.7 10.4 27.8Läna‘i 26.9 15.5 25.6 4.8 6.2 28.6Moloka‘i 26.3 18.6 5.3 4.5 8.5 51.4
Kaua i County 22.5 16.3 15.8 4.4 9.8 33.5Hanalei 22.8 13.9 13.6 4.3 14.9 32.1Kapa‘a 20.1 16.3 10.2 3.3 11.4 29.7Lïhu‘e 25.8 15.8 22.8 5.6 7.2 35.2Köloa 22.8 18.3 16.8 5.6 8.2 37.1Waimea 21.0 15.7 16.2 3.3 8.9 35.0
Source: U.S. Department of Commerce, U.S. Census Bureau, American Community Survey
State of Hawai‘i Primary Care Needs Assessment Data Book 2016 3
Service Area
<100% ofFederalPoverty
Level
Children inHouseholdsReceivingAssistance
HouseholdReceiving
SNAP
CivilianLabor ForceUnemployed
Adults withNo HighSchoolDiploma
Average perCapita
Income
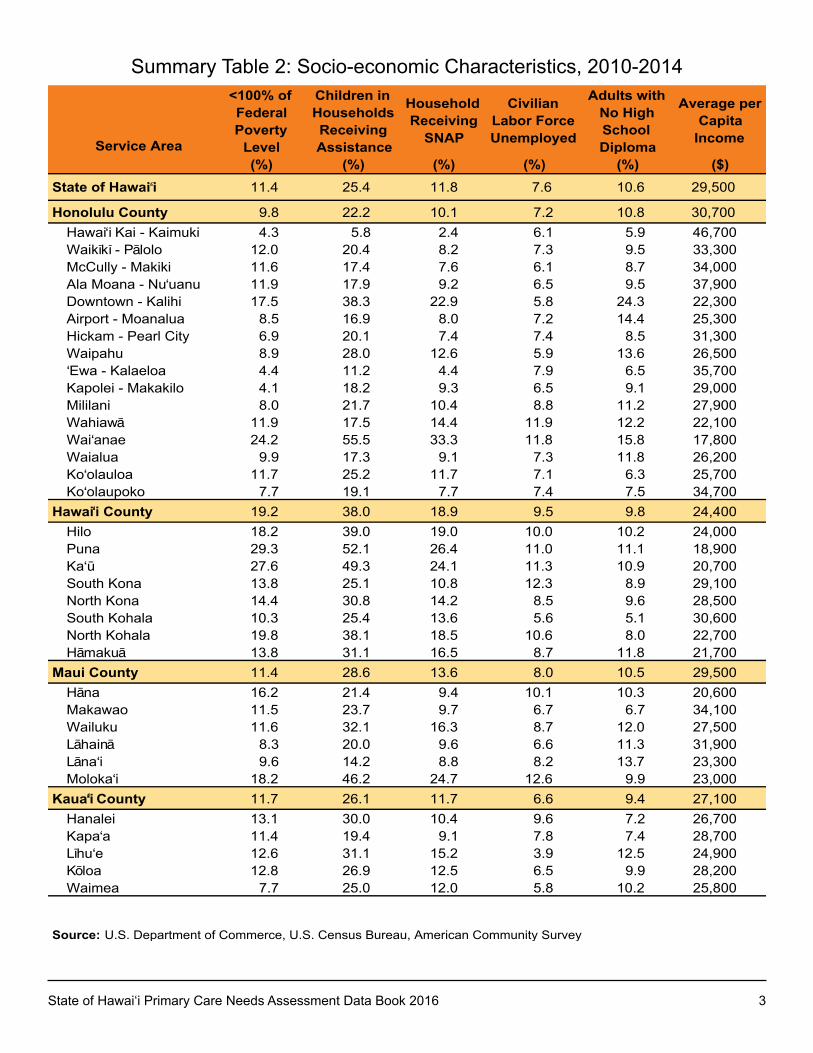
(%) (%) (%) (%) (%) ($)State of Hawai i 11.4 25.4 11.8 7.6 10.6 29,500
Honolulu County 9.8 22.2 10.1 7.2 10.8 30,700Hawai‘i Kai - Kaimuki 4.3 5.8 2.4 6.1 5.9 46,700Waikïkï - Pälolo 12.0 20.4 8.2 7.3 9.5 33,300McCully - Makiki 11.6 17.4 7.6 6.1 8.7 34,000Ala Moana - Nu‘uanu 11.9 17.9 9.2 6.5 9.5 37,900Downtown - Kalihi 17.5 38.3 22.9 5.8 24.3 22,300Airport - Moanalua 8.5 16.9 8.0 7.2 14.4 25,300Hickam - Pearl City 6.9 20.1 7.4 7.4 8.5 31,300Waipahu 8.9 28.0 12.6 5.9 13.6 26,500‘Ewa - Kalaeloa 4.4 11.2 4.4 7.9 6.5 35,700Kapolei - Makakilo 4.1 18.2 9.3 6.5 9.1 29,000Mililani 8.0 21.7 10.4 8.8 11.2 27,900Wahiawä 11.9 17.5 14.4 11.9 12.2 22,100Wai‘anae 24.2 55.5 33.3 11.8 15.8 17,800Waialua 9.9 17.3 9.1 7.3 11.8 26,200Ko‘olauloa 11.7 25.2 11.7 7.1 6.3 25,700Ko‘olaupoko 7.7 19.1 7.7 7.4 7.5 34,700
Hawai‘i County 19.2 38.0 18.9 9.5 9.8 24,400Hilo 18.2 39.0 19.0 10.0 10.2 24,000Puna 29.3 52.1 26.4 11.0 11.1 18,900Ka‘ü 27.6 49.3 24.1 11.3 10.9 20,700South Kona 13.8 25.1 10.8 12.3 8.9 29,100North Kona 14.4 30.8 14.2 8.5 9.6 28,500South Kohala 10.3 25.4 13.6 5.6 5.1 30,600North Kohala 19.8 38.1 18.5 10.6 8.0 22,700Hämakuä 13.8 31.1 16.5 8.7 11.8 21,700
Maui County 11.4 28.6 13.6 8.0 10.5 29,500Häna 16.2 21.4 9.4 10.1 10.3 20,600Makawao 11.5 23.7 9.7 6.7 6.7 34,100Wailuku 11.6 32.1 16.3 8.7 12.0 27,500Lähainä 8.3 20.0 9.6 6.6 11.3 31,900Läna‘i 9.6 14.2 8.8 8.2 13.7 23,300Moloka‘i 18.2 46.2 24.7 12.6 9.9 23,000
Kaua‘i County 11.7 26.1 11.7 6.6 9.4 27,100Hanalei 13.1 30.0 10.4 9.6 7.2 26,700Kapa‘a 11.4 19.4 9.1 7.8 7.4 28,700Lïhu‘e 12.6 31.1 15.2 3.9 12.5 24,900Köloa 12.8 26.9 12.5 6.5 9.9 28,200Waimea 7.7 25.0 12.0 5.8 10.2 25,800
Source: U.S. Department of Commerce, U.S. Census Bureau, American Community Survey
Summary Table 2: Socio-economic Characteristics, 2010-2014
4 State of Hawai‘i Primary Care Needs Assessment Data Book 2016
Service Area
White (alone or in any combination)
Native Hawaiian (alone or in any combination)
Filipino (alone or in any combination)
Japanese (alone or in any combination)
Chinese (alone or in any combination)
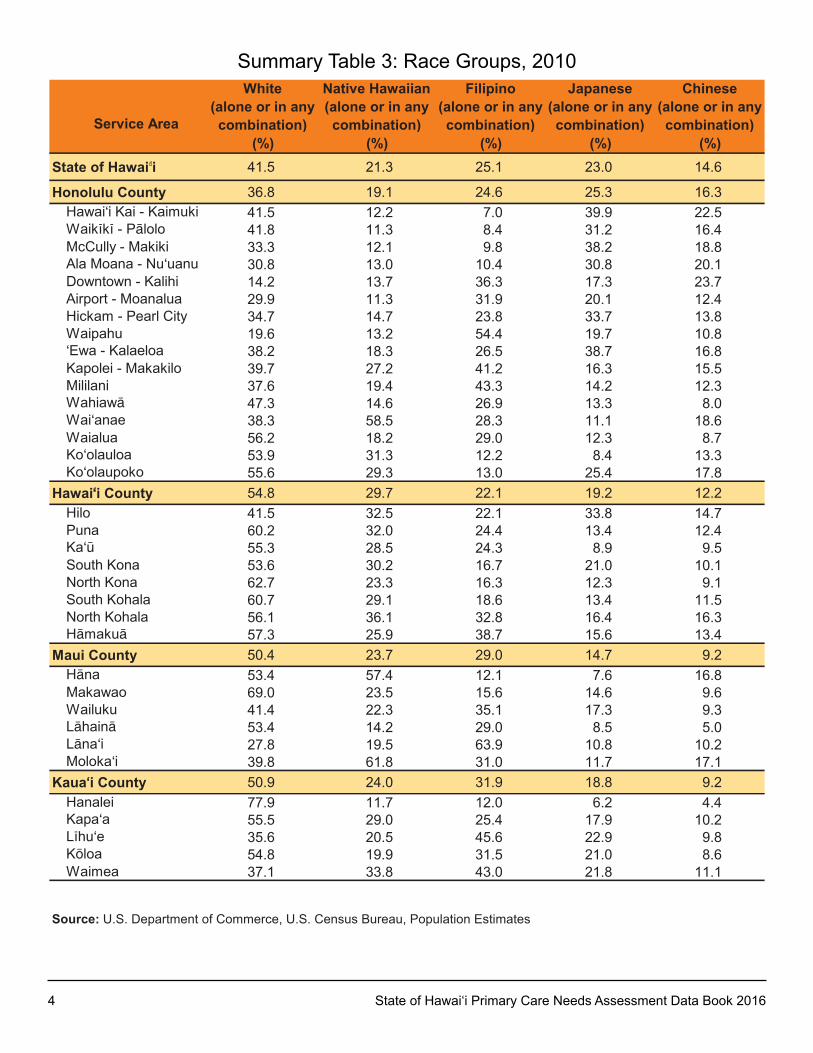
(%) (%) (%) (%) (%)State of Hawai i 41.5 21.3 25.1 23.0 14.6
Honolulu County 36.8 19.1 24.6 25.3 16.3Hawai‘i kai - kaimuki 41.5 12.2 7.0 39.9 22.5Waikïkï - Pälolo 41.8 11.3 8.4 31.2 16.4McCully - Makiki 33.3 12.1 9.8 38.2 18.8Ala Moana - Nu‘uanu 30.8 13.0 10.4 30.8 20.1Downtown - kalihi 14.2 13.7 36.3 17.3 23.7Airport - Moanalua 29.9 11.3 31.9 20.1 12.4Hickam - Pearl City 34.7 14.7 23.8 33.7 13.8Waipahu 19.6 13.2 54.4 19.7 10.8‘Ewa - kalaeloa 38.2 18.3 26.5 38.7 16.8kapolei - Makakilo 39.7 27.2 41.2 16.3 15.5Mililani 37.6 19.4 43.3 14.2 12.3Wahiawä 47.3 14.6 26.9 13.3 8.0Wai‘anae 38.3 58.5 28.3 11.1 18.6Waialua 56.2 18.2 29.0 12.3 8.7ko‘olauloa 53.9 31.3 12.2 8.4 13.3ko‘olaupoko 55.6 29.3 13.0 25.4 17.8
Hawai‘i County 54.8 29.7 22.1 19.2 12.2Hilo 41.5 32.5 22.1 33.8 14.7Puna 60.2 32.0 24.4 13.4 12.4ka‘ü 55.3 28.5 24.3 8.9 9.5South kona 53.6 30.2 16.7 21.0 10.1North kona 62.7 23.3 16.3 12.3 9.1South kohala 60.7 29.1 18.6 13.4 11.5North kohala 56.1 36.1 32.8 16.4 16.3Hämakuä 57.3 25.9 38.7 15.6 13.4
Maui County 50.4 23.7 29.0 14.7 9.2Häna 53.4 57.4 12.1 7.6 16.8Makawao 69.0 23.5 15.6 14.6 9.6Wailuku 41.4 22.3 35.1 17.3 9.3Lähainä 53.4 14.2 29.0 8.5 5.0Läna‘i 27.8 19.5 63.9 10.8 10.2Moloka‘i 39.8 61.8 31.0 11.7 17.1
Kaua‘i County 50.9 24.0 31.9 18.8 9.2Hanalei 77.9 11.7 12.0 6.2 4.4kapa‘a 55.5 29.0 25.4 17.9 10.2Lïhu‘e 35.6 20.5 45.6 22.9 9.8köloa 54.8 19.9 31.5 21.0 8.6Waimea 37.1 33.8 43.0 21.8 11.1
Source: u.S. Department of Commerce, u.S. Census Bureau, Population Estimates
Summary Table 3: Race Groups, 2010
State of Hawai‘i Primary Care Needs Assessment Data Book 2016 5
Service Area
Crude BirthRate
InfantMortalityRate*
Less ThanAdequate
Prenatal CareUtilization
Low BirthWeight
BirthsUnder 18Years ofAge
Motherswith Pre-ExistingMedical
Conditions(per 1,000) (per 1,000) (%) (%) (%) (%)
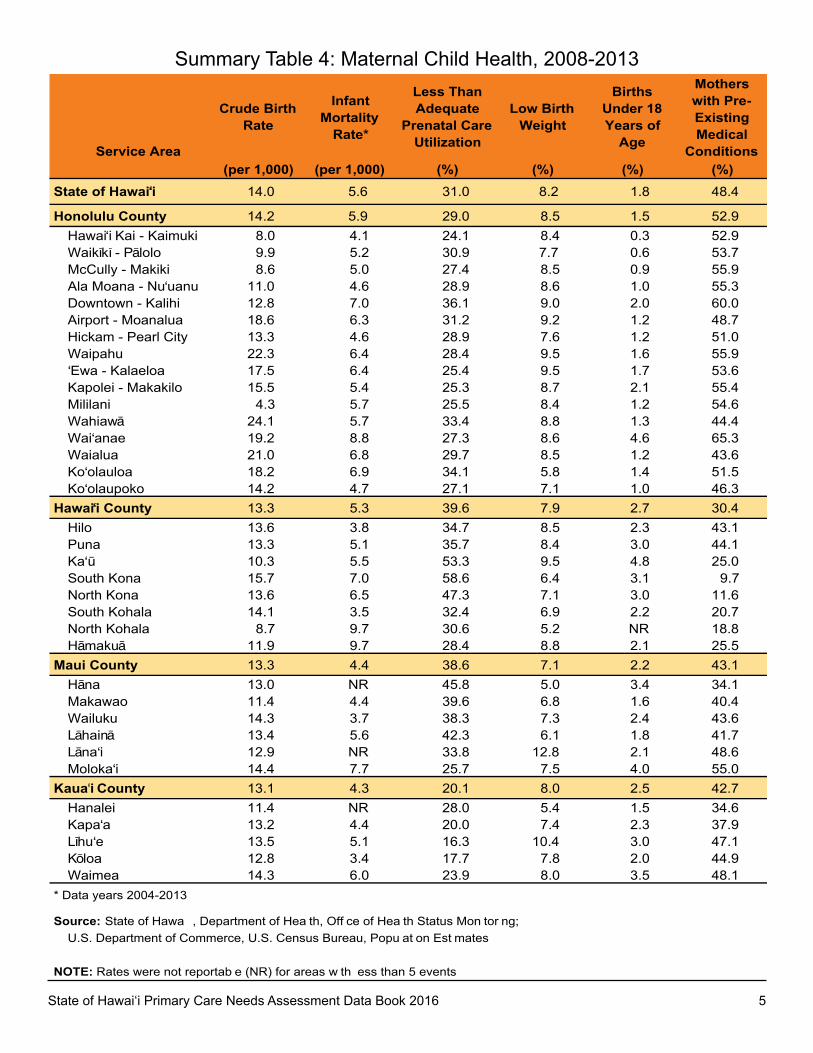
State of Hawai‘i 14.0 5.6 31.0 8.2 1.8 48.4
Honolulu County 14.2 5.9 29.0 8.5 1.5 52.9Hawai‘i Kai - Kaimuki 8.0 4.1 24.1 8.4 0.3 52.9Waikïkï - Pälolo 9.9 5.2 30.9 7.7 0.6 53.7McCully - Makiki 8.6 5.0 27.4 8.5 0.9 55.9Ala Moana - Nu‘uanu 11.0 4.6 28.9 8.6 1.0 55.3Downtown - Kalihi 12.8 7.0 36.1 9.0 2.0 60.0Airport - Moanalua 18.6 6.3 31.2 9.2 1.2 48.7Hickam - Pearl City 13.3 4.6 28.9 7.6 1.2 51.0Waipahu 22.3 6.4 28.4 9.5 1.6 55.9‘Ewa - Kalaeloa 17.5 6.4 25.4 9.5 1.7 53.6Kapolei - Makakilo 15.5 5.4 25.3 8.7 2.1 55.4Mililani 4.3 5.7 25.5 8.4 1.2 54.6Wahiawä 24.1 5.7 33.4 8.8 1.3 44.4Wai‘anae 19.2 8.8 27.3 8.6 4.6 65.3Waialua 21.0 6.8 29.7 8.5 1.2 43.6Ko‘olauloa 18.2 6.9 34.1 5.8 1.4 51.5Ko‘olaupoko 14.2 4.7 27.1 7.1 1.0 46.3
Hawai‘i County 13.3 5.3 39.6 7.9 2.7 30.4Hilo 13.6 3.8 34.7 8.5 2.3 43.1Puna 13.3 5.1 35.7 8.4 3.0 44.1Ka‘ü 10.3 5.5 53.3 9.5 4.8 25.0South Kona 15.7 7.0 58.6 6.4 3.1 9.7North Kona 13.6 6.5 47.3 7.1 3.0 11.6South Kohala 14.1 3.5 32.4 6.9 2.2 20.7North Kohala 8.7 9.7 30.6 5.2 NR 18.8Hämakuä 11.9 9.7 28.4 8.8 2.1 25.5
Maui County 13.3 4.4 38.6 7.1 2.2 43.1Häna 13.0 NR 45.8 5.0 3.4 34.1Makawao 11.4 4.4 39.6 6.8 1.6 40.4Wailuku 14.3 3.7 38.3 7.3 2.4 43.6Lähainä 13.4 5.6 42.3 6.1 1.8 41.7Läna‘i 12.9 NR 33.8 12.8 2.1 48.6Moloka‘i 14.4 7.7 25.7 7.5 4.0 55.0
Kaua i County 13.1 4.3 20.1 8.0 2.5 42.7Hanalei 11.4 NR 28.0 5.4 1.5 34.6Kapa‘a 13.2 4.4 20.0 7.4 2.3 37.9Lïhu‘e 13.5 5.1 16.3 10.4 3.0 47.1Köloa 12.8 3.4 17.7 7.8 2.0 44.9Waimea 14.3 6.0 23.9 8.0 3.5 48.1
* Data years 2004-2013
Source: State of Hawa , Department of Hea th, Off ce of Hea th Status Mon tor ng;;U.S. Department of Commerce, U.S. Census Bureau, Popu at on Est mates
NOTE: Rates were not reportab e (NR) for areas w th ess than 5 events
Summary Table 4: Maternal Child Health, 2008-2013
6 State of Hawai‘i Primary Care Needs Assessment Data Book 2016
Service Area
Adults who are Obese
Adults who Smoke
Adults who are Heavy Drinkers
Adults with No Physical
Activity
Adults with Diabetes
Adults with High Blood Pressure*
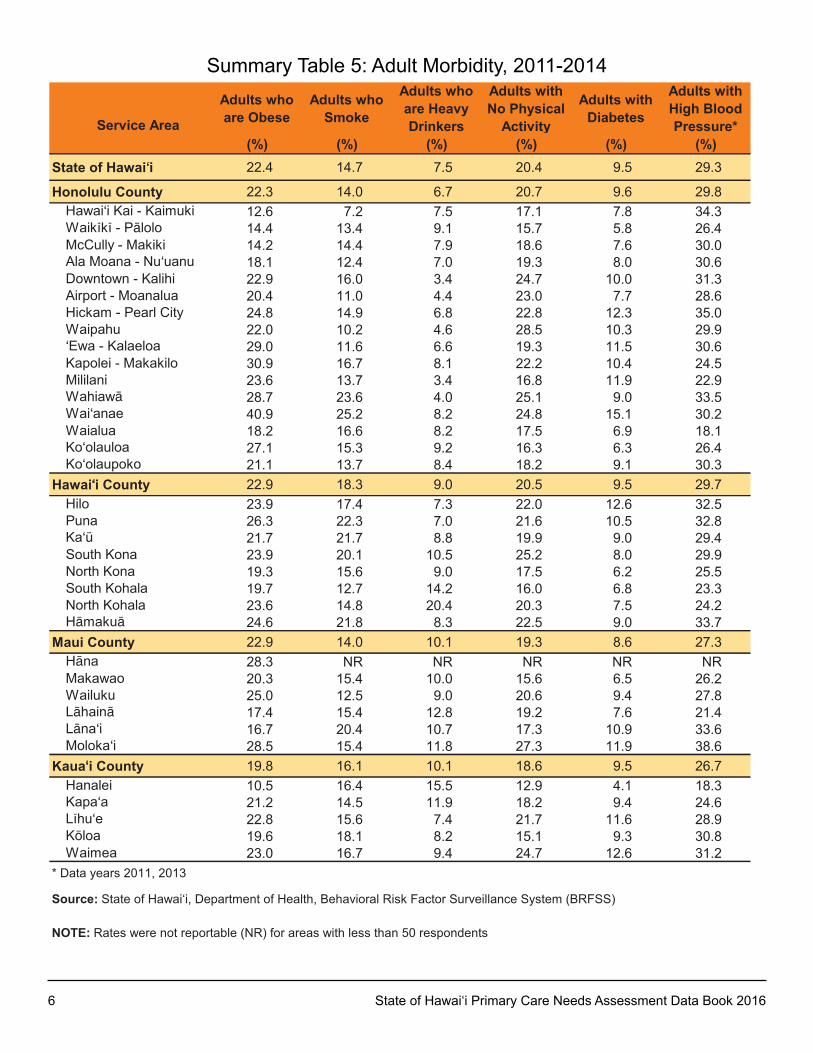
(%) (%) (%) (%) (%) (%)State of Hawai‘i 22.4 14.7 7.5 20.4 9.5 29.3
Honolulu County 22.3 14.0 6.7 20.7 9.6 29.8Hawai‘i kai - kaimuki 12.6 7.2 7.5 17.1 7.8 34.3Waikïkï - Pälolo 14.4 13.4 9.1 15.7 5.8 26.4McCully - Makiki 14.2 14.4 7.9 18.6 7.6 30.0Ala Moana - Nu‘uanu 18.1 12.4 7.0 19.3 8.0 30.6Downtown - kalihi 22.9 16.0 3.4 24.7 10.0 31.3Airport - Moanalua 20.4 11.0 4.4 23.0 7.7 28.6Hickam - Pearl City 24.8 14.9 6.8 22.8 12.3 35.0Waipahu 22.0 10.2 4.6 28.5 10.3 29.9‘Ewa - kalaeloa 29.0 11.6 6.6 19.3 11.5 30.6kapolei - Makakilo 30.9 16.7 8.1 22.2 10.4 24.5Mililani 23.6 13.7 3.4 16.8 11.9 22.9Wahiawä 28.7 23.6 4.0 25.1 9.0 33.5Wai‘anae 40.9 25.2 8.2 24.8 15.1 30.2Waialua 18.2 16.6 8.2 17.5 6.9 18.1ko‘olauloa 27.1 15.3 9.2 16.3 6.3 26.4ko‘olaupoko 21.1 13.7 8.4 18.2 9.1 30.3
Hawai‘i County 22.9 18.3 9.0 20.5 9.5 29.7Hilo 23.9 17.4 7.3 22.0 12.6 32.5Puna 26.3 22.3 7.0 21.6 10.5 32.8ka‘ü 21.7 21.7 8.8 19.9 9.0 29.4South kona 23.9 20.1 10.5 25.2 8.0 29.9North kona 19.3 15.6 9.0 17.5 6.2 25.5South kohala 19.7 12.7 14.2 16.0 6.8 23.3North kohala 23.6 14.8 20.4 20.3 7.5 24.2Hämakuä 24.6 21.8 8.3 22.5 9.0 33.7
Maui County 22.9 14.0 10.1 19.3 8.6 27.3Häna 28.3 NR NR NR NR NRMakawao 20.3 15.4 10.0 15.6 6.5 26.2Wailuku 25.0 12.5 9.0 20.6 9.4 27.8Lähainä 17.4 15.4 12.8 19.2 7.6 21.4Läna‘i 16.7 20.4 10.7 17.3 10.9 33.6Moloka‘i 28.5 15.4 11.8 27.3 11.9 38.6
Kaua‘i County 19.8 16.1 10.1 18.6 9.5 26.7Hanalei 10.5 16.4 15.5 12.9 4.1 18.3kapa‘a 21.2 14.5 11.9 18.2 9.4 24.6Lïhu‘e 22.8 15.6 7.4 21.7 11.6 28.9köloa 19.6 18.1 8.2 15.1 9.3 30.8Waimea 23.0 16.7 9.4 24.7 12.6 31.2
* Data years 2011, 2013
Source: State of Hawai‘i, Department of Health, Behavioral Risk Factor Surveillance System (BRFSS)
NOTE: Rates were not reportable (NR) for areas with less than 50 respondents
Summary Table 5: Adult Morbidity, 2011-2014
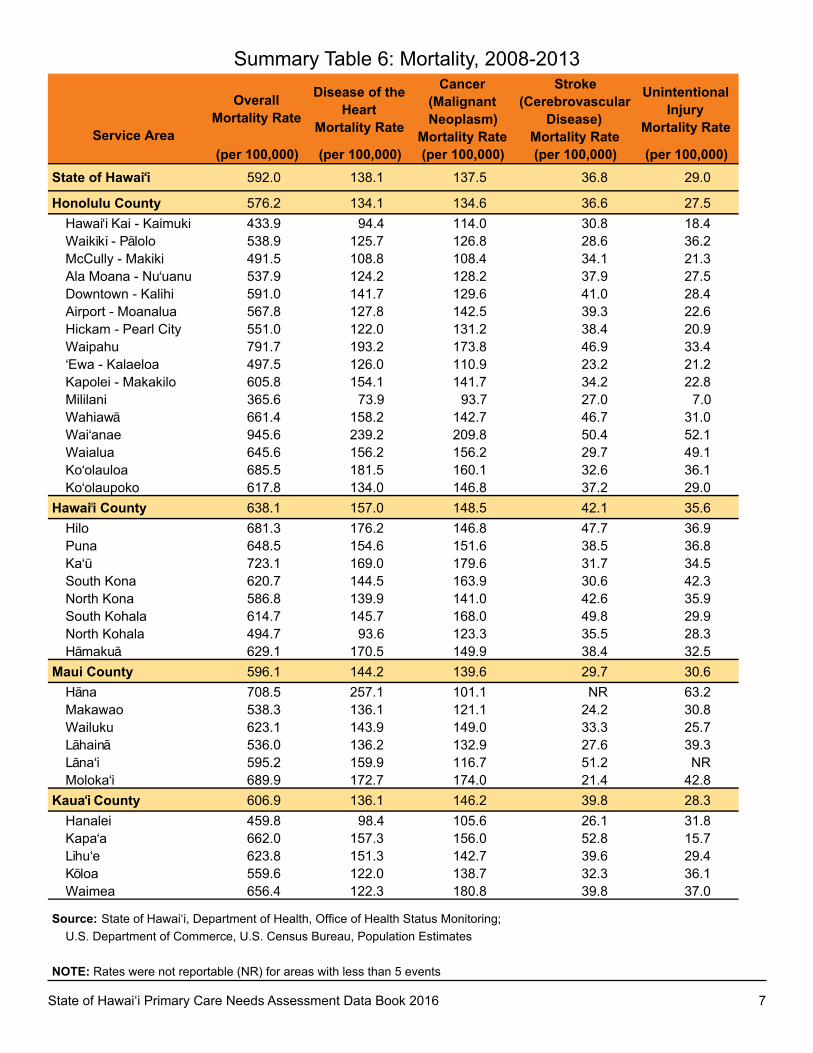
State of Hawai‘i Primary Care Needs Assessment Data Book 2016 7
Service Area
Overall Mortality Rate
Disease of the Heart
Mortality Rate
Cancer (Malignant Neoplasm)
Mortality Rate
Stroke (Cerebrovascular
Disease) Mortality Rate
Unintentional Injury
Mortality Rate
(per 100,000) (per 100,000) (per 100,000) (per 100,000) (per 100,000)State of Hawai‘i 592.0 138.1 137.5 36.8 29.0
Honolulu County 576.2 134.1 134.6 36.6 27.5Hawai‘i Kai - Kaimuki 433.9 94.4 114.0 30.8 18.4Waikïkï - Pälolo 538.9 125.7 126.8 28.6 36.2McCully - Makiki 491.5 108.8 108.4 34.1 21.3Ala Moana - Nu‘uanu 537.9 124.2 128.2 37.9 27.5Downtown - Kalihi 591.0 141.7 129.6 41.0 28.4Airport - Moanalua 567.8 127.8 142.5 39.3 22.6Hickam - Pearl City 551.0 122.0 131.2 38.4 20.9Waipahu 791.7 193.2 173.8 46.9 33.4‘Ewa - Kalaeloa 497.5 126.0 110.9 23.2 21.2Kapolei - Makakilo 605.8 154.1 141.7 34.2 22.8Mililani 365.6 73.9 93.7 27.0 7.0Wahiawä 661.4 158.2 142.7 46.7 31.0Wai‘anae 945.6 239.2 209.8 50.4 52.1Waialua 645.6 156.2 156.2 29.7 49.1Ko‘olauloa 685.5 181.5 160.1 32.6 36.1Ko‘olaupoko 617.8 134.0 146.8 37.2 29.0
Hawai i County 638.1 157.0 148.5 42.1 35.6Hilo 681.3 176.2 146.8 47.7 36.9Puna 648.5 154.6 151.6 38.5 36.8Ka‘ü 723.1 169.0 179.6 31.7 34.5South Kona 620.7 144.5 163.9 30.6 42.3North Kona 586.8 139.9 141.0 42.6 35.9South Kohala 614.7 145.7 168.0 49.8 29.9North Kohala 494.7 93.6 123.3 35.5 28.3Hämakuä 629.1 170.5 149.9 38.4 32.5
Maui County 596.1 144.2 139.6 29.7 30.6Häna 708.5 257.1 101.1 NR 63.2Makawao 538.3 136.1 121.1 24.2 30.8Wailuku 623.1 143.9 149.0 33.3 25.7Lähainä 536.0 136.2 132.9 27.6 39.3Läna‘i 595.2 159.9 116.7 51.2 NRMoloka‘i 689.9 172.7 174.0 21.4 42.8
Kaua‘i County 606.9 136.1 146.2 39.8 28.3Hanalei 459.8 98.4 105.6 26.1 31.8Kapa‘a 662.0 157.3 156.0 52.8 15.7Lïhu‘e 623.8 151.3 142.7 39.6 29.4Köloa 559.6 122.0 138.7 32.3 36.1Waimea 656.4 122.3 180.8 39.8 37.0
Source: State of Hawai‘i, Department of Health, Office of Health Status Monitoring;U.S. Department of Commerce, U.S. Census Bureau, Population Estimates
NOTE: Rates were not reportable (NR) for areas with less than 5 events
Summary Table 6: Mortality, 2008-2013

8 State of Hawai‘i Primary Care Needs Assessment Data Book 2016
Service Area
Adults with NoDental Visit*
Adults withPermanent Teeth
Removed*
Oral HealthEmergency Room
Visits Rate
OverallHospitalization
Rate(%) (%) (per 10,000) (per 10,000)
State of Hawai i 29.0 42.4 16.8 741.5
Honolulu County 27.2 41.0 11.4 739.6Hawai‘i Kai - Kaimuki 18.9 35.7 5.1 650.6Waikïkï - Pälolo 27.3 37.6 10.6 570.1McCully - Makiki 29.0 42.6 11.1 727.1Ala Moana - Nu‘uanu 27.0 39.2 14.9 740.3Downtown - Kalihi 32.1 47.0 17.8 871.5Airport - Moanalua 29.0 41.5 11.0 712.5Hickam - Pearl City 21.1 43.4 8.3 687.5Waipahu 27.2 37.5 10.7 747.8‘Ewa - Kalaeloa 25.5 39.3 9.6 697.8Kapolei - Makakilo 30.6 38.1 9.9 655.6Mililani 21.6 42.4 5.0 573.6Wahiawä 39.5 43.5 21.9 771.3Wai‘anae 41.9 54.8 11.4 1,006.6Waialua 38.1 38.0 19.2 737.4Ko‘olauloa 30.8 44.6 21.0 807.6Ko‘olaupoko 25.5 39.4 10.3 808.7
Hawai‘i County 34.6 46.3 36.0 786.1Hilo 31.6 46.4 39.6 913.4Puna 40.6 45.7 21.8 490.7Ka‘ü 37.4 46.9 82.2 1,845.5South Kona 37.4 57.8 63.2 1,110.8North Kona 32.2 40.1 31.3 746.8South Kohala 32.7 46.6 26.6 659.0North Kohala 25.1 48.0 48.0 650.4Hämakuä 35.4 51.8 42.9 703.6
Maui County 31.9 45.3 17.8 700.1Häna NR NR NR 590.7Makawao 32.0 45.0 18.7 640.2Wailuku 30.2 43.9 18.8 749.5Lähainä 32.1 50.3 9.0 638.7Läna‘i 51.0 52.2 11.2 590.6Moloka‘i 29.3 49.1 36.1 780.2
Kaua‘i County 32.2 46.1 38.7 742.0Hanalei 27.7 48.2 26.8 570.0Kapa‘a 32.4 44.0 54.7 676.6Lïhu‘e 36.8 46.8 41.1 871.9Köloa 27.2 45.8 24.7 748.1Waimea 35.0 49.4 30.7 833.2
* Data years 2012, 2014
Source: State of Hawai‘i, Department of Health, Behavioral Risk Factor Surveillance System (BRFSS);;Hawai‘I Health Information Corporation (HHIC)
NOTE: Rates were not reportable (NR) for areas with less than 50 respondents for "No dental visits and Permanent teethremoved measures", while rates were not reportable (NR) for areas with less than 10 events for "Emergency Room Visits.
Summary Table 7: Oral Health and Overall Hospital Admissions, 2010-2014
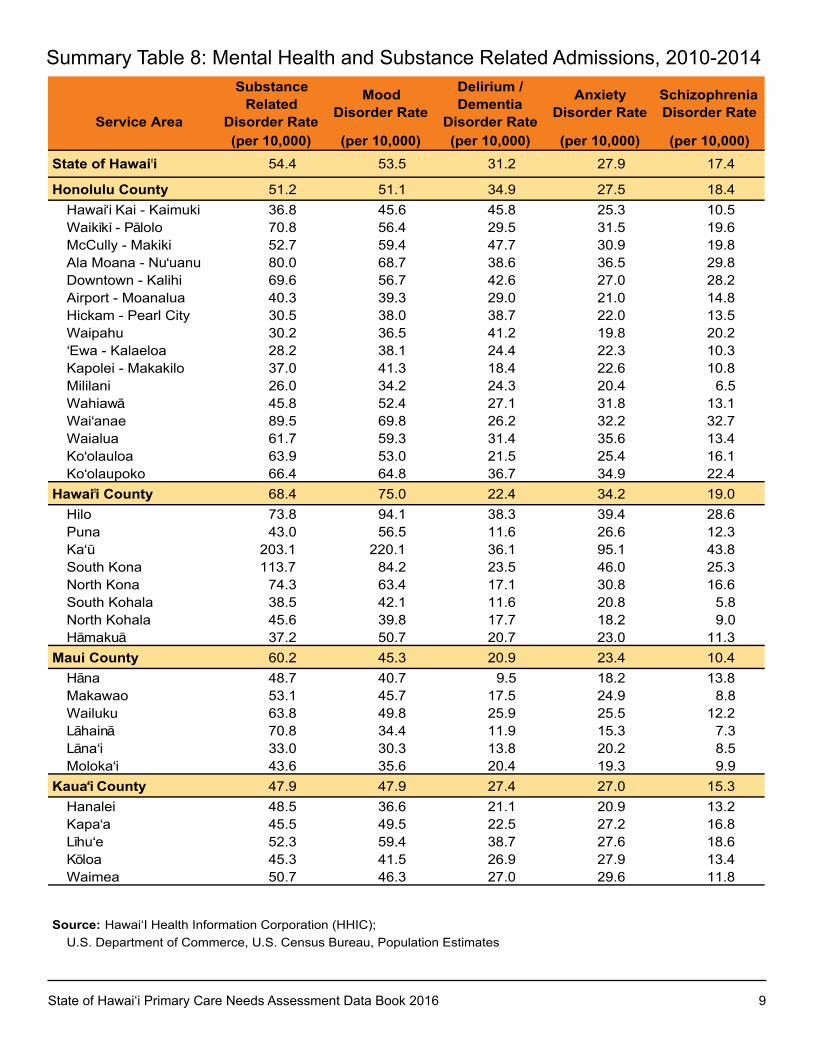
State of Hawai‘i Primary Care Needs Assessment Data Book 2016 9
Service Area
SubstanceRelated
Disorder Rate
MoodDisorder Rate
Delirium /Dementia
Disorder Rate
AnxietyDisorder Rate
SchizophreniaDisorder Rate
(per 10,000) (per 10,000) (per 10,000) (per 10,000) (per 10,000)State of Hawai i 54.4 53.5 31.2 27.9 17.4
Honolulu County 51.2 51.1 34.9 27.5 18.4Hawai‘i Kai - Kaimuki 36.8 45.6 45.8 25.3 10.5Waikïkï - Pälolo 70.8 56.4 29.5 31.5 19.6McCully - Makiki 52.7 59.4 47.7 30.9 19.8Ala Moana - Nu‘uanu 80.0 68.7 38.6 36.5 29.8Downtown - Kalihi 69.6 56.7 42.6 27.0 28.2Airport - Moanalua 40.3 39.3 29.0 21.0 14.8Hickam - Pearl City 30.5 38.0 38.7 22.0 13.5Waipahu 30.2 36.5 41.2 19.8 20.2‘Ewa - Kalaeloa 28.2 38.1 24.4 22.3 10.3Kapolei - Makakilo 37.0 41.3 18.4 22.6 10.8Mililani 26.0 34.2 24.3 20.4 6.5Wahiawä 45.8 52.4 27.1 31.8 13.1Wai‘anae 89.5 69.8 26.2 32.2 32.7Waialua 61.7 59.3 31.4 35.6 13.4Ko‘olauloa 63.9 53.0 21.5 25.4 16.1Ko‘olaupoko 66.4 64.8 36.7 34.9 22.4
Hawai i County 68.4 75.0 22.4 34.2 19.0Hilo 73.8 94.1 38.3 39.4 28.6Puna 43.0 56.5 11.6 26.6 12.3Ka‘ü 203.1 220.1 36.1 95.1 43.8South Kona 113.7 84.2 23.5 46.0 25.3North Kona 74.3 63.4 17.1 30.8 16.6South Kohala 38.5 42.1 11.6 20.8 5.8North Kohala 45.6 39.8 17.7 18.2 9.0Hämakuä 37.2 50.7 20.7 23.0 11.3
Maui County 60.2 45.3 20.9 23.4 10.4Häna 48.7 40.7 9.5 18.2 13.8Makawao 53.1 45.7 17.5 24.9 8.8Wailuku 63.8 49.8 25.9 25.5 12.2Lähainä 70.8 34.4 11.9 15.3 7.3Läna‘i 33.0 30.3 13.8 20.2 8.5Moloka‘i 43.6 35.6 20.4 19.3 9.9
Kaua‘i County 47.9 47.9 27.4 27.0 15.3Hanalei 48.5 36.6 21.1 20.9 13.2Kapa‘a 45.5 49.5 22.5 27.2 16.8Lïhu‘e 52.3 59.4 38.7 27.6 18.6Köloa 45.3 41.5 26.9 27.9 13.4Waimea 50.7 46.3 27.0 29.6 11.8
Source: Hawai‘I Health Information Corporation (HHIC);;U.S. Department of Commerce, U.S. Census Bureau, Population Estimates
Summary Table 8: Mental Health and Substance Related Admissions, 2010-2014
10 State of Hawai‘i Primary Care Needs Assessment Data Book 2016
CHAPTER 1: INTRODuCTIONPuRPOSE
The Primary Care Needs Assessment Data Book is a compendium of comparative health statistics on 35 primary care service areas in the State of Hawai‘i. This Data Book was developed to assist policy makers, health planners, health care professionals and community members in making assessments of the relative health risks and primary health care needs of these communities. This Data Book demonstrates significant differences in risks related to geography, but it is important to be aware there are other characteristics such as race/ethnicity, gender, age, education, poverty, and other factors that may explain observed differences. In strategic planning to address differences at the community level, it is essential to consider the impact of all measures due to the complex nature of disparities. It is hoped that the Data Book continues to be a valuable resource on population-level measures of risks along the life course from birth until death.
HISTORY OF THE DATA BOOk
In the early 1990’s, meetings were held to develop the Primary Care Access Plan for the State of Hawai‘i. Stakeholders from the public and private sectors were brought together to identify primary care needs and recommend appropriate allocation of resources to ensure the best possible primary care services for the people of Hawai‘i. In 1994, the Primary Care Access Plan was released and included the development of a Primary Care Needs Assessment Data Book that could be used for strategic planning purposes. Primary care is defined in this plan to be the integration of services that promote and preserve health, prevent disease, injury and disabilities, and provide a regular source of care for acute and chronic illness and disabilities. Primary care providers are seen as the entry point into the larger health services system. The primary care provider incorporates community needs, risks, strengths, resources, and cultures into clinical practice while sharing an ongoing responsibility for health care with each family.
The earliest editions of this Data Book primarily addressed maternal and infant health and socio-economic risks, but over the years the focus was expanded to include more comprehensive indicators reflecting the diversity of primary care. The 2005 edition introduced several new indicators including smoking, diabetes, obesity, stroke and heart disease mortality, and some measures of adult oral health. The 2009 revision reorganized and broadened the scope by including several new risk factors for chronic disease and cancer mortality. The 2012 edition added information on hospital discharge data related to mental health and substance use disorders. In addition, some of the socio-economic data was changed to reflect data available in the American Community Survey. There was also a change from previous versions in which the three largest areas in Honolulu County were expanded to 11 areas to show a finer level of detail. These three original areas were maintained in that edition for historical purposes and to highlight the diversity found in these areas. In the current, 2016 version, these three historical areas have been removed to simplify presentation of the data. This edition represents a change from previous versions with a change to hospital admission rate calculations from simple proportion of hospital admissions that first occurred in the last Data Book released in 2012.
Additional indicators were added including public coverage for health insurance, no health insurance, overall age adjusted mortality rate, preventable emergency department visit rate related to oral health, and an overall hospital admission rate. There were also some changes in the presentation of data to clarify the community level maps including consolidation of the three separate Health Professional Shortage Designations into one map. The addition of the Native Hawaiian Health Care System was added as a federally funded project that provides important services to high risk populations in the state.
Comments on the usefulness of the information and suggestions for new indicators were obtained through feedback surveys, presentations to the Hawai‘i Primary Care Association, and through an online survey sent to those who were mailed a copy of the previous edition.
State of Hawai‘i Primary Care Needs Assessment Data Book 2016 11
DATA SOuRCES
Data was collected from public and unpublished files by several government agencies, namely: the United States Bureau of the Census, for socio-economic and demographic data; the Hawai‘i Department of Health, Office of Health Status Monitoring (OHSM), for vital statistics data; the Behavioral Risk Factor Surveillance System Program, for adult chronic disease risk factors and oral health data; and the Hawai‘i Health Information Corporation, for oral health emergency room, substance use and mental health hospitalization data.
United States Bureau of the Census
The u.S. Constitution requires the u.S. Census to count every resident in the united States every 10 years. The last Census was done in 2010. Census information affects the numbers of seats each state occupies in the u.S. House of Representatives. Data from the Census can be analyzed to determine demographic information such as number of residents, their ages, their race/ethnicity, family composition, and other measures living in a particular census tract. The Census no longer collects specific information on what used to be found on the long form. The American Community Survey (ACS) was expanded to capture most of this information. The ACS is collected on an annual basis and provides data at the census tract level on a rolling basis rather than every 10 years. For this Data Book, a five year (2010-2014) aggregate is used to report out information based on census tract estimates.
Vital Statistics
The collection of Vital Statistics data including births, deaths, and marriages in the state is coordinated by the Office of Health Status Monitoring in the Hawai‘i Department of Health. This data is used to report on indicators of health status for the state. The birth certificate data includes demographic and other characteristics about the infant, the parents, and factors related to the pregnancy and delivery. The information from the death certificate includes demographic and some basic information related to the cause and circumstance of the death. More information on the Hawai‘i vital statistics data is available online at http://hawaii.gov/health/statistics/vital-statistics/index.html.
Behavioral Risk Factor Surveillance System Survey
The Behavioral Risk Factor Surveillance System (BRFSS) is a state-based survey that collects information on adult health risk behaviors, preventive health practices, and health care access primarily related to chronic disease and injury. The BRFSS, first implemented in Hawai‘i in 1986, is funded by the Centers for Disease Control and Prevention. It is a disproportionate stratified random-digit telephone-based survey that provides weighted estimates to reflect those living in Hawai‘i. In 2011, there was a change in weighting methodology so estimates are not comparable to earlier periods and so only data from 2011-2014 were available for use. In this Data Book, all estimates based on the BRFSS data for the population size and the number of individuals with a particular indicator are rounded to the nearest 100. More information on the Hawai‘i BRFSS data is available online at http://hawaii.gov/health/statistics/brfss/brfss/index.html.
Hawai‘i Health Information Corporation
The mission of the Hawai‘i Health Information Corporation (HHIC) is to collect, analyze, and disseminate statewide health information in support of efforts to continuously improve the quality and cost-efficiency of health care services provided to the people of Hawai‘i. HHIC is a private, not-for-profit corporation established in 1994 by the state’s major private health care organizations. HHIC maintains one of the largest healthcare databases in Hawai‘i, including inpatient, emergency department, and financial data. As an independent organization, HHIC has collected inpatient hospital data from licensed acute care hospitals in Hawai‘i since 1995. The inpatient database currently includes approximately two million patient records. In 2000, Emergency Department (ED) data was added to HHIC’s data repository and currently contains three million patient records. More information on HHIC and use of their data is available online at http://hhic.org.
12 State of Hawai‘i Primary Care Needs Assessment Data Book 2016
HEALTH DISPARITIES
When looking at overall population level health, it’s important to acknowledge that there are some groups in that population that may have differences when compared to other groups. The term disparity is often used to portray differences in health as being unjust and that a particular population group is at a disadvantage or suffering an increase burden of disease due to the differences. These differences could be related to multiple factors, which may include potentially (changeable, adjustable) modifiable factors such as inadequate access to health care services, socio-economic differences, education, health behaviors, and having a medical home. Whereas, non-modifiable factors could include population groups defined by age, race/ethnicity, and gender.
Often disparity research focuses on highlighting disparities among the non-modifiable factors such as race/ethnicity as it is relatively easy to measure and a simple way to categorize people. This simple categorization gets much more complicated when applied to a society with the diversity found in Hawai‘i where more than a third of mothers who have a live birth and nearly a third of fathers report belonging to more than one of the five federal race groups (White, Black, Asian, Native Hawaiian and Other Pacific Islander, American Indian and Alaskan Native).1 However, it’s important to consider that race/ethnicity perhaps represents a cascade of different factors including modifiable behaviors common for particular subgroups. This contrasts with some conditions that may have an underlying genetic reason. It is imperative to assess if additional factors may be contributing to the disparity. It is also important to look at what factors may be contributing to better health outcomes among groups to determine if certain protective factors could benefit disadvantaged groups. Often, the true underlying reasons for disparities are not well characterized, but it is crucial to continue to monitor disparate populations and determine if these groups are improving or continuing to suffer an increased burden compared to others. understandings disparities can lead to appropriate interventions to improve the overall health of the population.
The Centers for Disease Control and Prevention (CDC) developed National Healthy People Objectives and Goals to improve the health of society. Fundamental to reaching these objectives will require the elimination of long-standing and pervasive health disparities related to race/ethnicity, socioeconomic status, and other key dimensions of health. The Determinants of Health are central to address these concerns and are defined in Healthy People 2020 in five categories: 1) Policy Making; 2) Social Factors; 3) Health Services; 4) Individual Behavior; and 5) Biology and Genetics.
Determinants of Health reach beyond the boundaries of traditional health care and public health sectors. Sectors such as education, housing, transportation, agriculture, and environment can be chief allies in improving population health. The interrelationships among these influence individual and population health so interventions that target multiple Determinants of Health are more likely to be effective.2
In this report, estimates are reported at three distinct geographic levels: 1) Primary care service area; 2) County; and 3) State. Differences across the levels are important to understand, but it’s also important to look at other Determinants of Health that can contribute to disparities such as age, race/ethnicity, education, geography, insurance status, household federal poverty level, and medical home. The importance of more in depth analyses such as qualitative methods are often needed to understand the underlying reasons why a particular disparity exists. This report provides a lot of information and the reader is encouraged to use it in conjunction with other resources when planning and implementing public health activities.
1 Hamilton BE, Ventura SJ. Characteristics of births to single-and multiple-race women: California, Hawaii, Pennsylvania, utah, and Washington, 2003.National Vital Statistics Reports; vol 55 no 15. 2007.
2 U.S. Department of Health and Human Services. Healthy People 2020 Maternal and Infant Health Objectives. 2010. Available at http://www.healthypeople.gov/2020/topicsobjectives2020/objectiveslist.aspx?topicId=26 .
State of Hawai‘i Primary Care Needs Assessment Data Book 2016 13
RISk INDICATORS
A quantitative measure of the health and socio-economic risk faced by a population is used as a proxy for measuring the level of need for primary care services. It is implicitly assumed the higher the measured risk in a particular service area, the greater is the perceived need for primary care services. While the risk assessment approach may not be sufficient to capture all the complex dimensions of need, it allows for ease and objectivity in the comparative analysis of service areas. Risk indicators were selected for use in this Data Book from stakeholders input and the availability of data at the census tract or zip code level.
DELINEATION OF PRIMARY CARE SERVICE AREAS
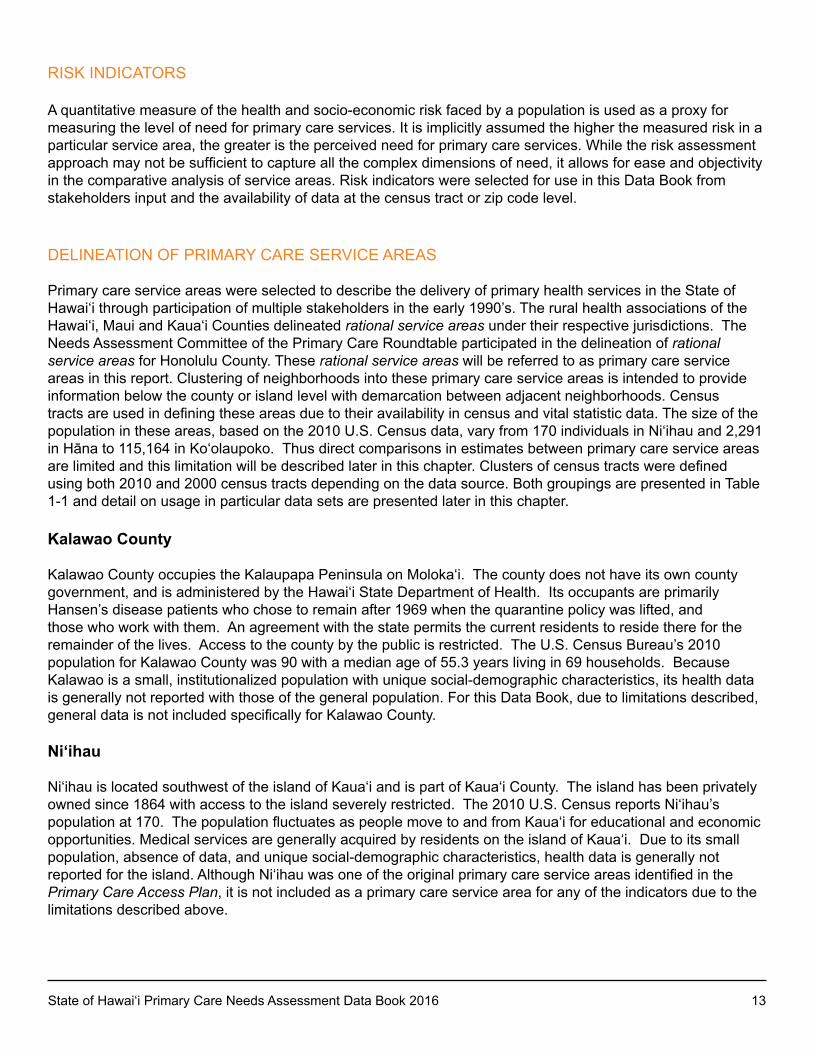
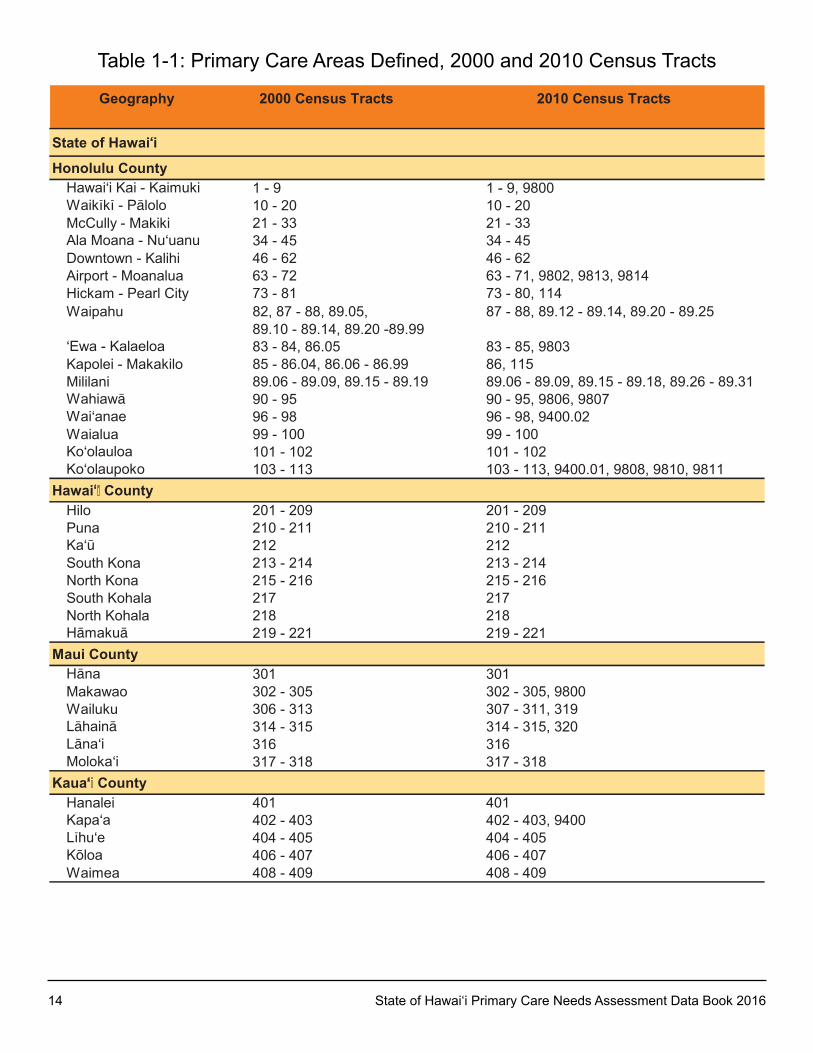
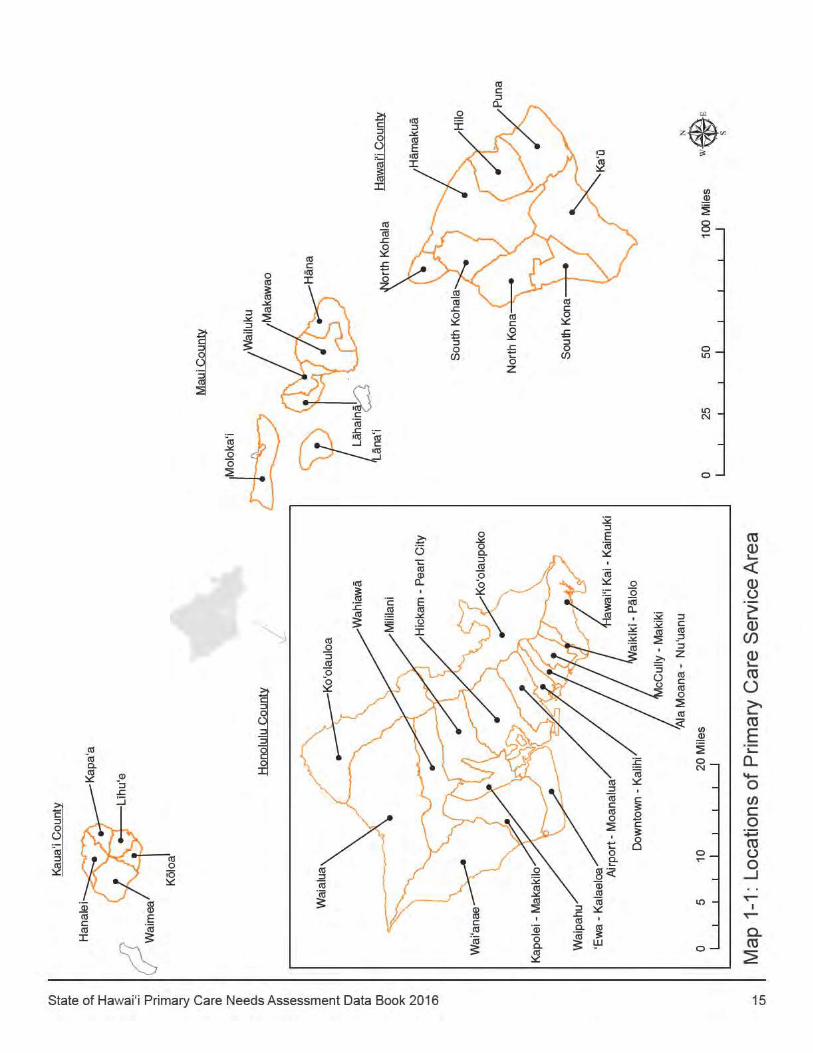
Primary care service areas were selected to describe the delivery of primary health services in the State of Hawai‘i through participation of multiple stakeholders in the early 1990’s. The rural health associations of the Hawai‘i, Maui and kaua‘i Counties delineated rational service areas under their respective jurisdictions. The Needs Assessment Committee of the Primary Care Roundtable participated in the delineation of rational service areas for Honolulu County. These rational service areas will be referred to as primary care service areas in this report. Clustering of neighborhoods into these primary care service areas is intended to provide information below the county or island level with demarcation between adjacent neighborhoods. Census tracts are used in defining these areas due to their availability in census and vital statistic data. The size of the population in these areas, based on the 2010 u.S. Census data, vary from 170 individuals in Ni‘ihau and 2,291 in Hāna to 115,164 in Ko‘olaupoko. Thus direct comparisons in estimates between primary care service areas are limited and this limitation will be described later in this chapter. Clusters of census tracts were defined using both 2010 and 2000 census tracts depending on the data source. Both groupings are presented in Table 1-1 and detail on usage in particular data sets are presented later in this chapter.
Kalawao County
kalawao County occupies the kalaupapa Peninsula on Moloka‘i. The county does not have its own county government, and is administered by the Hawai‘i State Department of Health. Its occupants are primarily Hansen’s disease patients who chose to remain after 1969 when the quarantine policy was lifted, and those who work with them. An agreement with the state permits the current residents to reside there for the remainder of the lives. Access to the county by the public is restricted. The u.S. Census Bureau’s 2010 population for kalawao County was 90 with a median age of 55.3 years living in 69 households. Because kalawao is a small, institutionalized population with unique social-demographic characteristics, its health data is generally not reported with those of the general population. For this Data Book, due to limitations described, general data is not included specifically for Kalawao County.
Ni‘ihau
Ni‘ihau is located southwest of the island of kaua‘i and is part of kaua‘i County. The island has been privately owned since 1864 with access to the island severely restricted. The 2010 u.S. Census reports Ni‘ihau’s population at 170. The population fluctuates as people move to and from Kaua‘i for educational and economic opportunities. Medical services are generally acquired by residents on the island of kaua‘i. Due to its small population, absence of data, and unique social-demographic characteristics, health data is generally not reported for the island. Although Ni‘ihau was one of the original primary care service areas identified in the Primary Care Access Plan, it is not included as a primary care service area for any of the indicators due to the limitations described above.
14 State of Hawai‘i Primary Care Needs Assessment Data Book 2016
Geography 2000 Census Tracts 2010 Census Tracts
State of Hawai‘i
Honolulu CountyHawai‘i kai - kaimuki 1 - 9 1 - 9, 9800Waikïkï - Pälolo 10 - 20 10 - 20McCully - Makiki 21 - 33 21 - 33Ala Moana - Nu‘uanu 34 - 45 34 - 45Downtown - kalihi 46 - 62 46 - 62Airport - Moanalua 63 - 72 63 - 71, 9802, 9813, 9814Hickam - Pearl City 73 - 81 73 - 80, 114Waipahu 82, 87 - 88, 89.05,
89.10 - 89.14, 89.20 -89.9987 - 88, 89.12 - 89.14, 89.20 - 89.25
‘Ewa - kalaeloa 83 - 84, 86.05 83 - 85, 9803kapolei - Makakilo 85 - 86.04, 86.06 - 86.99 86, 115Mililani 89.06 - 89.09, 89.15 - 89.19 89.06 - 89.09, 89.15 - 89.18, 89.26 - 89.31Wahiawä 90 - 95 90 - 95, 9806, 9807Wai‘anae 96 - 98 96 - 98, 9400.02Waialua 99 - 100 99 - 100ko‘olauloa 101 - 102 101 - 102ko‘olaupoko 103 - 113 103 - 113, 9400.01, 9808, 9810, 9811
Hawai‘ CountyHilo 201 - 209 201 - 209Puna 210 - 211 210 - 211ka‘ü 212 212South kona 213 - 214 213 - 214North kona 215 - 216 215 - 216South kohala 217 217North kohala 218 218Hämakuä 219 - 221 219 - 221
Maui CountyHäna 301 301Makawao 302 - 305 302 - 305, 9800Wailuku 306 - 313 307 - 311, 319Lähainä 314 - 315 314 - 315, 320Läna‘i 316 316Moloka‘i 317 - 318 317 - 318
Kaua‘ CountyHanalei 401 401kapa‘a 402 - 403 402 - 403, 9400Lïhu‘e 404 - 405 404 - 405köloa 406 - 407 406 - 407Waimea 408 - 409 408 - 409
Table 1-1: Primary Care Areas Defined, 2000 and 2010 Census Tracts
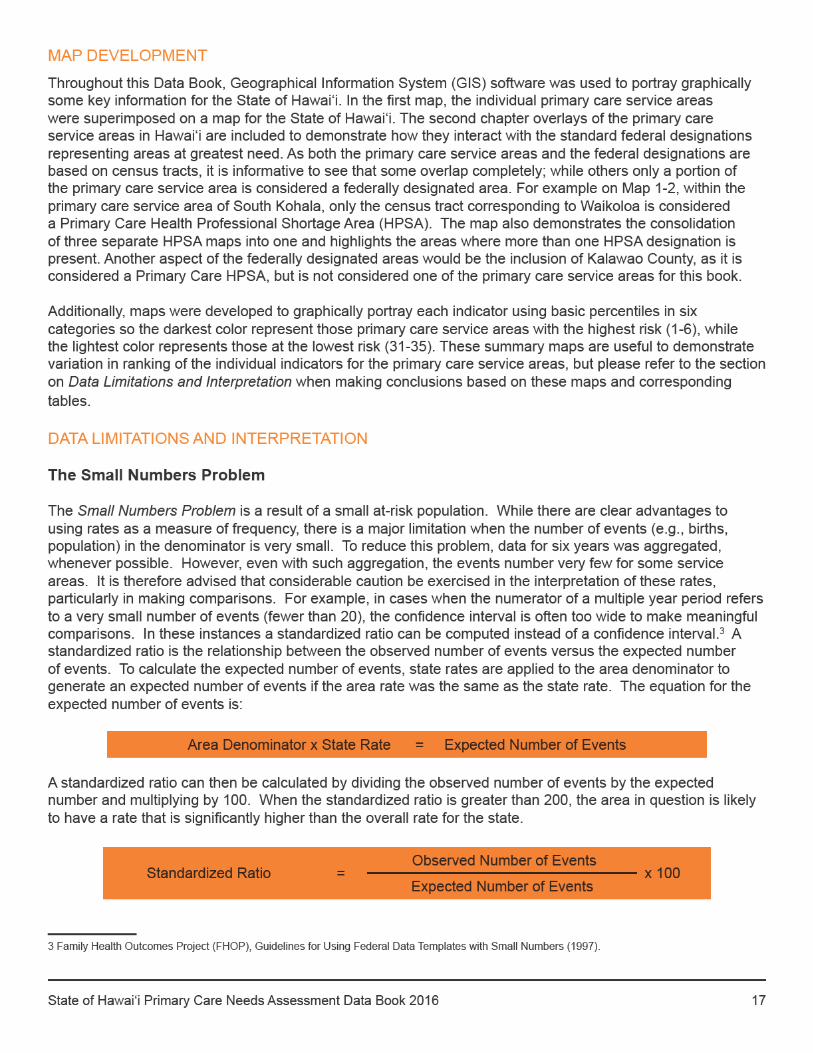
16 State of Hawai‘i Primary Care Needs Assessment Data Book 2016
Changes between 2000 and 2010 Census Tracts
Most 2010 census tracts remained unchanged, but a number of census tracts were split, merged, or revised resulting in changes to the census tract numbering. Other census tract numbering changes has occurred to reflect 1) Hawaiian Home Land Tracts (9400 - 9499), 2) Special Land Use Tracts (9800 - 9899), and 3) Water Tracts (9900 - 9989). Because the uS Census Bureau changed their methodology, census tract numbering will be unique only within counties so there may be duplicate census tract numbers within the state. Such as CT 319 for kalawao, and Spreckelville, Maui and CT 9800 for Hanauma Bay, Oahu and kahoolawe, Maui. The data sources vary on use of census tracts so somewhat different definitions were used in this report based on the available data. The following narrative identifies what tracts were used in the respective data sources and table 1-1 shows the census tracts used for the Primary Care Service Area.
Primary Care Service Areas and US Census Data
Data from the 2010-2014 American Community Survey (ACS) and the 2010 u.S. Census was obtained at the census tract level. Primary Care Service Areas were assigned based on aggregated census tracts as noted in Table 1-1. All data from the 2010-2014 ACS was reported based on 2010 census tracts.
Primary Care Service Areas and Vital Statistics Data
Vital statistics is obtained at the census tract level and assigned to the appropriate primary care service area based on the 2000 census tracts as noted in Table 1-1. When census tract information was listed as unknown for a particular county, it was included in the county and state totals and not in an individual primary care service area.
Primary Care Service Areas and BRFSS Data
BRFSS data is collected at the zip code level. When zip codes overlap census tracts, individuals are assigned to a census tract using a random number calculation based on a crosswalk obtained from the Missouri Census Data Center from 2010 census tracts using a 5% threshold (if more than 5% occurred in one area, this proportion was assigned to that area). For example, zip code 96786 overlaps two primary care service areas (Wahiawa and Waialua), but 94% of the population with a 96786 zip code reside in one of the areas (Wahiawa) based on the 2010 u.S. Census. Therefore, we randomly selected 94% of the respondents with this zip code to be assigned to Wahiawa, with the remaining 6% being assigned to Waialua. For the island of Ni‘ihau, the island’s small population and the limited number of land-line telephones mean very few if any of the residents would be captured in the BRFSS survey. Therefore, all respondents with a zip code 96769 were assigned to the primary care service area of Waimea which shares the same zip code.
Primary Care Service Areas and HHIC Data
HHIC data was available at the zip code level and were assigned to appropriate primary care service areas using the same procedure done with the BRFSS data.
State of Hawai‘i Primary Care Needs Assessment Data Book 2016 19
CHAPTER 2: PRIMARY CARE OFFICE, FEDERAL DESIGNATIONS, AND CLINICAL SYSTEMS
PRIMARY CARE OFFICE
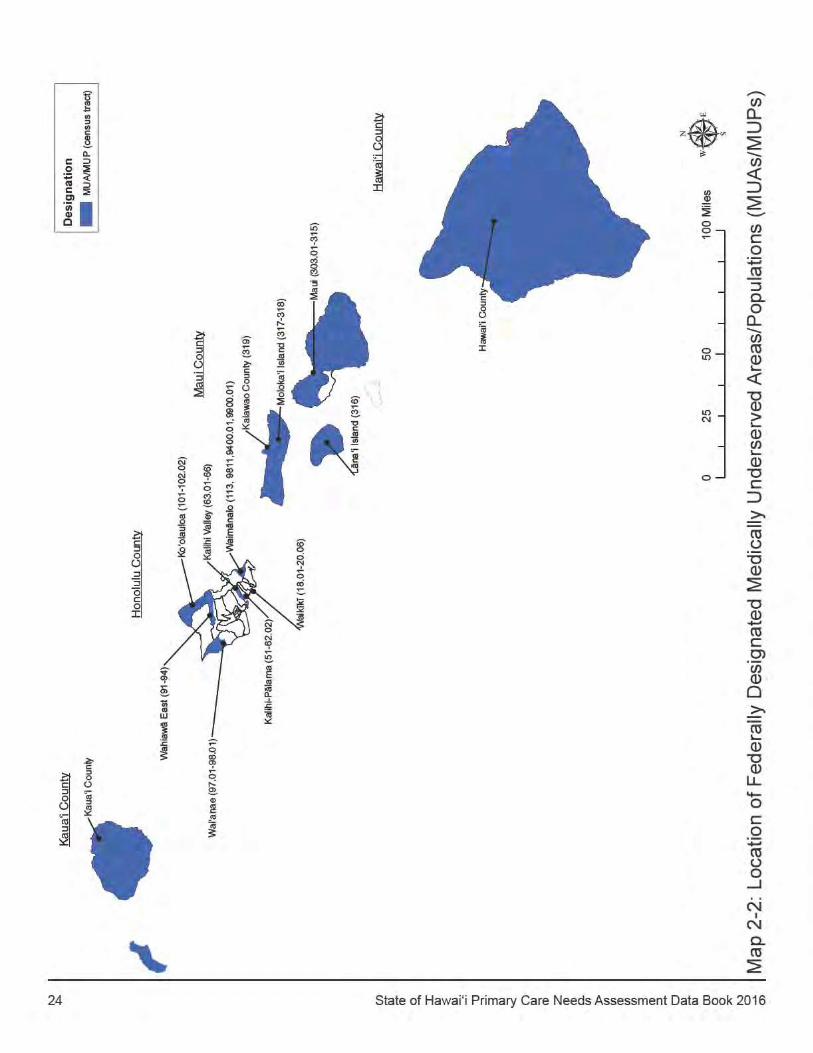
The Hawai‘i Primary Care Office (PCO) is located in the Department of Health (DOH), Family Health Services Division. This comprehensive program promotes and supports access to primary care, oral health care, and mental health care services for underserved communities in Hawai‘i. The PCO is responsible for overseeing the development and recertification of Health Professional Shortage Areas (HPSA), and Medically Underserved Area/Populations (MuA/P) designations. Designations document the medical, dental, and mental health needs in specific geographic areas. Once an area receives a shortage designation it is eligible for important federal programs including the National Health Service Corps (NHSC), Centers for Medicare & Medicaid Services (CMS) Medicare Incentive Payments, CMS Rural Health Clinic Program, J-1 Visa Waiver Program, Rural Health Clinic certification, and Federally Qualified Health Center (FQHC) and FQHC look-alikes.
The PCO is funded through the Health Services Administration (HRSA), State Primary Care Office grant. The program’s following core functions are to:
• Support organizational effectiveness and foster collaboration;• Provide technical assistance to organizations and communities wishing to expand access to primary care
for underserved populations;• Conduct needs assessment(s) and data sharing;• Support workforce development for the National Health Service Corps and safety Net/Health Center
Network; and • Review and update shortage designation areas.
The Hawai‘i PCO works in close collaboration with Federally Qualified Health Centers (FQHCs), primary care contractors, the Hawai‘i Primary Care Association , the Hawai‘i State Office of Rural Health, Hawai‘i/Pacific Basin Area Health Education Centers, the Native Hawaiian Health Scholarship Program, community stakeholders, and other public and private organizations to support the development, viability, and expansion of a statewide comprehensive primary health care system. An integral part of the program is the provision of high-quality, culturally competent, coordinated, primary care services to the uninsured and underinsured through contracts with 13 of the FQHCs throughout the state and two private community clinics. Services covered under these contracts include medical care, behavioral health, dental treatment, and pharmaceutical services. Program data demonstrates an ever increasing demand for services. Having an accurate picture of our communities’ health status and needs is critical for planning and program needs. This is accomplished through a needs assessment process supported by the PCO. The product of the statewide assessment is the PCO Needs Assessment Data Book a biennial publication, which provides essential data for identifying community, shortage designation, health workforce, and primary care health needs.
20 State of Hawai‘i Primary Care Needs Assessment Data Book 2016
BACKGROUND ON FEDERAL DESIGNATIONS
Health Professional Shortage Areas (HPSAs)
Health Professional Shortage Areas (HPSAs) are designated by HRSA as having shortages of primary medical, dental or mental health providers and may be geographic (e.g., county or specific service area), population (e.g., low income, homeless) or facility (e.g., public, non-profit, private practice). Health Professional Shortage Area designations are based on specific designation criteria, and guidelines specific to each of the three types of designations (e.g., primary care, dental and mental health). Information about the specific designation criteria may be found at: http://bhpr.hrsa.gov/shortage/hpsas/.
The National Health Service Corps (NHSC) and the Rural Health Clinic Certification Program are two of several federal programs requiring a HPSA designation. The Area Health Education Center (AHEC) Program gives special consideration to centers that serve HPSAs with higher percentages of underserved minorities, and also provides special funding priority to centers offering substantial training experience in HPSAs. The Division of Shortage Designation of the Bureau of Health Professions with the Health Resources and Services Administration (HRSA) of the u.S. Department of Health and Human Services is responsible for reviewing and designating HPSAs.
Medically Underserved Area/Population (MUA/MUP)
Medically underserved Areas/Populations (MuA/Ps) are areas or populations designated as having too few primary care providers, high infant mortality rates, high poverty rates, or a high elderly population. A MuA/P may be a whole county or a group of contiguous counties, a group of county or civil divisions or a group of urban census tracts. Medically underserved Populations (MuPs) may include groups of persons who face economic, cultural or linguistic barriers to health care. Like HPSAs, MuA/Ps are determined using a set of eligiblity criteria that computes an Index of Medical under-service score. This score determines if an area may be designated as either a MuA or MuP. For more information on the criteria and scoring methodology see the website: http://bhpr.hrsa.gov/shortage/muaps/index.html.
__________Sources: 42 CFR Chapter 1, Part 5; Health Resources and Services Administration, Bureau of Primary Health Care Guidelines; and the National Health Service Corps website, http://nhsc.hrsa.gov/.
State of Hawai‘i Primary Care Needs Assessment Data Book 2016 21
The National Health Service Corps (NHSC)
The National Health Service Corps is one of several scholarship and loan repayment assistance programs operated by the Bureau of Health Workforce (BHW) to support the recruitment and retention of health care professionals to work in a HPSA. The NHSC program requires a service commitment by an individual to work at an approved health care site for at least two years in exchange for financial assistance. Eligible healthcare professionals under the NHSC Loan Repayment Programs are:
• Primary Care Physicians (Family Medicine, General Internal Medicine, General Pediatrics, Obstetrics/ Gynecology, General Psychiatry)
• Nurse Practitioners• Physician Assistants• Certified Nurse-Midwives• Dentists (General Dentistry and Pediatric Dentistry)• Dental Hygienists• Mental and Behavioral Health Professionals (Psychiatrists, Health Service Psychologists, Clinical Social
Workers, Licensed Professional Counselors, Marriage and Family Therapists, and Psychiatric Nurse Specialists)
Many types of practices can apply to become eligible sites for the placement of NHSC Scholars and Loan Repayors, including:• FQHCs, FQHC Look-A-Likes, and Rural Health Clinics• Public Health Departments• Hospital Affiliated outpatient primary care • Group Practices• Solo Practices/Partnerships• State and Federal Prisons• u.S. Immigration, Customs & Enforcement• Tribally Run Indian Health Service Sites and Federal Indian Health Service Sites• Other (Critical Access Hospitals, Community Mental Health Centers, Free Clinics, Mobile units, School-
based clinics)
The BHW also has Nurse Corps scholarship and loan repayment programs as well as Faculty Loan programs.
More information and application forms for interested health professionals and practice sites can be found at http://nhsc.hrsa.gov. For further assistance call the NHSC Helpline at 1-800-221-9393 (available from 9 a.m. to 5:30 p.m. EST) or through the new Customer Service Portal @ https://programportal.hrsa.gov/extranet/landing.seam.
22 State of Hawai‘i Primary Care Needs Assessment Data Book 2016
PrimaryCare Dental Mental
HealthArea (Census Tract)
Designation
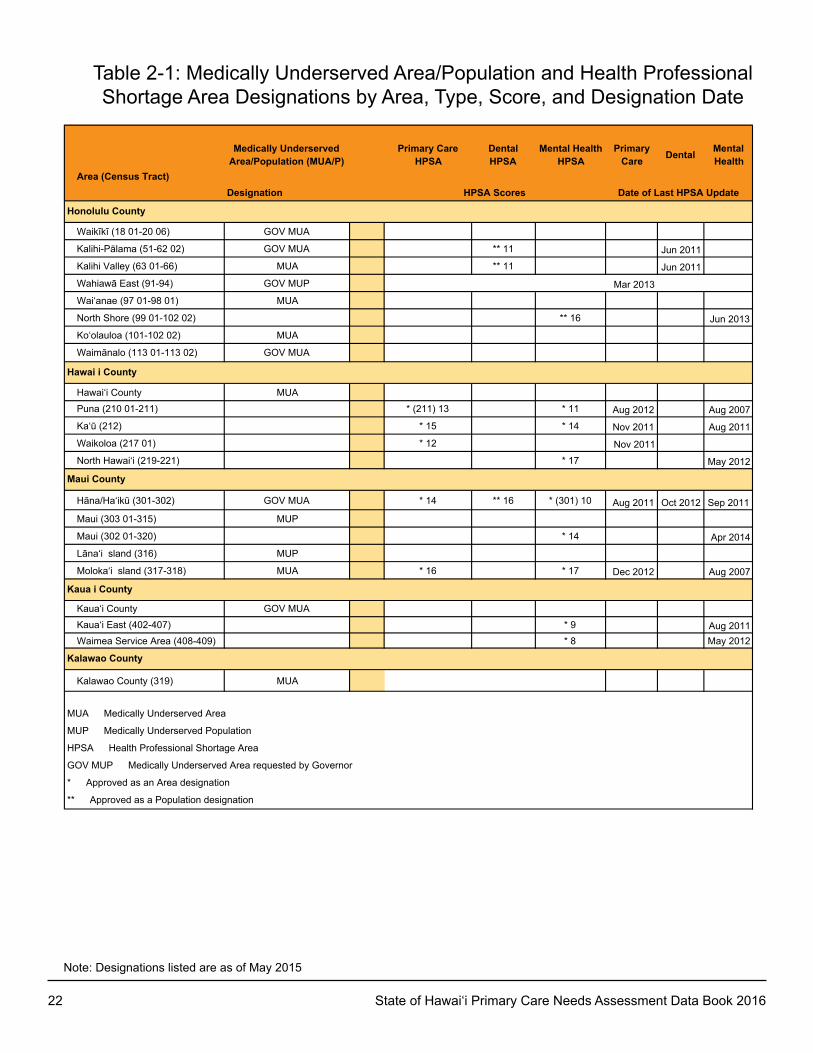
Waikīkī (18 01-20 06) GOV MUA
Kalihi-Pālama (51-62 02) GOV MUA ** 11 Jun 2011Kalihi Valley (63 01-66) MUA ** 11 Jun 2011Wahiawā East (91-94) GOV MUP Mar 2013Wai‘anae (97 01-98 01) MUA
North Shore (99 01-102 02) ** 16 Jun 2013Ko‘olauloa (101-102 02) MUA
Waimānalo (113 01-113 02) GOV MUA
Hawai‘i County MUAPuna (210 01-211) * (211) 13 * 11 Aug 2012 Aug 2007Ka‘ū (212) * 15 * 14 Nov 2011 Aug 2011Waikoloa (217 01) * 12 Nov 2011North Hawai‘i (219-221) * 17 May 2012
Hāna/Ha‘ikū (301-302) GOV MUA * 14 ** 16 * (301) 10 Aug 2011 Oct 2012 Sep 2011Maui (303 01-315) MUP
Maui (302 01-320) * 14 Apr 2014Lāna‘i sland (316) MUP
Moloka‘i sland (317-318) MUA * 16 * 17 Dec 2012 Aug 2007
Kaua‘i County GOV MUAKaua‘i East (402-407) * 9 Aug 2011Waimea Service Area (408-409) * 8 May 2012
Kalawao County (319) MUA
Kaua i County
Kalawao County
HPSA Scores
Medically UnderservedArea/Population (MUA/P)
Primary CareHPSA
DentalHPSA
Mental HealthHPSA
** Approved as a Population designation
MUA Medically Underserved Area
MUP Medically Underserved Population
Date of Last HPSA Update
HPSA Health Professional Shortage Area
GOV MUP Medically Underserved Area requested by Governor
* Approved as an Area designation
Honolulu County
Hawai i County
Maui County
Note: Designations listed are as of May 2015
Table 2-1: Medically underserved Area/Population and Health Professional Shortage Area Designations by Area, Type, Score, and Designation Date

State of Hawai‘i Primary Care Needs Assessment Data Book 2016 25
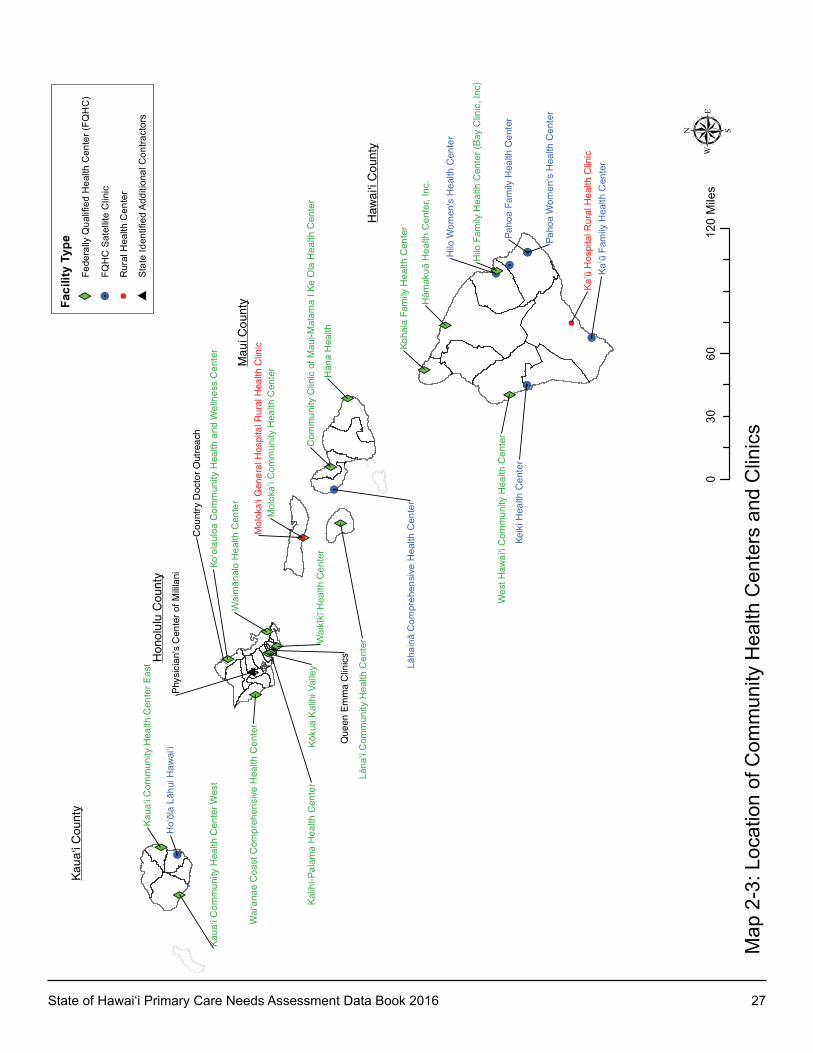
COMMuNITY HEALTH CENTERS AND CLINICS
Access to health care occurs in many settings. Ideally, an individual will have a central medical home where all services are coordinated. This data report focuses on primary care access among Rural Health Clinics, FQHCs, and State Primary Care contractors.
Rural Health Clinic (RHC)
The Rural Health Clinic (RHC) program is intended to increase primary care services for Medicaid and Medicare patients in rural communities. A RHC can be public, private, or non-profit, and must be located in rural underserved areas as designated under Section 1861(aa)(2) of the Social Security Act. An advantage of having a RHC status is the enhanced reimbursement rates for providing Medicaid and Medicare services. A RHC is required to use a team approach of physicians and mid-level practitioners such as nurse practitioners, physician assistants, and certified nurse midwives to provide services. The clinic must be staffed at least half time with a mid-level practitioner and must provide the same services that are required of a community health center.
Federally Qualified Health Center (FQHC)
Federally Qualified Health Centers (FQHCs) include all organizations receiving grants under Section 330 of the Public Health Service Act (PHS). FQHCs qualify for enhanced reimbursement from Medicare and Medicaid, as well as other benefits. FQHCs must serve an underserved area or population, offer a sliding fee scale, provide comprehensive services, have an ongoing quality assurance program, and have a governing board of directors. The 14 FQHC’s in Hawai‘i are critical safety nets for individuals and families with limited financial resources. Many of the centers have satellite sites expanding their service area capacity. In 2013, the FQHCs served 146,489 clients.1 Fifty-three percent of the patients were on Medicaid/Quest, 76% were below 100% of the federal poverty level, and 92% were below 200% of the poverty level. In order to simplify the map on page 27, we have only shown the satellite clinics located outside of Honolulu County.
State Funded Primary Care Contractors
The Department of Health identified the need to provide primary care services to areas that did not meet the requirements for a RHC or FQHC, but were critical in ensuring appropriate access to services. Currently, there are 16 sites that receive such funding identified through an open and competitive procurement process. These health centers and clinics expand access to primary care services for the medically underserved that are coordinated, culturally sensitive, and focus on health promotion and disease prevention.
1 Hawai‘i Primary Care Association Report. 2013.
26 State of Hawai‘i Primary Care Needs Assessment Data Book 2016
Facility
Primary Care Designation
Score
Dental Health Designation
Score
Mental Health Designation
Score
Facility Classification
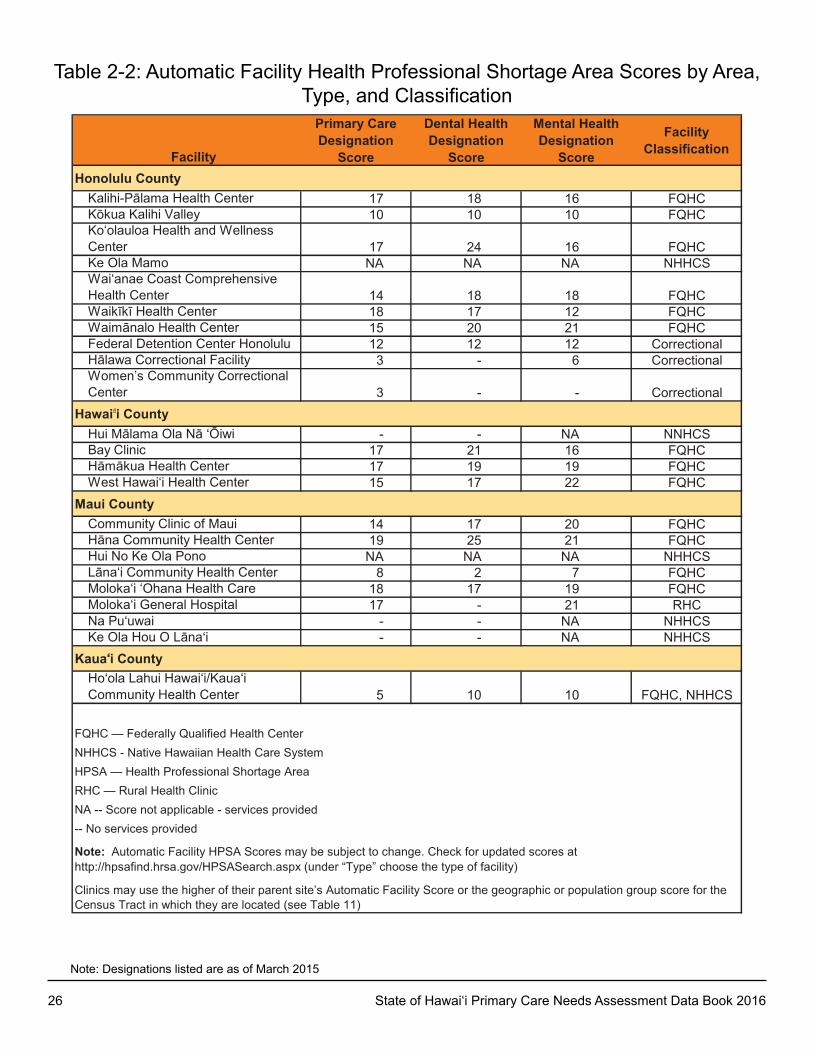
Honolulu CountyKalihi-Pālama Health Center 17 18 16 FQHCKōkua Kalihi Valley 10 10 10 FQHCKo‘olauloa Health and Wellness Center 17 24 16 FQHCke Ola Mamo NA NA NA NHHCSWai‘anae Coast Comprehensive Health Center 14 18 18 FQHCWaikīkī Health Center 18 17 12 FQHCWaimānalo Health Center 15 20 21 FQHCFederal Detention Center Honolulu 12 12 12 CorrectionalHālawa Correctional Facility 3 - 6 CorrectionalWomen’s Community Correctional Center 3 - - Correctional
Hawai i CountyHui Mālama Ola Nā ‘Ōiwi - - NA NNHCSBay Clinic 17 21 16 FQHCHāmākua Health Center 17 19 19 FQHCWest Hawai‘i Health Center 15 17 22 FQHC
Maui CountyCommunity Clinic of Maui 14 17 20 FQHCHāna Community Health Center 19 25 21 FQHCHui No ke Ola Pono NA NA NA NHHCSLāna‘i Community Health Center 8 2 7 FQHCMoloka‘i ‘Ohana Health Care 18 17 19 FQHCMoloka‘i General Hospital 17 - 21 RHCNa Pu‘uwai - - NA NHHCSKe Ola Hou O Lāna‘i - - NA NHHCS
Kaua‘i CountyHo‘ola Lahui Hawai‘i/Kaua‘i Community Health Center 5 10 10 FQHC, NHHCS
FQHC — Federally Qualified Health CenterNHHCS - Native Hawaiian Health Care SystemHPSA — Health Professional Shortage AreaRHC — Rural Health ClinicNA -- Score not applicable - services provided-- No services provided
Note: Automatic Facility HPSA Scores may be subject to change. Check for updated scores at http://hpsafind.hrsa.gov/HPSASearch.aspx (under “Type” choose the type of facility)
Clinics may use the higher of their parent site’s Automatic Facility Score or the geographic or population group score for the Census Tract in which they are located (see Table 11)
Table 2-2: Automatic Facility Health Professional Shortage Area Scores by Area, Type, and Classification
Note: Designations listed are as of March 2015
State of Hawai‘i Primary Care Needs Assessment Data Book 2016 27
Map
2-3
: Loc
atio
n of
Com
mun
ity H
ealth
Cen
ters
and
Clin
ics
!5
#
#
*
*
*
!
!
!
!!
!
!
5
5
5
55
5
5
X
X
X
X
XX
XX
X
X
XXX
X
XX
W
W
W
W
WW
WW
W
W
WWW
W
WW
'
'
Hilo
Wom
en's
Hea
lth C
ente
r
Hām
akuā
Hea
lth C
ente
r, In
c.
Hilo
Fam
ily H
ealth
Cen
ter
(Bay
Clin
ic, I
nc)
Cou
ntry
Doc
tor
Out
reac
h
Hān
a H
ealth
Koh
ala
Fam
ily H
ealth
Cen
ter
Com
mun
ity C
linic
of M
aui-M
alam
a I K
e O
la H
ealth
Cen
ter
Mol
oka‘
i Com
mun
ity H
ealth
Cen
ter
Wai
mān
alo
Hea
lth C
ente
r
Ko‘
olau
loa
Com
mun
ity H
ealth
and
Wel
lnes
s C
ente
r
Phy
sici
an's
Cen
ter
of M
ilila
ni
Que
en E
mm
a C
linic
s
Kōk
ua K
alih
i Val
ley
Kal
ihi-P
alam
a H
ealth
Cen
ter
Kau
a‘i C
omm
unity
Hea
lth C
ente
r E
ast
Kau
a‘i C
omm
unity
Hea
lth C
ente
r Wes
t
Wai
‘ana
e C
oast
Com
preh
ensi
ve H
ealth
Cen
ter
Lāna
‘i C
omm
unity
Hea
lth C
ente
r
Wes
t Haw
ai‘i
Com
mun
ity H
ealth
Cen
ter
Ka‘ū
Fam
ily H
ealth
Cen
ter
Pah
oa W
omen
‘s H
ealth
Cen
ter
Pah
oa F
amily
Hea
lth C
ente
r
Ho‘ōl
a Lā
hui H
awai
‘i
Kei
ki H
ealth
Cen
ter
Ka‘ū
Hos
pita
l Rur
al H
ealth
Clin
ic
Mol
oka‘
i Gen
eral
Hos
pita
l Rur
al H
ealth
Clin
ic
Wai
kīkī
Hea
lth C
ente
r
Lāha
inā
Com
preh
ensi
ve H
ealth
Cen
ter
µ0
6012
030
Mile
s
Hon
olu
lu C
ount
y
Kau
a‘i C
ount
y
Mau
i Co
unty
Haw
ai‘i
Cou
nty
Faci
lity
Type
XWFe
dera
lly Q
ualif
ied
Hea
lth C
ente
r (FQ
HC
)
!5FQ
HC
Sat
ellit
e C
linic
'R
ural
Hea
lth C
ente
r
# *S
tate
Iden
tifie
d A
dditi
onal
Con
tract
ors
28 State of Hawai‘i Primary Care Needs Assessment Data Book 2016
NATIVE HAWAIIAN HEALTH CARE SYSTEM
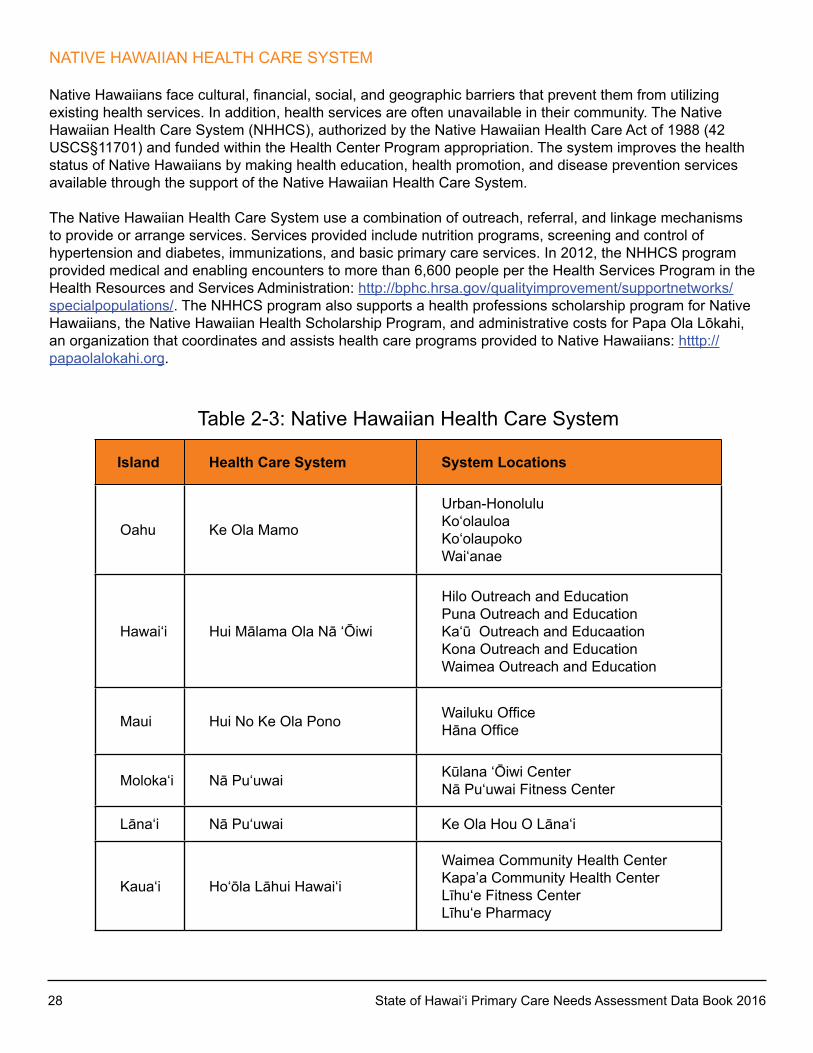
Native Hawaiians face cultural, financial, social, and geographic barriers that prevent them from utilizing existing health services. In addition, health services are often unavailable in their community. The Native Hawaiian Health Care System (NHHCS), authorized by the Native Hawaiian Health Care Act of 1988 (42 uSCS§11701) and funded within the Health Center Program appropriation. The system improves the health status of Native Hawaiians by making health education, health promotion, and disease prevention services available through the support of the Native Hawaiian Health Care System.
The Native Hawaiian Health Care System use a combination of outreach, referral, and linkage mechanisms to provide or arrange services. Services provided include nutrition programs, screening and control of hypertension and diabetes, immunizations, and basic primary care services. In 2012, the NHHCS program provided medical and enabling encounters to more than 6,600 people per the Health Services Program in the Health Resources and Services Administration: http://bphc.hrsa.gov/qualityimprovement/supportnetworks/specialpopulations/. The NHHCS program also supports a health professions scholarship program for Native Hawaiians, the Native Hawaiian Health Scholarship Program, and administrative costs for Papa Ola Lōkahi, an organization that coordinates and assists health care programs provided to Native Hawaiians: htttp://papaolalokahi.org.
Table 2-3: Native Hawaiian Health Care System
Island Health Care System System Locations
Oahu ke Ola Mamo
urban-Honoluluko‘olauloa ko‘olaupoko Wai‘anae
Hawai‘i Hui Mālama Ola Nā ‘Ōiwi
Hilo Outreach and EducationPuna Outreach and Education Ka‘ū Outreach and Educaationkona Outreach and EducationWaimea Outreach and Education
Maui Hui No ke Ola Pono Wailuku OfficeHāna Office
Moloka‘i Nā Pu‘uwai Kūlana ‘Ōiwi CenterNā Pu‘uwai Fitness Center
Lāna‘i Nā Pu‘uwai Ke Ola Hou O Lāna‘i
kaua‘i Ho‘ōla Lāhui Hawai‘i
Waimea Community Health Centerkapa’a Community Health CenterLīhu‘e Fitness CenterLīhu‘e Pharmacy

30 State of Hawai‘i Primary Care Needs Assessment Data Book 2016
HAWAI‘I HEALTH SYSTEMS CORPORATION AND CRITICAL ACCESS HOSPITALS
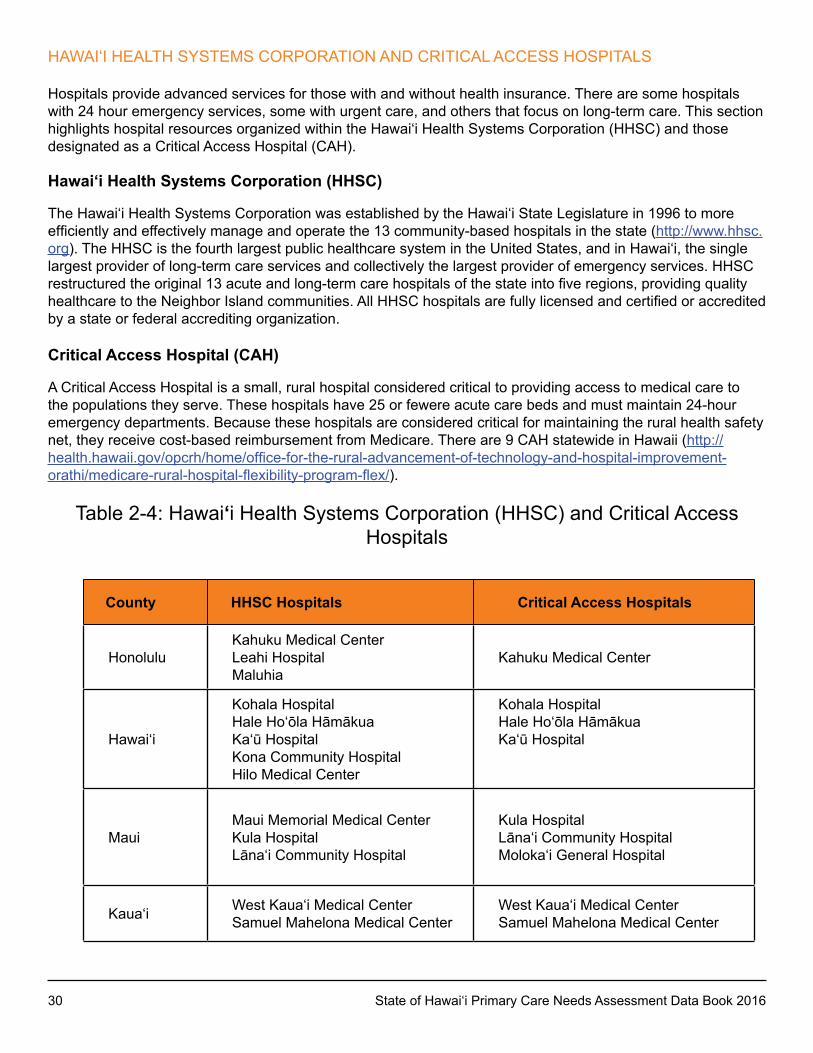
Hospitals provide advanced services for those with and without health insurance. There are some hospitals with 24 hour emergency services, some with urgent care, and others that focus on long-term care. This section highlights hospital resources organized within the Hawai‘i Health Systems Corporation (HHSC) and those designated as a Critical Access Hospital (CAH).
Hawai‘i Health Systems Corporation (HHSC)
The Hawai‘i Health Systems Corporation was established by the Hawai‘i State Legislature in 1996 to more efficiently and effectively manage and operate the 13 community-based hospitals in the state (http://www.hhsc.org). The HHSC is the fourth largest public healthcare system in the united States, and in Hawai‘i, the single largest provider of long-term care services and collectively the largest provider of emergency services. HHSC restructured the original 13 acute and long-term care hospitals of the state into five regions, providing quality healthcare to the Neighbor Island communities. All HHSC hospitals are fully licensed and certified or accredited by a state or federal accrediting organization.
Critical Access Hospital (CAH)
A Critical Access Hospital is a small, rural hospital considered critical to providing access to medical care to the populations they serve. These hospitals have 25 or fewere acute care beds and must maintain 24-hour emergency departments. Because these hospitals are considered critical for maintaining the rural health safety net, they receive cost-based reimbursement from Medicare. There are 9 CAH statewide in Hawaii (http://health.hawaii.gov/opcrh/home/office-for-the-rural-advancement-of-technology-and-hospital-improvement-orathi/medicare-rural-hospital-flexibility-program-flex/).
Table 2-4: Hawai‘i Health Systems Corporation (HHSC) and Critical Access Hospitals
County HHSC Hospitals Critical Access Hospitals
Honolulukahuku Medical CenterLeahi Hospital Maluhia
kahuku Medical Center
Hawai‘i
kohala HospitalHale Ho‘ōla Hāmākua Ka‘ū Hospital kona Community HospitalHilo Medical Center
kohala HospitalHale Ho‘ōla Hāmākua Ka‘ū Hospital
MauiMaui Memorial Medical Center kula Hospital Lāna‘i Community Hospital
kula Hospital Lāna‘i Community Hospital Moloka‘i General Hospital
kaua‘i West kaua‘i Medical CenterSamuel Mahelona Medical Center
West kaua‘i Medical CenterSamuel Mahelona Medical Center
State of Hawai‘i Primary Care Needs Assessment Data Book 2016 31
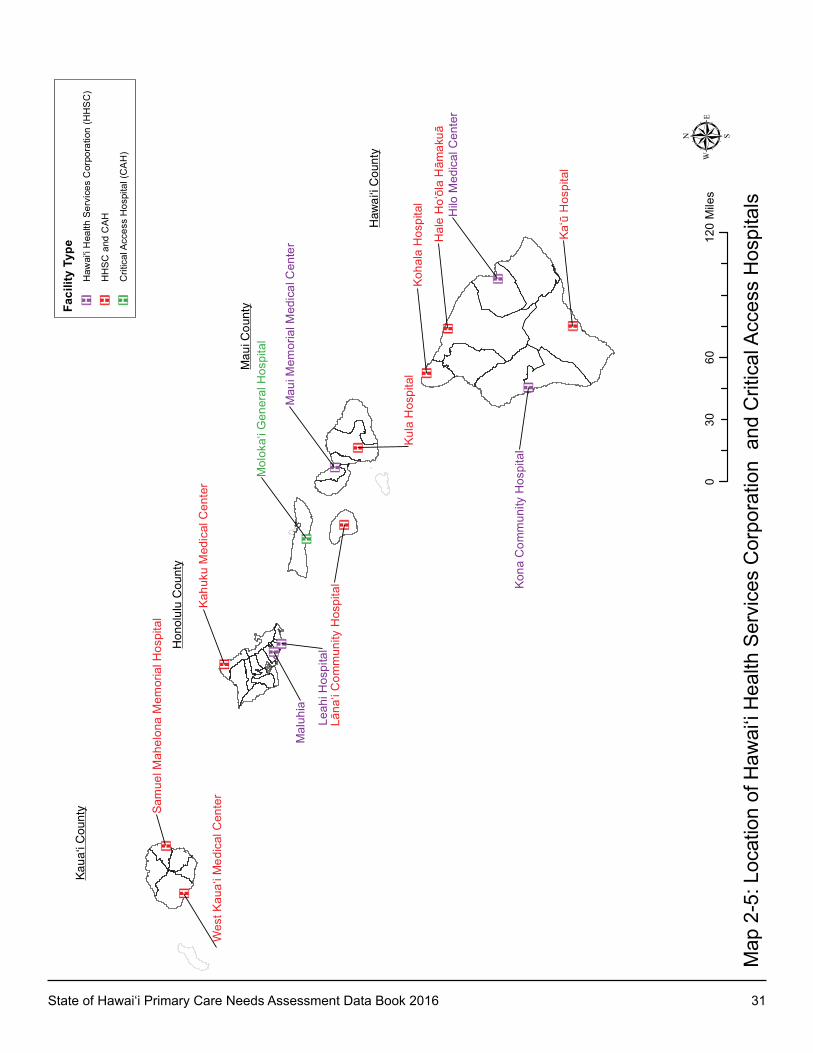
Map
2-5
: Loc
atio
n of
Haw
ai‘i
Hea
lth S
ervi
ces
Cor
pora
tion
and
Crit
ical
Acc
ess
Hos
pita
ls
v
® v
v
® v
v
® v
® v
vv
® v
v
® v
® v® v
Hilo
Med
ical
Cen
ter
Wes
t Kau
a‘i M
edic
al C
ente
r
Sam
uel M
ahel
ona
Mem
oria
l Hos
pita
l
Kahu
ku M
edic
al C
ente
r
Kula
Hos
pita
l
Lāna
‘i C
omm
unity
Hos
pita
l
Koha
la H
ospi
tal
Hal
e H
o‘ōl
a Hām
akuā
Ka‘ū
Hos
pita
l
Kona
Com
mun
ity H
ospi
tal
Leah
i Hos
pita
l
Mal
uhia
Mol
oka‘
i Gen
eral
Hos
pita
l
Mau
i Mem
oria
l Med
ical
Cen
ter
µ0
6012
030
Mile
s
Hon
olu
lu C
ount
y
Kau
a‘i C
ount
y
Mau
i Co
unty
Haw
ai‘i
Cou
nty
Faci
lity
Type
vH
awai
'i H
ealth
Ser
vice
s C
orpo
ratio
n (H
HS
C)
vH
HS
C a
nd C
AH
vC
ritic
al A
cces
s H
ospi
tal (
CA
H)
32 State of Hawai‘i Primary Care Needs Assessment Data Book 2016
CHAPTER 3: POPuLATION AND SOCIO-ECONOMIC
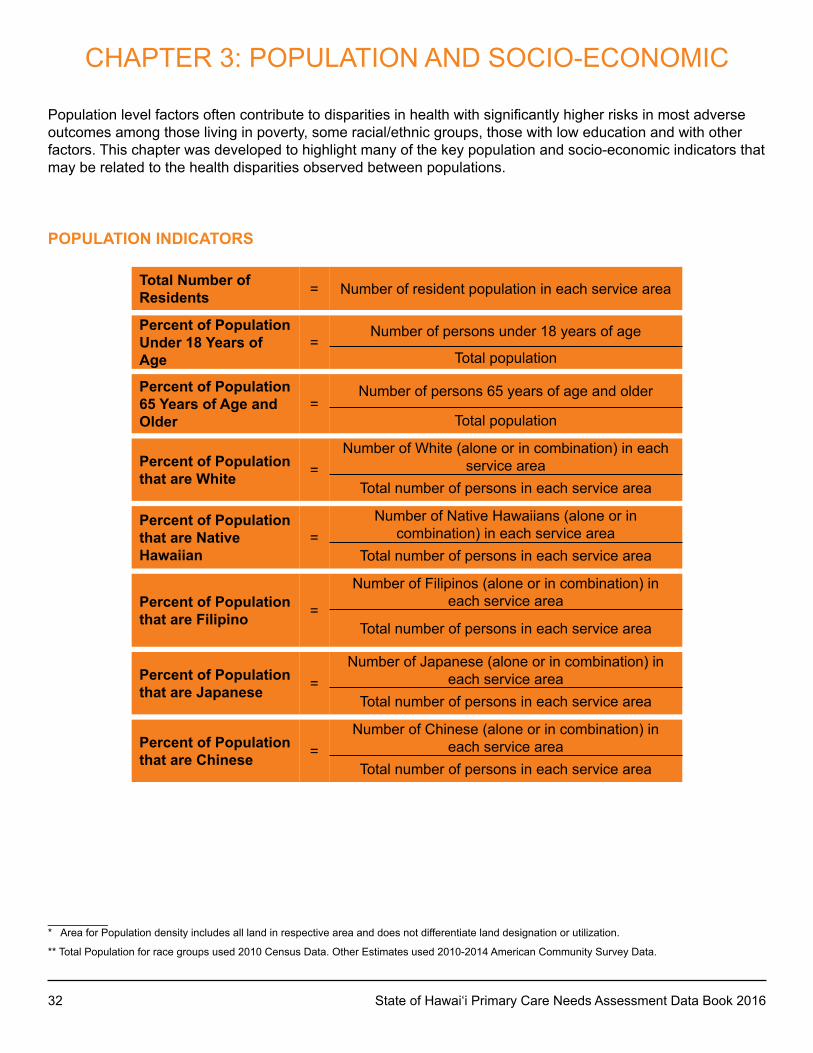
Population level factors often contribute to disparities in health with significantly higher risks in most adverse outcomes among those living in poverty, some racial/ethnic groups, those with low education and with other factors. This chapter was developed to highlight many of the key population and socio-economic indicators that may be related to the health disparities observed between populations.
POPULATION INDICATORS
Total Number of Residents = Number of resident population in each service area
Percent of Population Under 18 Years of Age
=Number of persons under 18 years of age
Total population
Percent of Population 65 Years of Age and Older
=Number of persons 65 years of age and older
Total population
Percent of Population that are White =
Number of White (alone or in combination) in each service area
Total number of persons in each service area
Percent of Population that are Native Hawaiian
=Number of Native Hawaiians (alone or in
combination) in each service areaTotal number of persons in each service area
Percent of Population that are Filipino =
Number of Filipinos (alone or in combination) in each service area
Total number of persons in each service area
Percent of Population that are Japanese =
Number of Japanese (alone or in combination) in each service area
Total number of persons in each service area
Percent of Population that are Chinese =
Number of Chinese (alone or in combination) in each service area
Total number of persons in each service area
_________* Area for Population density includes all land in respective area and does not differentiate land designation or utilization.
** Total Population for race groups used 2010 Census Data. Other Estimates used 2010-2014 American Community Survey Data.
State of Hawai‘i Primary Care Needs Assessment Data Book 2016 33
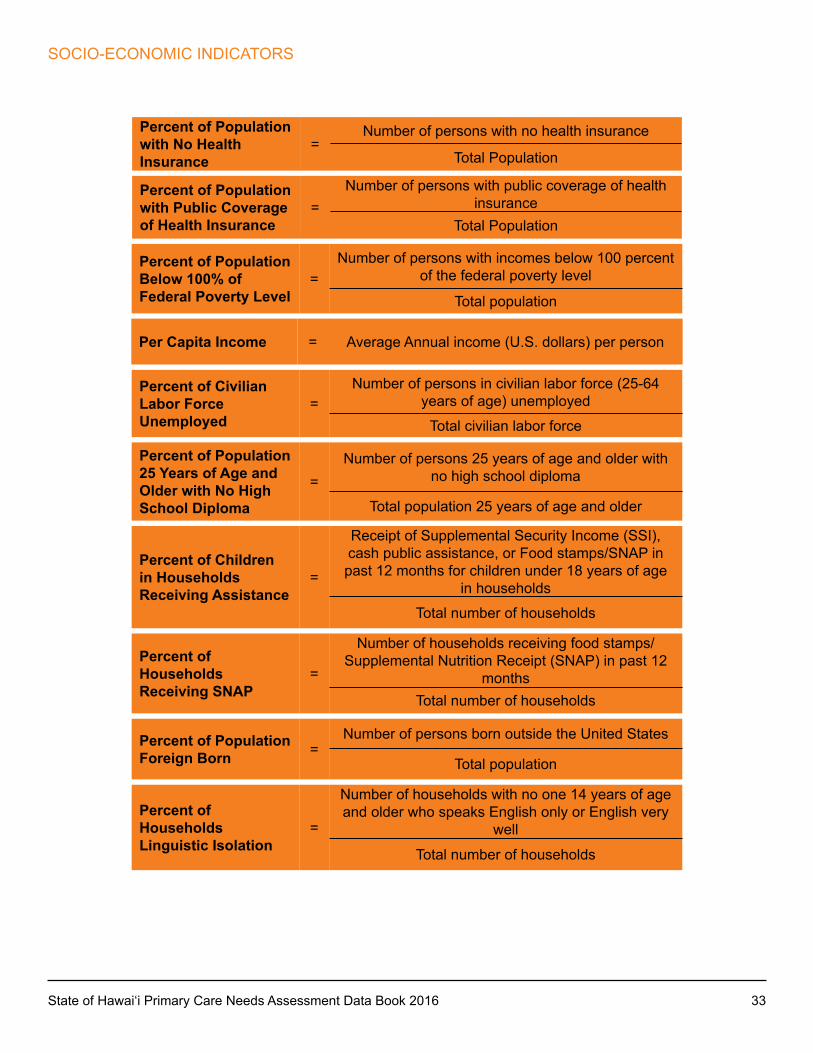
SOCIO-ECONOMIC INDICATORS
Percent of Population with No Health Insurance
=Number of persons with no health insurance
Total Population
Percent of Population with Public Coverage of Health Insurance
=Number of persons with public coverage of health
insurance Total Population
Percent of Population Below 100% of Federal Poverty Level
=Number of persons with incomes below 100 percent
of the federal poverty level
Total population
Per Capita Income = Average Annual income (u.S. dollars) per person
Percent of Civilian Labor Force Unemployed
=Number of persons in civilian labor force (25-64
years of age) unemployed
Total civilian labor force
Percent of Population 25 Years of Age and Older with No High School Diploma
=Number of persons 25 years of age and older with
no high school diploma
Total population 25 years of age and older
Percent of Children in Households Receiving Assistance
=
Receipt of Supplemental Security Income (SSI), cash public assistance, or Food stamps/SNAP in past 12 months for children under 18 years of age
in households
Total number of households
Percent of Households Receiving SNAP
=
Number of households receiving food stamps/Supplemental Nutrition Receipt (SNAP) in past 12
monthsTotal number of households
Percent of Population Foreign Born =
Number of persons born outside the united States
Total population
Percent of Households Linguistic Isolation
=
Number of households with no one 14 years of age and older who speaks English only or English very
well
Total number of households
36 State of Hawai‘i Primary Care Needs Assessment Data Book 2016
Service AreaAnnual Total Population
Number Under 18 Years of Age
Percent Under 18 Years of Age
95% Confidence Interval
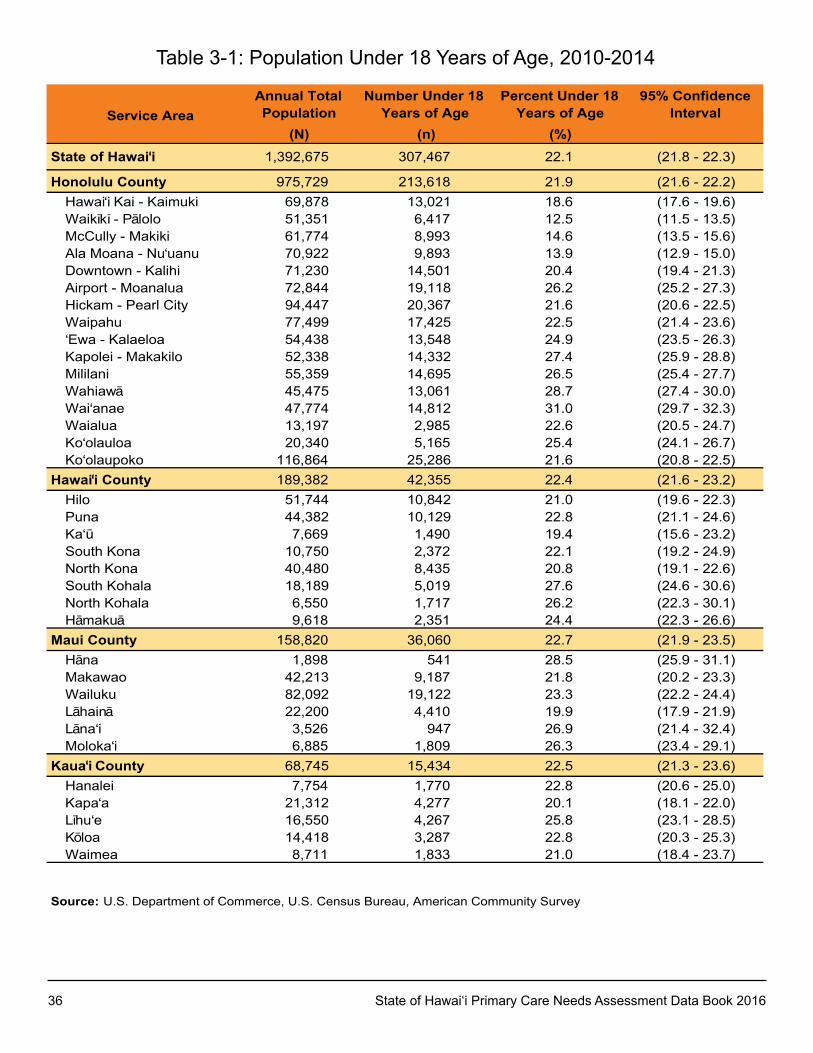
(N) (n) (%)State of Hawai‘i 1,392,675 307,467 22.1 (21.8 - 22.3)
Honolulu County 975,729 213,618 21.9 (21.6 - 22.2)Hawai‘i Kai - Kaimuki 69,878 13,021 18.6 (17.6 - 19.6)Waikïkï - Pälolo 51,351 6,417 12.5 (11.5 - 13.5)McCully - Makiki 61,774 8,993 14.6 (13.5 - 15.6)Ala Moana - Nu‘uanu 70,922 9,893 13.9 (12.9 - 15.0)Downtown - Kalihi 71,230 14,501 20.4 (19.4 - 21.3)Airport - Moanalua 72,844 19,118 26.2 (25.2 - 27.3)Hickam - Pearl City 94,447 20,367 21.6 (20.6 - 22.5)Waipahu 77,499 17,425 22.5 (21.4 - 23.6)‘Ewa - Kalaeloa 54,438 13,548 24.9 (23.5 - 26.3)Kapolei - Makakilo 52,338 14,332 27.4 (25.9 - 28.8)Mililani 55,359 14,695 26.5 (25.4 - 27.7)Wahiawä 45,475 13,061 28.7 (27.4 - 30.0)Wai‘anae 47,774 14,812 31.0 (29.7 - 32.3)Waialua 13,197 2,985 22.6 (20.5 - 24.7)Ko‘olauloa 20,340 5,165 25.4 (24.1 - 26.7)Ko‘olaupoko 116,864 25,286 21.6 (20.8 - 22.5)
Hawai‘i County 189,382 42,355 22.4 (21.6 - 23.2)Hilo 51,744 10,842 21.0 (19.6 - 22.3)Puna 44,382 10,129 22.8 (21.1 - 24.6)Ka‘ü 7,669 1,490 19.4 (15.6 - 23.2)South Kona 10,750 2,372 22.1 (19.2 - 24.9)North Kona 40,480 8,435 20.8 (19.1 - 22.6)South Kohala 18,189 5,019 27.6 (24.6 - 30.6)North Kohala 6,550 1,717 26.2 (22.3 - 30.1)Hämakuä 9,618 2,351 24.4 (22.3 - 26.6)
Maui County 158,820 36,060 22.7 (21.9 - 23.5)Häna 1,898 541 28.5 (25.9 - 31.1)Makawao 42,213 9,187 21.8 (20.2 - 23.3)Wailuku 82,092 19,122 23.3 (22.2 - 24.4)Lähainä 22,200 4,410 19.9 (17.9 - 21.9)Läna‘i 3,526 947 26.9 (21.4 - 32.4)Moloka‘i 6,885 1,809 26.3 (23.4 - 29.1)
Kaua‘i County 68,745 15,434 22.5 (21.3 - 23.6)Hanalei 7,754 1,770 22.8 (20.6 - 25.0)Kapa‘a 21,312 4,277 20.1 (18.1 - 22.0)Lïhu‘e 16,550 4,267 25.8 (23.1 - 28.5)Köloa 14,418 3,287 22.8 (20.3 - 25.3)Waimea 8,711 1,833 21.0 (18.4 - 23.7)
Source: U.S. Department of Commerce, U.S. Census Bureau, American Community Survey
Table 3-1: Population under 18 Years of Age, 2010-2014
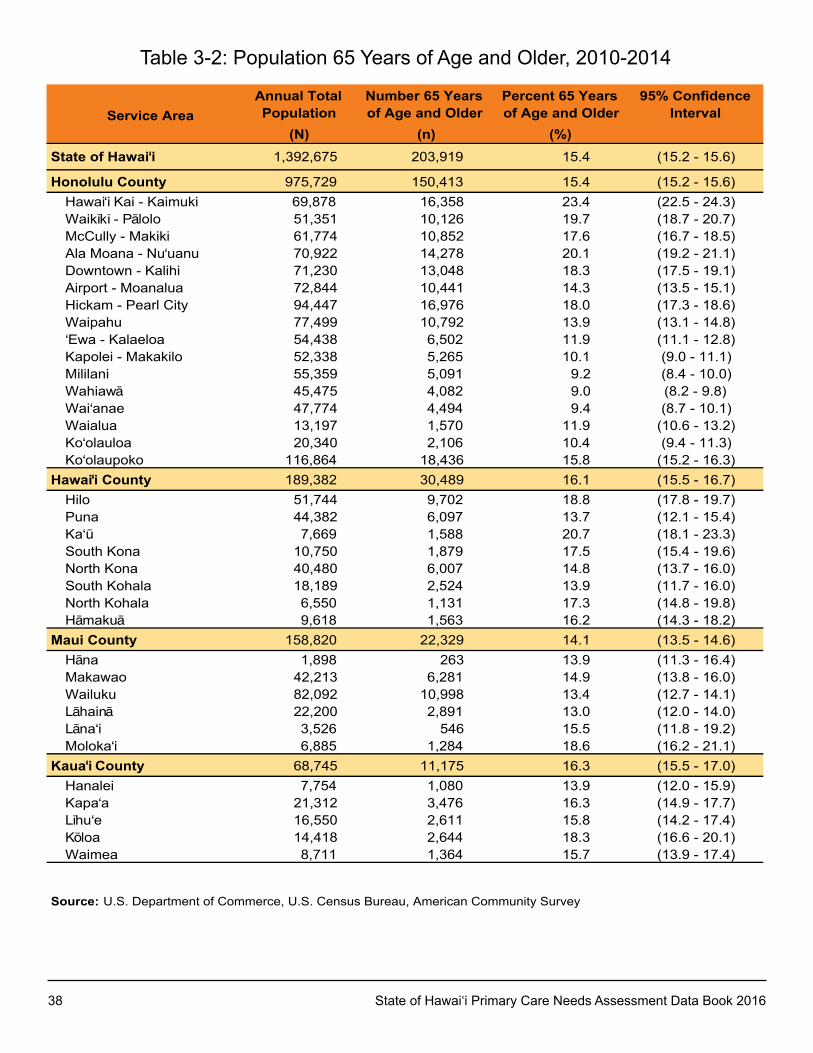
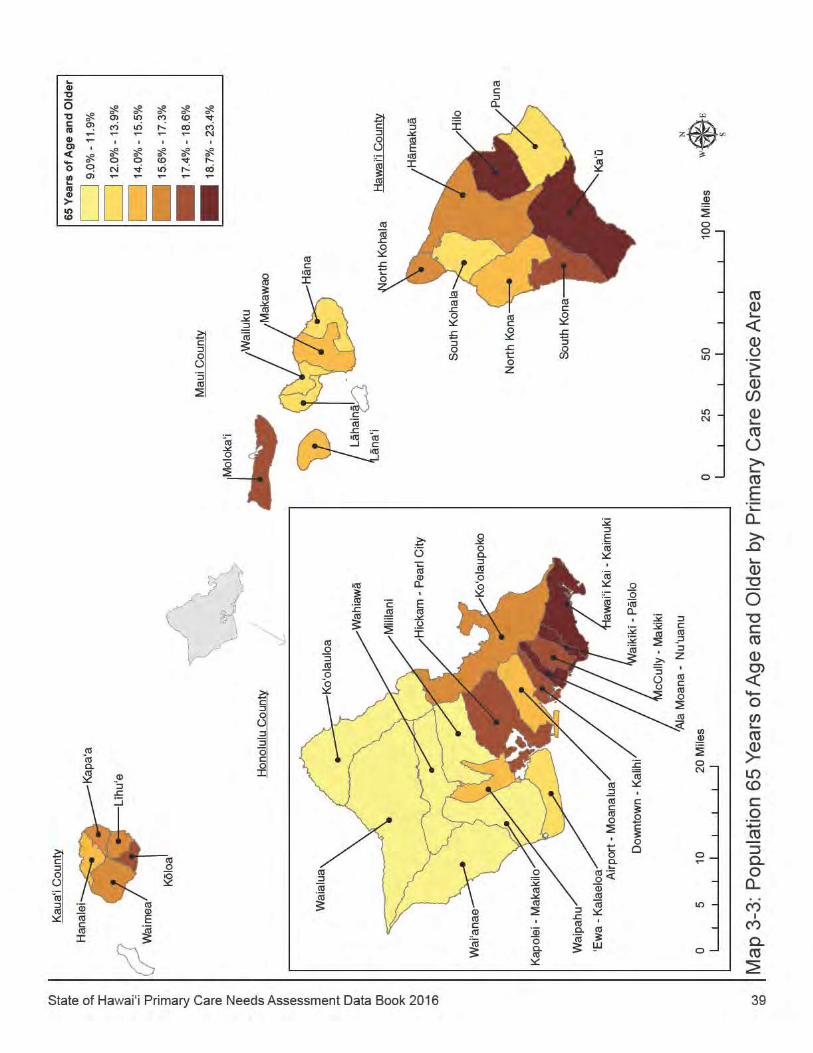
38 State of Hawai‘i Primary Care Needs Assessment Data Book 2016
Service AreaAnnual TotalPopulation
Number 65 Yearsof Age and Older
Percent 65 Yearsof Age and Older
95% ConfidenceInterval
(N) (n) (%)State of Hawai‘i 1,392,675 203,919 15.4 (15.2 - 15.6)
Honolulu County 975,729 150,413 15.4 (15.2 - 15.6)Hawai‘i Kai - Kaimuki 69,878 16,358 23.4 (22.5 - 24.3)Waikïkï - Pälolo 51,351 10,126 19.7 (18.7 - 20.7)McCully - Makiki 61,774 10,852 17.6 (16.7 - 18.5)Ala Moana - Nu‘uanu 70,922 14,278 20.1 (19.2 - 21.1)Downtown - Kalihi 71,230 13,048 18.3 (17.5 - 19.1)Airport - Moanalua 72,844 10,441 14.3 (13.5 - 15.1)Hickam - Pearl City 94,447 16,976 18.0 (17.3 - 18.6)Waipahu 77,499 10,792 13.9 (13.1 - 14.8)‘Ewa - Kalaeloa 54,438 6,502 11.9 (11.1 - 12.8)Kapolei - Makakilo 52,338 5,265 10.1 (9.0 - 11.1)Mililani 55,359 5,091 9.2 (8.4 - 10.0)Wahiawä 45,475 4,082 9.0 (8.2 - 9.8)Wai‘anae 47,774 4,494 9.4 (8.7 - 10.1)Waialua 13,197 1,570 11.9 (10.6 - 13.2)Ko‘olauloa 20,340 2,106 10.4 (9.4 - 11.3)Ko‘olaupoko 116,864 18,436 15.8 (15.2 - 16.3)
Hawai‘i County 189,382 30,489 16.1 (15.5 - 16.7)Hilo 51,744 9,702 18.8 (17.8 - 19.7)Puna 44,382 6,097 13.7 (12.1 - 15.4)Ka‘ü 7,669 1,588 20.7 (18.1 - 23.3)South Kona 10,750 1,879 17.5 (15.4 - 19.6)North Kona 40,480 6,007 14.8 (13.7 - 16.0)South Kohala 18,189 2,524 13.9 (11.7 - 16.0)North Kohala 6,550 1,131 17.3 (14.8 - 19.8)Hämakuä 9,618 1,563 16.2 (14.3 - 18.2)
Maui County 158,820 22,329 14.1 (13.5 - 14.6)Häna 1,898 263 13.9 (11.3 - 16.4)Makawao 42,213 6,281 14.9 (13.8 - 16.0)Wailuku 82,092 10,998 13.4 (12.7 - 14.1)Lähainä 22,200 2,891 13.0 (12.0 - 14.0)Läna‘i 3,526 546 15.5 (11.8 - 19.2)Moloka‘i 6,885 1,284 18.6 (16.2 - 21.1)
Kaua‘i County 68,745 11,175 16.3 (15.5 - 17.0)Hanalei 7,754 1,080 13.9 (12.0 - 15.9)Kapa‘a 21,312 3,476 16.3 (14.9 - 17.7)Lïhu‘e 16,550 2,611 15.8 (14.2 - 17.4)Köloa 14,418 2,644 18.3 (16.6 - 20.1)Waimea 8,711 1,364 15.7 (13.9 - 17.4)
Source: U.S. Department of Commerce, U.S. Census Bureau, American Community Survey
Table 3-2: Population 65 Years of Age and Older, 2010-2014
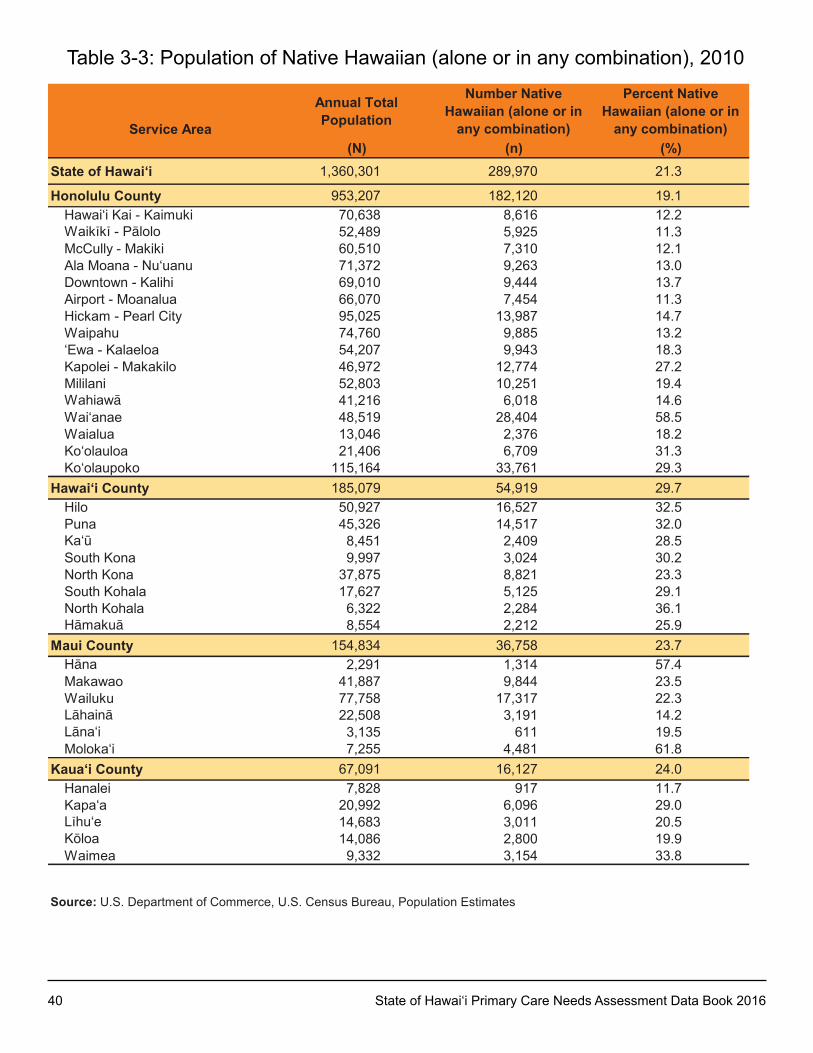
40 State of Hawai‘i Primary Care Needs Assessment Data Book 2016
Service Area
Annual Total Population
Number Native Hawaiian (alone or in
any combination)
Percent Native Hawaiian (alone or in
any combination)(N) (n) (%)
State of Hawai‘i 1,360,301 289,970 21.3
Honolulu County 953,207 182,120 19.1Hawai‘i Kai - Kaimuki 70,638 8,616 12.2Waikïkï - Pälolo 52,489 5,925 11.3McCully - Makiki 60,510 7,310 12.1Ala Moana - Nu‘uanu 71,372 9,263 13.0Downtown - kalihi 69,010 9,444 13.7Airport - Moanalua 66,070 7,454 11.3Hickam - Pearl City 95,025 13,987 14.7Waipahu 74,760 9,885 13.2‘Ewa - Kalaeloa 54,207 9,943 18.3kapolei - Makakilo 46,972 12,774 27.2Mililani 52,803 10,251 19.4Wahiawä 41,216 6,018 14.6Wai‘anae 48,519 28,404 58.5Waialua 13,046 2,376 18.2Ko‘olauloa 21,406 6,709 31.3Ko‘olaupoko 115,164 33,761 29.3
Hawai‘i County 185,079 54,919 29.7Hilo 50,927 16,527 32.5Puna 45,326 14,517 32.0Ka‘ü 8,451 2,409 28.5South kona 9,997 3,024 30.2North kona 37,875 8,821 23.3South kohala 17,627 5,125 29.1North kohala 6,322 2,284 36.1Hämakuä 8,554 2,212 25.9
Maui County 154,834 36,758 23.7Häna 2,291 1,314 57.4Makawao 41,887 9,844 23.5Wailuku 77,758 17,317 22.3Lähainä 22,508 3,191 14.2Läna‘i 3,135 611 19.5Moloka‘i 7,255 4,481 61.8
Kaua‘i County 67,091 16,127 24.0Hanalei 7,828 917 11.7Kapa‘a 20,992 6,096 29.0Lïhu‘e 14,683 3,011 20.5köloa 14,086 2,800 19.9Waimea 9,332 3,154 33.8
Source: u.S. Department of Commerce, u.S. Census Bureau, Population Estimates
Table 3-3: Population of Native Hawaiian (alone or in any combination), 2010
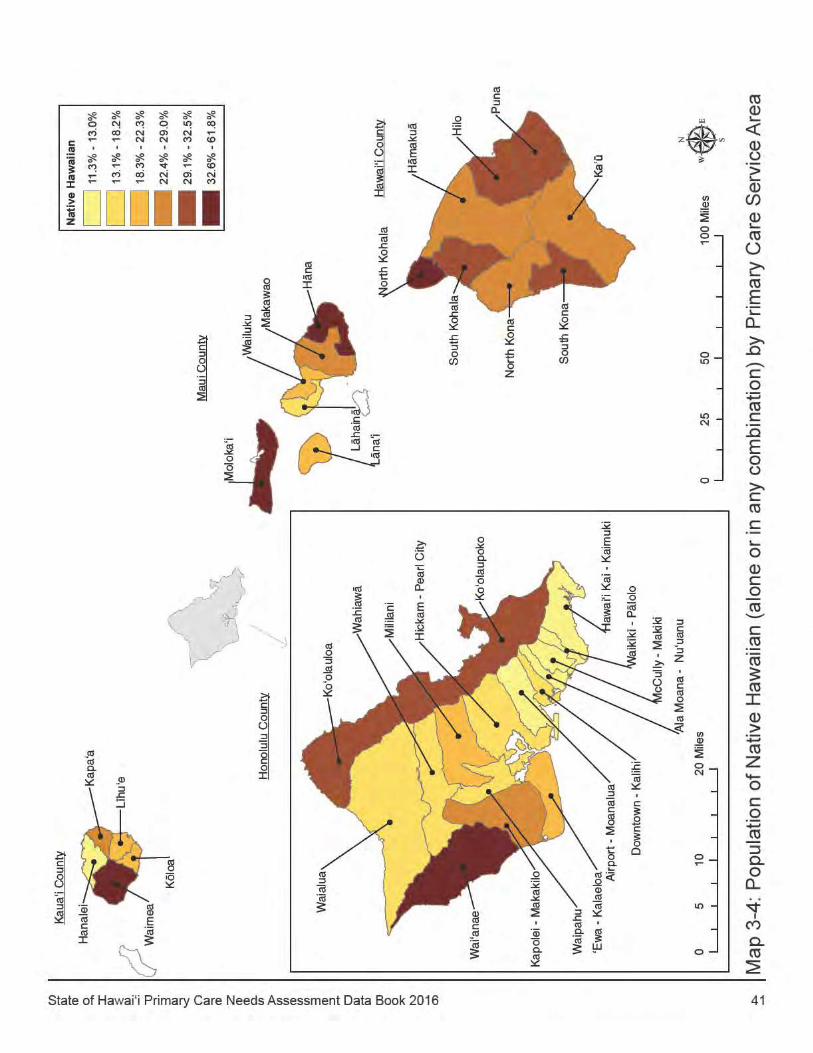
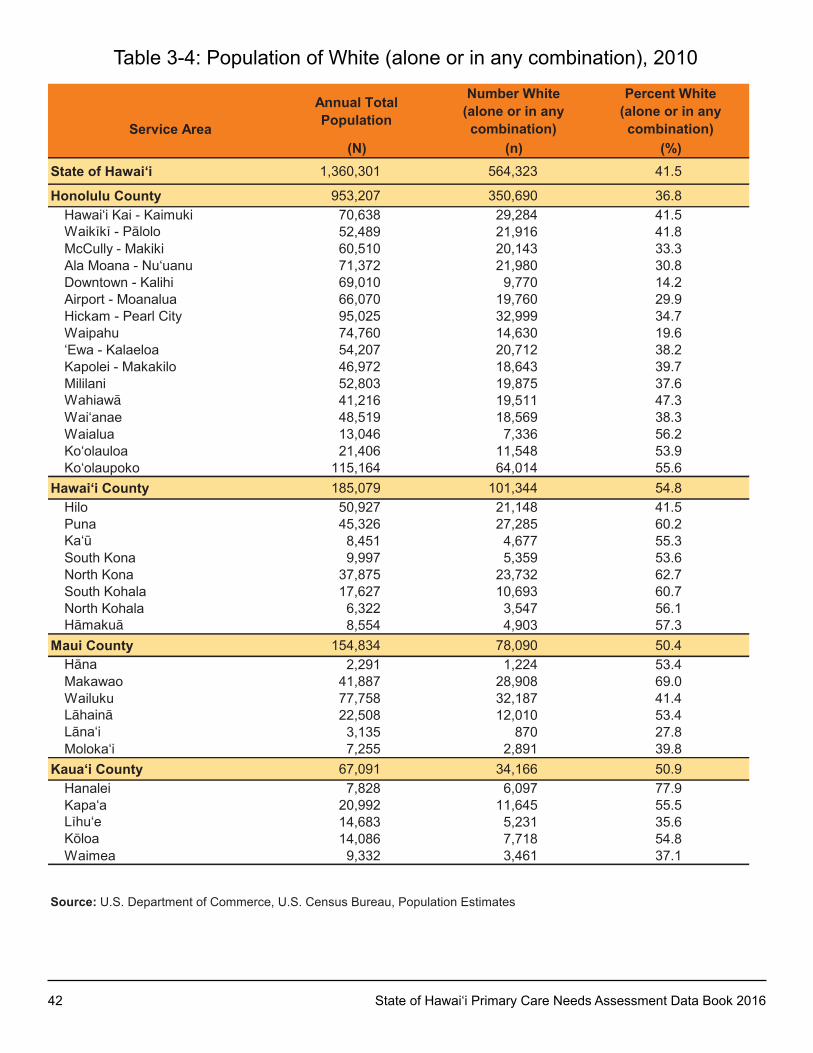
42 State of Hawai‘i Primary Care Needs Assessment Data Book 2016
Service Area
Annual Total Population
Number White (alone or in any combination)
Percent White (alone or in any combination)
(N) (n) (%)State of Hawai‘i 1,360,301 564,323 41.5
Honolulu County 953,207 350,690 36.8Hawai‘i Kai - Kaimuki 70,638 29,284 41.5Waikïkï - Pälolo 52,489 21,916 41.8McCully - Makiki 60,510 20,143 33.3Ala Moana - Nu‘uanu 71,372 21,980 30.8Downtown - kalihi 69,010 9,770 14.2Airport - Moanalua 66,070 19,760 29.9Hickam - Pearl City 95,025 32,999 34.7Waipahu 74,760 14,630 19.6‘Ewa - Kalaeloa 54,207 20,712 38.2kapolei - Makakilo 46,972 18,643 39.7Mililani 52,803 19,875 37.6Wahiawä 41,216 19,511 47.3Wai‘anae 48,519 18,569 38.3Waialua 13,046 7,336 56.2Ko‘olauloa 21,406 11,548 53.9Ko‘olaupoko 115,164 64,014 55.6
Hawai‘i County 185,079 101,344 54.8Hilo 50,927 21,148 41.5Puna 45,326 27,285 60.2Ka‘ü 8,451 4,677 55.3South kona 9,997 5,359 53.6North kona 37,875 23,732 62.7South kohala 17,627 10,693 60.7North kohala 6,322 3,547 56.1Hämakuä 8,554 4,903 57.3
Maui County 154,834 78,090 50.4Häna 2,291 1,224 53.4Makawao 41,887 28,908 69.0Wailuku 77,758 32,187 41.4Lähainä 22,508 12,010 53.4Läna‘i 3,135 870 27.8Moloka‘i 7,255 2,891 39.8
Kaua‘i County 67,091 34,166 50.9Hanalei 7,828 6,097 77.9Kapa‘a 20,992 11,645 55.5Lïhu‘e 14,683 5,231 35.6köloa 14,086 7,718 54.8Waimea 9,332 3,461 37.1
Source: u.S. Department of Commerce, u.S. Census Bureau, Population Estimates
Table 3-4: Population of White (alone or in any combination), 2010
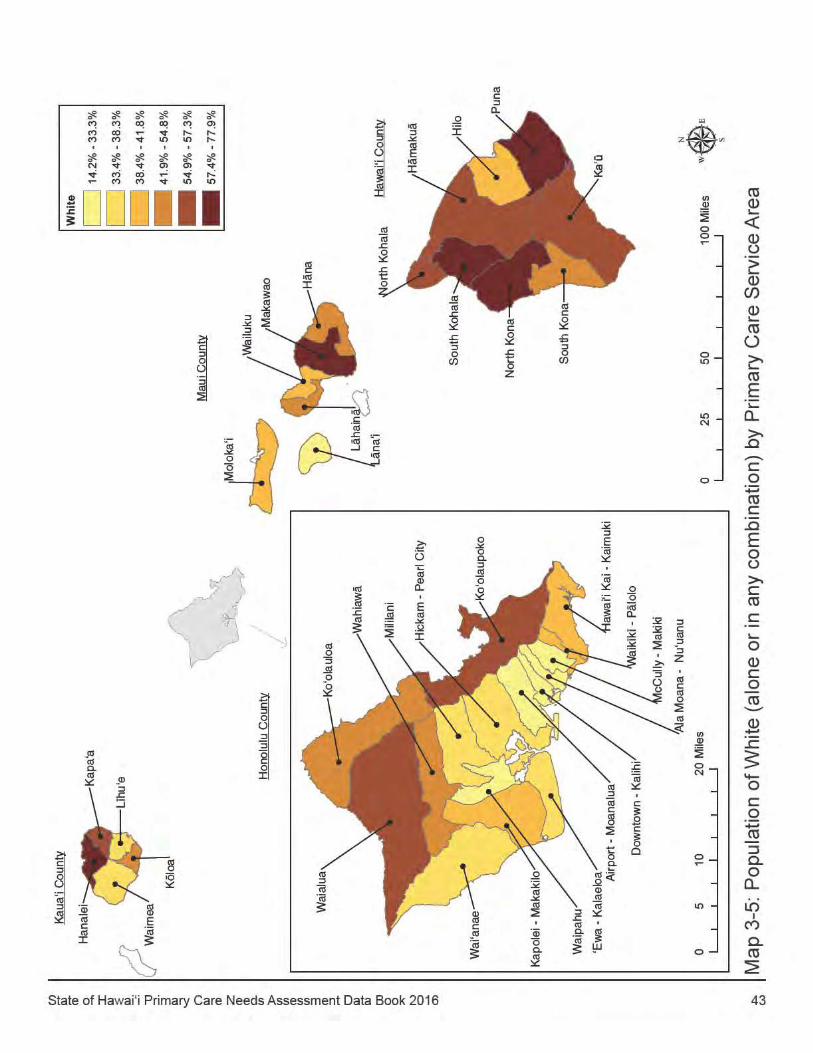

44 State of Hawai‘i Primary Care Needs Assessment Data Book 2016
Service Area
Annual Total Population
Number Filipino (alone or in any combination)
Percent Filipino (alone or in any combination)
(N) (n) (%)State of Hawai‘i 1,360,301 342,095 25.1
Honolulu County 953,207 234,894 24.6Hawai‘i Kai - Kaimuki 70,638 4,912 7.0Waikïkï - Pälolo 52,489 4,434 8.4McCully - Makiki 60,510 5,932 9.8Ala Moana - Nu‘uanu 71,372 7,414 10.4Downtown - kalihi 69,010 25,044 36.3Airport - Moanalua 66,070 21,080 31.9Hickam - Pearl City 95,025 22,587 23.8Waipahu 74,760 40,652 54.4‘Ewa - Kalaeloa 54,207 14,391 26.5kapolei - Makakilo 46,972 19,365 41.2Mililani 52,803 22,853 43.3Wahiawä 41,216 11,095 26.9Wai‘anae 48,519 13,729 28.3Waialua 13,046 3,787 29.0Ko‘olauloa 21,406 2,614 12.2Ko‘olaupoko 115,164 15,005 13.0
Hawai‘i County 185,079 40,878 22.1Hilo 50,927 11,264 22.1Puna 45,326 11,046 24.4Ka‘ü 8,451 2,051 24.3South kona 9,997 1,668 16.7North kona 37,875 6,181 16.3South kohala 17,627 3,285 18.6North kohala 6,322 2,075 32.8Hämakuä 8,554 3,308 38.7
Maui County 154,834 44,892 29.0Häna 2,291 277 12.1Makawao 41,887 6,551 15.6Wailuku 77,758 27,299 35.1Lähainä 22,508 6,516 29.0Läna‘i 3,135 2,003 63.9Moloka‘i 7,255 2,246 31.0
Kaua‘i County 67,091 21,423 31.9Hanalei 7,828 942 12.0Kapa‘a 20,992 5,331 25.4Lïhu‘e 14,683 6,694 45.6köloa 14,086 4,432 31.5Waimea 9,332 4,014 43.0
Source: u.S. Department of Commerce, u.S. Census Bureau, Population Estimates
Table 3-5: Population of Filipino (alone or in any combination), 2010
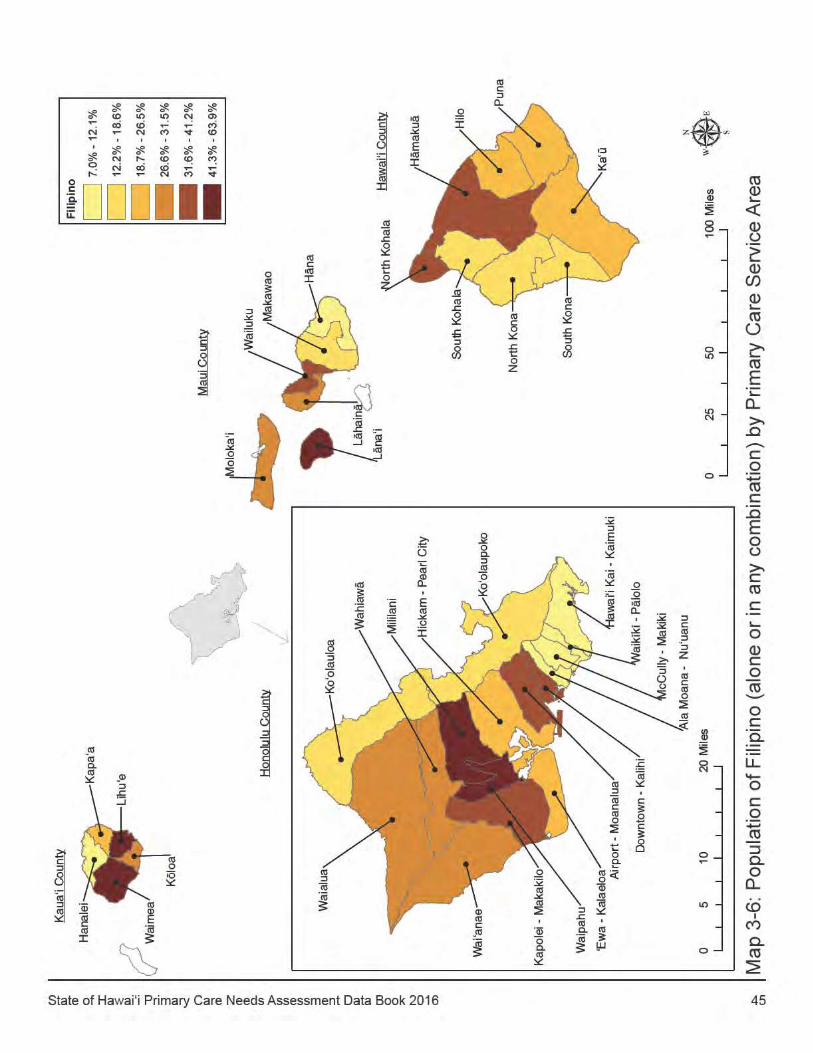
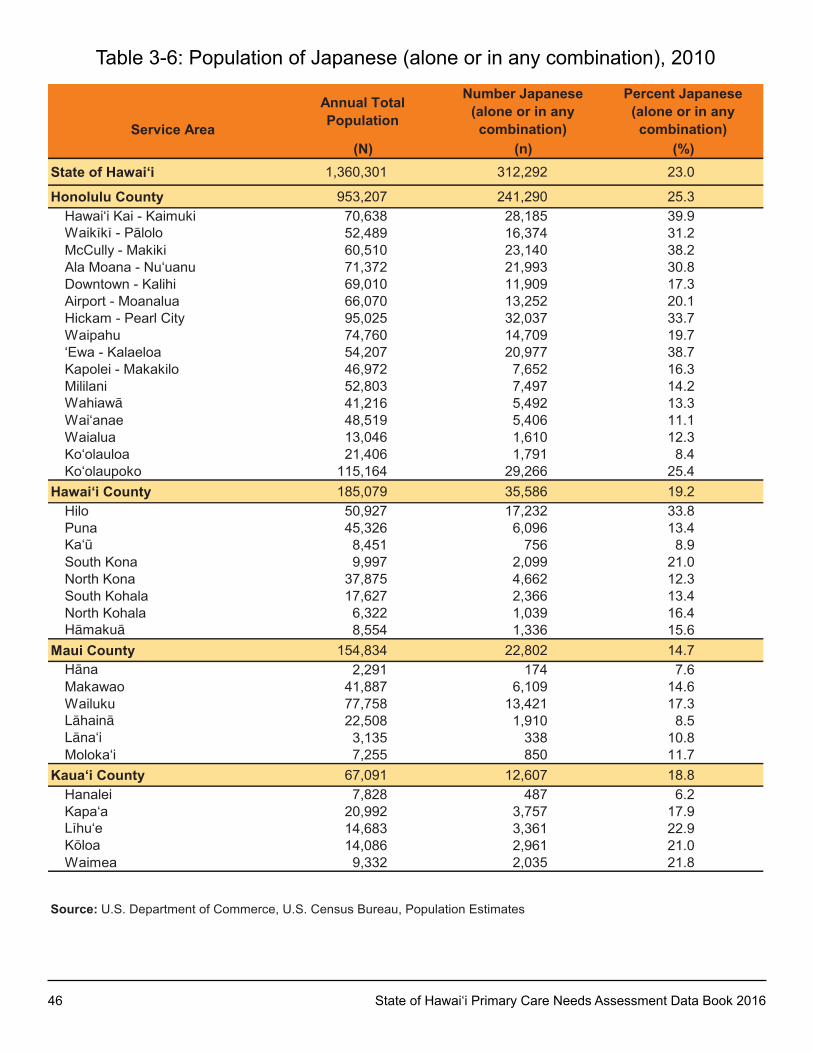
46 State of Hawai‘i Primary Care Needs Assessment Data Book 2016
Service Area
Annual Total Population
Number Japanese (alone or in any combination)
Percent Japanese (alone or in any combination)
(N) (n) (%)State of Hawai‘i 1,360,301 312,292 23.0
Honolulu County 953,207 241,290 25.3Hawai‘i Kai - Kaimuki 70,638 28,185 39.9Waikïkï - Pälolo 52,489 16,374 31.2McCully - Makiki 60,510 23,140 38.2Ala Moana - Nu‘uanu 71,372 21,993 30.8Downtown - kalihi 69,010 11,909 17.3Airport - Moanalua 66,070 13,252 20.1Hickam - Pearl City 95,025 32,037 33.7Waipahu 74,760 14,709 19.7‘Ewa - Kalaeloa 54,207 20,977 38.7kapolei - Makakilo 46,972 7,652 16.3Mililani 52,803 7,497 14.2Wahiawä 41,216 5,492 13.3Wai‘anae 48,519 5,406 11.1Waialua 13,046 1,610 12.3Ko‘olauloa 21,406 1,791 8.4Ko‘olaupoko 115,164 29,266 25.4
Hawai‘i County 185,079 35,586 19.2Hilo 50,927 17,232 33.8Puna 45,326 6,096 13.4Ka‘ü 8,451 756 8.9South kona 9,997 2,099 21.0North kona 37,875 4,662 12.3South kohala 17,627 2,366 13.4North kohala 6,322 1,039 16.4Hämakuä 8,554 1,336 15.6
Maui County 154,834 22,802 14.7Häna 2,291 174 7.6Makawao 41,887 6,109 14.6Wailuku 77,758 13,421 17.3Lähainä 22,508 1,910 8.5Läna‘i 3,135 338 10.8Moloka‘i 7,255 850 11.7
Kaua‘i County 67,091 12,607 18.8Hanalei 7,828 487 6.2Kapa‘a 20,992 3,757 17.9Lïhu‘e 14,683 3,361 22.9köloa 14,086 2,961 21.0Waimea 9,332 2,035 21.8
Source: u.S. Department of Commerce, u.S. Census Bureau, Population Estimates
Table 3-6: Population of Japanese (alone or in any combination), 2010
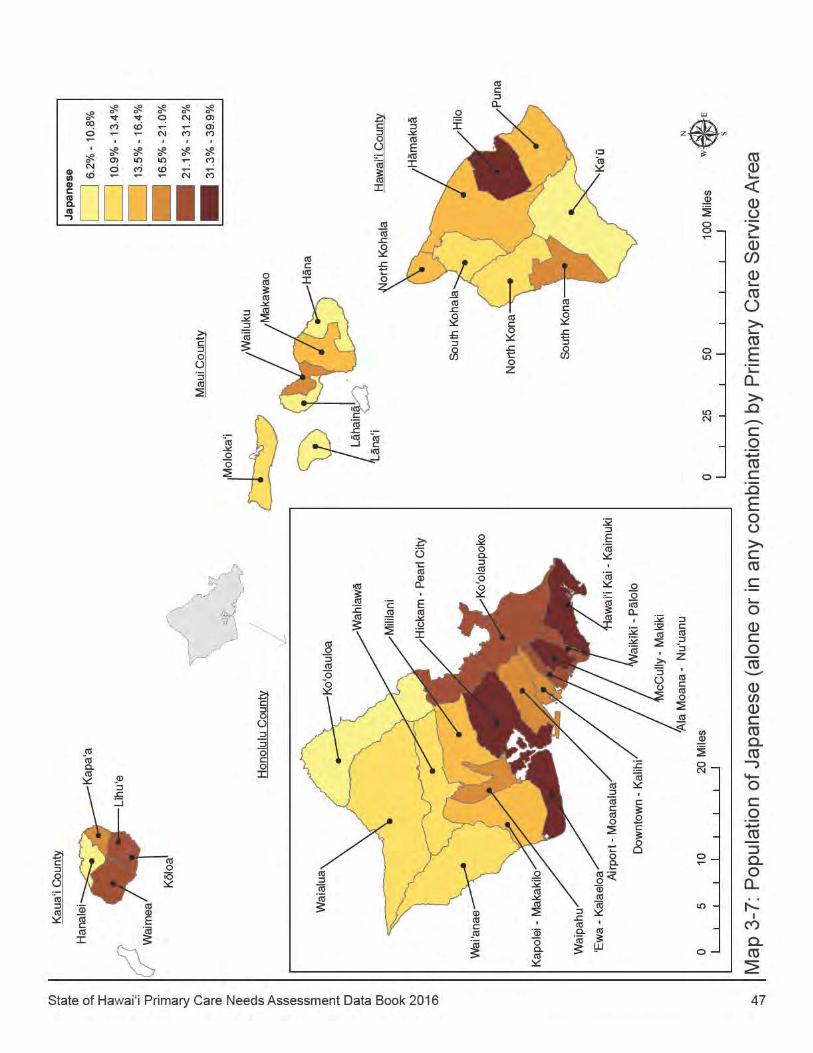
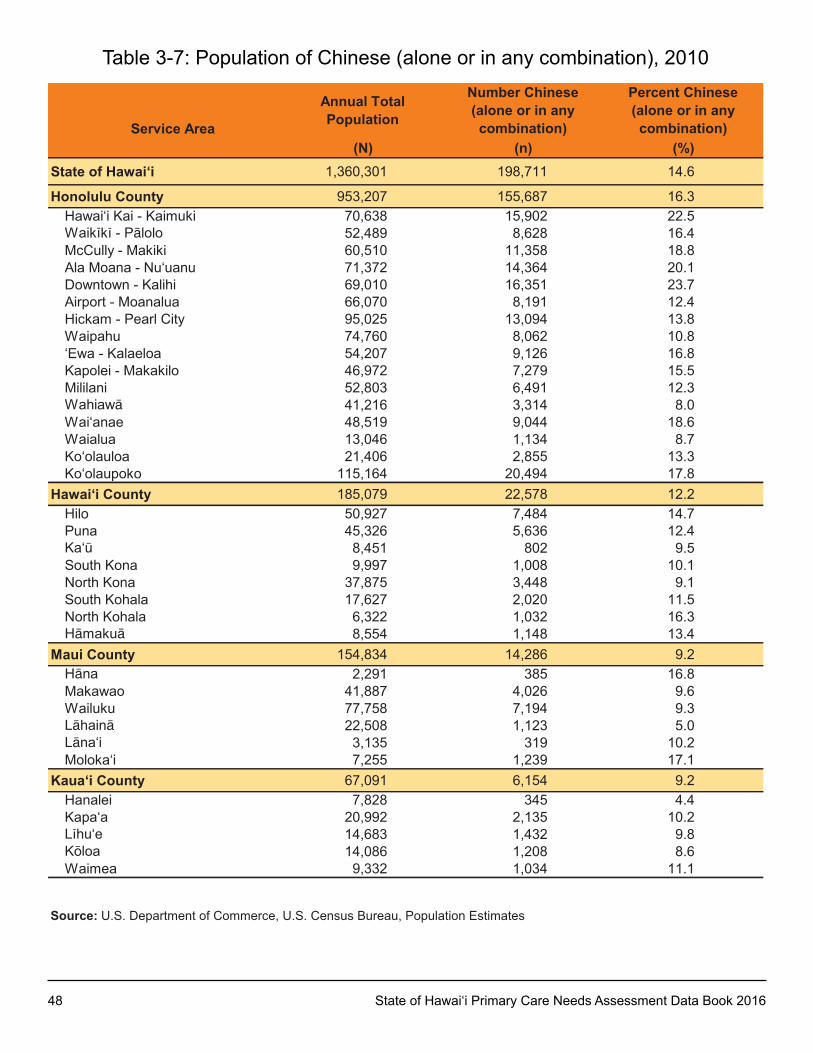
48 State of Hawai‘i Primary Care Needs Assessment Data Book 2016
Service Area
Annual Total Population
Number Chinese (alone or in any combination)
Percent Chinese (alone or in any combination)
(N) (n) (%)State of Hawai‘i 1,360,301 198,711 14.6
Honolulu County 953,207 155,687 16.3Hawai‘i Kai - Kaimuki 70,638 15,902 22.5Waikïkï - Pälolo 52,489 8,628 16.4McCully - Makiki 60,510 11,358 18.8Ala Moana - Nu‘uanu 71,372 14,364 20.1Downtown - kalihi 69,010 16,351 23.7Airport - Moanalua 66,070 8,191 12.4Hickam - Pearl City 95,025 13,094 13.8Waipahu 74,760 8,062 10.8‘Ewa - Kalaeloa 54,207 9,126 16.8kapolei - Makakilo 46,972 7,279 15.5Mililani 52,803 6,491 12.3Wahiawä 41,216 3,314 8.0Wai‘anae 48,519 9,044 18.6Waialua 13,046 1,134 8.7Ko‘olauloa 21,406 2,855 13.3Ko‘olaupoko 115,164 20,494 17.8
Hawai‘i County 185,079 22,578 12.2Hilo 50,927 7,484 14.7Puna 45,326 5,636 12.4Ka‘ü 8,451 802 9.5South kona 9,997 1,008 10.1North kona 37,875 3,448 9.1South kohala 17,627 2,020 11.5North kohala 6,322 1,032 16.3Hämakuä 8,554 1,148 13.4
Maui County 154,834 14,286 9.2Häna 2,291 385 16.8Makawao 41,887 4,026 9.6Wailuku 77,758 7,194 9.3Lähainä 22,508 1,123 5.0Läna‘i 3,135 319 10.2Moloka‘i 7,255 1,239 17.1
Kaua‘i County 67,091 6,154 9.2Hanalei 7,828 345 4.4Kapa‘a 20,992 2,135 10.2Lïhu‘e 14,683 1,432 9.8köloa 14,086 1,208 8.6Waimea 9,332 1,034 11.1
Source: u.S. Department of Commerce, u.S. Census Bureau, Population Estimates
Table 3-7: Population of Chinese (alone or in any combination), 2010
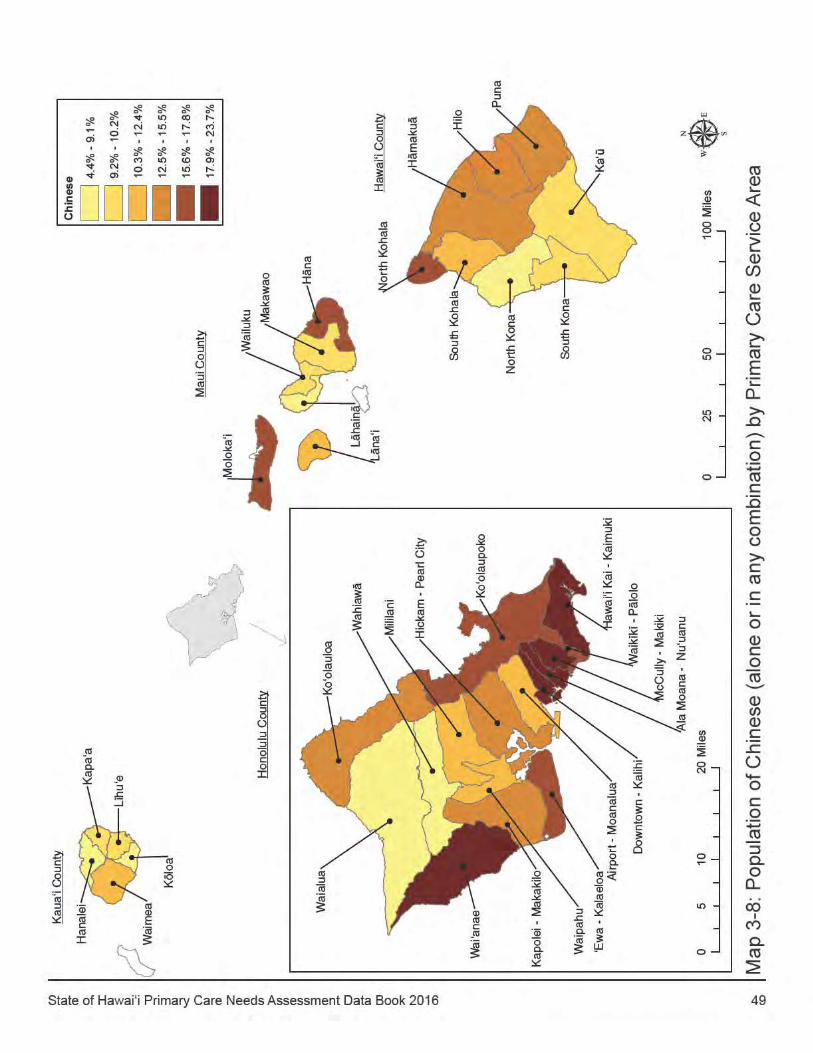
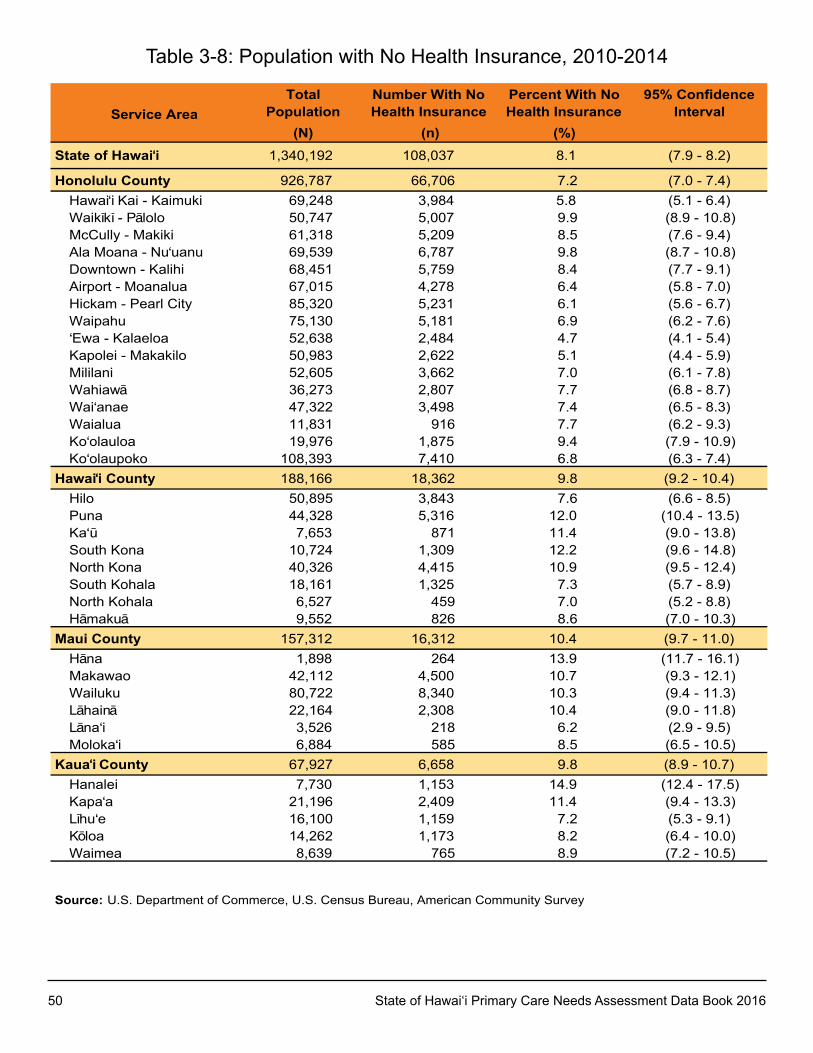
50 State of Hawai‘i Primary Care Needs Assessment Data Book 2016
Service AreaTotal
PopulationNumber With No Health Insurance
Percent With No Health Insurance
95% Confidence Interval
(N) (n) (%)State of Hawai‘i 1,340,192 108,037 8.1 (7.9 - 8.2)
Honolulu County 926,787 66,706 7.2 (7.0 - 7.4)Hawai‘i Kai - Kaimuki 69,248 3,984 5.8 (5.1 - 6.4)Waikïkï - Pälolo 50,747 5,007 9.9 (8.9 - 10.8)McCully - Makiki 61,318 5,209 8.5 (7.6 - 9.4)Ala Moana - Nu‘uanu 69,539 6,787 9.8 (8.7 - 10.8)Downtown - Kalihi 68,451 5,759 8.4 (7.7 - 9.1)Airport - Moanalua 67,015 4,278 6.4 (5.8 - 7.0)Hickam - Pearl City 85,320 5,231 6.1 (5.6 - 6.7)Waipahu 75,130 5,181 6.9 (6.2 - 7.6)‘Ewa - Kalaeloa 52,638 2,484 4.7 (4.1 - 5.4)Kapolei - Makakilo 50,983 2,622 5.1 (4.4 - 5.9)Mililani 52,605 3,662 7.0 (6.1 - 7.8)Wahiawä 36,273 2,807 7.7 (6.8 - 8.7)Wai‘anae 47,322 3,498 7.4 (6.5 - 8.3)Waialua 11,831 916 7.7 (6.2 - 9.3)Ko‘olauloa 19,976 1,875 9.4 (7.9 - 10.9)Ko‘olaupoko 108,393 7,410 6.8 (6.3 - 7.4)
Hawai‘i County 188,166 18,362 9.8 (9.2 - 10.4)Hilo 50,895 3,843 7.6 (6.6 - 8.5)Puna 44,328 5,316 12.0 (10.4 - 13.5)Ka‘ü 7,653 871 11.4 (9.0 - 13.8)South Kona 10,724 1,309 12.2 (9.6 - 14.8)North Kona 40,326 4,415 10.9 (9.5 - 12.4)South Kohala 18,161 1,325 7.3 (5.7 - 8.9)North Kohala 6,527 459 7.0 (5.2 - 8.8)Hämakuä 9,552 826 8.6 (7.0 - 10.3)
Maui County 157,312 16,312 10.4 (9.7 - 11.0)Häna 1,898 264 13.9 (11.7 - 16.1)Makawao 42,112 4,500 10.7 (9.3 - 12.1)Wailuku 80,722 8,340 10.3 (9.4 - 11.3)Lähainä 22,164 2,308 10.4 (9.0 - 11.8)Läna‘i 3,526 218 6.2 (2.9 - 9.5)Moloka‘i 6,884 585 8.5 (6.5 - 10.5)
Kaua‘i County 67,927 6,658 9.8 (8.9 - 10.7)Hanalei 7,730 1,153 14.9 (12.4 - 17.5)Kapa‘a 21,196 2,409 11.4 (9.4 - 13.3)Lïhu‘e 16,100 1,159 7.2 (5.3 - 9.1)Köloa 14,262 1,173 8.2 (6.4 - 10.0)Waimea 8,639 765 8.9 (7.2 - 10.5)
Source: U.S. Department of Commerce, U.S. Census Bureau, American Community Survey
Table 3-8: Population with No Health Insurance, 2010-2014
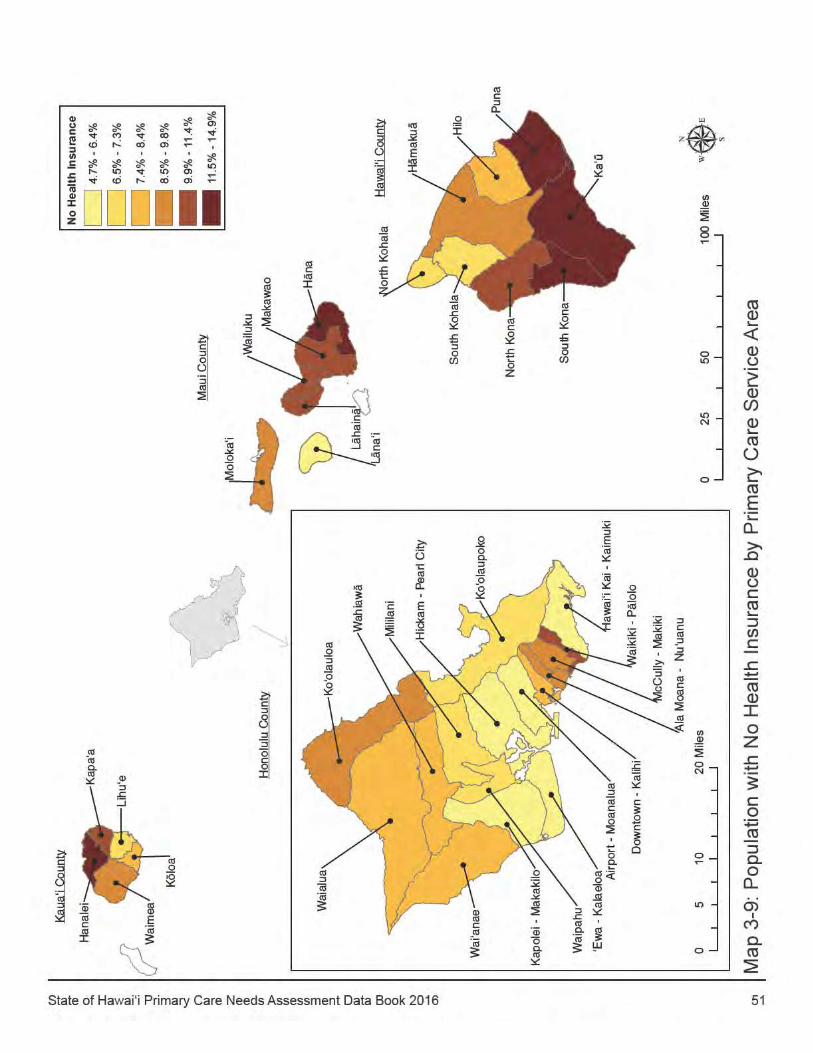
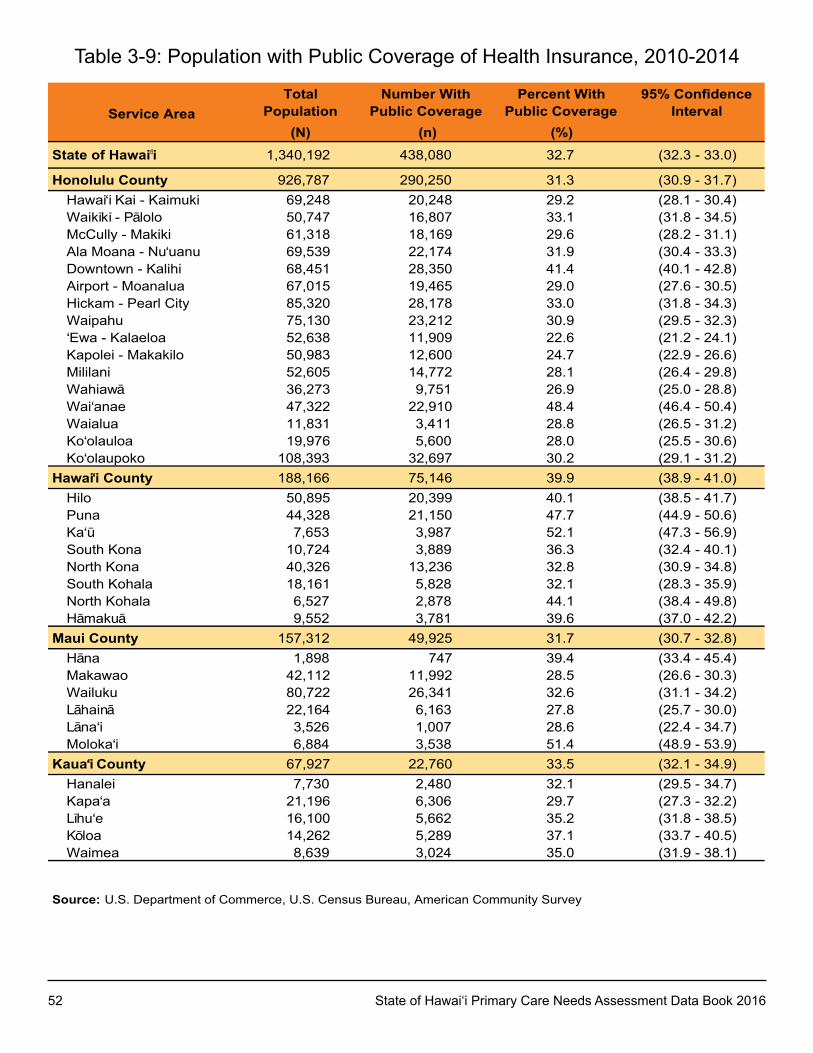
52 State of Hawai‘i Primary Care Needs Assessment Data Book 2016
Service AreaTotal
PopulationNumber With
Public CoveragePercent With
Public Coverage95% Confidence
Interval(N) (n) (%)
State of Hawai i 1,340,192 438,080 32.7 (32.3 - 33.0)
Honolulu County 926,787 290,250 31.3 (30.9 - 31.7)Hawai‘i Kai - Kaimuki 69,248 20,248 29.2 (28.1 - 30.4)Waikïkï - Pälolo 50,747 16,807 33.1 (31.8 - 34.5)McCully - Makiki 61,318 18,169 29.6 (28.2 - 31.1)Ala Moana - Nu‘uanu 69,539 22,174 31.9 (30.4 - 33.3)Downtown - Kalihi 68,451 28,350 41.4 (40.1 - 42.8)Airport - Moanalua 67,015 19,465 29.0 (27.6 - 30.5)Hickam - Pearl City 85,320 28,178 33.0 (31.8 - 34.3)Waipahu 75,130 23,212 30.9 (29.5 - 32.3)‘Ewa - Kalaeloa 52,638 11,909 22.6 (21.2 - 24.1)Kapolei - Makakilo 50,983 12,600 24.7 (22.9 - 26.6)Mililani 52,605 14,772 28.1 (26.4 - 29.8)Wahiawä 36,273 9,751 26.9 (25.0 - 28.8)Wai‘anae 47,322 22,910 48.4 (46.4 - 50.4)Waialua 11,831 3,411 28.8 (26.5 - 31.2)Ko‘olauloa 19,976 5,600 28.0 (25.5 - 30.6)Ko‘olaupoko 108,393 32,697 30.2 (29.1 - 31.2)
Hawai‘i County 188,166 75,146 39.9 (38.9 - 41.0)Hilo 50,895 20,399 40.1 (38.5 - 41.7)Puna 44,328 21,150 47.7 (44.9 - 50.6)Ka‘ü 7,653 3,987 52.1 (47.3 - 56.9)South Kona 10,724 3,889 36.3 (32.4 - 40.1)North Kona 40,326 13,236 32.8 (30.9 - 34.8)South Kohala 18,161 5,828 32.1 (28.3 - 35.9)North Kohala 6,527 2,878 44.1 (38.4 - 49.8)Hämakuä 9,552 3,781 39.6 (37.0 - 42.2)
Maui County 157,312 49,925 31.7 (30.7 - 32.8)Häna 1,898 747 39.4 (33.4 - 45.4)Makawao 42,112 11,992 28.5 (26.6 - 30.3)Wailuku 80,722 26,341 32.6 (31.1 - 34.2)Lähainä 22,164 6,163 27.8 (25.7 - 30.0)Läna‘i 3,526 1,007 28.6 (22.4 - 34.7)Moloka‘i 6,884 3,538 51.4 (48.9 - 53.9)
Kaua‘i County 67,927 22,760 33.5 (32.1 - 34.9)Hanalei 7,730 2,480 32.1 (29.5 - 34.7)Kapa‘a 21,196 6,306 29.7 (27.3 - 32.2)Lïhu‘e 16,100 5,662 35.2 (31.8 - 38.5)Köloa 14,262 5,289 37.1 (33.7 - 40.5)Waimea 8,639 3,024 35.0 (31.9 - 38.1)
Source: U.S. Department of Commerce, U.S. Census Bureau, American Community Survey
Table 3-9: Population with Public Coverage of Health Insurance, 2010-2014
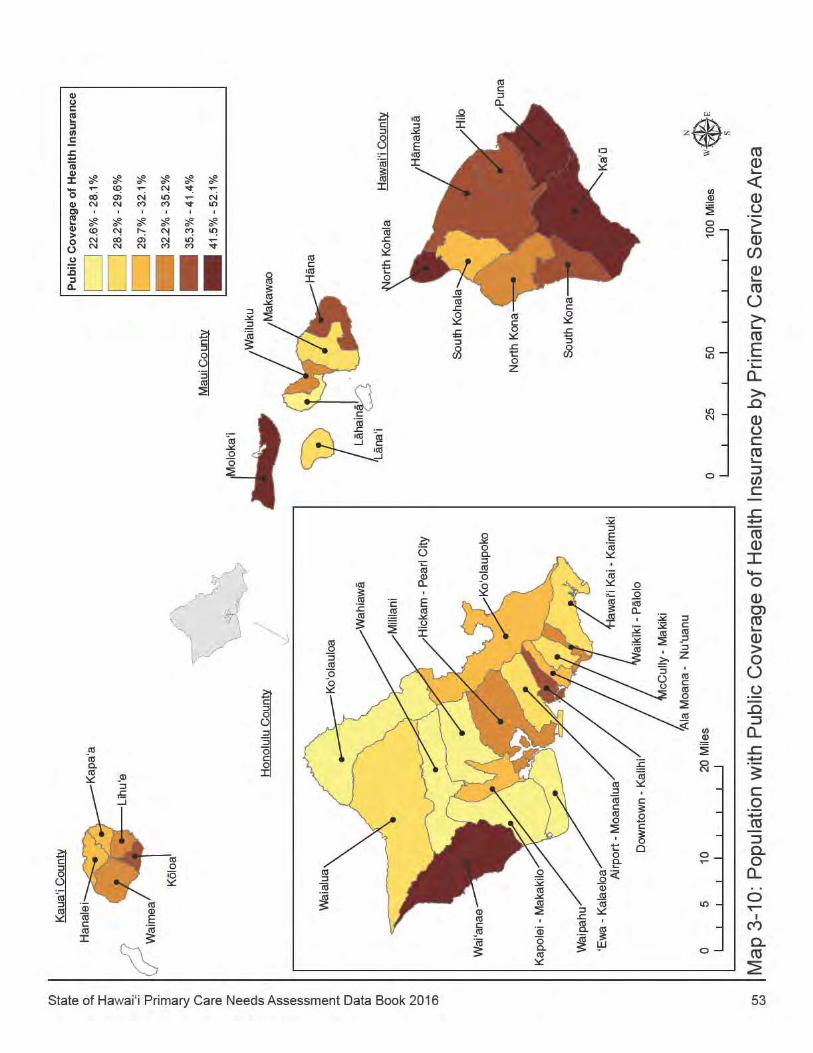
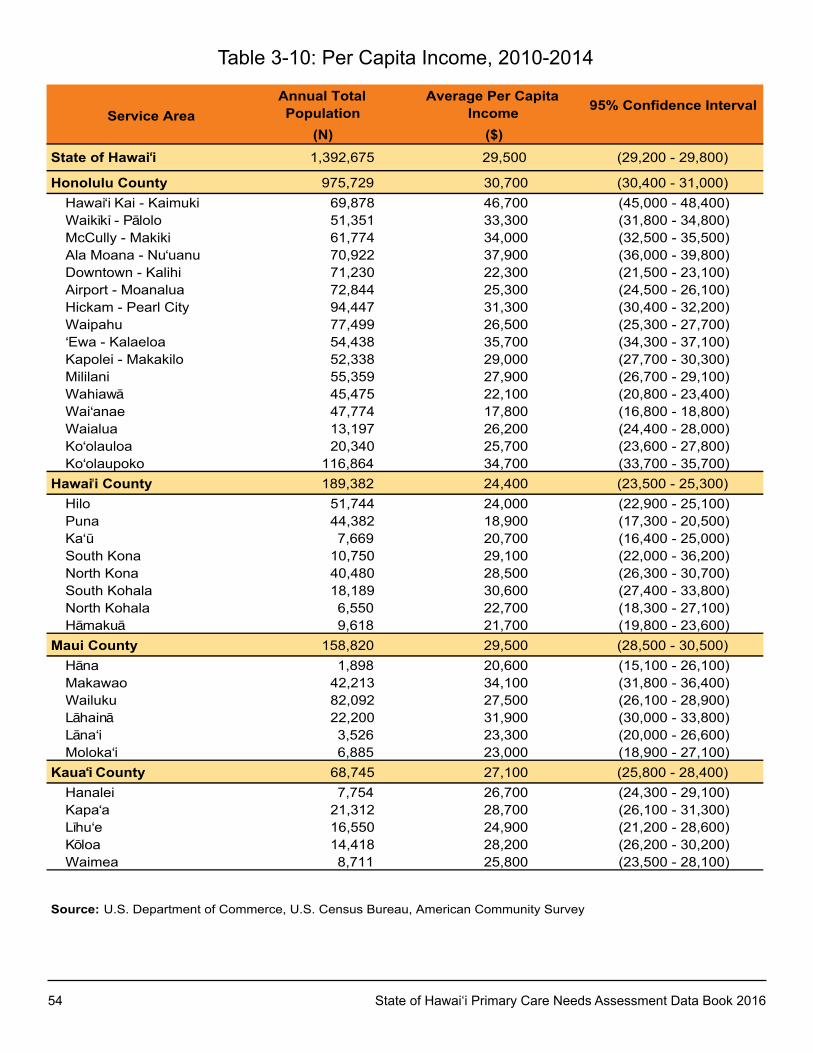
54 State of Hawai‘i Primary Care Needs Assessment Data Book 2016
Service AreaAnnual Total Population
Average Per Capita Income 95% Confidence Interval
(N) ($)State of Hawai‘i 1,392,675 29,500 (29,200 - 29,800)
Honolulu County 975,729 30,700 (30,400 - 31,000)Hawai‘i Kai - Kaimuki 69,878 46,700 (45,000 - 48,400)Waikïkï - Pälolo 51,351 33,300 (31,800 - 34,800)McCully - Makiki 61,774 34,000 (32,500 - 35,500)Ala Moana - Nu‘uanu 70,922 37,900 (36,000 - 39,800)Downtown - Kalihi 71,230 22,300 (21,500 - 23,100)Airport - Moanalua 72,844 25,300 (24,500 - 26,100)Hickam - Pearl City 94,447 31,300 (30,400 - 32,200)Waipahu 77,499 26,500 (25,300 - 27,700)‘Ewa - Kalaeloa 54,438 35,700 (34,300 - 37,100)Kapolei - Makakilo 52,338 29,000 (27,700 - 30,300)Mililani 55,359 27,900 (26,700 - 29,100)Wahiawä 45,475 22,100 (20,800 - 23,400)Wai‘anae 47,774 17,800 (16,800 - 18,800)Waialua 13,197 26,200 (24,400 - 28,000)Ko‘olauloa 20,340 25,700 (23,600 - 27,800)Ko‘olaupoko 116,864 34,700 (33,700 - 35,700)
Hawai i County 189,382 24,400 (23,500 - 25,300)Hilo 51,744 24,000 (22,900 - 25,100)Puna 44,382 18,900 (17,300 - 20,500)Ka‘ü 7,669 20,700 (16,400 - 25,000)South Kona 10,750 29,100 (22,000 - 36,200)North Kona 40,480 28,500 (26,300 - 30,700)South Kohala 18,189 30,600 (27,400 - 33,800)North Kohala 6,550 22,700 (18,300 - 27,100)Hämakuä 9,618 21,700 (19,800 - 23,600)
Maui County 158,820 29,500 (28,500 - 30,500)Häna 1,898 20,600 (15,100 - 26,100)Makawao 42,213 34,100 (31,800 - 36,400)Wailuku 82,092 27,500 (26,100 - 28,900)Lähainä 22,200 31,900 (30,000 - 33,800)Läna‘i 3,526 23,300 (20,000 - 26,600)Moloka‘i 6,885 23,000 (18,900 - 27,100)
Kaua‘i County 68,745 27,100 (25,800 - 28,400)Hanalei 7,754 26,700 (24,300 - 29,100)Kapa‘a 21,312 28,700 (26,100 - 31,300)Lïhu‘e 16,550 24,900 (21,200 - 28,600)Köloa 14,418 28,200 (26,200 - 30,200)Waimea 8,711 25,800 (23,500 - 28,100)
Source: U.S. Department of Commerce, U.S. Census Bureau, American Community Survey
Table 3-10: Per Capita Income, 2010-2014
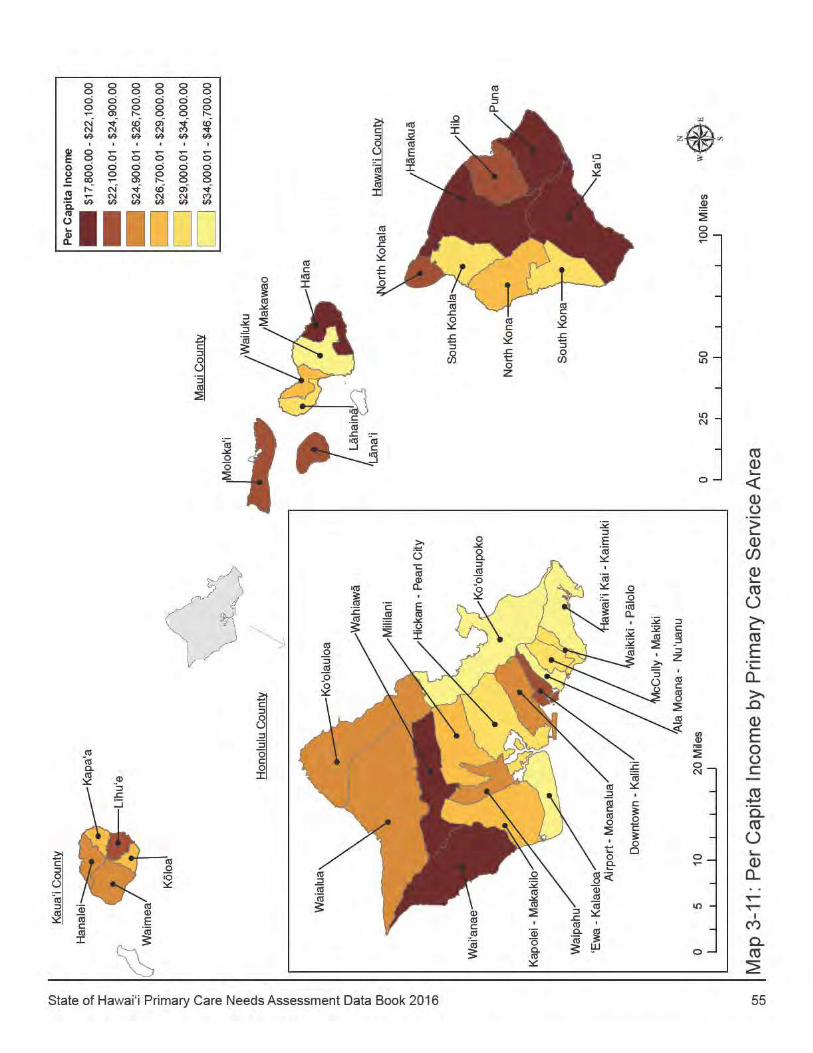
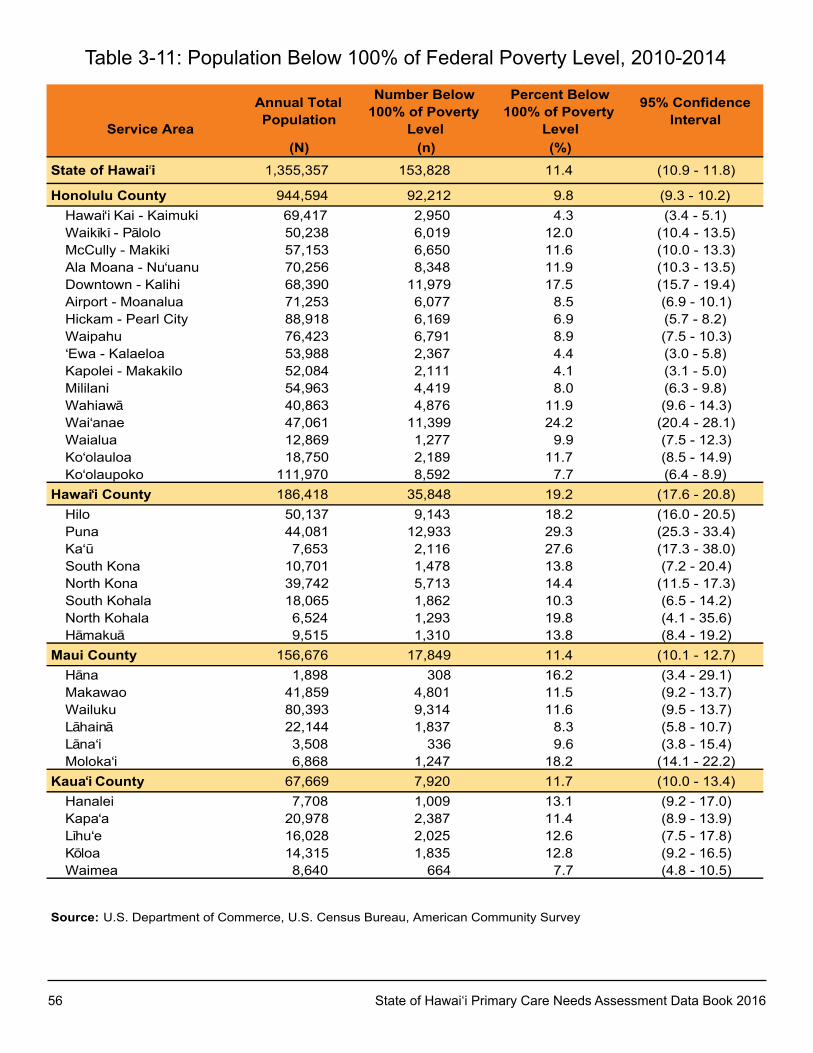
56 State of Hawai‘i Primary Care Needs Assessment Data Book 2016
Service Area
Annual Total Population
Number Below 100% of Poverty
Level
Percent Below 100% of Poverty
Level
95% Confidence Interval
(N) (n) (%)State of Hawai i 1,355,357 153,828 11.4 (10.9 - 11.8)
Honolulu County 944,594 92,212 9.8 (9.3 - 10.2)Hawai‘i Kai - Kaimuki 69,417 2,950 4.3 (3.4 - 5.1)Waikïkï - Pälolo 50,238 6,019 12.0 (10.4 - 13.5)McCully - Makiki 57,153 6,650 11.6 (10.0 - 13.3)Ala Moana - Nu‘uanu 70,256 8,348 11.9 (10.3 - 13.5)Downtown - Kalihi 68,390 11,979 17.5 (15.7 - 19.4)Airport - Moanalua 71,253 6,077 8.5 (6.9 - 10.1)Hickam - Pearl City 88,918 6,169 6.9 (5.7 - 8.2)Waipahu 76,423 6,791 8.9 (7.5 - 10.3)‘Ewa - Kalaeloa 53,988 2,367 4.4 (3.0 - 5.8)Kapolei - Makakilo 52,084 2,111 4.1 (3.1 - 5.0)Mililani 54,963 4,419 8.0 (6.3 - 9.8)Wahiawä 40,863 4,876 11.9 (9.6 - 14.3)Wai‘anae 47,061 11,399 24.2 (20.4 - 28.1)Waialua 12,869 1,277 9.9 (7.5 - 12.3)Ko‘olauloa 18,750 2,189 11.7 (8.5 - 14.9)Ko‘olaupoko 111,970 8,592 7.7 (6.4 - 8.9)
Hawai‘i County 186,418 35,848 19.2 (17.6 - 20.8)Hilo 50,137 9,143 18.2 (16.0 - 20.5)Puna 44,081 12,933 29.3 (25.3 - 33.4)Ka‘ü 7,653 2,116 27.6 (17.3 - 38.0)South Kona 10,701 1,478 13.8 (7.2 - 20.4)North Kona 39,742 5,713 14.4 (11.5 - 17.3)South Kohala 18,065 1,862 10.3 (6.5 - 14.2)North Kohala 6,524 1,293 19.8 (4.1 - 35.6)Hämakuä 9,515 1,310 13.8 (8.4 - 19.2)
Maui County 156,676 17,849 11.4 (10.1 - 12.7)Häna 1,898 308 16.2 (3.4 - 29.1)Makawao 41,859 4,801 11.5 (9.2 - 13.7)Wailuku 80,393 9,314 11.6 (9.5 - 13.7)Lähainä 22,144 1,837 8.3 (5.8 - 10.7)Läna‘i 3,508 336 9.6 (3.8 - 15.4)Moloka‘i 6,868 1,247 18.2 (14.1 - 22.2)
Kaua‘i County 67,669 7,920 11.7 (10.0 - 13.4)Hanalei 7,708 1,009 13.1 (9.2 - 17.0)Kapa‘a 20,978 2,387 11.4 (8.9 - 13.9)Lïhu‘e 16,028 2,025 12.6 (7.5 - 17.8)Köloa 14,315 1,835 12.8 (9.2 - 16.5)Waimea 8,640 664 7.7 (4.8 - 10.5)
Source: U.S. Department of Commerce, U.S. Census Bureau, American Community Survey
Table 3-11: Population Below 100% of Federal Poverty Level, 2010-2014
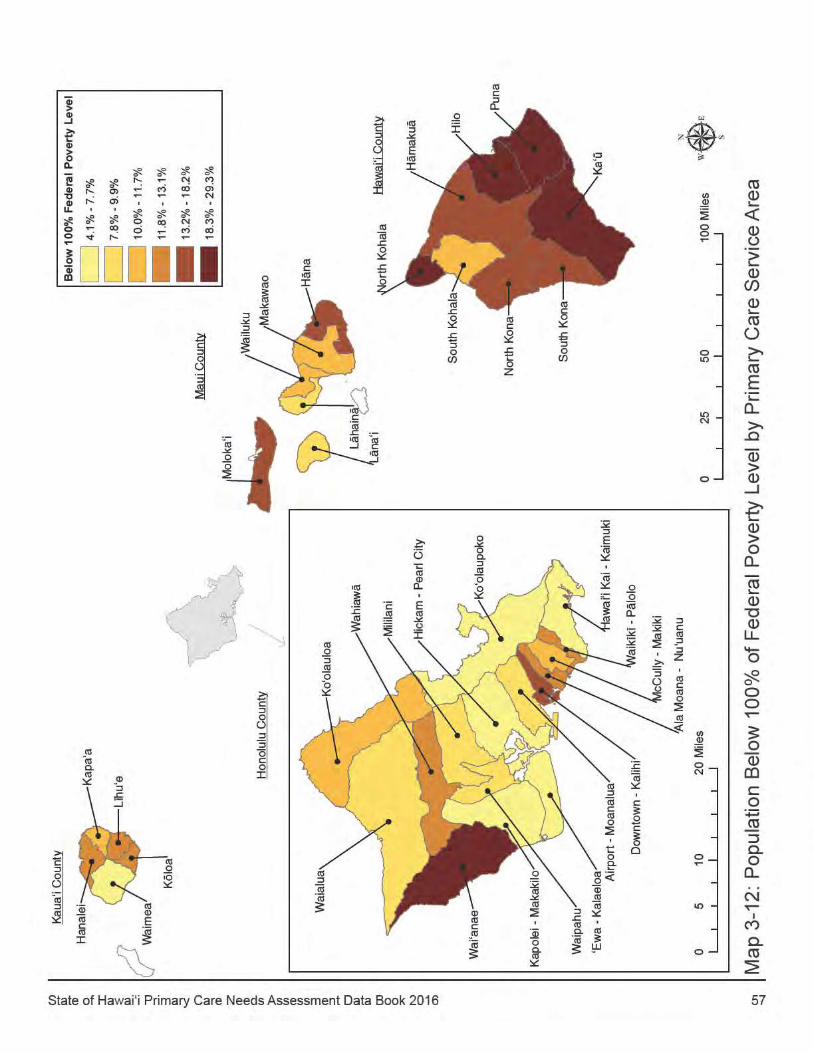
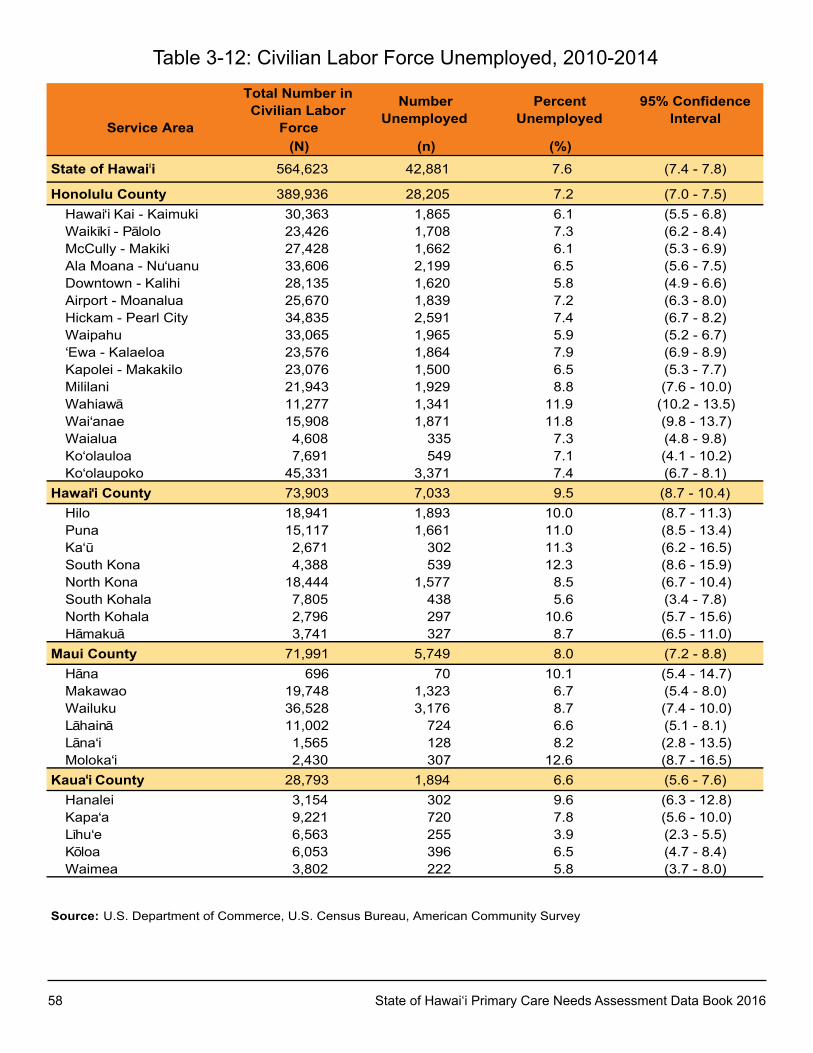
58 State of Hawai‘i Primary Care Needs Assessment Data Book 2016
Service Area
Total Number in Civilian Labor
Force
Number Unemployed
Percent Unemployed
95% Confidence Interval
(N) (n) (%)State of Hawai i 564,623 42,881 7.6 (7.4 - 7.8)
Honolulu County 389,936 28,205 7.2 (7.0 - 7.5)Hawai‘i Kai - Kaimuki 30,363 1,865 6.1 (5.5 - 6.8)Waikïkï - Pälolo 23,426 1,708 7.3 (6.2 - 8.4)McCully - Makiki 27,428 1,662 6.1 (5.3 - 6.9)Ala Moana - Nu‘uanu 33,606 2,199 6.5 (5.6 - 7.5)Downtown - Kalihi 28,135 1,620 5.8 (4.9 - 6.6)Airport - Moanalua 25,670 1,839 7.2 (6.3 - 8.0)Hickam - Pearl City 34,835 2,591 7.4 (6.7 - 8.2)Waipahu 33,065 1,965 5.9 (5.2 - 6.7)‘Ewa - Kalaeloa 23,576 1,864 7.9 (6.9 - 8.9)Kapolei - Makakilo 23,076 1,500 6.5 (5.3 - 7.7)Mililani 21,943 1,929 8.8 (7.6 - 10.0)Wahiawä 11,277 1,341 11.9 (10.2 - 13.5)Wai‘anae 15,908 1,871 11.8 (9.8 - 13.7)Waialua 4,608 335 7.3 (4.8 - 9.8)Ko‘olauloa 7,691 549 7.1 (4.1 - 10.2)Ko‘olaupoko 45,331 3,371 7.4 (6.7 - 8.1)
Hawai‘i County 73,903 7,033 9.5 (8.7 - 10.4)Hilo 18,941 1,893 10.0 (8.7 - 11.3)Puna 15,117 1,661 11.0 (8.5 - 13.4)Ka‘ü 2,671 302 11.3 (6.2 - 16.5)South Kona 4,388 539 12.3 (8.6 - 15.9)North Kona 18,444 1,577 8.5 (6.7 - 10.4)South Kohala 7,805 438 5.6 (3.4 - 7.8)North Kohala 2,796 297 10.6 (5.7 - 15.6)Hämakuä 3,741 327 8.7 (6.5 - 11.0)
Maui County 71,991 5,749 8.0 (7.2 - 8.8)Häna 696 70 10.1 (5.4 - 14.7)Makawao 19,748 1,323 6.7 (5.4 - 8.0)Wailuku 36,528 3,176 8.7 (7.4 - 10.0)Lähainä 11,002 724 6.6 (5.1 - 8.1)Läna‘i 1,565 128 8.2 (2.8 - 13.5)Moloka‘i 2,430 307 12.6 (8.7 - 16.5)
Kaua‘i County 28,793 1,894 6.6 (5.6 - 7.6)Hanalei 3,154 302 9.6 (6.3 - 12.8)Kapa‘a 9,221 720 7.8 (5.6 - 10.0)Lïhu‘e 6,563 255 3.9 (2.3 - 5.5)Köloa 6,053 396 6.5 (4.7 - 8.4)Waimea 3,802 222 5.8 (3.7 - 8.0)
Source: U.S. Department of Commerce, U.S. Census Bureau, American Community Survey
Table 3-12: Civilian Labor Force unemployed, 2010-2014
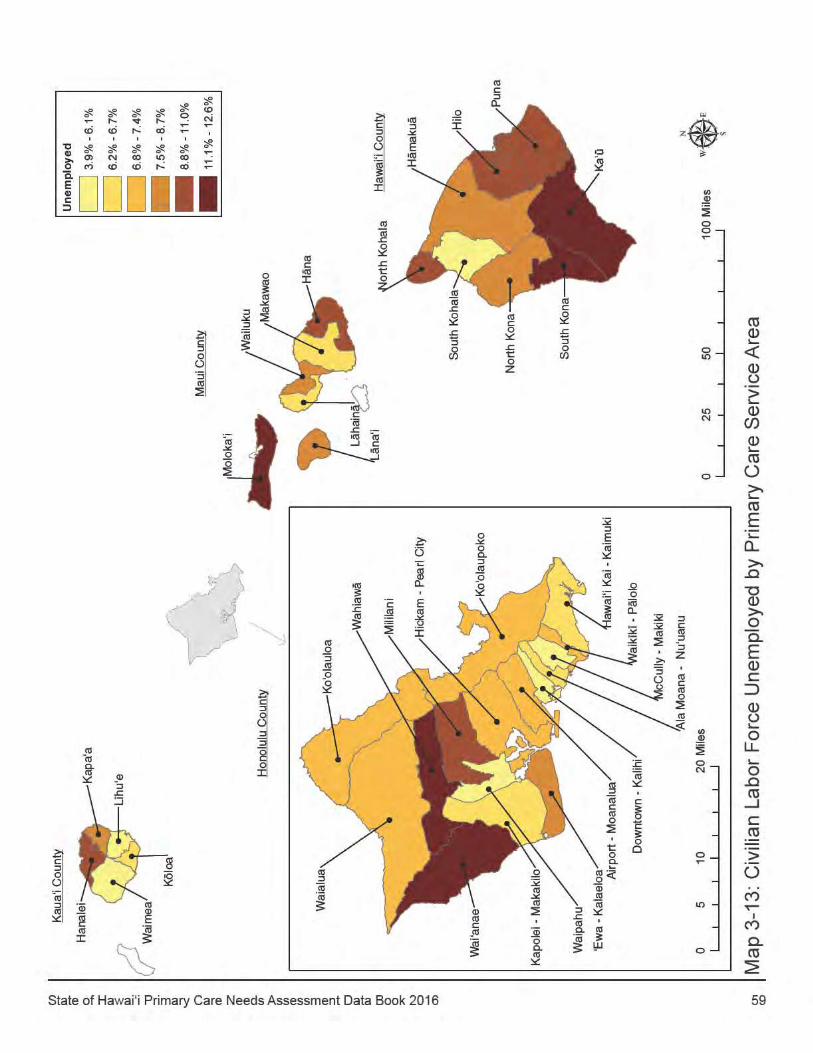
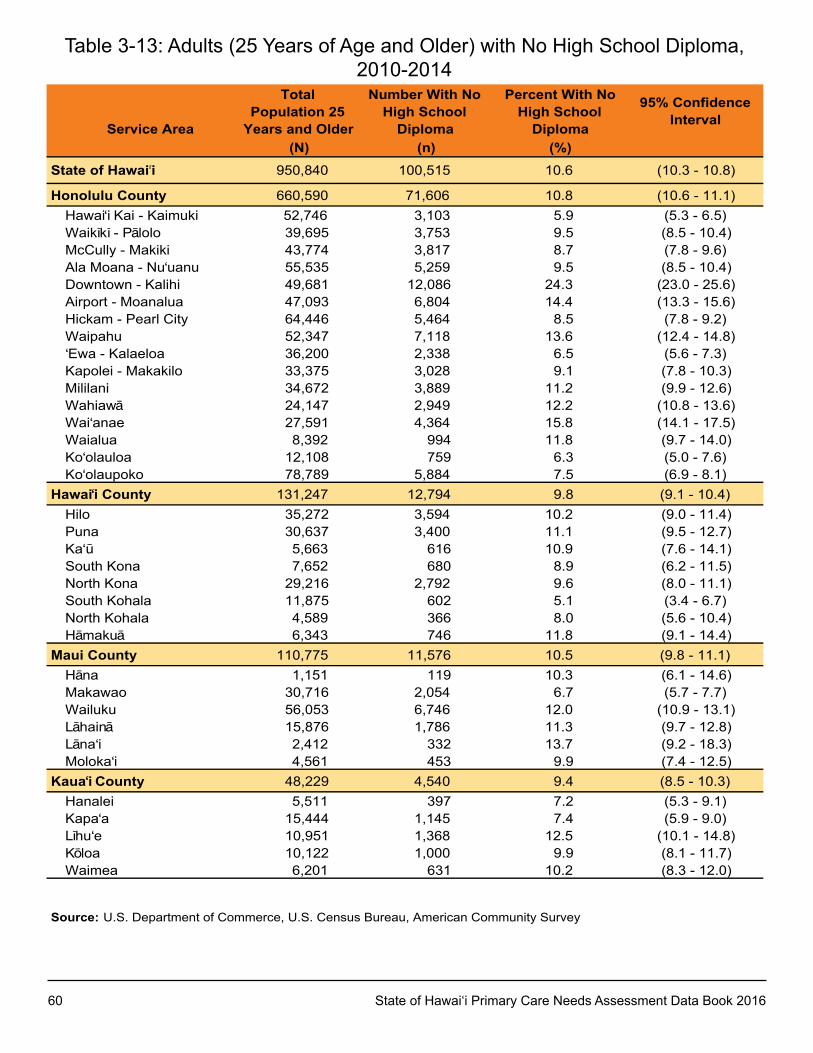
60 State of Hawai‘i Primary Care Needs Assessment Data Book 2016
Service Area
Total Population 25
Years and Older
Number With No High School
Diploma
Percent With No High School
Diploma
95% Confidence Interval
(N) (n) (%)State of Hawai i 950,840 100,515 10.6 (10.3 - 10.8)
Honolulu County 660,590 71,606 10.8 (10.6 - 11.1)Hawai‘i Kai - Kaimuki 52,746 3,103 5.9 (5.3 - 6.5)Waikïkï - Pälolo 39,695 3,753 9.5 (8.5 - 10.4)McCully - Makiki 43,774 3,817 8.7 (7.8 - 9.6)Ala Moana - Nu‘uanu 55,535 5,259 9.5 (8.5 - 10.4)Downtown - Kalihi 49,681 12,086 24.3 (23.0 - 25.6)Airport - Moanalua 47,093 6,804 14.4 (13.3 - 15.6)Hickam - Pearl City 64,446 5,464 8.5 (7.8 - 9.2)Waipahu 52,347 7,118 13.6 (12.4 - 14.8)‘Ewa - Kalaeloa 36,200 2,338 6.5 (5.6 - 7.3)Kapolei - Makakilo 33,375 3,028 9.1 (7.8 - 10.3)Mililani 34,672 3,889 11.2 (9.9 - 12.6)Wahiawä 24,147 2,949 12.2 (10.8 - 13.6)Wai‘anae 27,591 4,364 15.8 (14.1 - 17.5)Waialua 8,392 994 11.8 (9.7 - 14.0)Ko‘olauloa 12,108 759 6.3 (5.0 - 7.6)Ko‘olaupoko 78,789 5,884 7.5 (6.9 - 8.1)
Hawai‘i County 131,247 12,794 9.8 (9.1 - 10.4)Hilo 35,272 3,594 10.2 (9.0 - 11.4)Puna 30,637 3,400 11.1 (9.5 - 12.7)Ka‘ü 5,663 616 10.9 (7.6 - 14.1)South Kona 7,652 680 8.9 (6.2 - 11.5)North Kona 29,216 2,792 9.6 (8.0 - 11.1)South Kohala 11,875 602 5.1 (3.4 - 6.7)North Kohala 4,589 366 8.0 (5.6 - 10.4)Hämakuä 6,343 746 11.8 (9.1 - 14.4)
Maui County 110,775 11,576 10.5 (9.8 - 11.1)Häna 1,151 119 10.3 (6.1 - 14.6)Makawao 30,716 2,054 6.7 (5.7 - 7.7)Wailuku 56,053 6,746 12.0 (10.9 - 13.1)Lähainä 15,876 1,786 11.3 (9.7 - 12.8)Läna‘i 2,412 332 13.7 (9.2 - 18.3)Moloka‘i 4,561 453 9.9 (7.4 - 12.5)
Kaua‘i County 48,229 4,540 9.4 (8.5 - 10.3)Hanalei 5,511 397 7.2 (5.3 - 9.1)Kapa‘a 15,444 1,145 7.4 (5.9 - 9.0)Lïhu‘e 10,951 1,368 12.5 (10.1 - 14.8)Köloa 10,122 1,000 9.9 (8.1 - 11.7)Waimea 6,201 631 10.2 (8.3 - 12.0)
Source: U.S. Department of Commerce, U.S. Census Bureau, American Community Survey
Table 3-13: Adults (25 Years of Age and Older) with No High School Diploma, 2010-2014
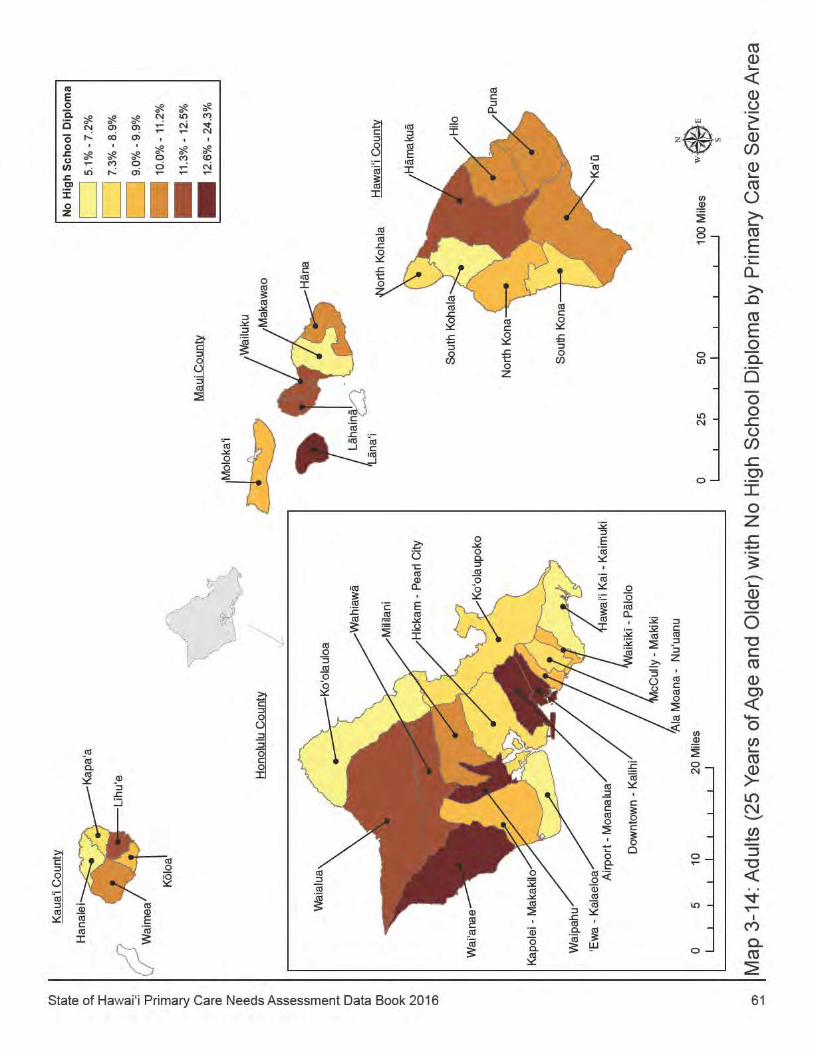
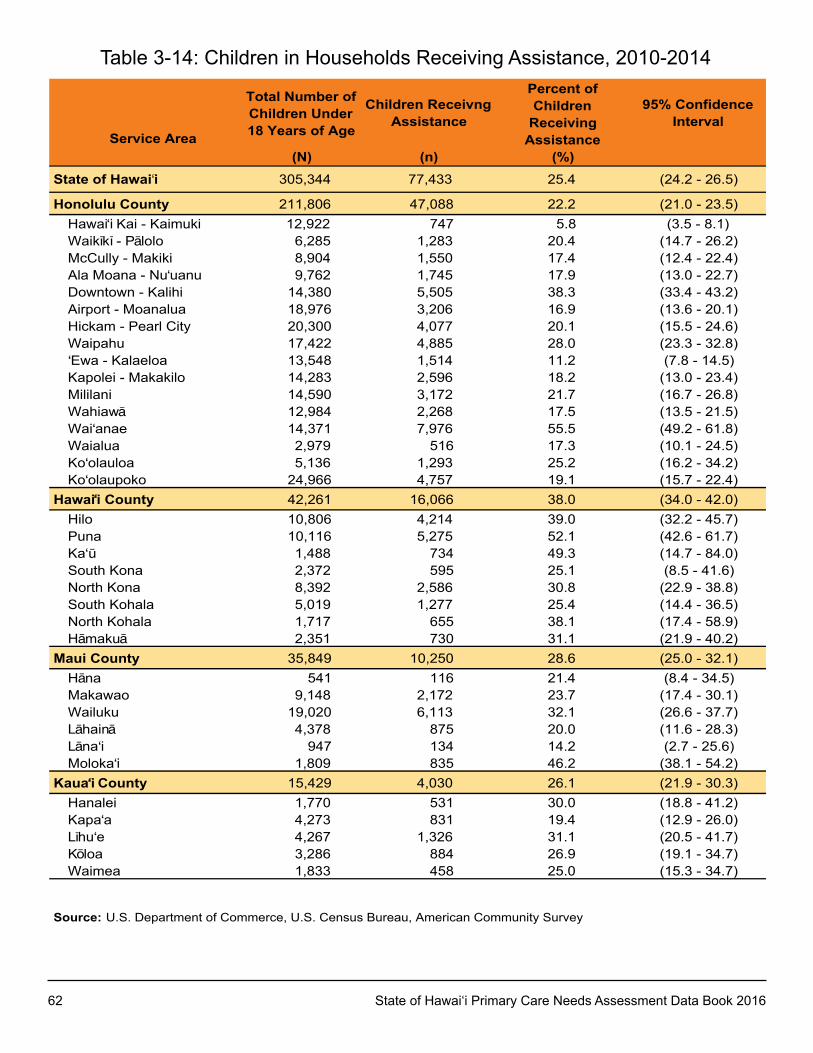
62 State of Hawai‘i Primary Care Needs Assessment Data Book 2016
Service Area
Total Number of Children Under 18 Years of Age
Children Receivng Assistance
Percent of Children
Receiving Assistance
95% Confidence Interval
(N) (n) (%)State of Hawai i 305,344 77,433 25.4 (24.2 - 26.5)
Honolulu County 211,806 47,088 22.2 (21.0 - 23.5)Hawai‘i Kai - Kaimuki 12,922 747 5.8 (3.5 - 8.1)Waikïkï - Pälolo 6,285 1,283 20.4 (14.7 - 26.2)McCully - Makiki 8,904 1,550 17.4 (12.4 - 22.4)Ala Moana - Nu‘uanu 9,762 1,745 17.9 (13.0 - 22.7)Downtown - Kalihi 14,380 5,505 38.3 (33.4 - 43.2)Airport - Moanalua 18,976 3,206 16.9 (13.6 - 20.1)Hickam - Pearl City 20,300 4,077 20.1 (15.5 - 24.6)Waipahu 17,422 4,885 28.0 (23.3 - 32.8)‘Ewa - Kalaeloa 13,548 1,514 11.2 (7.8 - 14.5)Kapolei - Makakilo 14,283 2,596 18.2 (13.0 - 23.4)Mililani 14,590 3,172 21.7 (16.7 - 26.8)Wahiawä 12,984 2,268 17.5 (13.5 - 21.5)Wai‘anae 14,371 7,976 55.5 (49.2 - 61.8)Waialua 2,979 516 17.3 (10.1 - 24.5)Ko‘olauloa 5,136 1,293 25.2 (16.2 - 34.2)Ko‘olaupoko 24,966 4,757 19.1 (15.7 - 22.4)
Hawai‘i County 42,261 16,066 38.0 (34.0 - 42.0)Hilo 10,806 4,214 39.0 (32.2 - 45.7)Puna 10,116 5,275 52.1 (42.6 - 61.7)Ka‘ü 1,488 734 49.3 (14.7 - 84.0)South Kona 2,372 595 25.1 (8.5 - 41.6)North Kona 8,392 2,586 30.8 (22.9 - 38.8)South Kohala 5,019 1,277 25.4 (14.4 - 36.5)North Kohala 1,717 655 38.1 (17.4 - 58.9)Hämakuä 2,351 730 31.1 (21.9 - 40.2)
Maui County 35,849 10,250 28.6 (25.0 - 32.1)Häna 541 116 21.4 (8.4 - 34.5)Makawao 9,148 2,172 23.7 (17.4 - 30.1)Wailuku 19,020 6,113 32.1 (26.6 - 37.7)Lähainä 4,378 875 20.0 (11.6 - 28.3)Läna‘i 947 134 14.2 (2.7 - 25.6)Moloka‘i 1,809 835 46.2 (38.1 - 54.2)
Kaua‘i County 15,429 4,030 26.1 (21.9 - 30.3)Hanalei 1,770 531 30.0 (18.8 - 41.2)Kapa‘a 4,273 831 19.4 (12.9 - 26.0)Lïhu‘e 4,267 1,326 31.1 (20.5 - 41.7)Köloa 3,286 884 26.9 (19.1 - 34.7)Waimea 1,833 458 25.0 (15.3 - 34.7)
Source: U.S. Department of Commerce, U.S. Census Bureau, American Community Survey
Table 3-14: Children in Households Receiving Assistance, 2010-2014
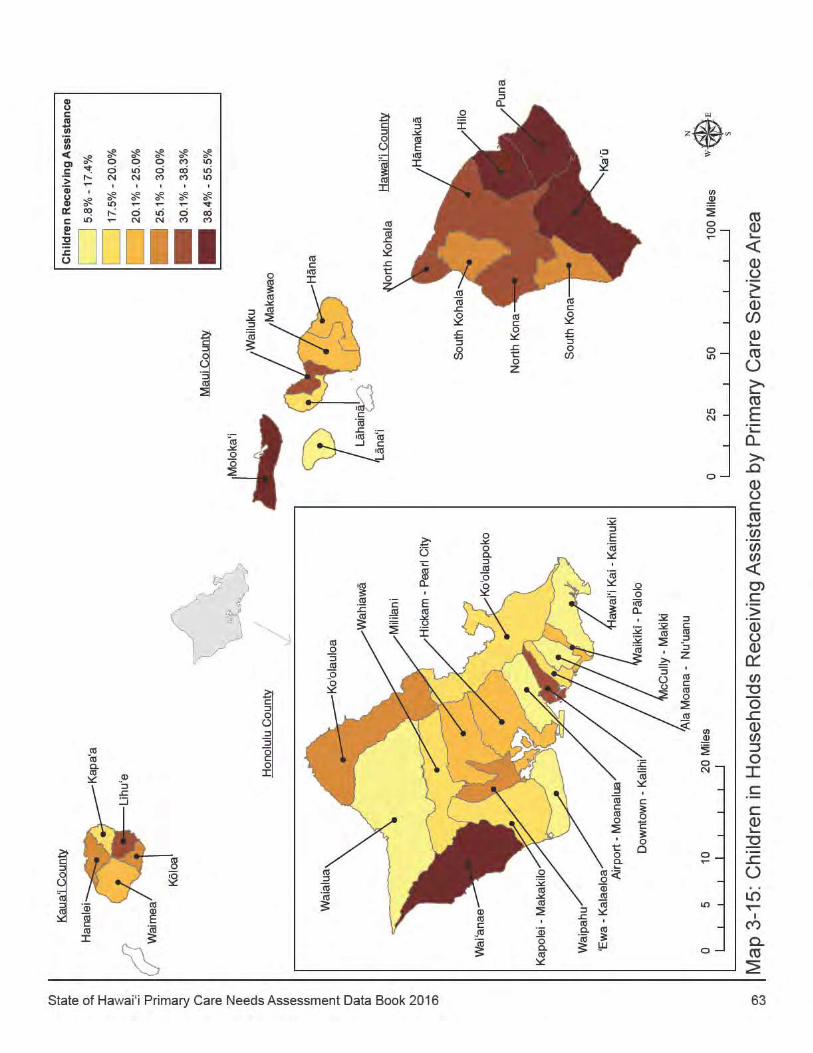
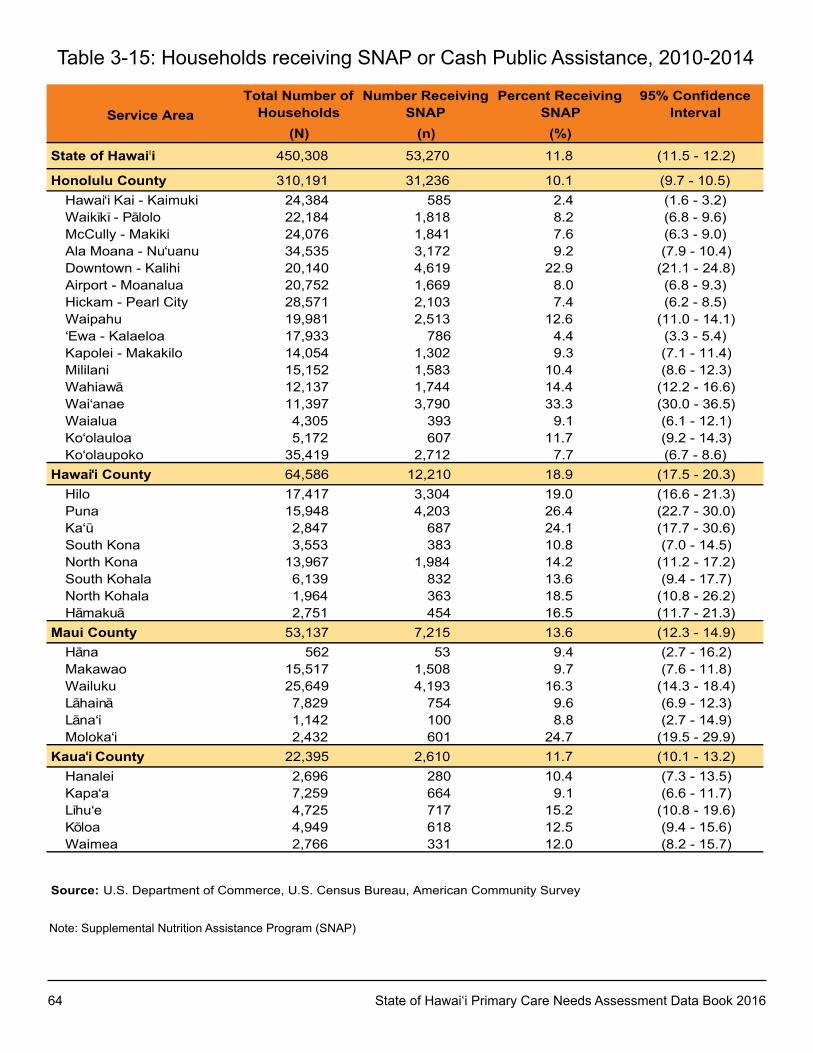
64 State of Hawai‘i Primary Care Needs Assessment Data Book 2016
Service AreaTotal Number of
HouseholdsNumber Receiving
SNAPPercent Receiving
SNAP95% Confidence
Interval(N) (n) (%)
State of Hawai i 450,308 53,270 11.8 (11.5 - 12.2)
Honolulu County 310,191 31,236 10.1 (9.7 - 10.5)Hawai‘i Kai - Kaimuki 24,384 585 2.4 (1.6 - 3.2)Waikïkï - Pälolo 22,184 1,818 8.2 (6.8 - 9.6)McCully - Makiki 24,076 1,841 7.6 (6.3 - 9.0)Ala Moana - Nu‘uanu 34,535 3,172 9.2 (7.9 - 10.4)Downtown - Kalihi 20,140 4,619 22.9 (21.1 - 24.8)Airport - Moanalua 20,752 1,669 8.0 (6.8 - 9.3)Hickam - Pearl City 28,571 2,103 7.4 (6.2 - 8.5)Waipahu 19,981 2,513 12.6 (11.0 - 14.1)‘Ewa - Kalaeloa 17,933 786 4.4 (3.3 - 5.4)Kapolei - Makakilo 14,054 1,302 9.3 (7.1 - 11.4)Mililani 15,152 1,583 10.4 (8.6 - 12.3)Wahiawä 12,137 1,744 14.4 (12.2 - 16.6)Wai‘anae 11,397 3,790 33.3 (30.0 - 36.5)Waialua 4,305 393 9.1 (6.1 - 12.1)Ko‘olauloa 5,172 607 11.7 (9.2 - 14.3)Ko‘olaupoko 35,419 2,712 7.7 (6.7 - 8.6)
Hawai‘i County 64,586 12,210 18.9 (17.5 - 20.3)Hilo 17,417 3,304 19.0 (16.6 - 21.3)Puna 15,948 4,203 26.4 (22.7 - 30.0)Ka‘ü 2,847 687 24.1 (17.7 - 30.6)South Kona 3,553 383 10.8 (7.0 - 14.5)North Kona 13,967 1,984 14.2 (11.2 - 17.2)South Kohala 6,139 832 13.6 (9.4 - 17.7)North Kohala 1,964 363 18.5 (10.8 - 26.2)Hämakuä 2,751 454 16.5 (11.7 - 21.3)
Maui County 53,137 7,215 13.6 (12.3 - 14.9)Häna 562 53 9.4 (2.7 - 16.2)Makawao 15,517 1,508 9.7 (7.6 - 11.8)Wailuku 25,649 4,193 16.3 (14.3 - 18.4)Lähainä 7,829 754 9.6 (6.9 - 12.3)Läna‘i 1,142 100 8.8 (2.7 - 14.9)Moloka‘i 2,432 601 24.7 (19.5 - 29.9)
Kaua‘i County 22,395 2,610 11.7 (10.1 - 13.2)Hanalei 2,696 280 10.4 (7.3 - 13.5)Kapa‘a 7,259 664 9.1 (6.6 - 11.7)Lïhu‘e 4,725 717 15.2 (10.8 - 19.6)Köloa 4,949 618 12.5 (9.4 - 15.6)Waimea 2,766 331 12.0 (8.2 - 15.7)
Source: U.S. Department of Commerce, U.S. Census Bureau, American Community Survey
Table 3-15: Households receiving SNAP or Cash Public Assistance, 2010-2014
Note: Supplemental Nutrition Assistance Program (SNAP)
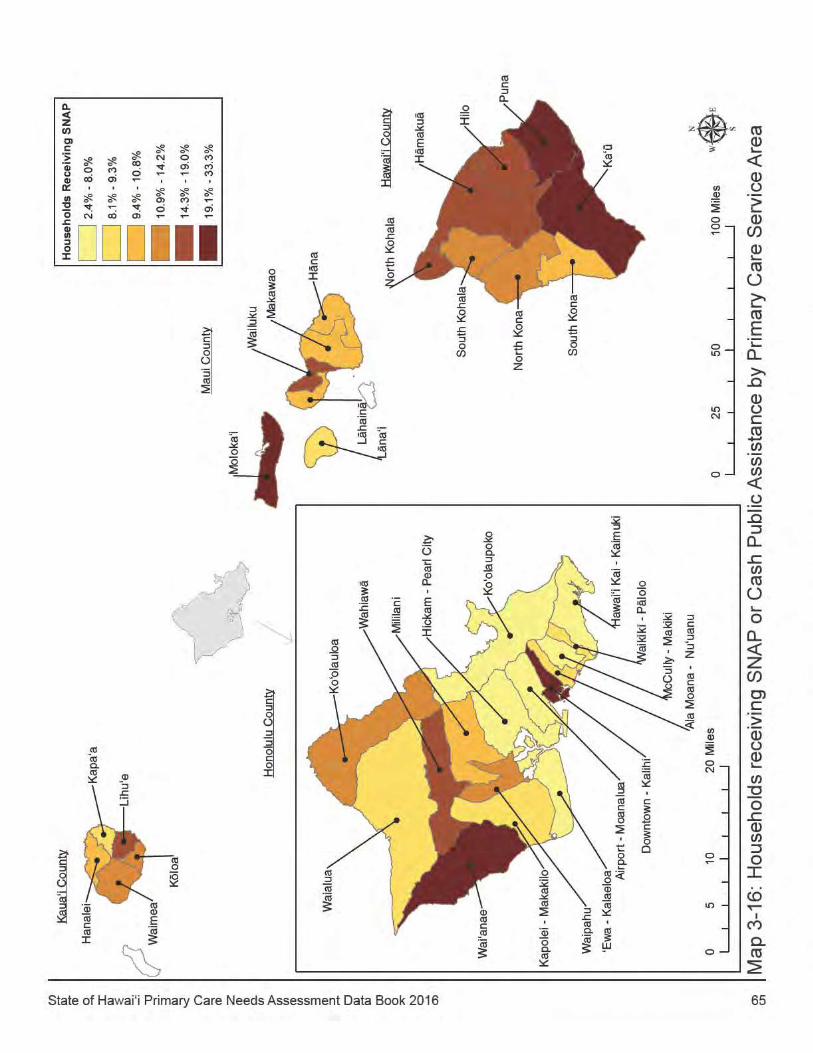
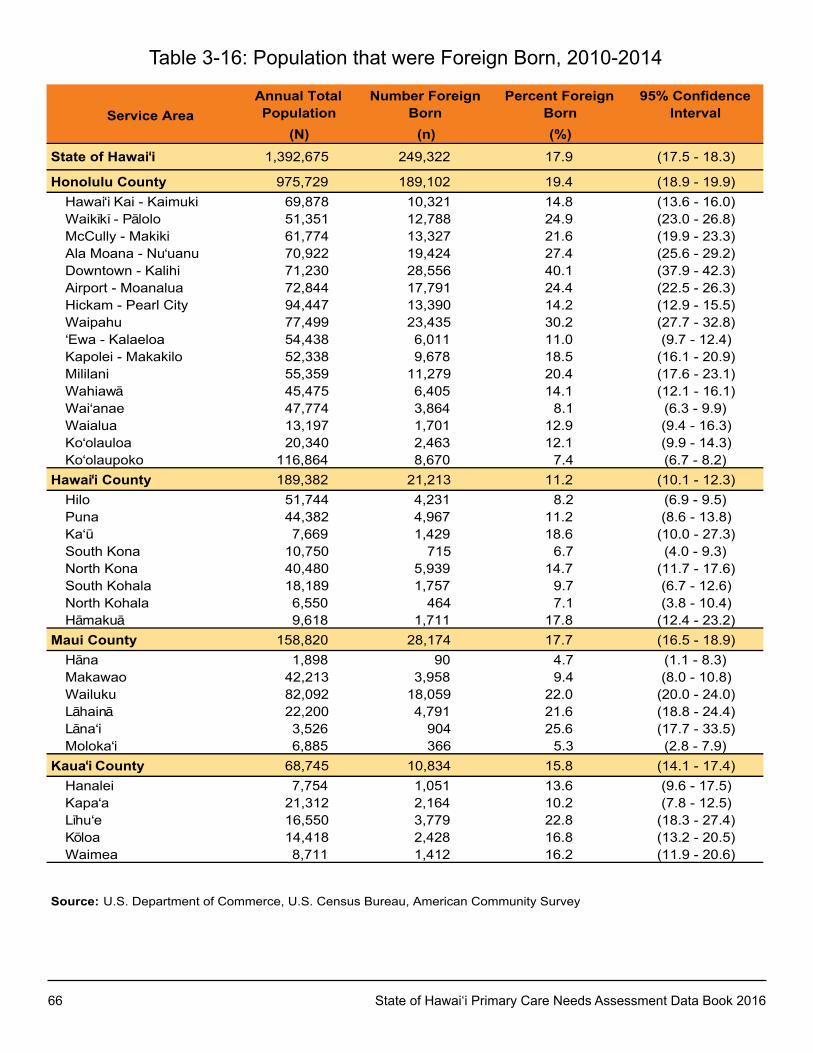
66 State of Hawai‘i Primary Care Needs Assessment Data Book 2016
Service AreaAnnual Total Population
Number Foreign Born
Percent Foreign Born
95% Confidence Interval
(N) (n) (%)State of Hawai‘i 1,392,675 249,322 17.9 (17.5 - 18.3)
Honolulu County 975,729 189,102 19.4 (18.9 - 19.9)Hawai‘i Kai - Kaimuki 69,878 10,321 14.8 (13.6 - 16.0)Waikïkï - Pälolo 51,351 12,788 24.9 (23.0 - 26.8)McCully - Makiki 61,774 13,327 21.6 (19.9 - 23.3)Ala Moana - Nu‘uanu 70,922 19,424 27.4 (25.6 - 29.2)Downtown - Kalihi 71,230 28,556 40.1 (37.9 - 42.3)Airport - Moanalua 72,844 17,791 24.4 (22.5 - 26.3)Hickam - Pearl City 94,447 13,390 14.2 (12.9 - 15.5)Waipahu 77,499 23,435 30.2 (27.7 - 32.8)‘Ewa - Kalaeloa 54,438 6,011 11.0 (9.7 - 12.4)Kapolei - Makakilo 52,338 9,678 18.5 (16.1 - 20.9)Mililani 55,359 11,279 20.4 (17.6 - 23.1)Wahiawä 45,475 6,405 14.1 (12.1 - 16.1)Wai‘anae 47,774 3,864 8.1 (6.3 - 9.9)Waialua 13,197 1,701 12.9 (9.4 - 16.3)Ko‘olauloa 20,340 2,463 12.1 (9.9 - 14.3)Ko‘olaupoko 116,864 8,670 7.4 (6.7 - 8.2)
Hawai‘i County 189,382 21,213 11.2 (10.1 - 12.3)Hilo 51,744 4,231 8.2 (6.9 - 9.5)Puna 44,382 4,967 11.2 (8.6 - 13.8)Ka‘ü 7,669 1,429 18.6 (10.0 - 27.3)South Kona 10,750 715 6.7 (4.0 - 9.3)North Kona 40,480 5,939 14.7 (11.7 - 17.6)South Kohala 18,189 1,757 9.7 (6.7 - 12.6)North Kohala 6,550 464 7.1 (3.8 - 10.4)Hämakuä 9,618 1,711 17.8 (12.4 - 23.2)
Maui County 158,820 28,174 17.7 (16.5 - 18.9)Häna 1,898 90 4.7 (1.1 - 8.3)Makawao 42,213 3,958 9.4 (8.0 - 10.8)Wailuku 82,092 18,059 22.0 (20.0 - 24.0)Lähainä 22,200 4,791 21.6 (18.8 - 24.4)Läna‘i 3,526 904 25.6 (17.7 - 33.5)Moloka‘i 6,885 366 5.3 (2.8 - 7.9)
Kaua‘i County 68,745 10,834 15.8 (14.1 - 17.4)Hanalei 7,754 1,051 13.6 (9.6 - 17.5)Kapa‘a 21,312 2,164 10.2 (7.8 - 12.5)Lïhu‘e 16,550 3,779 22.8 (18.3 - 27.4)Köloa 14,418 2,428 16.8 (13.2 - 20.5)Waimea 8,711 1,412 16.2 (11.9 - 20.6)
Source: U.S. Department of Commerce, U.S. Census Bureau, American Community Survey
Table 3-16: Population that were Foreign Born, 2010-2014
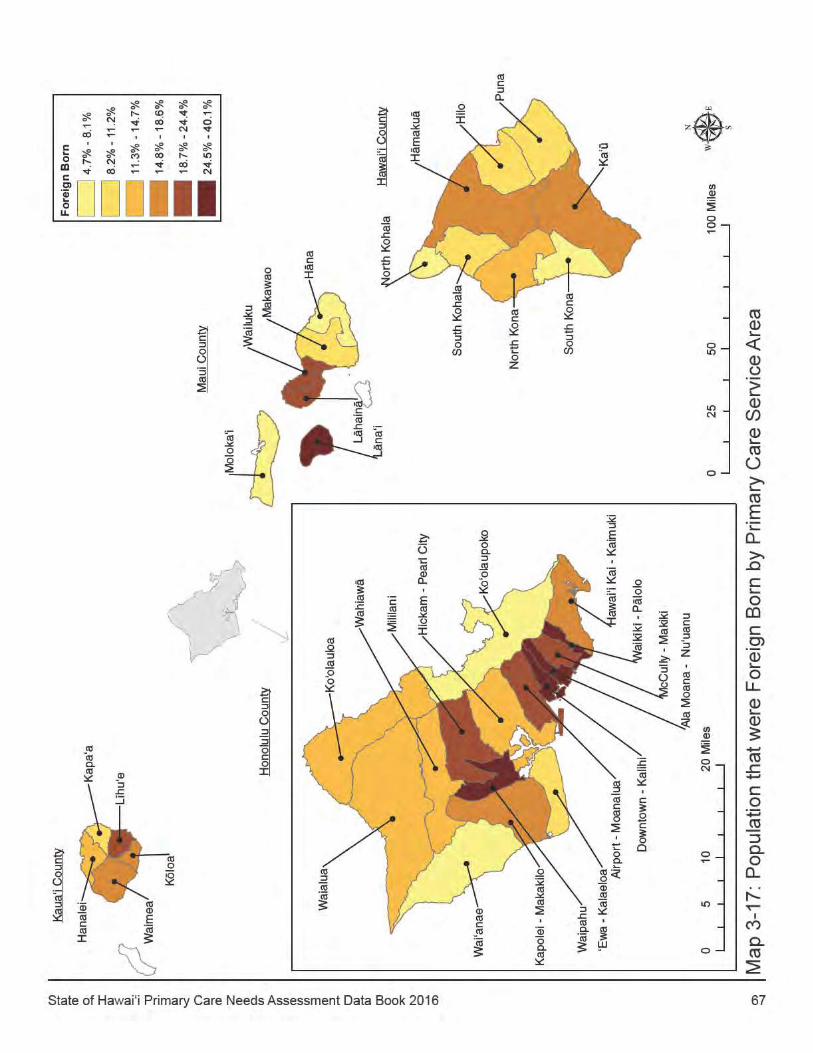
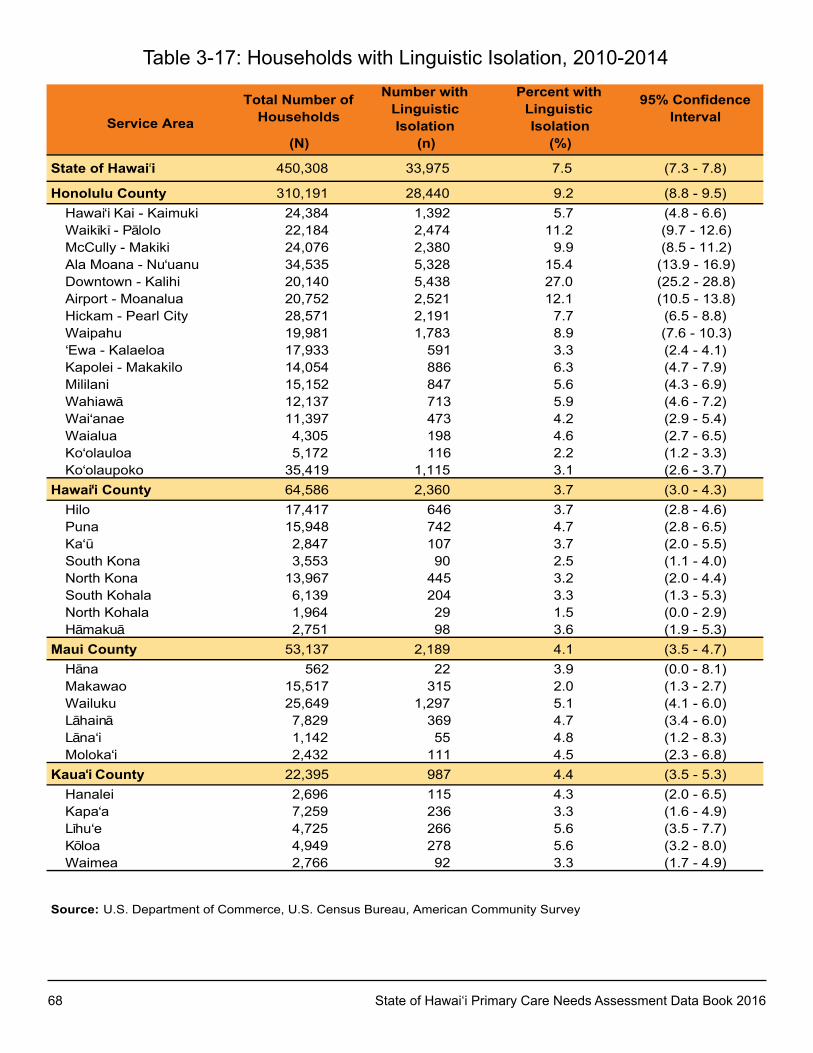
68 State of Hawai‘i Primary Care Needs Assessment Data Book 2016
Service Area
Total Number of Households
Number with Linguistic Isolation
Percent with Linguistic Isolation
95% Confidence Interval
(N) (n) (%)
State of Hawai i 450,308 33,975 7.5 (7.3 - 7.8)
Honolulu County 310,191 28,440 9.2 (8.8 - 9.5)Hawai‘i Kai - Kaimuki 24,384 1,392 5.7 (4.8 - 6.6)Waikïkï - Pälolo 22,184 2,474 11.2 (9.7 - 12.6)McCully - Makiki 24,076 2,380 9.9 (8.5 - 11.2)Ala Moana - Nu‘uanu 34,535 5,328 15.4 (13.9 - 16.9)Downtown - Kalihi 20,140 5,438 27.0 (25.2 - 28.8)Airport - Moanalua 20,752 2,521 12.1 (10.5 - 13.8)Hickam - Pearl City 28,571 2,191 7.7 (6.5 - 8.8)Waipahu 19,981 1,783 8.9 (7.6 - 10.3)‘Ewa - Kalaeloa 17,933 591 3.3 (2.4 - 4.1)Kapolei - Makakilo 14,054 886 6.3 (4.7 - 7.9)Mililani 15,152 847 5.6 (4.3 - 6.9)Wahiawä 12,137 713 5.9 (4.6 - 7.2)Wai‘anae 11,397 473 4.2 (2.9 - 5.4)Waialua 4,305 198 4.6 (2.7 - 6.5)Ko‘olauloa 5,172 116 2.2 (1.2 - 3.3)Ko‘olaupoko 35,419 1,115 3.1 (2.6 - 3.7)
Hawai‘i County 64,586 2,360 3.7 (3.0 - 4.3)Hilo 17,417 646 3.7 (2.8 - 4.6)Puna 15,948 742 4.7 (2.8 - 6.5)Ka‘ü 2,847 107 3.7 (2.0 - 5.5)South Kona 3,553 90 2.5 (1.1 - 4.0)North Kona 13,967 445 3.2 (2.0 - 4.4)South Kohala 6,139 204 3.3 (1.3 - 5.3)North Kohala 1,964 29 1.5 (0.0 - 2.9)Hämakuä 2,751 98 3.6 (1.9 - 5.3)
Maui County 53,137 2,189 4.1 (3.5 - 4.7)Häna 562 22 3.9 (0.0 - 8.1)Makawao 15,517 315 2.0 (1.3 - 2.7)Wailuku 25,649 1,297 5.1 (4.1 - 6.0)Lähainä 7,829 369 4.7 (3.4 - 6.0)Läna‘i 1,142 55 4.8 (1.2 - 8.3)Moloka‘i 2,432 111 4.5 (2.3 - 6.8)
Kaua‘i County 22,395 987 4.4 (3.5 - 5.3)Hanalei 2,696 115 4.3 (2.0 - 6.5)Kapa‘a 7,259 236 3.3 (1.6 - 4.9)Lïhu‘e 4,725 266 5.6 (3.5 - 7.7)Köloa 4,949 278 5.6 (3.2 - 8.0)Waimea 2,766 92 3.3 (1.7 - 4.9)
Source: U.S. Department of Commerce, U.S. Census Bureau, American Community Survey
Table 3-17: Households with Linguistic Isolation, 2010-2014
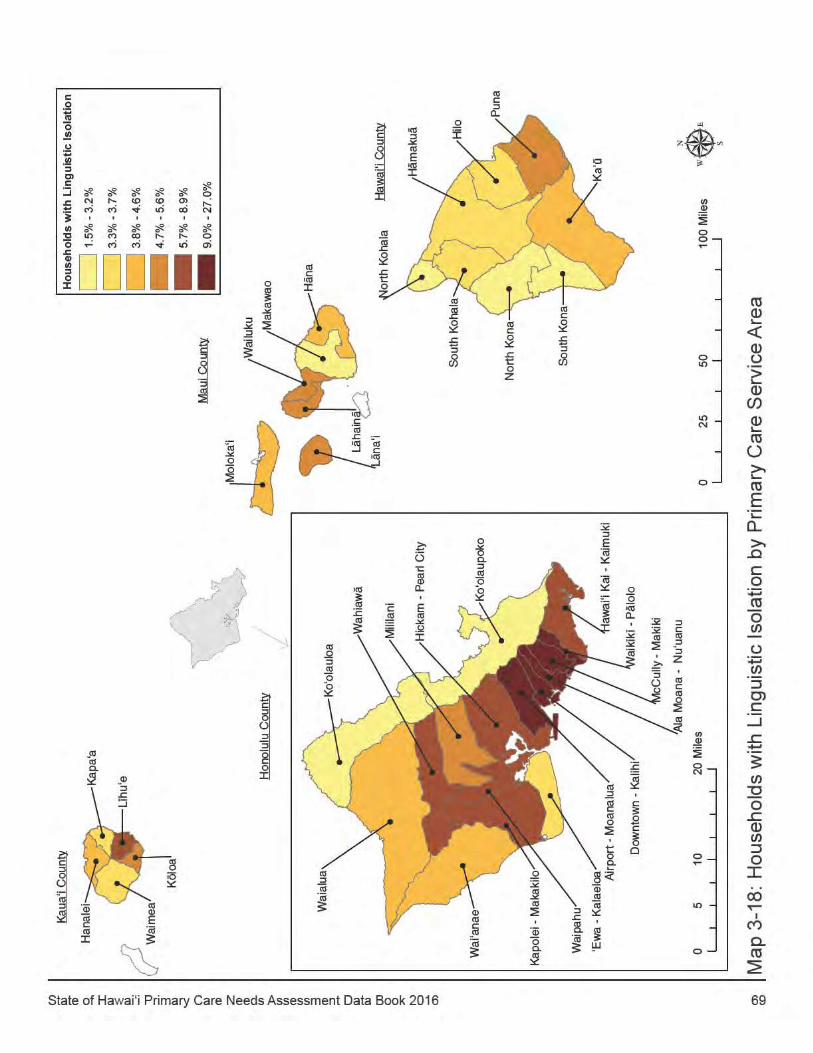
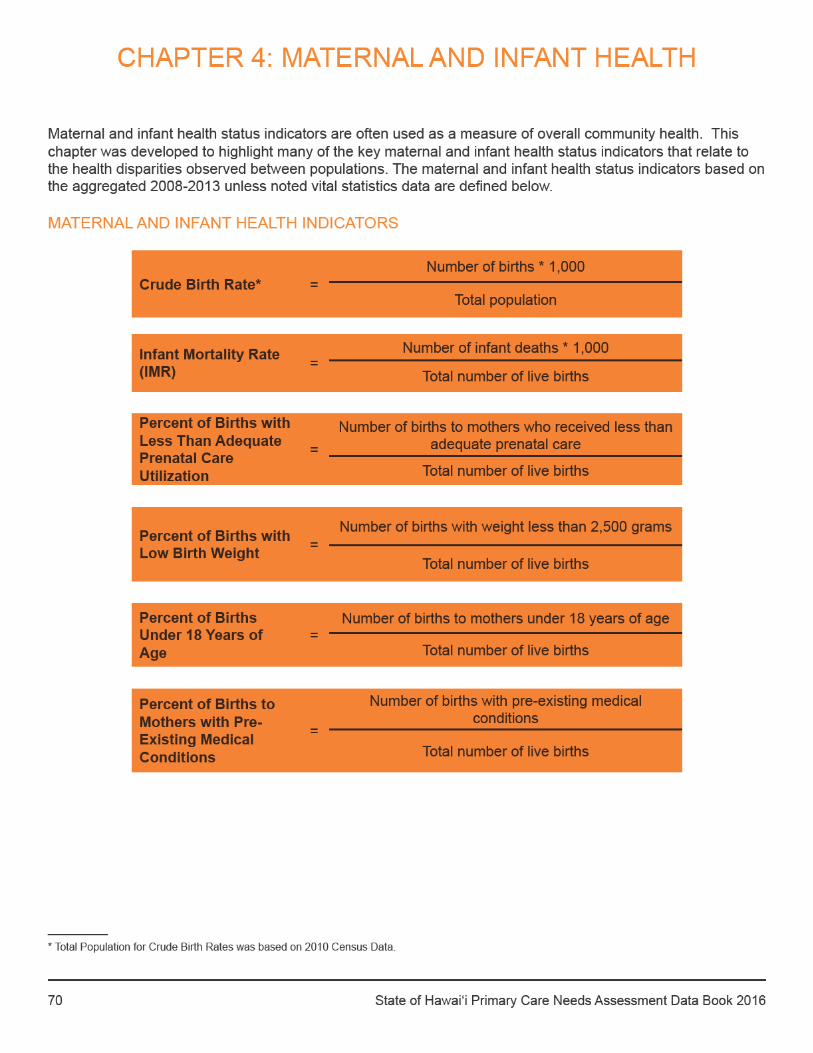

State of Hawai‘i Primary Care Needs Assessment Data Book 2016 71
Percent of Births with less than Adequate Prenatal Care Utilization
In 1994, Milton kotelchuck proposed the Adequacy of Prenatal utilization Index (APNCu), more commonly referred to as the “Kotelchuck Index.”1 The APNCU combines two separate indices: the “adequacy of initiation of prenatal care,” (month prenatal care began) and the “adequacy of received services” (number of visits based on gestational age of the child) to characterize adequacy of pregnancy-related health services provided to an expectant mother between conception and delivery. Rates are classified as “adequate plus,” “adequate,” “intermediate,” or “inadequate.”
The Adequacy of Prenatal utilization Index offers a more accurate and comprehensive set of measures of prenatal care use than just the trimester of prenatal care initiation. The APNCU is the prenatal care utilization index now being actively supported by the Maternal and Child Health Bureau (MCHB), Department of Health and Human Services (DHHS). Consequently, it is the index which the Family Health Services Division (FHSD) and other agencies are now required to use in their reporting. In this Data Book, the percentage of births with less than adequate prenatal care as defined in the APNCU is shown by primary care service area.
Percent of Births with Mothers with Pre-Existing Medical Conditions
Births to mothers with pre-existing medical conditions may be associated with worse outcomes than those born to mothers without these conditions. In general women are delaying child birth to later years and this is coinciding with increases in chronic conditions (e.g., diabetes, high blood pressure) and their related risk factors (e.g., obesity, physical inactivity) among women of reproductive age. This combination stresses the importance of obtaining and providing appropriate care before pregnancy, termed preconception and interconception care, to try and optimize the health of both the mother and the infant resulting from the pregnancy.2
This particular indicator was determined with the presence of the notation for any of the following pre-existing medical conditions collected in vital statistics data: anemia, cardiac disease, acute or chronic lung disease, diabetes, genital herpes, hydramnios/oligohydramnios, hemoglobinopathy, chronic hypertension, pregnancy-associated hypertension, eclampsia, incompetent cervix, previous infant 4000+ grams, previous pre-term or small-for-gestational-age infant, renal disease, Rh sensitization, uterine bleeding, or infectious disease.
1 kotelchuck, M. 1994. An Evaluation of the Kessner Adequacy of Prenatal Care Index and a Proposed Adequacy of Prenatal Care Utilization Index. American Journal of Public Health. 84 (9): 1414-1420.
2 D’Angelo D, Williams L, Morrow B, Cox S, Harris N, Harrison L, Posner SF, Hood JR, zapata L. 2007. Preconception and interconception health status of women who recently gave birth to a live-born infant--Pregnancy Risk Assessment Monitoring System (PRAMS), United States, 26 reporting areas, 2004. MMWR Surveillance Summary. 56(10):1-35.
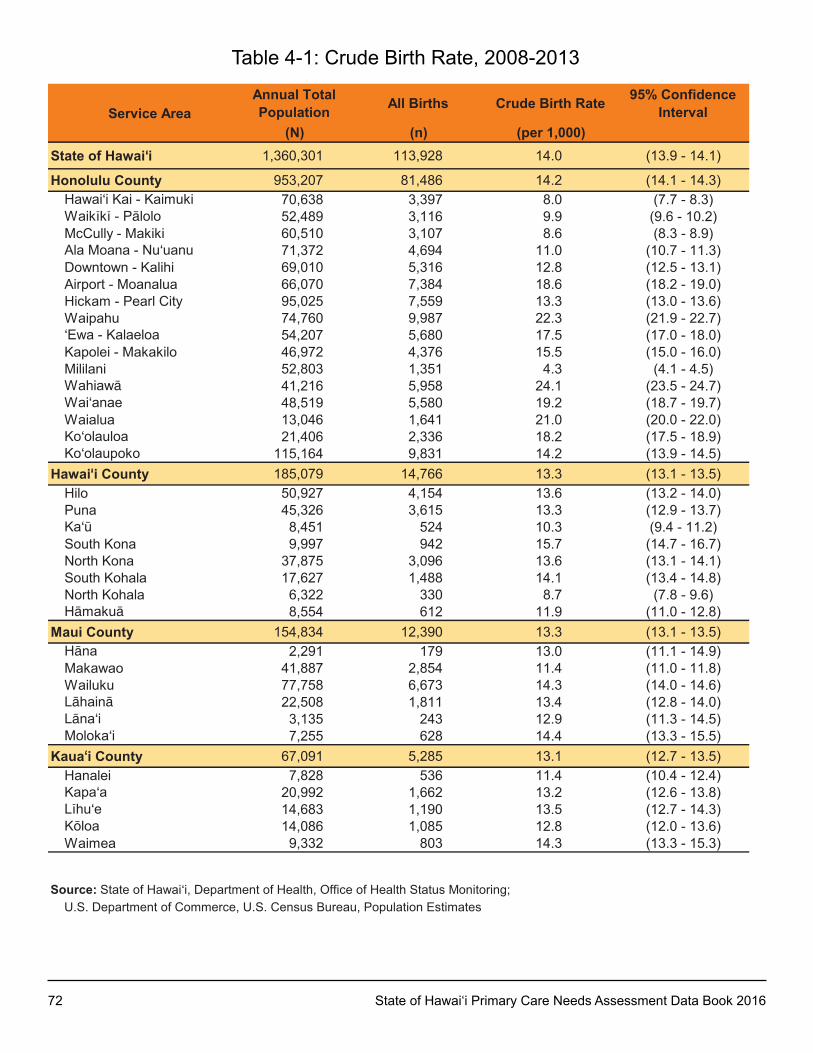
72 State of Hawai‘i Primary Care Needs Assessment Data Book 2016
Service AreaAnnual Total Population All Births Crude Birth Rate 95% Confidence
Interval(N) (n) (per 1,000)
State of Hawai‘i 1,360,301 113,928 14.0 (13.9 - 14.1)
Honolulu County 953,207 81,486 14.2 (14.1 - 14.3)Hawai‘i kai - kaimuki 70,638 3,397 8.0 (7.7 - 8.3)Waikïkï - Pälolo 52,489 3,116 9.9 (9.6 - 10.2)McCully - Makiki 60,510 3,107 8.6 (8.3 - 8.9)Ala Moana - Nu‘uanu 71,372 4,694 11.0 (10.7 - 11.3)Downtown - kalihi 69,010 5,316 12.8 (12.5 - 13.1)Airport - Moanalua 66,070 7,384 18.6 (18.2 - 19.0)Hickam - Pearl City 95,025 7,559 13.3 (13.0 - 13.6)Waipahu 74,760 9,987 22.3 (21.9 - 22.7)‘Ewa - kalaeloa 54,207 5,680 17.5 (17.0 - 18.0)kapolei - Makakilo 46,972 4,376 15.5 (15.0 - 16.0)Mililani 52,803 1,351 4.3 (4.1 - 4.5)Wahiawä 41,216 5,958 24.1 (23.5 - 24.7)Wai‘anae 48,519 5,580 19.2 (18.7 - 19.7)Waialua 13,046 1,641 21.0 (20.0 - 22.0)ko‘olauloa 21,406 2,336 18.2 (17.5 - 18.9)ko‘olaupoko 115,164 9,831 14.2 (13.9 - 14.5)
Hawai‘i County 185,079 14,766 13.3 (13.1 - 13.5)Hilo 50,927 4,154 13.6 (13.2 - 14.0)Puna 45,326 3,615 13.3 (12.9 - 13.7)ka‘ü 8,451 524 10.3 (9.4 - 11.2)South kona 9,997 942 15.7 (14.7 - 16.7)North kona 37,875 3,096 13.6 (13.1 - 14.1)South kohala 17,627 1,488 14.1 (13.4 - 14.8)North kohala 6,322 330 8.7 (7.8 - 9.6)Hämakuä 8,554 612 11.9 (11.0 - 12.8)
Maui County 154,834 12,390 13.3 (13.1 - 13.5)Häna 2,291 179 13.0 (11.1 - 14.9)Makawao 41,887 2,854 11.4 (11.0 - 11.8)Wailuku 77,758 6,673 14.3 (14.0 - 14.6)Lähainä 22,508 1,811 13.4 (12.8 - 14.0)Läna‘i 3,135 243 12.9 (11.3 - 14.5)Moloka‘i 7,255 628 14.4 (13.3 - 15.5)
Kaua‘i County 67,091 5,285 13.1 (12.7 - 13.5)Hanalei 7,828 536 11.4 (10.4 - 12.4)kapa‘a 20,992 1,662 13.2 (12.6 - 13.8)Lïhu‘e 14,683 1,190 13.5 (12.7 - 14.3)köloa 14,086 1,085 12.8 (12.0 - 13.6)Waimea 9,332 803 14.3 (13.3 - 15.3)
Source: State of Hawai‘i, Department of Health, Office of Health Status Monitoring;u.S. Department of Commerce, u.S. Census Bureau, Population Estimates
Table 4-1: Crude Birth Rate, 2008-2013
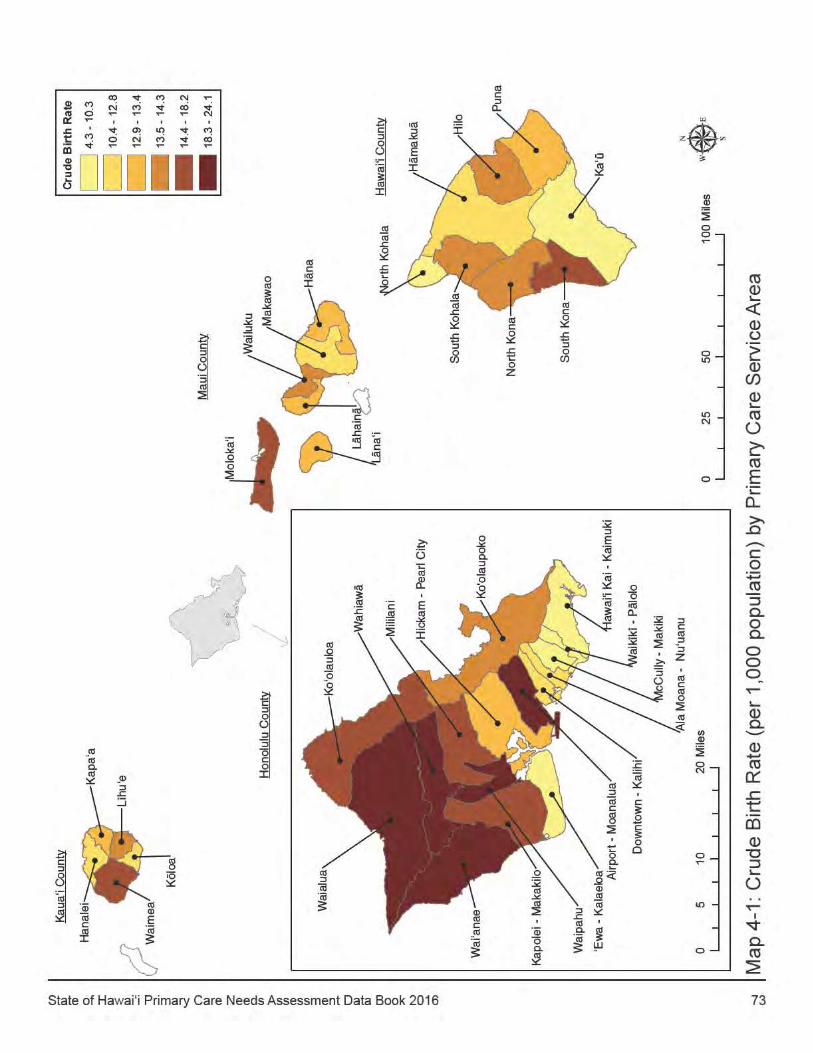
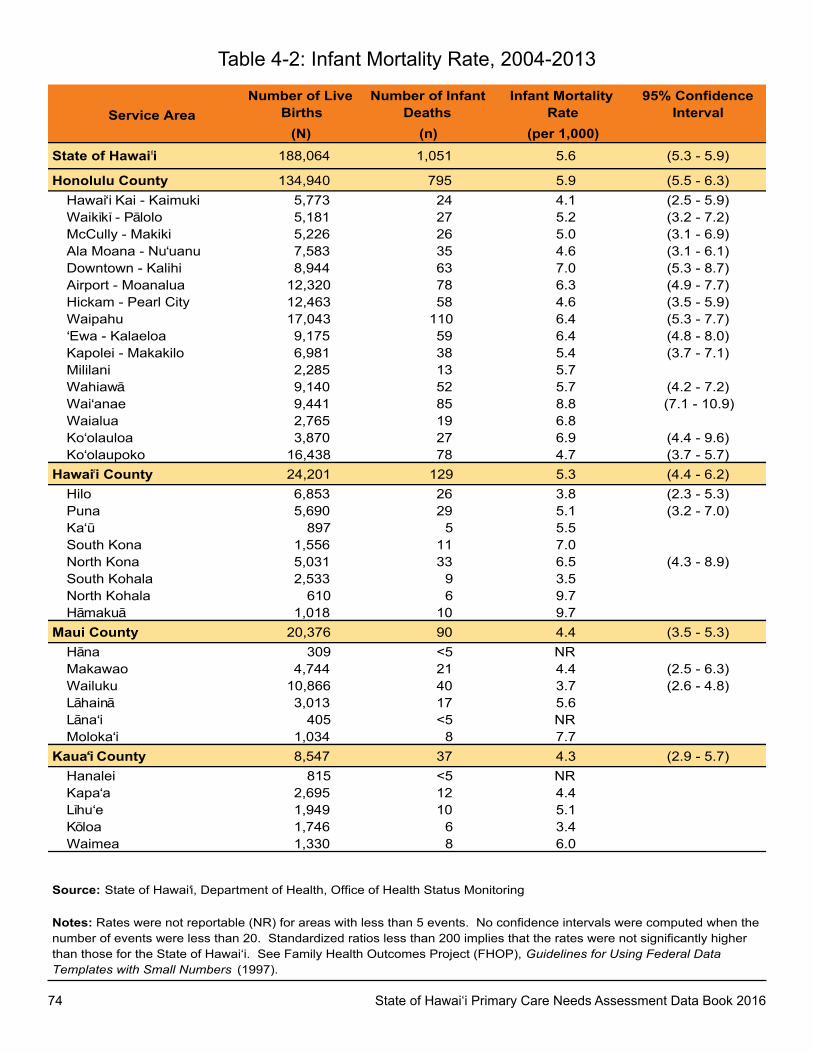
74 State of Hawai‘i Primary Care Needs Assessment Data Book 2016
Service AreaNumber of Live
BirthsNumber of Infant
DeathsInfant Mortality
Rate95% Confidence
Interval(N) (n) (per 1,000)
State of Hawai i 188,064 1,051 5.6 (5.3 - 5.9)
Honolulu County 134,940 795 5.9 (5.5 - 6.3)Hawai‘i Kai - Kaimuki 5,773 24 4.1 (2.5 - 5.9)Waikïkï - Pälolo 5,181 27 5.2 (3.2 - 7.2)McCully - Makiki 5,226 26 5.0 (3.1 - 6.9)Ala Moana - Nu‘uanu 7,583 35 4.6 (3.1 - 6.1)Downtown - Kalihi 8,944 63 7.0 (5.3 - 8.7)Airport - Moanalua 12,320 78 6.3 (4.9 - 7.7)Hickam - Pearl City 12,463 58 4.6 (3.5 - 5.9)Waipahu 17,043 110 6.4 (5.3 - 7.7)‘Ewa - Kalaeloa 9,175 59 6.4 (4.8 - 8.0)Kapolei - Makakilo 6,981 38 5.4 (3.7 - 7.1)Mililani 2,285 13 5.7Wahiawä 9,140 52 5.7 (4.2 - 7.2)Wai‘anae 9,441 85 8.8 (7.1 - 10.9)Waialua 2,765 19 6.8Ko‘olauloa 3,870 27 6.9 (4.4 - 9.6)Ko‘olaupoko 16,438 78 4.7 (3.7 - 5.7)
Hawai i County 24,201 129 5.3 (4.4 - 6.2)Hilo 6,853 26 3.8 (2.3 - 5.3)Puna 5,690 29 5.1 (3.2 - 7.0)Ka‘ü 897 5 5.5South Kona 1,556 11 7.0North Kona 5,031 33 6.5 (4.3 - 8.9)South Kohala 2,533 9 3.5North Kohala 610 6 9.7Hämakuä 1,018 10 9.7
Maui County 20,376 90 4.4 (3.5 - 5.3)Häna 309 <5 NRMakawao 4,744 21 4.4 (2.5 - 6.3)Wailuku 10,866 40 3.7 (2.6 - 4.8)Lähainä 3,013 17 5.6Läna‘i 405 <5 NRMoloka‘i 1,034 8 7.7
Kaua‘i County 8,547 37 4.3 (2.9 - 5.7)Hanalei 815 <5 NRKapa‘a 2,695 12 4.4Lïhu‘e 1,949 10 5.1Köloa 1,746 6 3.4Waimea 1,330 8 6.0
Source: State of Hawai‘i, Department of Health, Office of Health Status Monitoring
Notes: Rates were not reportable (NR) for areas with less than 5 events. No confidence intervals were computed when the number of events were less than 20. Standardized ratios less than 200 implies that the rates were not significantly higher than those for the State of Hawai‘i. See Family Health Outcomes Project (FHOP), Guidelines for Using Federal Data Templates with Small Numbers (1997).
Table 4-2: Infant Mortality Rate, 2004-2013

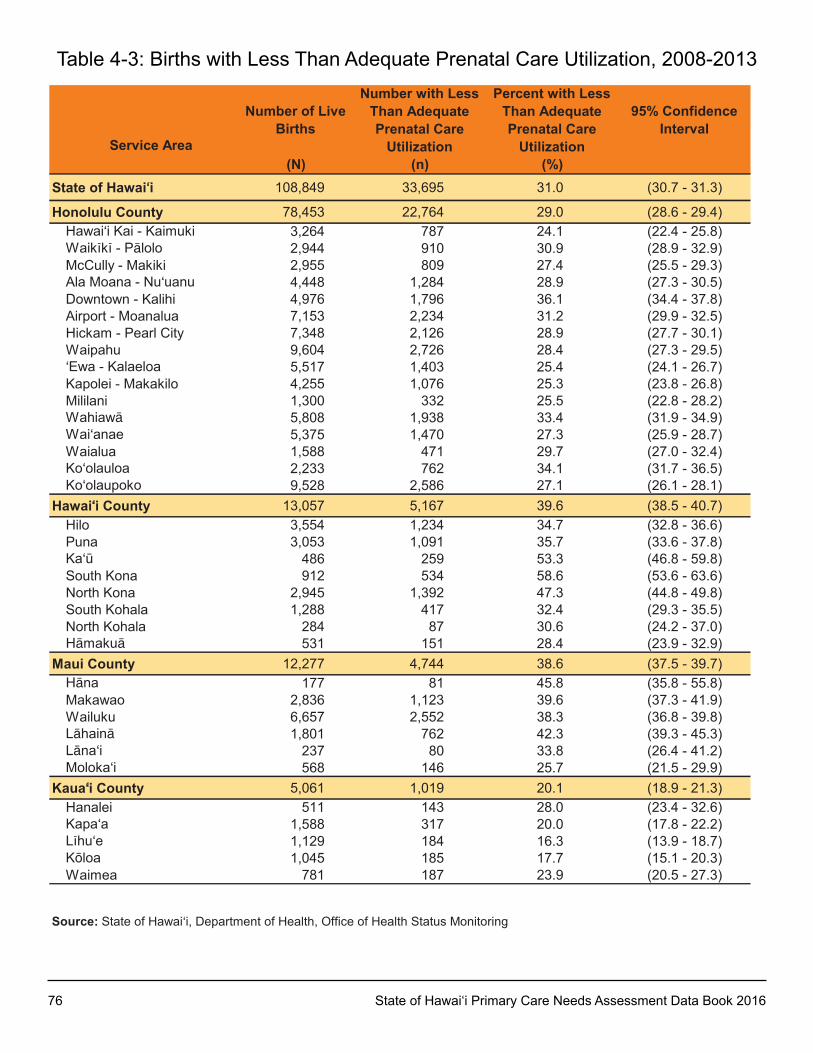
76 State of Hawai‘i Primary Care Needs Assessment Data Book 2016
Service Area
Number of Live Births
Number with Less Than Adequate Prenatal Care
Utilization
Percent with Less Than Adequate Prenatal Care
Utilization
95% Confidence Interval
(N) (n) (%)State of Hawai‘i 108,849 33,695 31.0 (30.7 - 31.3)
Honolulu County 78,453 22,764 29.0 (28.6 - 29.4)Hawai‘i kai - kaimuki 3,264 787 24.1 (22.4 - 25.8)Waikïkï - Pälolo 2,944 910 30.9 (28.9 - 32.9)McCully - Makiki 2,955 809 27.4 (25.5 - 29.3)Ala Moana - Nu‘uanu 4,448 1,284 28.9 (27.3 - 30.5)Downtown - kalihi 4,976 1,796 36.1 (34.4 - 37.8)Airport - Moanalua 7,153 2,234 31.2 (29.9 - 32.5)Hickam - Pearl City 7,348 2,126 28.9 (27.7 - 30.1)Waipahu 9,604 2,726 28.4 (27.3 - 29.5)‘Ewa - kalaeloa 5,517 1,403 25.4 (24.1 - 26.7)kapolei - Makakilo 4,255 1,076 25.3 (23.8 - 26.8)Mililani 1,300 332 25.5 (22.8 - 28.2)Wahiawä 5,808 1,938 33.4 (31.9 - 34.9)Wai‘anae 5,375 1,470 27.3 (25.9 - 28.7)Waialua 1,588 471 29.7 (27.0 - 32.4)ko‘olauloa 2,233 762 34.1 (31.7 - 36.5)ko‘olaupoko 9,528 2,586 27.1 (26.1 - 28.1)
Hawai‘i County 13,057 5,167 39.6 (38.5 - 40.7)Hilo 3,554 1,234 34.7 (32.8 - 36.6)Puna 3,053 1,091 35.7 (33.6 - 37.8)ka‘ü 486 259 53.3 (46.8 - 59.8)South kona 912 534 58.6 (53.6 - 63.6)North kona 2,945 1,392 47.3 (44.8 - 49.8)South kohala 1,288 417 32.4 (29.3 - 35.5)North kohala 284 87 30.6 (24.2 - 37.0)Hämakuä 531 151 28.4 (23.9 - 32.9)
Maui County 12,277 4,744 38.6 (37.5 - 39.7)Häna 177 81 45.8 (35.8 - 55.8)Makawao 2,836 1,123 39.6 (37.3 - 41.9)Wailuku 6,657 2,552 38.3 (36.8 - 39.8)Lähainä 1,801 762 42.3 (39.3 - 45.3)Läna‘i 237 80 33.8 (26.4 - 41.2)Moloka‘i 568 146 25.7 (21.5 - 29.9)
Kaua‘i County 5,061 1,019 20.1 (18.9 - 21.3)Hanalei 511 143 28.0 (23.4 - 32.6)kapa‘a 1,588 317 20.0 (17.8 - 22.2)Lïhu‘e 1,129 184 16.3 (13.9 - 18.7)köloa 1,045 185 17.7 (15.1 - 20.3)Waimea 781 187 23.9 (20.5 - 27.3)
Source: State of Hawai‘i, Department of Health, Office of Health Status Monitoring
Table 4-3: Births with Less Than Adequate Prenatal Care utilization, 2008-2013
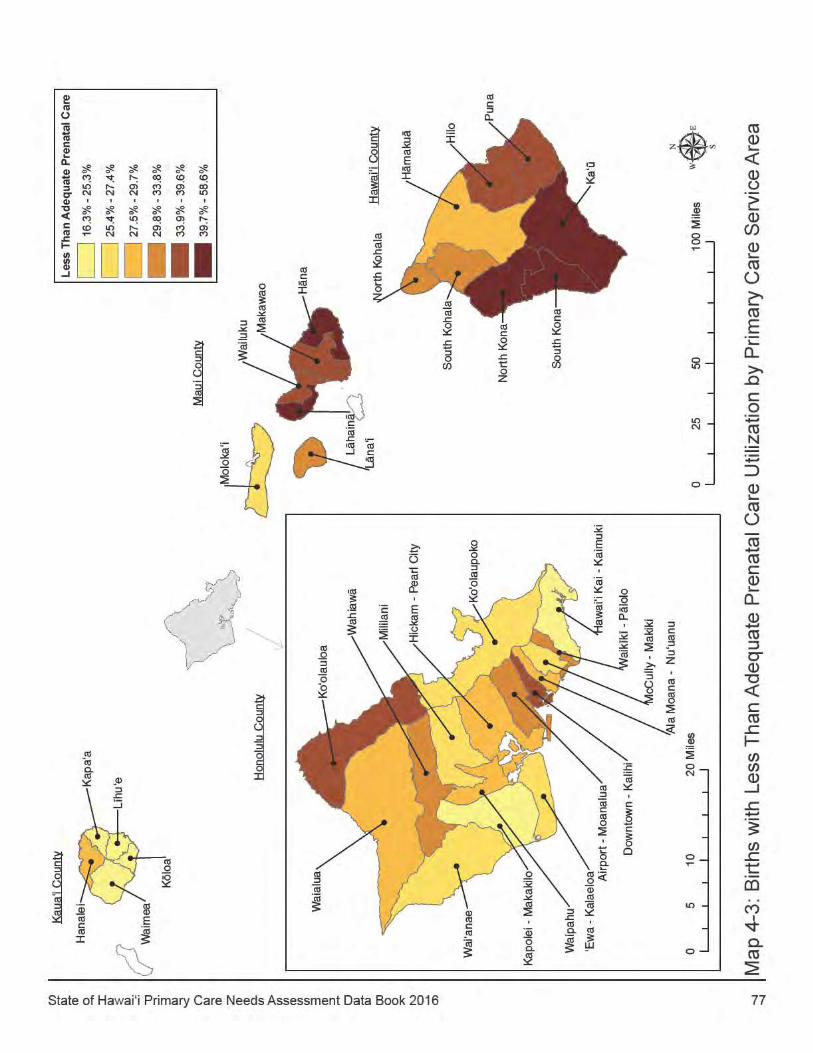
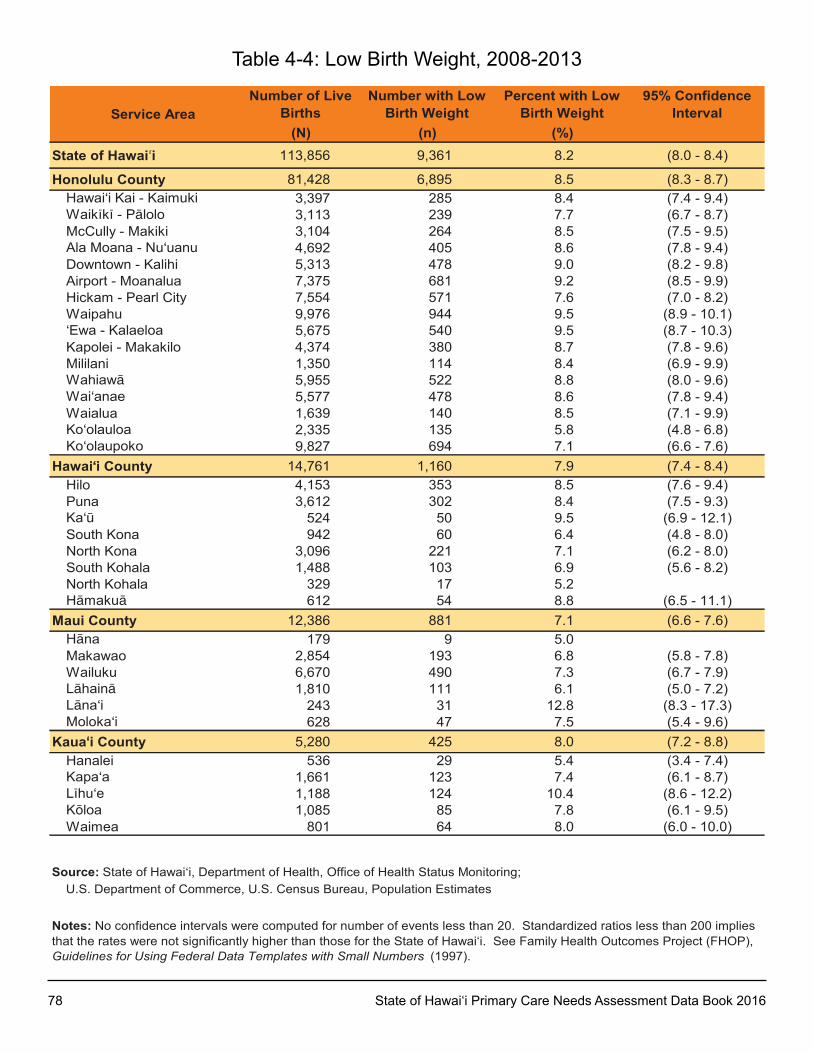
78 State of Hawai‘i Primary Care Needs Assessment Data Book 2016
Service AreaNumber of Live
BirthsNumber with Low
Birth WeightPercent with Low
Birth Weight95% Confidence
Interval(N) (n) (%)
State of Hawai i 113,856 9,361 8.2 (8.0 - 8.4)
Honolulu County 81,428 6,895 8.5 (8.3 - 8.7)Hawai‘i kai - kaimuki 3,397 285 8.4 (7.4 - 9.4)Waikïkï - Pälolo 3,113 239 7.7 (6.7 - 8.7)McCully - Makiki 3,104 264 8.5 (7.5 - 9.5)Ala Moana - Nu‘uanu 4,692 405 8.6 (7.8 - 9.4)Downtown - kalihi 5,313 478 9.0 (8.2 - 9.8)Airport - Moanalua 7,375 681 9.2 (8.5 - 9.9)Hickam - Pearl City 7,554 571 7.6 (7.0 - 8.2)Waipahu 9,976 944 9.5 (8.9 - 10.1)‘Ewa - kalaeloa 5,675 540 9.5 (8.7 - 10.3)kapolei - Makakilo 4,374 380 8.7 (7.8 - 9.6)Mililani 1,350 114 8.4 (6.9 - 9.9)Wahiawä 5,955 522 8.8 (8.0 - 9.6)Wai‘anae 5,577 478 8.6 (7.8 - 9.4)Waialua 1,639 140 8.5 (7.1 - 9.9)ko‘olauloa 2,335 135 5.8 (4.8 - 6.8)ko‘olaupoko 9,827 694 7.1 (6.6 - 7.6)
Hawai‘i County 14,761 1,160 7.9 (7.4 - 8.4)Hilo 4,153 353 8.5 (7.6 - 9.4)Puna 3,612 302 8.4 (7.5 - 9.3)ka‘ü 524 50 9.5 (6.9 - 12.1)South kona 942 60 6.4 (4.8 - 8.0)North kona 3,096 221 7.1 (6.2 - 8.0)South kohala 1,488 103 6.9 (5.6 - 8.2)North kohala 329 17 5.2Hämakuä 612 54 8.8 (6.5 - 11.1)
Maui County 12,386 881 7.1 (6.6 - 7.6)Häna 179 9 5.0Makawao 2,854 193 6.8 (5.8 - 7.8)Wailuku 6,670 490 7.3 (6.7 - 7.9)Lähainä 1,810 111 6.1 (5.0 - 7.2)Läna‘i 243 31 12.8 (8.3 - 17.3)Moloka‘i 628 47 7.5 (5.4 - 9.6)
Kaua‘i County 5,280 425 8.0 (7.2 - 8.8)Hanalei 536 29 5.4 (3.4 - 7.4)kapa‘a 1,661 123 7.4 (6.1 - 8.7)Lïhu‘e 1,188 124 10.4 (8.6 - 12.2)köloa 1,085 85 7.8 (6.1 - 9.5)Waimea 801 64 8.0 (6.0 - 10.0)
Source: State of Hawai‘i, Department of Health, Office of Health Status Monitoring;u.S. Department of Commerce, u.S. Census Bureau, Population Estimates
Notes: No confidence intervals were computed for number of events less than 20. Standardized ratios less than 200 implies that the rates were not significantly higher than those for the State of Hawai‘i. See Family Health Outcomes Project (FHOP), Guidelines for Using Federal Data Templates with Small Numbers (1997).
Table 4-4: Low Birth Weight, 2008-2013
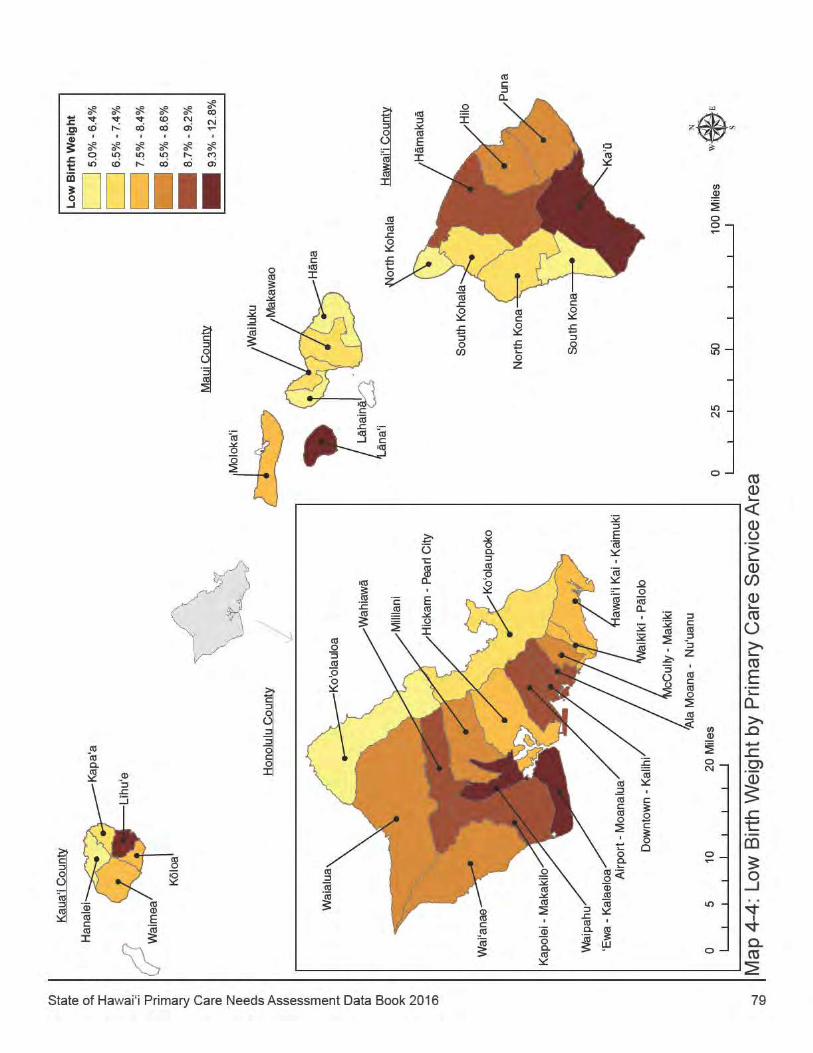
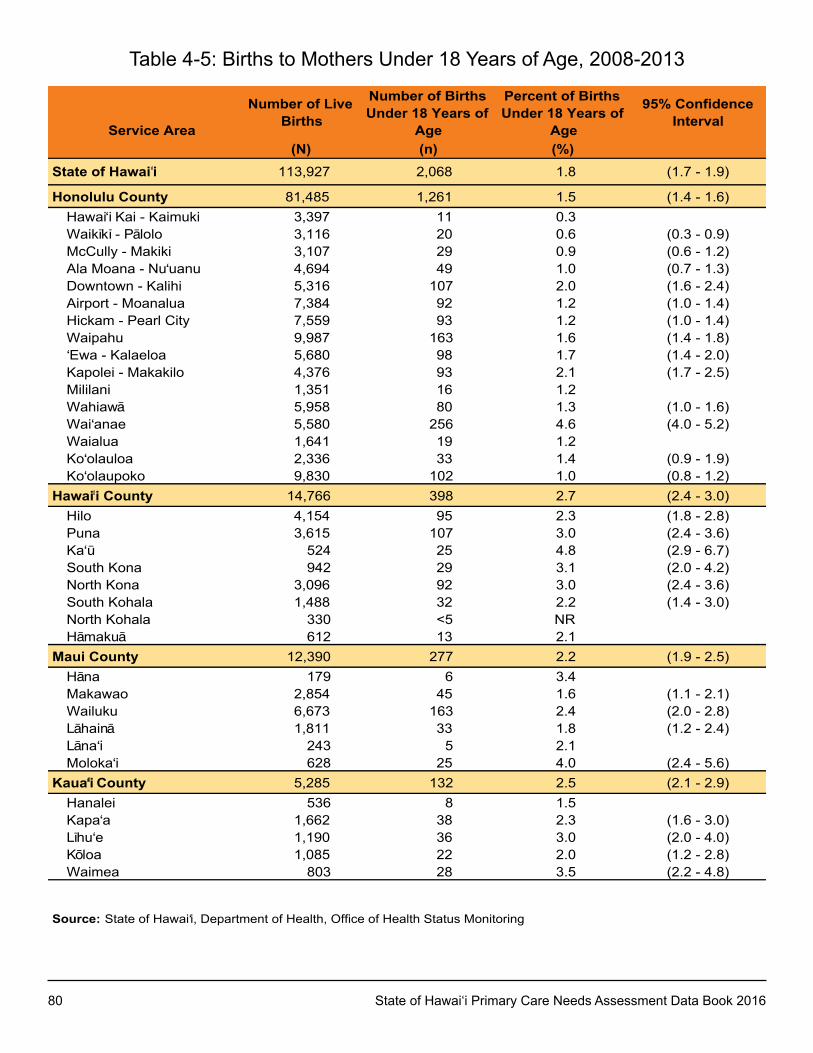
80 State of Hawai‘i Primary Care Needs Assessment Data Book 2016
Service Area
Number of LiveBirths
Number of BirthsUnder 18 Years of
Age
Percent of BirthsUnder 18 Years of
Age
95% ConfidenceInterval
(N) (n) (%)State of Hawai i 113,927 2,068 1.8 (1.7 - 1.9)
Honolulu County 81,485 1,261 1.5 (1.4 - 1.6)Hawai‘i Kai - Kaimuki 3,397 11 0.3Waikïkï - Pälolo 3,116 20 0.6 (0.3 - 0.9)McCully - Makiki 3,107 29 0.9 (0.6 - 1.2)Ala Moana - Nu‘uanu 4,694 49 1.0 (0.7 - 1.3)Downtown - Kalihi 5,316 107 2.0 (1.6 - 2.4)Airport - Moanalua 7,384 92 1.2 (1.0 - 1.4)Hickam - Pearl City 7,559 93 1.2 (1.0 - 1.4)Waipahu 9,987 163 1.6 (1.4 - 1.8)‘Ewa - Kalaeloa 5,680 98 1.7 (1.4 - 2.0)Kapolei - Makakilo 4,376 93 2.1 (1.7 - 2.5)Mililani 1,351 16 1.2Wahiawä 5,958 80 1.3 (1.0 - 1.6)Wai‘anae 5,580 256 4.6 (4.0 - 5.2)Waialua 1,641 19 1.2Ko‘olauloa 2,336 33 1.4 (0.9 - 1.9)Ko‘olaupoko 9,830 102 1.0 (0.8 - 1.2)
Hawai i County 14,766 398 2.7 (2.4 - 3.0)Hilo 4,154 95 2.3 (1.8 - 2.8)Puna 3,615 107 3.0 (2.4 - 3.6)Ka‘ü 524 25 4.8 (2.9 - 6.7)South Kona 942 29 3.1 (2.0 - 4.2)North Kona 3,096 92 3.0 (2.4 - 3.6)South Kohala 1,488 32 2.2 (1.4 - 3.0)North Kohala 330 <5 NRHämakuä 612 13 2.1
Maui County 12,390 277 2.2 (1.9 - 2.5)Häna 179 6 3.4Makawao 2,854 45 1.6 (1.1 - 2.1)Wailuku 6,673 163 2.4 (2.0 - 2.8)Lähainä 1,811 33 1.8 (1.2 - 2.4)Läna‘i 243 5 2.1Moloka‘i 628 25 4.0 (2.4 - 5.6)
Kaua‘i County 5,285 132 2.5 (2.1 - 2.9)Hanalei 536 8 1.5Kapa‘a 1,662 38 2.3 (1.6 - 3.0)Lïhu‘e 1,190 36 3.0 (2.0 - 4.0)Köloa 1,085 22 2.0 (1.2 - 2.8)Waimea 803 28 3.5 (2.2 - 4.8)
Source: State of Hawai‘i, Department of Health, Office of Health Status Monitoring
Te
Table 4-5: Births to Mothers under 18 Years of Age, 2008-2013
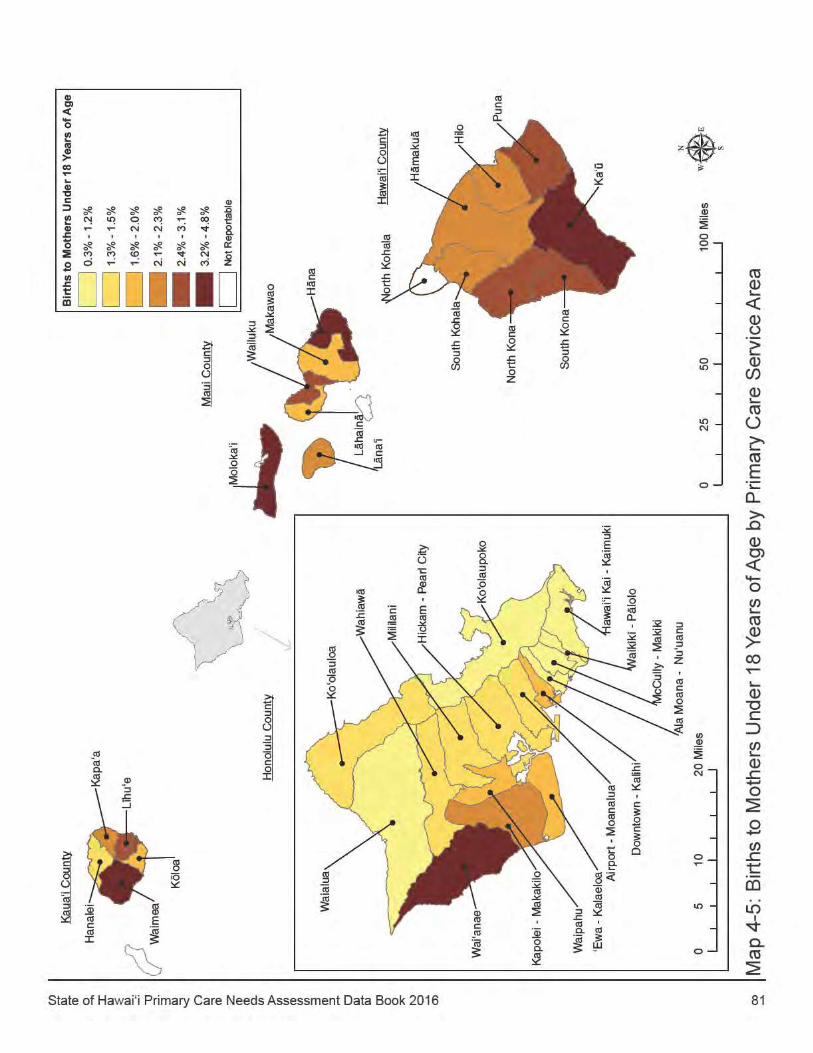
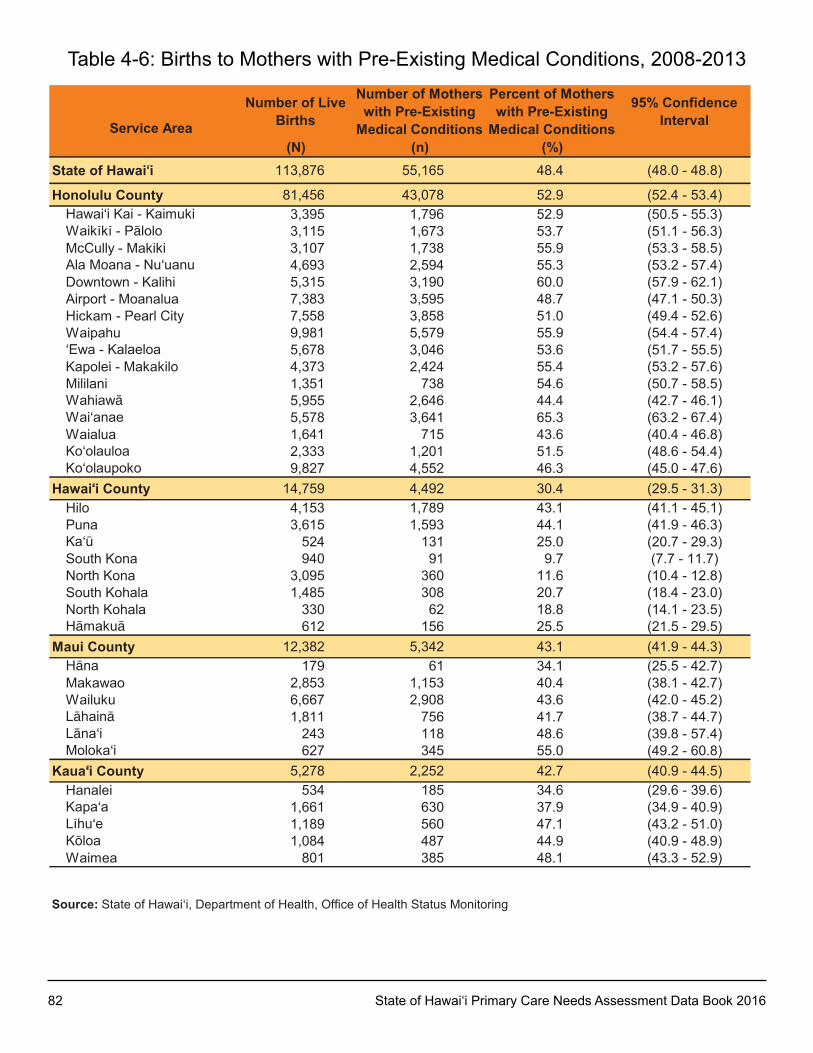
82 State of Hawai‘i Primary Care Needs Assessment Data Book 2016
Service Area
Number of Live Births
Number of Mothers with Pre-Existing
Medical Conditions
Percent of Mothers with Pre-Existing
Medical Conditions
95% Confidence Interval
(N) (n) (%)State of Hawai‘i 113,876 55,165 48.4 (48.0 - 48.8)
Honolulu County 81,456 43,078 52.9 (52.4 - 53.4)Hawai‘i kai - kaimuki 3,395 1,796 52.9 (50.5 - 55.3)Waikïkï - Pälolo 3,115 1,673 53.7 (51.1 - 56.3)McCully - Makiki 3,107 1,738 55.9 (53.3 - 58.5)Ala Moana - Nu‘uanu 4,693 2,594 55.3 (53.2 - 57.4)Downtown - kalihi 5,315 3,190 60.0 (57.9 - 62.1)Airport - Moanalua 7,383 3,595 48.7 (47.1 - 50.3)Hickam - Pearl City 7,558 3,858 51.0 (49.4 - 52.6)Waipahu 9,981 5,579 55.9 (54.4 - 57.4)‘Ewa - kalaeloa 5,678 3,046 53.6 (51.7 - 55.5)kapolei - Makakilo 4,373 2,424 55.4 (53.2 - 57.6)Mililani 1,351 738 54.6 (50.7 - 58.5)Wahiawä 5,955 2,646 44.4 (42.7 - 46.1)Wai‘anae 5,578 3,641 65.3 (63.2 - 67.4)Waialua 1,641 715 43.6 (40.4 - 46.8)ko‘olauloa 2,333 1,201 51.5 (48.6 - 54.4)ko‘olaupoko 9,827 4,552 46.3 (45.0 - 47.6)
Hawai‘i County 14,759 4,492 30.4 (29.5 - 31.3)Hilo 4,153 1,789 43.1 (41.1 - 45.1)Puna 3,615 1,593 44.1 (41.9 - 46.3)ka‘ü 524 131 25.0 (20.7 - 29.3)South kona 940 91 9.7 (7.7 - 11.7)North kona 3,095 360 11.6 (10.4 - 12.8)South kohala 1,485 308 20.7 (18.4 - 23.0)North kohala 330 62 18.8 (14.1 - 23.5)Hämakuä 612 156 25.5 (21.5 - 29.5)
Maui County 12,382 5,342 43.1 (41.9 - 44.3)Häna 179 61 34.1 (25.5 - 42.7)Makawao 2,853 1,153 40.4 (38.1 - 42.7)Wailuku 6,667 2,908 43.6 (42.0 - 45.2)Lähainä 1,811 756 41.7 (38.7 - 44.7)Läna‘i 243 118 48.6 (39.8 - 57.4)Moloka‘i 627 345 55.0 (49.2 - 60.8)
Kaua‘i County 5,278 2,252 42.7 (40.9 - 44.5)Hanalei 534 185 34.6 (29.6 - 39.6)kapa‘a 1,661 630 37.9 (34.9 - 40.9)Lïhu‘e 1,189 560 47.1 (43.2 - 51.0)köloa 1,084 487 44.9 (40.9 - 48.9)Waimea 801 385 48.1 (43.3 - 52.9)
Source: State of Hawai‘i, Department of Health, Office of Health Status Monitoring
Table 4-6: Births to Mothers with Pre-Existing Medical Conditions, 2008-2013
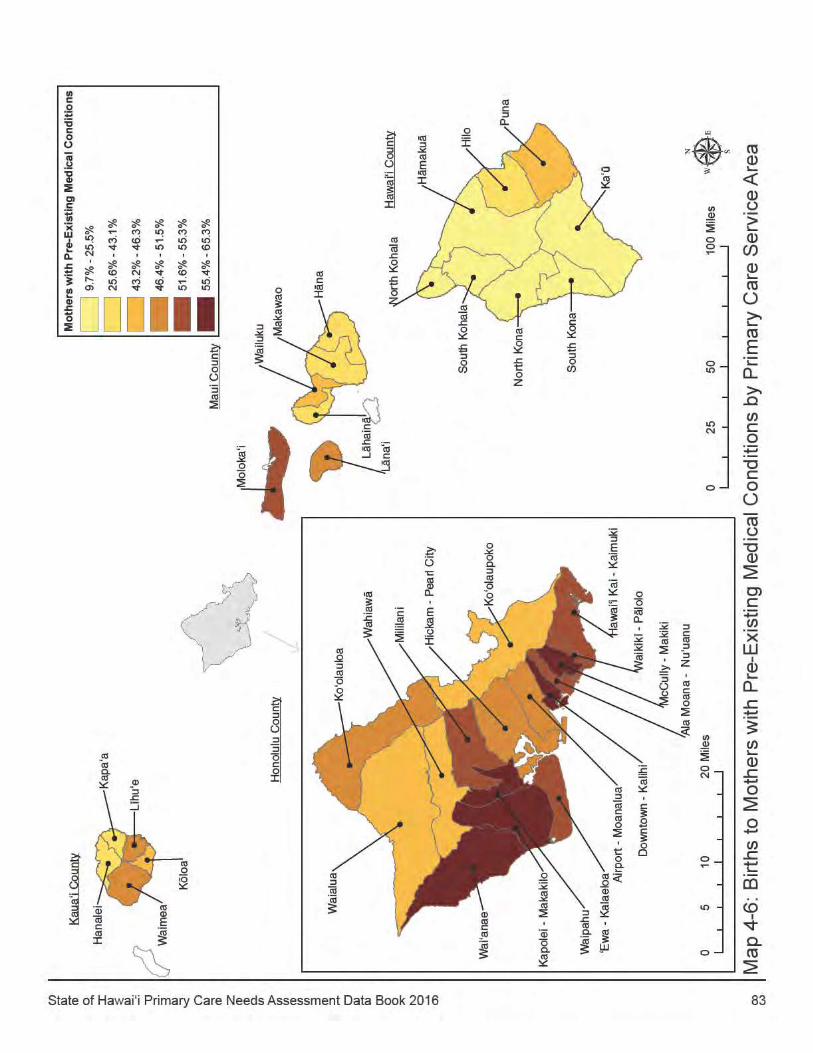
84 State of Hawai‘i Primary Care Needs Assessment Data Book 2016
CHAPTER 5: MORBIDITY
This section of the Data Book builds on the success of the developmental indicators used in previous editions. To impact population level changes in rates of chronic disease and the leading causes of death, the primary prevention of chronic disease should start early in life. Morbidity refers to the state of having disease or being unhealthful and can refer to risk factors such as obesity and smoking which are associated with long term disability and chronic disease. Regular physical exams and health screening tests are an important part of preventive health care where co-morbidities can be addressed through lifestyle and medical interventions. Preventive health care can help ensure that common, serious diseases and conditions are detected and treated early. The prevention of risk factors and their early identification and control can contribute to improved long term health and decrease the impact of chronic disease. The morbidity indicators based on adult risk factors, using aggregated data from the 2011-2014 Behavioral Risk Factor Surveillance System (BRFSS) unless noted, are defined on the next page.
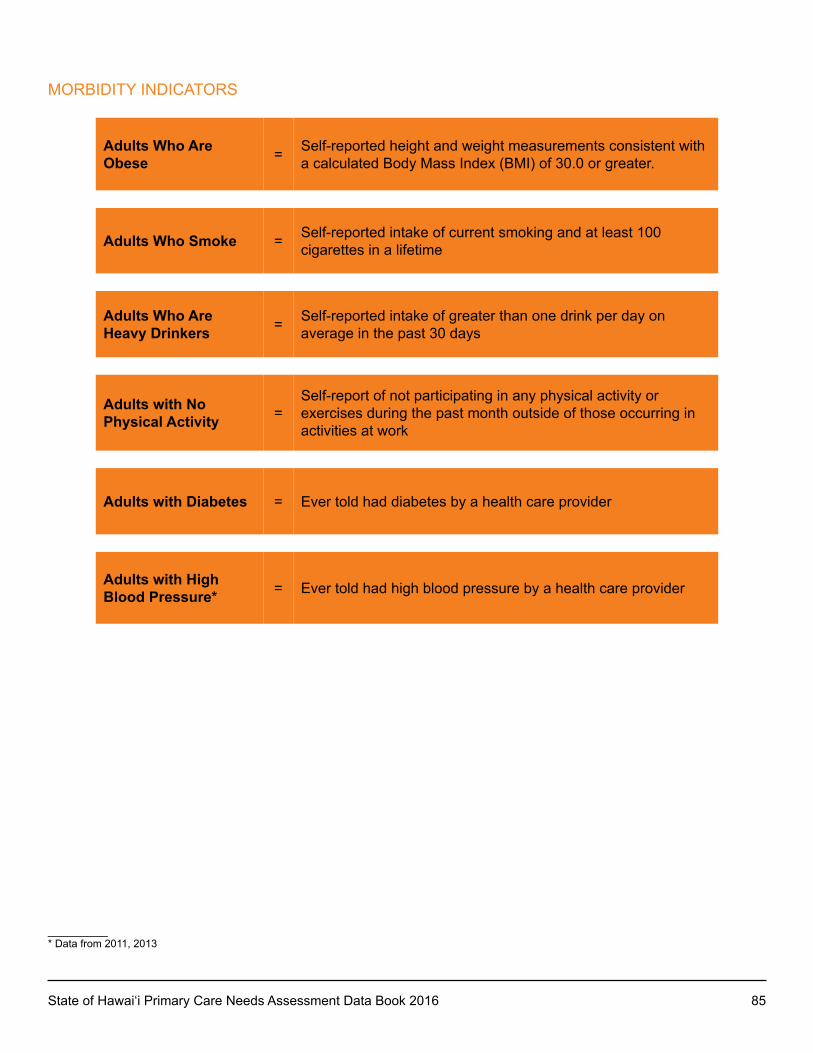
State of Hawai‘i Primary Care Needs Assessment Data Book 2016 85
MORBIDITY INDICATORS
Adults Who Are Obese = Self-reported height and weight measurements consistent with
a calculated Body Mass Index (BMI) of 30.0 or greater.
Adults Who Smoke = Self-reported intake of current smoking and at least 100 cigarettes in a lifetime
Adults Who Are Heavy Drinkers = Self-reported intake of greater than one drink per day on
average in the past 30 days
Adults with No Physical Activity =
Self-report of not participating in any physical activity or exercises during the past month outside of those occurring in activities at work
Adults with Diabetes = Ever told had diabetes by a health care provider
Adults with High Blood Pressure* = Ever told had high blood pressure by a health care provider
_________* Data from 2011, 2013
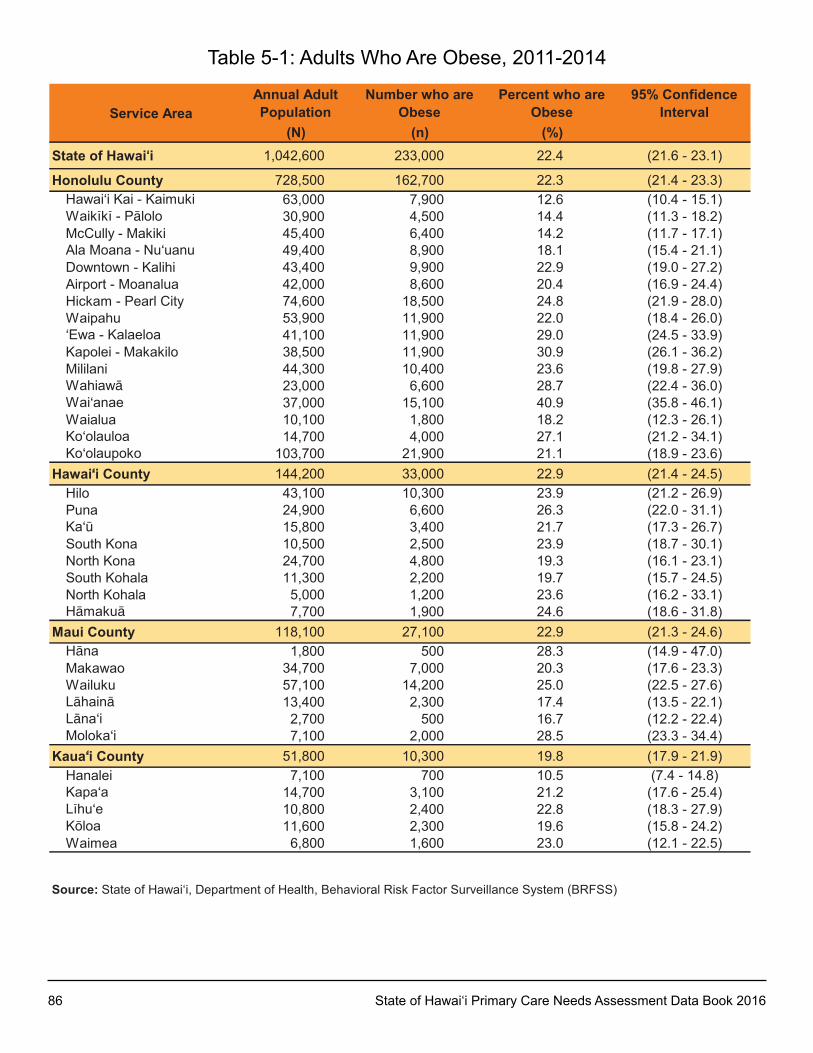
86 State of Hawai‘i Primary Care Needs Assessment Data Book 2016
Service AreaAnnual Adult Population
Number who are Obese
Percent who are Obese
95% Confidence Interval
(N) (n) (%)State of Hawai‘i 1,042,600 233,000 22.4 (21.6 - 23.1)
Honolulu County 728,500 162,700 22.3 (21.4 - 23.3)Hawai‘i kai - kaimuki 63,000 7,900 12.6 (10.4 - 15.1)Waikïkï - Pälolo 30,900 4,500 14.4 (11.3 - 18.2)McCully - Makiki 45,400 6,400 14.2 (11.7 - 17.1)Ala Moana - Nu‘uanu 49,400 8,900 18.1 (15.4 - 21.1)Downtown - kalihi 43,400 9,900 22.9 (19.0 - 27.2)Airport - Moanalua 42,000 8,600 20.4 (16.9 - 24.4)Hickam - Pearl City 74,600 18,500 24.8 (21.9 - 28.0)Waipahu 53,900 11,900 22.0 (18.4 - 26.0)‘Ewa - kalaeloa 41,100 11,900 29.0 (24.5 - 33.9)kapolei - Makakilo 38,500 11,900 30.9 (26.1 - 36.2)Mililani 44,300 10,400 23.6 (19.8 - 27.9)Wahiawä 23,000 6,600 28.7 (22.4 - 36.0)Wai‘anae 37,000 15,100 40.9 (35.8 - 46.1)Waialua 10,100 1,800 18.2 (12.3 - 26.1)ko‘olauloa 14,700 4,000 27.1 (21.2 - 34.1)ko‘olaupoko 103,700 21,900 21.1 (18.9 - 23.6)
Hawai‘i County 144,200 33,000 22.9 (21.4 - 24.5)Hilo 43,100 10,300 23.9 (21.2 - 26.9)Puna 24,900 6,600 26.3 (22.0 - 31.1)ka‘ü 15,800 3,400 21.7 (17.3 - 26.7)South kona 10,500 2,500 23.9 (18.7 - 30.1)North kona 24,700 4,800 19.3 (16.1 - 23.1)South kohala 11,300 2,200 19.7 (15.7 - 24.5)North kohala 5,000 1,200 23.6 (16.2 - 33.1)Hämakuä 7,700 1,900 24.6 (18.6 - 31.8)
Maui County 118,100 27,100 22.9 (21.3 - 24.6)Häna 1,800 500 28.3 (14.9 - 47.0)Makawao 34,700 7,000 20.3 (17.6 - 23.3)Wailuku 57,100 14,200 25.0 (22.5 - 27.6)Lähainä 13,400 2,300 17.4 (13.5 - 22.1)Läna‘i 2,700 500 16.7 (12.2 - 22.4)Moloka‘i 7,100 2,000 28.5 (23.3 - 34.4)
Kaua‘i County 51,800 10,300 19.8 (17.9 - 21.9)Hanalei 7,100 700 10.5 (7.4 - 14.8)kapa‘a 14,700 3,100 21.2 (17.6 - 25.4)Lïhu‘e 10,800 2,400 22.8 (18.3 - 27.9)köloa 11,600 2,300 19.6 (15.8 - 24.2)Waimea 6,800 1,600 23.0 (12.1 - 22.5)
Source: State of Hawai‘i, Department of Health, Behavioral Risk Factor Surveillance System (BRFSS)
Table 5-1: Adults Who Are Obese, 2011-2014
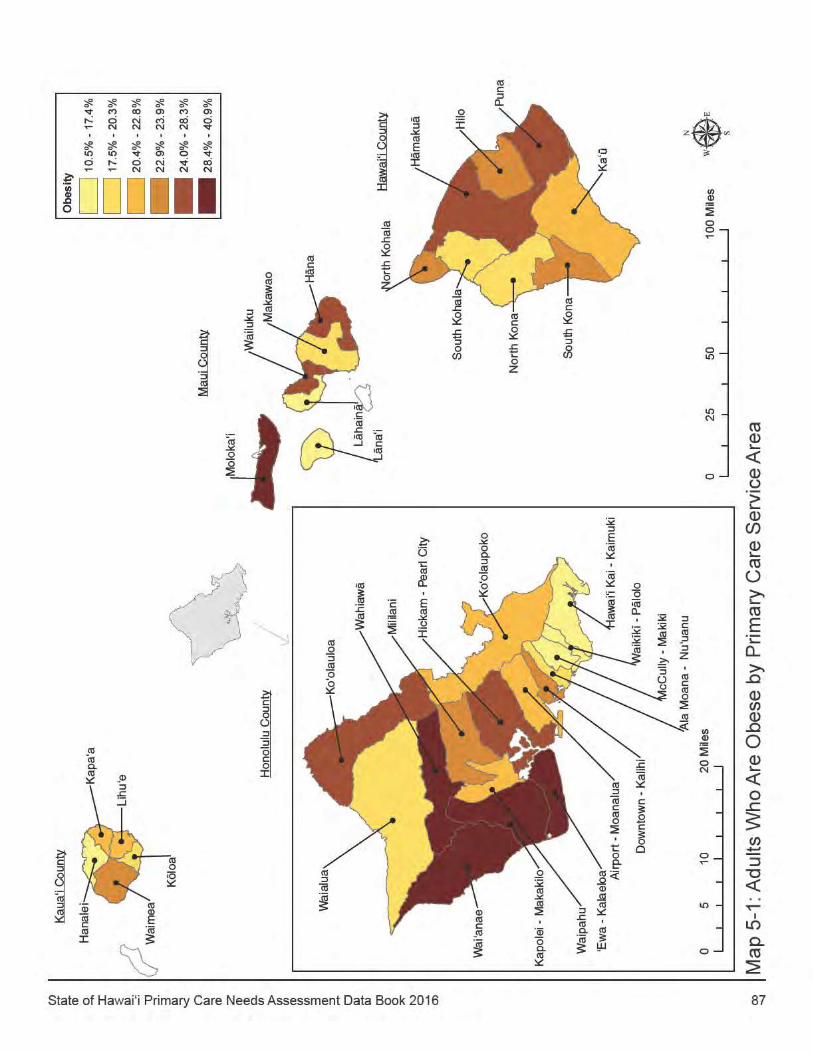

88 State of Hawai‘i Primary Care Needs Assessment Data Book 2016
Service AreaAnnual Adult Population
Number who Smoke
Percent who Smoke
95% Confidence Interval
(N) (n) (%)State of Hawai‘i 1,056,000 155,300 14.7 (14.1 - 15.4)
Honolulu County 738,800 103,500 14.0 (13.2 - 14.8)Hawai‘i kai - kaimuki 64,400 4,700 7.2 (5.6 - 9.3)Waikïkï - Pälolo 31,200 4,200 13.4 (10.2 - 17.3)McCully - Makiki 47,100 6,800 14.4 (11.8 - 17.4)Ala Moana - Nu‘uanu 50,100 6,200 12.4 (10.1 - 15.2)Downtown - kalihi 43,300 7,000 16.0 (12.9 - 19.8)Airport - Moanalua 42,900 4,700 11.0 (8.3 - 14.4)Hickam - Pearl City 75,600 11,300 14.9 (12.4 - 17.8)Waipahu 54,400 5,600 10.2 (8.0 - 13.0)‘Ewa - kalaeloa 42,600 5,000 11.6 (8.7 - 15.4)kapolei - Makakilo 39,300 6,500 16.7 (13.0 - 21.1)Mililani 43,900 6,000 13.7 (10.6 - 17.6)Wahiawä 23,300 5,500 23.6 (18.4 - 29.8)Wai‘anae 37,400 9,400 25.2 (20.9 - 29.9)Waialua 10,200 1,700 16.6 (10.5 - 25.3)ko‘olauloa 15,200 2,300 15.3 (10.0 - 22.8)ko‘olaupoko 104,600 14,300 13.7 (11.7 - 15.9)
Hawai‘i County 145,700 26,700 18.3 (16.9 - 19.9)Hilo 43,900 7,600 17.4 (15.1 - 20.0)Puna 25,200 5,600 22.3 (18.0 - 27.2)ka‘ü 15,800 3,400 21.7 (17.3 - 26.8)South kona 10,600 2,100 20.1 (15.1 - 26.2)North kona 24,800 3,900 15.6 (12.6 - 19.2)South kohala 11,600 1,500 12.7 (9.4 - 16.9)North kohala 5,000 700 14.8 (9.3 - 22.6)Hämakuä 7,500 1,600 21.8 (15.5 - 29.8)
Maui County 119,500 16,700 14.0 (12.6 - 15.5)Häna 1,800 NR NRMakawao 35,100 5,400 15.4 (12.8 - 18.6)Wailuku 57,700 7,200 12.5 (10.7 - 14.4)Lähainä 13,800 2,100 15.4 (11.2 - 20.8)Läna‘i 2,700 600 20.4 (11.9 - 32.5)Moloka‘i 7,100 1,100 15.4 (10.8 - 21.4)
Kaua‘i County 52,100 8,400 16.1 (13.9 - 18.6)Hanalei 7,100 1,200 16.4 (9.2 - 27.7)kapa‘a 15,000 2,200 14.5 (11.5 - 18.1)Lïhu‘e 10,700 1,700 15.6 (11.7 - 20.6)köloa 11,700 2,100 18.1 (13.2 - 24.4)Waimea 6,900 1,200 16.7 (12.1 - 22.5)
Source: State of Hawai‘i, Department of Health, Behavioral Risk Factor Surveillance System (BRFSS)
Notes: Number and rates were not reportable (NR) for areas with <50 respondents or the relative standard error was >30% per Hawai‘i BRFSS data suppression guidelines. No confidence intervals were included for areas with NR indicators.
Table 5-2: Adults Who Smoke, 2011-2014
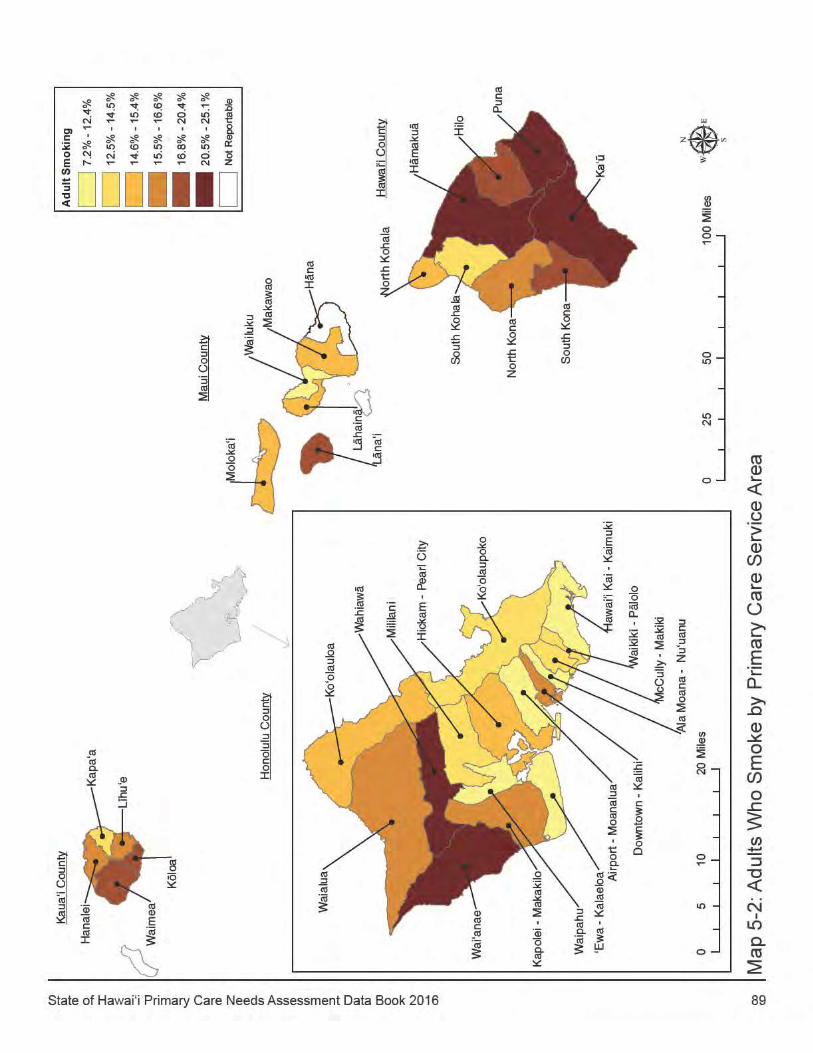
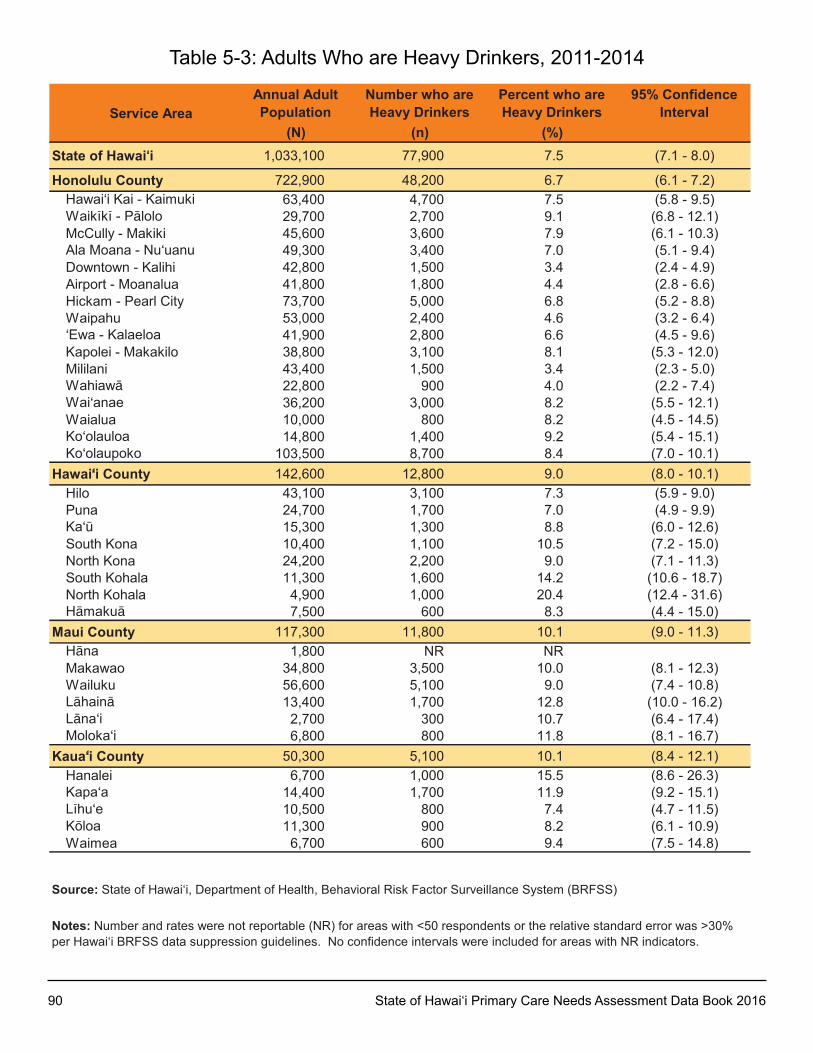
90 State of Hawai‘i Primary Care Needs Assessment Data Book 2016
Service AreaAnnual Adult Population
Number who are Heavy Drinkers
Percent who are Heavy Drinkers
95% Confidence Interval
(N) (n) (%)State of Hawai‘i 1,033,100 77,900 7.5 (7.1 - 8.0)
Honolulu County 722,900 48,200 6.7 (6.1 - 7.2)Hawai‘i kai - kaimuki 63,400 4,700 7.5 (5.8 - 9.5)Waikïkï - Pälolo 29,700 2,700 9.1 (6.8 - 12.1)McCully - Makiki 45,600 3,600 7.9 (6.1 - 10.3)Ala Moana - Nu‘uanu 49,300 3,400 7.0 (5.1 - 9.4)Downtown - kalihi 42,800 1,500 3.4 (2.4 - 4.9)Airport - Moanalua 41,800 1,800 4.4 (2.8 - 6.6)Hickam - Pearl City 73,700 5,000 6.8 (5.2 - 8.8)Waipahu 53,000 2,400 4.6 (3.2 - 6.4)‘Ewa - kalaeloa 41,900 2,800 6.6 (4.5 - 9.6)kapolei - Makakilo 38,800 3,100 8.1 (5.3 - 12.0)Mililani 43,400 1,500 3.4 (2.3 - 5.0)Wahiawä 22,800 900 4.0 (2.2 - 7.4)Wai‘anae 36,200 3,000 8.2 (5.5 - 12.1)Waialua 10,000 800 8.2 (4.5 - 14.5)ko‘olauloa 14,800 1,400 9.2 (5.4 - 15.1)ko‘olaupoko 103,500 8,700 8.4 (7.0 - 10.1)
Hawai‘i County 142,600 12,800 9.0 (8.0 - 10.1)Hilo 43,100 3,100 7.3 (5.9 - 9.0)Puna 24,700 1,700 7.0 (4.9 - 9.9)ka‘ü 15,300 1,300 8.8 (6.0 - 12.6)South kona 10,400 1,100 10.5 (7.2 - 15.0)North kona 24,200 2,200 9.0 (7.1 - 11.3)South kohala 11,300 1,600 14.2 (10.6 - 18.7)North kohala 4,900 1,000 20.4 (12.4 - 31.6)Hämakuä 7,500 600 8.3 (4.4 - 15.0)
Maui County 117,300 11,800 10.1 (9.0 - 11.3)Häna 1,800 NR NRMakawao 34,800 3,500 10.0 (8.1 - 12.3)Wailuku 56,600 5,100 9.0 (7.4 - 10.8)Lähainä 13,400 1,700 12.8 (10.0 - 16.2)Läna‘i 2,700 300 10.7 (6.4 - 17.4)Moloka‘i 6,800 800 11.8 (8.1 - 16.7)
Kaua‘i County 50,300 5,100 10.1 (8.4 - 12.1)Hanalei 6,700 1,000 15.5 (8.6 - 26.3)kapa‘a 14,400 1,700 11.9 (9.2 - 15.1)Lïhu‘e 10,500 800 7.4 (4.7 - 11.5)köloa 11,300 900 8.2 (6.1 - 10.9)Waimea 6,700 600 9.4 (7.5 - 14.8)
Source: State of Hawai‘i, Department of Health, Behavioral Risk Factor Surveillance System (BRFSS)
Notes: Number and rates were not reportable (NR) for areas with <50 respondents or the relative standard error was >30% per Hawai‘i BRFSS data suppression guidelines. No confidence intervals were included for areas with NR indicators.
Table 5-3: Adults Who are Heavy Drinkers, 2011-2014
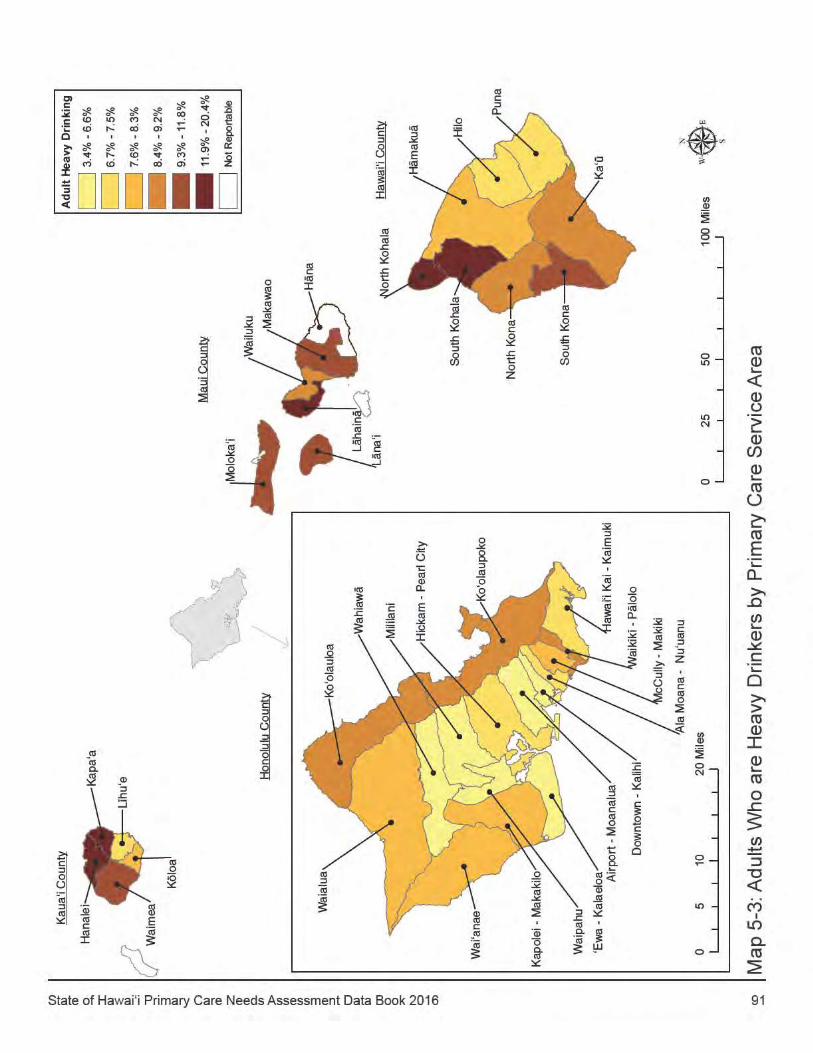
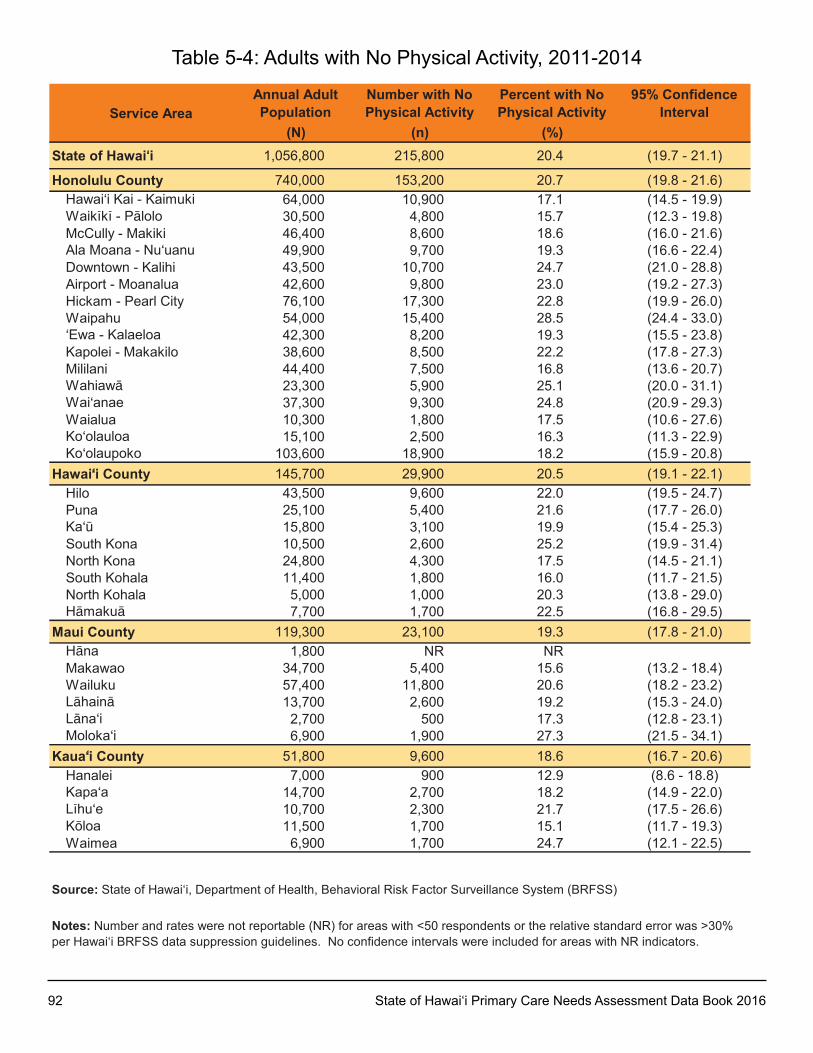
92 State of Hawai‘i Primary Care Needs Assessment Data Book 2016
Service AreaAnnual Adult Population
Number with No Physical Activity
Percent with No Physical Activity
95% Confidence Interval
(N) (n) (%)State of Hawai‘i 1,056,800 215,800 20.4 (19.7 - 21.1)
Honolulu County 740,000 153,200 20.7 (19.8 - 21.6)Hawai‘i kai - kaimuki 64,000 10,900 17.1 (14.5 - 19.9)Waikïkï - Pälolo 30,500 4,800 15.7 (12.3 - 19.8)McCully - Makiki 46,400 8,600 18.6 (16.0 - 21.6)Ala Moana - Nu‘uanu 49,900 9,700 19.3 (16.6 - 22.4)Downtown - kalihi 43,500 10,700 24.7 (21.0 - 28.8)Airport - Moanalua 42,600 9,800 23.0 (19.2 - 27.3)Hickam - Pearl City 76,100 17,300 22.8 (19.9 - 26.0)Waipahu 54,000 15,400 28.5 (24.4 - 33.0)‘Ewa - kalaeloa 42,300 8,200 19.3 (15.5 - 23.8)kapolei - Makakilo 38,600 8,500 22.2 (17.8 - 27.3)Mililani 44,400 7,500 16.8 (13.6 - 20.7)Wahiawä 23,300 5,900 25.1 (20.0 - 31.1)Wai‘anae 37,300 9,300 24.8 (20.9 - 29.3)Waialua 10,300 1,800 17.5 (10.6 - 27.6)ko‘olauloa 15,100 2,500 16.3 (11.3 - 22.9)ko‘olaupoko 103,600 18,900 18.2 (15.9 - 20.8)
Hawai‘i County 145,700 29,900 20.5 (19.1 - 22.1)Hilo 43,500 9,600 22.0 (19.5 - 24.7)Puna 25,100 5,400 21.6 (17.7 - 26.0)ka‘ü 15,800 3,100 19.9 (15.4 - 25.3)South kona 10,500 2,600 25.2 (19.9 - 31.4)North kona 24,800 4,300 17.5 (14.5 - 21.1)South kohala 11,400 1,800 16.0 (11.7 - 21.5)North kohala 5,000 1,000 20.3 (13.8 - 29.0)Hämakuä 7,700 1,700 22.5 (16.8 - 29.5)
Maui County 119,300 23,100 19.3 (17.8 - 21.0)Häna 1,800 NR NRMakawao 34,700 5,400 15.6 (13.2 - 18.4)Wailuku 57,400 11,800 20.6 (18.2 - 23.2)Lähainä 13,700 2,600 19.2 (15.3 - 24.0)Läna‘i 2,700 500 17.3 (12.8 - 23.1)Moloka‘i 6,900 1,900 27.3 (21.5 - 34.1)
Kaua‘i County 51,800 9,600 18.6 (16.7 - 20.6)Hanalei 7,000 900 12.9 (8.6 - 18.8)kapa‘a 14,700 2,700 18.2 (14.9 - 22.0)Lïhu‘e 10,700 2,300 21.7 (17.5 - 26.6)köloa 11,500 1,700 15.1 (11.7 - 19.3)Waimea 6,900 1,700 24.7 (12.1 - 22.5)
Source: State of Hawai‘i, Department of Health, Behavioral Risk Factor Surveillance System (BRFSS)
Notes: Number and rates were not reportable (NR) for areas with <50 respondents or the relative standard error was >30% per Hawai‘i BRFSS data suppression guidelines. No confidence intervals were included for areas with NR indicators.
Table 5-4: Adults with No Physical Activity, 2011-2014
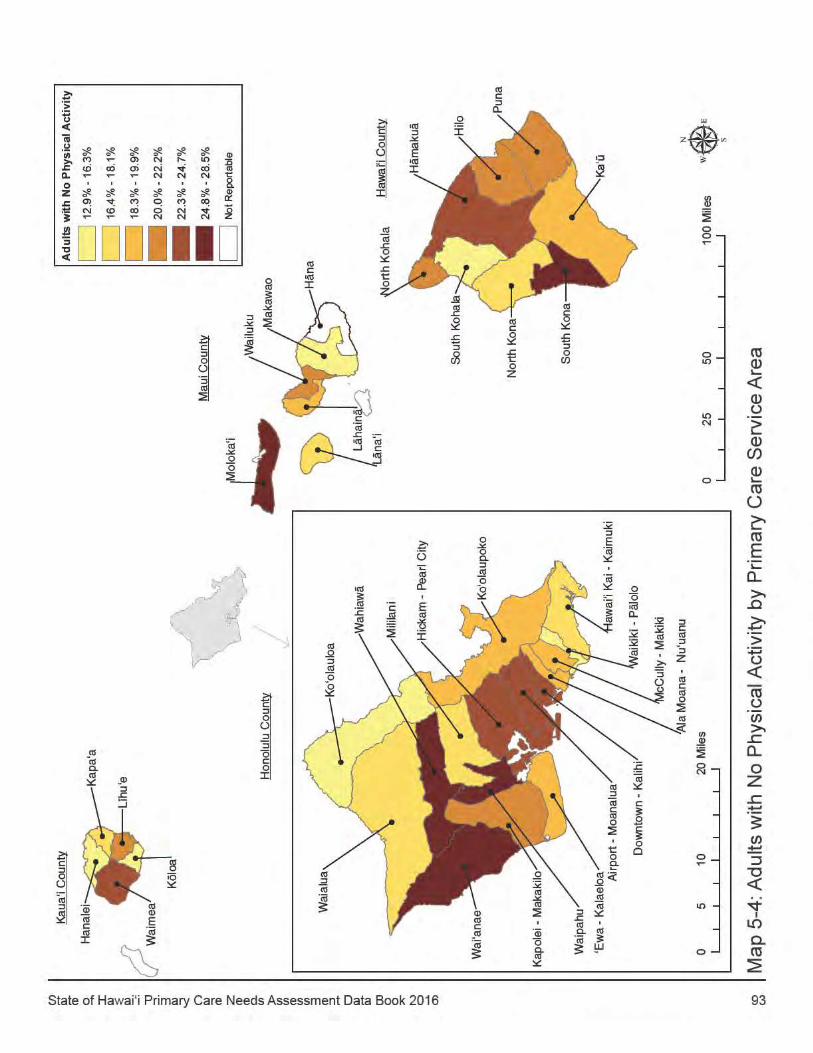
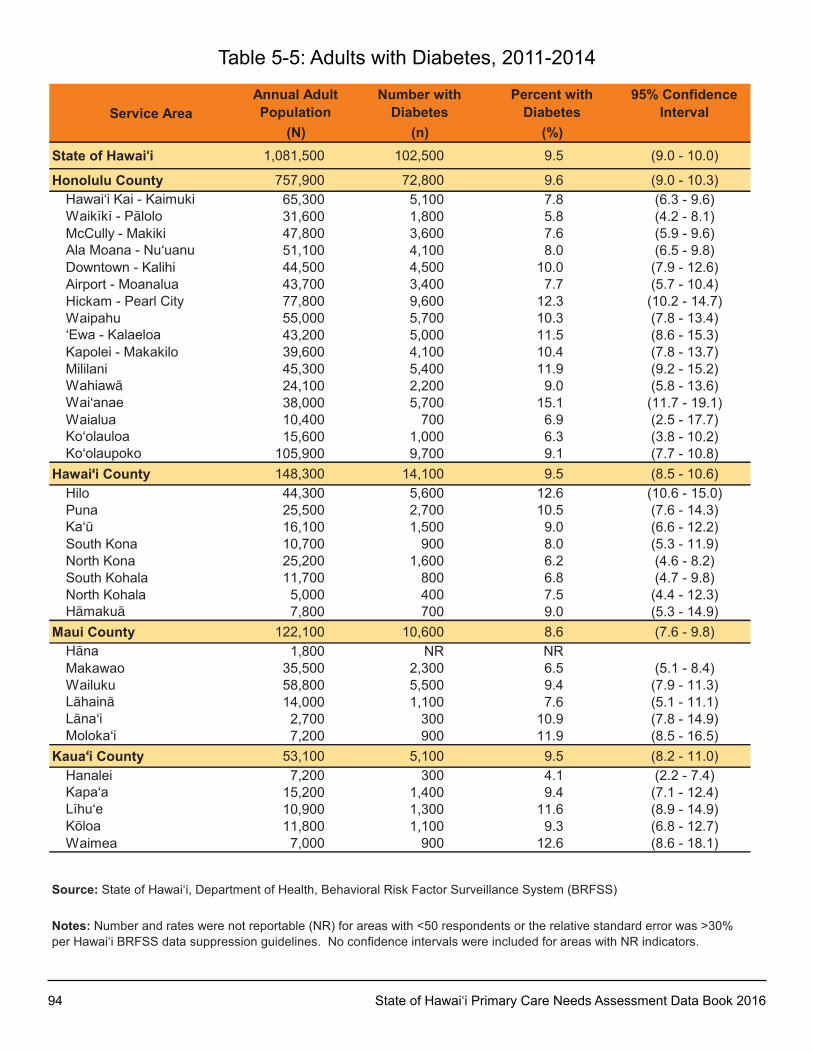
94 State of Hawai‘i Primary Care Needs Assessment Data Book 2016
Service AreaAnnual Adult Population
Number with Diabetes
Percent with Diabetes
95% Confidence Interval
(N) (n) (%)State of Hawai‘i 1,081,500 102,500 9.5 (9.0 - 10.0)
Honolulu County 757,900 72,800 9.6 (9.0 - 10.3)Hawai‘i kai - kaimuki 65,300 5,100 7.8 (6.3 - 9.6)Waikïkï - Pälolo 31,600 1,800 5.8 (4.2 - 8.1)McCully - Makiki 47,800 3,600 7.6 (5.9 - 9.6)Ala Moana - Nu‘uanu 51,100 4,100 8.0 (6.5 - 9.8)Downtown - kalihi 44,500 4,500 10.0 (7.9 - 12.6)Airport - Moanalua 43,700 3,400 7.7 (5.7 - 10.4)Hickam - Pearl City 77,800 9,600 12.3 (10.2 - 14.7)Waipahu 55,000 5,700 10.3 (7.8 - 13.4)‘Ewa - kalaeloa 43,200 5,000 11.5 (8.6 - 15.3)kapolei - Makakilo 39,600 4,100 10.4 (7.8 - 13.7)Mililani 45,300 5,400 11.9 (9.2 - 15.2)Wahiawä 24,100 2,200 9.0 (5.8 - 13.6)Wai‘anae 38,000 5,700 15.1 (11.7 - 19.1)Waialua 10,400 700 6.9 (2.5 - 17.7)ko‘olauloa 15,600 1,000 6.3 (3.8 - 10.2)ko‘olaupoko 105,900 9,700 9.1 (7.7 - 10.8)
Hawai‘i County 148,300 14,100 9.5 (8.5 - 10.6)Hilo 44,300 5,600 12.6 (10.6 - 15.0)Puna 25,500 2,700 10.5 (7.6 - 14.3)ka‘ü 16,100 1,500 9.0 (6.6 - 12.2)South kona 10,700 900 8.0 (5.3 - 11.9)North kona 25,200 1,600 6.2 (4.6 - 8.2)South kohala 11,700 800 6.8 (4.7 - 9.8)North kohala 5,000 400 7.5 (4.4 - 12.3)Hämakuä 7,800 700 9.0 (5.3 - 14.9)
Maui County 122,100 10,600 8.6 (7.6 - 9.8)Häna 1,800 NR NRMakawao 35,500 2,300 6.5 (5.1 - 8.4)Wailuku 58,800 5,500 9.4 (7.9 - 11.3)Lähainä 14,000 1,100 7.6 (5.1 - 11.1)Läna‘i 2,700 300 10.9 (7.8 - 14.9)Moloka‘i 7,200 900 11.9 (8.5 - 16.5)
Kaua‘i County 53,100 5,100 9.5 (8.2 - 11.0)Hanalei 7,200 300 4.1 (2.2 - 7.4)kapa‘a 15,200 1,400 9.4 (7.1 - 12.4)Lïhu‘e 10,900 1,300 11.6 (8.9 - 14.9)köloa 11,800 1,100 9.3 (6.8 - 12.7)Waimea 7,000 900 12.6 (8.6 - 18.1)
Source: State of Hawai‘i, Department of Health, Behavioral Risk Factor Surveillance System (BRFSS)
Notes: Number and rates were not reportable (NR) for areas with <50 respondents or the relative standard error was >30% per Hawai‘i BRFSS data suppression guidelines. No confidence intervals were included for areas with NR indicators.
Table 5-5: Adults with Diabetes, 2011-2014
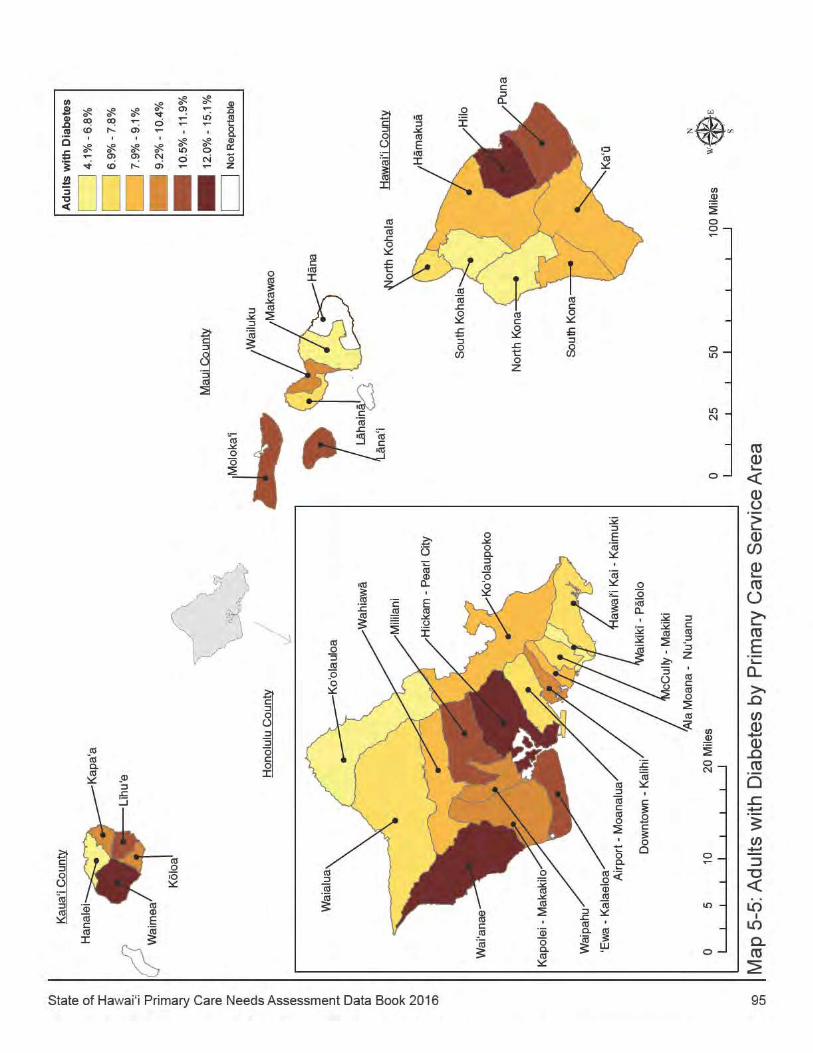

96 State of Hawai‘i Primary Care Needs Assessment Data Book 2016
Service AreaAnnual Adult Population
Number with High Blood Pressure
Percent with High Blood Pressure
95% Confidence Interval
(N) (n) (%)State of Hawai‘i 1,070,500 313,900 29.3 (28.3 - 30.4)
Honolulu County 749,900 223,100 29.8 (28.4 - 31.1)Hawai‘i kai - kaimuki 63,200 21,700 34.3 (30.1 - 38.9)Waikïkï - Pälolo 32,500 8,600 26.4 (21.2 - 32.4)McCully - Makiki 49,200 14,700 30.0 (25.6 - 34.7)Ala Moana - Nu‘uanu 48,400 14,800 30.6 (26.4 - 35.1)Downtown - kalihi 43,800 13,700 31.3 (26.1 - 37.0)Airport - Moanalua 47,300 13,500 28.6 (23.5 - 34.4)Hickam - Pearl City 76,800 26,900 35.0 (30.6 - 39.7)Waipahu 58,000 17,300 29.9 (24.6 - 35.8)‘Ewa - kalaeloa 40,900 12,500 30.6 (24.4 - 37.5)kapolei - Makakilo 42,100 10,300 24.5 (19.1 - 30.8)Mililani 45,600 10,500 22.9 (18.5 - 28.1)Wahiawä 24,200 8,100 33.5 (25.7 - 42.4)Wai‘anae 34,200 10,300 30.2 (24.3 - 36.7)Waialua 9,900 1,800 18.1 (10.7 - 28.8)ko‘olauloa 15,200 4,000 26.4 (17.5 - 37.8)ko‘olaupoko 107,900 32,700 30.3 (26.7 - 34.1)
Hawai‘i County 148,500 44,100 29.7 (27.5 - 32.0)Hilo 44,900 14,600 32.5 (28.7 - 36.5)Puna 25,500 8,400 32.8 (26.4 - 40.0)ka‘ü 16,600 4,900 29.4 (23.3 - 36.2)South kona 10,400 3,100 29.9 (22.4 - 38.6)North kona 25,600 6,500 25.5 (20.8 - 30.7)South kohala 12,400 2,900 23.3 (17.7 - 30.0)North kohala 5,100 1,200 24.2 (14.7 - 37.2)Hämakuä 7,000 2,400 33.7 (23.6 - 45.6)
Maui County 120,000 32,800 27.3 (25.2 - 29.6)Häna 1,700 NR NRMakawao 36,000 9,400 26.2 (22.4 - 30.4)Wailuku 57,700 16,100 27.8 (24.6 - 31.3)Lähainä 13,200 2,800 21.4 (15.9 - 28.2)Läna‘i 3,000 1,000 33.6 (26.5 - 41.5)Moloka‘i 7,400 2,900 38.6 (31.0 - 46.7)
Kaua‘i County 52,100 13,900 26.7 (23.9 - 29.8)Hanalei 7,400 1,300 18.3 (10.8 - 29.2)kapa‘a 14,900 3,700 24.6 (20.1 - 29.7)Lïhu‘e 10,500 3,000 28.9 (22.9 - 35.8)köloa 12,000 3,700 30.8 (24.7 - 37.7)Waimea 6,900 2,100 31.2 (22.7 - 41.2)
Source: State of Hawai‘i, Department of Health, Behavioral Risk Factor Surveillance System (BRFSS)
Notes: Number and rates were not reportable (NR) for areas with <50 respondents or the relative standard error was >30% per Hawai‘i BRFSS data suppression guidelines. No confidence intervals were included for areas with NR indicators.
Table 5-6: Adults with High Blood Pressure, 2011 and 2013
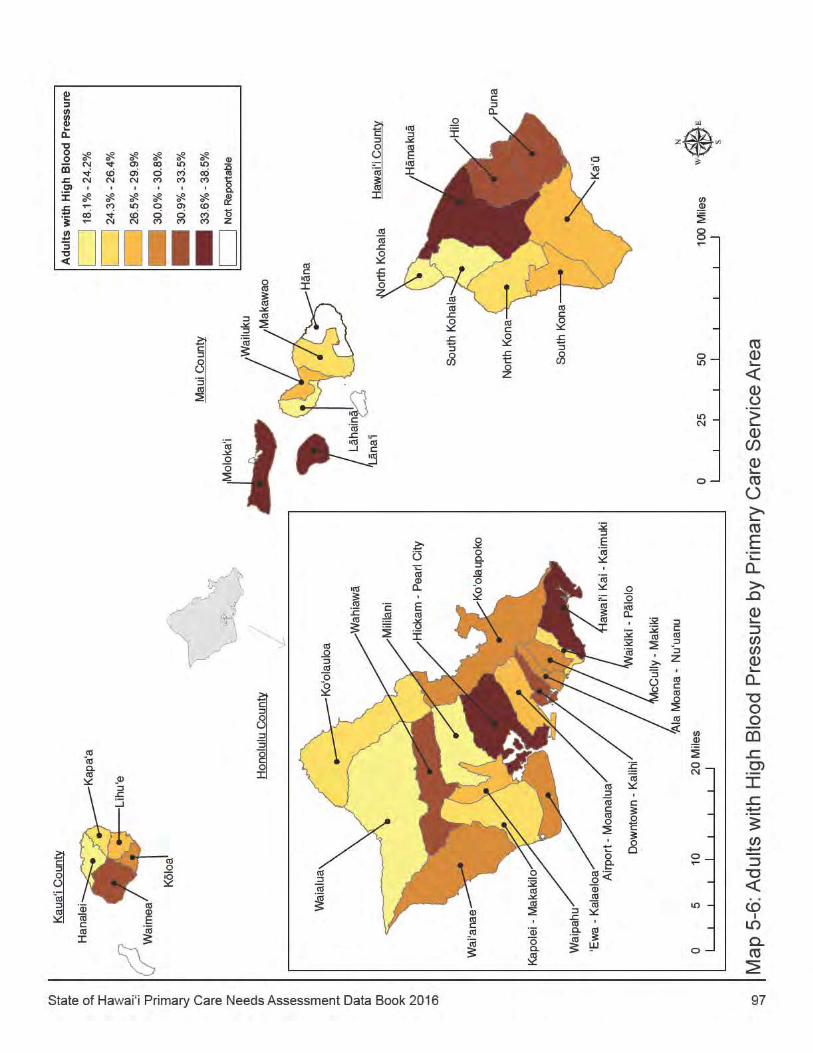

98 State of Hawai‘i Primary Care Needs Assessment Data Book 2016
CHAPTER 6: MORTALITY
This section of the Data Book focuses on the distribution of the overall death rate and the four leading causes of death (mortality) in the population. This revision of the Data Book has added the overall mortality rate. The International Statistical Classification of Diseases and Related Health Problems (most commonly known by the abbreviation ICD) provides codes to classify disease and a wide variety of signs, symptoms, abnormal findings, complaints, social circumstances and external causes of injury. Almost every health condition is assigned a unique category and given a code. The tenth version, or ICD 10, codes are used systematically in reporting statistics related to mortality by the National Centers for Health Statistics, the World Health Organization, and other entities. This Data Book highlights the four leading causes of death based on the underlying cause of death listed on the death certificate reported by the Office of Health Status and Monitoring of the Hawai‘i Department of Health. The total population for each primary care service area and county, based on the 2010 census, and all rates were adjusted to the reference 2000 U.S. standard population. The mortality indicators, using aggregated vital statistics data from 2008-2013, and population estimates from the u.S. Census Bureau are defined on the next page.
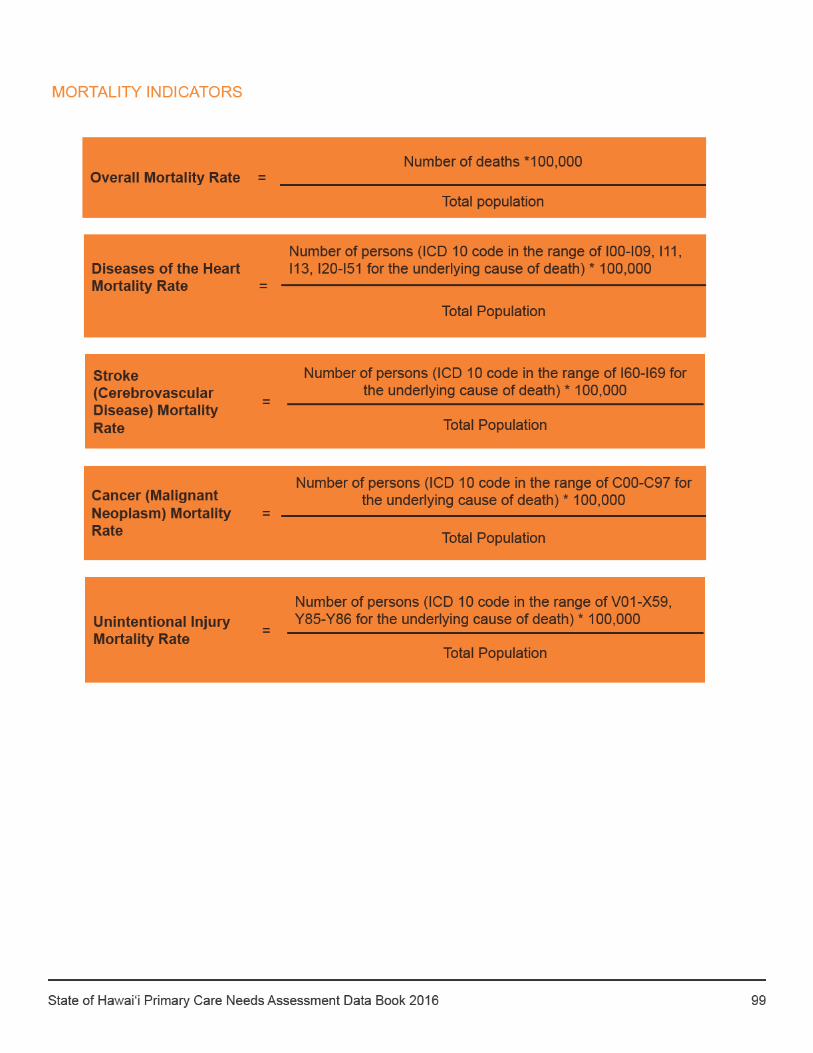
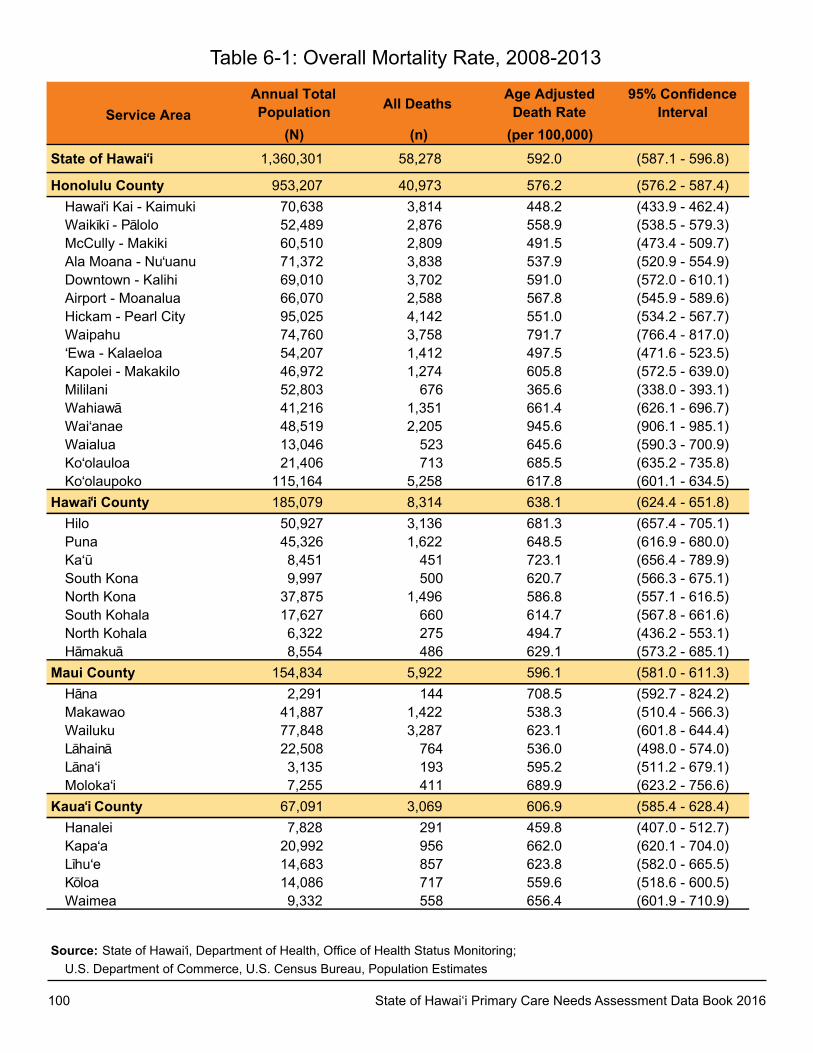
100 State of Hawai‘i Primary Care Needs Assessment Data Book 2016
Service AreaAnnual TotalPopulation All Deaths Age Adjusted
Death Rate95% Confidence
Interval(N) (n) (per 100,000)
State of Hawai‘i 1,360,301 58,278 592.0 (587.1 - 596.8)
Honolulu County 953,207 40,973 576.2 (576.2 - 587.4)Hawai‘i Kai - Kaimuki 70,638 3,814 448.2 (433.9 - 462.4)Waikïkï - Pälolo 52,489 2,876 558.9 (538.5 - 579.3)McCully - Makiki 60,510 2,809 491.5 (473.4 - 509.7)Ala Moana - Nu‘uanu 71,372 3,838 537.9 (520.9 - 554.9)Downtown - Kalihi 69,010 3,702 591.0 (572.0 - 610.1)Airport - Moanalua 66,070 2,588 567.8 (545.9 - 589.6)Hickam - Pearl City 95,025 4,142 551.0 (534.2 - 567.7)Waipahu 74,760 3,758 791.7 (766.4 - 817.0)‘Ewa - Kalaeloa 54,207 1,412 497.5 (471.6 - 523.5)Kapolei - Makakilo 46,972 1,274 605.8 (572.5 - 639.0)Mililani 52,803 676 365.6 (338.0 - 393.1)Wahiawä 41,216 1,351 661.4 (626.1 - 696.7)Wai‘anae 48,519 2,205 945.6 (906.1 - 985.1)Waialua 13,046 523 645.6 (590.3 - 700.9)Ko‘olauloa 21,406 713 685.5 (635.2 - 735.8)Ko‘olaupoko 115,164 5,258 617.8 (601.1 - 634.5)
Hawai‘i County 185,079 8,314 638.1 (624.4 - 651.8)Hilo 50,927 3,136 681.3 (657.4 - 705.1)Puna 45,326 1,622 648.5 (616.9 - 680.0)Ka‘ü 8,451 451 723.1 (656.4 - 789.9)South Kona 9,997 500 620.7 (566.3 - 675.1)North Kona 37,875 1,496 586.8 (557.1 - 616.5)South Kohala 17,627 660 614.7 (567.8 - 661.6)North Kohala 6,322 275 494.7 (436.2 - 553.1)Hämakuä 8,554 486 629.1 (573.2 - 685.1)
Maui County 154,834 5,922 596.1 (581.0 - 611.3)Häna 2,291 144 708.5 (592.7 - 824.2)Makawao 41,887 1,422 538.3 (510.4 - 566.3)Wailuku 77,848 3,287 623.1 (601.8 - 644.4)Lähainä 22,508 764 536.0 (498.0 - 574.0)Läna‘i 3,135 193 595.2 (511.2 - 679.1)Moloka‘i 7,255 411 689.9 (623.2 - 756.6)
Kaua‘i County 67,091 3,069 606.9 (585.4 - 628.4)Hanalei 7,828 291 459.8 (407.0 - 512.7)Kapa‘a 20,992 956 662.0 (620.1 - 704.0)Lïhu‘e 14,683 857 623.8 (582.0 - 665.5)Köloa 14,086 717 559.6 (518.6 - 600.5)Waimea 9,332 558 656.4 (601.9 - 710.9)
Source: State of Hawai‘i, Department of Health, Office of Health Status Monitoring;;U.S. Department of Commerce, U.S. Census Bureau, Population Estimates
Table 6-1: Overall Mortality Rate, 2008-2013
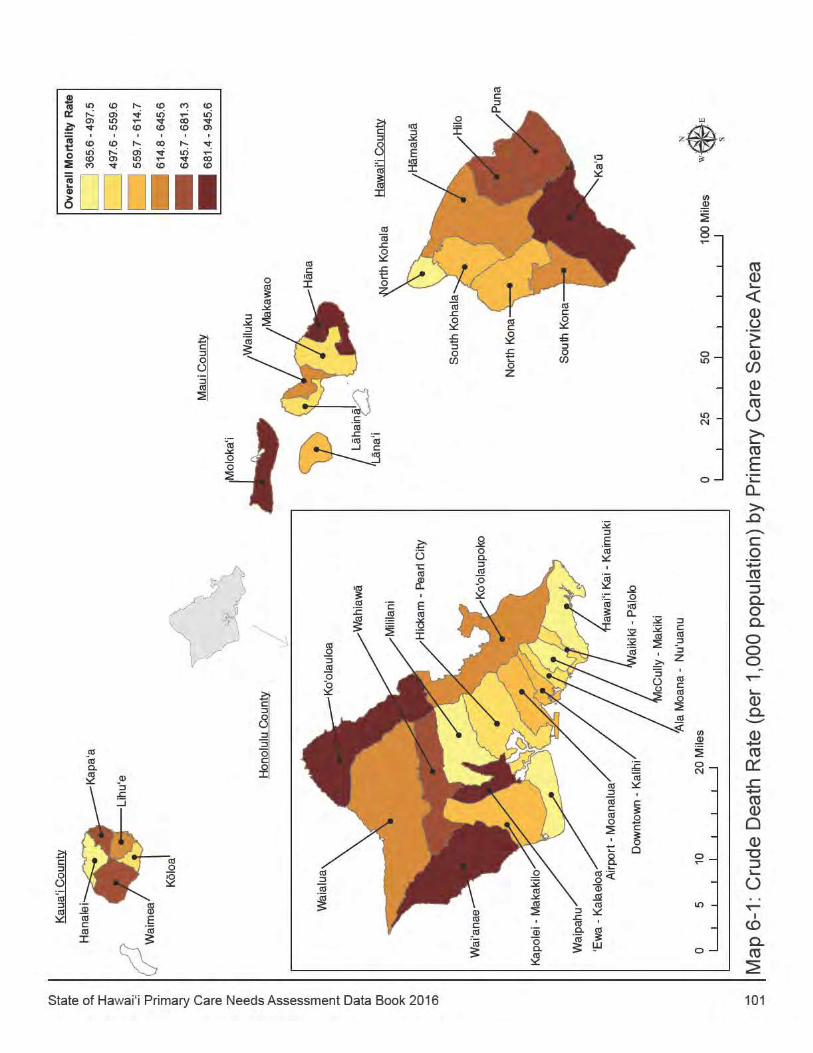
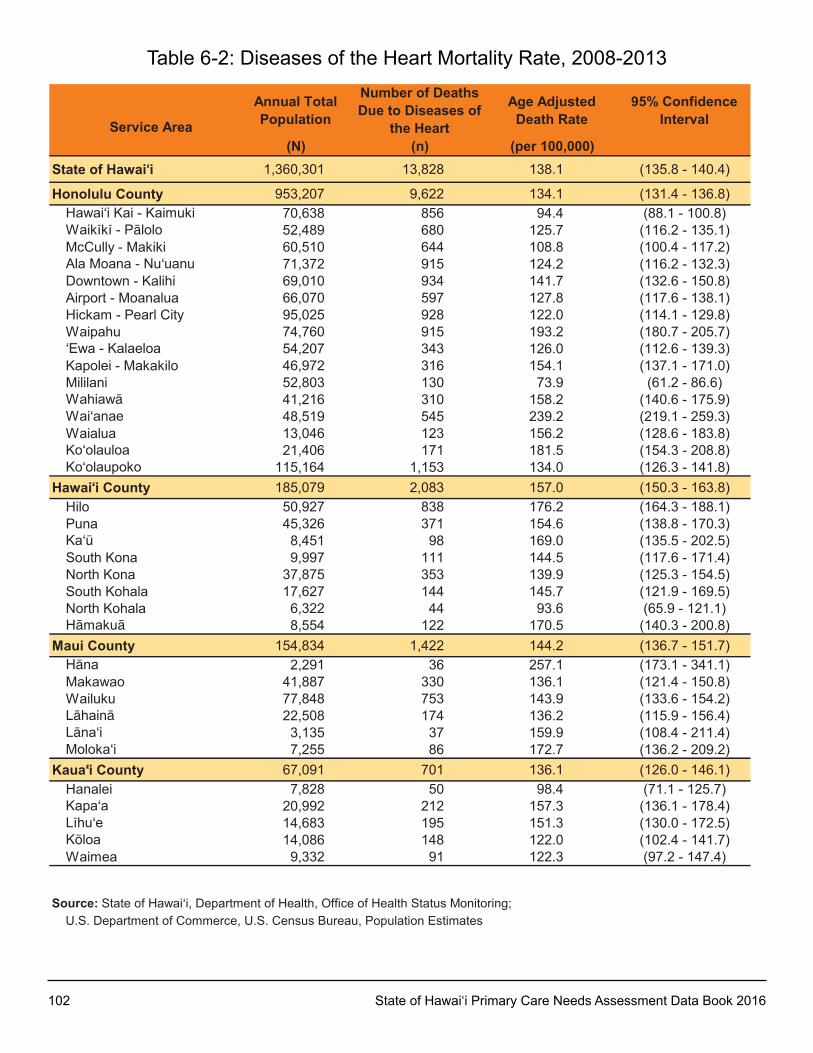
102 State of Hawai‘i Primary Care Needs Assessment Data Book 2016
Service Area
Annual Total Population
Number of Deaths Due to Diseases of
the Heart
Age Adjusted Death Rate
95% Confidence Interval
(N) (n) (per 100,000)State of Hawai‘i 1,360,301 13,828 138.1 (135.8 - 140.4)
Honolulu County 953,207 9,622 134.1 (131.4 - 136.8)Hawai‘i kai - kaimuki 70,638 856 94.4 (88.1 - 100.8)Waikïkï - Pälolo 52,489 680 125.7 (116.2 - 135.1)McCully - Makiki 60,510 644 108.8 (100.4 - 117.2)Ala Moana - Nu‘uanu 71,372 915 124.2 (116.2 - 132.3)Downtown - kalihi 69,010 934 141.7 (132.6 - 150.8)Airport - Moanalua 66,070 597 127.8 (117.6 - 138.1)Hickam - Pearl City 95,025 928 122.0 (114.1 - 129.8)Waipahu 74,760 915 193.2 (180.7 - 205.7)‘Ewa - kalaeloa 54,207 343 126.0 (112.6 - 139.3)kapolei - Makakilo 46,972 316 154.1 (137.1 - 171.0)Mililani 52,803 130 73.9 (61.2 - 86.6)Wahiawä 41,216 310 158.2 (140.6 - 175.9)Wai‘anae 48,519 545 239.2 (219.1 - 259.3)Waialua 13,046 123 156.2 (128.6 - 183.8)ko‘olauloa 21,406 171 181.5 (154.3 - 208.8)ko‘olaupoko 115,164 1,153 134.0 (126.3 - 141.8)
Hawai‘i County 185,079 2,083 157.0 (150.3 - 163.8)Hilo 50,927 838 176.2 (164.3 - 188.1)Puna 45,326 371 154.6 (138.8 - 170.3)ka‘ü 8,451 98 169.0 (135.5 - 202.5)South kona 9,997 111 144.5 (117.6 - 171.4)North kona 37,875 353 139.9 (125.3 - 154.5)South kohala 17,627 144 145.7 (121.9 - 169.5)North kohala 6,322 44 93.6 (65.9 - 121.1)Hämakuä 8,554 122 170.5 (140.3 - 200.8)
Maui County 154,834 1,422 144.2 (136.7 - 151.7)Häna 2,291 36 257.1 (173.1 - 341.1)Makawao 41,887 330 136.1 (121.4 - 150.8)Wailuku 77,848 753 143.9 (133.6 - 154.2)Lähainä 22,508 174 136.2 (115.9 - 156.4)Läna‘i 3,135 37 159.9 (108.4 - 211.4)Moloka‘i 7,255 86 172.7 (136.2 - 209.2)
Kaua‘i County 67,091 701 136.1 (126.0 - 146.1)Hanalei 7,828 50 98.4 (71.1 - 125.7)kapa‘a 20,992 212 157.3 (136.1 - 178.4)Lïhu‘e 14,683 195 151.3 (130.0 - 172.5)köloa 14,086 148 122.0 (102.4 - 141.7)Waimea 9,332 91 122.3 (97.2 - 147.4)
Source: State of Hawai‘i, Department of Health, Office of Health Status Monitoring;u.S. Department of Commerce, u.S. Census Bureau, Population Estimates
Table 6-2: Diseases of the Heart Mortality Rate, 2008-2013
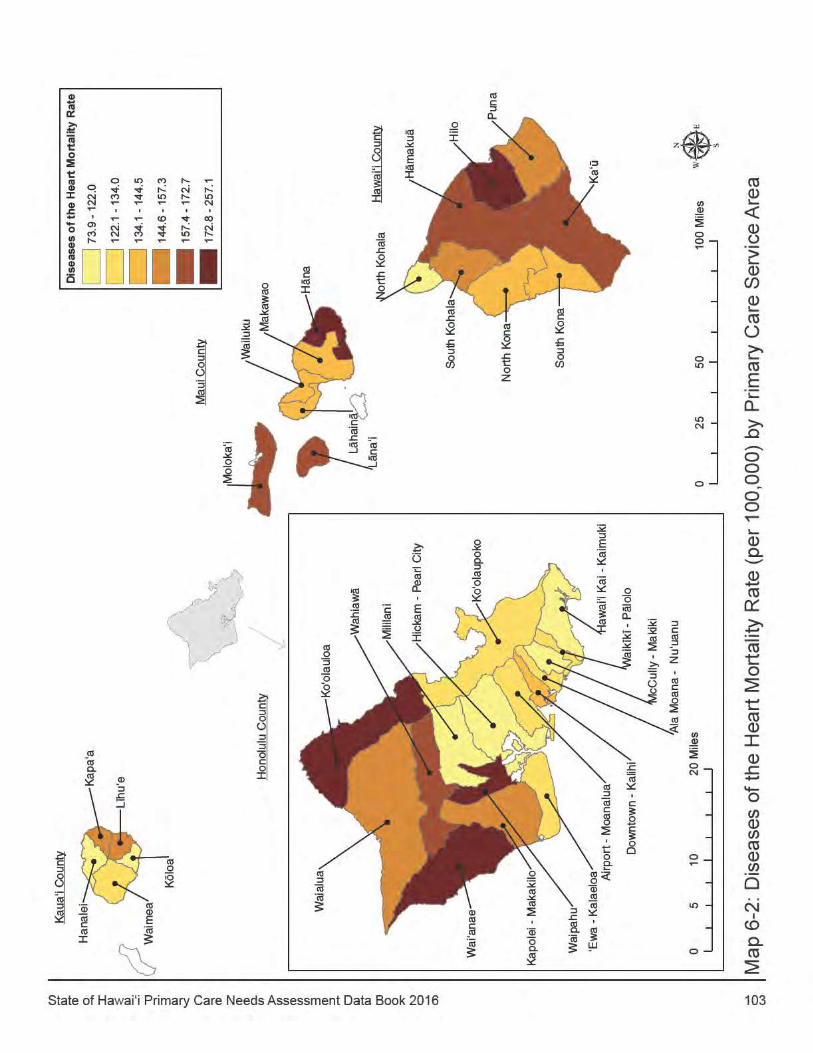

104 State of Hawai‘i Primary Care Needs Assessment Data Book 2016
Service AreaAnnual Total Population
Number of Cancer Deaths
Age Adjusted Death Rate
95% Confidence Interval
(N) (n) (per 100,000)State of Hawai‘i 1,360,301 13,309 137.5 (135.2 - 139.9)
Honolulu County 953,207 9,157 134.6 (131.9 - 137.4)Hawai‘i kai - kaimuki 70,638 861 114.0 (106.3 - 121.6)Waikïkï - Pälolo 52,489 591 126.8 (116.6 - 137.0)McCully - Makiki 60,510 554 108.4 (99.4 - 117.4)Ala Moana - Nu‘uanu 71,372 861 128.2 (119.6 - 136.7)Downtown - kalihi 69,010 749 129.6 (120.3 - 138.8)Airport - Moanalua 66,070 611 142.5 (131.2 - 153.8)Hickam - Pearl City 95,025 958 131.2 (122.9 - 139.5)Waipahu 74,760 825 173.8 (162.0 - 185.7)‘Ewa - kalaeloa 54,207 335 110.9 (99.0 - 122.7)kapolei - Makakilo 46,972 309 141.7 (125.9 - 157.5)Mililani 52,803 189 93.7 (80.3 - 107.0)Wahiawä 41,216 267 142.7 (125.6 - 159.8)Wai‘anae 48,519 500 209.8 (191.4 - 228.1)Waialua 13,046 113 156.2 (127.4 - 185.0)ko‘olauloa 21,406 165 160.1 (135.7 - 184.5)ko‘olaupoko 115,164 1,236 146.8 (138.6 - 154.9)
Hawai‘i County 185,079 1,997 148.5 (142.0 - 155.0)Hilo 50,927 635 146.8 (135.4 - 158.2)Puna 45,326 406 151.6 (136.8 - 166.3)ka‘ü 8,451 108 179.6 (145.7 - 213.4)South kona 9,997 127 163.9 (135.4 - 192.4)North kona 37,875 370 141.0 (126.6 - 155.4)South kohala 17,627 176 168.0 (143.2 - 192.8)North kohala 6,322 62 123.3 (92.6 - 153.9)Hämakuä 8,554 106 149.9 (121.4 - 178.4)
Maui County 154,834 1,430 139.6 (132.4 - 146.9)Häna 2,291 15 101.1Makawao 41,887 341 121.1 (108.2 - 133.9)Wailuku 77,848 762 149.0 (138.4 - 159.5)Lähainä 22,508 180 132.9 (113.5 - 152.3)Läna‘i 3,135 27 116.7 (72.7 - 160.8)Moloka‘i 7,255 94 174.0 (138.9 - 209.2)
Kaua‘i County 67,091 745 146.2 (135.7 - 156.7)Hanalei 7,828 56 105.6 (77.9 - 133.2)kapa‘a 20,992 215 156.0 (135.1 - 176.8)Lïhu‘e 14,683 173 142.7 (121.4 - 163.9)köloa 14,086 158 138.7 (117.1 - 160.4)Waimea 9,332 132 180.8 (150.0 - 211.7)
Source: State of Hawai‘i, Department of Health, Office of Health Status Monitoring;u.S. Department of Commerce, u.S. Census Bureau, Population Estimates
Notes: No confidence intervals were computed for number of events less than 20. Standardized ratios less than 200 implies that the rates were not significantly higher than those for the State of Hawai‘i. See Family Health Outcomes Project (FHOP), Guidelines for Using Federal Data Templates with Small Numbers (1997).
Table 6-3: Cancer (Malignant Neoplasm) Mortality Rate, 2008-2013
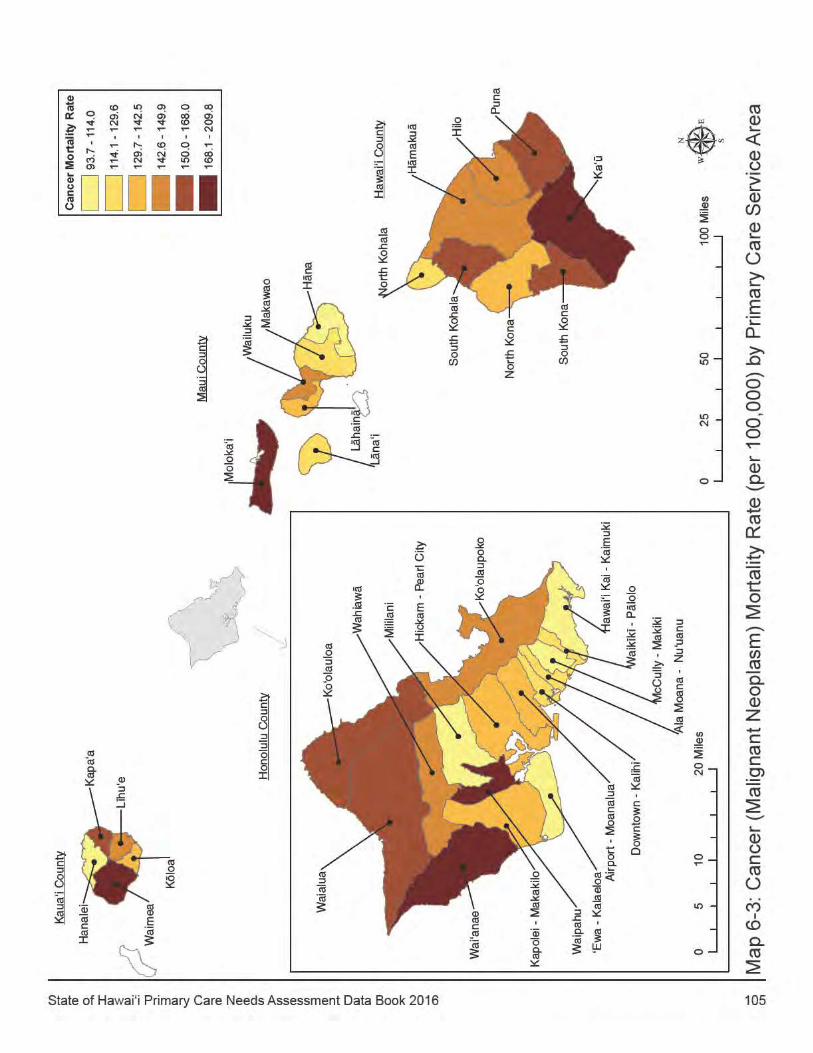
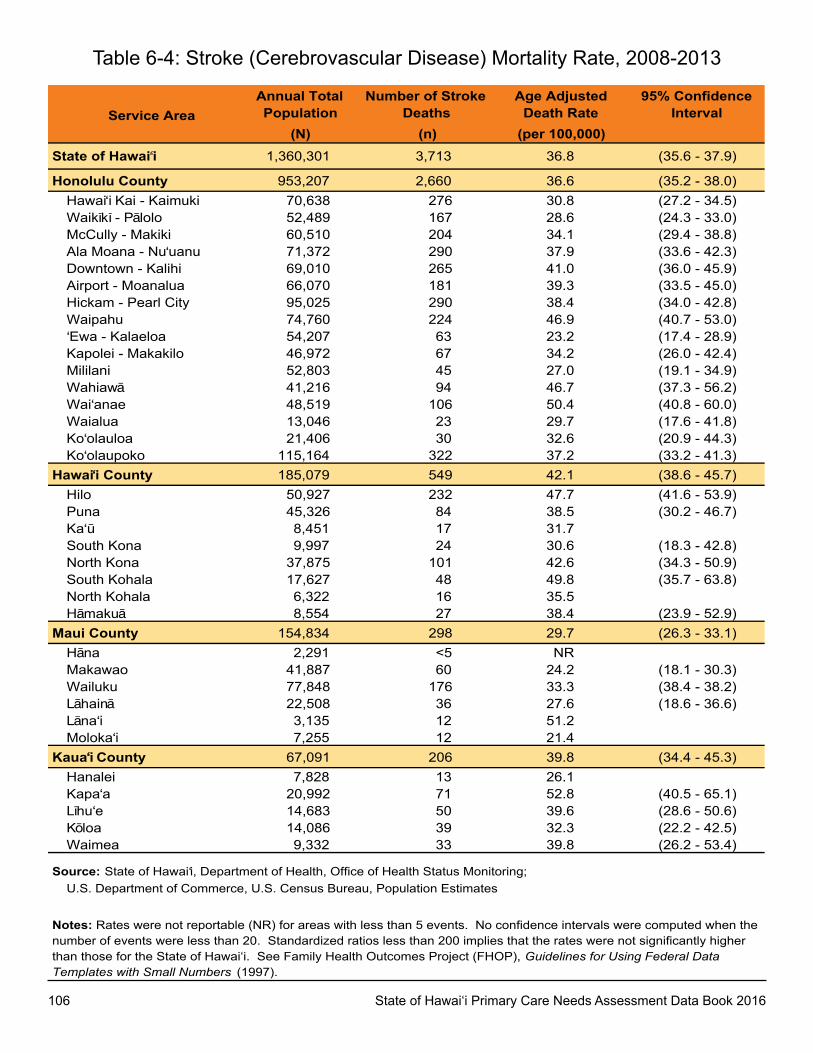
106 State of Hawai‘i Primary Care Needs Assessment Data Book 2016
Service AreaAnnual Total Population
Number of Stroke Deaths
Age Adjusted Death Rate
95% Confidence Interval
(N) (n) (per 100,000)State of Hawai i 1,360,301 3,713 36.8 (35.6 - 37.9)
Honolulu County 953,207 2,660 36.6 (35.2 - 38.0)Hawai‘i Kai - Kaimuki 70,638 276 30.8 (27.2 - 34.5)Waikïkï - Pälolo 52,489 167 28.6 (24.3 - 33.0)McCully - Makiki 60,510 204 34.1 (29.4 - 38.8)Ala Moana - Nu‘uanu 71,372 290 37.9 (33.6 - 42.3)Downtown - Kalihi 69,010 265 41.0 (36.0 - 45.9)Airport - Moanalua 66,070 181 39.3 (33.5 - 45.0)Hickam - Pearl City 95,025 290 38.4 (34.0 - 42.8)Waipahu 74,760 224 46.9 (40.7 - 53.0)‘Ewa - Kalaeloa 54,207 63 23.2 (17.4 - 28.9)Kapolei - Makakilo 46,972 67 34.2 (26.0 - 42.4)Mililani 52,803 45 27.0 (19.1 - 34.9)Wahiawä 41,216 94 46.7 (37.3 - 56.2)Wai‘anae 48,519 106 50.4 (40.8 - 60.0)Waialua 13,046 23 29.7 (17.6 - 41.8)Ko‘olauloa 21,406 30 32.6 (20.9 - 44.3)Ko‘olaupoko 115,164 322 37.2 (33.2 - 41.3)
Hawai‘i County 185,079 549 42.1 (38.6 - 45.7)Hilo 50,927 232 47.7 (41.6 - 53.9)Puna 45,326 84 38.5 (30.2 - 46.7)Ka‘ü 8,451 17 31.7South Kona 9,997 24 30.6 (18.3 - 42.8)North Kona 37,875 101 42.6 (34.3 - 50.9)South Kohala 17,627 48 49.8 (35.7 - 63.8)North Kohala 6,322 16 35.5Hämakuä 8,554 27 38.4 (23.9 - 52.9)
Maui County 154,834 298 29.7 (26.3 - 33.1)Häna 2,291 <5 NRMakawao 41,887 60 24.2 (18.1 - 30.3)Wailuku 77,848 176 33.3 (38.4 - 38.2)Lähainä 22,508 36 27.6 (18.6 - 36.6)Läna‘i 3,135 12 51.2Moloka‘i 7,255 12 21.4
Kaua‘i County 67,091 206 39.8 (34.4 - 45.3)Hanalei 7,828 13 26.1Kapa‘a 20,992 71 52.8 (40.5 - 65.1)Lïhu‘e 14,683 50 39.6 (28.6 - 50.6)Köloa 14,086 39 32.3 (22.2 - 42.5)Waimea 9,332 33 39.8 (26.2 - 53.4)
Source: State of Hawai‘i, Department of Health, Office of Health Status Monitoring;U.S. Department of Commerce, U.S. Census Bureau, Population Estimates
Notes: Rates were not reportable (NR) for areas with less than 5 events. No confidence intervals were computed when the number of events were less than 20. Standardized ratios less than 200 implies that the rates were not significantly higher than those for the State of Hawai‘i. See Family Health Outcomes Project (FHOP), Guidelines for Using Federal Data Templates with Small Numbers (1997).
Table 6-4: Stroke (Cerebrovascular Disease) Mortality Rate, 2008-2013
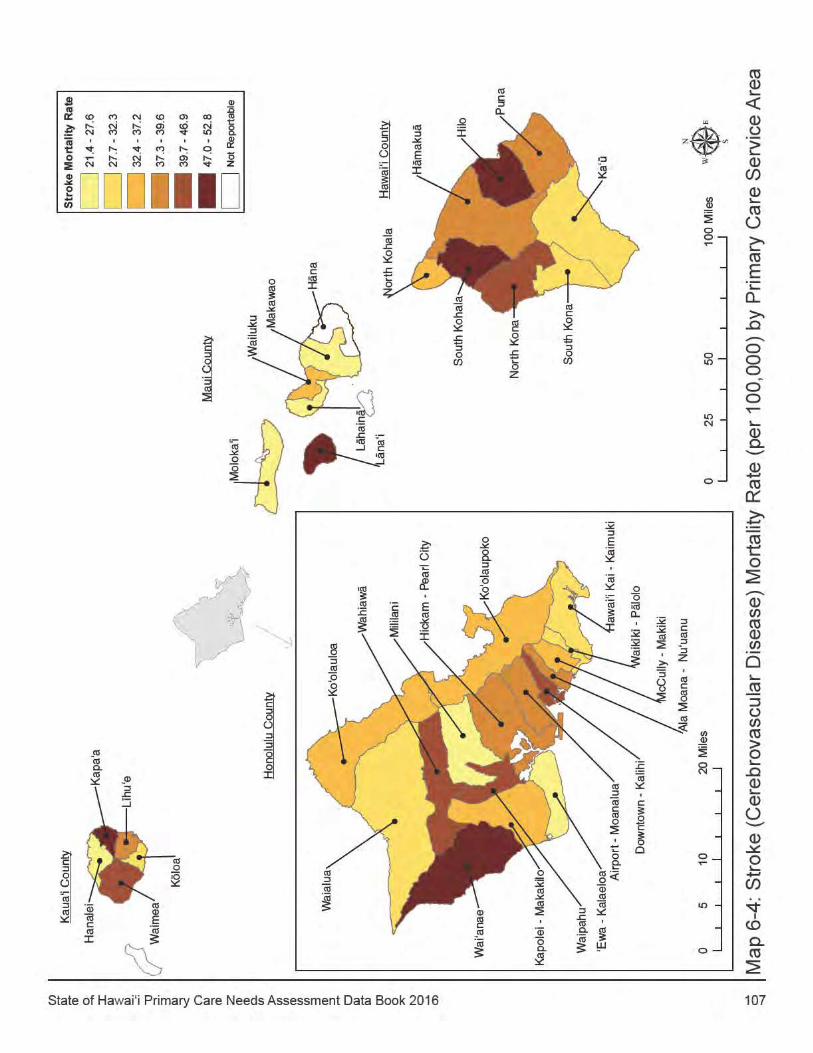
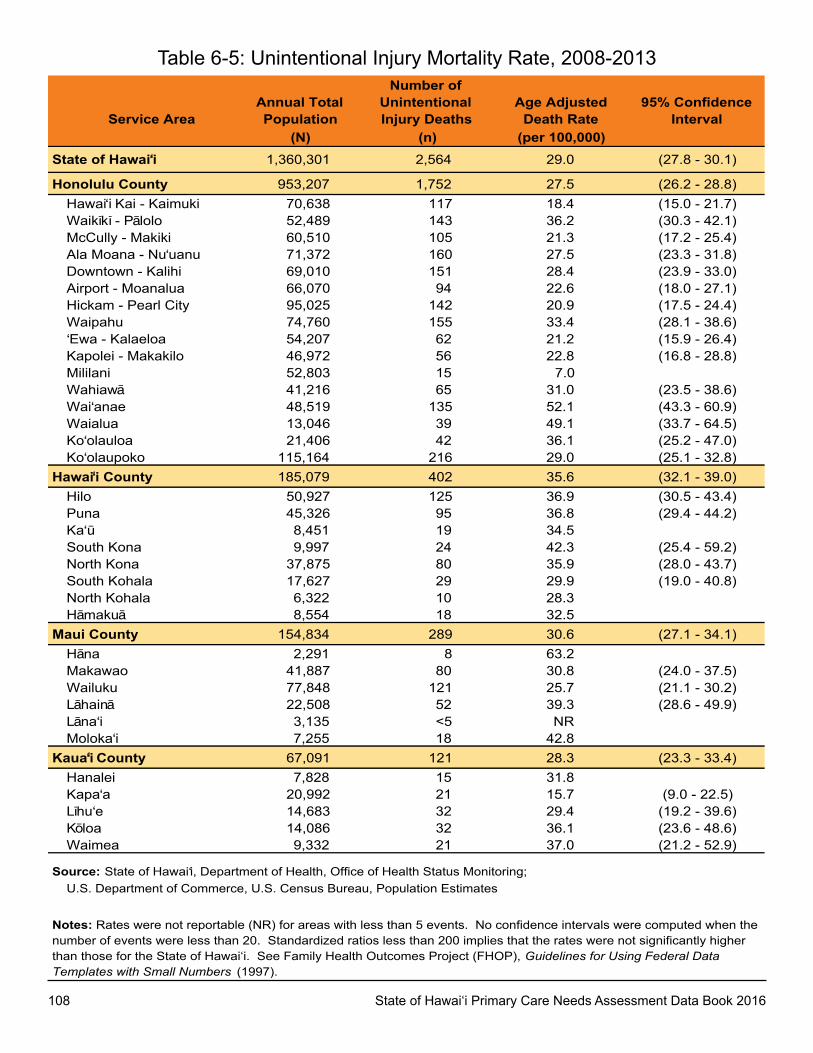
108 State of Hawai‘i Primary Care Needs Assessment Data Book 2016
Service AreaAnnual Total Population
Number of Unintentional Injury Deaths
Age Adjusted Death Rate
95% Confidence Interval
(N) (n) (per 100,000)State of Hawai‘i 1,360,301 2,564 29.0 (27.8 - 30.1)
Honolulu County 953,207 1,752 27.5 (26.2 - 28.8)Hawai‘i Kai - Kaimuki 70,638 117 18.4 (15.0 - 21.7)Waikïkï - Pälolo 52,489 143 36.2 (30.3 - 42.1)McCully - Makiki 60,510 105 21.3 (17.2 - 25.4)Ala Moana - Nu‘uanu 71,372 160 27.5 (23.3 - 31.8)Downtown - Kalihi 69,010 151 28.4 (23.9 - 33.0)Airport - Moanalua 66,070 94 22.6 (18.0 - 27.1)Hickam - Pearl City 95,025 142 20.9 (17.5 - 24.4)Waipahu 74,760 155 33.4 (28.1 - 38.6)‘Ewa - Kalaeloa 54,207 62 21.2 (15.9 - 26.4)Kapolei - Makakilo 46,972 56 22.8 (16.8 - 28.8)Mililani 52,803 15 7.0Wahiawä 41,216 65 31.0 (23.5 - 38.6)Wai‘anae 48,519 135 52.1 (43.3 - 60.9)Waialua 13,046 39 49.1 (33.7 - 64.5)Ko‘olauloa 21,406 42 36.1 (25.2 - 47.0)Ko‘olaupoko 115,164 216 29.0 (25.1 - 32.8)
Hawai‘i County 185,079 402 35.6 (32.1 - 39.0)Hilo 50,927 125 36.9 (30.5 - 43.4)Puna 45,326 95 36.8 (29.4 - 44.2)Ka‘ü 8,451 19 34.5South Kona 9,997 24 42.3 (25.4 - 59.2)North Kona 37,875 80 35.9 (28.0 - 43.7)South Kohala 17,627 29 29.9 (19.0 - 40.8)North Kohala 6,322 10 28.3Hämakuä 8,554 18 32.5
Maui County 154,834 289 30.6 (27.1 - 34.1)Häna 2,291 8 63.2Makawao 41,887 80 30.8 (24.0 - 37.5)Wailuku 77,848 121 25.7 (21.1 - 30.2)Lähainä 22,508 52 39.3 (28.6 - 49.9)Läna‘i 3,135 <5 NRMoloka‘i 7,255 18 42.8
Kaua‘i County 67,091 121 28.3 (23.3 - 33.4)Hanalei 7,828 15 31.8Kapa‘a 20,992 21 15.7 (9.0 - 22.5)Lïhu‘e 14,683 32 29.4 (19.2 - 39.6)Köloa 14,086 32 36.1 (23.6 - 48.6)Waimea 9,332 21 37.0 (21.2 - 52.9)
Source: State of Hawai‘i, Department of Health, Office of Health Status Monitoring;U.S. Department of Commerce, U.S. Census Bureau, Population Estimates
Notes: Rates were not reportable (NR) for areas with less than 5 events. No confidence intervals were computed when the number of events were less than 20. Standardized ratios less than 200 implies that the rates were not significantly higher than those for the State of Hawai‘i. See Family Health Outcomes Project (FHOP), Guidelines for Using Federal Data Templates with Small Numbers (1997).
Table 6-5: Unintentional Injury Mortality Rate, 2008-2013
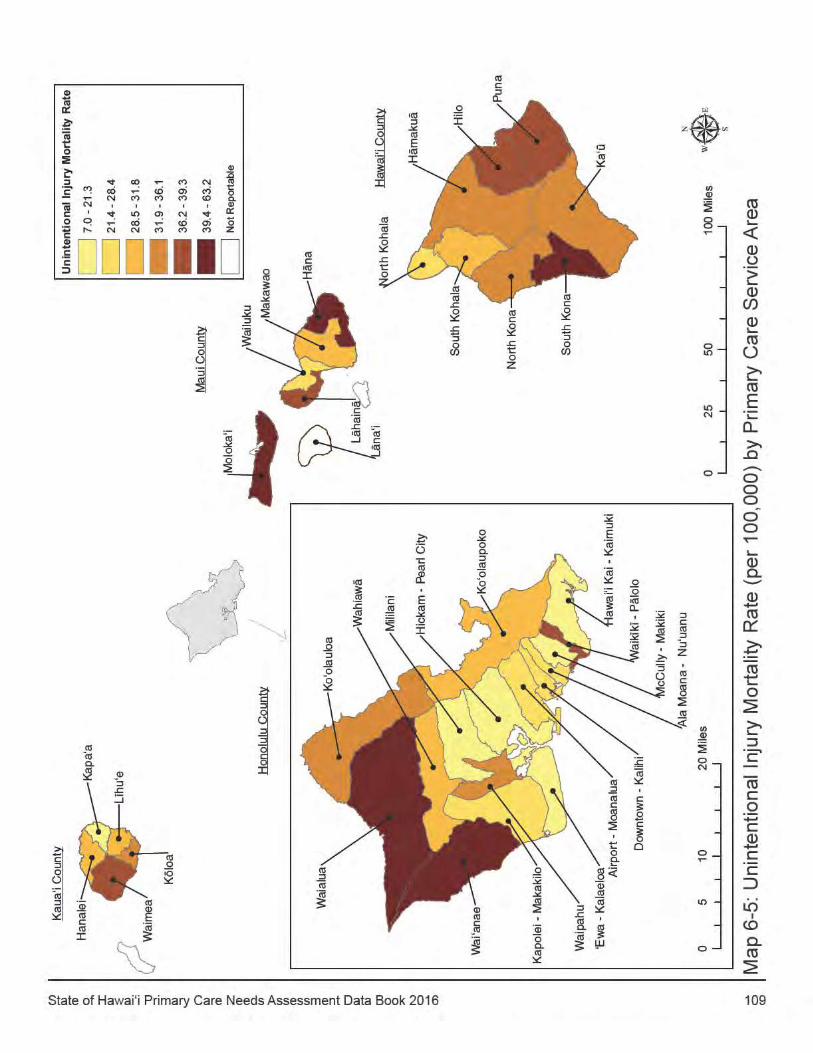
State of Hawai‘i Primary Care Needs Assessment Data Book 2016 110
CHAPTER 7: ORAL HEALTH
This section of the Data Book updates the indicators, based on the Behavioral Risk Factor Surveillance System (BRFSS) survey, for adult oral health that was first presented in the 2005 edition of the Data Book. Oral health is an essential and integral component of health throughout life. Poor oral health can result in significant illness, disease, and even death. Poor oral health is associated with increased health care costs, increased absenteeism, and decreased productivity. People who do not receive regular professional care can develop oral disease that requires complex restorative treatment, leads to tooth loss, and contributes to health problems. Routine dental visits provide an opportunity for early diagnosis, prevention, and treatment of oral disease. The adult oral health indicators use aggregated data from the 2012 and 2014 BRFSS are defined on the next page. Additionally, this Data Book has added a new indicator based on claims data from Emergency Department Visits for what are considered preventable oral health visits among all ages. A recent report using the same data source found that 10.6% of all emergency room visits for preventable oral health conditions in 2012 in Hawaii were among children under 18 years of age.1 Specific codes, based on consensus of national experts, of 521 (Diseases of hard tissues of teeth) and 522 (Diseases of pulp and periapical tissues) are used to assess visits that could have been prevented through access to outpatient dental care. 2 The Emergency Department Visit data comes from the Hawai‘i Health Information Corporation (HHIC) data from visits that occurred from 2010-2014.
1 Family Health Services Division, Hawaii Department of Health. Hawaii Oral Health: key Findings. August 2015. Available online at www.health.hawaii.gov/fhsd/publications.2 Pew Children’s Dental Campaign. A costly dental destination: Hospital Care Means States Pay Dearly. Pew Center on the States. Issue Brief.
February 2012. Available online at www.pewcenteonthestates.org/dental.
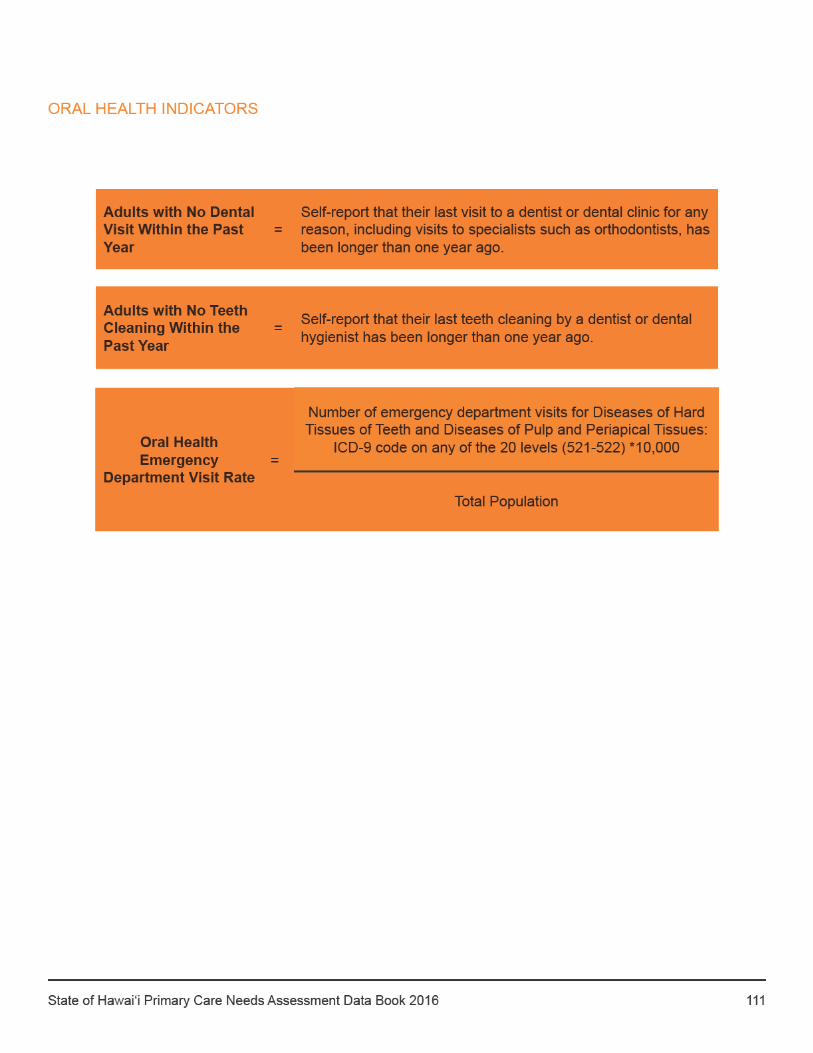
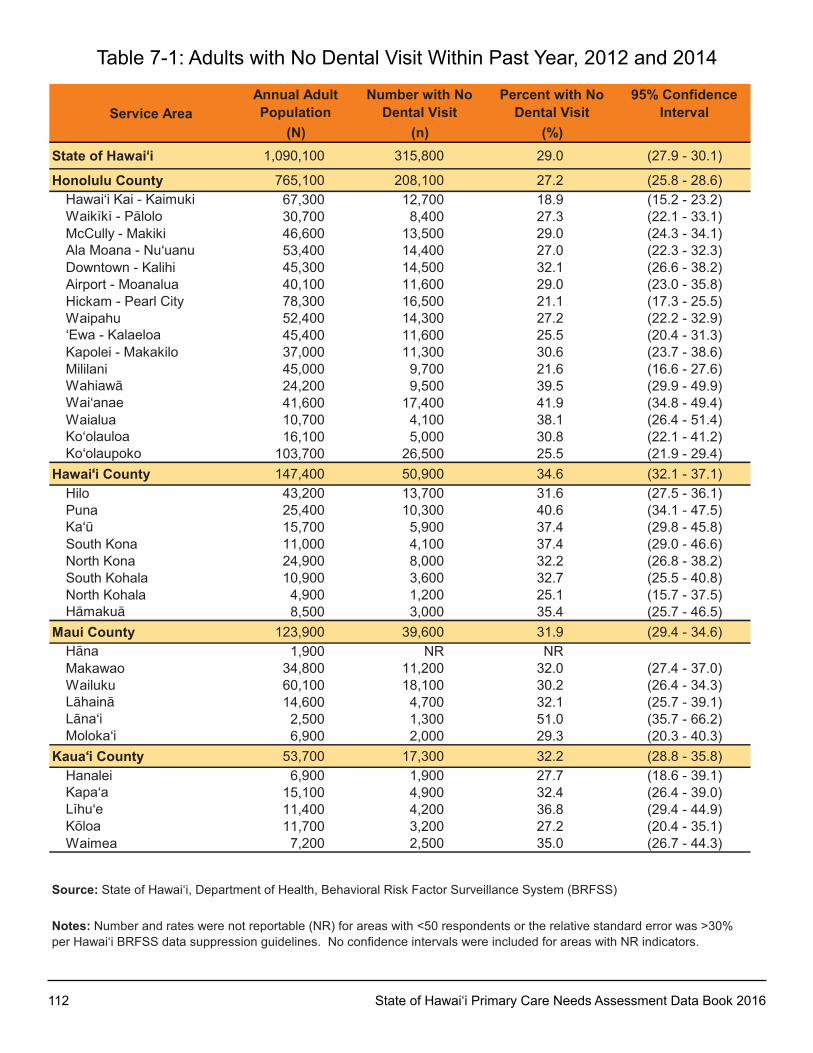
112 State of Hawai‘i Primary Care Needs Assessment Data Book 2016
Service AreaAnnual Adult Population
Number with No Dental Visit
Percent with No Dental Visit
95% Confidence Interval
(N) (n) (%)State of Hawai‘i 1,090,100 315,800 29.0 (27.9 - 30.1)
Honolulu County 765,100 208,100 27.2 (25.8 - 28.6)Hawai‘i kai - kaimuki 67,300 12,700 18.9 (15.2 - 23.2)Waikïkï - Pälolo 30,700 8,400 27.3 (22.1 - 33.1)McCully - Makiki 46,600 13,500 29.0 (24.3 - 34.1)Ala Moana - Nu‘uanu 53,400 14,400 27.0 (22.3 - 32.3)Downtown - kalihi 45,300 14,500 32.1 (26.6 - 38.2)Airport - Moanalua 40,100 11,600 29.0 (23.0 - 35.8)Hickam - Pearl City 78,300 16,500 21.1 (17.3 - 25.5)Waipahu 52,400 14,300 27.2 (22.2 - 32.9)‘Ewa - kalaeloa 45,400 11,600 25.5 (20.4 - 31.3)kapolei - Makakilo 37,000 11,300 30.6 (23.7 - 38.6)Mililani 45,000 9,700 21.6 (16.6 - 27.6)Wahiawä 24,200 9,500 39.5 (29.9 - 49.9)Wai‘anae 41,600 17,400 41.9 (34.8 - 49.4)Waialua 10,700 4,100 38.1 (26.4 - 51.4)ko‘olauloa 16,100 5,000 30.8 (22.1 - 41.2)ko‘olaupoko 103,700 26,500 25.5 (21.9 - 29.4)
Hawai‘i County 147,400 50,900 34.6 (32.1 - 37.1)Hilo 43,200 13,700 31.6 (27.5 - 36.1)Puna 25,400 10,300 40.6 (34.1 - 47.5)ka‘ü 15,700 5,900 37.4 (29.8 - 45.8)South kona 11,000 4,100 37.4 (29.0 - 46.6)North kona 24,900 8,000 32.2 (26.8 - 38.2)South kohala 10,900 3,600 32.7 (25.5 - 40.8)North kohala 4,900 1,200 25.1 (15.7 - 37.5)Hämakuä 8,500 3,000 35.4 (25.7 - 46.5)
Maui County 123,900 39,600 31.9 (29.4 - 34.6)Häna 1,900 NR NRMakawao 34,800 11,200 32.0 (27.4 - 37.0)Wailuku 60,100 18,100 30.2 (26.4 - 34.3)Lähainä 14,600 4,700 32.1 (25.7 - 39.1)Läna‘i 2,500 1,300 51.0 (35.7 - 66.2)Moloka‘i 6,900 2,000 29.3 (20.3 - 40.3)
Kaua‘i County 53,700 17,300 32.2 (28.8 - 35.8)Hanalei 6,900 1,900 27.7 (18.6 - 39.1)kapa‘a 15,100 4,900 32.4 (26.4 - 39.0)Lïhu‘e 11,400 4,200 36.8 (29.4 - 44.9)köloa 11,700 3,200 27.2 (20.4 - 35.1)Waimea 7,200 2,500 35.0 (26.7 - 44.3)
Source: State of Hawai‘i, Department of Health, Behavioral Risk Factor Surveillance System (BRFSS)
Notes: Number and rates were not reportable (NR) for areas with <50 respondents or the relative standard error was >30% per Hawai‘i BRFSS data suppression guidelines. No confidence intervals were included for areas with NR indicators.
Table 7-1: Adults with No Dental Visit Within Past Year, 2012 and 2014
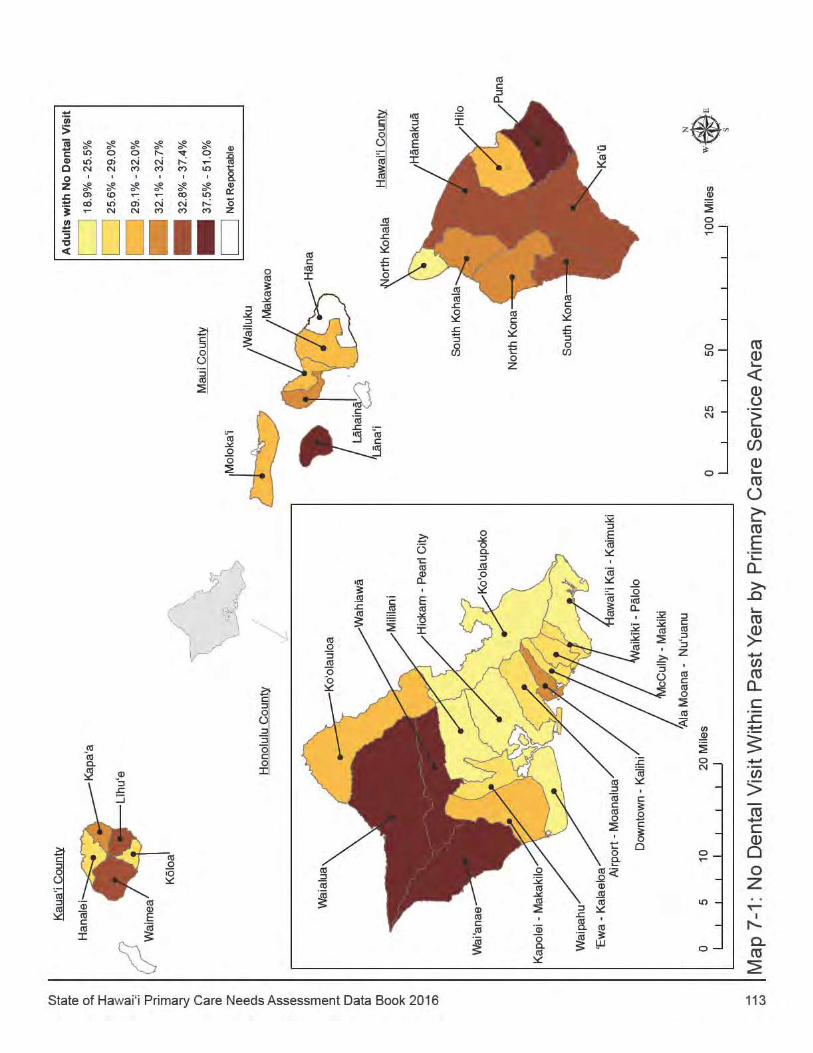
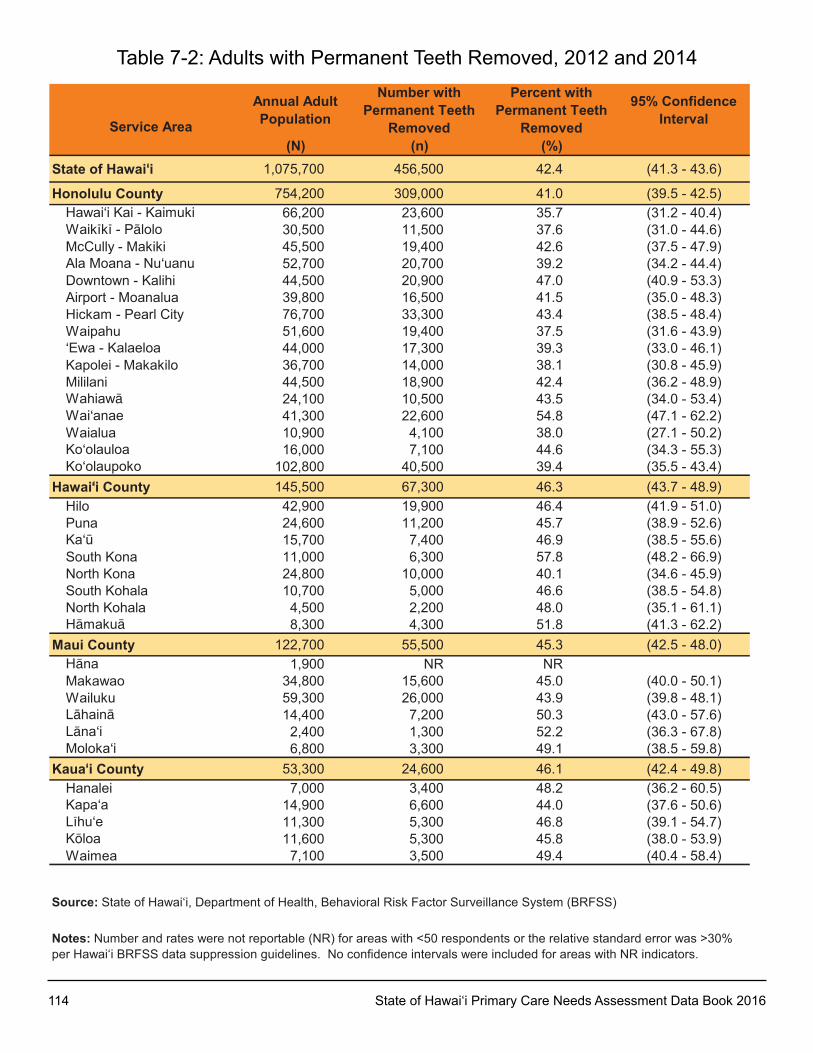
114 State of Hawai‘i Primary Care Needs Assessment Data Book 2016
Service Area
Annual Adult Population
Number with Permanent Teeth
Removed
Percent with Permanent Teeth
Removed
95% Confidence Interval
(N) (n) (%)State of Hawai‘i 1,075,700 456,500 42.4 (41.3 - 43.6)
Honolulu County 754,200 309,000 41.0 (39.5 - 42.5)Hawai‘i kai - kaimuki 66,200 23,600 35.7 (31.2 - 40.4)Waikïkï - Pälolo 30,500 11,500 37.6 (31.0 - 44.6)McCully - Makiki 45,500 19,400 42.6 (37.5 - 47.9)Ala Moana - Nu‘uanu 52,700 20,700 39.2 (34.2 - 44.4)Downtown - kalihi 44,500 20,900 47.0 (40.9 - 53.3)Airport - Moanalua 39,800 16,500 41.5 (35.0 - 48.3)Hickam - Pearl City 76,700 33,300 43.4 (38.5 - 48.4)Waipahu 51,600 19,400 37.5 (31.6 - 43.9)‘Ewa - kalaeloa 44,000 17,300 39.3 (33.0 - 46.1)kapolei - Makakilo 36,700 14,000 38.1 (30.8 - 45.9)Mililani 44,500 18,900 42.4 (36.2 - 48.9)Wahiawä 24,100 10,500 43.5 (34.0 - 53.4)Wai‘anae 41,300 22,600 54.8 (47.1 - 62.2)Waialua 10,900 4,100 38.0 (27.1 - 50.2)ko‘olauloa 16,000 7,100 44.6 (34.3 - 55.3)ko‘olaupoko 102,800 40,500 39.4 (35.5 - 43.4)
Hawai‘i County 145,500 67,300 46.3 (43.7 - 48.9)Hilo 42,900 19,900 46.4 (41.9 - 51.0)Puna 24,600 11,200 45.7 (38.9 - 52.6)ka‘ü 15,700 7,400 46.9 (38.5 - 55.6)South kona 11,000 6,300 57.8 (48.2 - 66.9)North kona 24,800 10,000 40.1 (34.6 - 45.9)South kohala 10,700 5,000 46.6 (38.5 - 54.8)North kohala 4,500 2,200 48.0 (35.1 - 61.1)Hämakuä 8,300 4,300 51.8 (41.3 - 62.2)
Maui County 122,700 55,500 45.3 (42.5 - 48.0)Häna 1,900 NR NRMakawao 34,800 15,600 45.0 (40.0 - 50.1)Wailuku 59,300 26,000 43.9 (39.8 - 48.1)Lähainä 14,400 7,200 50.3 (43.0 - 57.6)Läna‘i 2,400 1,300 52.2 (36.3 - 67.8)Moloka‘i 6,800 3,300 49.1 (38.5 - 59.8)
Kaua‘i County 53,300 24,600 46.1 (42.4 - 49.8)Hanalei 7,000 3,400 48.2 (36.2 - 60.5)kapa‘a 14,900 6,600 44.0 (37.6 - 50.6)Lïhu‘e 11,300 5,300 46.8 (39.1 - 54.7)köloa 11,600 5,300 45.8 (38.0 - 53.9)Waimea 7,100 3,500 49.4 (40.4 - 58.4)
Source: State of Hawai‘i, Department of Health, Behavioral Risk Factor Surveillance System (BRFSS)
Notes: Number and rates were not reportable (NR) for areas with <50 respondents or the relative standard error was >30% per Hawai‘i BRFSS data suppression guidelines. No confidence intervals were included for areas with NR indicators.
Table 7-2: Adults with Permanent Teeth Removed, 2012 and 2014
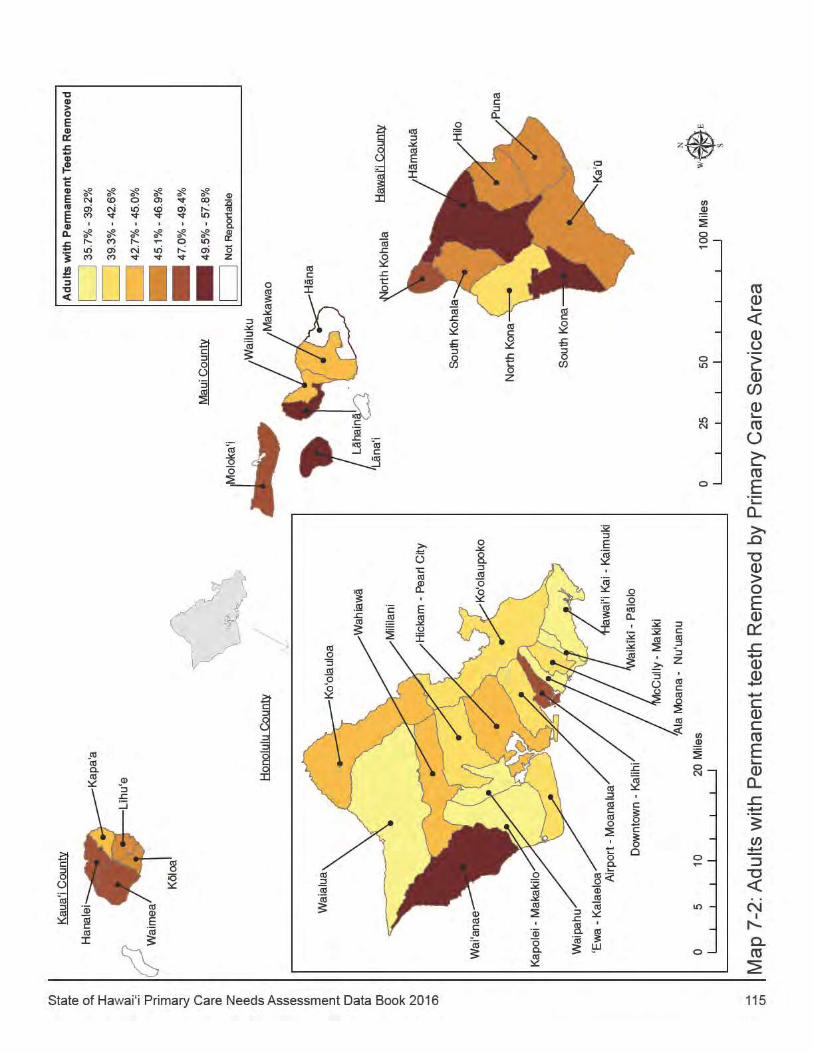
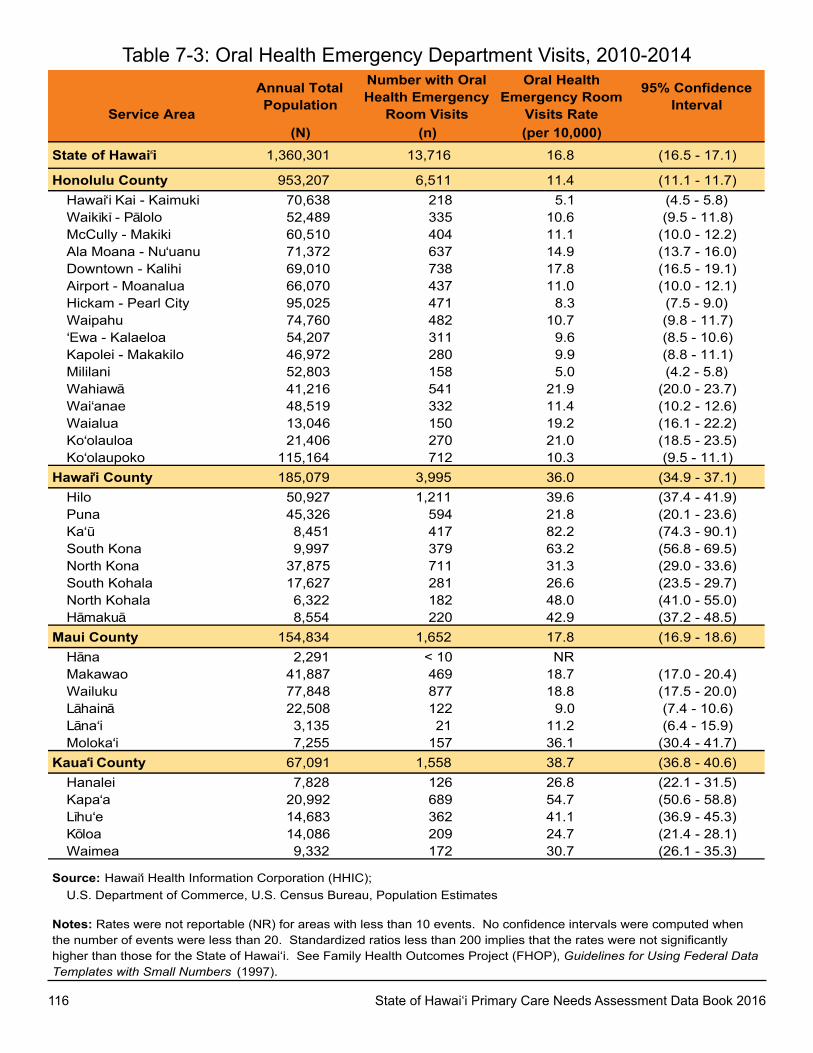
116 State of Hawai‘i Primary Care Needs Assessment Data Book 2016
Service Area
Annual TotalPopulation
Number with OralHealth Emergency
Room Visits
Oral HealthEmergency Room
Visits Rate
95% ConfidenceInterval
(N) (n) (per 10,000)State of Hawai i 1,360,301 13,716 16.8 (16.5 - 17.1)
Honolulu County 953,207 6,511 11.4 (11.1 - 11.7)Hawai‘i Kai - Kaimuki 70,638 218 5.1 (4.5 - 5.8)Waikïkï - Pälolo 52,489 335 10.6 (9.5 - 11.8)McCully - Makiki 60,510 404 11.1 (10.0 - 12.2)Ala Moana - Nu‘uanu 71,372 637 14.9 (13.7 - 16.0)Downtown - Kalihi 69,010 738 17.8 (16.5 - 19.1)Airport - Moanalua 66,070 437 11.0 (10.0 - 12.1)Hickam - Pearl City 95,025 471 8.3 (7.5 - 9.0)Waipahu 74,760 482 10.7 (9.8 - 11.7)‘Ewa - Kalaeloa 54,207 311 9.6 (8.5 - 10.6)Kapolei - Makakilo 46,972 280 9.9 (8.8 - 11.1)Mililani 52,803 158 5.0 (4.2 - 5.8)Wahiawä 41,216 541 21.9 (20.0 - 23.7)Wai‘anae 48,519 332 11.4 (10.2 - 12.6)Waialua 13,046 150 19.2 (16.1 - 22.2)Ko‘olauloa 21,406 270 21.0 (18.5 - 23.5)Ko‘olaupoko 115,164 712 10.3 (9.5 - 11.1)
Hawai‘i County 185,079 3,995 36.0 (34.9 - 37.1)Hilo 50,927 1,211 39.6 (37.4 - 41.9)Puna 45,326 594 21.8 (20.1 - 23.6)Ka‘ü 8,451 417 82.2 (74.3 - 90.1)South Kona 9,997 379 63.2 (56.8 - 69.5)North Kona 37,875 711 31.3 (29.0 - 33.6)South Kohala 17,627 281 26.6 (23.5 - 29.7)North Kohala 6,322 182 48.0 (41.0 - 55.0)Hämakuä 8,554 220 42.9 (37.2 - 48.5)
Maui County 154,834 1,652 17.8 (16.9 - 18.6)Häna 2,291 < 10 NRMakawao 41,887 469 18.7 (17.0 - 20.4)Wailuku 77,848 877 18.8 (17.5 - 20.0)Lähainä 22,508 122 9.0 (7.4 - 10.6)Läna‘i 3,135 21 11.2 (6.4 - 15.9)Moloka‘i 7,255 157 36.1 (30.4 - 41.7)
Kaua‘i County 67,091 1,558 38.7 (36.8 - 40.6)Hanalei 7,828 126 26.8 (22.1 - 31.5)Kapa‘a 20,992 689 54.7 (50.6 - 58.8)Lïhu‘e 14,683 362 41.1 (36.9 - 45.3)Köloa 14,086 209 24.7 (21.4 - 28.1)Waimea 9,332 172 30.7 (26.1 - 35.3)
Source: Hawai‘i Health Information Corporation (HHIC);;U.S. Department of Commerce, U.S. Census Bureau, Population Estimates
Notes: Rates were not reportable (NR) for areas with less than 10 events. No confidence intervals were computed whenthe number of events were less than 20. Standardized ratios less than 200 implies that the rates were not significantlyhigher than those for the State of Hawai‘i. See Family Health Outcomes Project (FHOP), Guidelines for Using Federal DataTemplates with Small Numbers (1997).
Table 7-3: Oral Health Emergency Department Visits, 2010-2014
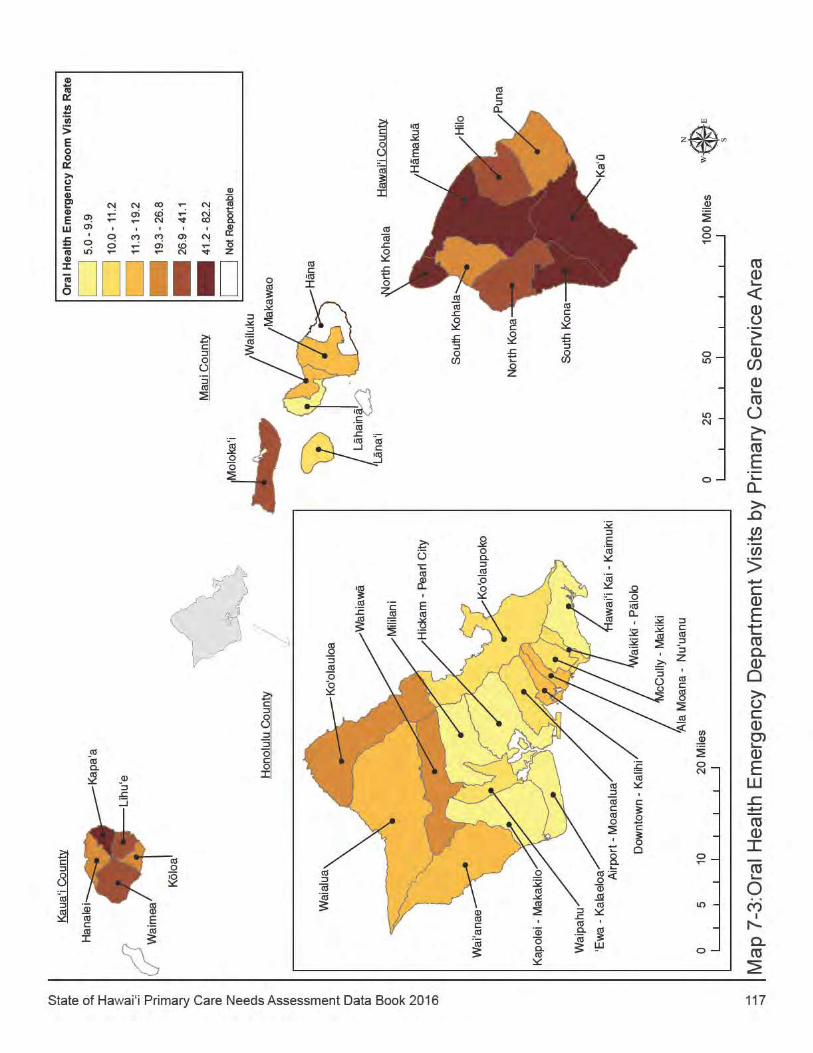
State of Hawai‘i Primary Care Needs Assessment Data Book 2016 118
CHAPTER 8: MENTAL HEALTH & SuBSTANCE RELATED ADMISSIONS
This section of the Data Book introduces indicators related to mental health and substance abuse. Substance use and mental health may contribute to high risk behaviors, worsen existing disease, and result in admissions to hospitals. The burden of mental illness in the united States is among the highest of all diseases, and mental disorders are among the most common causes of disability. Mental health is essential to a person’s well-being, healthy family and interpersonal relationships, and the ability to live a full and productive life. Mental health disorders can have harmful and long-lasting effects—including high psychosocial and economic costs—not only for people living with the disorder, but also for their families, schools, workplaces, and communities. Early diagnosis and treatment can decrease the disease burden of mental health disorders as well as associated chronic diseases.1 In general substance use also has a major impact on individuals, families, and communities. The effects of substance abuse are cumulative, significantly contributing to costly social, physical, mental, and public health problems. These problems include: teenage pregnancy, human immunodeficiency virus/acquired immunodeficiency syndrome (HIV/AIDS), other sexually transmitted diseases (STDs), domestic violence, child abuse, motor vehicle crashes, physical fights, crime, homicide, suicide, and chronic diseases.2
The hospital admissions presented includes anyone, regardless of age, in which a mental illness or a substance abuse diagnosis was coded as a primary or secondary diagnoses on any of the up to 20 levels of diagnostic codes reported by the hospitals for each admission is presented. The same hospital admission could occur in multiple indicators in this report if that particular admission had ICD codes from more than one of the disorders listed. The categories used in this report is based on methodology used by the Agency for Healthcare Research and Quality.3 The five most common Mental Illness and Substance Related Disorders from the Hawai‘i Health Information Corporation (HHIC) hospitalization data are defined on the next page. For some general information, the overall hospitalization rate was provided by area. All admission rates were based on the 2010 Census population and are not age-adjusted.
1 US Department of Health and Human Services. Office of Disease Prevention and Health Promotion. Available online at: http://www.healthypeople.gov/2020/LHI/mentalHealth.aspx.
2 US Department of Health and Human Services (HHS), Office of Disease Prevention and Health Promotion. Healthy People 2010 midcourse review: Focus area 26, substance abuse [Internet]. Washington: HHS; 2006 [cited 2010 April 12]. Available online at: http://www.healthypeople.gov/2010/Data/midcourse/pdf/FA26.pdf
3 Owens P, Myers M, Elixhauser A, Brach C. Care of Adults with Mental Health and Substance Abuse Disorders in u.S. Community Hospitals, 2004-HCUP Fact Book No 10. AHRQ Publication No. )8-0008, January 2007. Available online at: http://www.adhq.gov/data/hcup/factbk10.
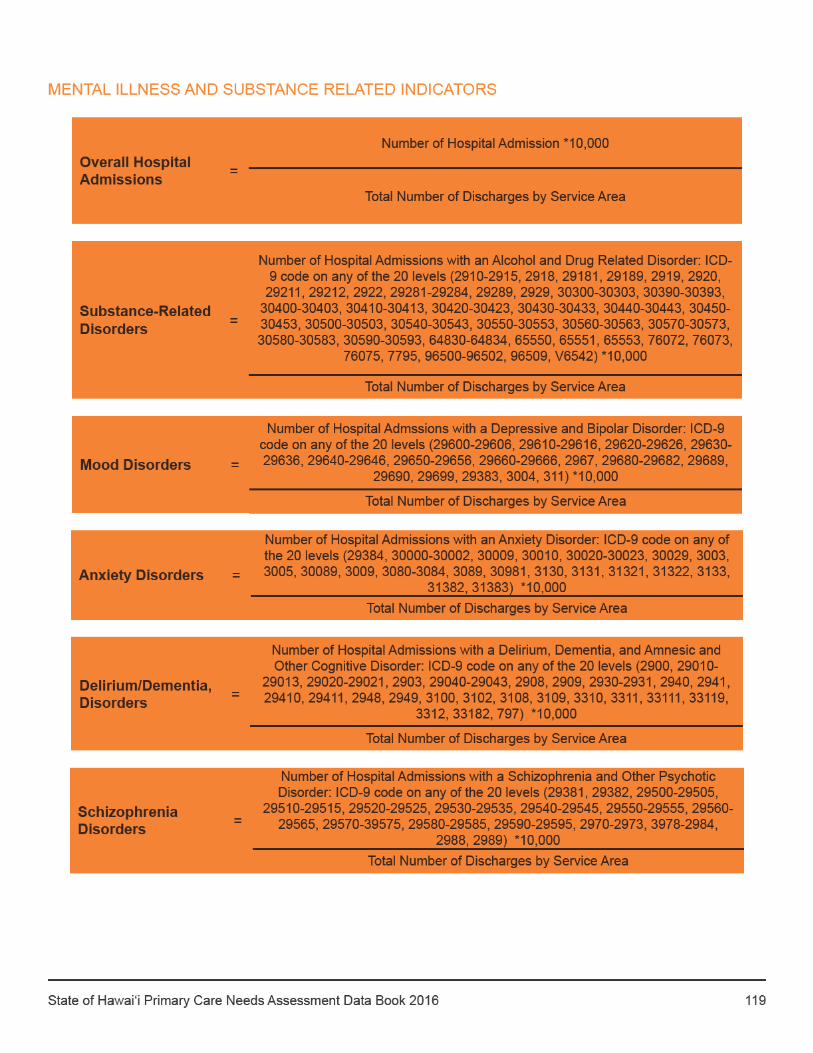
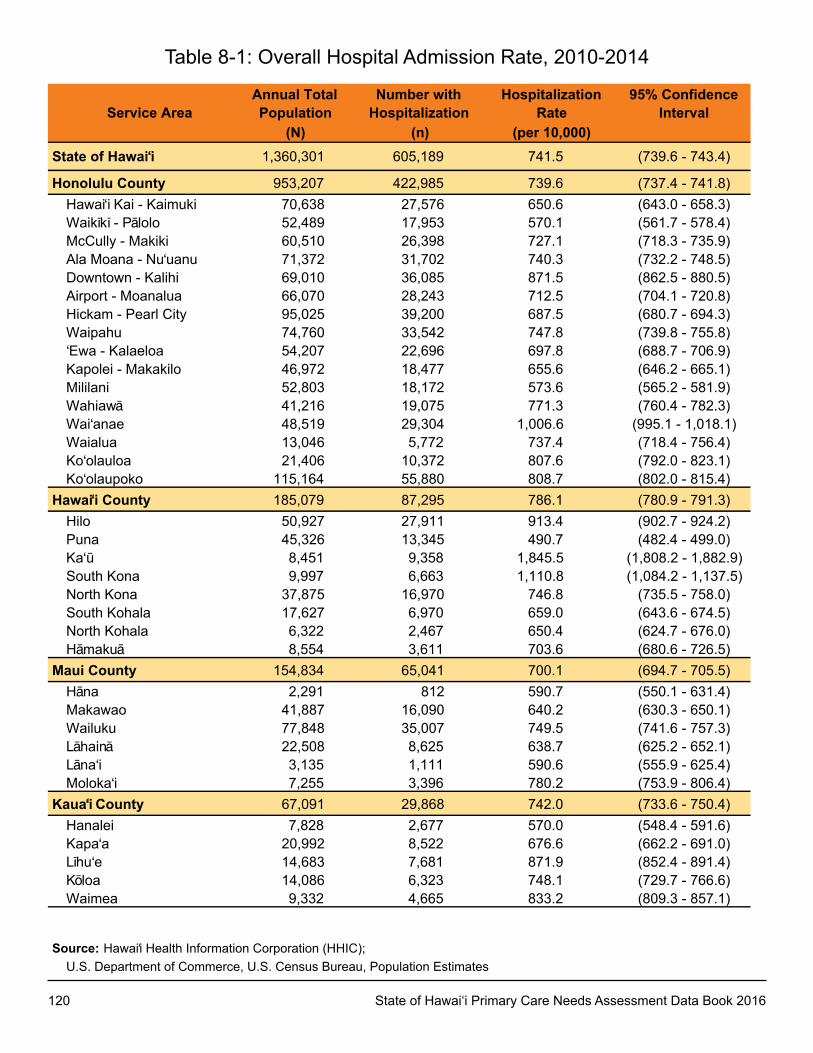
120 State of Hawai‘i Primary Care Needs Assessment Data Book 2016
Service AreaAnnual TotalPopulation
Number withHospitalization
HospitalizationRate
95% ConfidenceInterval
(N) (n) (per 10,000)State of Hawai‘i 1,360,301 605,189 741.5 (739.6 - 743.4)
Honolulu County 953,207 422,985 739.6 (737.4 - 741.8)Hawai‘i Kai - Kaimuki 70,638 27,576 650.6 (643.0 - 658.3)Waikïkï - Pälolo 52,489 17,953 570.1 (561.7 - 578.4)McCully - Makiki 60,510 26,398 727.1 (718.3 - 735.9)Ala Moana - Nu‘uanu 71,372 31,702 740.3 (732.2 - 748.5)Downtown - Kalihi 69,010 36,085 871.5 (862.5 - 880.5)Airport - Moanalua 66,070 28,243 712.5 (704.1 - 720.8)Hickam - Pearl City 95,025 39,200 687.5 (680.7 - 694.3)Waipahu 74,760 33,542 747.8 (739.8 - 755.8)‘Ewa - Kalaeloa 54,207 22,696 697.8 (688.7 - 706.9)Kapolei - Makakilo 46,972 18,477 655.6 (646.2 - 665.1)Mililani 52,803 18,172 573.6 (565.2 - 581.9)Wahiawä 41,216 19,075 771.3 (760.4 - 782.3)Wai‘anae 48,519 29,304 1,006.6 (995.1 - 1,018.1)Waialua 13,046 5,772 737.4 (718.4 - 756.4)Ko‘olauloa 21,406 10,372 807.6 (792.0 - 823.1)Ko‘olaupoko 115,164 55,880 808.7 (802.0 - 815.4)
Hawai‘i County 185,079 87,295 786.1 (780.9 - 791.3)Hilo 50,927 27,911 913.4 (902.7 - 924.2)Puna 45,326 13,345 490.7 (482.4 - 499.0)Ka‘ü 8,451 9,358 1,845.5 (1,808.2 - 1,882.9)South Kona 9,997 6,663 1,110.8 (1,084.2 - 1,137.5)North Kona 37,875 16,970 746.8 (735.5 - 758.0)South Kohala 17,627 6,970 659.0 (643.6 - 674.5)North Kohala 6,322 2,467 650.4 (624.7 - 676.0)Hämakuä 8,554 3,611 703.6 (680.6 - 726.5)
Maui County 154,834 65,041 700.1 (694.7 - 705.5)Häna 2,291 812 590.7 (550.1 - 631.4)Makawao 41,887 16,090 640.2 (630.3 - 650.1)Wailuku 77,848 35,007 749.5 (741.6 - 757.3)Lähainä 22,508 8,625 638.7 (625.2 - 652.1)Läna‘i 3,135 1,111 590.6 (555.9 - 625.4)Moloka‘i 7,255 3,396 780.2 (753.9 - 806.4)
Kaua‘i County 67,091 29,868 742.0 (733.6 - 750.4)Hanalei 7,828 2,677 570.0 (548.4 - 591.6)Kapa‘a 20,992 8,522 676.6 (662.2 - 691.0)Lïhu‘e 14,683 7,681 871.9 (852.4 - 891.4)Köloa 14,086 6,323 748.1 (729.7 - 766.6)Waimea 9,332 4,665 833.2 (809.3 - 857.1)
Source: Hawai‘i Health Information Corporation (HHIC);;U.S. Department of Commerce, U.S. Census Bureau, Population Estimates
Table 8-1: Overall Hospital Admission Rate, 2010-2014
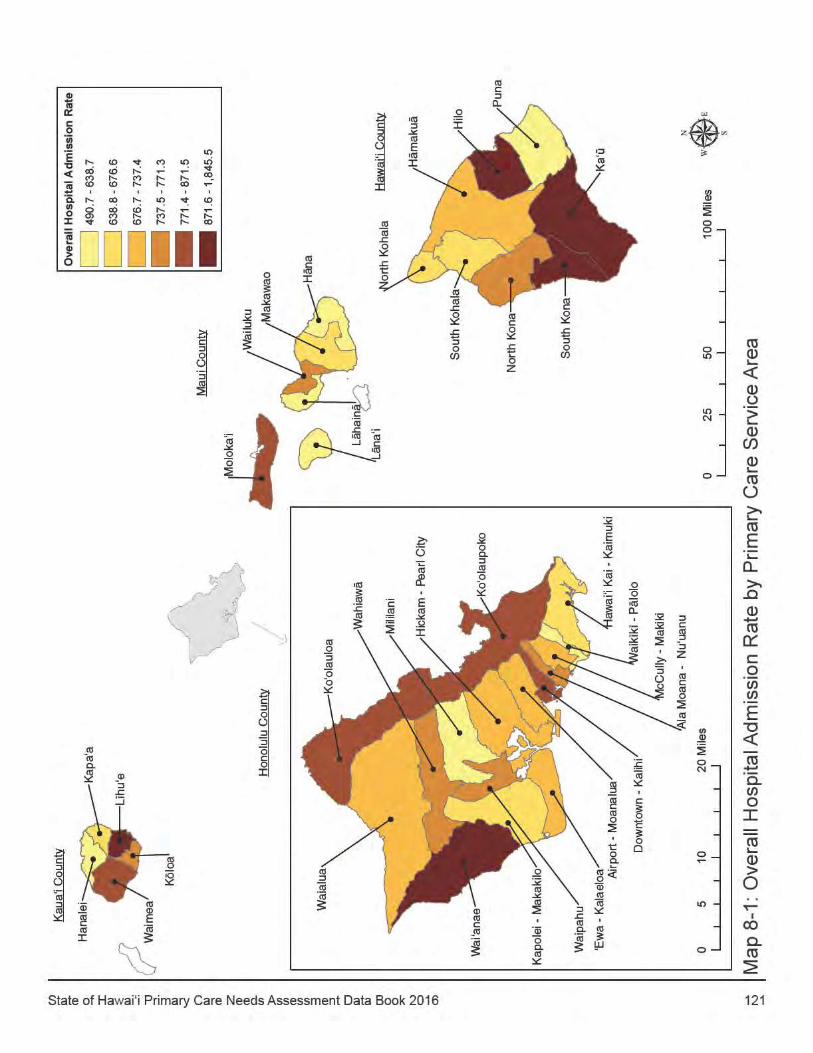
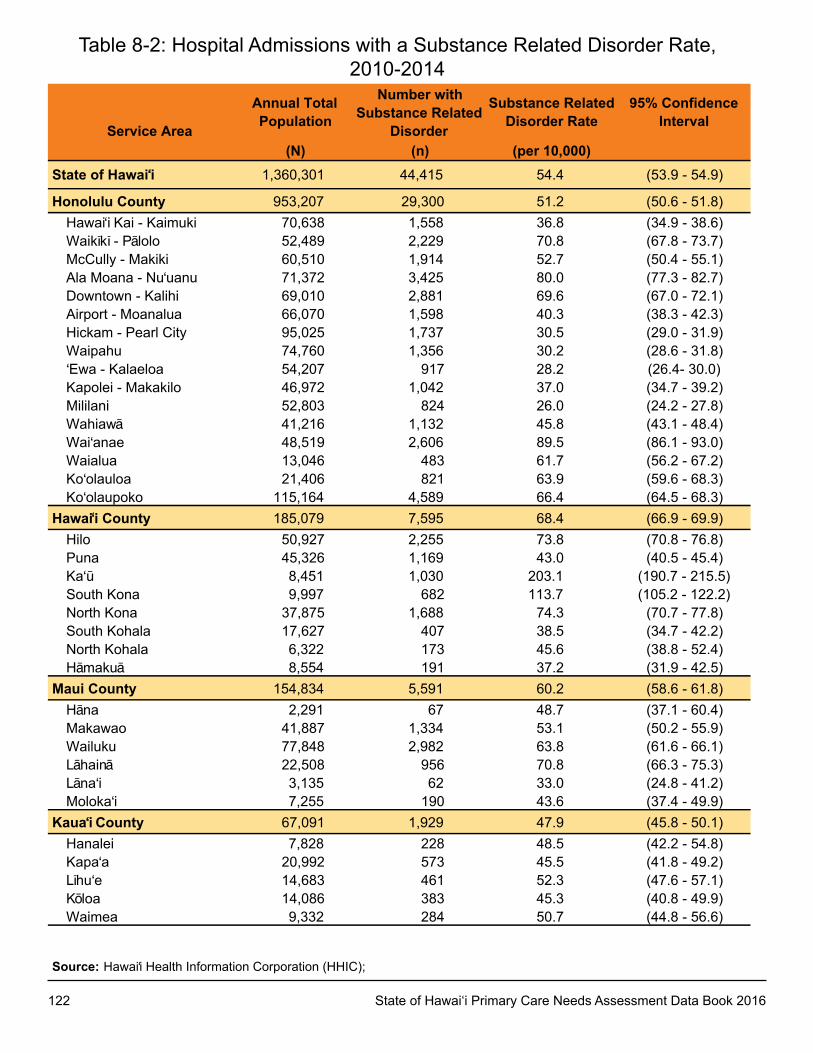
122 State of Hawai‘i Primary Care Needs Assessment Data Book 2016
Service Area
Annual TotalPopulation
Number withSubstance Related
Disorder
Substance RelatedDisorder Rate
95% ConfidenceInterval
(N) (n) (per 10,000)State of Hawai‘i 1,360,301 44,415 54.4 (53.9 - 54.9)
Honolulu County 953,207 29,300 51.2 (50.6 - 51.8)Hawai‘i Kai - Kaimuki 70,638 1,558 36.8 (34.9 - 38.6)Waikïkï - Pälolo 52,489 2,229 70.8 (67.8 - 73.7)McCully - Makiki 60,510 1,914 52.7 (50.4 - 55.1)Ala Moana - Nu‘uanu 71,372 3,425 80.0 (77.3 - 82.7)Downtown - Kalihi 69,010 2,881 69.6 (67.0 - 72.1)Airport - Moanalua 66,070 1,598 40.3 (38.3 - 42.3)Hickam - Pearl City 95,025 1,737 30.5 (29.0 - 31.9)Waipahu 74,760 1,356 30.2 (28.6 - 31.8)‘Ewa - Kalaeloa 54,207 917 28.2 (26.4- 30.0)Kapolei - Makakilo 46,972 1,042 37.0 (34.7 - 39.2)Mililani 52,803 824 26.0 (24.2 - 27.8)Wahiawä 41,216 1,132 45.8 (43.1 - 48.4)Wai‘anae 48,519 2,606 89.5 (86.1 - 93.0)Waialua 13,046 483 61.7 (56.2 - 67.2)Ko‘olauloa 21,406 821 63.9 (59.6 - 68.3)Ko‘olaupoko 115,164 4,589 66.4 (64.5 - 68.3)
Hawai‘i County 185,079 7,595 68.4 (66.9 - 69.9)Hilo 50,927 2,255 73.8 (70.8 - 76.8)Puna 45,326 1,169 43.0 (40.5 - 45.4)Ka‘ü 8,451 1,030 203.1 (190.7 - 215.5)South Kona 9,997 682 113.7 (105.2 - 122.2)North Kona 37,875 1,688 74.3 (70.7 - 77.8)South Kohala 17,627 407 38.5 (34.7 - 42.2)North Kohala 6,322 173 45.6 (38.8 - 52.4)Hämakuä 8,554 191 37.2 (31.9 - 42.5)
Maui County 154,834 5,591 60.2 (58.6 - 61.8)Häna 2,291 67 48.7 (37.1 - 60.4)Makawao 41,887 1,334 53.1 (50.2 - 55.9)Wailuku 77,848 2,982 63.8 (61.6 - 66.1)Lähainä 22,508 956 70.8 (66.3 - 75.3)Läna‘i 3,135 62 33.0 (24.8 - 41.2)Moloka‘i 7,255 190 43.6 (37.4 - 49.9)
Kaua‘i County 67,091 1,929 47.9 (45.8 - 50.1)Hanalei 7,828 228 48.5 (42.2 - 54.8)Kapa‘a 20,992 573 45.5 (41.8 - 49.2)Lïhu‘e 14,683 461 52.3 (47.6 - 57.1)Köloa 14,086 383 45.3 (40.8 - 49.9)Waimea 9,332 284 50.7 (44.8 - 56.6)
Source: Hawai‘i Health Information Corporation (HHIC);;
Table 8-2: Hospital Admissions with a Substance Related Disorder Rate, 2010-2014
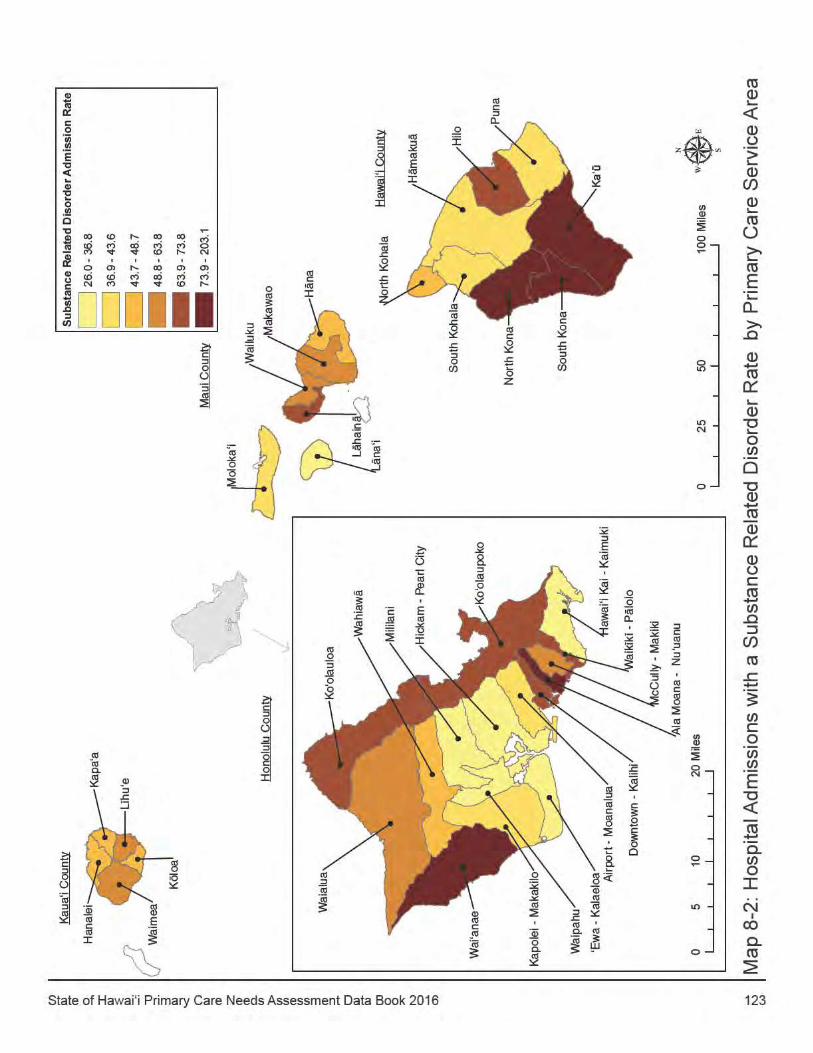
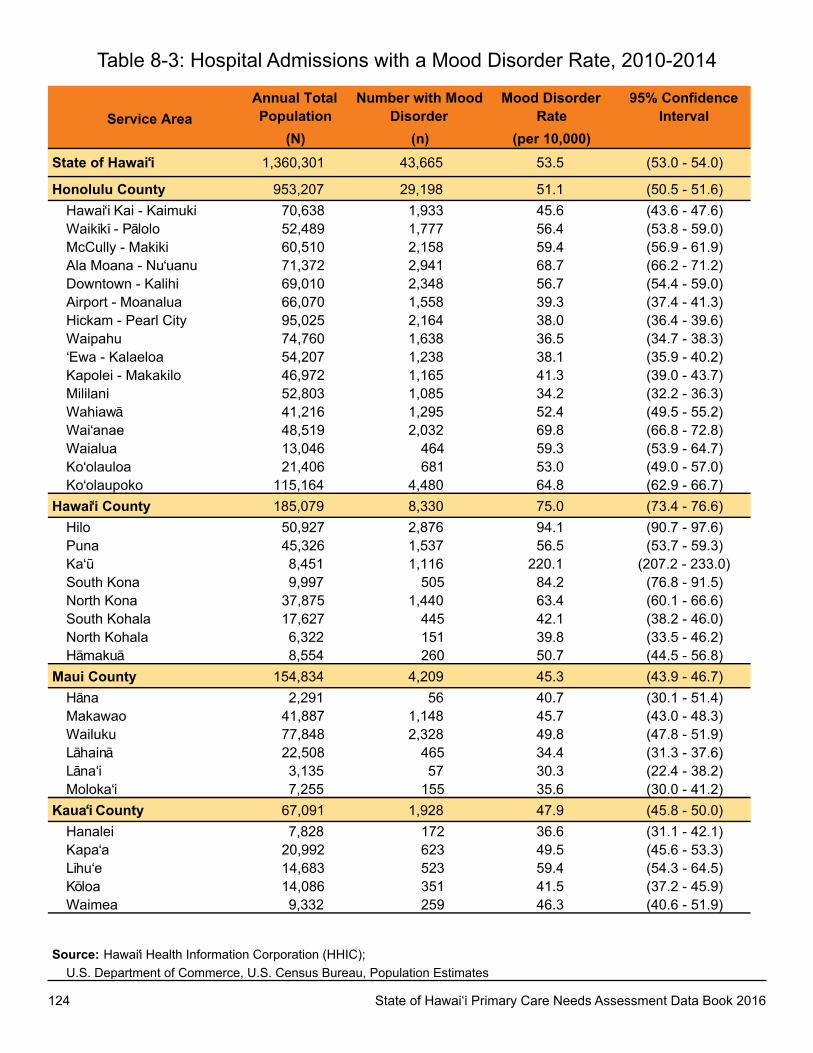
124 State of Hawai‘i Primary Care Needs Assessment Data Book 2016
Service AreaAnnual TotalPopulation
Number with MoodDisorder
Mood DisorderRate
95% ConfidenceInterval
(N) (n) (per 10,000)State of Hawai‘i 1,360,301 43,665 53.5 (53.0 - 54.0)
Honolulu County 953,207 29,198 51.1 (50.5 - 51.6)Hawai‘i Kai - Kaimuki 70,638 1,933 45.6 (43.6 - 47.6)Waikïkï - Pälolo 52,489 1,777 56.4 (53.8 - 59.0)McCully - Makiki 60,510 2,158 59.4 (56.9 - 61.9)Ala Moana - Nu‘uanu 71,372 2,941 68.7 (66.2 - 71.2)Downtown - Kalihi 69,010 2,348 56.7 (54.4 - 59.0)Airport - Moanalua 66,070 1,558 39.3 (37.4 - 41.3)Hickam - Pearl City 95,025 2,164 38.0 (36.4 - 39.6)Waipahu 74,760 1,638 36.5 (34.7 - 38.3)‘Ewa - Kalaeloa 54,207 1,238 38.1 (35.9 - 40.2)Kapolei - Makakilo 46,972 1,165 41.3 (39.0 - 43.7)Mililani 52,803 1,085 34.2 (32.2 - 36.3)Wahiawä 41,216 1,295 52.4 (49.5 - 55.2)Wai‘anae 48,519 2,032 69.8 (66.8 - 72.8)Waialua 13,046 464 59.3 (53.9 - 64.7)Ko‘olauloa 21,406 681 53.0 (49.0 - 57.0)Ko‘olaupoko 115,164 4,480 64.8 (62.9 - 66.7)
Hawai‘i County 185,079 8,330 75.0 (73.4 - 76.6)Hilo 50,927 2,876 94.1 (90.7 - 97.6)Puna 45,326 1,537 56.5 (53.7 - 59.3)Ka‘ü 8,451 1,116 220.1 (207.2 - 233.0)South Kona 9,997 505 84.2 (76.8 - 91.5)North Kona 37,875 1,440 63.4 (60.1 - 66.6)South Kohala 17,627 445 42.1 (38.2 - 46.0)North Kohala 6,322 151 39.8 (33.5 - 46.2)Hämakuä 8,554 260 50.7 (44.5 - 56.8)
Maui County 154,834 4,209 45.3 (43.9 - 46.7)Häna 2,291 56 40.7 (30.1 - 51.4)Makawao 41,887 1,148 45.7 (43.0 - 48.3)Wailuku 77,848 2,328 49.8 (47.8 - 51.9)Lähainä 22,508 465 34.4 (31.3 - 37.6)Läna‘i 3,135 57 30.3 (22.4 - 38.2)Moloka‘i 7,255 155 35.6 (30.0 - 41.2)
Kaua‘i County 67,091 1,928 47.9 (45.8 - 50.0)Hanalei 7,828 172 36.6 (31.1 - 42.1)Kapa‘a 20,992 623 49.5 (45.6 - 53.3)Lïhu‘e 14,683 523 59.4 (54.3 - 64.5)Köloa 14,086 351 41.5 (37.2 - 45.9)Waimea 9,332 259 46.3 (40.6 - 51.9)
Source: Hawai‘i Health Information Corporation (HHIC);;U.S. Department of Commerce, U.S. Census Bureau, Population Estimates
Table 8-3: Hospital Admissions with a Mood Disorder Rate, 2010-2014
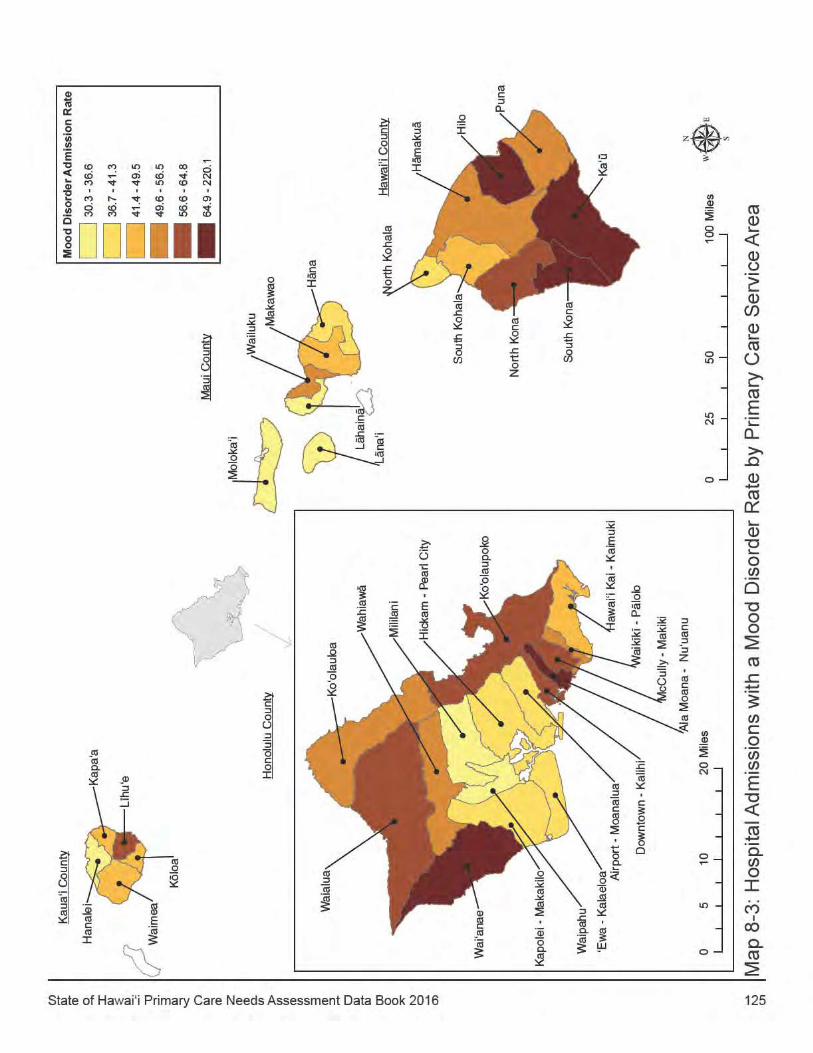

126 State of Hawai‘i Primary Care Needs Assessment Data Book 2016
Service AreaAnnual Total Population
Number with Anxiety Disorder
Anxiety Disorder Rate
95% Confidence Interval
(N) (n) (per 10,000)State of Hawai‘i 1,360,301 22,788 27.9 (27.6 - 28.3)
Honolulu County 953,207 15,739 27.5 (27.1 - 27.9)Hawai‘i kai - kaimuki 70,638 1,074 25.3 (23.8 - 26.9)Waikïkï - Pälolo 52,489 993 31.5 (29.6 - 33.5)McCully - Makiki 60,510 1,123 30.9 (29.1 - 32.7)Ala Moana - Nu‘uanu 71,372 1,561 36.5 (34.6 - 38.3)Downtown - kalihi 69,010 1,118 27.0 (25.4 - 28.6)Airport - Moanalua 66,070 834 21.0 (19.6 - 22.5)Hickam - Pearl City 95,025 1,253 22.0 (20.8 - 23.2)Waipahu 74,760 889 19.8 (18.5 - 21.1)‘Ewa - kalaeloa 54,207 725 22.3 (20.7 - 23.9)kapolei - Makakilo 46,972 638 22.6 (20.9 - 24.4)Mililani 52,803 647 20.4 (18.8 - 22.0)Wahiawä 41,216 786 31.8 (29.6 - 34.0)Wai‘anae 48,519 938 32.2 (30.2 - 34.3)Waialua 13,046 279 35.6 (31.5 - 39.8)ko‘olauloa 21,406 326 25.4 (22.6 - 28.1)ko‘olaupoko 115,164 2,413 34.9 (33.5 - 36.3)
Hawai‘i County 185,079 3,793 34.2 (33.1 - 35.2)Hilo 50,927 1,205 39.4 (37.2 - 41.7)Puna 45,326 724 26.6 (24.7 - 28.6)ka‘ü 8,451 482 95.1 (86.6 - 103.5)South kona 9,997 276 46.0 (40.6 - 51.4)North kona 37,875 699 30.8 (28.5 - 33.0)South kohala 17,627 220 20.8 (18.1 - 23.6)North kohala 6,322 69 18.2 (13.9 - 22.5)Hämakuä 8,554 118 23.0 (18.8 - 27.1)
Maui County 154,834 2,170 23.4 (22.4 - 24.3)Häna 2,291 25 18.2 (11.1 - 25.3)Makawao 41,887 625 24.9 (22.9 - 26.8)Wailuku 77,848 1,192 25.5 (24.1 - 27.0)Lähainä 22,508 206 15.3 (13.2 - 17.3)Läna‘i 3,135 38 20.2 (13.8 - 26.6)Moloka‘i 7,255 84 19.3 (15.2 - 23.4)
Kaua‘i County 67,091 1,086 27.0 (25.4 - 28.6)Hanalei 7,828 98 20.9 (16.7 - 25.0)kapa‘a 20,992 343 27.2 (24.4 - 30.1)Lïhu‘e 14,683 243 27.6 (24.1 - 31.1)köloa 14,086 236 27.9 (24.4 - 31.5)Waimea 9,332 166 29.6 (25.1 - 34.2)
Source: Hawai‘i Health Information Corporation (HHIC);u.S. Department of Commerce, u.S. Census Bureau, Population Estimates
Table 8-4: Hospital Admissions with an Anxiety Disorder Rate, 2010-2014
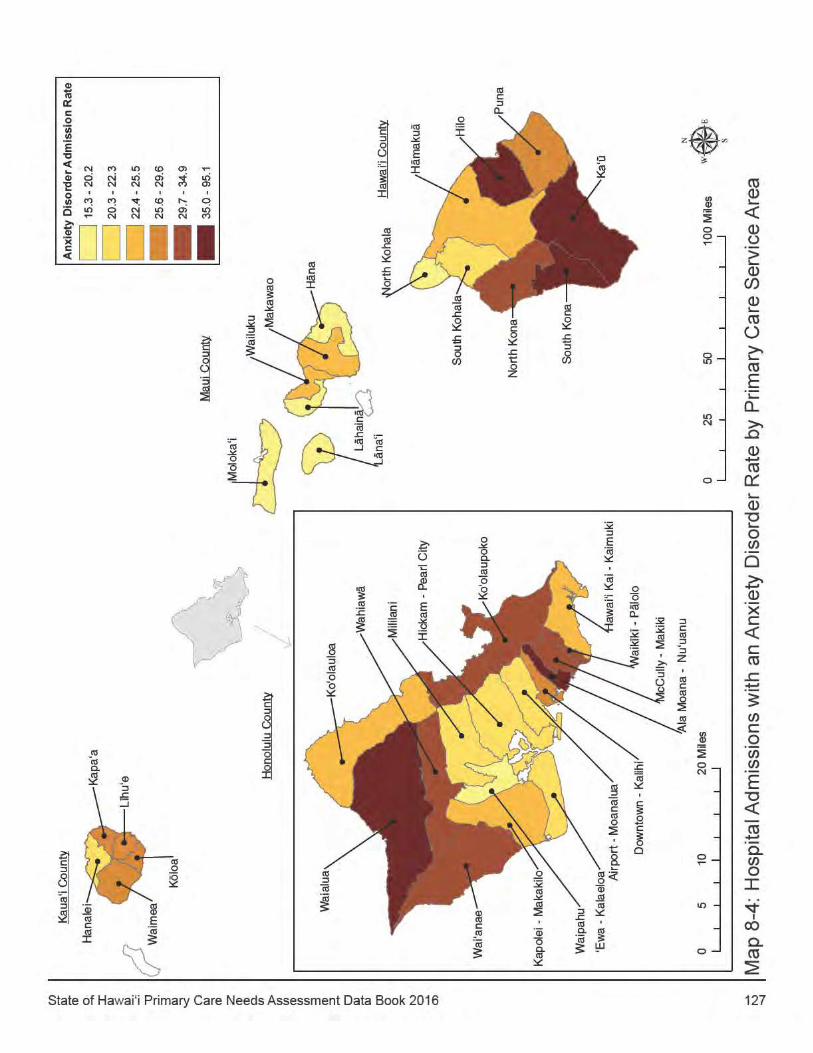

128 State of Hawai‘i Primary Care Needs Assessment Data Book 2016
Service Area
Annual Total Population
Number with Delirium/Dementia
Disorders
Delirium/Dementia Disorder Rate
95% Confidence Interval
(N) (n) (per 10,000)State of Hawai‘i 1,360,301 25,464 31.2 (30.8 - 31.6)
Honolulu County 953,207 19,932 34.9 (34.4 - 35.3)Hawai‘i kai - kaimuki 70,638 1,943 45.8 (43.8 - 47.9)Waikïkï - Pälolo 52,489 930 29.5 (27.6 - 31.4)McCully - Makiki 60,510 1,730 47.7 (45.4 - 49.9)Ala Moana - Nu‘uanu 71,372 1,651 38.6 (36.7 - 40.4)Downtown - kalihi 69,010 1,762 42.6 (40.6 - 44.5)Airport - Moanalua 66,070 1,148 29.0 (27.3 - 30.6)Hickam - Pearl City 95,025 2,205 38.7 (37.1 - 40.3)Waipahu 74,760 1,846 41.2 (39.3 - 43.0)‘Ewa - kalaeloa 54,207 793 24.4 (22.7 - 26.1)kapolei - Makakilo 46,972 518 18.4 (16.8 - 20.0)Mililani 52,803 769 24.3 (22.6 - 26.0)Wahiawä 41,216 670 27.1 (25.0 - 29.1)Wai‘anae 48,519 764 26.2 (24.4 - 28.1)Waialua 13,046 246 31.4 (27.5 - 35.4)ko‘olauloa 21,406 276 21.5 (19.0 - 24.0)ko‘olaupoko 115,164 2,539 36.7 (35.3 - 38.2)
Hawai‘i County 185,079 2,493 22.4 (21.6 - 23.3)Hilo 50,927 1,170 38.3 (36.1 - 40.5)Puna 45,326 315 11.6 (10.3 - 12.9)ka‘ü 8,451 183 36.1 (30.9 - 41.3)South kona 9,997 141 23.5 (19.6 - 27.4)North kona 37,875 388 17.1 (15.4 - 18.8)South kohala 17,627 123 11.6 (9.6 - 13.7)North kohala 6,322 67 17.7 (13.4 - 21.9)Hämakuä 8,554 106 20.7 (16.7 - 24.6)
Maui County 154,834 1,938 20.9 (19.9 - 21.8)Häna 2,291 13 9.5 (4.3 - 14.6)Makawao 41,887 441 17.5 (15.9 - 19.2)Wailuku 77,848 1,208 25.9 (24.4 - 27.3)Lähainä 22,508 161 11.9 (10.1 - 13.8)Läna‘i 3,135 26 13.8 (8.5 - 19.1)Moloka‘i 7,255 89 20.4 (16.2 - 24.7)
Kaua‘i County 67,091 1,101 27.4 (25.7 - 29.0)Hanalei 7,828 99 21.1 (16.9 - 25.2)kapa‘a 20,992 283 22.5 (19.9 - 25.1)Lïhu‘e 14,683 341 38.7 (34.6 - 42.8)köloa 14,086 227 26.9 (23.4 - 30.4)Waimea 9,332 151 27.0 (22.7 - 31.3)
Source: Hawai‘i Health Information Corporation (HHIC);u.S. Department of Commerce, u.S. Census Bureau, Population Estimates
Table 8-5: Hospital Admissions with a Delirium/Dementia Disorder Rate, 2010-2014
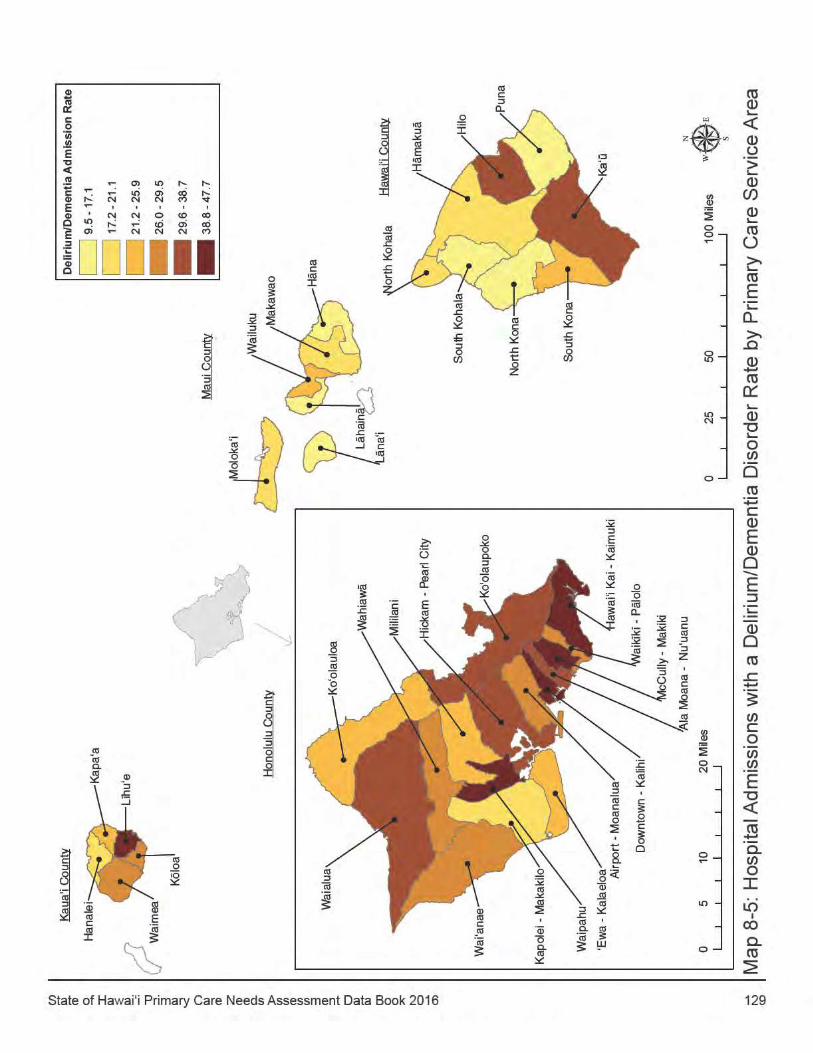
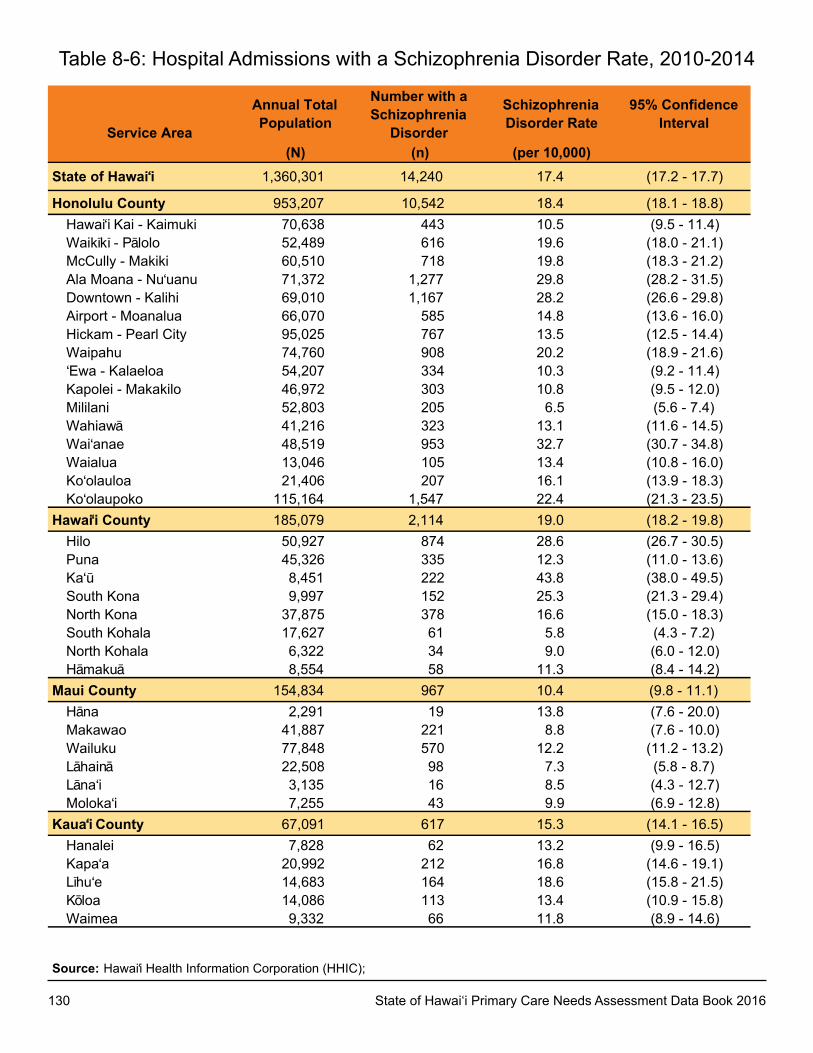
130 State of Hawai‘i Primary Care Needs Assessment Data Book 2016
Service Area
Annual TotalPopulation
Number with aSchizophreniaDisorder
SchizophreniaDisorder Rate
95% ConfidenceInterval
(N) (n) (per 10,000)State of Hawai‘i 1,360,301 14,240 17.4 (17.2 - 17.7)
Honolulu County 953,207 10,542 18.4 (18.1 - 18.8)Hawai‘i Kai - Kaimuki 70,638 443 10.5 (9.5 - 11.4)Waikïkï - Pälolo 52,489 616 19.6 (18.0 - 21.1)McCully - Makiki 60,510 718 19.8 (18.3 - 21.2)Ala Moana - Nu‘uanu 71,372 1,277 29.8 (28.2 - 31.5)Downtown - Kalihi 69,010 1,167 28.2 (26.6 - 29.8)Airport - Moanalua 66,070 585 14.8 (13.6 - 16.0)Hickam - Pearl City 95,025 767 13.5 (12.5 - 14.4)Waipahu 74,760 908 20.2 (18.9 - 21.6)‘Ewa - Kalaeloa 54,207 334 10.3 (9.2 - 11.4)Kapolei - Makakilo 46,972 303 10.8 (9.5 - 12.0)Mililani 52,803 205 6.5 (5.6 - 7.4)Wahiawä 41,216 323 13.1 (11.6 - 14.5)Wai‘anae 48,519 953 32.7 (30.7 - 34.8)Waialua 13,046 105 13.4 (10.8 - 16.0)Ko‘olauloa 21,406 207 16.1 (13.9 - 18.3)Ko‘olaupoko 115,164 1,547 22.4 (21.3 - 23.5)
Hawai‘i County 185,079 2,114 19.0 (18.2 - 19.8)Hilo 50,927 874 28.6 (26.7 - 30.5)Puna 45,326 335 12.3 (11.0 - 13.6)Ka‘ü 8,451 222 43.8 (38.0 - 49.5)South Kona 9,997 152 25.3 (21.3 - 29.4)North Kona 37,875 378 16.6 (15.0 - 18.3)South Kohala 17,627 61 5.8 (4.3 - 7.2)North Kohala 6,322 34 9.0 (6.0 - 12.0)Hämakuä 8,554 58 11.3 (8.4 - 14.2)
Maui County 154,834 967 10.4 (9.8 - 11.1)Häna 2,291 19 13.8 (7.6 - 20.0)Makawao 41,887 221 8.8 (7.6 - 10.0)Wailuku 77,848 570 12.2 (11.2 - 13.2)Lähainä 22,508 98 7.3 (5.8 - 8.7)Läna‘i 3,135 16 8.5 (4.3 - 12.7)Moloka‘i 7,255 43 9.9 (6.9 - 12.8)
Kaua‘i County 67,091 617 15.3 (14.1 - 16.5)Hanalei 7,828 62 13.2 (9.9 - 16.5)Kapa‘a 20,992 212 16.8 (14.6 - 19.1)Lïhu‘e 14,683 164 18.6 (15.8 - 21.5)Köloa 14,086 113 13.4 (10.9 - 15.8)Waimea 9,332 66 11.8 (8.9 - 14.6)
Source: Hawai‘i Health Information Corporation (HHIC);;
Table 8-6: Hospital Admissions with a Schizophrenia Disorder Rate, 2010-2014
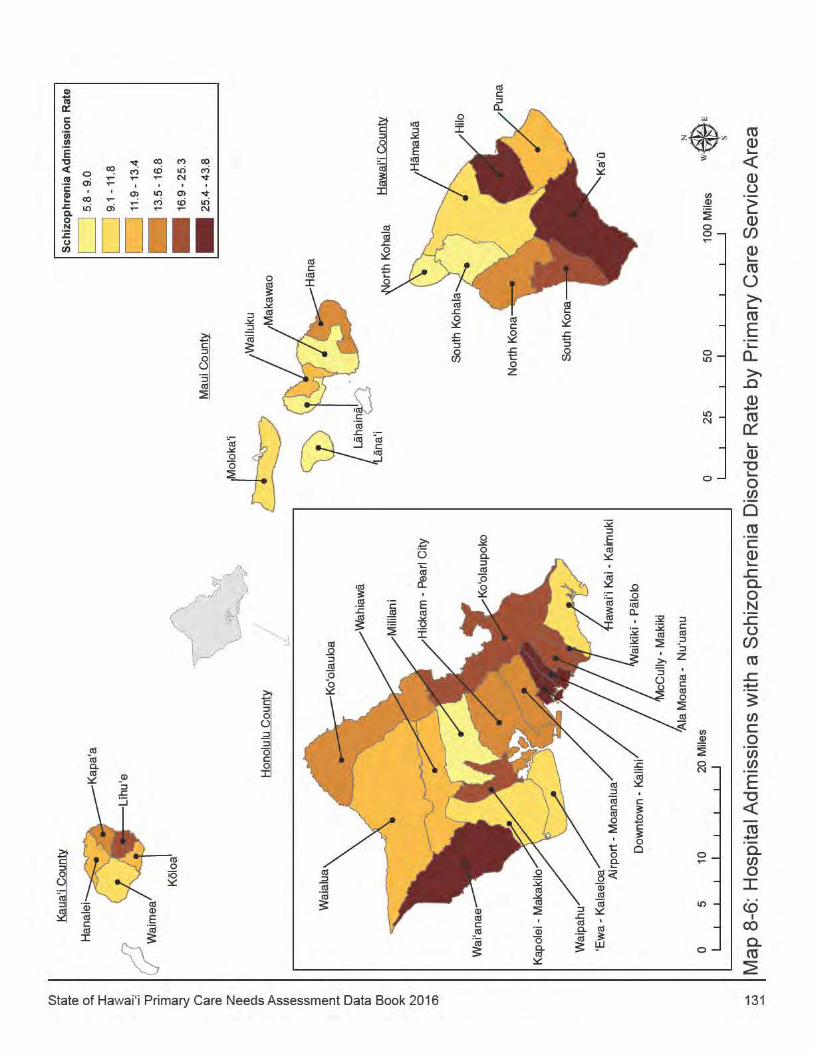
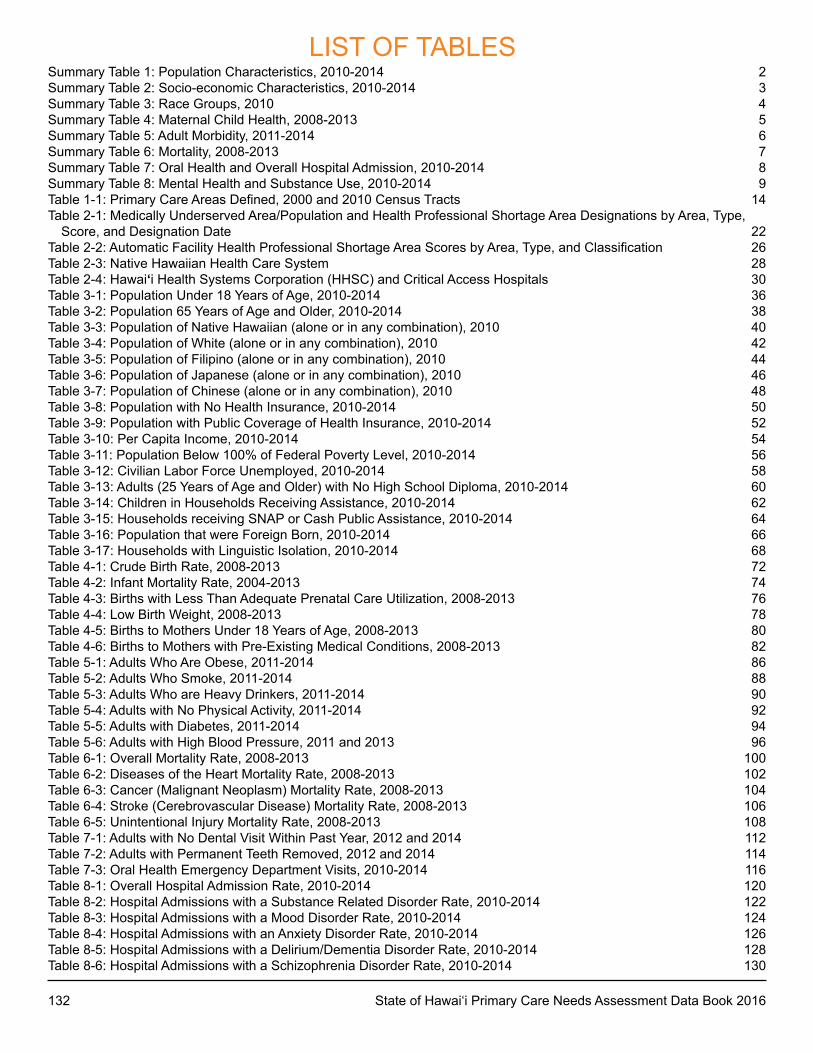
132 State of Hawai‘i Primary Care Needs Assessment Data Book 2016
Summary Table 1: Population Characteristics, 2010-2014 2Summary Table 2: Socio-economic Characteristics, 2010-2014 3Summary Table 3: Race Groups, 2010 4Summary Table 4: Maternal Child Health, 2008-2013 5Summary Table 5: Adult Morbidity, 2011-2014 6Summary Table 6: Mortality, 2008-2013 7Summary Table 7: Oral Health and Overall Hospital Admission, 2010-2014 8Summary Table 8: Mental Health and Substance use, 2010-2014 9Table 1-1: Primary Care Areas Defined, 2000 and 2010 Census Tracts 14Table 2-1: Medically underserved Area/Population and Health Professional Shortage Area Designations by Area, Type,
Score, and Designation Date 22Table 2-2: Automatic Facility Health Professional Shortage Area Scores by Area, Type, and Classification 26Table 2-3: Native Hawaiian Health Care System 28Table 2-4: Hawai‘i Health Systems Corporation (HHSC) and Critical Access Hospitals 30Table 3-1: Population under 18 Years of Age, 2010-2014 36Table 3-2: Population 65 Years of Age and Older, 2010-2014 38Table 3-3: Population of Native Hawaiian (alone or in any combination), 2010 40Table 3-4: Population of White (alone or in any combination), 2010 42Table 3-5: Population of Filipino (alone or in any combination), 2010 44Table 3-6: Population of Japanese (alone or in any combination), 2010 46Table 3-7: Population of Chinese (alone or in any combination), 2010 48Table 3-8: Population with No Health Insurance, 2010-2014 50Table 3-9: Population with Public Coverage of Health Insurance, 2010-2014 52Table 3-10: Per Capita Income, 2010-2014 54Table 3-11: Population Below 100% of Federal Poverty Level, 2010-2014 56Table 3-12: Civilian Labor Force unemployed, 2010-2014 58Table 3-13: Adults (25 Years of Age and Older) with No High School Diploma, 2010-2014 60Table 3-14: Children in Households Receiving Assistance, 2010-2014 62Table 3-15: Households receiving SNAP or Cash Public Assistance, 2010-2014 64Table 3-16: Population that were Foreign Born, 2010-2014 66Table 3-17: Households with Linguistic Isolation, 2010-2014 68Table 4-1: Crude Birth Rate, 2008-2013 72Table 4-2: Infant Mortality Rate, 2004-2013 74Table 4-3: Births with Less Than Adequate Prenatal Care utilization, 2008-2013 76Table 4-4: Low Birth Weight, 2008-2013 78Table 4-5: Births to Mothers under 18 Years of Age, 2008-2013 80Table 4-6: Births to Mothers with Pre-Existing Medical Conditions, 2008-2013 82Table 5-1: Adults Who Are Obese, 2011-2014 86Table 5-2: Adults Who Smoke, 2011-2014 88Table 5-3: Adults Who are Heavy Drinkers, 2011-2014 90Table 5-4: Adults with No Physical Activity, 2011-2014 92Table 5-5: Adults with Diabetes, 2011-2014 94Table 5-6: Adults with High Blood Pressure, 2011 and 2013 96Table 6-1: Overall Mortality Rate, 2008-2013 100Table 6-2: Diseases of the Heart Mortality Rate, 2008-2013 102Table 6-3: Cancer (Malignant Neoplasm) Mortality Rate, 2008-2013 104Table 6-4: Stroke (Cerebrovascular Disease) Mortality Rate, 2008-2013 106Table 6-5: Unintentional Injury Mortality Rate, 2008-2013 108Table 7-1: Adults with No Dental Visit Within Past Year, 2012 and 2014 112Table 7-2: Adults with Permanent Teeth Removed, 2012 and 2014 114Table 7-3: Oral Health Emergency Department Visits, 2010-2014 116Table 8-1: Overall Hospital Admission Rate, 2010-2014 120Table 8-2: Hospital Admissions with a Substance Related Disorder Rate, 2010-2014 122Table 8-3: Hospital Admissions with a Mood Disorder Rate, 2010-2014 124Table 8-4: Hospital Admissions with an Anxiety Disorder Rate, 2010-2014 126Table 8-5: Hospital Admissions with a Delirium/Dementia Disorder Rate, 2010-2014 128Table 8-6: Hospital Admissions with a Schizophrenia Disorder Rate, 2010-2014 130
LIST OF TABLES
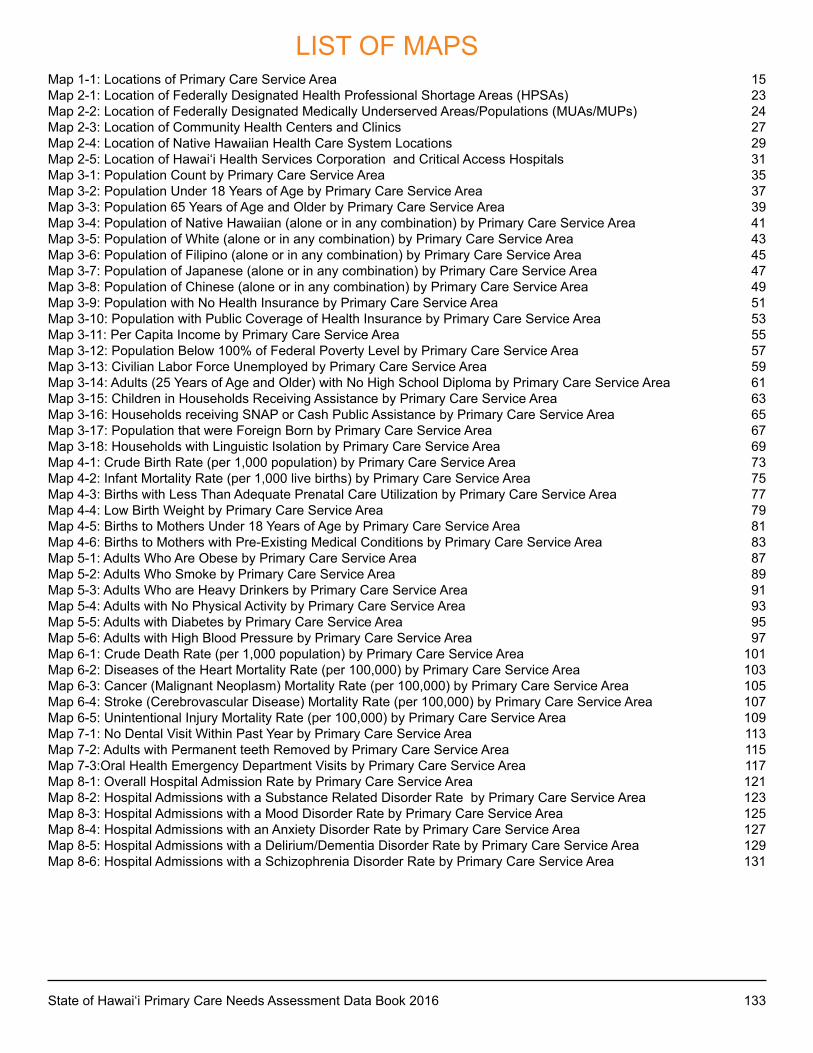
State of Hawai‘i Primary Care Needs Assessment Data Book 2016 133
Map 1-1: Locations of Primary Care Service Area 15Map 2-1: Location of Federally Designated Health Professional Shortage Areas (HPSAs) 23Map 2-2: Location of Federally Designated Medically underserved Areas/Populations (MuAs/MuPs) 24Map 2-3: Location of Community Health Centers and Clinics 27Map 2-4: Location of Native Hawaiian Health Care System Locations 29Map 2-5: Location of Hawai‘i Health Services Corporation and Critical Access Hospitals 31Map 3-1: Population Count by Primary Care Service Area 35Map 3-2: Population under 18 Years of Age by Primary Care Service Area 37Map 3-3: Population 65 Years of Age and Older by Primary Care Service Area 39Map 3-4: Population of Native Hawaiian (alone or in any combination) by Primary Care Service Area 41Map 3-5: Population of White (alone or in any combination) by Primary Care Service Area 43Map 3-6: Population of Filipino (alone or in any combination) by Primary Care Service Area 45Map 3-7: Population of Japanese (alone or in any combination) by Primary Care Service Area 47Map 3-8: Population of Chinese (alone or in any combination) by Primary Care Service Area 49Map 3-9: Population with No Health Insurance by Primary Care Service Area 51Map 3-10: Population with Public Coverage of Health Insurance by Primary Care Service Area 53Map 3-11: Per Capita Income by Primary Care Service Area 55Map 3-12: Population Below 100% of Federal Poverty Level by Primary Care Service Area 57Map 3-13: Civilian Labor Force unemployed by Primary Care Service Area 59Map 3-14: Adults (25 Years of Age and Older) with No High School Diploma by Primary Care Service Area 61Map 3-15: Children in Households Receiving Assistance by Primary Care Service Area 63Map 3-16: Households receiving SNAP or Cash Public Assistance by Primary Care Service Area 65Map 3-17: Population that were Foreign Born by Primary Care Service Area 67Map 3-18: Households with Linguistic Isolation by Primary Care Service Area 69Map 4-1: Crude Birth Rate (per 1,000 population) by Primary Care Service Area 73Map 4-2: Infant Mortality Rate (per 1,000 live births) by Primary Care Service Area 75Map 4-3: Births with Less Than Adequate Prenatal Care utilization by Primary Care Service Area 77Map 4-4: Low Birth Weight by Primary Care Service Area 79Map 4-5: Births to Mothers under 18 Years of Age by Primary Care Service Area 81Map 4-6: Births to Mothers with Pre-Existing Medical Conditions by Primary Care Service Area 83Map 5-1: Adults Who Are Obese by Primary Care Service Area 87Map 5-2: Adults Who Smoke by Primary Care Service Area 89Map 5-3: Adults Who are Heavy Drinkers by Primary Care Service Area 91Map 5-4: Adults with No Physical Activity by Primary Care Service Area 93Map 5-5: Adults with Diabetes by Primary Care Service Area 95Map 5-6: Adults with High Blood Pressure by Primary Care Service Area 97Map 6-1: Crude Death Rate (per 1,000 population) by Primary Care Service Area 101Map 6-2: Diseases of the Heart Mortality Rate (per 100,000) by Primary Care Service Area 103Map 6-3: Cancer (Malignant Neoplasm) Mortality Rate (per 100,000) by Primary Care Service Area 105Map 6-4: Stroke (Cerebrovascular Disease) Mortality Rate (per 100,000) by Primary Care Service Area 107Map 6-5: Unintentional Injury Mortality Rate (per 100,000) by Primary Care Service Area 109Map 7-1: No Dental Visit Within Past Year by Primary Care Service Area 113Map 7-2: Adults with Permanent teeth Removed by Primary Care Service Area 115Map 7-3:Oral Health Emergency Department Visits by Primary Care Service Area 117Map 8-1: Overall Hospital Admission Rate by Primary Care Service Area 121Map 8-2: Hospital Admissions with a Substance Related Disorder Rate by Primary Care Service Area 123Map 8-3: Hospital Admissions with a Mood Disorder Rate by Primary Care Service Area 125Map 8-4: Hospital Admissions with an Anxiety Disorder Rate by Primary Care Service Area 127Map 8-5: Hospital Admissions with a Delirium/Dementia Disorder Rate by Primary Care Service Area 129Map 8-6: Hospital Admissions with a Schizophrenia Disorder Rate by Primary Care Service Area 131
LIST OF MAPS
134 State of Hawai‘i Primary Care Needs Assessment Data Book 2016
ACKNOWLEDGMENTS
The Family Health Services Division (FHSD) appreciates the assistance given by the following organizations in providing data for this document:
• Hawai‘i Department of Health, Office of Health Status Monitoring
• Hawai‘i Department of Health, Behavioral Risk Factor Surveillance System
• Hawai‘i Department of Health, Family Health Services Division
• Hawai‘i Health Information Corporation
• United State Census Bureau
The following Family Health Services Division personnel and community partners directed the design and creation of this document:
• Danette Wong Tomiyasu, M.B.A.; Deputy Director, Health Resources Administration
• Donald Hayes, M.D., M.P.H.; Epidemiologist, Family Health Services Division*
• Nils Morita; Research Statistician, Family Health Services Division
• Catherine Sorensen, D.r.P.H., M.P.H.; Primary Care Program Specialist, Family Health Services Division
• John Yamauchi; Information Specialist, Family Health Services Division
• Annette Mente; Planner, Family Health Services Division
To request additional copies of the Primary Care Needs Assessment Data Book, call (808) 733-8364 or fax (808) 733-8369.
The Primary Care Needs Assessment Data Book is also available on the internet at:http://health.hawaii.gov/FHSD/publications/
_________* Position supported by the Family Health Services Division; the MCH Epidemiology Program, Centers for Disease Control and Prevention; and the MCH Bureau, Health Resources and Services Administration.

For more information:
Family Health Services DivisionPhone: (808) 586-4122
Fax: (808) 586-9303
This report is available online at:http://health.hawaii.gov/FHSD/publications/
We value your feedback, please complete the evaluation form online at:http://health.hawaii.gov/fhsd/evaluation-forms-2
We provide access to our activities without regard to race, color, national origin, language, age, sex, gender identity or expression, sexual orientation, religion, or disability.
For help with a problem, please contact the Hawai‘i State Department of Health, 1250 Punchbowl Street, Room 216, Honolulu, HI 96813 or at (808) 586-4122 within 180 days. You may also contact our departmental Affirmative Action Officer at P.O. Box 3378, Honolulu, HI 96801-3378 or at (808) 586-4616 (voice/tty).
This project was supported by the Health Resources and Services Administration (HRSA) of the U.S. Department of Health and Human Services (HHS) under grant number U68HP11443, titled “Primary Care Services Resources Coordination and Development”, with a total grant award of $167,994. This information or content and conclusions are those of the author and should not be construed as the official position or policy of, nor should any endorsements be inferred by HRSA, HHS or the U.S. Government.