Embed Size (px)
Citation preview
Drowning Deaths ‐ Rural and Remote Australia
A report by the Royal Life Saving Society Australia
Funding for this project was provided by the Australian Government Department of Health and Ageing
© AWSC August 2008 1
© The Royal Life Saving Society Australia 2008
All rights reserved.
The views expressed and the conclusions reached in this report are those of the authors.
This report is copyright. This work may be reproduced in whole or in part for research, training or drowning prevention
purposes subject to the inclusion of an acknowledgement of the source and provided no commercial usage or sale is
made. For any other enquiries concerning reproduction, contact RLSSA National Manager, Research and Health
Promotion on (02) 82173128.
Suggested Citation:
Franklin RC, Simmonds EL, Peden A, Scarr J (2008). Drowning Deaths ‐ Rural and Remote Australia. Australian Water
Safety Council: Sydney [Secretariat: Royal Life Saving Society Australia, PO Box 558, Broadway NSW 2007, Australia].
Further Copies:
Available on‐line at www.watersafety.com.au
The Royal Life Saving Society Australia
Royal Life Saving is active all over Australia. Our branches, members, volunteers, trainers, employees and lifesavers are
found in almost all communities. Lifesavers are everywhere. They can be teachers, students, mums, dads, firefighters,
plumbers or accountants. They patrol the houses, streets, workplaces and parks of the communities in which they live.
They don’t always wear a uniform but they can and do save lives. The RLSSA approach is inclusive and some of their
biggest achievements occur away from large capital cities.
The Australian Water Safety Council is comprised of:
The Royal Life Saving Society Australia (RLSSA); Surf Life Saving Australia (SLSA); AUSTSWIM; Australian Swimming
Coaches & Teachers Association (ASCTA); Swimming Australia; Kidsafe Australia; Farmsafe Australia (FSA); Australia &
New Zealand Safe Boating Education Group (ANZSBEG); Australian Local Government Association (ALGA); Surfing
Australia; Aquatic and Recreation Institute (ARI); Standing Committee on Recreation and Sport, (SCORS). Australian
National Sportsfishing Association
Acknowledgements
The authors would like to thank all Royal Life Saving staff who helped with input into this report. Information for the
report has been collected from the National Coroners Information System and as such would not have been possible
without the hard work of the State and Territory Coroners. Funding for this report was provided by the Australian
Government Department of Health and Ageing.
© AWSC August 2008 2
Executive Summary
This report examines drowning deaths of residents of rural and remote locations and people who visit rural
and remote aquatic locations. Using data from the Australian Bureau of Statistics (ABS) for the period 1 July
1992 to 30 June 2004 and the National Coroners Information System (NCIS) for the period 1 July 2002 to 30
June 2007, the following statistical evidence was compiled:
Residents of Rural and Remote Locations (ABS and NCIS data)
From the ABS data over the 13 years there were on average 62 deaths per annum of residents of rural and
remote locations per annum and in the NCIS data for the last five years there were on average 50 deaths per
annum. In both datasets, the crude drowning death rate was 1.7 times higher for residents of rural and
remote locations than their urban counterparts. In both datasets, there was a downward trend in the
number of residents who drowned per annum. Males continue to be over represented and half of all people
who drowned were aged between 25 and 54 years. Common States or Territories where residents of rural
and remote locations drowned were Queensland, New South Wales and Western Australia; however, the
Northern Territory had the highest drowning death rate. Common locations were rivers, oceans, beaches
and swimming pools, with most people drowning in the postcode in which they lived. Approximately one in
five drowning deaths were of Aboriginal and Torres Strait Islanders.
High Risk Age groups (NCIS data)
An examination of those age groups identified as high risk age groups (0‐4 years, 18‐34 years and 55+ years)
in the National Water Safety 2008‐2011 was undertaken using NCIS data. For the 0‐4 years age group,
victims commonly drowned close to home in swimming pools and rivers which they were not in prior to
drowning. For the 18‐34 years age groups the majority were males. One in three had alcohol in their
system, were recreating in the water immediately prior to drowning and drowned in swimming pools, oceans
and beaches. The majority of drowning deaths in this age group occurred during the summer. For the 55+
years age group the rate of drowning deaths increased as they aged and commonly occurred in rivers, oceans
and swimming pools following a fall into the water.
Drowning deaths at Rural and Remote locations (NCIS data)
For people who drowned at rural and remote locations, there were 70 deaths per annum of which 62% were
residents of rural and remote locations. The majority of the deaths occurred in Queensland, Western
Australia and New South Wales. The most common ages were 25‐44 years, and the most common locations
were rivers, oceans and beaches. Common activities immediately prior to drowning were using watercraft,
and swimming, paddling or wading. Alcohol or drugs were in the system of one in four people and one half
of all people drowned in a postcode which was different to the one in which they lived.
Drowning deaths at Rural and Remote Rivers, Oceans and Beaches (NCIS data)
The three most common rural and remote aquatic locations (rivers, oceans, beaches) where drowning deaths
occurred were examined in detail. Males were over represented at all locations and the majority of people
were visitors to the location (i.e. lived in a different postcode to the one in which they drowned). For
drowning deaths in rivers the most common States or Territories were Northern Territory and Queensland
and commonly occurred between January and March. Common activities immediately prior to drowning
© AWSC August 2008 3
were transport, and swimming, paddling and wading. For drowning deaths at rural and remote ocean
locations, Queensland and Western Australia were the most common State or Territory. Common activities
immediately prior to drowning were using watercraft and snorkelling or scuba diving and deaths occurred all
year round. For beach locations Western Australia and Queensland were the most common State or
Territory and most people were in the water immediately prior to drowning. For one in five deaths at rural
and remote beach locations drowning victims had alcohol or drugs in their system at the time of death.
Conclusion
In conclusion, this study aimed to provide an overall examination of drowning deaths that occurred at rural
and remote locations and of people from rural and remote locations. There is unfortunately no one strategy
that will prevent all rural and remote drowning deaths, therefore a wide variety of strategies targeting a
range of age groups, aquatic locations, and activities (including alcohol consumption) will be required to
reduce rural drowning deaths.
© AWSC August 2008 4
© AWSC August 2008 5
Contents
Executive Summary ................................................................................................................................................................ 3
Contents ................................................................................................................................................................................. 5
Introduction ........................................................................................................................................................................... 6
Aims ................................................................................................................................................................................... 6
Rural and Remote Definitions ........................................................................................................................................... 6
Data used in this report ..................................................................................................................................................... 8
Methods ................................................................................................................................................................................. 9
ABS ..................................................................................................................................................................................... 9
NCIS ................................................................................................................................................................................. 12
Visitor Status ................................................................................................................................................................... 14
Results .................................................................................................................................................................................. 15
ABS Residents of rural and remote locations .................................................................................................................. 15
NCIS ................................................................................................................................................................................. 22
Residents of rural and remote locations (NCIS Data) ...................................................................................................... 22
People drowning at rural and remote locations (NCIS Data) .......................................................................................... 38
Discussion ............................................................................................................................................................................ 55
Drowning deaths of residents of rural and remote locations ......................................................................................... 55
People drowning at rural and remote locations (NCIS Data) .......................................................................................... 57
Data issues ....................................................................................................................................................................... 58
Conclusion ....................................................................................................................................................................... 58
Glossary................................................................................................................................................................................ 60
Tables ................................................................................................................................................................................... 62
Figures .................................................................................................................................................................................. 64
References ........................................................................................................................................................................... 66
Appendix 1: .......................................................................................................................................................................... 67
Introduction
The reduction of rural and remote drowning deaths has been identified as a key goal area of the Draft Australian
Water Safety Strategy 2008‐2011 which has the overall aim of reducing drowning deaths by 50% by the year 2020 1. To measure effectively the rural targets in the strategy, good baseline information, that informs the
development, implementation and monitoring of stratagems aimed at achieving the goal is required. This
information should include the current number of people drowning from (residents) or at rural and remote
locations and the circumstances surrounding these deaths.
This report is one in a series of reports funded by the Australian Government Department of Health and Ageing
under the National Water Safety Plan 2004‐2007 examining issues around rural and remote water safety. Other
reports have examined rural and remote swimming and water safety teachers 2, issues around facilities, program
and services for water safety for Aboriginal and Torres Strait Islanders in rural and remote Australia 3, and water
safety in rural and remote locations 4. These reports are available from www.watersafety.com.au.
Aims
The aims of this research report are to:
• Analyse unintentional drowning deaths in rural and remote Australia using Australian Bureau of Statistics (ABS) data for the period 1 July 1992 to 30 June 2004 and National Coroners Information System (NCIS) data for the period 1 July 2002 to 30 June 2007 by:
o Trends over time
o Age
o Sex
o State and Territory
o Month of year
o Location
o Activity
o Alcohol and/or drugs
o Visitor status
o NCIS case status (open, closed or unknown)
• Provide statistical data to support the rural and remote section of the Australian Water Safety Strategy 2008‐2011.
Rural and Remote Definitions
Rural and remote definitions have changed over time from being a measure of distance from capital cities to a
measure of accessibility of goods and services, and opportunities for social interaction 5. The
Accessibility/Remoteness Index of Australia (ARIA) Classifications measure distance from populated localities to
service centres based on road distance and consists of the following five classes 5:
• Highly Accessible – relatively unrestricted accessibility to a wide range of goods and services, and
opportunities for social interaction
• Accessible – some restrictions to accessibility of some goods and services, and opportunities for social
interaction
• Moderately Accessible – significantly restricted accessibility of goods and services, and opportunities for
social interaction
• Remote – very restricted accessibility of goods and services, and opportunities for social interaction
• Very Remote – very little accessibility of goods and services, and opportunities for social interaction 6.
© AWSC August 2008 6
ARIA was then improved by the Australian Bureau of Statistics (ABS) using the Australian Standard Geographical
Classification (ASGC) at a Collection District (CD) level. The ARIA+ index is derived from 1 km population grids
based on population density, distance by road to the nearest service centre and type of service (for further
information see http://www.health.gov.au/internet/main/publishing.nsf/Content/health‐historicpubs‐hfsocc‐
ocpanew14a.htm) 6. ARIA+ provides a greater level of precision in its measurement of remoteness and consists of
six classifications 6:
• Major Cities ‐ CDs with an average ARIA index value of 0 to 0.2
• Inner Regional ‐ CDs with an average ARIA index value greater than 0.2 and less than or equal to 2.4
• Outer Regional ‐ CDs with an average ARIA index value greater than 2.4 and less than or equal to 5.92
• Remote ‐ CDs with an average ARIA index value greater than 5.92 and less than or equal to 10.53
• Very Remote ‐ CDs with an average ARIA index value greater than 10.53
• Migratory ‐ composed of off‐shore, shipping and migratory CDs 7.
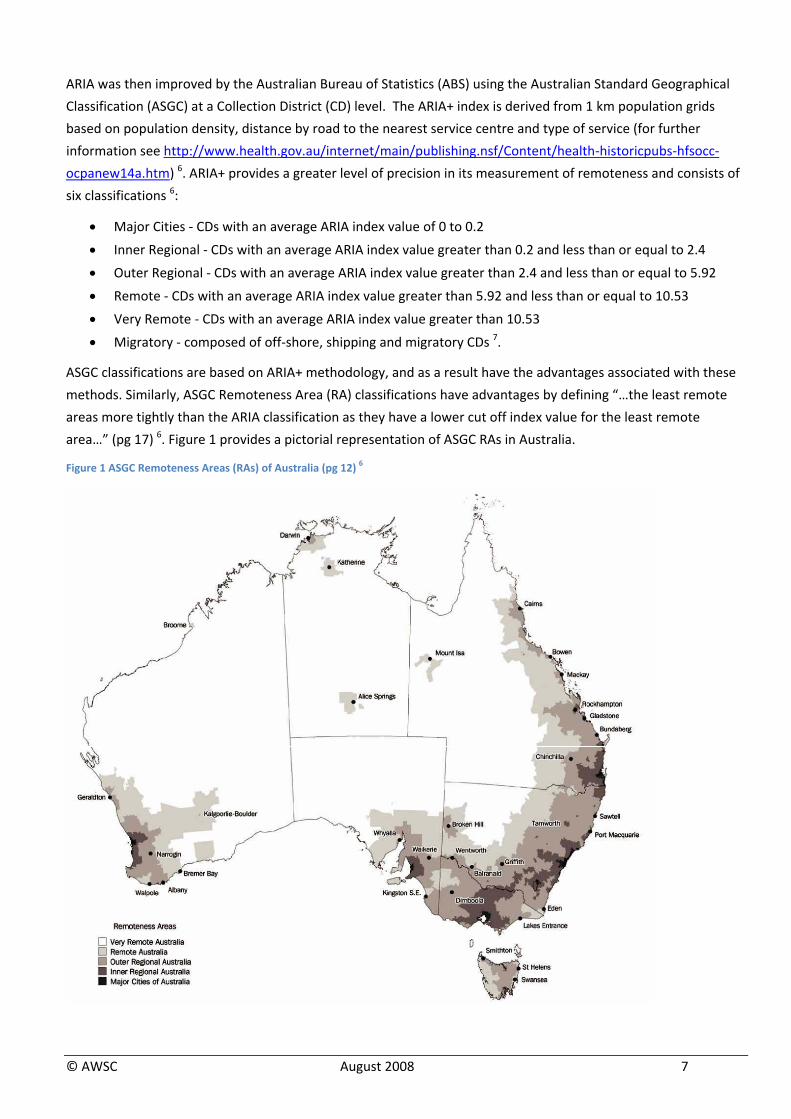
ASGC classifications are based on ARIA+ methodology, and as a result have the advantages associated with these
methods. Similarly, ASGC Remoteness Area (RA) classifications have advantages by defining “…the least remote
areas more tightly than the ARIA classification as they have a lower cut off index value for the least remote
area…” (pg 17) 6. Figure 1 provides a pictorial representation of ASGC RAs in Australia.
Figure 1 ASGC Remoteness Areas (RAs) of Australia (pg 12) 6
© AWSC August 2008 7
Data used in this report
There are two sources of data used in this report, the first is the ABS deaths data collection and the second is the
NCIS data.
Australian Bureau of Statistics (ABS) Deaths Data Collection
The ABS is Australia’s central statistical authority and is the largest provider of statistics in Australia. Data
produced by the ABS is used to inform discussion, research and decision making in a variety of different fields 8.
The Australian Bureau of Statistics Act (1975) legally provides the ABS with the responsibility of leading a national
statistical service for all Australian governments and the community 8.
Information on injury deaths in Australia has traditionally come from the ABS deaths data collection9 and it
includes all deaths reported in Australia during the specified time period. Death records are provided to the ABS
on a monthly basis by individual registrars, however some deaths that occur towards the end of a month may not
be registered until the next month10. The ABS provides the official count of deaths in Australia as reporting is
mandatory. However, the data within the ABS may not be entirely accurate at the time of publishing as
information about the cause of death is dependent on the finalisation of coronial proceedings 10 which can result
in missing data or limitations in classifying the circumstances surrounding the death such as the activity and
location.
National Coroners Information System (NCIS)
The NCIS is a national internet based data storage and retrieval system for Australian coronial cases 11. It contains
information on every death reported to a coroner in Australia since 1 July 2000 (1 January 2001 for Queensland) 11. The NCIS assists coroners investigating deaths by providing information on previous coronial cases. This
information may also be used by researchers and others to identify systemic hazards within the community, and
develop injury prevention strategies 11.
The NCIS for each case contains up to four case documents (police, autopsy, toxicology and coroner’s finding
reports 9), as well as a range of coded information about the person and the circumstance surrounding the death.
Included in the coded information are postcodes for the person’s residence and the location where the incident
occurred. While the NCIS has the potential to provide more comprehensive data on injury deaths in Australia
than the ABS, this information is time dependant as it requires the coroner to have closed the case for all
information to be available and this process can take several years. There are also variations in information
between State and Territory NCIS records due to the wide range of individuals involved in providing information
into the system 12.
Open cases provide only limited information while they are under investigation 9. Case closure rates on the NCIS
have improved from 40% in June 2002 to 78% in January 2008 13. There are still a small number of issues being
worked out including ensuring all closed cases have all the information stored on the NCIS system, catching up
with the backlog of cases and improving the quality of the coding. Also, information for Queensland is currently
only entered into the system once the case has been closed 13.
© AWSC August 2008 8
Methods
Drowning death information for this report was collected from the ABS deaths data collection, 1 January 1992 to
31 December 2004 and from the NCIS, 1 July 2002 to 30 June 2007. Separate methodologies were required to
analyse the ABS and NCIS data. The different timeframes used relate to the availability of information, at the time
of the study ABS information was only available to 31 December 2004 and as extra drowning information was
recorded (drowning flag) from 1 January 1992, the period 1 January 1992 to 31 December 2004 was used for the
ABS information. It was decided that the last five years (1 July 2002 to 30 June 2007) for the NCIS information
would provide a five‐year baseline to allow for future comparisons.
ABS
The ABS publishes a regular report on the causes of death in Australia each year (Cat No. 3303.0) 14. The cause of
death information is compiled from data made available to the ABS by the Registrar of Births, Deaths and
Marriages in each State or Territory. The ABS uses the International Classification of Diseases (ICD) version 9 (ICD‐
9) and 10 (ICD‐10) to classify diseases and other health problems on hospital records and death certificates. The
ABS makes this information available (at a cost), as deaths data collection. All drowning deaths for the period
1992 to 2004 were purchased from the ABS where they had identified the cause of death as drowning or
drowning related (i.e. E910, E830 or E832, E954, E964, E984, W65‐W74, V90 or V92, X71, X92, Y21) under the ICD‐
9 or ICD‐10 classification.
A similar methodology as used by Driscoll et al 15 in the report ‘Alcohol and water safety’ has been used in this
report. In their report Driscoll et al 15 define drowning deaths using Underlying Cause of Death (UCoD)
classifications.
UCoD used in this report has been classified as follows:
• Accidental drowning ‐ ICD‐9 E910 to 1998; ICD‐10 W65‐W74 from 1999
• Water transport drowning ‐ ICD‐9 E830 or E832 to 1998; ICD‐10 V90 or V92 from 1999
• Suicide by drowning ‐ ICD‐9 E954 to 1998; ICD‐10 X71 from 1999
• Homicide by drowning ‐ ICD‐9 E964 to 1998; ICD‐10 X92 from 1999
• Drowning intent undetermined ‐ ICD‐9 E984 to 1998; ICD‐10 Y21 from 1999
• Drowning due to cataclysmic storms and floods ‐ ICD‐9 E908 to 1998; ICD‐10 X37 or X38 from 1999 where
the ABS identified it as a drowning death
• ABS identified drowning death ‐ where the UCoD was not drowning but the ABS flagged the item as a
drowning or drowning related. This was further classified into:
o Drowning ABS Identified
o Drowning ABS Identified suicide primary cause of death
o Drowning ABS identified homicide primary cause of death
Those cases where the UCoD was suicide by drowning, homicide by drowning, ABS identified suicide primary
cause of death and drowning ABS identified homicide primary cause of death were excluded from the analysis.
© AWSC August 2008 9
Location of usual residence by Statistical Local Area (SLA) was used to classify the data according to the ASGC
classifications for rural and remote. Cases that were identified as being outer regional, remote, very remote, and
migratory were included in the analysis.
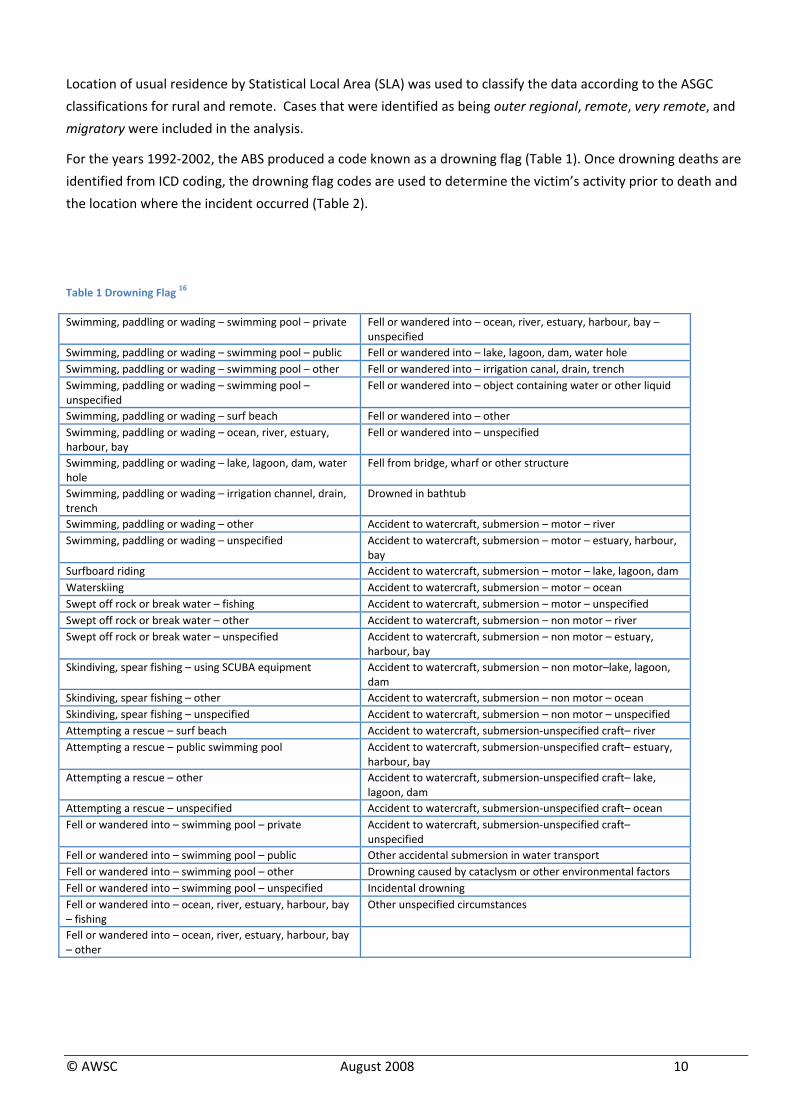
For the years 1992‐2002, the ABS produced a code known as a drowning flag (Table 1). Once drowning deaths are
identified from ICD coding, the drowning flag codes are used to determine the victim’s activity prior to death and
the location where the incident occurred (Table 2).
Table 1 Drowning Flag 16
Swimming, paddling or wading – swimming pool – private Fell or wandered into – ocean, river, estuary, harbour, bay – unspecified
Swimming, paddling or wading – swimming pool – public Fell or wandered into – lake, lagoon, dam, water hole Swimming, paddling or wading – swimming pool – other Fell or wandered into – irrigation canal, drain, trench Swimming, paddling or wading – swimming pool – unspecified
Fell or wandered into – object containing water or other liquid
Swimming, paddling or wading – surf beach Fell or wandered into – other Swimming, paddling or wading – ocean, river, estuary, harbour, bay
Fell or wandered into – unspecified
Swimming, paddling or wading – lake, lagoon, dam, water hole
Fell from bridge, wharf or other structure
Swimming, paddling or wading – irrigation channel, drain, trench
Drowned in bathtub
Swimming, paddling or wading – other Accident to watercraft, submersion – motor – river Swimming, paddling or wading – unspecified Accident to watercraft, submersion – motor – estuary, harbour,
bay Surfboard riding Accident to watercraft, submersion – motor – lake, lagoon, dam Waterskiing Accident to watercraft, submersion – motor – ocean Swept off rock or break water – fishing Accident to watercraft, submersion – motor – unspecified Swept off rock or break water – other Accident to watercraft, submersion – non motor – river Swept off rock or break water – unspecified Accident to watercraft, submersion – non motor – estuary,
harbour, bay Skindiving, spear fishing – using SCUBA equipment Accident to watercraft, submersion – non motor–lake, lagoon,
dam Skindiving, spear fishing – other Accident to watercraft, submersion – non motor – ocean Skindiving, spear fishing – unspecified Accident to watercraft, submersion – non motor – unspecified Attempting a rescue – surf beach Accident to watercraft, submersion‐unspecified craft– river Attempting a rescue – public swimming pool Accident to watercraft, submersion‐unspecified craft– estuary,
harbour, bay Attempting a rescue – other Accident to watercraft, submersion‐unspecified craft– lake,
lagoon, dam Attempting a rescue – unspecified Accident to watercraft, submersion‐unspecified craft– ocean Fell or wandered into – swimming pool – private Accident to watercraft, submersion‐unspecified craft–
unspecified Fell or wandered into – swimming pool – public Other accidental submersion in water transport Fell or wandered into – swimming pool – other Drowning caused by cataclysm or other environmental factors Fell or wandered into – swimming pool – unspecified Incidental drowning Fell or wandered into – ocean, river, estuary, harbour, bay – fishing
Other unspecified circumstances
Fell or wandered into – ocean, river, estuary, harbour, bay – other
© AWSC August 2008 10
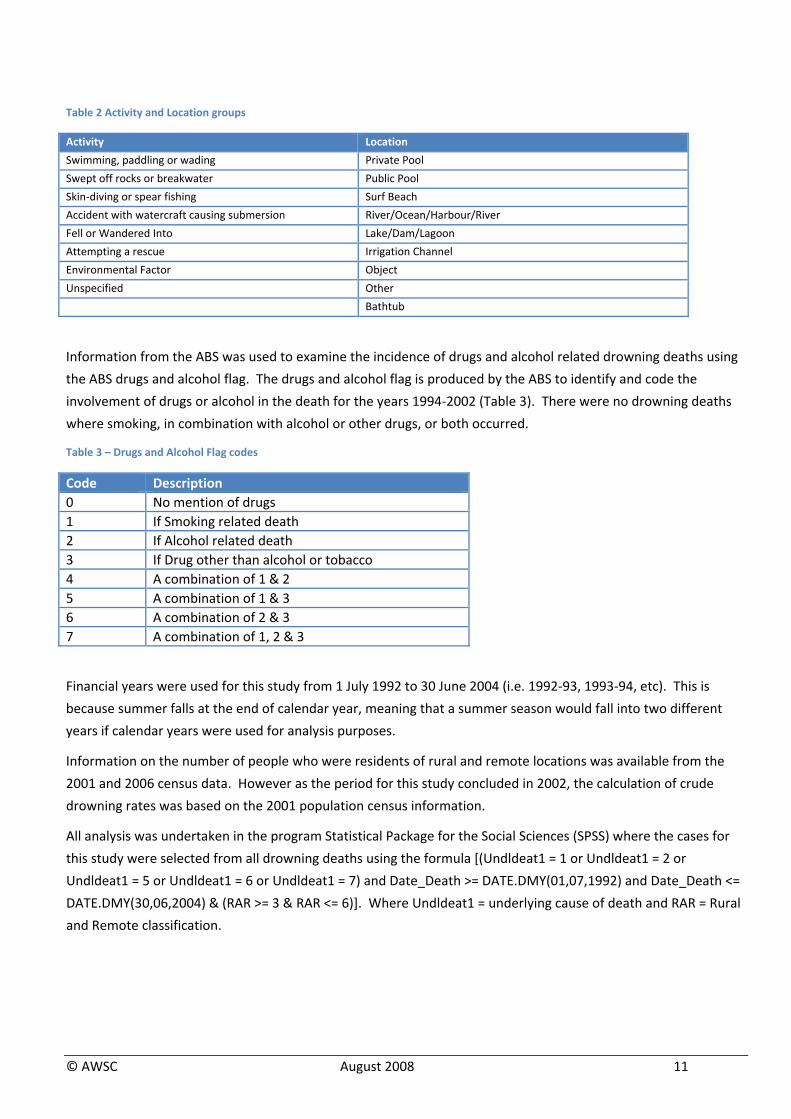
Table 2 Activity and Location groups
Activity Location
Swimming, paddling or wading Private Pool
Swept off rocks or breakwater Public Pool
Skin‐diving or spear fishing Surf Beach
Accident with watercraft causing submersion River/Ocean/Harbour/River
Fell or Wandered Into Lake/Dam/Lagoon
Attempting a rescue Irrigation Channel
Environmental Factor Object
Unspecified Other
Bathtub
Information from the ABS was used to examine the incidence of drugs and alcohol related drowning deaths using
the ABS drugs and alcohol flag. The drugs and alcohol flag is produced by the ABS to identify and code the
involvement of drugs or alcohol in the death for the years 1994‐2002 (Table 3). There were no drowning deaths
where smoking, in combination with alcohol or other drugs, or both occurred.
Table 3 – Drugs and Alcohol Flag codes
Code Description 0 No mention of drugs 1 If Smoking related death 2 If Alcohol related death 3 If Drug other than alcohol or tobacco 4 A combination of 1 & 2 5 A combination of 1 & 3 6 A combination of 2 & 3 7 A combination of 1, 2 & 3
Financial years were used for this study from 1 July 1992 to 30 June 2004 (i.e. 1992‐93, 1993‐94, etc). This is
because summer falls at the end of calendar year, meaning that a summer season would fall into two different
years if calendar years were used for analysis purposes.
Information on the number of people who were residents of rural and remote locations was available from the
2001 and 2006 census data. However as the period for this study concluded in 2002, the calculation of crude
drowning rates was based on the 2001 population census information.
All analysis was undertaken in the program Statistical Package for the Social Sciences (SPSS) where the cases for
this study were selected from all drowning deaths using the formula [(Undldeat1 = 1 or Undldeat1 = 2 or
Undldeat1 = 5 or Undldeat1 = 6 or Undldeat1 = 7) and Date_Death >= DATE.DMY(01,07,1992) and Date_Death <=
DATE.DMY(30,06,2004) & (RAR >= 3 & RAR <= 6)]. Where Undldeat1 = underlying cause of death and RAR = Rural
and Remote classification.
© AWSC August 2008 11
NCIS
The NCIS was examined for all drowning deaths in Australia between 1 July 2002 and 30 June 2007 using the
following search criteria:
• Mechanism – Threats to Breathing – Drowning and Immersion
• Key words ‘drown’ and ‘immersion’ searched for in Findings
• Key words ‘drown’ and ‘immersion’ searched for in Police Reports
• Key words ‘drown’ and ‘immersion’ searched for in Autopsy Reports
• Key words ‘drown’ and ‘immersion’ searched for in Cause of Death
• Aquatic locations
Cases identified were then matched with information from the Royal Life Saving drowning reports from 2002‐
2003 to 2006‐2007, which is collected by Royal Life Saving Branches and analysed by the National Office.
Information is collected from State and Territory Coronial Offices, the NCIS and media reports 17. This was
undertaken to ensure that all drowning deaths were identified.
There were 99 RLSSA cases unable to be matched to NCIS records. The majority of these drowning deaths (79)
were in Queensland, followed by Western Australia (16), Tasmania (3) and South Australia, (1). To ensure all
relevant cases were included and due to the significant delay in reported deaths being added to the NCIS by the
Queensland Coroner’s Office, a separate provision of information from the Queensland Coroner’s Office was
provided. Further information was also requested from the NCIS so that all duplicate cases were identified and
removed from the analysis (there were a couple of cases that were entered into the NCIS system twice).
Cases initially identified as self inflicted harm or assault in the NCIS database, even though there was no finding
document or ruling by the coroner, were only excluded if:
• The intent notification and/or intent completion identified the case as self inflicted harm or assault, and
• The case on the basis of information available in the autopsy report, finding document or police report
also identified the case as self inflicted harm or assault, or
• This information included details of the deceased person’s history of mental illness, depression, previous
suicide attempts or conversations with friends or family about taking their own life.
Crocodile and shark attacks or cases where only part of a body was found that were unlikely to be drowning were
excluded while cases where skeletal remains had been found or no body recovered that did not have a ruling
from the coroner but were likely to have been a drowning death were included in this study.
The activity, location, alcohol involvement, age, sex, country of birth, postcode of residence and postcode of the
incident were recorded for each case where it was available. The use of police, autopsy and toxicology reports
and finding documents were used to gain further information on each case and the circumstances surrounding
the drowning death; however this information was not always available. Data from the identified cases was
entered into Excel spreadsheets and analysis was undertaken using SPSS 18.
A set of postcodes based on the ASGC classification was used to define the ‘time location’ and ‘residential’
postcodes of each drowning case. Each drowning case was classified manually into major cities, inner regional,
outer regional, remote and very remote depending on the time location and residential postcode of the drowning
© AWSC August 2008 12
incident. Migratory is the last ASGC remoteness category which includes areas composed of off‐ shore, shipping
and migratory CDs; however there were no drowning cases that fell within this category (Appendix 1).
The remoteness specific information that was analysed included cases from outer regional, remote and very
remote areas of Australia.
Because the ASGC has been developed using collection districts (CD), many SLAs and postcodes fall into two or
more RAs19. Therefore, a formula was devised: if one SLA or postcode could be classified into two or more RA
categories, the classification of the least remote was used, unless the more remote ASGC RA contained more than
four times the number of postcodes as the previous remoteness category (e.g. the SLA of Light (DC) contained
one CD in Major Cities of Australia and 21 CDs in Inner Regional areas of Australia and was thus classified as Inner
Regional). There were three cases where the postcode contained three or more remoteness categories; for these
three the middle RA was used.
NCIS data entry of postcodes is based on Australia Post and Victorian Department of Human Services
suburb/postcode listings; however, there were seven drowning cases in this study where the postcodes were not
provided in the ASGC classification. Therefore, these were coded according to the next closest postcode using the
same methodology if one postcode had two remoteness categories.
RLSSA activity and location codes were used to create consistencies with the recording and reporting of the
drowning deaths identified in Australia. The RLSSA codes provide greater detail than the NCIS, as these codes are
often missing in the NCIS database. Activities and locations that consisted of a small number of drowning deaths
and were not already covered in the RLSSA codes were classified as ‘Other’.
There were few drowning deaths among individuals aged above 85 years and these were therefore grouped
together as 85 years+.
Population statistics by age and sex for each of the ASGC remoteness categories within each State and Territory
were collected from the 2001 ABS Census data. The drowning rate was then calculated by dividing the drowning
deaths identified within each remoteness category by the population in the same remoteness category and then
multiplied by 100,000. This enabled drowning deaths in Australia to be examined by the rate per 100,000 people
by age, sex, state and RA.
In some instances information within a drowning case was unknown, due to:
• The case being open and the coroner still enquiring into the death
• The identity of the person who died was unknown
• The body was not located or the body was heavily decomposed
• A doctor was unable to sign a death certificate giving the causes of death
• The coroner was unable to make a ruling on circumstances surrounding the drowning death
• The residential address of the deceased was not applicable as they were a homeless person or a tourist
from overseas 20.
© AWSC August 2008 13
Visitor Status
A Visitor was defined as a person who drowned in a postcode other than the postcode they were living in.
ABS
In the ABS data there were 4,014 drowning deaths between 1 July 2002 and 30 June 2004. Of these 812 (20.2%)
were residents of rural and remote locations.
In the ABS data visitor information is based on the State or Territory in which the person drowned compared to
their residential location. In the NCIS data visitor status is worked out by comparing their residential postcode to
the postcode for the locations where the drowning incident occurred.
NCIS
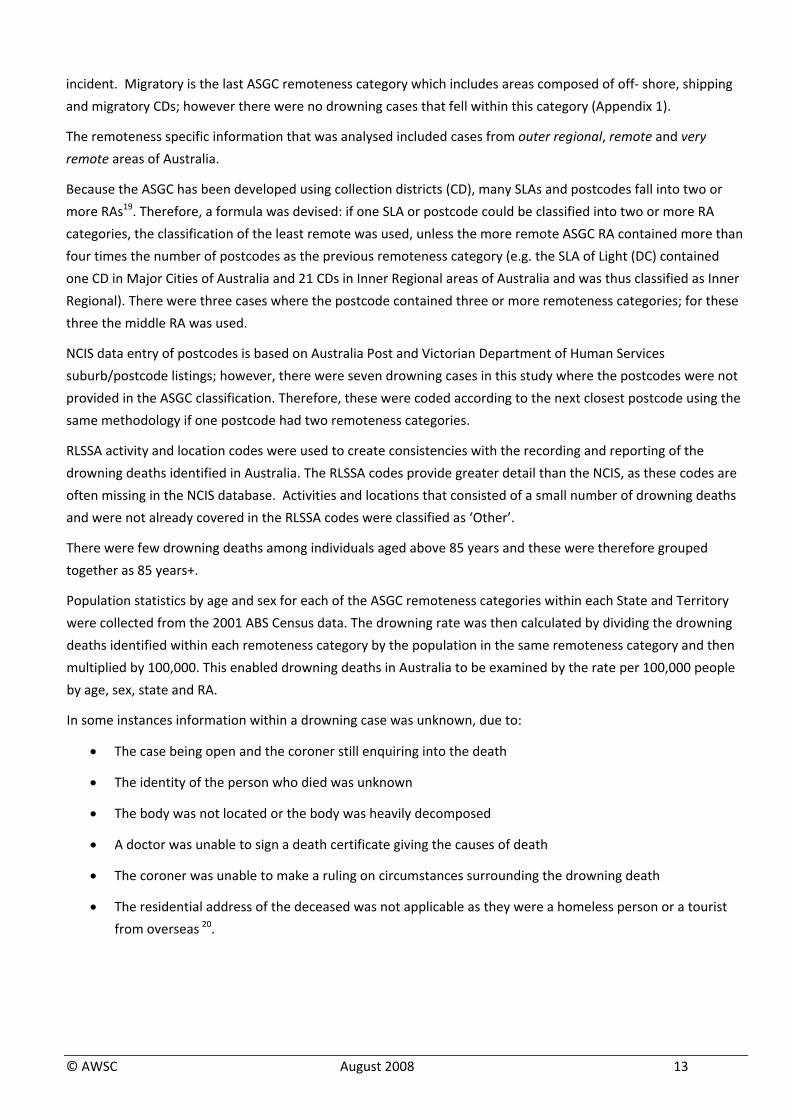
In the NCIS data there were 1,510 drowning deaths. Of these 251 (16.6%) were of residents of rural and remote
locations and 352 occurred in rural and remote locations (Figure 2).
For residents of rural and remote locations (n=251), they may have:
• Been visiting an urban location (18),
• Been a visitor in another rural and remote location (70),
• Drowned in the postcode in which they lived (150), or
• An unknown status (13). (Figure 2)
For people who drowned in a rural and remote location (352), the drowned person may have:
• Been an urban resident visiting a rural and remote location (85),
• Been a resident of a rural and remote location who drowned in a different rural or remote location (70),
• Been a visitor from overseas (36),
• Been a resident of a rural or remote location who drowned in the same postcode in which they lived
(148), or
• An unknown visitor status (13). (Figure 2)
Figure 2 NCIS Data by Visitor Status
© AWSC August 2008 14
Results
The information from the analysis will be examined in two sections: residents of rural and remote locations using
ABS (812 cases) and NCIS data (251 cases); and by people who drowned in rural and remote locations by NCIS
data (352 cases). The analysis of 812 cases from the ABS information will provide an overview of drowning deaths
of residents of rural and remote locations only. The NCIS data explores the 251 resident drowning deaths,
including by high risk age groups (0‐4 years, 18‐34 years and 55+ years) identified in the Draft Australian Water
Safety Strategy 2008‐2011. The NCIS data also explores the 352 drowning deaths of people in rural and remote
locations. This information is then further analysed by common locations (rivers, oceans and beaches).
ABS Residents of rural and remote locations
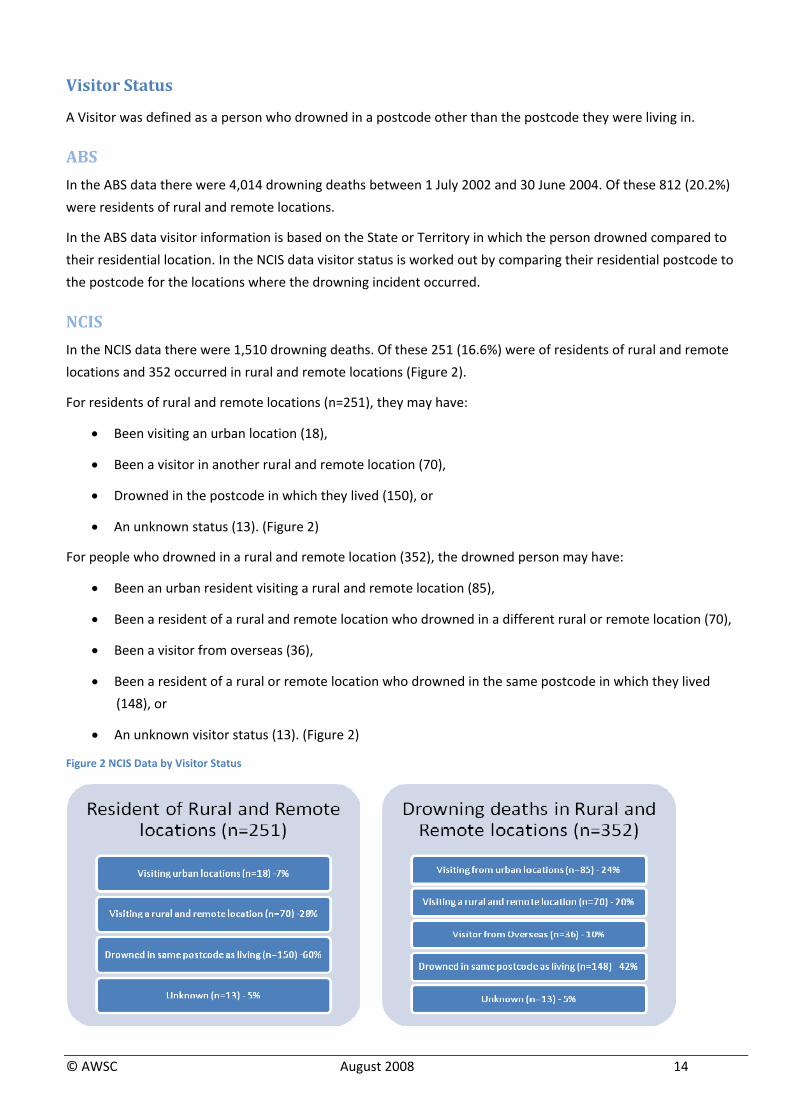
There were 812 residents of rural and remote locations who drowned in Australia between 1 July 1992 and 30
June 2004. This is an average 62 deaths per annum (ranging from 92 in 1992‐1993 to 34 in 2003‐2004) (Figure 3).
Figure 3 Number of drowning deaths per annum by sex, residents of rural and remote locations, 1 July 1992 to 30 June 2004, ABS (n=812)
Of the 812 drowning deaths, the majority (78.8%) were males with an average age of 21.0 years, which was
significantly younger than females (25.5 years). The most common age groups were 0‐4 years (19.1%), 25‐29
years (10.0%) and 35‐39 Years (8.4%) and there were four cases where the age was unknown (Table 4). The age
group patterns for males were similar to the overall age group pattern; however, the most common age groups
for females were 0‐4 years (34.5%), 5‐9 years (7.1%) and 25‐29 years (6.0%).
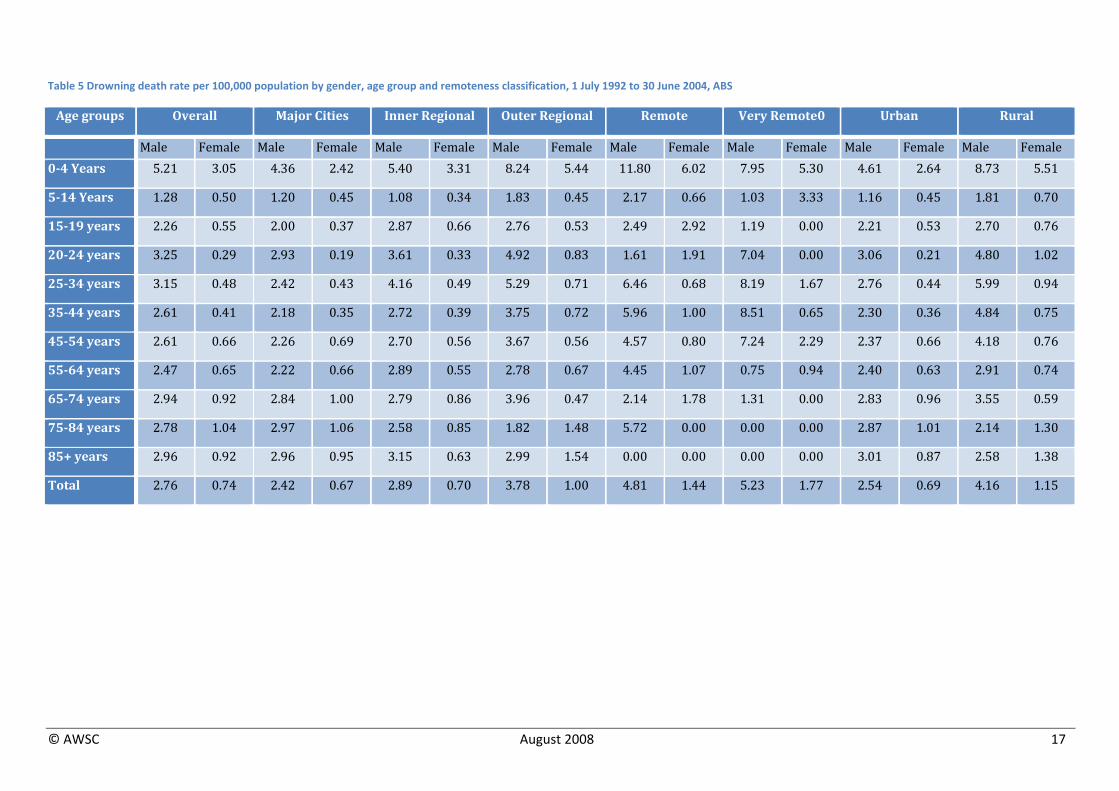
The overall crude rate of drowning deaths for rural and remote males was 4.16 per 100,000 compared to 2.54 per
100,000 for urban males. The overall crude drowning rate for rural and remote females was 1.15 per 100,000,
compared to 0.69 per 100,000 for urban females. This was also reflected in the 0‐4 years olds where the
residents of rural and remote locations drowning death rate was 8.73 per 100,000 males and 5.51 per 100,000
females compared to the residents of urban locations drowning death rate 0‐4 years of 4.61 per 100,000 males
and 2.64 per 100,000 females. (Table 5)
© AWSC August 2008 15
© AWSC August 2008 16
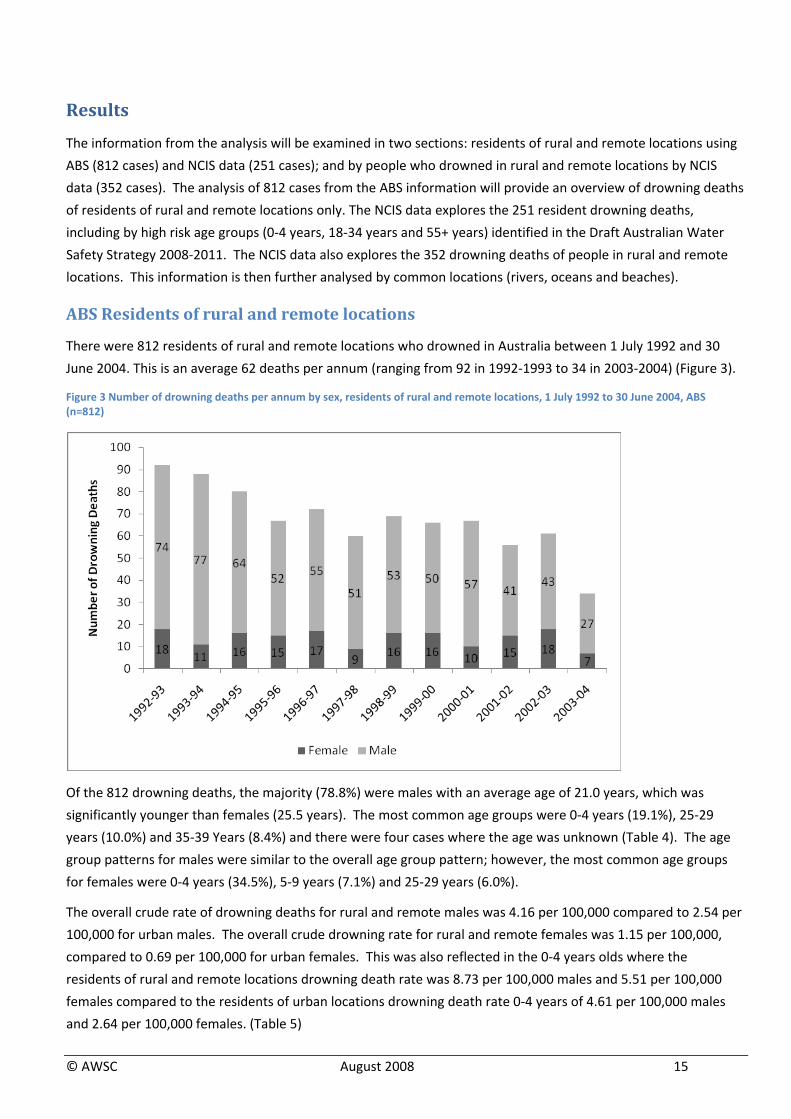
Table 4 Age groups by sex, residents of rural and remote locations, 1 July 1992 to 30 June 2004, ABS
Male Female Total
Age group N % N % N %04 Years 97 15.2 58 34.5 155 19.259 Years 26 4.1 12 7.1 38 4.71014 Years 18 2.8 3 1.8 21 2.61519 Years 28 4.4 8 4.8 36 4.52024 Years 41 6.4 8 4.8 49 6.12529 Years 71 11.1 10 6.0 81 10.03034 Years 53 8.3 9 5.4 62 7.73539 Years 60 9.4 8 4.8 68 8.44044 Years 54 8.4 9 5.4 63 7.84549 Years 51 8.0 8 4.8 59 7.35054 Years 39 6.1 7 4.2 46 5.75559 Years 26 4.1 8 4.8 34 4.26064 Years 23 3.6 3 1.8 26 3.26569 Years 19 3.0 2 1.2 21 2.67074 Years 21 3.3 4 2.4 25 3.17579 Years 9 1.4 7 4.2 16 2.08084 Years 2 0.3 1 0.6 3 0.48589 Years 2 0.3 3 1.8 5 0.6
Total 640 100.0 168 100.0 808 100.0
Note there were four male cases where age was unknown
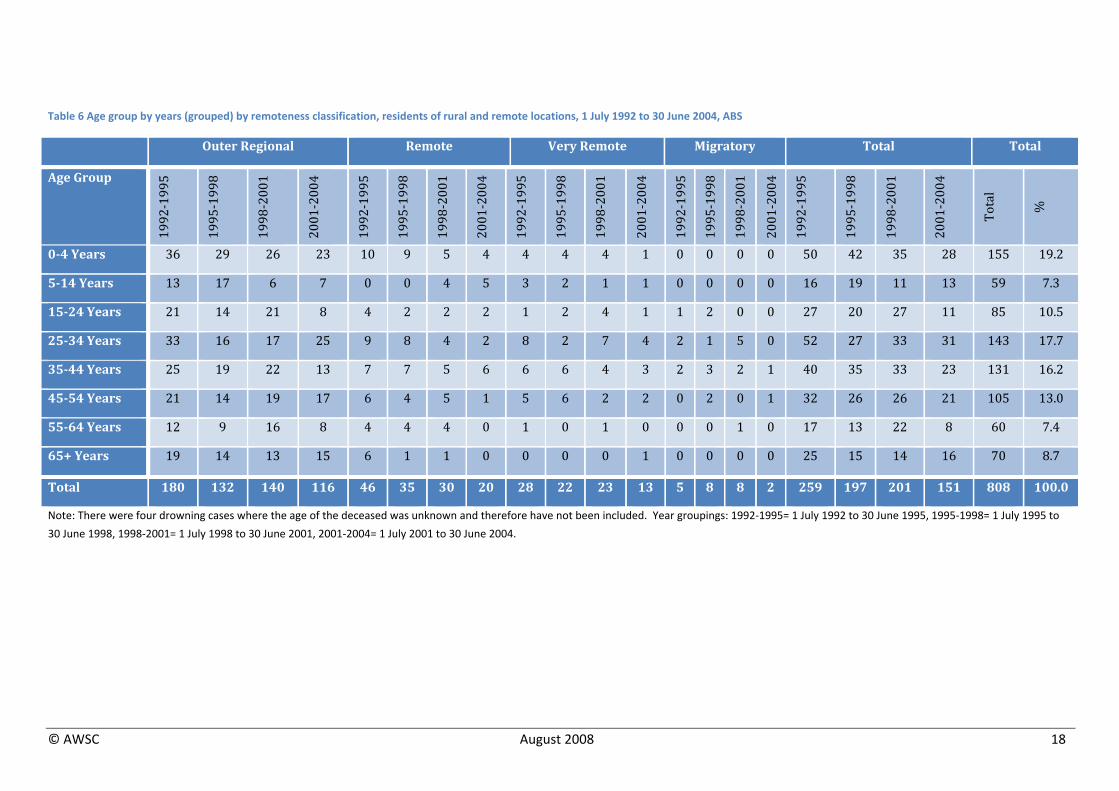
Residents of outer regional areas comprised the greater proportion (71.0%) of drowning deaths with an average
of 47 deaths per annum (Table 6). The crude rate for outer regional was 3.78 per 100,000 males and 1.00 per
100,000 females. For 0‐4 year olds in outer regional areas the drowning deaths rate was 8.24 per 100,000 for
males and 5.44 per 100,000 for females.
Residents of remote locations comprised 16.1% of all drowning deaths of residents of rural and remote locations,
with an average of 11 deaths per annum (Table 6), a crude rate of 4.81 per 100,000 males and 1.44 per 100,000
females. For 0‐4 year olds residents of remote locations the drowning rate was 11.80 per 100,000 males and 6.02
per 100,000 females.
Residents of very remote locations comprised 10.1% of all drowning deaths of residents of rural and remote
locations, with an average of seven deaths per annum (Table 6), a crude rate of 5.23 per 100,000 males and 1.77
per 100,000 females. For 0‐4 year olds the drowning rate was 7.95 per 100,000 males and 5.30 per 100,000
females.
© AWSC August 2008 17
Table 5 Drowning death rate per 100,000 population by gender, age group and remoteness classification, 1 July 1992 to 30 June 2004, ABS
Age groups Overall Major Cities Inner Regional Outer Regional Remote Very Remote0 Urban Rural
Male Female Male Female Male Female Male Female Male Female Male Female Male Female Male Female 04 Years 5.21 3.05 4.36 2.42 5.40 3.31 8.24 5.44 11.80 6.02 7.95 5.30 4.61 2.64 8.73 5.51
514 Years 1.28 0.50 1.20 0.45 1.08 0.34 1.83 0.45 2.17 0.66 1.03 3.33 1.16 0.45 1.81 0.70
1519 years 2.26 0.55 2.00 0.37 2.87 0.66 2.76 0.53 2.49 2.92 1.19 0.00 2.21 0.53 2.70 0.76
2024 years 3.25 0.29 2.93 0.19 3.61 0.33 4.92 0.83 1.61 1.91 7.04 0.00 3.06 0.21 4.80 1.02
2534 years 3.15 0.48 2.42 0.43 4.16 0.49 5.29 0.71 6.46 0.68 8.19 1.67 2.76 0.44 5.99 0.94
3544 years 2.61 0.41 2.18 0.35 2.72 0.39 3.75 0.72 5.96 1.00 8.51 0.65 2.30 0.36 4.84 0.75
4554 years 2.61 0.66 2.26 0.69 2.70 0.56 3.67 0.56 4.57 0.80 7.24 2.29 2.37 0.66 4.18 0.76
5564 years 2.47 0.65 2.22 0.66 2.89 0.55 2.78 0.67 4.45 1.07 0.75 0.94 2.40 0.63 2.91 0.74
6574 years 2.94 0.92 2.84 1.00 2.79 0.86 3.96 0.47 2.14 1.78 1.31 0.00 2.83 0.96 3.55 0.59
7584 years 2.78 1.04 2.97 1.06 2.58 0.85 1.82 1.48 5.72 0.00 0.00 0.00 2.87 1.01 2.14 1.30
85+ years 2.96 0.92 2.96 0.95 3.15 0.63 2.99 1.54 0.00 0.00 0.00 0.00 3.01 0.87 2.58 1.38
Total 2.76 0.74 2.42 0.67 2.89 0.70 3.78 1.00 4.81 1.44 5.23 1.77 2.54 0.69 4.16 1.15
© AWSC August 2008 18
Table 6 Age group by years (grouped) by remoteness classification, residents of rural and remote locations, 1 July 1992 to 30 June 2004, ABS
Outer Regional Remote Very Remote Migratory Total Total
Age Group 1992‐1995
1995‐1998
1998‐2001
2001‐2004
1992‐1995
1995‐1998
1998‐2001
2001‐2004
1992‐1995
1995‐1998
1998‐2001
2001‐2004
1992‐1995
1995‐1998
1998‐2001
2001‐2004
1992‐1995
1995‐1998
1998‐2001
2001‐2004
Total
%
04 Years 36 29 26 23 10 9 5 4 4 4 4 1 0 0 0 0 50 42 35 28 155 19.2
514 Years 13 17 6 7 0 0 4 5 3 2 1 1 0 0 0 0 16 19 11 13 59 7.3
1524 Years 21 14 21 8 4 2 2 2 1 2 4 1 1 2 0 0 27 20 27 11 85 10.5
2534 Years 33 16 17 25 9 8 4 2 8 2 7 4 2 1 5 0 52 27 33 31 143 17.7
3544 Years 25 19 22 13 7 7 5 6 6 6 4 3 2 3 2 1 40 35 33 23 131 16.2
4554 Years 21 14 19 17 6 4 5 1 5 6 2 2 0 2 0 1 32 26 26 21 105 13.0
5564 Years 12 9 16 8 4 4 4 0 1 0 1 0 0 0 1 0 17 13 22 8 60 7.4
65+ Years 19 14 13 15 6 1 1 0 0 0 0 1 0 0 0 0 25 15 14 16 70 8.7
Total 180 132 140 116 46 35 30 20 28 22 23 13 5 8 8 2 259 197 201 151 808 100.0
Note: There were four drowning cases where the age of the deceased was unknown and therefore have not been included. Year groupings: 1992‐1995= 1 July 1992 to 30 June 1995, 1995‐1998= 1 July 1995 to
30 June 1998, 1998‐2001= 1 July 1998 to 30 June 2001, 2001‐2004= 1 July 2001 to 30 June 2004.
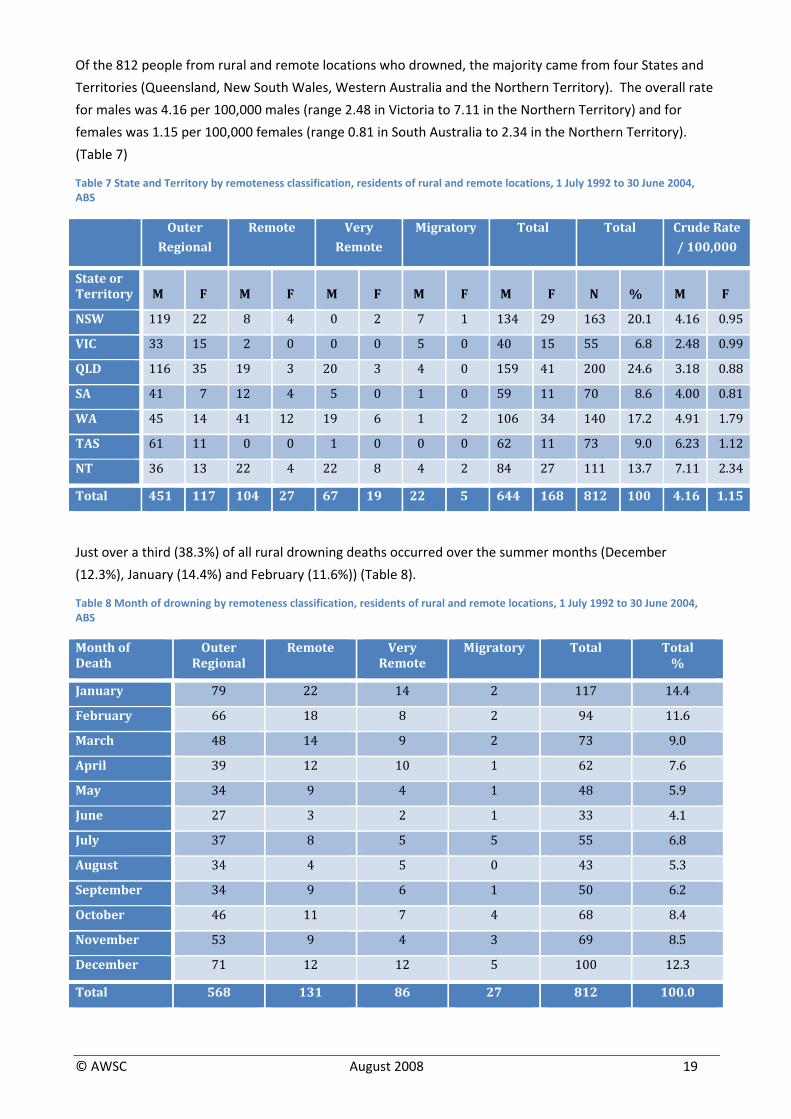
Of the 812 people from rural and remote locations who drowned, the majority came from four States and
Territories (Queensland, New South Wales, Western Australia and the Northern Territory). The overall rate
for males was 4.16 per 100,000 males (range 2.48 in Victoria to 7.11 in the Northern Territory) and for
females was 1.15 per 100,000 females (range 0.81 in South Australia to 2.34 in the Northern Territory).
(Table 7)
Table 7 State and Territory by remoteness classification, residents of rural and remote locations, 1 July 1992 to 30 June 2004, ABS
Outer
Regional
Remote Very
Remote
Migratory Total Total Crude Rate
/ 100,000
State or Territory M F M F M F M F M F N % M F
NSW 119 22 8 4 0 2 7 1 134 29 163 20.1 4.16 0.95
VIC 33 15 2 0 0 0 5 0 40 15 55 6.8 2.48 0.99
QLD 116 35 19 3 20 3 4 0 159 41 200 24.6 3.18 0.88
SA 41 7 12 4 5 0 1 0 59 11 70 8.6 4.00 0.81
WA 45 14 41 12 19 6 1 2 106 34 140 17.2 4.91 1.79
TAS 61 11 0 0 1 0 0 0 62 11 73 9.0 6.23 1.12
NT 36 13 22 4 22 8 4 2 84 27 111 13.7 7.11 2.34
Total 451 117 104 27 67 19 22 5 644 168 812 100 4.16 1.15
Just over a third (38.3%) of all rural drowning deaths occurred over the summer months (December
(12.3%), January (14.4%) and February (11.6%)) (Table 8).
Table 8 Month of drowning by remoteness classification, residents of rural and remote locations, 1 July 1992 to 30 June 2004, ABS
Month of Death
Outer Regi al on
Remote Very Re te mo
Migratory Total Total %
January 79 22 14 2 1 17 14.4
February 66 18 8 2 94 11.6
March 48 14 9 2 73 9.0
April 39 12 10 1 62 7.6
May 34 9 4 1 48 5.9
June 27 3 2 1 33 4.1
July 37 8 5 5 55 6.8
August 34 4 5 0 43 5.3
September 34 9 6 1 50 6.2
October 46 11 7 4 68 8.4
November 53 9 4 3 69 8.5
December 71 12 12 5 100 12.3
Total 568 131 86 27 812 100.0
© AWSC August 2008 19
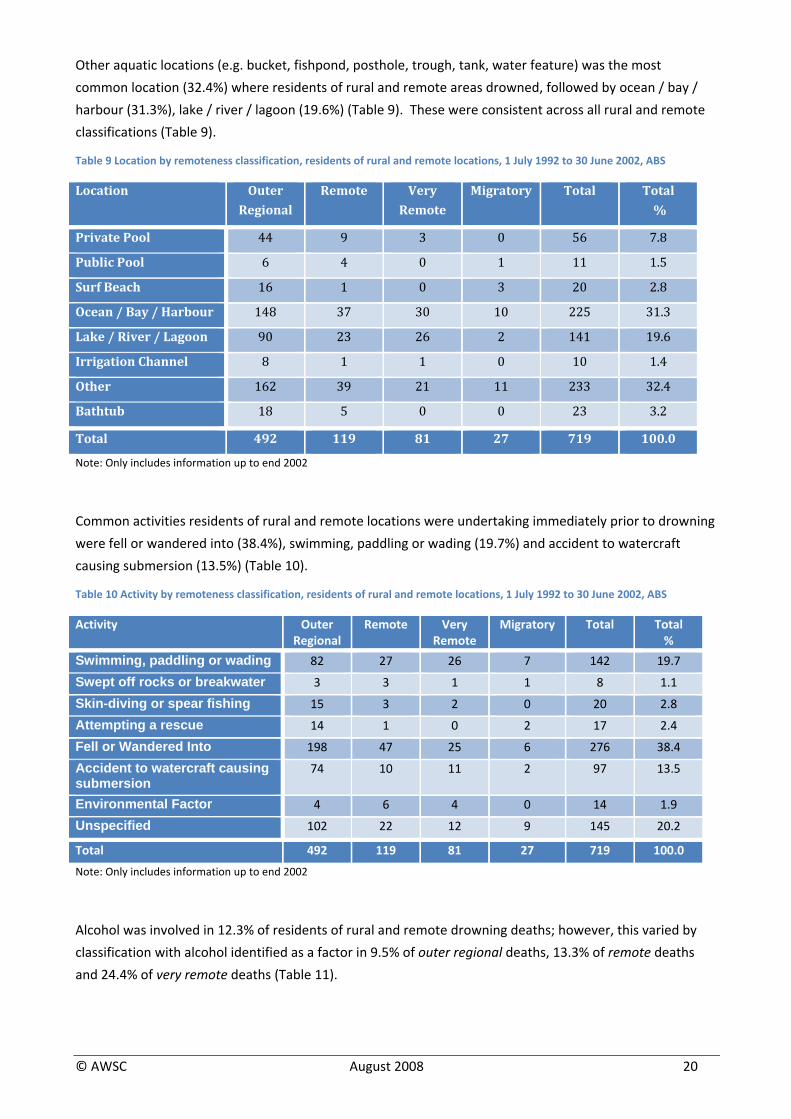
Other aquatic locations (e.g. bucket, fishpond, posthole, trough, tank, water feature) was the most
common location (32.4%) where residents of rural and remote areas drowned, followed by ocean / bay /
harbour (31.3%), lake / river / lagoon (19.6%) (Table 9). These were consistent across all rural and remote
classifications (Table 9).
Table 9 Location by remoteness classification, residents of rural and remote locations, 1 July 1992 to 30 June 2002, ABS
Location Outer Reg al ion
Remote Very Remote
Migratory Total Total %
Private Pool 44 9 3 0 56 7.8
Public Pool 6 4 0 1 11 1.5
Surf Beach 16 1 0 3 20 2.8
Ocean / Bay / Harbour 1 48 37 30 10 225 31.3
Lake / River / Lagoon 90 23 26 2 1 41 19.6
Irrigation Channel 8 1 1 0 10 1.4
Other 1 62 39 21 11 2 33 32.4
Bathtub 18 5 0 0 23 3.2
Total 492 119 81 27 719 100.0
Note: Only includes information up to end 2002
Common activities residents of rural and remote locations were undertaking immediately prior to drowning
were fell or wandered into (38.4%), swimming, paddling or wading (19.7%) and accident to watercraft
causing submersion (13.5%) (Table 10).
Table 10 Activity by remoteness classification, residents of rural and remote locations, 1 July 1992 to 30 June 2002, ABS
Activity Outer Regional
Remote Very Remote
Migratory Total Total%
Swimming, paddling or wading 82 27 26 7 142 19.7
Swept off rocks or breakwater 3 3 1 1 8 1.1
Skin-diving or spear fishing 15 3 2 0 20 2.8
Attempting a rescue 14 1 0 2 17 2.4
Fell or Wandered Into 198 47 25 6 276 38.4
Accident to watercraft causing submersion
74 10 11 2 97 13.5
Environmental Factor 4 6 4 0 14 1.9
Unspecified 102 22 12 9 145 20.2
Total 492 119 81 27 719 100.0
Note: Only includes information up to end 2002
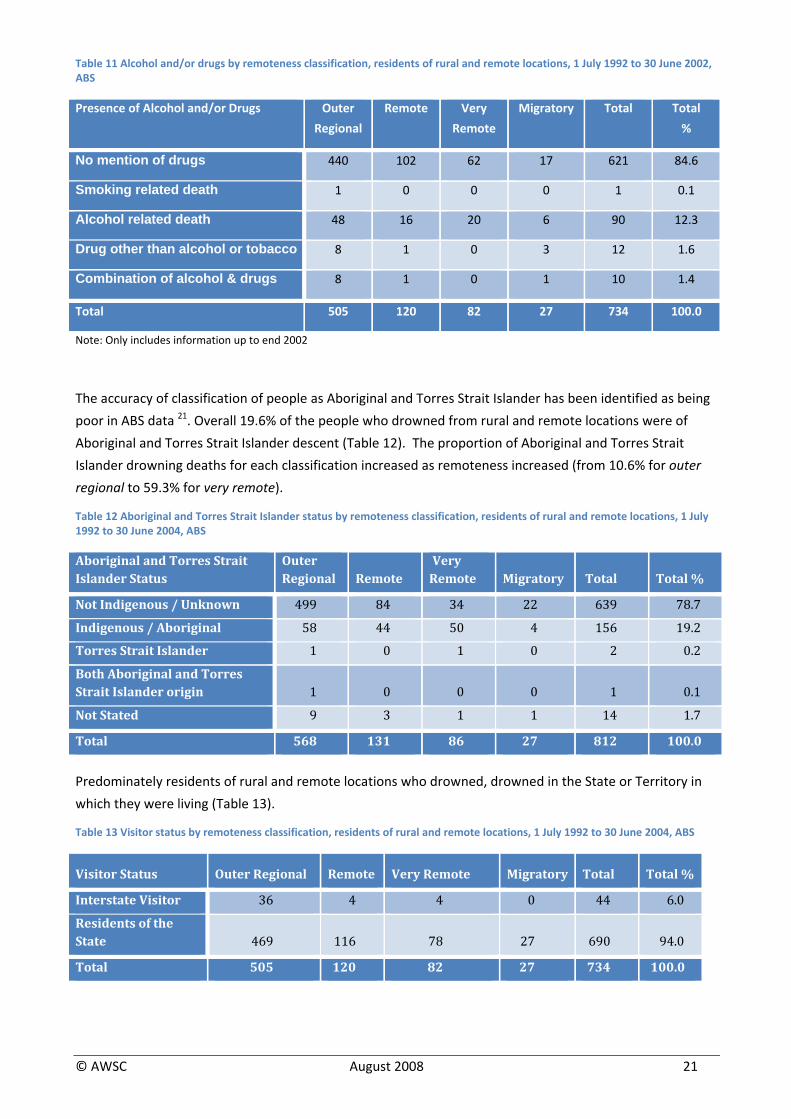
Alcohol was involved in 12.3% of residents of rural and remote drowning deaths; however, this varied by
classification with alcohol identified as a factor in 9.5% of outer regional deaths, 13.3% of remote deaths
and 24.4% of very remote deaths (Table 11).
© AWSC August 2008 20
© AWSC August 2008 21
Table 11 Alcohol and/or drugs by remoteness classification, residents of rural and remote locations, 1 July 1992 to 30 June 2002, ABS
Presence of Alcohol and/or Drugs Outer
Regional
Remote Very
Remote
Migratory Total Total
%
No mention of drugs 440 102 62 17 621 84.6
Smoking related death 1 0 0 0 1 0.1
Alcohol related death 48 16 20 6 90 12.3
Drug other than alcohol or tobacco 8 1 0 3 12 1.6
Combination of alcohol & drugs 8 1 0 1 10 1.4
Total 505 120 82 27 734 100.0
Note: Only includes information up to end 2002
The accuracy of classification of people as Aboriginal and Torres Strait Islander has been identified as being
poor in ABS data 21. Overall 19.6% of the people who drowned from rural and remote locations were of
Aboriginal and Torres Strait Islander descent (Table 12). The proportion of Aboriginal and Torres Strait
Islander drowning deaths for each classification increased as remoteness increased (from 10.6% for outer
regional to 59.3% for very remote).
Table 12 Aboriginal and Torres Strait Islander status by remoteness classification, residents of rural and remote locations, 1 July 1992 to 30 June 2004, ABS
Aboriginal and Torres Strait Islander Status
Outer Re al gion Remote
Very Remote Migratory Total Tot al %
Not Indigenous / Unknown 499 84 34 22 639 78.7
Indigenous / Aboriginal 58 44 50 4 156 19.2
Torres Strait Islander 1 0 1 0 2 0.2
Both Aboriginal and Torres Strait Islander origin 1 0 0 0 1 0.1
Not Stated 9 3 1 1 14 1.7
Total 568 131 86 27 812 100.0
Predominately residents of rural and remote locations who drowned, drowned in the State or Territory in
which they were living (Table 13).
Table 13 Visitor status by remoteness classification, residents of rural and remote locations, 1 July 1992 to 30 June 2004, ABS
Visitor Status Outer R ional eg Remote Very Remote Migratory To tal Total %
Interstate Visitor 36 4 4 0 44 6.0
Residents of the State 469 116 78 27 690 94.0
Total 505 120 82 27 734 100.0
NCIS
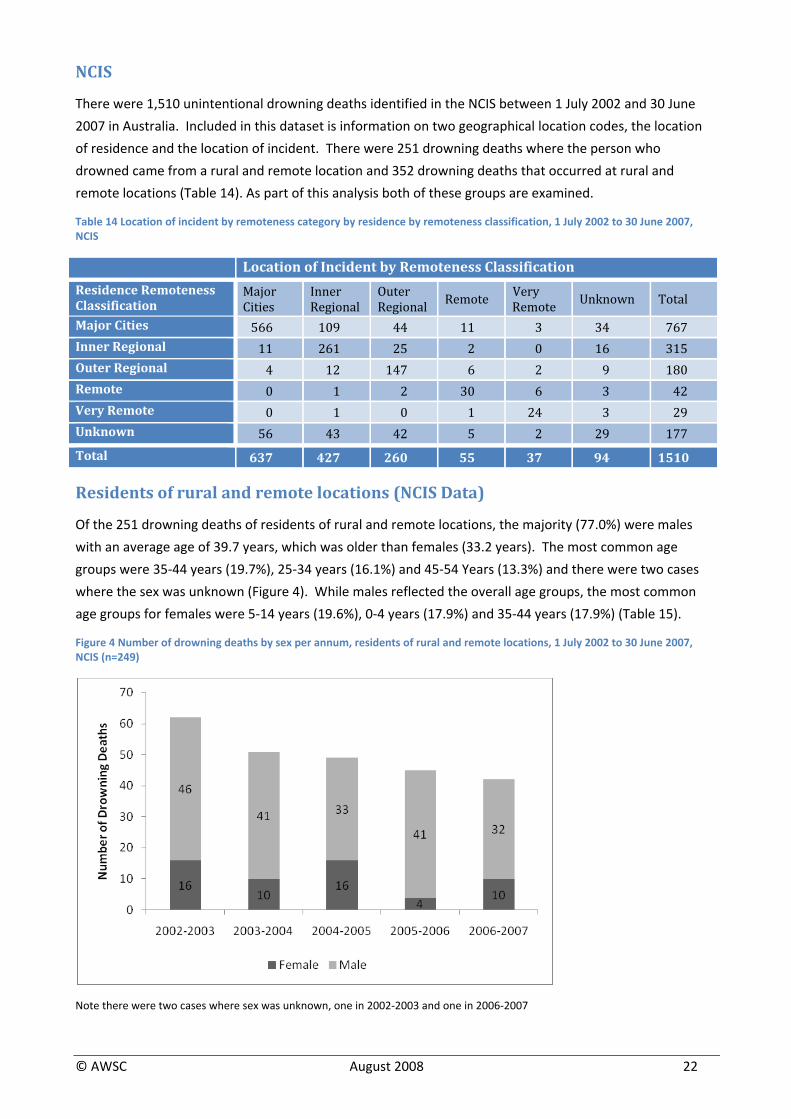
There were 1,510 unintentional drowning deaths identified in the NCIS between 1 July 2002 and 30 June
2007 in Australia. Included in this dataset is information on two geographical location codes, the location
of residence and the location of incident. There were 251 drowning deaths where the person who
drowned came from a rural and remote location and 352 drowning deaths that occurred at rural and
remote locations (Table 14). As part of this analysis both of these groups are examined.
Table 14 Location of incident by remoteness category by residence by remoteness classification, 1 July 2002 to 30 June 2007, NCIS
Location o dent mot las tionf Inci by Re eness C sifica
Residence Remoteness Classification
M ajorCities
Inner Regional
Ou terRegional Re te mo Very
Rem te o Unknown Total
Major Cities 566 109 44 11 3 34 767 Inner Regional 11 261 25 2 0 16 315 Outer Regional 4 12 147 6 2 9 180 Remote 0 1 2 30 6 3 42 Very Remote 0 1 0 1 24 3 29 Unknown 56 43 42 5 2 29 177 Total 637 427 260 55 37 94 1510
Residents of rural and remote locations (NCIS Data)
Of the 251 drowning deaths of residents of rural and remote locations, the majority (77.0%) were males
with an average age of 39.7 years, which was older than females (33.2 years). The most common age
groups were 35‐44 years (19.7%), 25‐34 years (16.1%) and 45‐54 Years (13.3%) and there were two cases
where the sex was unknown (Figure 4). While males reflected the overall age groups, the most common
age groups for females were 5‐14 years (19.6%), 0‐4 years (17.9%) and 35‐44 years (17.9%) (Table 15).
Figure 4 Number of drowning deaths by sex per annum, residents of rural and remote locations, 1 July 2002 to 30 June 2007, NCIS (n=249)
Note there were two cases where sex was unknown, one in 2002‐2003 and one in 2006‐2007
© AWSC August 2008 22
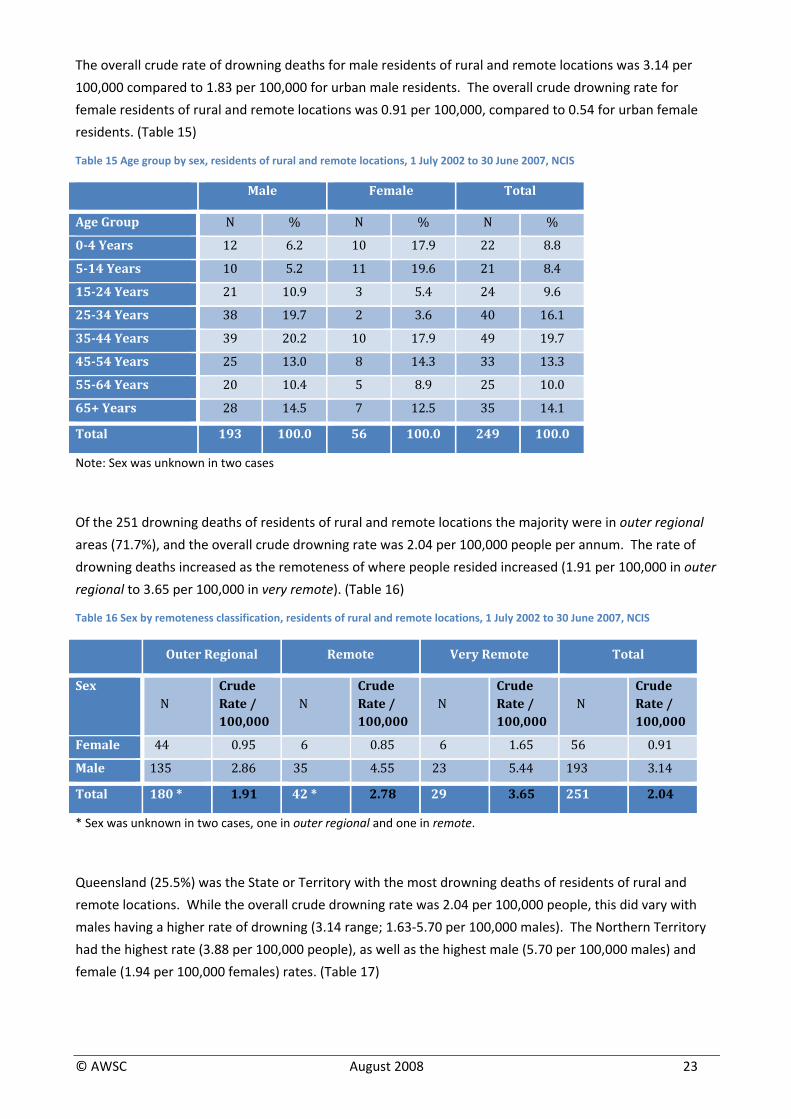
The overall crude rate of drowning deaths for male residents of rural and remote locations was 3.14 per
100,000 compared to 1.83 per 100,000 for urban male residents. The overall crude drowning rate for
female residents of rural and remote locations was 0.91 per 100,000, compared to 0.54 for urban female
residents. (Table 15)
Table 15 Age group by sex, residents of rural and remote locations, 1 July 2002 to 30 June 2007, NCIS
Male Female Total
Age Group N % N % N %
04 Years 12 6.2 10 17.9 22 8.8
514 Years 10 5.2 11 19.6 21 8.4
1524 Years 21 10.9 3 5.4 24 9.6
2534 Years 38 19.7 2 3.6 40 16.1
3544 Years 39 20.2 10 17.9 49 19.7
4554 Years 25 13.0 8 14.3 33 13.3
5564 Years 20 10.4 5 8.9 25 10.0
65+ Years 28 14.5 7 12.5 35 14.1
Total 193 100.0 56 100.0 249 100.0
Note: Sex was unknown in two cases
Of the 251 drowning deaths of residents of rural and remote locations the majority were in outer regional
areas (71.7%), and the overall crude drowning rate was 2.04 per 100,000 people per annum. The rate of
drowning deaths increased as the remoteness of where people resided increased (1.91 per 100,000 in outer
regional to 3.65 per 100,000 in very remote). (Table 16)
Table 16 Sex by remoteness classification, residents of rural and remote locations, 1 July 2002 to 30 June 2007, NCIS
Outer Regional Remote Very Remote Total
Sex N
Crude Rate / 100,000
N Crude Rate / 100,000
N Crude Rate / 100,000
N Crude Rate / 100,000
Female 44 0.95 6 0.85 6 1.65 56 0.91
Male 135 2.86 35 4.55 23 5.44 193 3.14
Total 180 * 1.91 42 * 2.78 29 3.65 251 2.04
* Sex was unknown in two cases, one in outer regional and one in remote.
Queensland (25.5%) was the State or Territory with the most drowning deaths of residents of rural and
remote locations. While the overall crude drowning rate was 2.04 per 100,000 people, this did vary with
males having a higher rate of drowning (3.14 range; 1.63‐5.70 per 100,000 males). The Northern Territory
had the highest rate (3.88 per 100,000 people), as well as the highest male (5.70 per 100,000 males) and
female (1.94 per 100,000 females) rates. (Table 17)
© AWSC August 2008 23
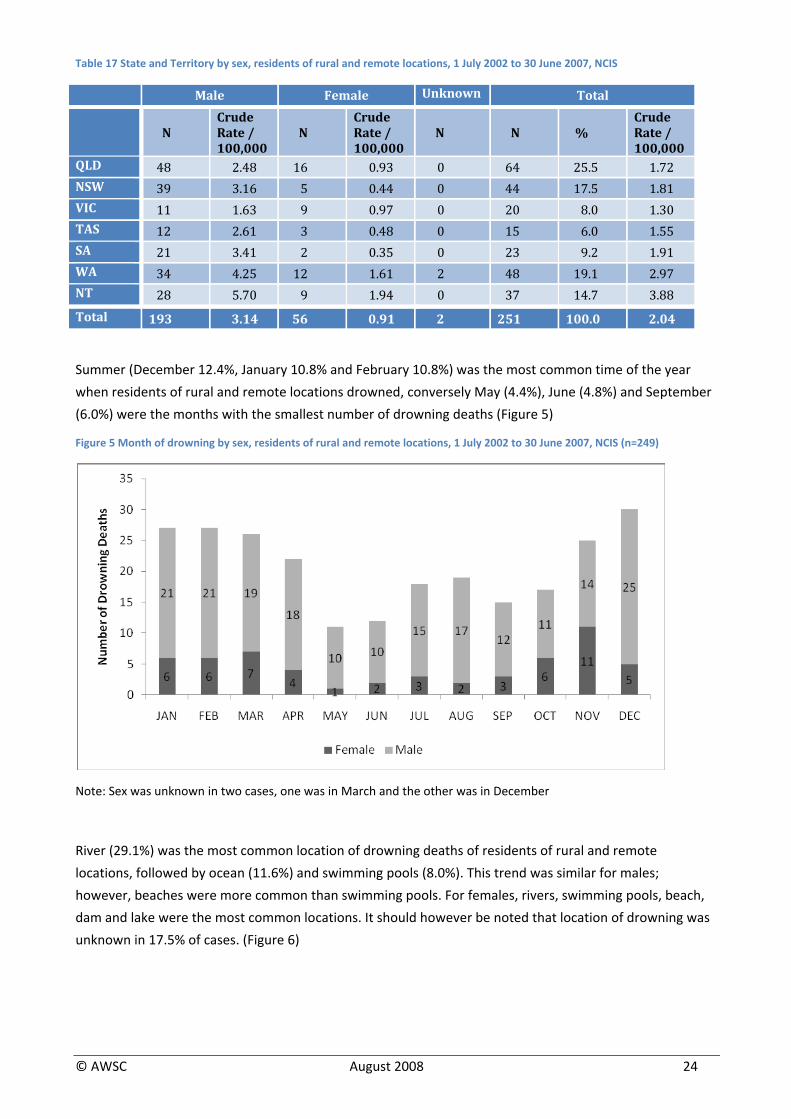
Table 17 State and Territory by sex, residents of rural and remote locations, 1 July 2002 to 30 June 2007, NCIS
Male Female Unknown Total
N
Crude Rate / 100,000
N Crude Rate / 100,000
N N % Crude Rate / 100,000
QLD 48 2.48 16 0.93 0 64 25.5 1.72 NSW 39 3.16 5 0.44 0 44 17.5 1.81 VIC 11 1.63 9 0.97 0 20 8.0 1.30 TAS 12 2.61 3 0.48 0 15 6.0 1.55 SA 21 3.41 2 0.35 0 23 9.2 1.91 WA 34 4.25 12 1.61 2 48 19.1 2.97 NT 28 5.70 9 1.94 0 37 14.7 3.88 Total 193 3.14 56 0.91 2 251 100.0 2.04
Summer (December 12.4%, January 10.8% and February 10.8%) was the most common time of the year
when residents of rural and remote locations drowned, conversely May (4.4%), June (4.8%) and September
(6.0%) were the months with the smallest number of drowning deaths (Figure 5)
Figure 5 Month of drowning by sex, residents of rural and remote locations, 1 July 2002 to 30 June 2007, NCIS (n=249)
Note: Sex was unknown in two cases, one was in March and the other was in December
River (29.1%) was the most common location of drowning deaths of residents of rural and remote
locations, followed by ocean (11.6%) and swimming pools (8.0%). This trend was similar for males;
however, beaches were more common than swimming pools. For females, rivers, swimming pools, beach,
dam and lake were the most common locations. It should however be noted that location of drowning was
unknown in 17.5% of cases. (Figure 6)
© AWSC August 2008 24
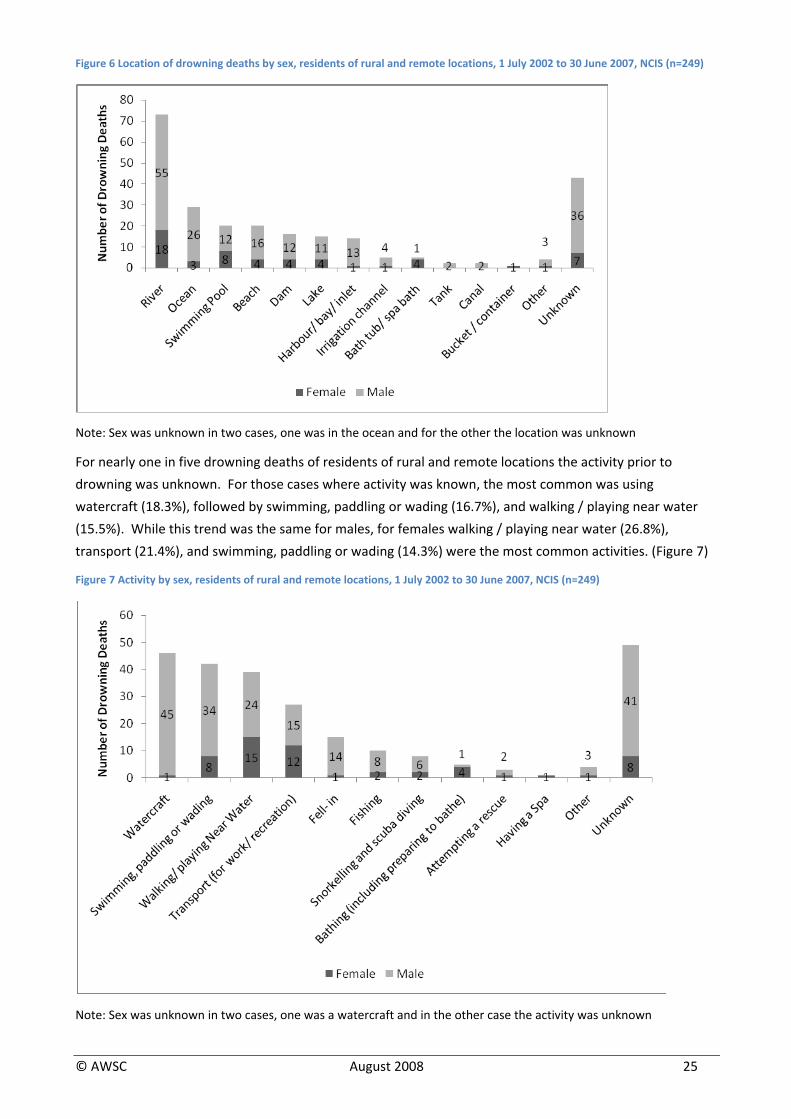
Figure 6 Location of drowning deaths by sex, residents of rural and remote locations, 1 July 2002 to 30 June 2007, NCIS (n=249)
Note: Sex was unknown in two cases, one was in the ocean and for the other the location was unknown
For nearly one in five drowning deaths of residents of rural and remote locations the activity prior to
drowning was unknown. For those cases where activity was known, the most common was using
watercraft (18.3%), followed by swimming, paddling or wading (16.7%), and walking / playing near water
(15.5%). While this trend was the same for males, for females walking / playing near water (26.8%),
transport (21.4%), and swimming, paddling or wading (14.3%) were the most common activities. (Figure 7)
Figure 7 Activity by sex, residents of rural and remote locations, 1 July 2002 to 30 June 2007, NCIS (n=249)
Note: Sex was unknown in two cases, one was a watercraft and in the other case the activity was unknown
© AWSC August 2008 25
© AWSC August 2008 26
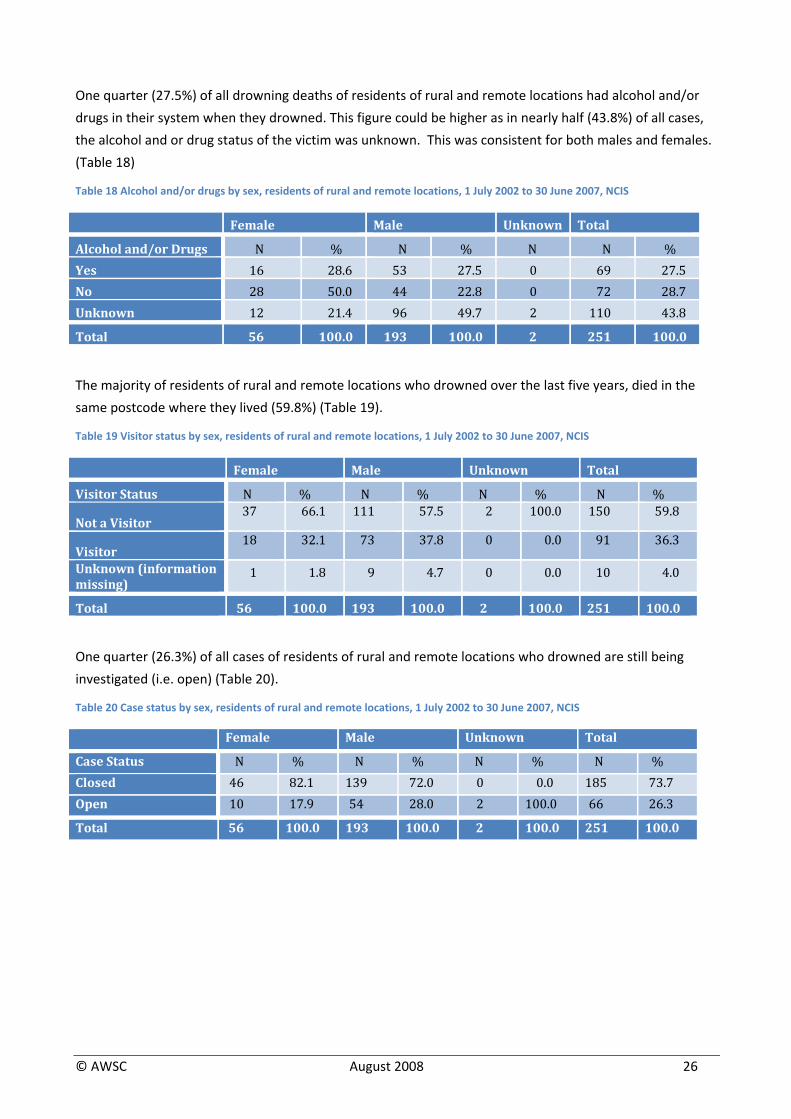
One quarter (27.5%) of all drowning deaths of residents of rural and remote locations had alcohol and/or
drugs in their system when they drowned. This figure could be higher as in nearly half (43.8%) of all cases,
the alcohol and or drug status of the victim was unknown. This was consistent for both males and females.
(Table 18)
Table 18 Alcohol and/or drugs by sex, residents of rural and remote locations, 1 July 2002 to 30 June 2007, NCIS
Female Male Unk wnno Total
Alcohol and/or Drugs N % N % N N % Yes 16 28.6 53 27.5 0 69 27.5 No 28 50.0 44 22.8 0 72 28.7 Unknown 12 21.4 96 49.7 2 110 43.8
Total 56 100.0 193 100.0 2 251 100.0
The majority of residents of rural and remote locations who drowned over the last five years, died in the
same postcode where they lived (59.8%) (Table 19).
Table 19 Visitor status by sex, residents of rural and remote locations, 1 July 2002 to 30 June 2007, NCIS
Female Male Unknown Total
Visitor Status N % N % N % N %
Not a Visitor 37 66.1 111 57.5 2 100.0 150 59.8
Visitor 18 32.1 73 37.8 0 0.0 91 36.3
Unknown (information missing)
1 1.8 9 4.7 0 0.0 10 4.0
Total 56 100.0 193 100.0 2 100.0 251 100.0
One quarter (26.3%) of all cases of residents of rural and remote locations who drowned are still being
investigated (i.e. open) (Table 20).
Table 20 Case status by sex, residents of rural and remote locations, 1 July 2002 to 30 June 2007, NCIS
Female Male Unknown Total
Case Status N % N % N % N %Closed 46 82.1 139 72.0 0 0.0 1 85 73.7Open 10 17.9 54 28.0 2 100.0 66 26.3
Total 56 100.0 193 100.0 2 100.0 251 100.0
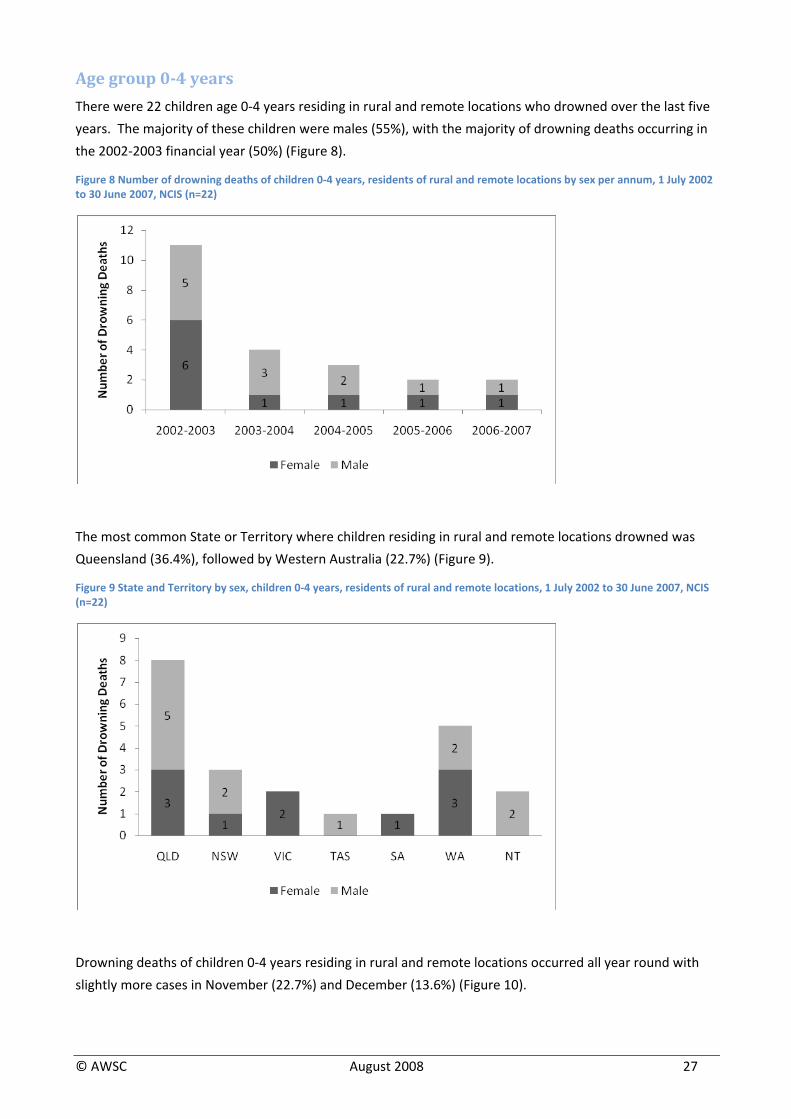
Age group 04 years
There were 22 children age 0‐4 years residing in rural and remote locations who drowned over the last five
years. The majority of these children were males (55%), with the majority of drowning deaths occurring in
the 2002‐2003 financial year (50%) (Figure 8).
Figure 8 Number of drowning deaths of children 0‐4 years, residents of rural and remote locations by sex per annum, 1 July 2002 to 30 June 2007, NCIS (n=22)
The most common State or Territory where children residing in rural and remote locations drowned was
Queensland (36.4%), followed by Western Australia (22.7%) (Figure 9).
Figure 9 State and Territory by sex, children 0‐4 years, residents of rural and remote locations, 1 July 2002 to 30 June 2007, NCIS (n=22)
Drowning deaths of children 0‐4 years residing in rural and remote locations occurred all year round with
slightly more cases in November (22.7%) and December (13.6%) (Figure 10).
© AWSC August 2008 27
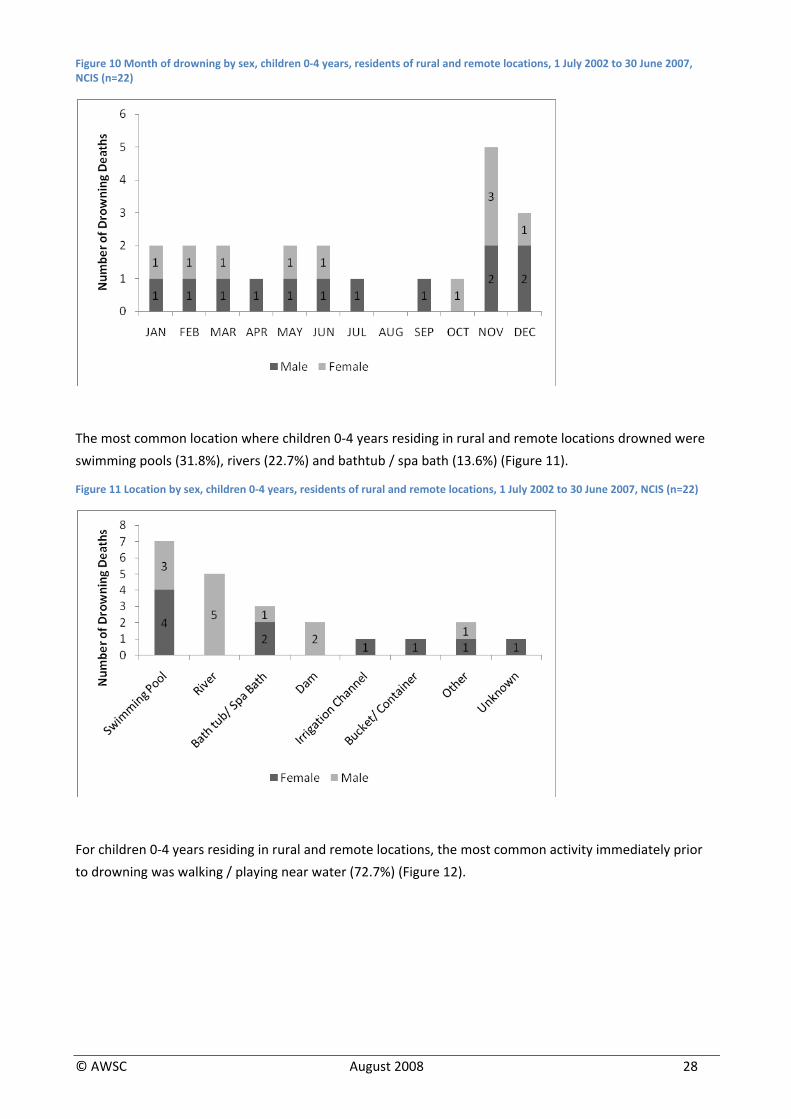
Figure 10 Month of drowning by sex, children 0‐4 years, residents of rural and remote locations, 1 July 2002 to 30 June 2007, NCIS (n=22)
The most common location where children 0‐4 years residing in rural and remote locations drowned were
swimming pools (31.8%), rivers (22.7%) and bathtub / spa bath (13.6%) (Figure 11).
Figure 11 Location by sex, children 0‐4 years, residents of rural and remote locations, 1 July 2002 to 30 June 2007, NCIS (n=22)
For children 0‐4 years residing in rural and remote locations, the most common activity immediately prior
to drowning was walking / playing near water (72.7%) (Figure 12).
© AWSC August 2008 28
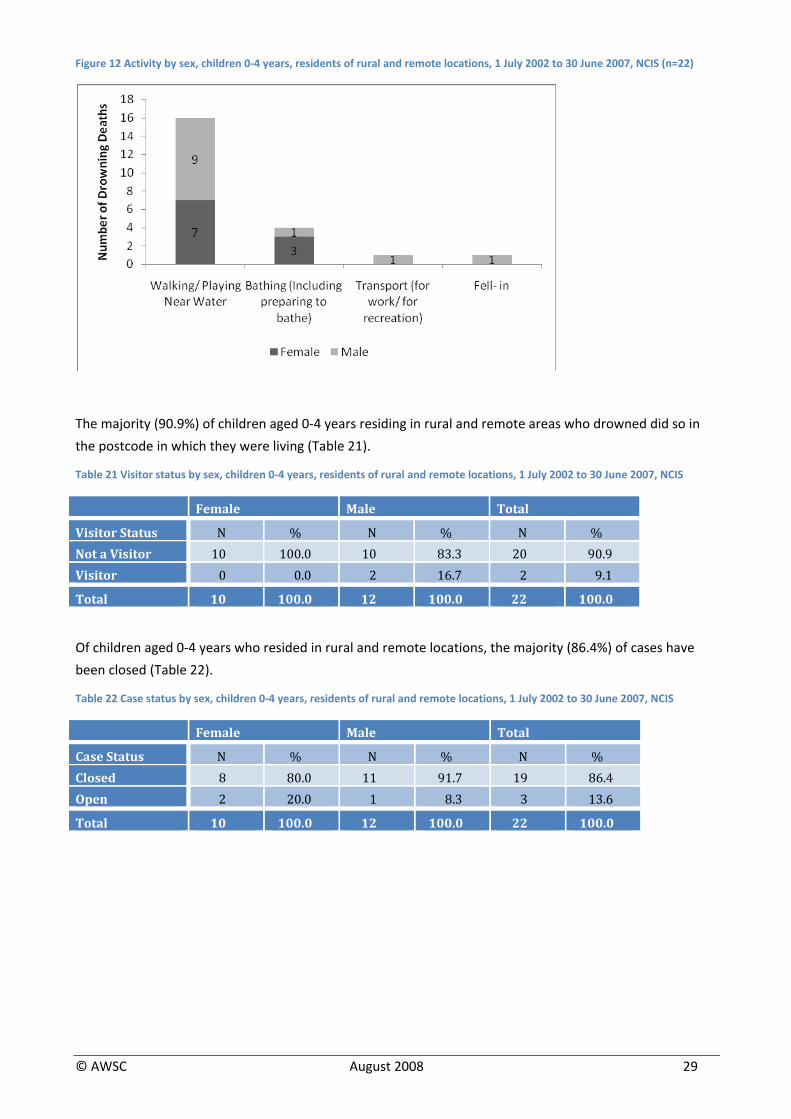
Figure 12 Activity by sex, children 0‐4 years, residents of rural and remote locations, 1 July 2002 to 30 June 2007, NCIS (n=22)
The majority (90.9%) of children aged 0‐4 years residing in rural and remote areas who drowned did so in
the postcode in which they were living (Table 21).
Table 21 Visitor status by sex, children 0‐4 years, residents of rural and remote locations, 1 July 2002 to 30 June 2007, NCIS
Female Male Total
Visitor Status N % N % N % Not a Visitor 10 100.0 10 83.3 20 90.9 Visitor 0 0.0 2 16.7 2 9.1
Total 10 100.0 12 100.0 22 100.0
Of children aged 0‐4 years who resided in rural and remote locations, the majority (86.4%) of cases have
been closed (Table 22).
Table 22 Case status by sex, children 0‐4 years, residents of rural and remote locations, 1 July 2002 to 30 June 2007, NCIS
Female Male Tot al
Case Status N % N % N % Closed 8 80.0 11 91.7 19 86.4 Open 2 20.0 1 8.3 3 13.6
Total 10 100.0 12 100.0 22 100.0
© AWSC August 2008 29
Age group 1834
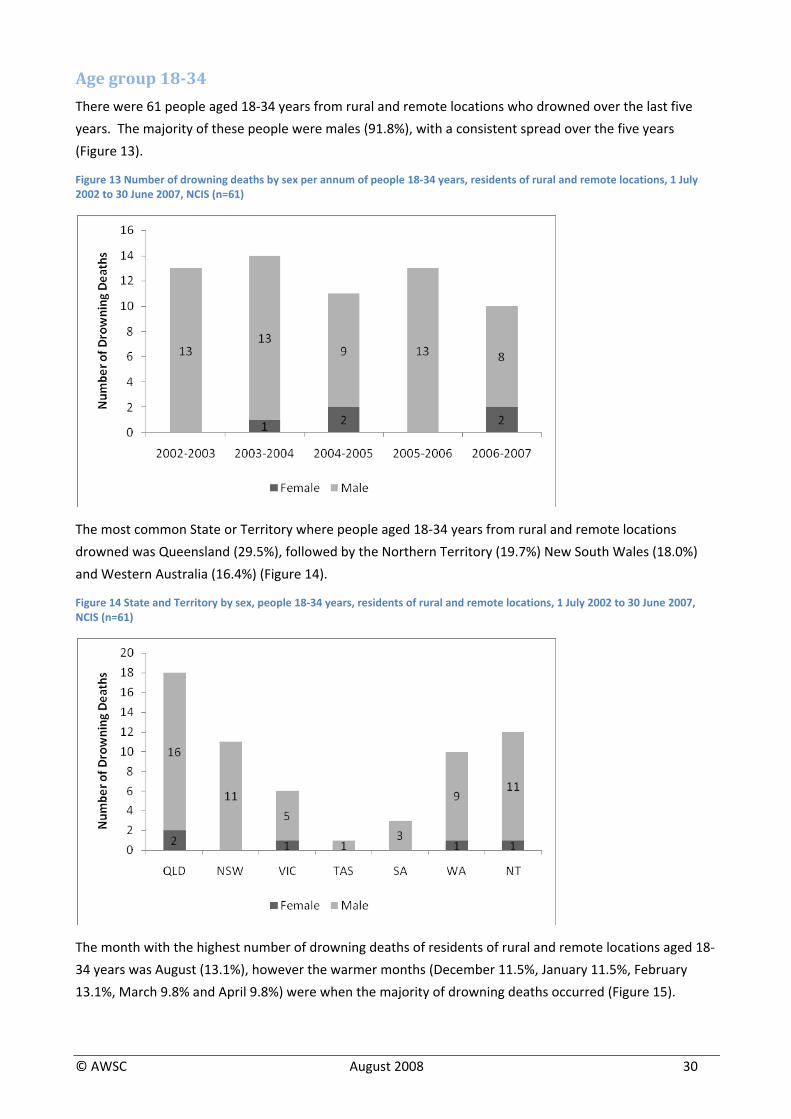
There were 61 people aged 18‐34 years from rural and remote locations who drowned over the last five
years. The majority of these people were males (91.8%), with a consistent spread over the five years
(Figure 13).
Figure 13 Number of drowning deaths by sex per annum of people 18‐34 years, residents of rural and remote locations, 1 July 2002 to 30 June 2007, NCIS (n=61)
The most common State or Territory where people aged 18‐34 years from rural and remote locations
drowned was Queensland (29.5%), followed by the Northern Territory (19.7%) New South Wales (18.0%)
and Western Australia (16.4%) (Figure 14).
Figure 14 State and Territory by sex, people 18‐34 years, residents of rural and remote locations, 1 July 2002 to 30 June 2007, NCIS (n=61)
The month with the highest number of drowning deaths of residents of rural and remote locations aged 18‐
34 years was August (13.1%), however the warmer months (December 11.5%, January 11.5%, February
13.1%, March 9.8% and April 9.8%) were when the majority of drowning deaths occurred (Figure 15).
© AWSC August 2008 30
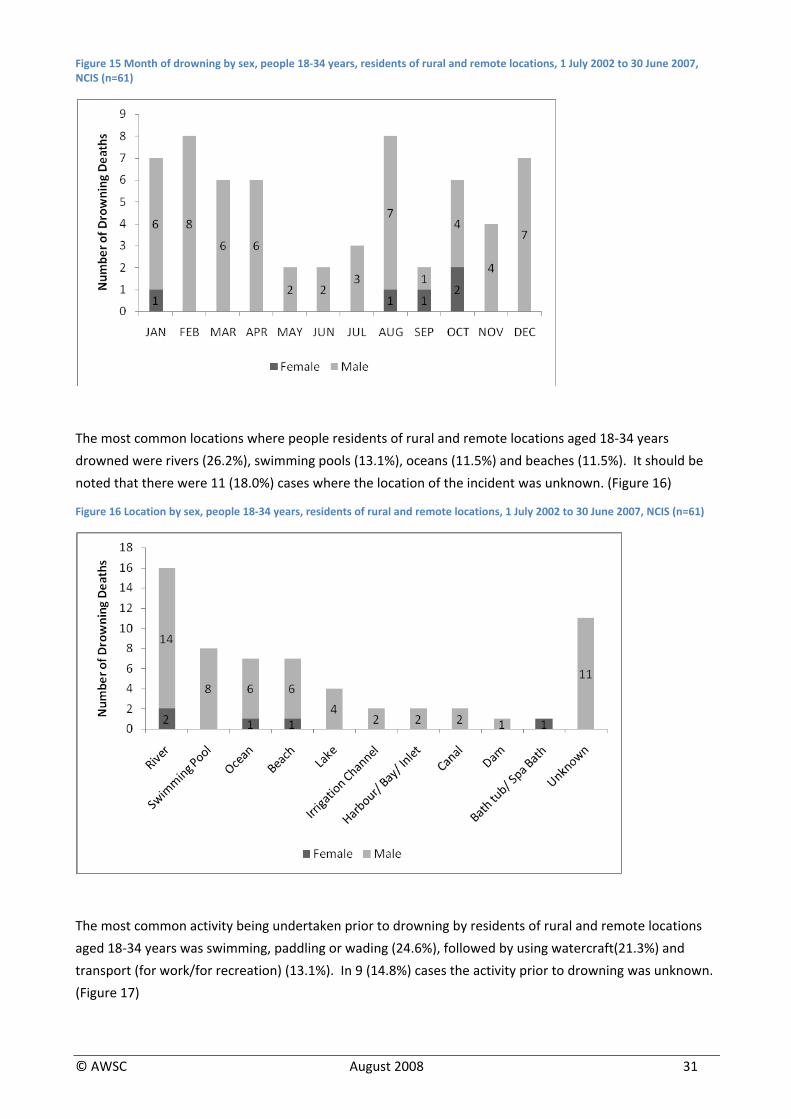
Figure 15 Month of drowning by sex, people 18‐34 years, residents of rural and remote locations, 1 July 2002 to 30 June 2007, NCIS (n=61)
The most common locations where people residents of rural and remote locations aged 18‐34 years
drowned were rivers (26.2%), swimming pools (13.1%), oceans (11.5%) and beaches (11.5%). It should be
noted that there were 11 (18.0%) cases where the location of the incident was unknown. (Figure 16)
Figure 16 Location by sex, people 18‐34 years, residents of rural and remote locations, 1 July 2002 to 30 June 2007, NCIS (n=61)
The most common activity being undertaken prior to drowning by residents of rural and remote locations
aged 18‐34 years was swimming, paddling or wading (24.6%), followed by using watercraft(21.3%) and
transport (for work/for recreation) (13.1%). In 9 (14.8%) cases the activity prior to drowning was unknown.
(Figure 17)
© AWSC August 2008 31
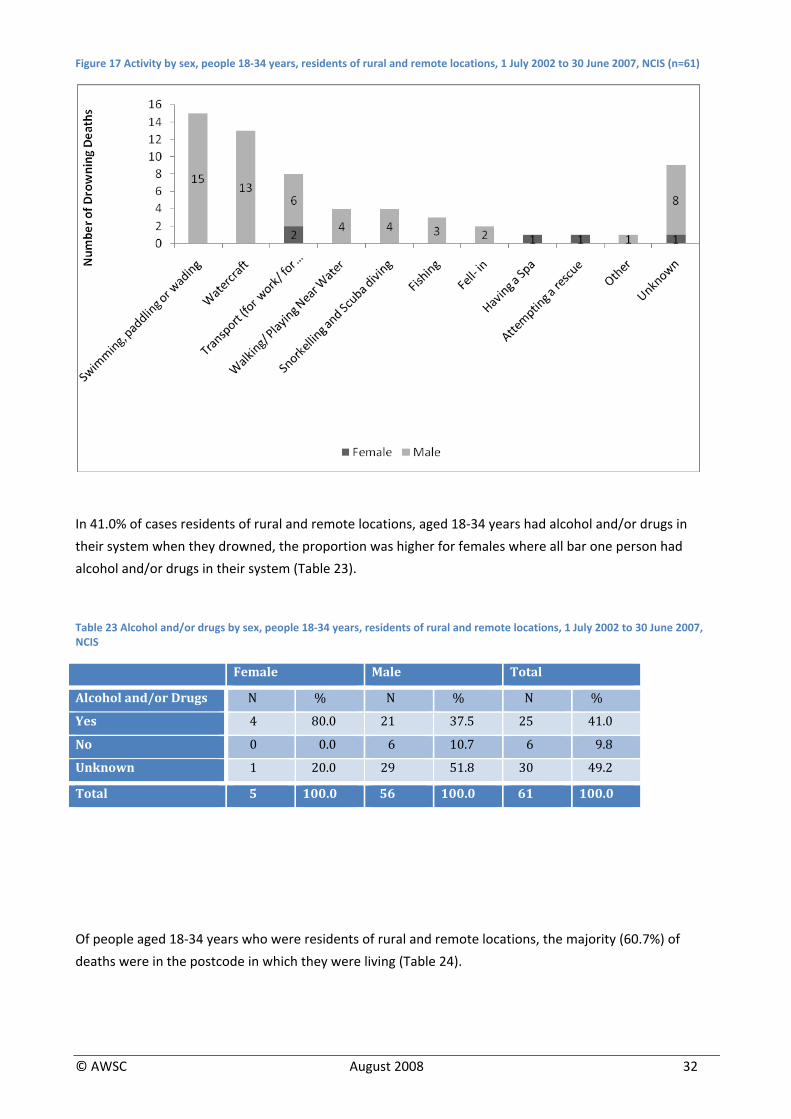
Figure 17 Activity by sex, people 18‐34 years, residents of rural and remote locations, 1 July 2002 to 30 June 2007, NCIS (n=61)
In 41.0% of cases residents of rural and remote locations, aged 18‐34 years had alcohol and/or drugs in
their system when they drowned, the proportion was higher for females where all bar one person had
alcohol and/or drugs in their system (Table 23).
Table 23 Alcohol and/or drugs by sex, people 18‐34 years, residents of rural and remote locations, 1 July 2002 to 30 June 2007, NCIS
Female Male Total
Alcohol and/or Drugs N % N % N %
Yes 4 80.0 21 37.5 25 41.0
No 0 0.0 6 10.7 6 9.8
Unknown 1 20.0 29 51.8 30 49.2
Total 5 100.0 56 100.0 61 100.0
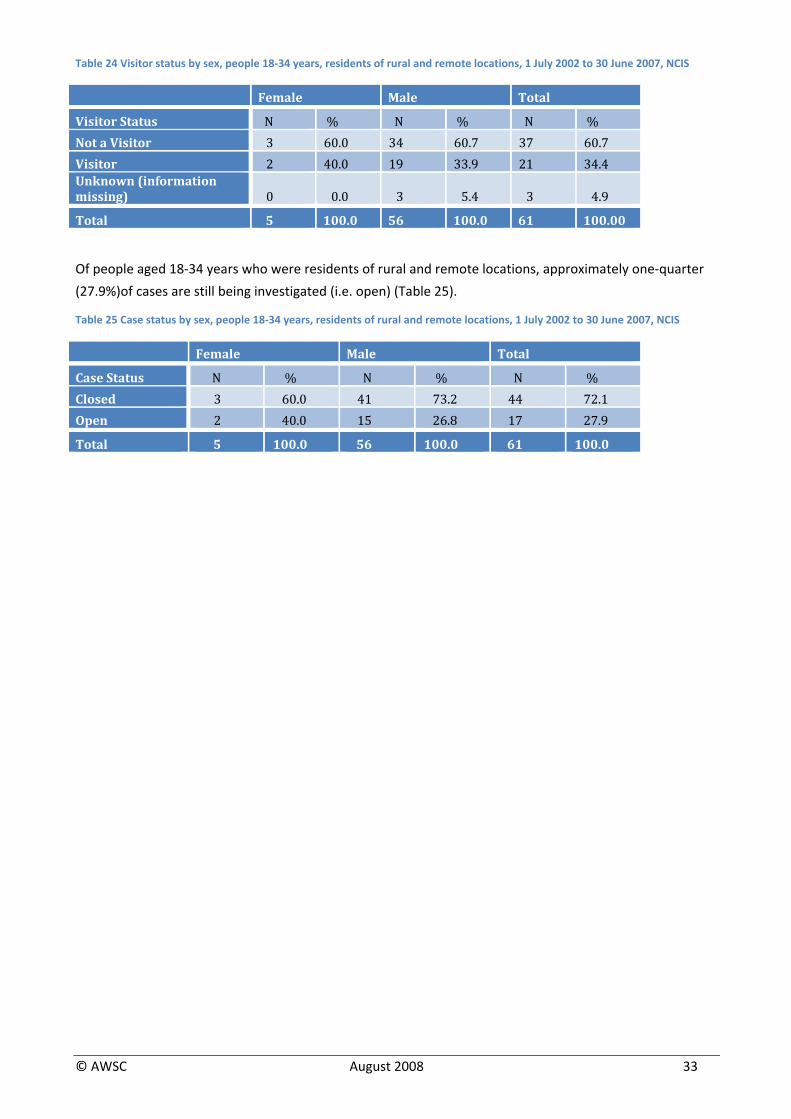
Of people aged 18‐34 years who were residents of rural and remote locations, the majority (60.7%) of
deaths were in the postcode in which they were living (Table 24).
© AWSC August 2008 32
© AWSC August 2008 33
Table 24 Visitor status by sex, people 18‐34 years, residents of rural and remote locations, 1 July 2002 to 30 June 2007, NCIS
Female Male Total
Visitor Status N % N % N % Not a Visitor 3 60.0 34 60.7 37 60.7 Visitor 2 40.0 19 33.9 21 34.4 Unknown (information missing) 0 0.0 3 5.4 3 4.9
Total 5 100.0 56 100.0 61 100.00
Of people aged 18‐34 years who were residents of rural and remote locations, approximately one‐quarter
(27.9%)of cases are still being investigated (i.e. open) (Table 25).
Table 25 Case status by sex, people 18‐34 years, residents of rural and remote locations, 1 July 2002 to 30 June 2007, NCIS
Female Ma le Total
Case Status N % N % N % Closed 3 60.0 41 73.2 44 72.1 Open 2 40.0 15 26.8 17 27.9
Total 5 100.0 56 100.0 61 100.0
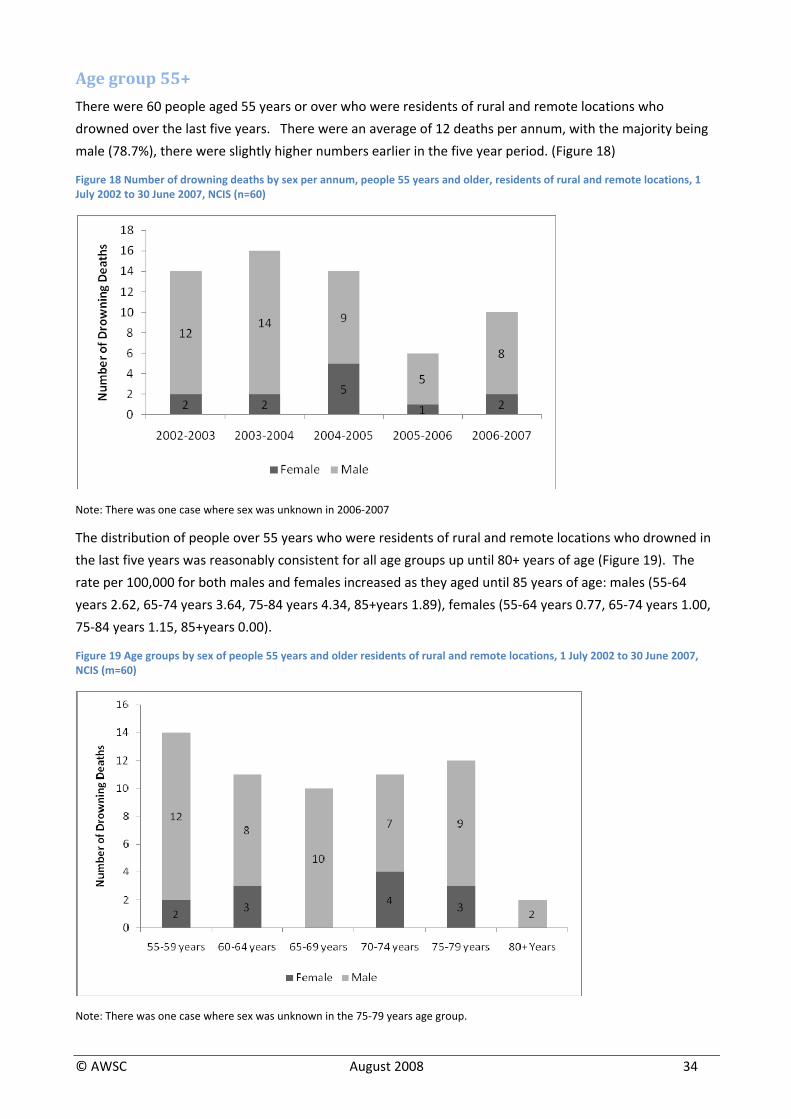
Age group 55+
There were 60 people aged 55 years or over who were residents of rural and remote locations who
drowned over the last five years. There were an average of 12 deaths per annum, with the majority being
male (78.7%), there were slightly higher numbers earlier in the five year period. (Figure 18)
Figure 18 Number of drowning deaths by sex per annum, people 55 years and older, residents of rural and remote locations, 1 July 2002 to 30 June 2007, NCIS (n=60)
Note: There was one case where sex was unknown in 2006‐2007
The distribution of people over 55 years who were residents of rural and remote locations who drowned in
the last five years was reasonably consistent for all age groups up until 80+ years of age (Figure 19). The
rate per 100,000 for both males and females increased as they aged until 85 years of age: males (55‐64
years 2.62, 65‐74 years 3.64, 75‐84 years 4.34, 85+years 1.89), females (55‐64 years 0.77, 65‐74 years 1.00,
75‐84 years 1.15, 85+years 0.00).
Figure 19 Age groups by sex of people 55 years and older residents of rural and remote locations, 1 July 2002 to 30 June 2007, NCIS (m=60)
Note: There was one case where sex was unknown in the 75‐79 years age group.
© AWSC August 2008 34
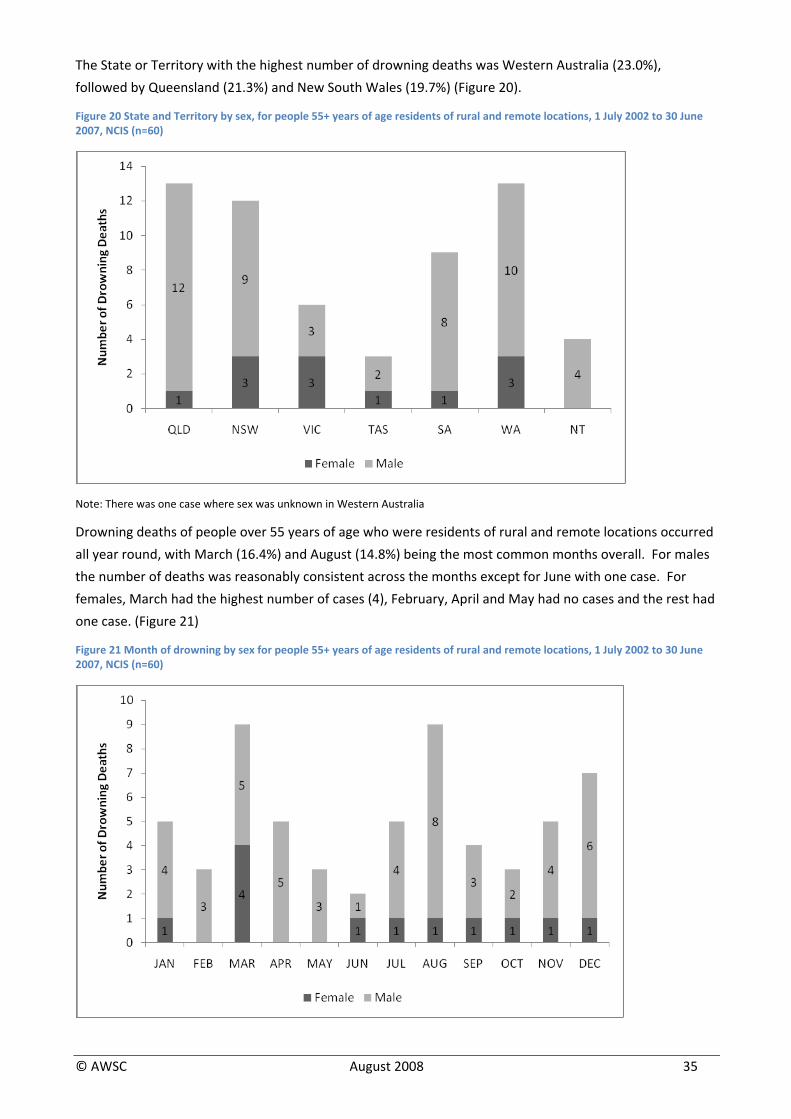
The State or Territory with the highest number of drowning deaths was Western Australia (23.0%),
followed by Queensland (21.3%) and New South Wales (19.7%) (Figure 20).
Figure 20 State and Territory by sex, for people 55+ years of age residents of rural and remote locations, 1 July 2002 to 30 June 2007, NCIS (n=60)
Note: There was one case where sex was unknown in Western Australia
Drowning deaths of people over 55 years of age who were residents of rural and remote locations occurred
all year round, with March (16.4%) and August (14.8%) being the most common months overall. For males
the number of deaths was reasonably consistent across the months except for June with one case. For
females, March had the highest number of cases (4), February, April and May had no cases and the rest had
one case. (Figure 21)
Figure 21 Month of drowning by sex for people 55+ years of age residents of rural and remote locations, 1 July 2002 to 30 June 2007, NCIS (n=60)
© AWSC August 2008 35
Note: There was one case where sex was unknown in March.
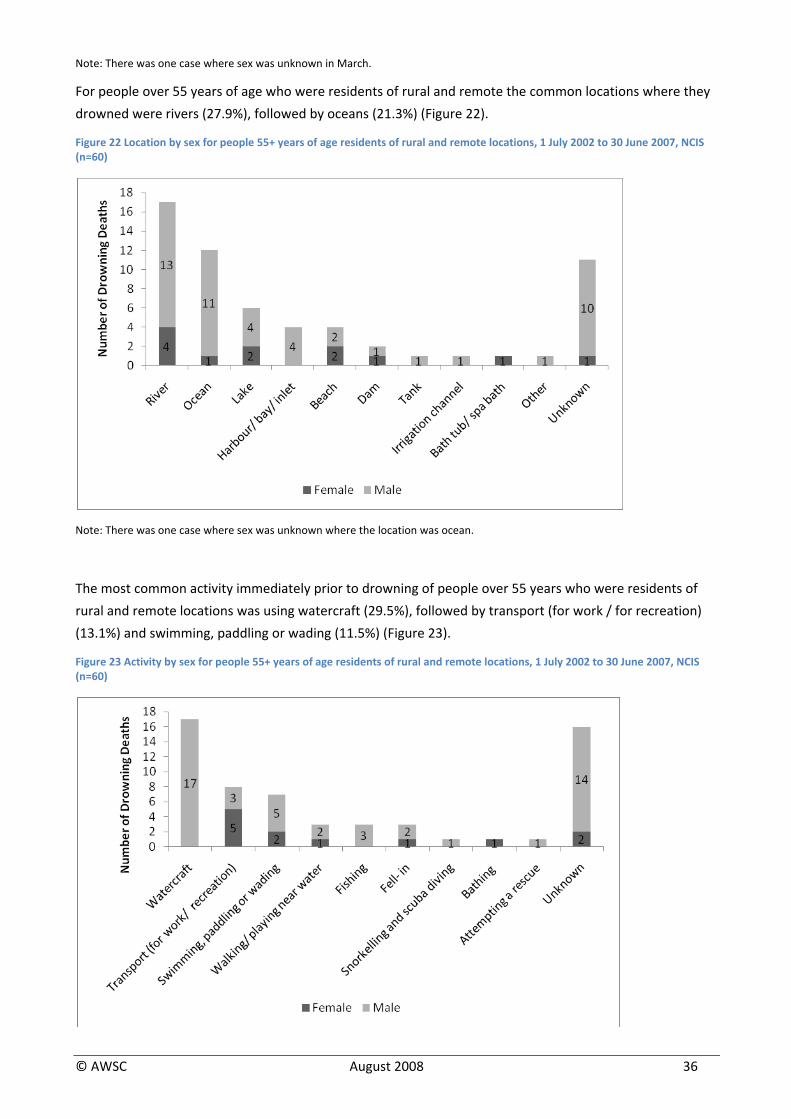
For people over 55 years of age who were residents of rural and remote the common locations where they
drowned were rivers (27.9%), followed by oceans (21.3%) (Figure 22).
Figure 22 Location by sex for people 55+ years of age residents of rural and remote locations, 1 July 2002 to 30 June 2007, NCIS (n=60)
Note: There was one case where sex was unknown where the location was ocean.
The most common activity immediately prior to drowning of people over 55 years who were residents of
rural and remote locations was using watercraft (29.5%), followed by transport (for work / for recreation)
(13.1%) and swimming, paddling or wading (11.5%) (Figure 23).
Figure 23 Activity by sex for people 55+ years of age residents of rural and remote locations, 1 July 2002 to 30 June 2007, NCIS (n=60)
© AWSC August 2008 36
© AWSC August 2008 37
Note: There was one case where sex was unknown where the activity prior to drowning was watercraft.
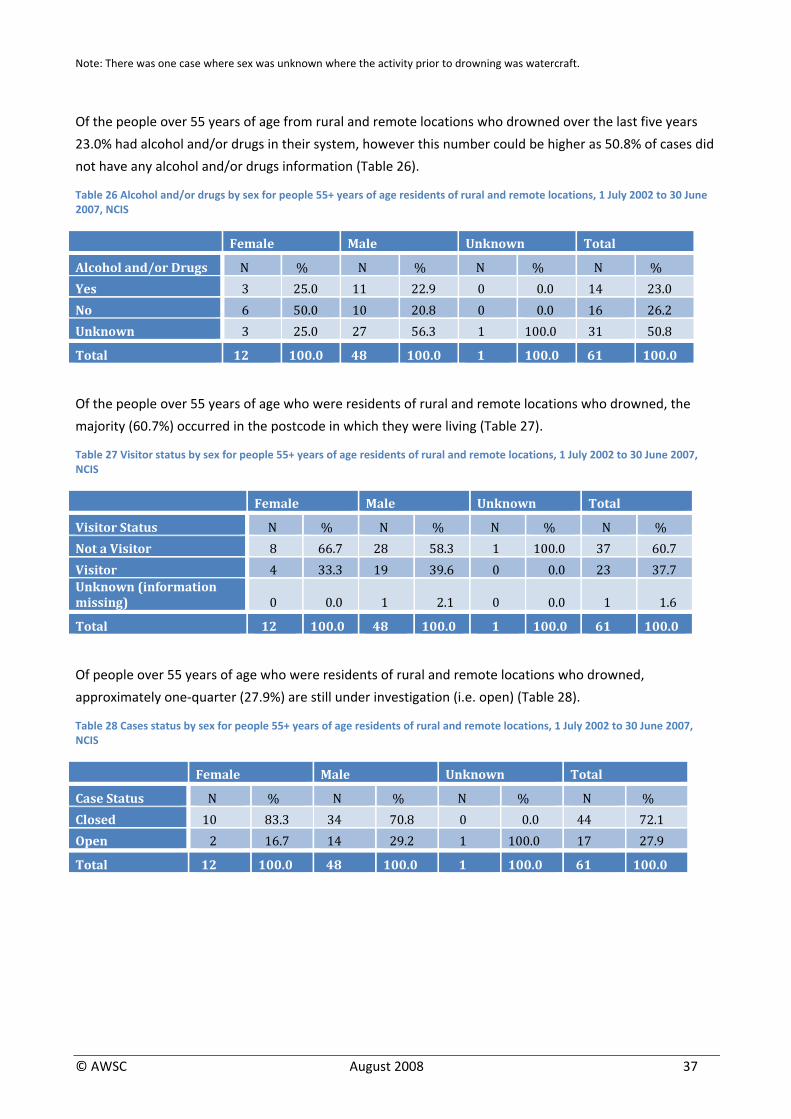
Of the people over 55 years of age from rural and remote locations who drowned over the last five years
23.0% had alcohol and/or drugs in their system, however this number could be higher as 50.8% of cases did
not have any alcohol and/or drugs information (Table 26).
Table 26 Alcohol and/or drugs by sex for people 55+ years of age residents of rural and remote locations, 1 July 2002 to 30 June 2007, NCIS
Female Male Unknown Total
Alcohol and/or Drugs N % N % N % N % Yes 3 25.0 11 22.9 0 0.0 14 23.0 No 6 50.0 10 20.8 0 0.0 16 26.2 Unknown 3 25.0 27 56.3 1 100.0 31 50.8
Total 12 100.0 48 100.0 1 100.0 61 100.0
Of the people over 55 years of age who were residents of rural and remote locations who drowned, the
majority (60.7%) occurred in the postcode in which they were living (Table 27).
Table 27 Visitor status by sex for people 55+ years of age residents of rural and remote locations, 1 July 2002 to 30 June 2007, NCIS
Female Male Unknown Total
Visitor Status N % N % N % N % Not a Visitor 8 66.7 28 58.3 1 100.0 37 60.7 Visitor 4 33.3 19 39.6 0 0.0 23 37.7 Unknown (information missing) 0 0.0 1 2.1 0 0.0 1 1.6
Total 12 100.0 48 100.0 1 100.0 61 100.0
Of people over 55 years of age who were residents of rural and remote locations who drowned,
approximately one‐quarter (27.9%) are still under investigation (i.e. open) (Table 28).
Table 28 Cases status by sex for people 55+ years of age residents of rural and remote locations, 1 July 2002 to 30 June 2007, NCIS
Female Male Unknown Total
Case Status N % N % N % N % Closed 10 83.3 34 70.8 0 0.0 44 72.1 Open 2 16.7 14 29.2 1 100.0 17 27.9
Total 12 100.0 48 100.0 1 100.0 61 100.0
People drowning at rural and remote locations (NCIS Data)
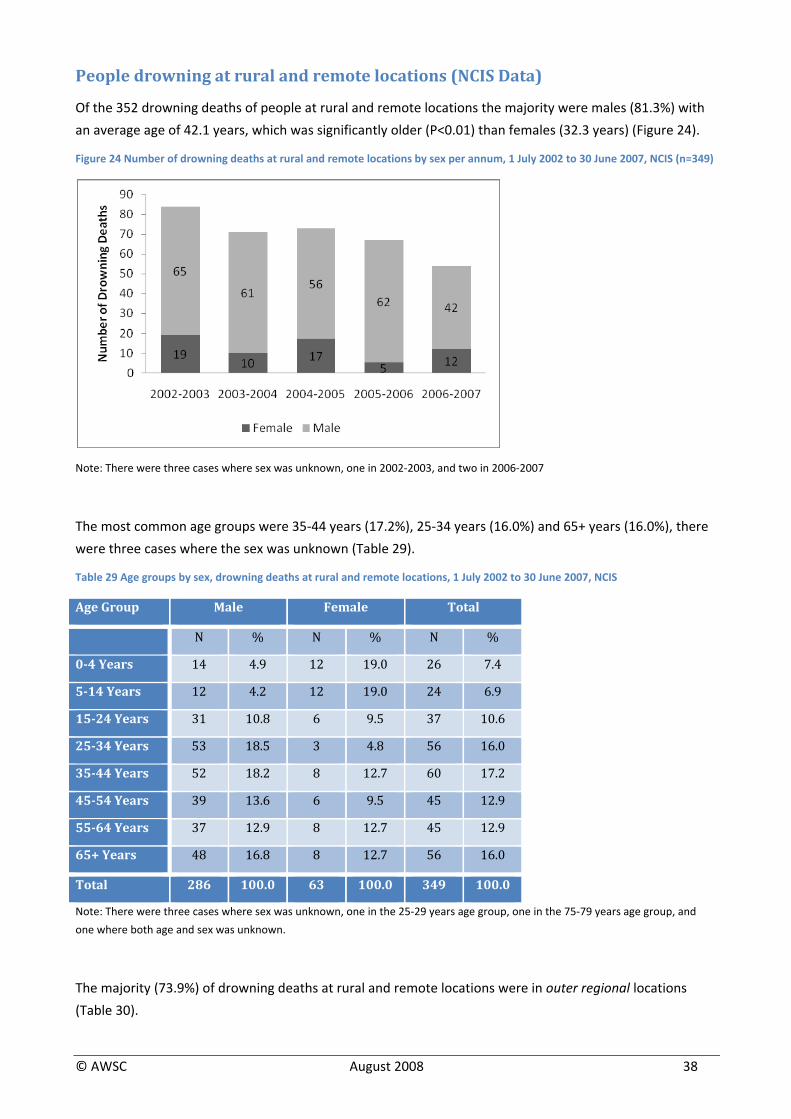
Of the 352 drowning deaths of people at rural and remote locations the majority were males (81.3%) with
an average age of 42.1 years, which was significantly older (P<0.01) than females (32.3 years) (Figure 24).
Figure 24 Number of drowning deaths at rural and remote locations by sex per annum, 1 July 2002 to 30 June 2007, NCIS (n=349)
Note: There were three cases where sex was unknown, one in 2002‐2003, and two in 2006‐2007
The most common age groups were 35‐44 years (17.2%), 25‐34 years (16.0%) and 65+ years (16.0%), there
were three cases where the sex was unknown (Table 29).
Table 29 Age groups by sex, drowning deaths at rural and remote locations, 1 July 2002 to 30 June 2007, NCIS
Age Group Male Female Total
N % N % N %
04 Years 14 4.9 12 19.0 26 7.4
514 Years 12 4.2 1 2 19.0 24 6.9
1524 Years 31 10.8 6 9.5 37 10.6
2534 Years 53 18.5 3 4.8 56 16.0
3544 Years 52 18.2 8 12.7 60 17.2
4554 Years 39 13.6 6 9.5 45 12.9
5564 Years 37 12.9 8 12.7 45 12.9
65+ Years 48 16.8 8 12.7 56 16.0
Total 286 100.0 63 100.0 349 100.0
Note: There were three cases where sex was unknown, one in the 25‐29 years age group, one in the 75‐79 years age group, and
one where both age and sex was unknown.
The majority (73.9%) of drowning deaths at rural and remote locations were in outer regional locations
(Table 30).
© AWSC August 2008 38
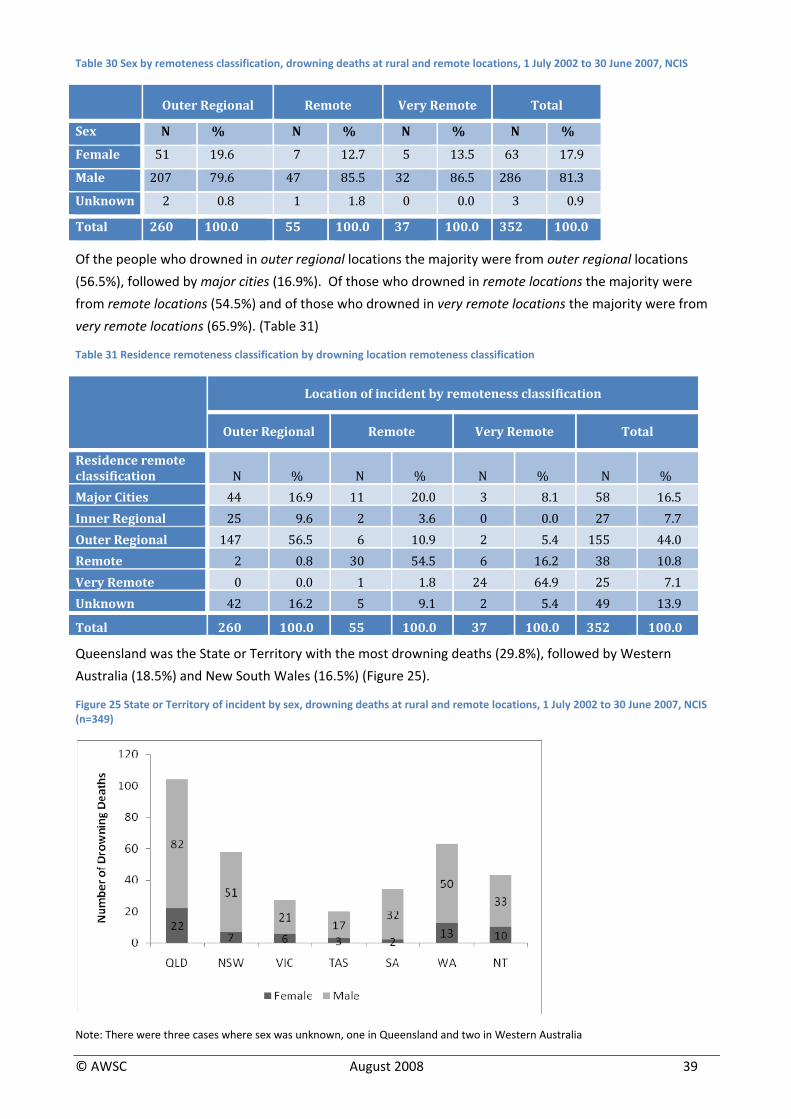
Table 30 Sex by remoteness classification, drowning deaths at rural and remote locations, 1 July 2002 to 30 June 2007, NCIS
Outer Regional Remote Very Remote Total
Sex N % N % N % N %
Female 51 19.6 7 12.7 5 13.5 63 17.9
Male 20 7 79.6 47 85.5 32 86.5 286 81.3
Unknown 2 0.8 1 1.8 0 0.0 3 0.9
Total 260 100.0 55 100.0 37 100.0 352 100.0
Of the people who drowned in outer regional locations the majority were from outer regional locations
(56.5%), followed by major cities (16.9%). Of those who drowned in remote locations the majority were
from remote locations (54.5%) and of those who drowned in very remote locations the majority were from
very remote locations (65.9%). (Table 31)
Table 31 Residence remoteness classification by drowning location remoteness classification
Location of incident by remoteness classification
Outer Regional Remote Very Remote Total
Residence remote classification N % N % N % N % Major Cities 44 16.9 11 20.0 3 8.1 58 16.5 Inner Regional 25 9.6 2 3.6 0 0.0 27 7.7 Outer Regional 147 56.5 6 10.9 2 5.4 155 44.0 Remote 2 0.8 30 54.5 6 16.2 38 10.8 Very Remote 0 0.0 1 1.8 24 64.9 25 7.1 Unknown 42 16.2 5 9.1 2 5.4 49 13.9
Total 260 100.0 55 100.0 37 100.0 352 100.0
Queensland was the State or Territory with the most drowning deaths (29.8%), followed by Western
Australia (18.5%) and New South Wales (16.5%) (Figure 25).
Figure 25 State or Territory of incident by sex, drowning deaths at rural and remote locations, 1 July 2002 to 30 June 2007, NCIS (n=349)
Note: There were three cases where sex was unknown, one in Queensland and two in Western Australia
© AWSC August 2008 39
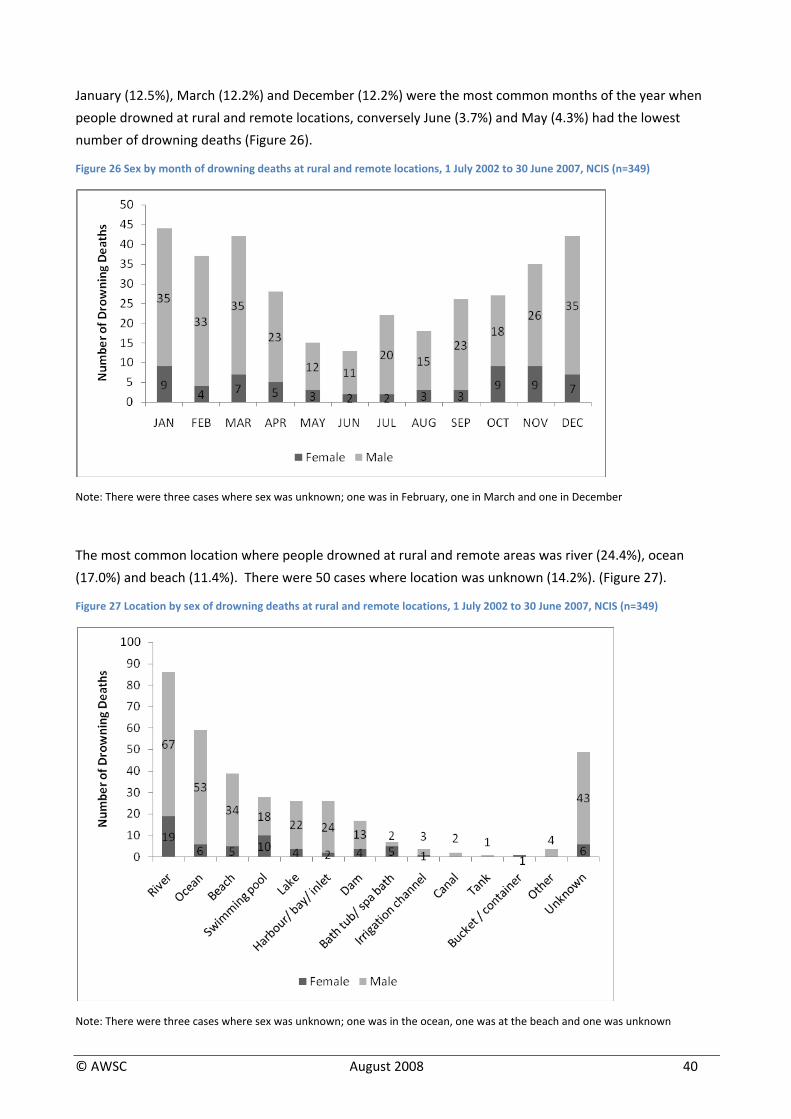
January (12.5%), March (12.2%) and December (12.2%) were the most common months of the year when
people drowned at rural and remote locations, conversely June (3.7%) and May (4.3%) had the lowest
number of drowning deaths (Figure 26).
Figure 26 Sex by month of drowning deaths at rural and remote locations, 1 July 2002 to 30 June 2007, NCIS (n=349)
Note: There were three cases where sex was unknown; one was in February, one in March and one in December
The most common location where people drowned at rural and remote areas was river (24.4%), ocean
(17.0%) and beach (11.4%). There were 50 cases where location was unknown (14.2%). (Figure 27).
Figure 27 Location by sex of drowning deaths at rural and remote locations, 1 July 2002 to 30 June 2007, NCIS (n=349)
Note: There were three cases where sex was unknown; one was in the ocean, one was at the beach and one was unknown
© AWSC August 2008 40
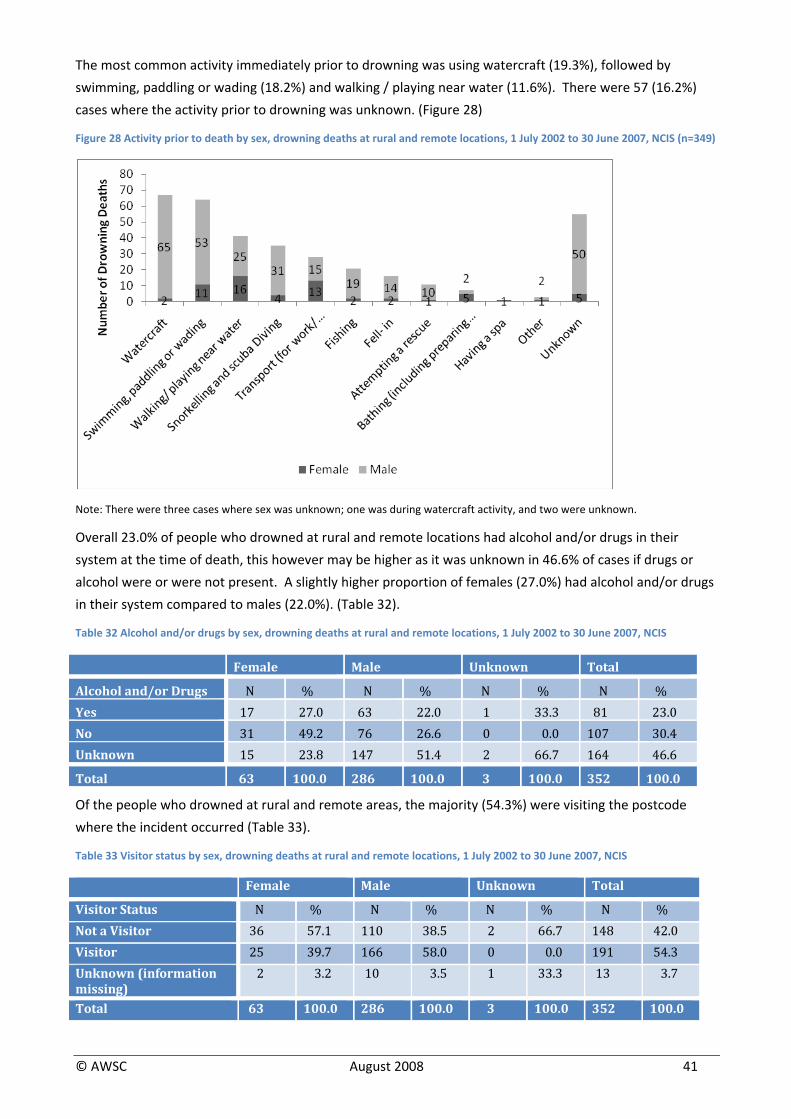
The most common activity immediately prior to drowning was using watercraft (19.3%), followed by
swimming, paddling or wading (18.2%) and walking / playing near water (11.6%). There were 57 (16.2%)
cases where the activity prior to drowning was unknown. (Figure 28)
Figure 28 Activity prior to death by sex, drowning deaths at rural and remote locations, 1 July 2002 to 30 June 2007, NCIS (n=349)
Note: There were three cases where sex was unknown; one was during watercraft activity, and two were unknown.
Overall 23.0% of people who drowned at rural and remote locations had alcohol and/or drugs in their
system at the time of death, this however may be higher as it was unknown in 46.6% of cases if drugs or
alcohol were or were not present. A slightly higher proportion of females (27.0%) had alcohol and/or drugs
in their system compared to males (22.0%). (Table 32).
Table 32 Alcohol and/or drugs by sex, drowning deaths at rural and remote locations, 1 July 2002 to 30 June 2007, NCIS
Female Male Unknown Total
Alcohol and/or Drugs N % N % N % N % Yes 17 27.0 63 22.0 1 33.3 81 23.0 No 31 49.2 76 26.6 0 0.0 107 30.4 Unknown 15 23.8 147 51.4 2 66.7 164 46.6
Total 63 100.0 286 100.0 3 100.0 352 100.0
Of the people who drowned at rural and remote areas, the majority (54.3%) were visiting the postcode
where the incident occurred (Table 33).
Table 33 Visitor status by sex, drowning deaths at rural and remote locations, 1 July 2002 to 30 June 2007, NCIS
Female Male Unknown Total
Visitor Status N % N % N % N %Not a Visitor 36 57.1 110 38.5 2 66.7 148 42.0Visitor 25 39.7 166 58.0 0 0.0 1 91 54.3Unknown (information missing)
2 3.2 10 3.5 1 33.3 13 3.7
Total 63 100.0 286 100.0 3 100.0 352 100.0
© AWSC August 2008 41
© AWSC August 2008 42
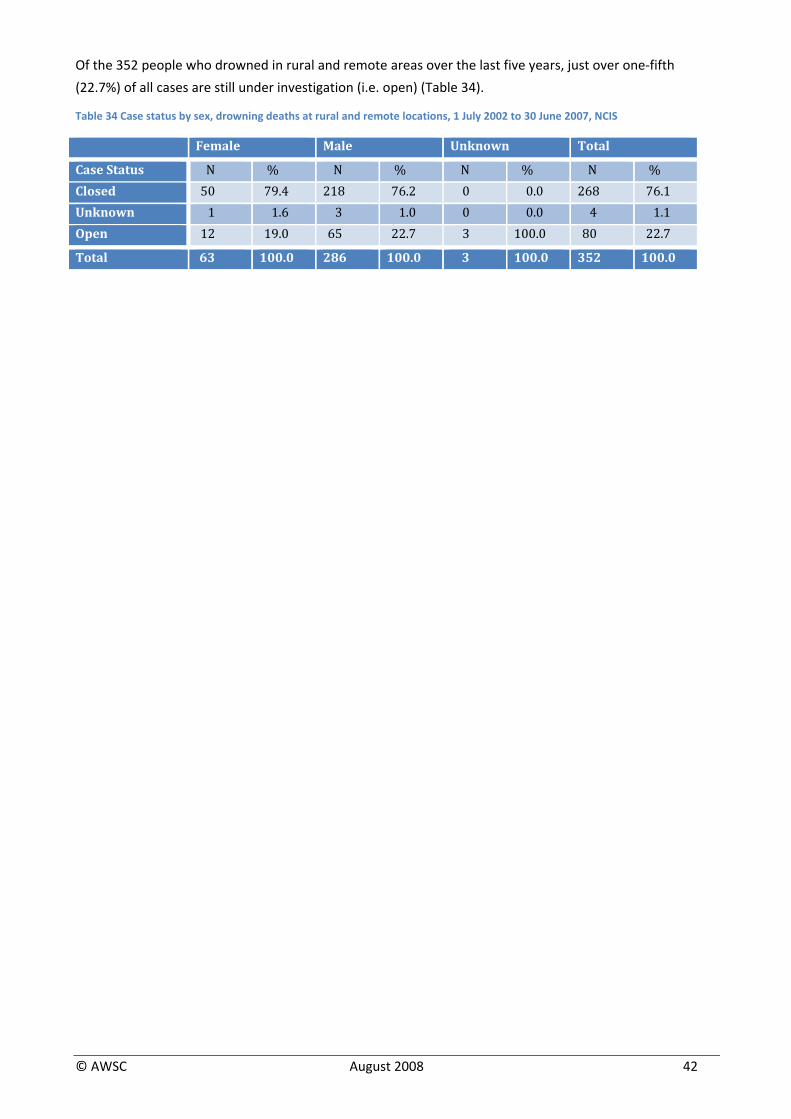
Of the 352 people who drowned in rural and remote areas over the last five years, just over one‐fifth
(22.7%) of all cases are still under investigation (i.e. open) (Table 34).
Table 34 Case status by sex, drowning deaths at rural and remote locations, 1 July 2002 to 30 June 2007, NCIS
Female Male Unknown Total
Case Status N % N % N % N %Closed 50 79.4 218 76.2 0 0.0 26 8 76.1Unknown 1 1.6 3 1.0 0 0.0 4 1.1Open 12 19.0 65 22.7 3 100.0 80 22.7
Total 63 100.0 286 100.0 3 100.0 352 100.0
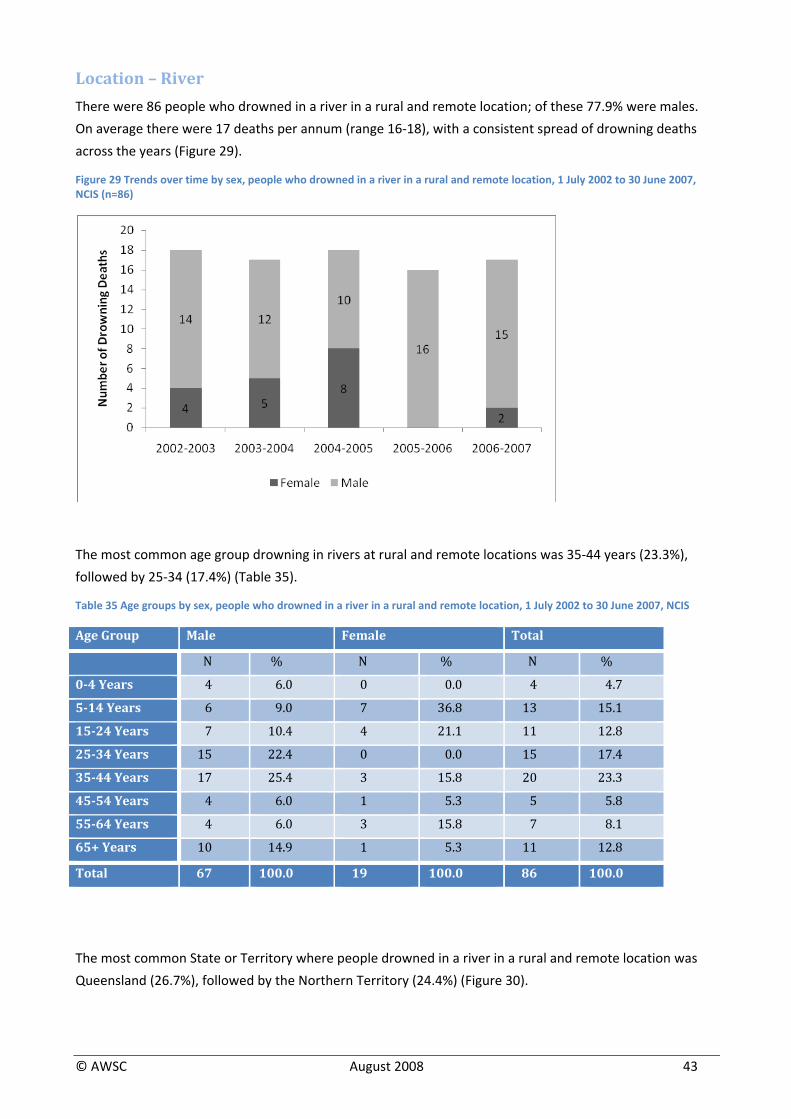
Location – River
There were 86 people who drowned in a river in a rural and remote location; of these 77.9% were males.
On average there were 17 deaths per annum (range 16‐18), with a consistent spread of drowning deaths
across the years (Figure 29).
Figure 29 Trends over time by sex, people who drowned in a river in a rural and remote location, 1 July 2002 to 30 June 2007, NCIS (n=86)
The most common age group drowning in rivers at rural and remote locations was 35‐44 years (23.3%),
followed by 25‐34 (17.4%) (Table 35).
Table 35 Age groups by sex, people who drowned in a river in a rural and remote location, 1 July 2002 to 30 June 2007, NCIS
Age Group Male Female Total
N % N % N %
04 Years 4 6.0 0 0.0 4 4.7
514 Years 6 9.0 7 36.8 13 15.1
1524 Years 7 10.4 4 21.1 11 12.8
2534 Years 15 22.4 0 0.0 15 17.4
3544 Years 17 25.4 3 15.8 20 23.3
4554 Years 4 6.0 1 5.3 5 5.8
5564 Years 4 6.0 3 15.8 7 8.1
65+ Years 10 14.9 1 5.3 11 12.8
Total 67 100.0 19 100.0 86 100.0
The most common State or Territory where people drowned in a river in a rural and remote location was
Queensland (26.7%), followed by the Northern Territory (24.4%) (Figure 30).
© AWSC August 2008 43
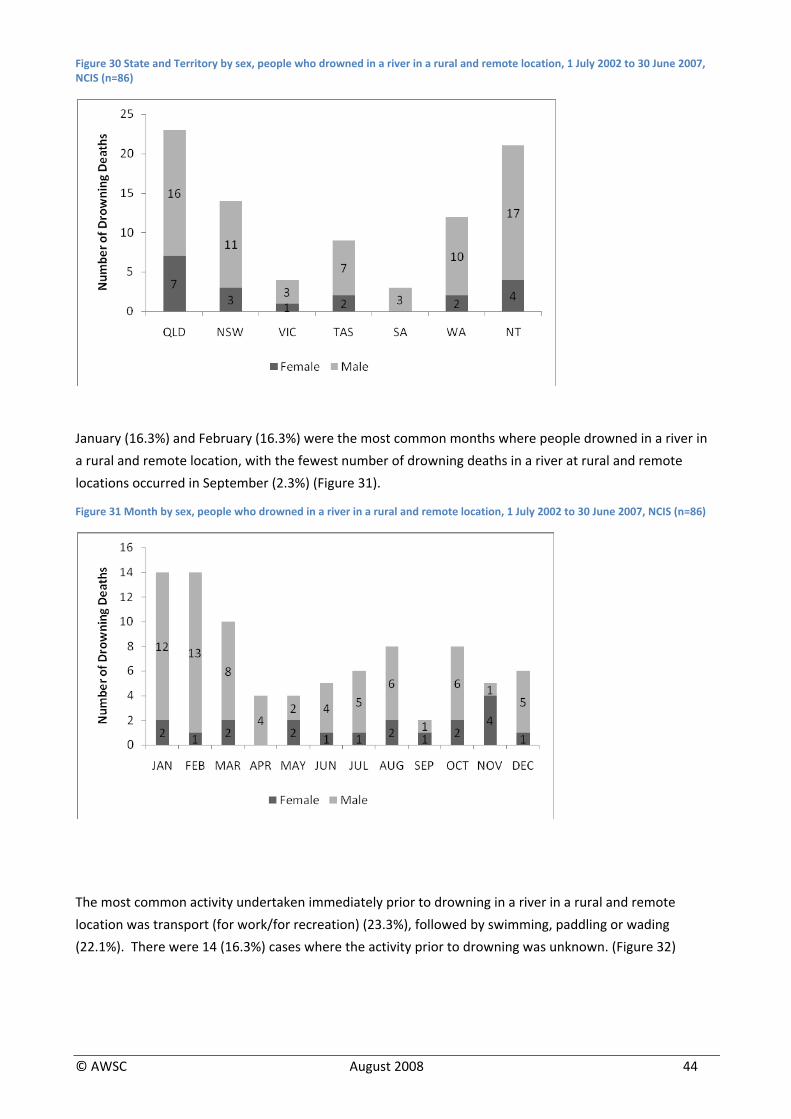
Figure 30 State and Territory by sex, people who drowned in a river in a rural and remote location, 1 July 2002 to 30 June 2007, NCIS (n=86)
January (16.3%) and February (16.3%) were the most common months where people drowned in a river in
a rural and remote location, with the fewest number of drowning deaths in a river at rural and remote
locations occurred in September (2.3%) (Figure 31).
Figure 31 Month by sex, people who drowned in a river in a rural and remote location, 1 July 2002 to 30 June 2007, NCIS (n=86)
The most common activity undertaken immediately prior to drowning in a river in a rural and remote
location was transport (for work/for recreation) (23.3%), followed by swimming, paddling or wading
(22.1%). There were 14 (16.3%) cases where the activity prior to drowning was unknown. (Figure 32)
© AWSC August 2008 44
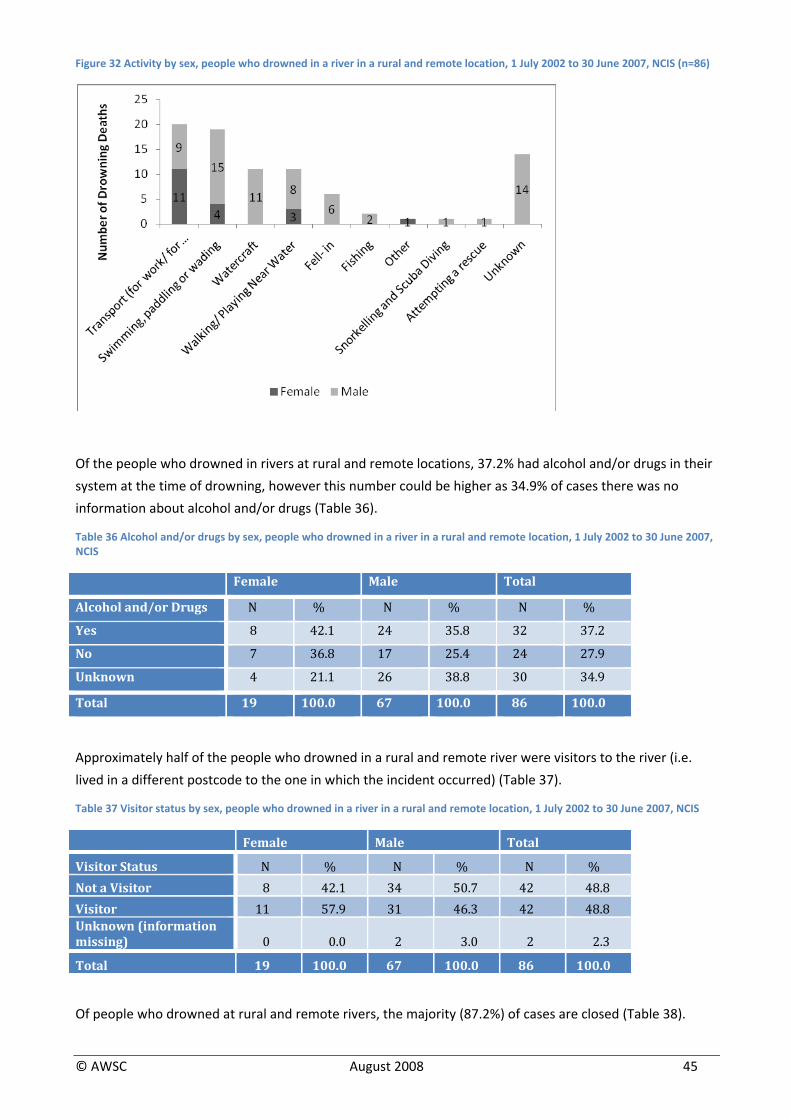
Figure 32 Activity by sex, people who drowned in a river in a rural and remote location, 1 July 2002 to 30 June 2007, NCIS (n=86)
Of the people who drowned in rivers at rural and remote locations, 37.2% had alcohol and/or drugs in their
system at the time of drowning, however this number could be higher as 34.9% of cases there was no
information about alcohol and/or drugs (Table 36).
Table 36 Alcohol and/or drugs by sex, people who drowned in a river in a rural and remote location, 1 July 2002 to 30 June 2007, NCIS
Female Male Total
Alcohol and/or Drugs N % N % N %
Yes 8 42.1 24 35.8 32 37.2
No 7 36.8 17 25.4 24 27.9
Unknown 4 21.1 26 38.8 30 34.9
Total 19 100.0 67 100.0 86 100.0
Approximately half of the people who drowned in a rural and remote river were visitors to the river (i.e.
lived in a different postcode to the one in which the incident occurred) (Table 37).
Table 37 Visitor status by sex, people who drowned in a river in a rural and remote location, 1 July 2002 to 30 June 2007, NCIS
Female Ma le To tal
Visitor Status N % N % N % Not a Visitor 8 42.1 34 50.7 42 48.8 Visitor 11 57.9 31 46.3 42 48.8 Unknown (information missing) 0 0.0 2 3.0 2 2.3
Total 19 100.0 67 100.0 86 100.0
Of people who drowned at rural and remote rivers, the majority (87.2%) of cases are closed (Table 38).
© AWSC August 2008 45
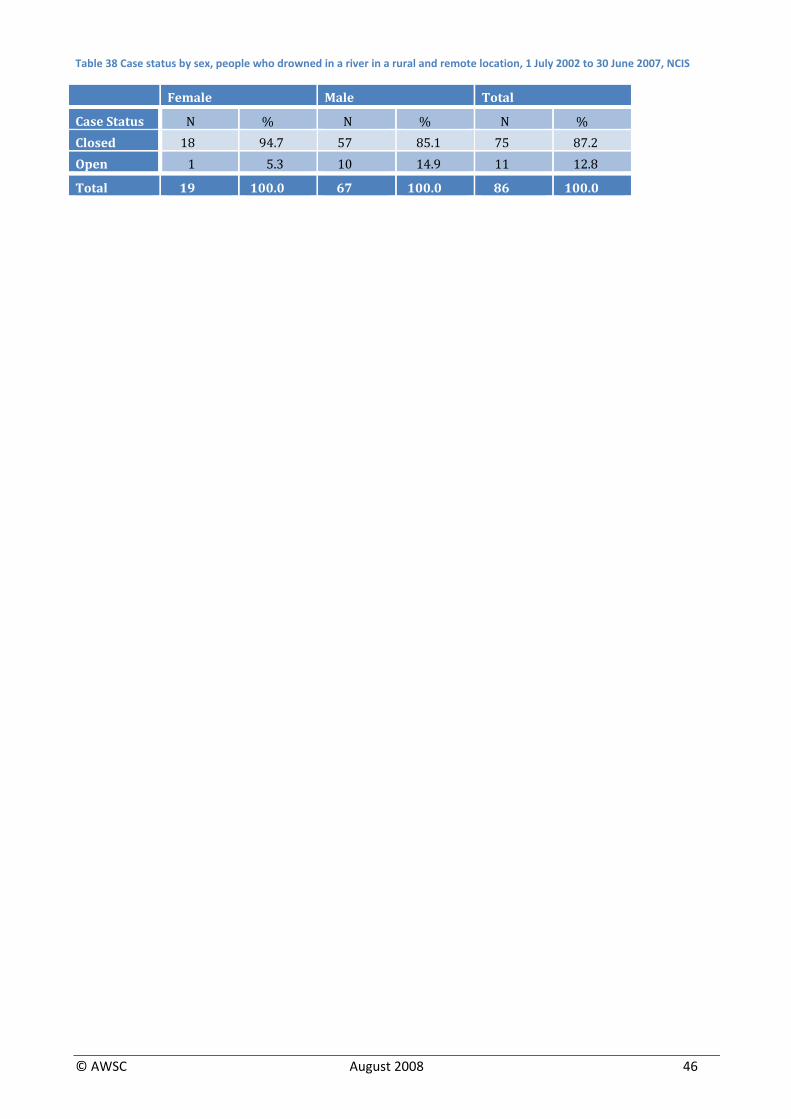
© AWSC August 2008 46
Table 38 Case status by sex, people who drowned in a river in a rural and remote location, 1 July 2002 to 30 June 2007, NCIS
Female Male Tot al
Case Status N % N % N % Closed 18 94.7 57 85.1 75 87.2 Open 1 5.3 10 14.9 11 12.8
Total 19 100.0 67 100.0 86 100.0
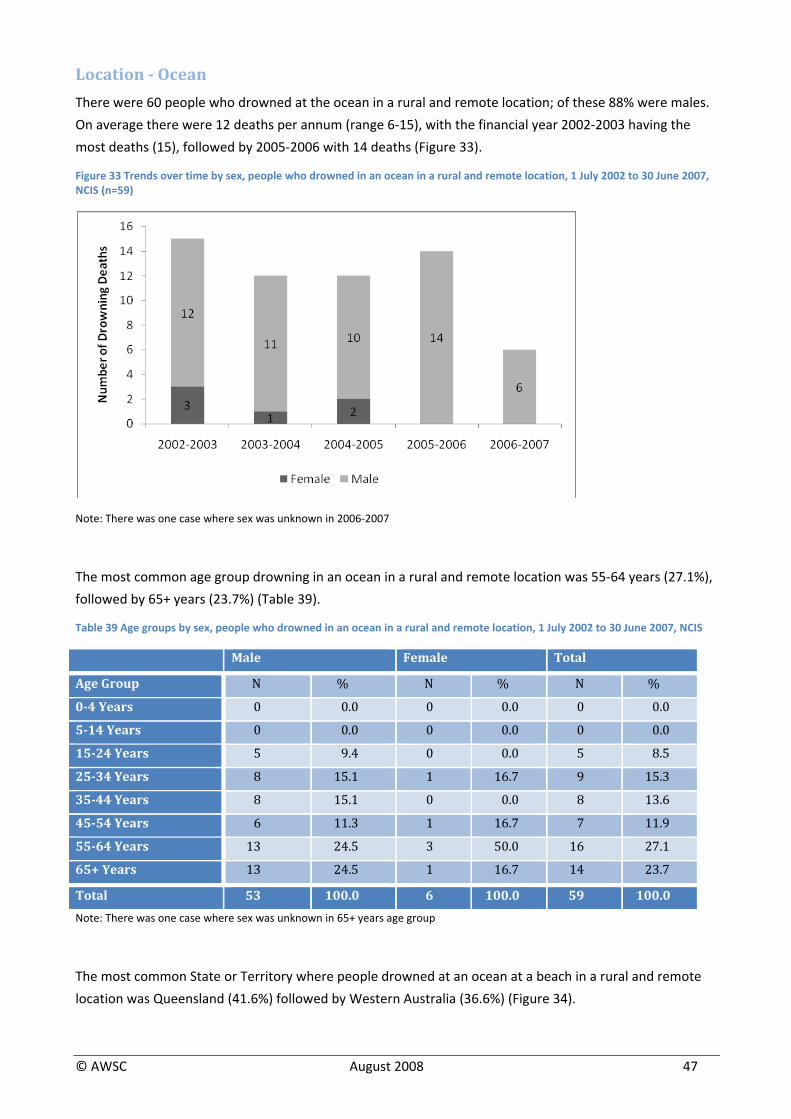
Location Ocean
There were 60 people who drowned at the ocean in a rural and remote location; of these 88% were males.
On average there were 12 deaths per annum (range 6‐15), with the financial year 2002‐2003 having the
most deaths (15), followed by 2005‐2006 with 14 deaths (Figure 33).
Figure 33 Trends over time by sex, people who drowned in an ocean in a rural and remote location, 1 July 2002 to 30 June 2007, NCIS (n=59)
Note: There was one case where sex was unknown in 2006‐2007
The most common age group drowning in an ocean in a rural and remote location was 55‐64 years (27.1%),
followed by 65+ years (23.7%) (Table 39).
Table 39 Age groups by sex, people who drowned in an ocean in a rural and remote location, 1 July 2002 to 30 June 2007, NCIS
Male Female Total
Age Group N % N % N %
04 Years 0 0.0 0 0.0 0 0.0
514 Years 0 0.0 0 0.0 0 0.0
1524 Years 5 9.4 0 0.0 5 8.5
2534 Years 8 15.1 1 16.7 9 15.3
3544 Years 8 15.1 0 0.0 8 13.6
4554 Years 6 11.3 1 16.7 7 11.9
5564 Years 13 24.5 3 50.0 16 27.1
65+ Years 13 24.5 1 16.7 14 23.7
Total 53 100.0 6 100.0 59 100.0
Note: There was one case where sex was unknown in 65+ years age group
The most common State or Territory where people drowned at an ocean at a beach in a rural and remote
location was Queensland (41.6%) followed by Western Australia (36.6%) (Figure 34).
© AWSC August 2008 47
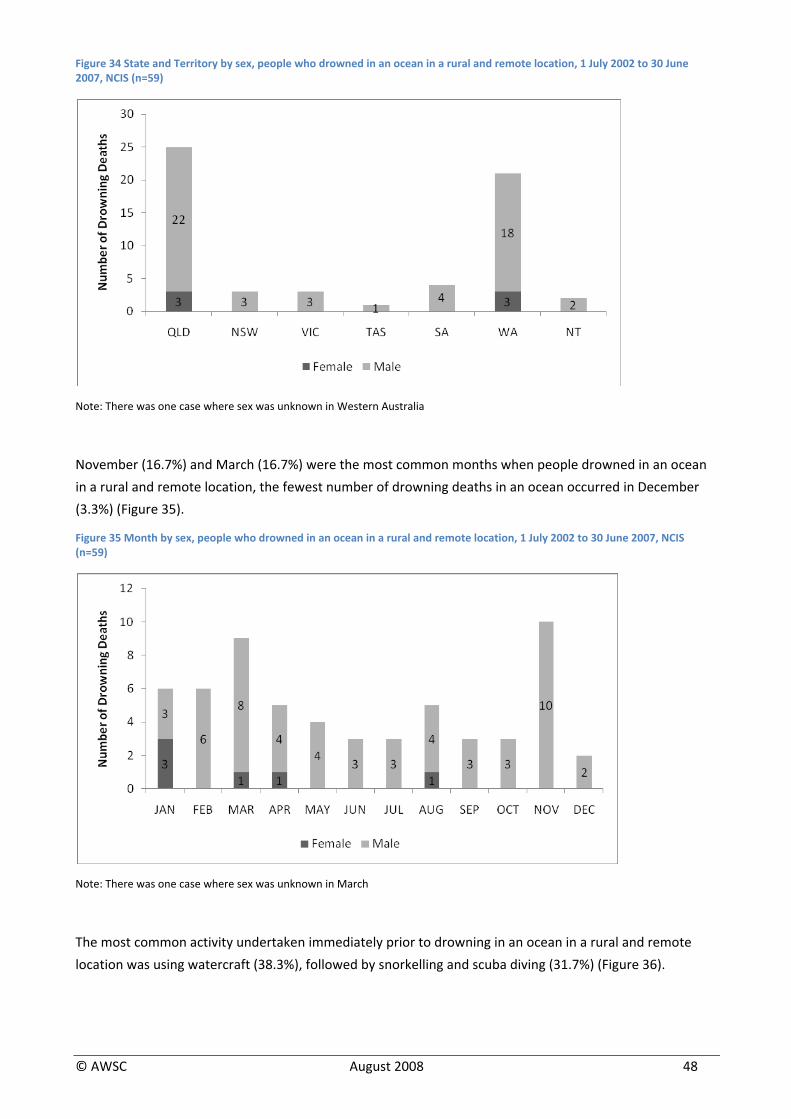
Figure 34 State and Territory by sex, people who drowned in an ocean in a rural and remote location, 1 July 2002 to 30 June 2007, NCIS (n=59)
Note: There was one case where sex was unknown in Western Australia
November (16.7%) and March (16.7%) were the most common months when people drowned in an ocean
in a rural and remote location, the fewest number of drowning deaths in an ocean occurred in December
(3.3%) (Figure 35).
Figure 35 Month by sex, people who drowned in an ocean in a rural and remote location, 1 July 2002 to 30 June 2007, NCIS (n=59)
Note: There was one case where sex was unknown in March
The most common activity undertaken immediately prior to drowning in an ocean in a rural and remote
location was using watercraft (38.3%), followed by snorkelling and scuba diving (31.7%) (Figure 36).
© AWSC August 2008 48
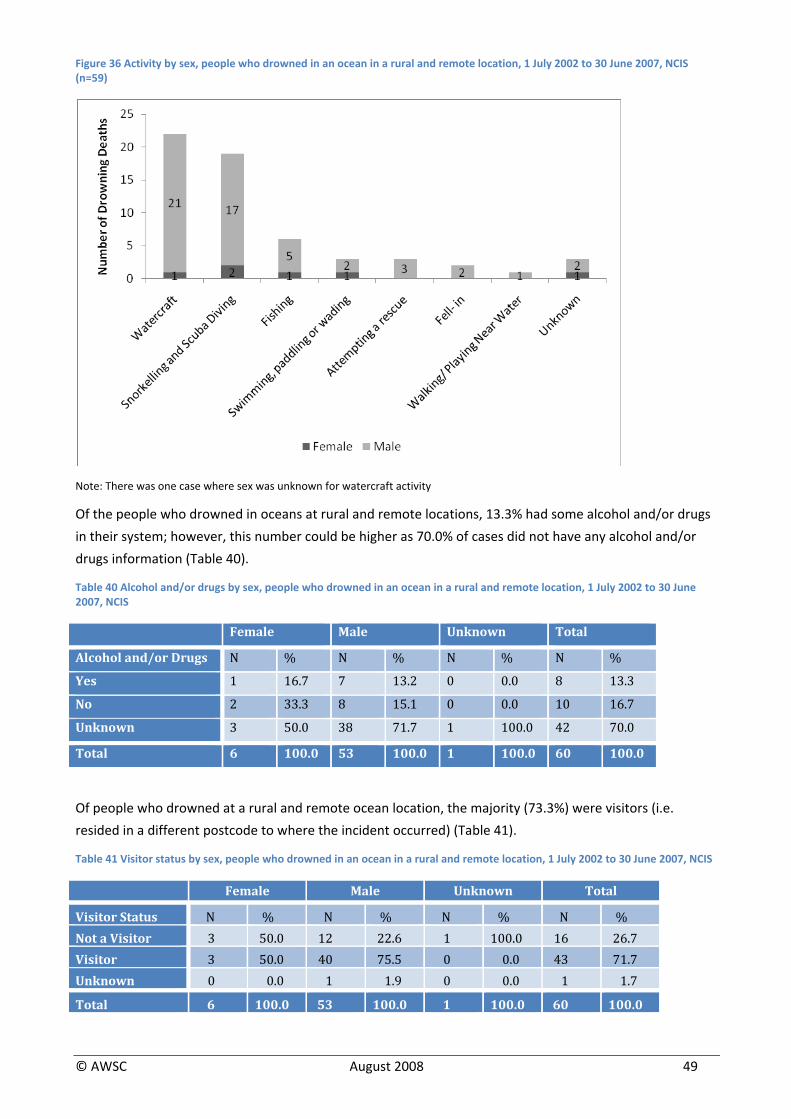
Figure 36 Activity by sex, people who drowned in an ocean in a rural and remote location, 1 July 2002 to 30 June 2007, NCIS (n=59)
Note: There was one case where sex was unknown for watercraft activity
Of the people who drowned in oceans at rural and remote locations, 13.3% had some alcohol and/or drugs
in their system; however, this number could be higher as 70.0% of cases did not have any alcohol and/or
drugs information (Table 40).
Table 40 Alcohol and/or drugs by sex, people who drowned in an ocean in a rural and remote location, 1 July 2002 to 30 June 2007, NCIS
Female Male Unknown Total
Alcohol and/or Drugs N % N % N % N %
Yes 1 16.7 7 13.2 0 0.0 8 13.3
No 2 33.3 8 15.1 0 0.0 10 16.7
Unknown 3 50.0 38 71.7 1 100.0 42 70.0
Total 6 100.0 53 100.0 1 100.0 60 100.0
Of people who drowned at a rural and remote ocean location, the majority (73.3%) were visitors (i.e.
resided in a different postcode to where the incident occurred) (Table 41).
Table 41 Visitor status by sex, people who drowned in an ocean in a rural and remote location, 1 July 2002 to 30 June 2007, NCIS
Female Male Unknow n Total
Visitor Status N % N % N % N % Not a Visitor 3 50.0 12 22.6 1 10 0.0 16 26.7 Visitor 3 50.0 40 75.5 0 0.0 43 71.7 Unknown 0 0.0 1 1.9 0 0.0 1 1.7
Total 6 100.0 53 100.0 1 100.0 60 100.0
© AWSC August 2008 49
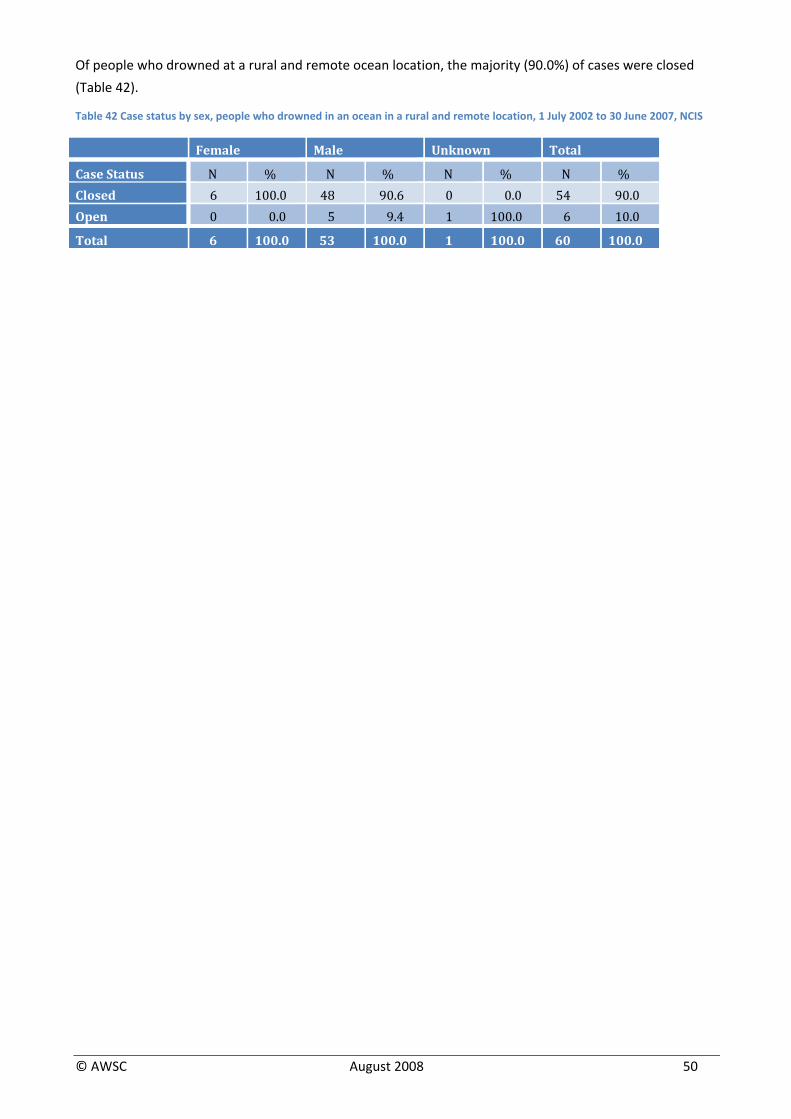
© AWSC August 2008 50
Of people who drowned at a rural and remote ocean location, the majority (90.0%) of cases were closed
(Table 42).
Table 42 Case status by sex, people who drowned in an ocean in a rural and remote location, 1 July 2002 to 30 June 2007, NCIS
Female Male Unknown Total
Case Status N % N % N % N % Closed 6 100.0 48 90.6 0 0.0 54 90.0 Open 0 0.0 5 9.4 1 100.0 6 10.0
Total 6 100.0 53 100.0 1 100.0 60 100.0
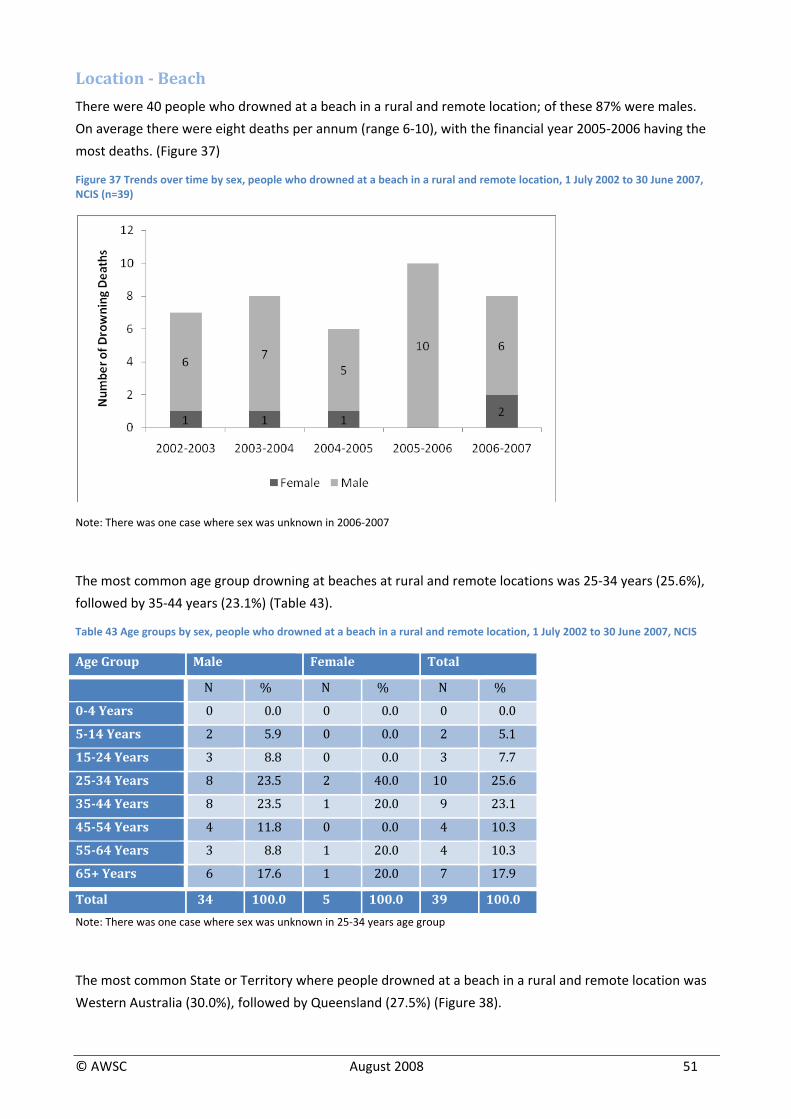
Location Beach
There were 40 people who drowned at a beach in a rural and remote location; of these 87% were males.
On average there were eight deaths per annum (range 6‐10), with the financial year 2005‐2006 having the
most deaths. (Figure 37)
Figure 37 Trends over time by sex, people who drowned at a beach in a rural and remote location, 1 July 2002 to 30 June 2007, NCIS (n=39)
Note: There was one case where sex was unknown in 2006‐2007
The most common age group drowning at beaches at rural and remote locations was 25‐34 years (25.6%),
followed by 35‐44 years (23.1%) (Table 43).
Table 43 Age groups by sex, people who drowned at a beach in a rural and remote location, 1 July 2002 to 30 June 2007, NCIS
Age Group Male Female Total
N % N % N %
04 Years 0 0.0 0 0.0 0 0.0
514 Years 2 5.9 0 0.0 2 5.1
1524 Years 3 8.8 0 0.0 3 7.7
2534 Years 8 23.5 2 40.0 10 25.6
3544 Years 8 23.5 1 20.0 9 23.1
4554 Years 4 11.8 0 0.0 4 10.3
5564 Years 3 8.8 1 20.0 4 10.3
65+ Years 6 17.6 1 20.0 7 17.9
Total 34 100.0 5 100.0 39 100.0
Note: There was one case where sex was unknown in 25‐34 years age group
The most common State or Territory where people drowned at a beach in a rural and remote location was
Western Australia (30.0%), followed by Queensland (27.5%) (Figure 38).
© AWSC August 2008 51
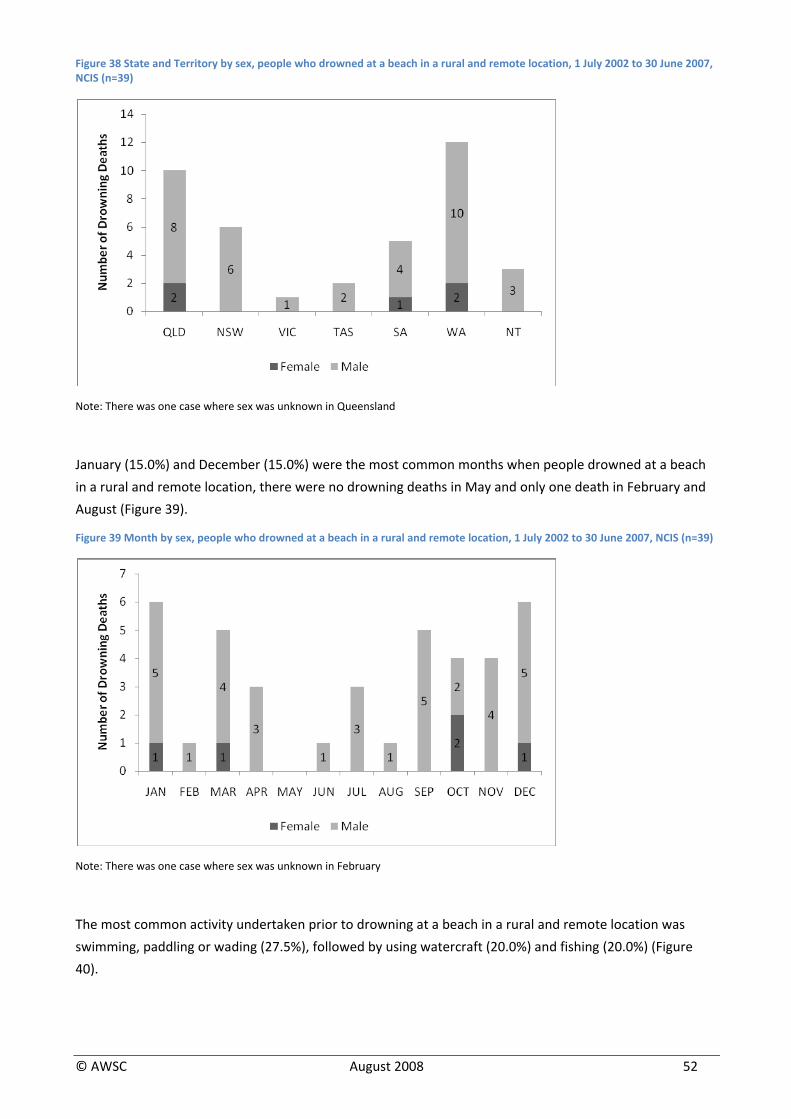
Figure 38 State and Territory by sex, people who drowned at a beach in a rural and remote location, 1 July 2002 to 30 June 2007, NCIS (n=39)
Note: There was one case where sex was unknown in Queensland
January (15.0%) and December (15.0%) were the most common months when people drowned at a beach
in a rural and remote location, there were no drowning deaths in May and only one death in February and
August (Figure 39).
Figure 39 Month by sex, people who drowned at a beach in a rural and remote location, 1 July 2002 to 30 June 2007, NCIS (n=39)
Note: There was one case where sex was unknown in February
The most common activity undertaken prior to drowning at a beach in a rural and remote location was
swimming, paddling or wading (27.5%), followed by using watercraft (20.0%) and fishing (20.0%) (Figure
40).
© AWSC August 2008 52
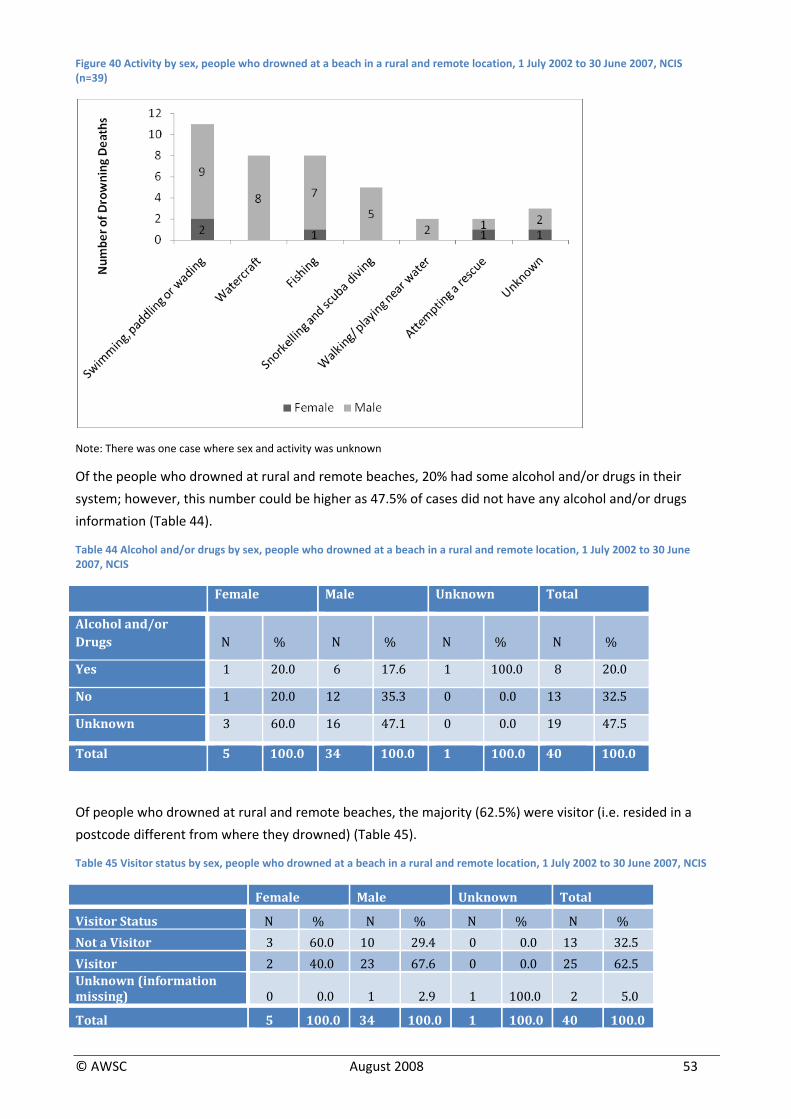
Figure 40 Activity by sex, people who drowned at a beach in a rural and remote location, 1 July 2002 to 30 June 2007, NCIS (n=39)
Note: There was one case where sex and activity was unknown
Of the people who drowned at rural and remote beaches, 20% had some alcohol and/or drugs in their
system; however, this number could be higher as 47.5% of cases did not have any alcohol and/or drugs
information (Table 44).
Table 44 Alcohol and/or drugs by sex, people who drowned at a beach in a rural and remote location, 1 July 2002 to 30 June 2007, NCIS
Female Male Unknown Total
Alcohol and/or Drugs N % N % N % N %
Yes 1 20.0 6 17.6 1 100.0 8 20.0
No 1 20.0 12 35.3 0 0.0 13 32.5
Unknown 3 60.0 16 47.1 0 0.0 19 47.5
Total 5 100.0 34 100.0 1 100.0 40 100.0
Of people who drowned at rural and remote beaches, the majority (62.5%) were visitor (i.e. resided in a
postcode different from where they drowned) (Table 45).
Table 45 Visitor status by sex, people who drowned at a beach in a rural and remote location, 1 July 2002 to 30 June 2007, NCIS
Female Male Unknown Total
Visitor Status N % N % N % N % Not a Visitor 3 60.0 10 29.4 0 0.0 13 32.5 Visitor 2 40.0 23 67.6 0 0.0 25 62.5 Unknown (information missing) 0 0.0 1 2.9 1 100.0 2 5.0
Total 5 100.0 34 100.0 1 100.0 40 100.0
© AWSC August 2008 53
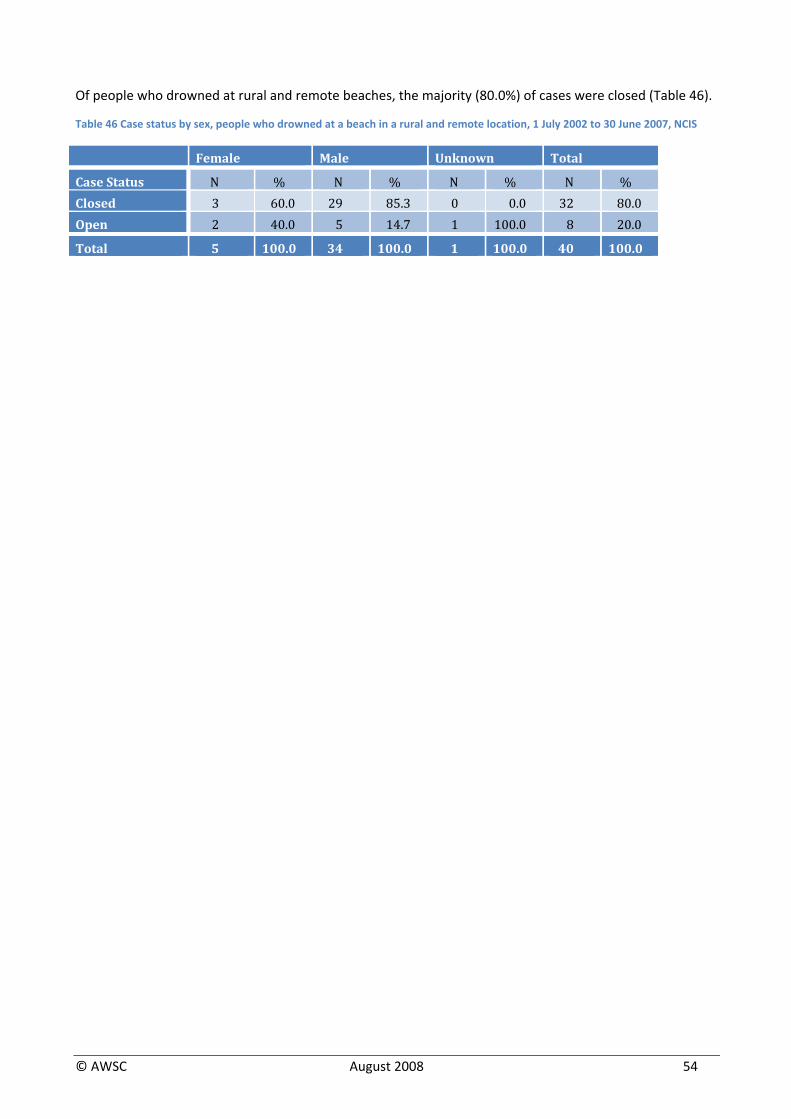
© AWSC August 2008 54
Of people who drowned at rural and remote beaches, the majority (80.0%) of cases were closed (Table 46).
Table 46 Case status by sex, people who drowned at a beach in a rural and remote location, 1 July 2002 to 30 June 2007, NCIS
Female Male Unknown Total
Case Status N % N % N % N % Closed 3 60.0 29 85.3 0 0.0 32 80.0 Open 2 40.0 5 14.7 1 100.0 8 20.0
Total 5 100.0 34 100.0 1 100.0 40 100.0
Discussion
Goal four of the Draft Australian Water Safety Strategy 2008‐2011, aims to reduce rural and remote
drowning deaths, with the overall aim of reducing all drowning deaths in Australia by 50% by 2020. This
will not be an easy task and the better the information about drowning deaths and the effectiveness of
preventative strategies, the easier this task will be for those agencies involved in preventing these deaths.
Rural and remote drowning deaths can be divided into two groups, those who reside at rural and remote
locations and those who drown at rural and remote locations. This report examines drowning deaths of
residents of rural and remote locations using ABS and NCIS data, and in keeping with the framework of the
draft Australian Water Safety Strategy, an analysis of the three priority age groups (0‐4 years, 18‐34 years
and 55+ years) using the NCIS data was undertaken. An examination of drowning deaths at rural and
remote locations was undertaken using NCIS data including those rural and remote locations with high
numbers of drowning deaths (rivers, oceans and beaches).
Drowning deaths of residents of rural and remote locations
From the ABS data (1992‐1993 to 2003‐2004), there were on average 62 drowning deaths of residents of
rural and remote locations in Australia per annum, where as there were 50 drowning deaths per annum in
the NCIS data (2002‐2003 to 2006‐2007). In both datasets, there was a reduction in the number of deaths
over their respective study periods with the ABS data decreasing from 92 deaths in 1992‐1993 to 34 in
2003‐2004 and the NCIS data decreasing from 62 in 2002‐2003 to 42 in 2006‐2007.
For the two years where both datasets had information, in 2002‐2003 the number of deaths were similar
(ABS 61 and NCIS 62), whereas in 2003‐04, the number of deaths in the NCIS dataset (51 deaths) was 50%
greater than the ABS dataset (34 deaths). This discrepancy is related to the way information is collected
and the amount of time since the end of the collection period (i.e. the longer the period of time from each
collection to when the information is provided the more complete the information) 15.
Residents of rural and remote locations are at a higher risk of death from drowning than residents of urban
locations. From the ABS data, residents of rural and remote locations had an overall crude drowning death
rate of 4.14 per 100,000 males and 1.15 per 100,000 females compared to an overall crude rate of 2.54 per
100,000 urban males and 0.69 per 100,000 urban females. A similar result was found in the NCIS data with
male and female residents of rural and remote locations having a drowning death rate 1.7 times higher
than their urban counterparts do.
There were a number of age groups overrepresented in residents of rural and remote locations drowning
deaths. In the ABS data the 0‐4 years age group had the highest number of deaths and in both the ABS and
the NCIS approximately half (46.9% ABS and 49.1% NCIS) of all drowning deaths were aged between 25 and
54 years. While the 25‐54 years age has not been target specifically in the Strategy, the 18‐34 years age
group has and is examined.
In both datasets, the three States or Territories with the most drowning deaths were Queensland, New
South Wales and Western Australia; however, the Northern Territory had the highest rate per 100,000.
Strategies targeting rural and remote communities in Queensland, New South Wales, Western Australia
and the Northern Territory will have the greatest impact on reducing the number and rate of drowning
deaths of residents of rural and remote locations.
© AWSC August 2008 55
The warmer months (approximately October through to April) where when most drowning deaths to
residents of rural and remote locations occurred and, as such, strategies that require public involvement
(e.g. awareness raising or undertaking actions) should be undertaken during this period. There is currently
no information about exposure to aquatics by residents of rural and remote locations, but it could be
assumed to be similar to the wider population, that is during the warmer months more people will be
participating in aquatic activity and visiting places where there is water.
The ABS data does not contain as much detail about the location and activity as can be gleaned from the
NCIS data. In the ABS data ocean / bay / harbour and lake / river / lagoon were the two location groupings
with the most deaths. Whereas in the NCIS data, river, ocean, beach and swimming pool were the most
common locations. In both groups there were a large number of people who drowned who were not
intending to go into the water (e.g. fell or wandered in, walking playing near water).
Information about Aboriginal and Torres Strait Islander drowning deaths is hard to gather. This information
is collected poorly in the ABS data and is nearly non‐existent in the NCIS data. As such the NCIS information
was not used in this report. In the ABS data, nearly one in five people from rural and remote locations who
drowned were of Aboriginal or Torres Strait Islander descent. Strategies specifically developed to address
Aboriginal and Torres Strait Islander drowning will help reduce the overall number of residents from rural
and remote locations drowning.
Information about the visitor status of a person was examined in both datasets. In the ABS data, 94% of all
drowning deaths of residents of rural and remote location were in the State or Territory in which they lived.
In the NCIS data, 63% of drowning deaths occurred in the same postcode in which they lived. What we can
conclude from this is that primarily residents of rural and remote location drown near to where they live.
Strategies that are locally focused may have a greater impact in reducing drowning deaths of residents of
rural and remote locations.
Age groups (NCIS Data)
Three age groups were examined in greater detail using NCIS data (0‐4 years, 18‐34 years and 55+ years), as
these age groups have been identified in the Draft Australian Water Safety Strategy 2008‐2011 as high risk.
The analysis of age groups was of residents of rural and remote locations and examined the number of
deaths per annum, State or Territory of death, time of year (month), location, activity, alcohol and/or drugs
(except for children 0‐4 years), visitor status and case status.
In the NCIS data there were 22 deaths of children under five years of age, with over half (59.1%) of them
occurring in either Queensland or Western Australia. While drowning deaths occurred all year round, there
was a decrease in the number of deaths from 11 in 2002‐2003 to two in 2005‐2006 and 2006‐2007, it is
possible that the later years are an under numeration of deaths and as such should be used with caution.
Common locations were swimming pools and rivers. Similar to wider child drowning death prevention
strategies, those that restrict a child’s access to water (pool fencing) and promote supervision should have
an impact on reducing these deaths 22 23. The majority (91%) of children 0‐4 years of age who drowned did
so in the postcode in which they lived, thus strategies should be aimed at targeting parents and carers of
children where they live.
Of the 61 deaths in the 18‐34 years age group, the majority (92%) were males. Alcohol and/or drugs were
present at the time of drowning in a third of the males and all bar one of the females. Strategies targeting
alcohol use and aquatic activity are required for this age group. There were on average 12 deaths per
© AWSC August 2008 56
annum and this remained reasonably consistent over time; however, the deaths tended to occur during the
warmer months. Common locations were rivers, swimming pools, ocean and beach and the common
activities were swimming, paddling or wading and using watercraft. In this age group, people were more
likely to be in or on the water immediately prior to drowning, therefore strategies should focus on activities
that people undertake in or on the water. Most people in this age group drowned close to home (i.e. in the
postcode in which they lived).
There were on average 12 people over 55 years of age who were residents of rural and remote locations
that drowned per annum and while there has been a decrease in the number of deaths over the five‐year
period this should be used with some caution. Drowning death tended to occur all year round. Western
Australia, Queensland and New South Wales had the most deaths. Due to the number of people in each
age group decreasing at a faster rate than the number of drowning deaths, there is an increase in the rate
of drowning while there is a decrease in the number of deaths. Common locations were rivers and oceans
and the common activities meant the person was out of the water immediately prior to the incident.
Strategies that give older people skills to get out of trouble after falling‐in should be available and used.
Using watercraft was also a common activity and attention needs to focus on reducing drowning deaths
related to using watercraft. Alcohol and or drugs were in the person’s system at the time of drowning in
approximately one in five cases. Most people in this age group drowned close to home (i.e. in the postcode
in which they lived).
People drowning at rural and remote locations (NCIS Data)
There were on average 70 people who drowned per annum at rural and remote locations, the majority
(61.9%) of which were residents of rural and remote locations. Nearly a third (29.8%) of all drowning
deaths occurred in Queensland. A third (33.2%) of all drowning deaths was of people aged 25‐44 years.
The hotter months were when most of the drowning deaths occurred and common locations were rivers,
oceans and beaches. Using watercraft and swimming, paddling or wading were common activities. One‐
quarter of people had alcohol and/or drugs in their system. Over half drowned in a postcode different to
the one in which they were living. For people visiting rural and remote locations, strategies targeting the
locations they are visiting are more likely to have an impact on reducing drowning deaths. As such, the
three most common locations are examined in detail.
Locations (NCIS Data)
Rural and remote rivers were the most common drowning location in the NCIS data with an average of 17
deaths per annum, which remained consistent across the five years. Nearly four out of the five deaths
(78%) were males. The most common age group was 35‐44 years but all age groups less than 45 years of
age were represented. Northern Territory and Queensland were the two most common States or Territory
and the first quarter of the year (January to March) was more common. Common activities were transport
(for work / recreation) and swimming, paddling or wading. A third (37%) of the people who drowned had
alcohol and/or drugs in the system at the time of death and just under half (49%) lived in the postcode
where the drowning occurred. Strategies targeting males aged 18‐44 years and alcohol in Northern
Territory and Queensland should have the greatest impact on reducing drowning death at rural and remote
rivers.
The majority of ocean drowning deaths at rural and remote locations were male (88%), with an average of
eight deaths per annum, although there was a dip in this number in 2006‐2007. Using watercraft and
© AWSC August 2008 57
undertaking snorkelling and scuba diving were the most common activities. Queensland and Western
Australia were the States or Territories with the most deaths and these deaths tended to occur all year
round. Alcohol and/or drugs were only noted as present in 13% of cases; however, there were a large
number where the alcohol and/or drugs status was unknown (70%). Three‐quarters of ocean deaths were
of visitors. Strategies that target watercraft activities and snorkelling and scuba diving in Queensland and
Western Australia should have the greatest impact in reducing the number of drowning deaths at rural and
remote oceans.
At rural and remote beach locations, the people who drowned were predominately males (87%), aged 25‐
44 years (48.7%). The number of deaths per annum at rural and remote beaches has been fairly consistent
with an average of eight deaths per annum. Western Australia and Queensland were the two most
common States or Territories and more drowning deaths occurred during the warmer months. People
were commonly in the water (e.g. swimming, paddling or wading, snorkelling and scuba diving) prior to the
drowning incident and approximately two‐thirds (62.5%) were visitors to the location (i.e. lived in a
different postcode). Alcohol and/or drugs were present in one in five people’s system at the time of
drowning. Strategies to reduce drowning deaths at rural and remote beach locations should target males
aged 25‐44 years who undertake aquatic activities in Western Australia and Queensland to have the
greatest initial impact.
Data issues
Both the ABS and the NCIS data have their strengths and limitations and this report did not set out to test
the differences between the two datasets. Driscoll et al 15 in their examination of alcohol and water safety
provided detailed information about the use of both datasets. The biggest issue with using either dataset is
the completeness of the data, as both datasets appear to miss cases that occur towards the end of a
collection period.
While the ABS data collection is well established, the length of time from collection to release, lack of detail
and information is collected in calendar years (i.e. the peak drowning period of summer fall across two
collection periods), reduces its usefulness for providing timely up to date information about drowning.
Conversely, NCIS data is available in a timelier manner (except for Queensland who wait until the case is
closed before entering it into the system). There is a greater amount of information available once the case
is closed which is very useful for prevention purposes. The time taken for a case to close and the lack of
case detail available until the case closes means that some cases are missed and some are included that are
later excluded making it hard to be confident that all cases are included.
In 2007 the ABS started to provide ICD‐10 coding and Australian Standard Geographical Classification
(ASGC) code for all cases from 1 January 2005. It is anticipated that the combining of information will allow
for better identification of drowning related cases, and provide a stronger historical perspective of deaths
in Australia.
Conclusion
This study aimed to provide an overall examination of unintentional drowning deaths at rural and remote
locations and of people from rural and remote locations. This study achieves this aim and provides insights
into where preventative strategies should be targeted for maximum impact. There is unfortunately no one
strategy that will prevent all rural and remote drowning deaths, therefore a wide variety of strategies
© AWSC August 2008 58
© AWSC August 2008 59
targeting a range of age groups, aquatic locations, and activities (including consuming alcohol) will be
required to reduce rural drowning deaths.
Glossary
ABS Australian Bureau of Statistics
ACT Australian Capital Territory
ALGA Australian Local Government Association
ANZSBEG Australia & New Zealand Safe Boating Education Group
APR April
ARI Aquatic and Recreation Institute
ARIA Accessibility/Remoteness Index of Australia
ASCTA Australian Swimming Coaches and Teachers Association
ASGC Australian Standard Geographical Classification
AUG August
AUSTSWIM Australian Council for the Teaching of Swimming and Water Safety
AWSC Australian Water Safety Council
CD Collection District
DEC December
Drowning Drowning is the process of experiencing respiratory impairment from
submersion/immersion in liquid. Drowning outcomes are classified as death,
morbidity and no morbidity 24
FEB February
FSA Farmsafe Australia
ICD International Classification of Diseases
ICD‐9 International Classification of Diseases 9th Revision
ICD‐10 International Classification of Diseases 10th Revision
JAN January
JUL July
JUN June
MAR March
MAY May
NCIS National Coroners Information System
NOV November
NSW New South Wales
NT Northern Territory
© AWSC August 2008 60
© AWSC August 2008 61
NWSP National Water Safety Plan
OCT October
QLD Queensland
RA Remoteness Area
RLSSA Royal Life Saving Society Australia
SA South Australia
SCORS Standing Committee on Recreation and Sport
SEP September
SLA Statistical Local Area
SLSA Surf Life Saving Australia
SPSS Statistical Package for the Social Sciences
TAS Tasmania
UCoD Underlying Cause of Death
VIC Victoria
WA Western Australia
Tables
Table 1 Drowning Flag 16 ........................................................................................................................................................................ 10
Table 2 Activity and Location groups ..................................................................................................................................................... 11
Table 3 – Drugs and Alcohol Flag codes ................................................................................................................................................. 11
Table 4 Age groups by sex, residents of rural and remote locations, 1 July 1992 to 30 June 2004, ABS ............................................... 16
Table 5 Drowning death rate per 100,000 population by gender, age group and remoteness classification, 1 July 1992 to 30 June 2004, ABS............................................................................................................................................................................................... 17
Table 6 Age group by years (grouped) by remoteness classification, residents of rural and remote locations, 1 July 1992 to 30 June 2004, ABS............................................................................................................................................................................................... 18
Table 7 State and Territory by remoteness classification, residents of rural and remote locations, 1 July 1992 to 30 June 2004, ABS19
Table 8 Month of drowning by remoteness classification, residents of rural and remote locations, 1 July 1992 to 30 June 2004, ABS ............................................................................................................................................................................................................... 19
Table 9 Location by remoteness classification, residents of rural and remote locations, 1 July 1992 to 30 June 2002, ABS ................ 20
Table 10 Activity by remoteness classification, residents of rural and remote locations, 1 July 1992 to 30 June 2002, ABS................ 20
Table 11 Alcohol and/or drugs by remoteness classification, residents of rural and remote locations, 1 July 1992 to 30 June 2002, ABS ........................................................................................................................................................................................................ 21
Table 12 Aboriginal and Torres Strait Islander status by remoteness classification, residents of rural and remote locations, 1 July 1992 to 30 June 2004, ABS .................................................................................................................................................................... 21
Table 13 Visitor status by remoteness classification, residents of rural and remote locations, 1 July 1992 to 30 June 2004, ABS ....... 21
Table 14 Location of incident by remoteness category by residence by remoteness classification, 1 July 2002 to 30 June 2007, NCIS ............................................................................................................................................................................................................... 22
Table 15 Age group by sex, residents of rural and remote locations, 1 July 2002 to 30 June 2007, NCIS ............................................. 23
Table 16 Sex by remoteness classification, residents of rural and remote locations, 1 July 2002 to 30 June 2007, NCIS ..................... 23
Table 17 State and Territory by sex, residents of rural and remote locations, 1 July 2002 to 30 June 2007, NCIS ............................... 24
Table 18 Alcohol and/or drugs by sex, residents of rural and remote locations, 1 July 2002 to 30 June 2007, NCIS ............................ 26
Table 19 Visitor status by sex, residents of rural and remote locations, 1 July 2002 to 30 June 2007, NCIS ........................................ 26
Table 20 Case status by sex, residents of rural and remote locations, 1 July 2002 to 30 June 2007, NCIS ........................................... 26
Table 21 Visitor status by sex, children 0‐4 years, residents of rural and remote locations, 1 July 2002 to 30 June 2007, NCIS .......... 29
Table 22 Case status by sex, children 0‐4 years, residents of rural and remote locations, 1 July 2002 to 30 June 2007, NCIS ............. 29
Table 23 Alcohol and/or drugs by sex, people 18‐34 years, residents of rural and remote locations, 1 July 2002 to 30 June 2007, NCIS ....................................................................................................................................................................................................... 32
Table 24 Visitor status by sex, people 18‐34 years, residents of rural and remote locations, 1 July 2002 to 30 June 2007, NCIS ........ 33
Table 25 Case status by sex, people 18‐34 years, residents of rural and remote locations, 1 July 2002 to 30 June 2007, NCIS ........... 33
Table 26 Alcohol and/or drugs by sex for people 55+ years of age residents of rural and remote locations, 1 July 2002 to 30 June 2007, NCIS ............................................................................................................................................................................................. 37
Table 27 Visitor status by sex for people 55+ years of age residents of rural and remote locations, 1 July 2002 to 30 June 2007, NCIS ............................................................................................................................................................................................................... 37
Table 28 Cases status by sex for people 55+ years of age residents of rural and remote locations, 1 July 2002 to 30 June 2007, NCIS ............................................................................................................................................................................................................... 37
Table 29 Age groups by sex, drowning deaths at rural and remote locations, 1 July 2002 to 30 June 2007, NCIS ............................... 38
Table 30 Sex by remoteness classification, drowning deaths at rural and remote locations, 1 July 2002 to 30 June 2007, NCIS ......... 39
Table 31 Residence remoteness classification by drowning location remoteness classification........................................................... 39
Table 32 Alcohol and/or drugs by sex, drowning deaths at rural and remote locations, 1 July 2002 to 30 June 2007, NCIS ................ 41
Table 33 Visitor status by sex, drowning deaths at rural and remote locations, 1 July 2002 to 30 June 2007, NCIS ............................ 41
Table 34 Case status by sex, drowning deaths at rural and remote locations, 1 July 2002 to 30 June 2007, NCIS ............................... 42
© AWSC August 2008 62
Table 35 Age groups by sex, people who drowned in a river in a rural and remote location, 1 July 2002 to 30 June 2007, NCIS ........ 43
Table 36 Alcohol and/or drugs by sex, people who drowned in a river in a rural and remote location, 1 July 2002 to 30 June 2007, NCIS ....................................................................................................................................................................................................... 45
Table 37 Visitor status by sex, people who drowned in a river in a rural and remote location, 1 July 2002 to 30 June 2007, NCIS ..... 45
Table 38 Case status by sex, people who drowned in a river in a rural and remote location, 1 July 2002 to 30 June 2007, NCIS ........ 46
Table 39 Age groups by sex, people who drowned in an ocean in a rural and remote location, 1 July 2002 to 30 June 2007, NCIS .... 47
Table 40 Alcohol and/or drugs by sex, people who drowned in an ocean in a rural and remote location, 1 July 2002 to 30 June 2007, NCIS ....................................................................................................................................................................................................... 49
Table 41 Visitor status by sex, people who drowned in an ocean in a rural and remote location, 1 July 2002 to 30 June 2007, NCIS . 49
Table 42 Case status by sex, people who drowned in an ocean in a rural and remote location, 1 July 2002 to 30 June 2007, NCIS .... 50
Table 43 Age groups by sex, people who drowned at a beach in a rural and remote location, 1 July 2002 to 30 June 2007, NCIS ...... 51
Table 44 Alcohol and/or drugs by sex, people who drowned at a beach in a rural and remote location, 1 July 2002 to 30 June 2007, NCIS ....................................................................................................................................................................................................... 53
Table 45 Visitor status by sex, people who drowned at a beach in a rural and remote location, 1 July 2002 to 30 June 2007, NCIS ... 53
Table 46 Case status by sex, people who drowned at a beach in a rural and remote location, 1 July 2002 to 30 June 2007, NCIS ..... 54
Table 47 Inner Regional Australia Postcodes ......................................................................................................................................... 67
Table 48 Outer Regional Australia Postcodes ........................................................................................................................................ 68
Table 49 Remote Australia Postcodes ................................................................................................................................................... 69
Table 50 Very Remote Postcodes .......................................................................................................................................................... 70
© AWSC August 2008 63
Figures
Figure 1 ASGC Remoteness Areas (RAs) of Australia (pg 12) 6 ................................................................................................................. 7
Figure 2 NCIS Data by Visitor Status ...................................................................................................................................................... 14
Figure 3 Number of drowning deaths per annum by sex, residents of rural and remote locations, 1 July 1992 to 30 June 2004, ABS (n=812) .................................................................................................................................................................................................. 15
Figure 4 Number of drowning deaths by sex per annum, residents of rural and remote locations, 1 July 2002 to 30 June 2007, NCIS (n=249) .................................................................................................................................................................................................. 22
Figure 5 Month of drowning by sex, residents of rural and remote locations, 1 July 2002 to 30 June 2007, NCIS (n=249) .................. 24
Figure 6 Location of drowning deaths by sex, residents of rural and remote locations, 1 July 2002 to 30 June 2007, NCIS (n=249) ... 25
Figure 7 Activity by sex, residents of rural and remote locations, 1 July 2002 to 30 June 2007, NCIS (n=249) ..................................... 25
Figure 8 Number of drowning deaths of children 0‐4 years, residents of rural and remote locations by sex per annum, 1 July 2002 to 30 June 2007, NCIS (n=22) ..................................................................................................................................................................... 27
Figure 9 State and Territory by sex, children 0‐4 years, residents of rural and remote locations, 1 July 2002 to 30 June 2007, NCIS (n=22) .................................................................................................................................................................................................... 27
Figure 10 Month of drowning by sex, children 0‐4 years, residents of rural and remote locations, 1 July 2002 to 30 June 2007, NCIS (n=22) .................................................................................................................................................................................................... 28
Figure 11 Location by sex, children 0‐4 years, residents of rural and remote locations, 1 July 2002 to 30 June 2007, NCIS (n=22) ..... 28
Figure 12 Activity by sex, children 0‐4 years, residents of rural and remote locations, 1 July 2002 to 30 June 2007, NCIS (n=22) ...... 29
Figure 13 Number of drowning deaths by sex per annum of people 18‐34 years, residents of rural and remote locations, 1 July 2002 to 30 June 2007, NCIS (n=61)................................................................................................................................................................. 30
Figure 14 State and Territory by sex, people 18‐34 years, residents of rural and remote locations, 1 July 2002 to 30 June 2007, NCIS (n=61) .................................................................................................................................................................................................... 30
Figure 15 Month of drowning by sex, people 18‐34 years, residents of rural and remote locations, 1 July 2002 to 30 June 2007, NCIS (n=61) .................................................................................................................................................................................................... 31
Figure 16 Location by sex, people 18‐34 years, residents of rural and remote locations, 1 July 2002 to 30 June 2007, NCIS (n=61) ... 31
Figure 17 Activity by sex, people 18‐34 years, residents of rural and remote locations, 1 July 2002 to 30 June 2007, NCIS (n=61) .... 32
Figure 18 Number of drowning deaths by sex per annum, people 55 years and older, residents of rural and remote locations, 1 July 2002 to 30 June 2007, NCIS (n=60) ........................................................................................................................................................ 34
Figure 19 Age groups by sex of people 55 years and older residents of rural and remote locations, 1 July 2002 to 30 June 2007, NCIS (m=60) ................................................................................................................................................................................................... 34
Figure 20 State and Territory by sex, for people 55+ years of age residents of rural and remote locations, 1 July 2002 to 30 June 2007, NCIS (n=60) .................................................................................................................................................................................. 35
Figure 21 Month of drowning by sex for people 55+ years of age residents of rural and remote locations, 1 July 2002 to 30 June 2007, NCIS (n=60) .................................................................................................................................................................................. 35
Figure 22 Location by sex for people 55+ years of age residents of rural and remote locations, 1 July 2002 to 30 June 2007, NCIS (n=60) .................................................................................................................................................................................................... 36
Figure 23 Activity by sex for people 55+ years of age residents of rural and remote locations, 1 July 2002 to 30 June 2007, NCIS (n=60) .................................................................................................................................................................................................... 36
Figure 24 Number of drowning deaths at rural and remote locations by sex per annum, 1 July 2002 to 30 June 2007, NCIS (n=349) 38
Figure 25 State or Territory of incident by sex, drowning deaths at rural and remote locations, 1 July 2002 to 30 June 2007, NCIS (n=349) .................................................................................................................................................................................................. 39
Figure 26 Sex by month of drowning deaths at rural and remote locations, 1 July 2002 to 30 June 2007, NCIS (n=349)..................... 40
Figure 27 Location by sex of drowning deaths at rural and remote locations, 1 July 2002 to 30 June 2007, NCIS (n=349) .................. 40
Figure 28 Activity prior to death by sex, drowning deaths at rural and remote locations, 1 July 2002 to 30 June 2007, NCIS (n=349) 41
Figure 29 Trends over time by sex, people who drowned in a river in a rural and remote location, 1 July 2002 to 30 June 2007, NCIS (n=86) .................................................................................................................................................................................................... 43
Figure 30 State and Territory by sex, people who drowned in a river in a rural and remote location, 1 July 2002 to 30 June 2007, NCIS (n=86) ............................................................................................................................................................................................ 44
© AWSC August 2008 64
© AWSC August 2008 65
Figure 31 Month by sex, people who drowned in a river in a rural and remote location, 1 July 2002 to 30 June 2007, NCIS (n=86) ... 44
Figure 32 Activity by sex, people who drowned in a river in a rural and remote location, 1 July 2002 to 30 June 2007, NCIS (n=86).. 45
Figure 33 Trends over time by sex, people who drowned in an ocean in a rural and remote location, 1 July 2002 to 30 June 2007, NCIS (n=59) ............................................................................................................................................................................................ 47
Figure 34 State and Territory by sex, people who drowned in an ocean in a rural and remote location, 1 July 2002 to 30 June 2007, NCIS (n=59) ............................................................................................................................................................................................ 48
Figure 35 Month by sex, people who drowned in an ocean in a rural and remote location, 1 July 2002 to 30 June 2007, NCIS (n=59) ............................................................................................................................................................................................................... 48
Figure 36 Activity by sex, people who drowned in an ocean in a rural and remote location, 1 July 2002 to 30 June 2007, NCIS (n=59) ............................................................................................................................................................................................................... 49
Figure 37 Trends over time by sex, people who drowned at a beach in a rural and remote location, 1 July 2002 to 30 June 2007, NCIS (n=39) ............................................................................................................................................................................................ 51
Figure 38 State and Territory by sex, people who drowned at a beach in a rural and remote location, 1 July 2002 to 30 June 2007, NCIS (n=39) ............................................................................................................................................................................................ 52
Figure 39 Month by sex, people who drowned at a beach in a rural and remote location, 1 July 2002 to 30 June 2007, NCIS (n=39) 52
Figure 40 Activity by sex, people who drowned at a beach in a rural and remote location, 1 July 2002 to 30 June 2007, NCIS (n=39) ............................................................................................................................................................................................................... 53
References
1. Australian Water Safety Council. Draft Australian Water Safety Strategy 2008‐2011. Sydney, 2008. 2. Franklin R. Rural and Remote Teachers of Swimming and Water Safety ‐ Survey 2007. Sydney, 2007. 3. Rubin T, Franklin R, Scarr J, Peden A. Issues Paper. Facilities, Programs and Services for the Water Safety
of Aboriginal and Torres Strait Islanders in Rural and Remote Australia. Sydney, 2008. 4. Franklin R, Morris B. Examination of water safety in rural, remote and regional locations across Australia.
Sydney: Australian Water Safety Council, 2005:28. 5. Australian Institute of Health and Welfare. Rural, regional and remote health: A guide to remoteness
classifications. Canberra: Australian Institute of Health and Welfare, 2004:87. 6. AIHW. Rural, regional and remote health: A guide to remoteness classifications. Canberra: Australian
Institute of Health and Welfare, 2004:87. 7. Australian Bureau of Statistics. Statistical Geography Volume 1 ‐ Australian Standard Geographical
Classification (ASGC). Canberra: Australian Bureau of Statistics, 2006. 8. Australian Bureau of Statistics. ABS Corporate Plan, 2006. 9. Driscoll TR, Henley G, Harrison JE. The National Coroners Information System as an information tool for
injury surveillance. Injury Research and Statistics Series Number 21. Adelaide: AIHW, 2003. 10. Australian Bureau of Statistics. Information Paper: ABS Causes of Death Statistics: Concepts, Sources
and Methods, 2006. Canberra: Australian Bureau of Statistics, 2008. 11. Victorian Institute of Forensic Medicine. National Coroners Information System, 2007. 12. Driscoll TR, Henley G, Harrison J. The National Coroners Information System as an information tool for
injury surveillance. Canberra, 2003. 13. National Coroners Information System. Items influencing case identification on the NCIS. Southbank:
Victorian Institute of Forensic Medicine, 2008. 14. Australian Bureau of Statistics. 3303.0 Causes of death, Australia. Canberra, 2003. 15. Driscoll T, Steenkamp M, Harrison JE. Alcohol and Water Safety. In: Commonwealth Department of
Health and Ageing, editor: Commonwealth of Australia, 2003:97. 16. Franklin R. Drowning in Australia, 1992‐2002‐ Draft. Sydney: Royal Life Saving Society Australia, 2006. 17. Royal Life Saving Society Australia. The National Drowning Report 2007: Royal Life Saving Society
Australia, 2007. 18. SPSS for Windows [program]. Rel. 15.0.0. version. Chicago: SPSS Inc, 2005. 19. Australian Bureau of Statistics. Census Geography Paper 03/01 ‐ ASGC Remoteness Classification ‐
Purpose and Use: Australian Bureau of Statistics, 2003. 20. National Coroners Information System. National Coroners Information System Coding Manual and User
Guide Version 3. Southbank: Victorian Institute of Forensic Medicine, 2007. 21. Burke P. Causes of death: Occupational data quality. In: Franklin R, editor. Brisbane, Qld: ABS, 1997. 22. Stevenson MR, Rimajova M, Edgecombe D, Vickery K. Childhood Drowning: Barriers Surrounding Private
Swimming Pools. Pediatrics 2003;111(2):e115‐119. 23. Brenner R, Committee on Injury Violence and Poison Prevention. Prevention of Drowning in Infants,
Children, and Adolescents: Technical Report. Pediatrics 2003;112(2):6. 24. World Health Organisation. Facts about injuries. Drowning.: World Health Organisation, 2001:1‐8.
© AWSC August 2008 66
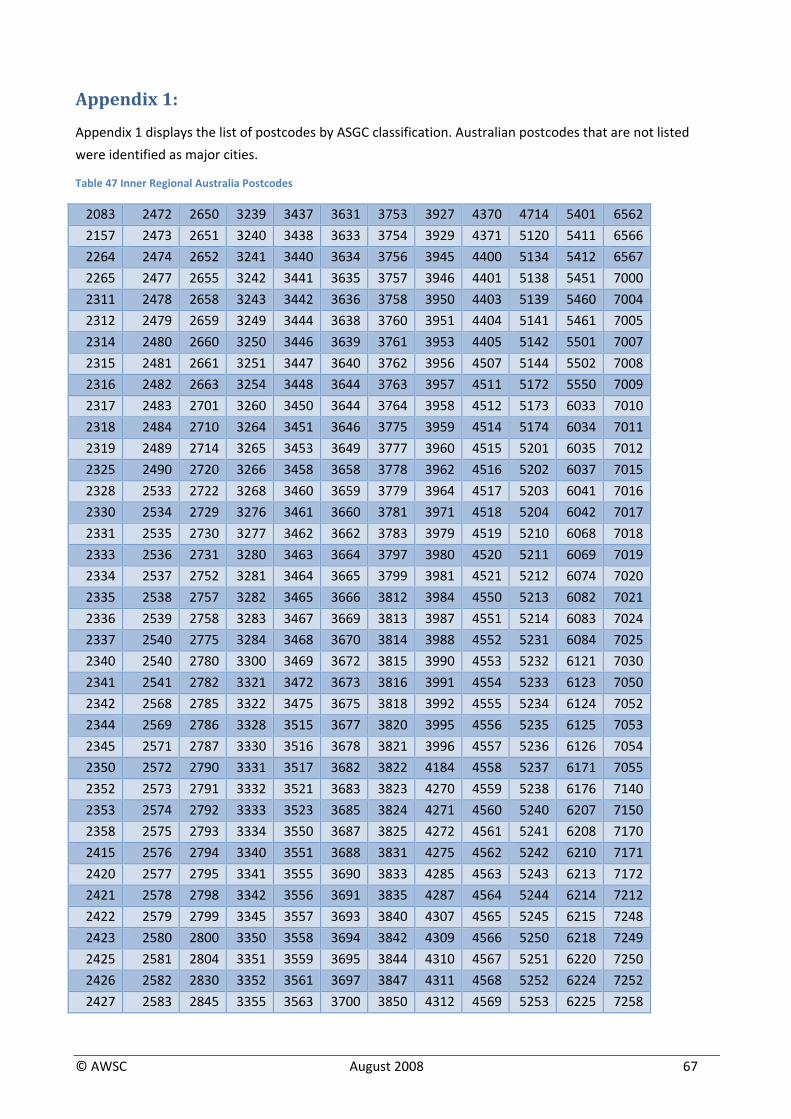
Appendix 1:
Appendix 1 displays the list of postcodes by ASGC classification. Australian postcodes that are not listed
were identified as major cities.
Table 47 Inner Regional Australia Postcodes
2083 2472 2650 3239 3437 3631 3753 3927 4370 4714 5401 6562
2157 2473 2651 3240 3438 3633 3754 3929 4371 5120 5411 6566
2264 2474 2652 3241 3440 3634 3756 3945 4400 5134 5412 6567
2265 2477 2655 3242 3441 3635 3757 3946 4401 5138 5451 7000
2311 2478 2658 3243 3442 3636 3758 3950 4403 5139 5460 7004
2312 2479 2659 3249 3444 3638 3760 3951 4404 5141 5461 7005
2314 2480 2660 3250 3446 3639 3761 3953 4405 5142 5501 7007
2315 2481 2661 3251 3447 3640 3762 3956 4507 5144 5502 7008
2316 2482 2663 3254 3448 3644 3763 3957 4511 5172 5550 7009
2317 2483 2701 3260 3450 3644 3764 3958 4512 5173 6033 7010
2318 2484 2710 3264 3451 3646 3775 3959 4514 5174 6034 7011
2319 2489 2714 3265 3453 3649 3777 3960 4515 5201 6035 7012
2325 2490 2720 3266 3458 3658 3778 3962 4516 5202 6037 7015
2328 2533 2722 3268 3460 3659 3779 3964 4517 5203 6041 7016
2330 2534 2729 3276 3461 3660 3781 3971 4518 5204 6042 7017
2331 2535 2730 3277 3462 3662 3783 3979 4519 5210 6068 7018
2333 2536 2731 3280 3463 3664 3797 3980 4520 5211 6069 7019
2334 2537 2752 3281 3464 3665 3799 3981 4521 5212 6074 7020
2335 2538 2757 3282 3465 3666 3812 3984 4550 5213 6082 7021
2336 2539 2758 3283 3467 3669 3813 3987 4551 5214 6083 7024
2337 2540 2775 3284 3468 3670 3814 3988 4552 5231 6084 7025
2340 2540 2780 3300 3469 3672 3815 3990 4553 5232 6121 7030
2341 2541 2782 3321 3472 3673 3816 3991 4554 5233 6123 7050
2342 2568 2785 3322 3475 3675 3818 3992 4555 5234 6124 7052
2344 2569 2786 3328 3515 3677 3820 3995 4556 5235 6125 7053
2345 2571 2787 3330 3516 3678 3821 3996 4557 5236 6126 7054
2350 2572 2790 3331 3517 3682 3822 4184 4558 5237 6171 7055
2352 2573 2791 3332 3521 3683 3823 4270 4559 5238 6176 7140
2353 2574 2792 3333 3523 3685 3824 4271 4560 5240 6207 7150
2358 2575 2793 3334 3550 3687 3825 4272 4561 5241 6208 7170
2415 2576 2794 3340 3551 3688 3831 4275 4562 5242 6210 7171
2420 2577 2795 3341 3555 3690 3833 4285 4563 5243 6213 7172
2421 2578 2798 3342 3556 3691 3835 4287 4564 5244 6214 7212
2422 2579 2799 3345 3557 3693 3840 4307 4565 5245 6215 7248
2423 2580 2800 3350 3558 3694 3842 4309 4566 5250 6218 7249
2425 2581 2804 3351 3559 3695 3844 4310 4567 5251 6220 7250
2426 2582 2830 3352 3561 3697 3847 4311 4568 5252 6224 7252
2427 2583 2845 3355 3563 3700 3850 4312 4569 5253 6225 7258
© AWSC August 2008 67
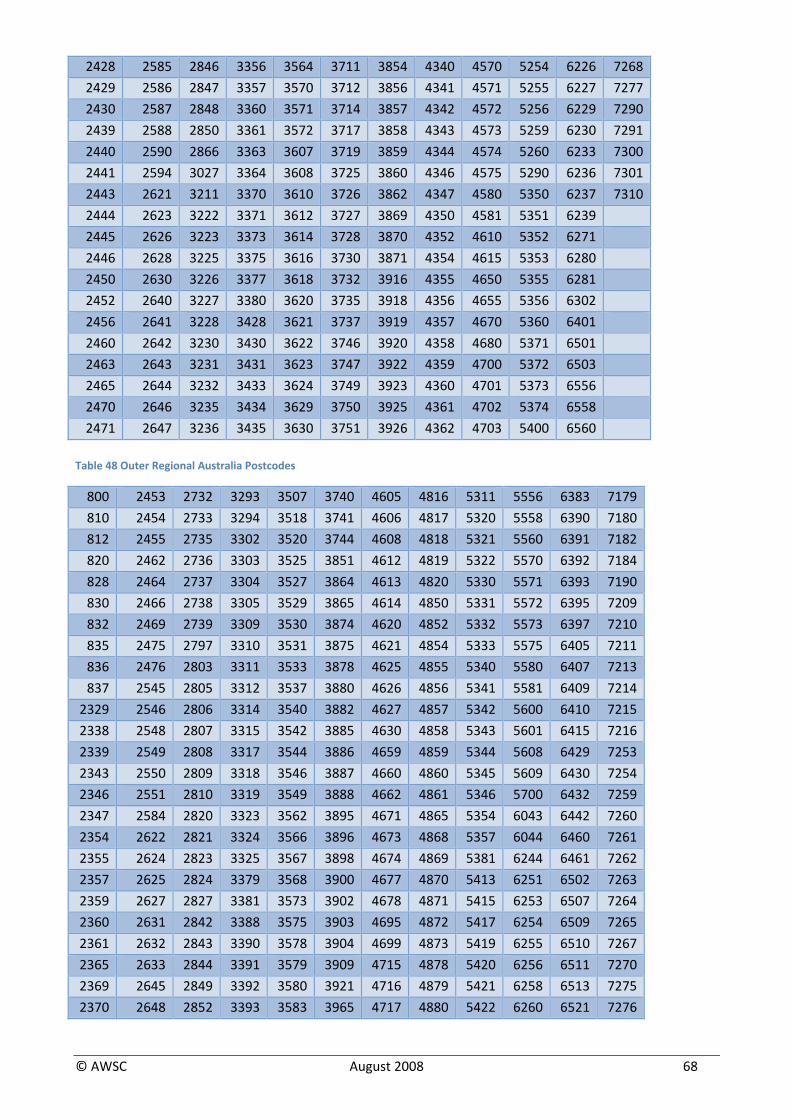
2428 2585 2846 3356 3564 3711 3854 4340 4570 5254 6226 7268
2429 2586 2847 3357 3570 3712 3856 4341 4571 5255 6227 7277
2430 2587 2848 3360 3571 3714 3857 4342 4572 5256 6229 7290
2439 2588 2850 3361 3572 3717 3858 4343 4573 5259 6230 7291
2440 2590 2866 3363 3607 3719 3859 4344 4574 5260 6233 7300
2441 2594 3027 3364 3608 3725 3860 4346 4575 5290 6236 7301
2443 2621 3211 3370 3610 3726 3862 4347 4580 5350 6237 7310
2444 2623 3222 3371 3612 3727 3869 4350 4581 5351 6239
2445 2626 3223 3373 3614 3728 3870 4352 4610 5352 6271
2446 2628 3225 3375 3616 3730 3871 4354 4615 5353 6280
2450 2630 3226 3377 3618 3732 3916 4355 4650 5355 6281
2452 2640 3227 3380 3620 3735 3918 4356 4655 5356 6302
2456 2641 3228 3428 3621 3737 3919 4357 4670 5360 6401
2460 2642 3230 3430 3622 3746 3920 4358 4680 5371 6501
2463 2643 3231 3431 3623 3747 3922 4359 4700 5372 6503
2465 2644 3232 3433 3624 3749 3923 4360 4701 5373 6556
2470 2646 3235 3434 3629 3750 3925 4361 4702 5374 6558
2471 2647 3236 3435 3630 3751 3926 4362 4703 5400 6560
Table 48 Outer Regional Australia Postcodes
800 2453 2732 3293 3507 3740 4605 4816 5311 5556 6383 7179
810 2454 2733 3294 3518 3741 4606 4817 5320 5558 6390 7180
812 2455 2735 3302 3520 3744 4608 4818 5321 5560 6391 7182
820 2462 2736 3303 3525 3851 4612 4819 5322 5570 6392 7184
828 2464 2737 3304 3527 3864 4613 4820 5330 5571 6393 7190
830 2466 2738 3305 3529 3865 4614 4850 5331 5572 6395 7209
832 2469 2739 3309 3530 3874 4620 4852 5332 5573 6397 7210
835 2475 2797 3310 3531 3875 4621 4854 5333 5575 6405 7211
836 2476 2803 3311 3533 3878 4625 4855 5340 5580 6407 7213
837 2545 2805 3312 3537 3880 4626 4856 5341 5581 6409 7214
2329 2546 2806 3314 3540 3882 4627 4857 5342 5600 6410 7215
2338 2548 2807 3315 3542 3885 4630 4858 5343 5601 6415 7216
2339 2549 2808 3317 3544 3886 4659 4859 5344 5608 6429 7253
2343 2550 2809 3318 3546 3887 4660 4860 5345 5609 6430 7254
2346 2551 2810 3319 3549 3888 4662 4861 5346 5700 6432 7259
2347 2584 2820 3323 3562 3895 4671 4865 5354 6043 6442 7260
2354 2622 2821 3324 3566 3896 4673 4868 5357 6044 6460 7261
2355 2624 2823 3325 3567 3898 4674 4869 5381 6244 6461 7262
2357 2625 2824 3379 3568 3900 4677 4870 5413 6251 6502 7263
2359 2627 2827 3381 3573 3902 4678 4871 5415 6253 6507 7264
2360 2631 2842 3388 3575 3903 4695 4872 5417 6254 6509 7265
2361 2632 2843 3390 3578 3904 4699 4873 5419 6255 6510 7267
2365 2633 2844 3391 3579 3909 4715 4878 5420 6256 6511 7270
2369 2645 2849 3392 3580 3921 4716 4879 5421 6258 6513 7275
2370 2648 2852 3393 3583 3965 4717 4880 5422 6260 6521 7276
© AWSC August 2008 68
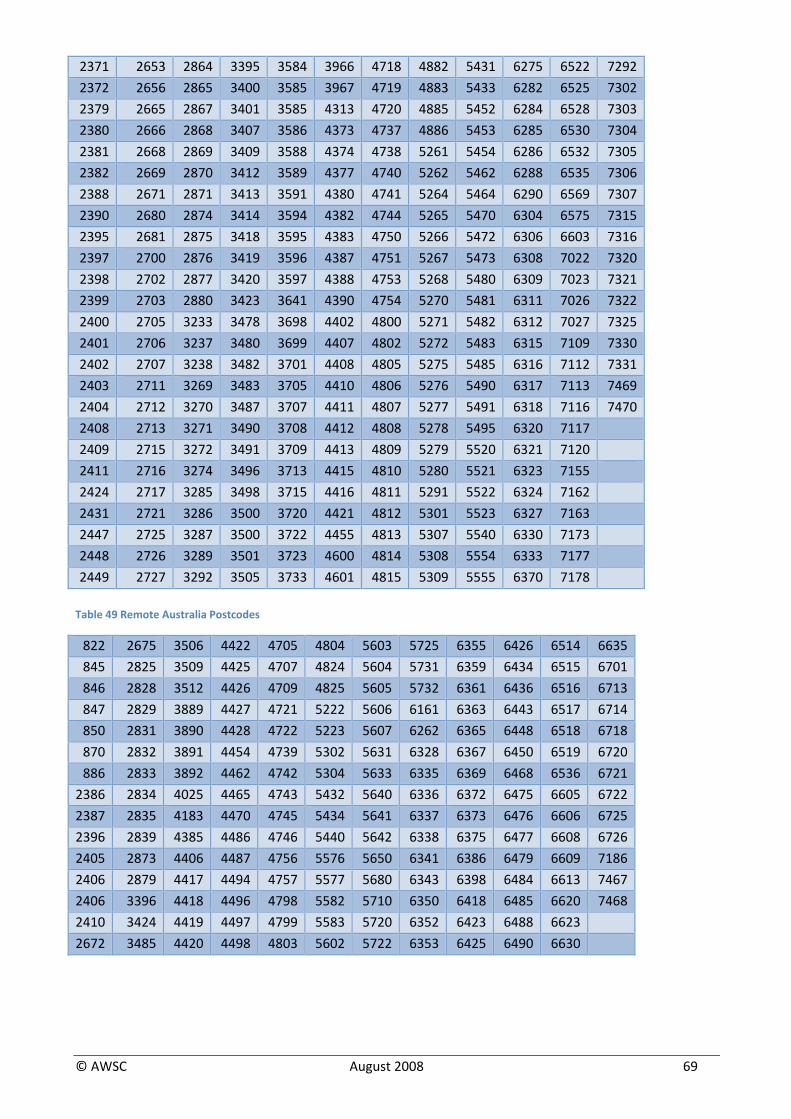
2371 2653 2864 3395 3584 3966 4718 4882 5431 6275 6522 7292
2372 2656 2865 3400 3585 3967 4719 4883 5433 6282 6525 7302
2379 2665 2867 3401 3585 4313 4720 4885 5452 6284 6528 7303
2380 2666 2868 3407 3586 4373 4737 4886 5453 6285 6530 7304
2381 2668 2869 3409 3588 4374 4738 5261 5454 6286 6532 7305
2382 2669 2870 3412 3589 4377 4740 5262 5462 6288 6535 7306
2388 2671 2871 3413 3591 4380 4741 5264 5464 6290 6569 7307
2390 2680 2874 3414 3594 4382 4744 5265 5470 6304 6575 7315
2395 2681 2875 3418 3595 4383 4750 5266 5472 6306 6603 7316
2397 2700 2876 3419 3596 4387 4751 5267 5473 6308 7022 7320
2398 2702 2877 3420 3597 4388 4753 5268 5480 6309 7023 7321
2399 2703 2880 3423 3641 4390 4754 5270 5481 6311 7026 7322
2400 2705 3233 3478 3698 4402 4800 5271 5482 6312 7027 7325
2401 2706 3237 3480 3699 4407 4802 5272 5483 6315 7109 7330
2402 2707 3238 3482 3701 4408 4805 5275 5485 6316 7112 7331
2403 2711 3269 3483 3705 4410 4806 5276 5490 6317 7113 7469
2404 2712 3270 3487 3707 4411 4807 5277 5491 6318 7116 7470
2408 2713 3271 3490 3708 4412 4808 5278 5495 6320 7117
2409 2715 3272 3491 3709 4413 4809 5279 5520 6321 7120
2411 2716 3274 3496 3713 4415 4810 5280 5521 6323 7155
2424 2717 3285 3498 3715 4416 4811 5291 5522 6324 7162
2431 2721 3286 3500 3720 4421 4812 5301 5523 6327 7163
2447 2725 3287 3500 3722 4455 4813 5307 5540 6330 7173
2448 2726 3289 3501 3723 4600 4814 5308 5554 6333 7177
2449 2727 3292 3505 3733 4601 4815 5309 5555 6370 7178
Table 49 Remote Australia Postcodes
822 2675 3506 4422 4705 4804 5603 5725 6355 6426 6514 6635
845 2825 3509 4425 4707 4824 5604 5731 6359 6434 6515 6701
846 2828 3512 4426 4709 4825 5605 5732 6361 6436 6516 6713
847 2829 3889 4427 4721 5222 5606 6161 6363 6443 6517 6714
850 2831 3890 4428 4722 5223 5607 6262 6365 6448 6518 6718
870 2832 3891 4454 4739 5302 5631 6328 6367 6450 6519 6720
886 2833 3892 4462 4742 5304 5633 6335 6369 6468 6536 6721
2386 2834 4025 4465 4743 5432 5640 6336 6372 6475 6605 6722
2387 2835 4183 4470 4745 5434 5641 6337 6373 6476 6606 6725
2396 2839 4385 4486 4746 5440 5642 6338 6375 6477 6608 6726
2405 2873 4406 4487 4756 5576 5650 6341 6386 6479 6609 7186
2406 2879 4417 4494 4757 5577 5680 6343 6398 6484 6613 7467
2406 3396 4418 4496 4798 5582 5710 6350 6418 6485 6620 7468
2410 3424 4419 4497 4799 5583 5720 6352 6423 6488 6623
2672 3485 4420 4498 4803 5602 5722 6353 6425 6490 6630
© AWSC August 2008 69
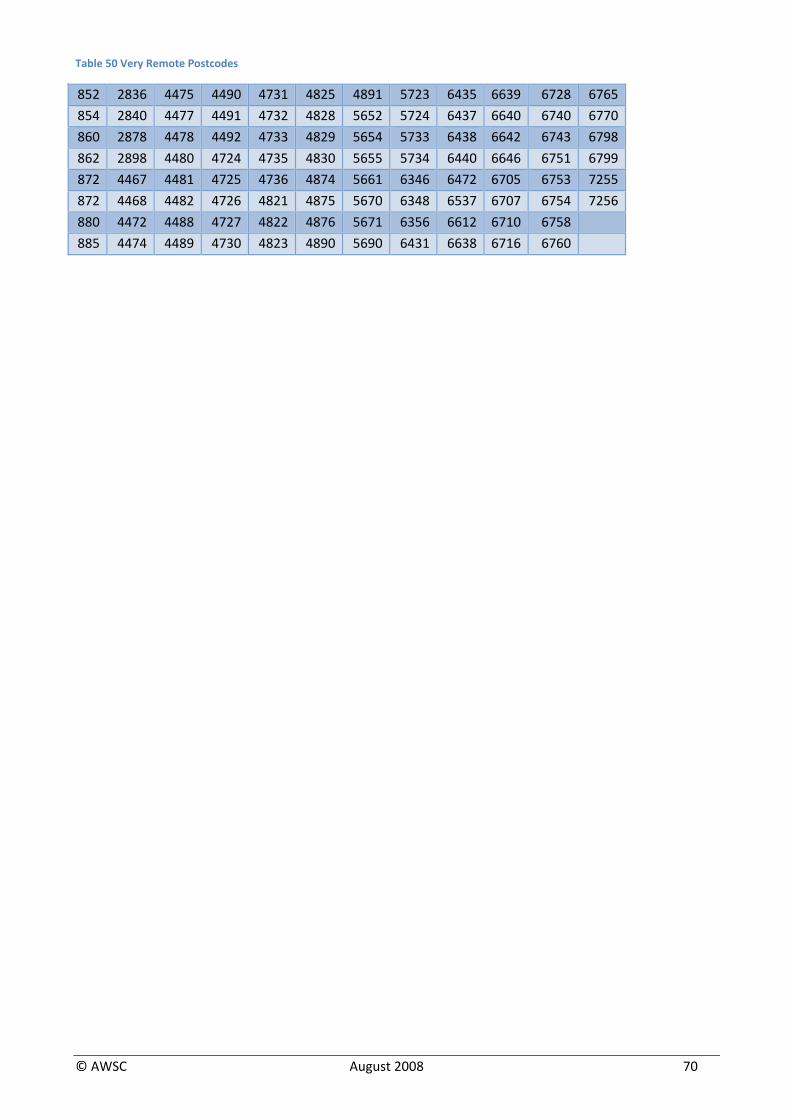
© AWSC August 2008 70
Table 50 Very Remote Postcodes
852 2836 4475 4490 4731 4825 4891 5723 6435 6639 6728 6765
854 2840 4477 4491 4732 4828 5652 5724 6437 6640 6740 6770
860 2878 4478 4492 4733 4829 5654 5733 6438 6642 6743 6798
862 2898 4480 4724 4735 4830 5655 5734 6440 6646 6751 6799
872 4467 4481 4725 4736 4874 5661 6346 6472 6705 6753 7255
872 4468 4482 4726 4821 4875 5670 6348 6537 6707 6754 7256
880 4472 4488 4727 4822 4876 5671 6356 6612 6710 6758
885 4474 4489 4730 4823 4890 5690 6431 6638 6716 6760