Embed Size (px)
Citation preview
1
Drought and its effect on vegetation, comparison of Landsat NDVI for Drought and non-drought years related to Land use Land cover classifications. By: Travis Ritter (EES 5053) Fall 2006 Abstract: The purpose of this study is to analyze the effects of drought on various land use and land cover types. Imagery was selected for both drought and non-drought conditions based on precipitation data. The Normalized Difference Vegetation Index (NDVI) was then calculated for both images in order to detect the amount of change within the study area. The NDVI images were then analyzed for change for selected USGS land use/cover classification to determine which classification was the most susceptible to drought in terms of reduced NDVI values. Introduction:
Many studies have been done on the effects of drought and its relation to the
Normalized Difference Vegetation Index (NDVI). It has been well documented that
there is a direct correlation between the NDVI and the amount of stress vegetation is
experiencing. The purpose of this project will be to determine drought effects on NDVI
in the San Antonio region and also the effects on selected land use land cover types
within the region to determine which type is most susceptible to drought conditions.
Texas is currently under severe drought conditions and has been for the previous
year. Precipitation data suggests that rainfall is several inches below normal. In order to
determine the effects of drought and make a statistical comparison to non-drought years it
is necessary to identify drought periods. Rain gauge data was used to determine dry
periods and Landsat imagery will be used to derive NDVI using ENVI software.
Data:
Precipitation data was downloaded and compiled from the NOAA internet site in
order to determine years of drought vs. non-drought conditions using the yearly average
of precipitation. Normal rainfall for San Antonio is approximately 30-inches per year
2
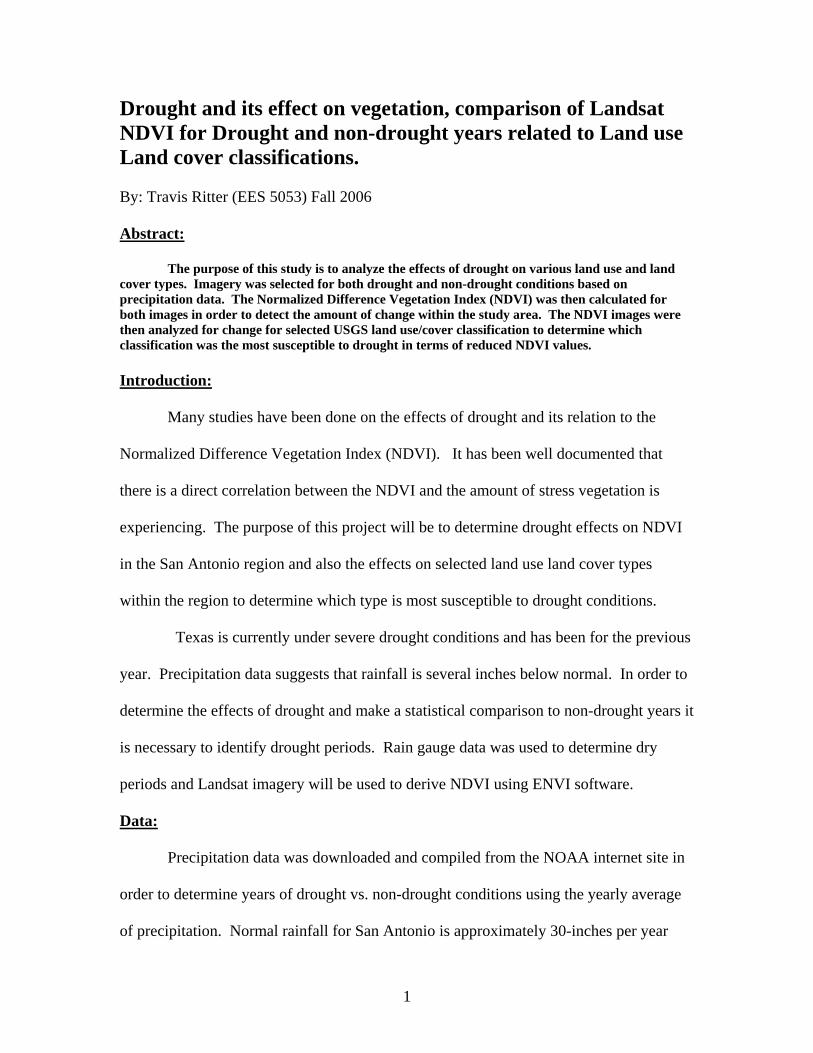
[http://www.srh.noaa.gov/ewx/html/cli/satcli.htm]. The data analyzed (1998 to present)
revealed two dry periods. These include the current drought condition and a dry period
that took place in 1999. Figure 1 presents the yearly precipitation data for 1998 thru July
2006. Figure 2 presents a time series rainfall by month from January 1998 thru July
2006.
Figure 2. Monthly Precipitation Data 1998 thur July 2006
0
5
10
15
20
1998
1998
1998
1998
1999
1999
1999
1999
2000
2000
2000
2000
2001
2001
2001
2001
2002
2002
2002
2002
2003
2003
2003
2003
2004
2004
2004
2004
2005
2005
2005
2005
2006
2006
2006
Year
Rai
n (in
ches
)
From Figures 1 and 2 it is easily observed that there are two years suitable to analyze
imagery for drought conditions. These are 1999 and 2006. For this study 1999 will be
used to analyze drought conditions as 1999 had precipitation levels 14-inches below
normal. The year 2002 will be used for non-drought conditions. It should be noted that
even though the rainfall appeared normal for the 2002 image, much of the central Texas
area was still under drought conditions.
Figure 1. Precipitation (in.)
42.1
16.63
35.86 37.52 35.04 33.24
52.89
22.77
7.06
0
10
20
30
40
50
60
1998 1999 2000 2001 2002 2003 2004 2005 2006
3
Imagery Data: Data was downloaded from the Texas View Remote Sensing Consortium
webpage. In order to select images to show differences in drought vs. non-drought
conditions the 1999 image be used for drought. The 2002 year was used for the non-
drought condition. The downloaded imagery was in the National Land Archive
Processing System Data Format (NDF) format. Specifically, the header file (H1) and
band 3 and 4 (I3 and I4) were used for processing. The 2002 image was acquired
11/13/02 at 16:51. The 1999 image was acquired 10/20/1999 at 16:56. These images
were also selected due to their closeness in seasonal timeframe.
Land use and land cover data LU/LC collected by the USGS NMD is useful for
environmental assessment of land use patterns with respect to water quality analysis,
growth management, and other types of environmental impact assessment. The Landuse
Landcover shapefile was downloaded from the TNRIS website. It was used to refine the
study area and also for comparison of effects of drought on different Land use land cover
classifications in terms of drought effects on vegetation (NDVI).
Methods: Study Area:
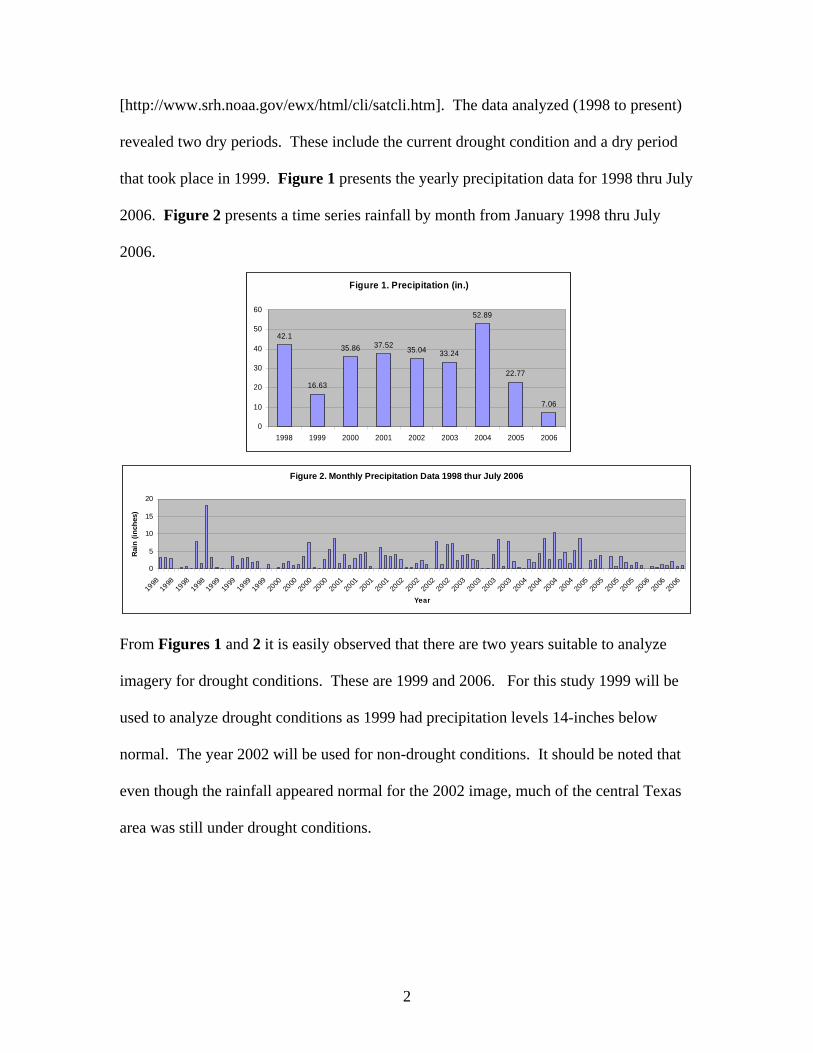
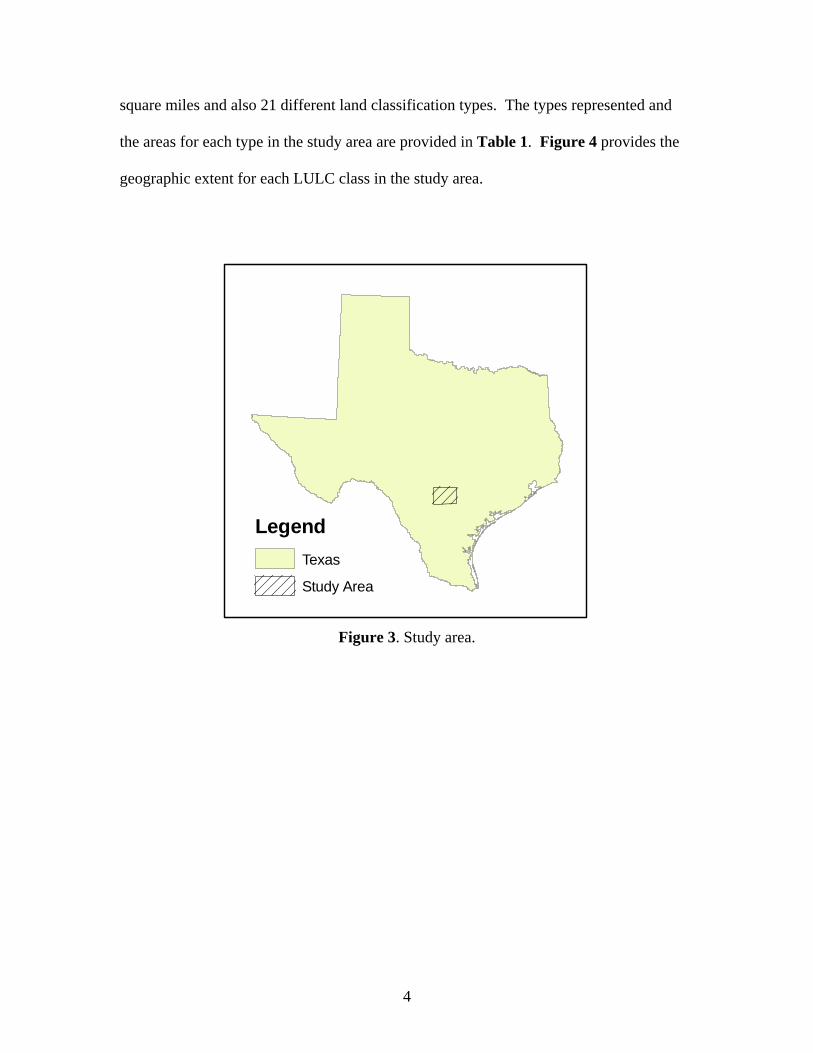
For this project a study was selected in the San Antonio region. Figure 3
illustrates the geographic extent of the study area. The specific area was refined by using
a Land Use Land Cover shapefiles in order to simplify classification. Four LULC tiles
were selected form the LULC shapefile which comprised an area of approximately 2,400
4
LegendTexas
Study Area
�
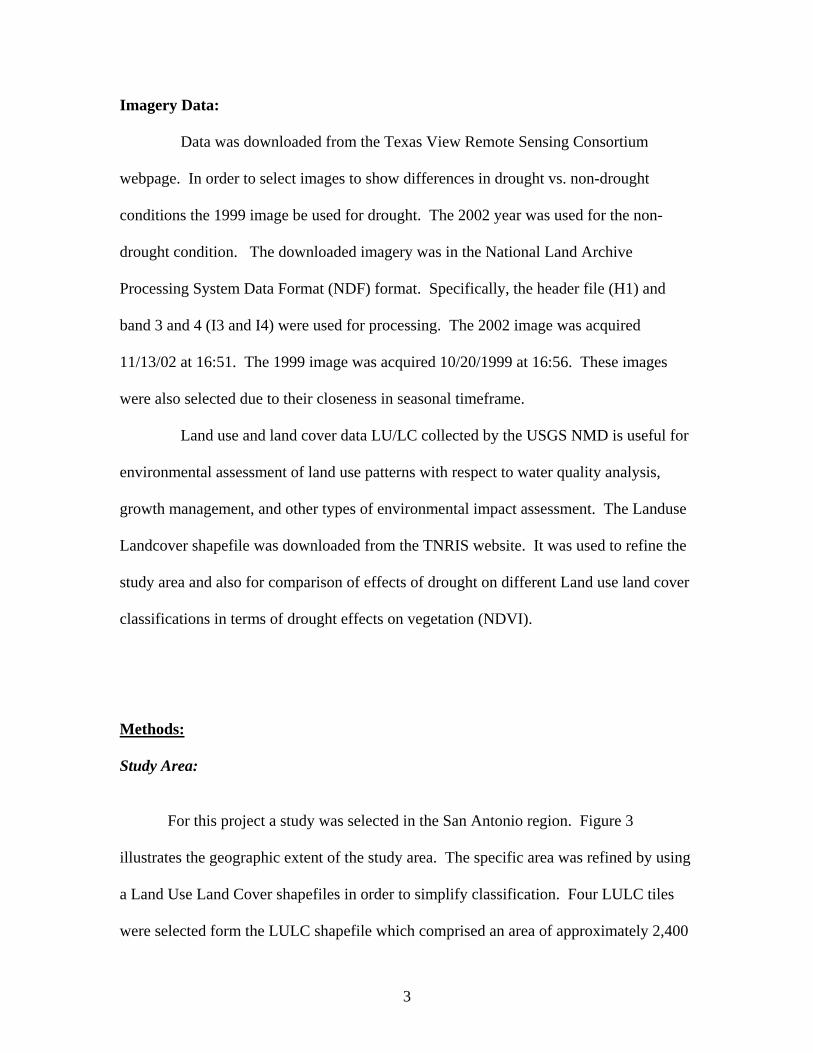
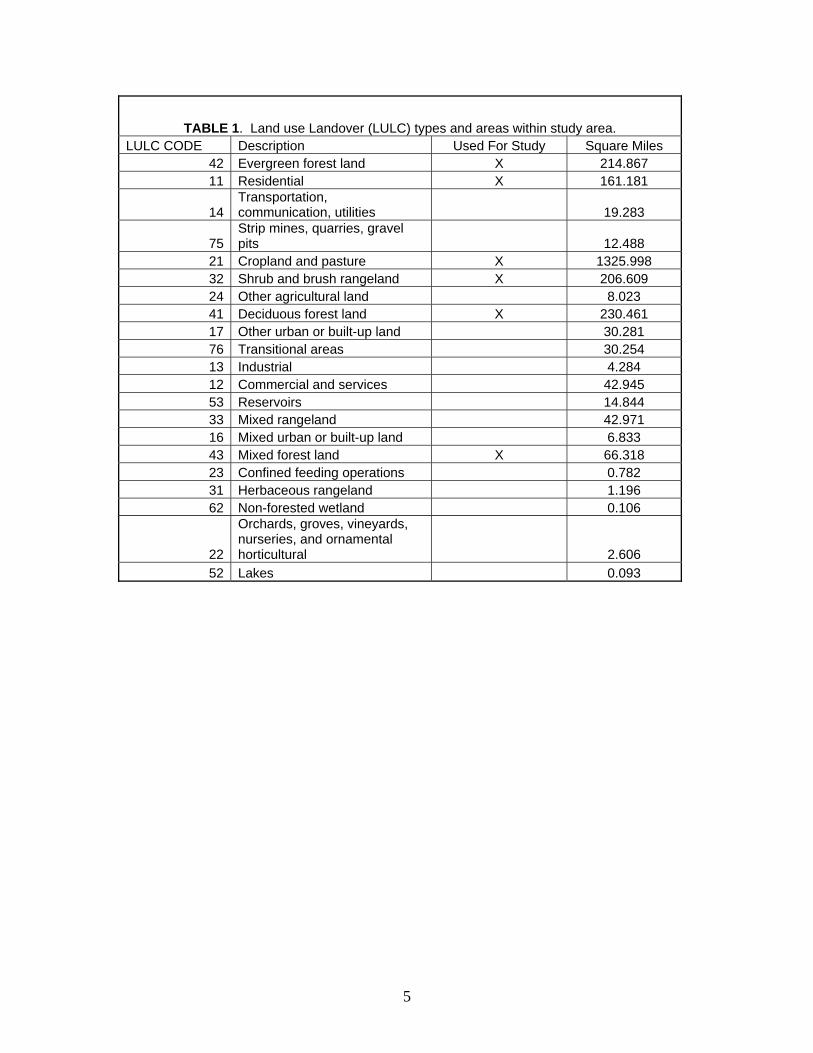
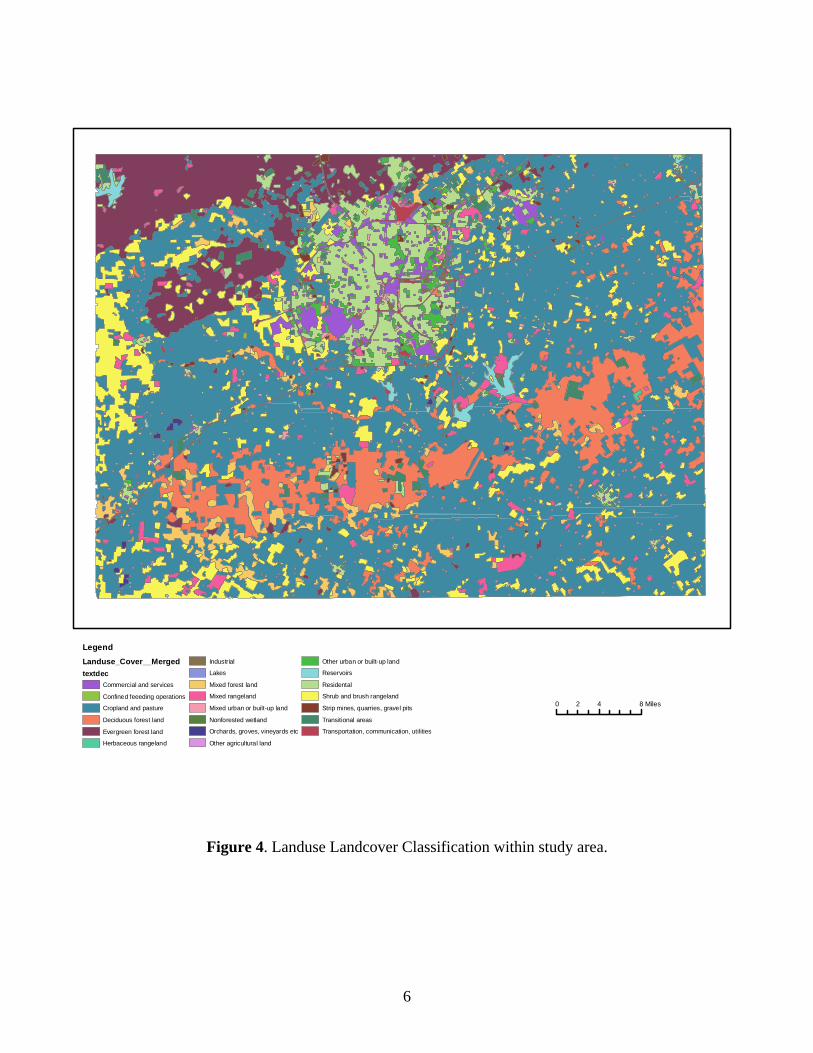
square miles and also 21 different land classification types. The types represented and
the areas for each type in the study area are provided in Table 1. Figure 4 provides the
geographic extent for each LULC class in the study area.
Figure 3. Study area.
5
TABLE 1. Land use Landover (LULC) types and areas within study area. LULC CODE Description Used For Study Square Miles
42 Evergreen forest land X 214.867 11 Residential X 161.181
14 Transportation, communication, utilities 19.283
75 Strip mines, quarries, gravel pits 12.488
21 Cropland and pasture X 1325.998 32 Shrub and brush rangeland X 206.609 24 Other agricultural land 8.023 41 Deciduous forest land X 230.461 17 Other urban or built-up land 30.281 76 Transitional areas 30.254 13 Industrial 4.284 12 Commercial and services 42.945 53 Reservoirs 14.844 33 Mixed rangeland 42.971 16 Mixed urban or built-up land 6.833 43 Mixed forest land X 66.318 23 Confined feeding operations 0.782 31 Herbaceous rangeland 1.196 62 Non-forested wetland 0.106
22
Orchards, groves, vineyards, nurseries, and ornamental horticultural 2.606
52 Lakes 0.093
6
Figure 4. Landuse Landcover Classification within study area.
LegendLanduse_Cover__Mergedtextdec
Commercial and services
Confined feeeding operations
Cropland and pasture
Deciduous forest land
Evergreen forest land
Herbaceous rangeland
Industrial
Lakes
Mixed forest land
Mixed rangeland
Mixed urban or built-up land
Nonforested wetland
Orchards, groves, vineyards etc
Other agricultural land
Other urban or built-up land
Reservoirs
Residental
Shrub and brush rangeland
Strip mines, quarries, gravel pits
Transitional areas
Transportation, communication, utilities
�0 4 82 Miles
7
Image Preprocessing: Image preprocessing included clipping the original images to the study area. This
was accomplished by creating a shapefile in ArcView from the Landuse Landcover
shapefile, which was imported into ENVI and used to clip the original images. The Dark
Object Subtract method was used to adjust images to remove all atmospheric
interference.
Change Detection: In order to determine the effects of drought condition the Normalized Difference
Vegetation Index (NDVI) was used. The NDVI is the ratio between the maximum
absorption of radiation in the red (R) spectral band (0.66 µm) versus the maximum
reflection of radiation in the near infrared (NIR) spectral band (~0.83 µm). For Landsat
image (TM or ETM+ image), they are band 3 and band 4, respectively. NDVI images
were created for both the 1999 and 2002 using the ENVI built in NDVI tool.
For this study change is defined as a change in the mean of the NDVI pixel values for the
study area between the two images (1999 and 2002). Change was evaluated for 1)
overall change in NDVI pixel vales for the entire study and 2) selected LULC
classification areas. The individual change detection for each LULC class was
preformed in order to determine which class was most affected by the drought conditions
during 1999.
In order to find the change for selected land classes it was necessary to first merge
all polygons of the same classification in the LULC shapefile into one polygon for each
8
class. After merging polygons selected LULCs were exported to individual shapefiles
and then imported into the ENVI software to use as Regions of Interest (ROI). This
allowed for computation of NDVI statistics for each ROI/LULC classification for the
NDVI images. The selected LULC classification types used to detect change are also
provided in Table 1. This process was performed for both the 1999 and 2002 images
(drought and non-drought conditions), and the results were compared to determine the
droughts effects upon selected LULC types.
Results:
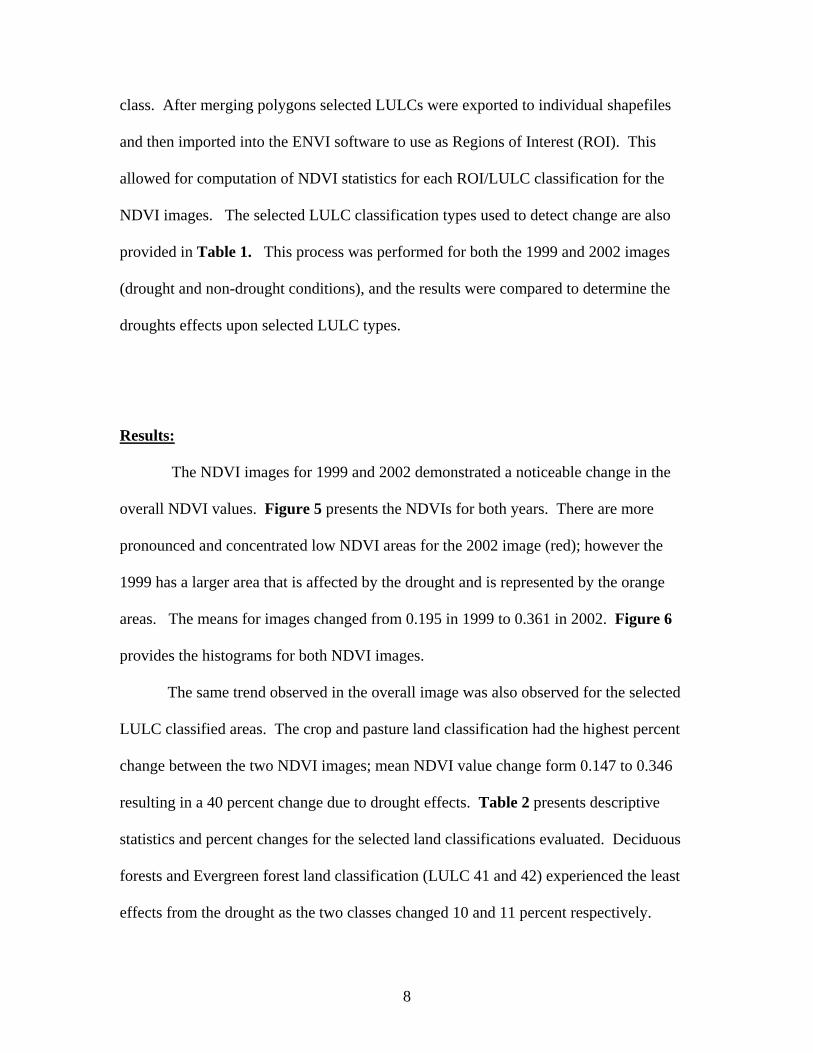
The NDVI images for 1999 and 2002 demonstrated a noticeable change in the
overall NDVI values. Figure 5 presents the NDVIs for both years. There are more
pronounced and concentrated low NDVI areas for the 2002 image (red); however the
1999 has a larger area that is affected by the drought and is represented by the orange
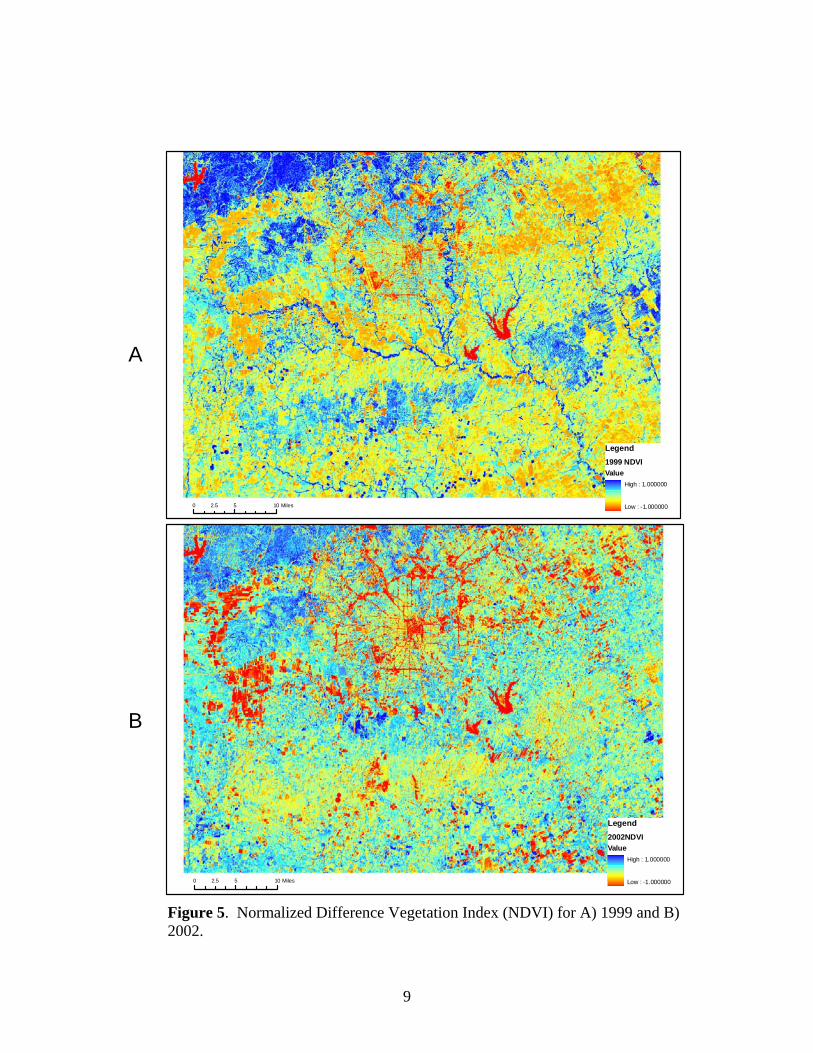
areas. The means for images changed from 0.195 in 1999 to 0.361 in 2002. Figure 6
provides the histograms for both NDVI images.
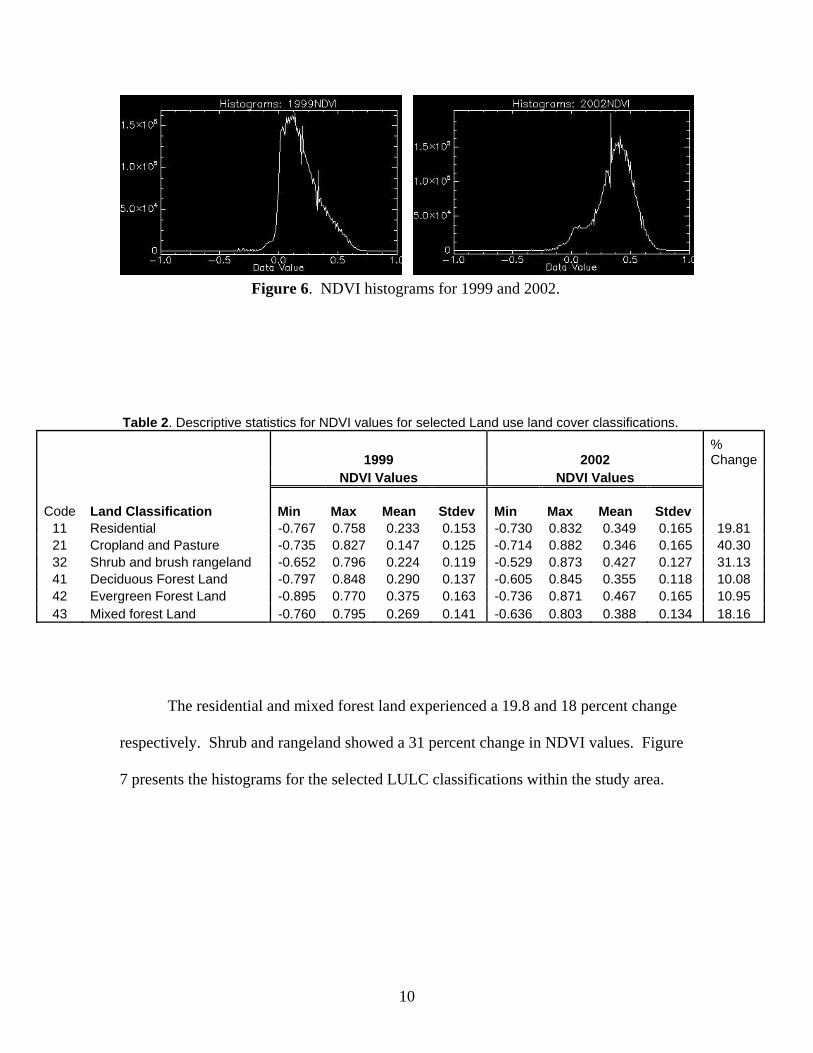
The same trend observed in the overall image was also observed for the selected
LULC classified areas. The crop and pasture land classification had the highest percent
change between the two NDVI images; mean NDVI value change form 0.147 to 0.346
resulting in a 40 percent change due to drought effects. Table 2 presents descriptive
statistics and percent changes for the selected land classifications evaluated. Deciduous
forests and Evergreen forest land classification (LULC 41 and 42) experienced the least
effects from the drought as the two classes changed 10 and 11 percent respectively.
9
Legend1999 NDVIValue
High : 1.000000
Low : -1.000000�0 5 102.5 Miles
Legend2002NDVIValue
High : 1.000000
Low : -1.000000�0 5 102.5 Miles
A
B
Figure 5. Normalized Difference Vegetation Index (NDVI) for A) 1999 and B) 2002.
10
Figure 6. NDVI histograms for 1999 and 2002.
Table 2. Descriptive statistics for NDVI values for selected Land use land cover classifications.
1999 2002 % Change
NDVI Values NDVI Values
Code Land Classification Min
Max
Mean
Stdev
Min
Max
Mean
Stdev
11 Residential -0.767 0.758 0.233 0.153 -0.730 0.832 0.349 0.165 19.81 21 Cropland and Pasture -0.735 0.827 0.147 0.125 -0.714 0.882 0.346 0.165 40.30 32 Shrub and brush rangeland -0.652 0.796 0.224 0.119 -0.529 0.873 0.427 0.127 31.13 41 Deciduous Forest Land -0.797 0.848 0.290 0.137 -0.605 0.845 0.355 0.118 10.08 42 Evergreen Forest Land -0.895 0.770 0.375 0.163 -0.736 0.871 0.467 0.165 10.95 43 Mixed forest Land -0.760 0.795 0.269 0.141 -0.636 0.803 0.388 0.134 18.16
The residential and mixed forest land experienced a 19.8 and 18 percent change
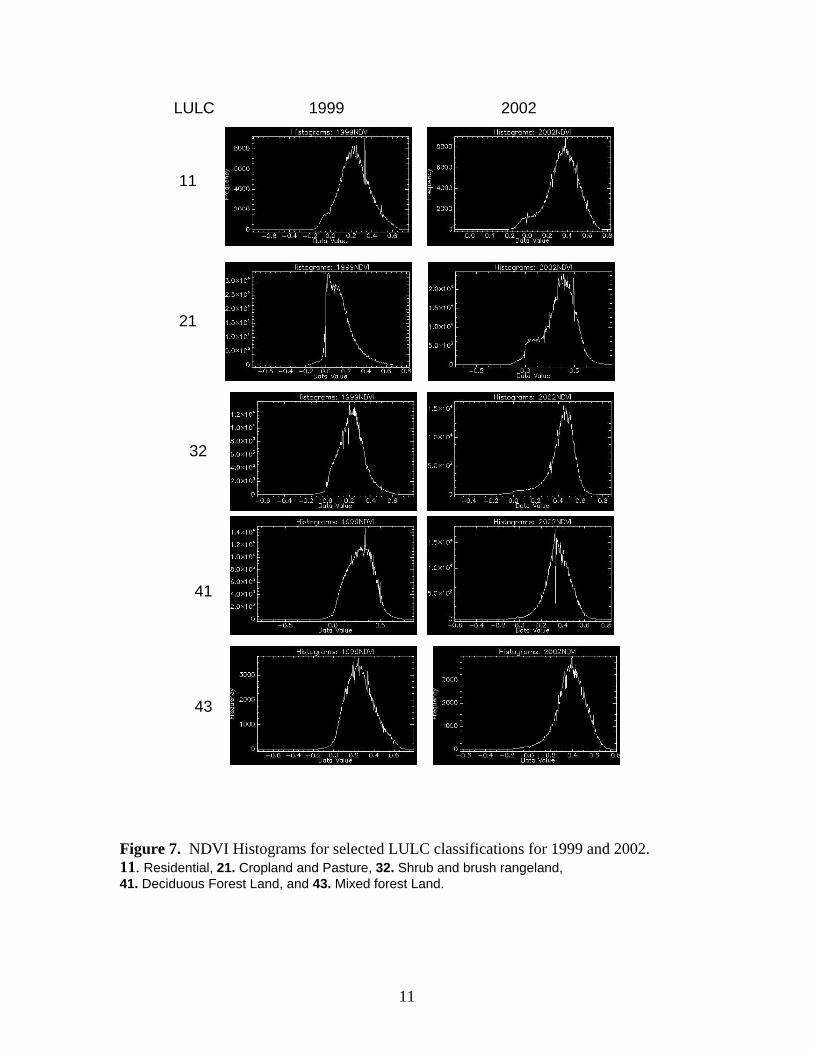
respectively. Shrub and rangeland showed a 31 percent change in NDVI values. Figure
7 presents the histograms for the selected LULC classifications within the study area.
11
Figure 7. NDVI Histograms for selected LULC classifications for 1999 and 2002. 11. Residential, 21. Cropland and Pasture, 32. Shrub and brush rangeland, 41. Deciduous Forest Land, and 43. Mixed forest Land.
11
1999 2002 LULC
21
32
41
43
12
Conclusions: Overall there was a decrease in the NDVI values for drought conditions as
expected. Of the specific land classifications that were evaluated the non-native
vegetation types appeared to be more negatively effected by drought. Croplands and
pastures were the most effected land classification; however there are several factors that
occur in this class including irrigation and harvest that could have skewed the results.
The NDVI method used to evaluate the vegetation health could have been flawed.
Further research needs to be conducted to determine the exact procedures the built in
NDVI tool in the ENVI software. Additonally, the LULC shapefile used to create the
ROIs for this study are generalized and may be, in some areas, out of date. The land use
land cover classification could be further refined using the ENVI software to create more
precise classifications which could be used to identify land cover types that provide a
more accurate measure of the effects of drought. However, this technique would be
subject to operator discretion and could provide different results between studies based
on the operators classifications.
This technique could be applied to any number of thematic map types including
soil types, elevation, eco-regions etc. It provides a simple tool to evaluate the effects of
the classification type on the NDVI. However, caution should be observed as there are
many factors that contribute to the NDVI, most importantly, drought.
13
References/Sources: http://www.texasview.org/ http://www.tnris.state.tx.us/ http://www.srh.weather.gov/ewx/html/cli/monthdaily.htm http://earthobservatory.nasa.gov/Observatory/Datasets/rainfall.gpcp.html http://www.ocs.orst.edu/prism/ http://datagateway.nrcs.usda.gov/statusmaps.asp http://earthobservatory.nasa.gov/Library/MeasuringVegetation/measuring_vegetation_3.html http://earthobservatory.nasa.gov/Observatory/Datasets/rainfall.gpcp.html A. Volcani, A. Karnieli , T. Svoray., 2005. The use of remote sensing and GIS for spatio-temporal analysis of the physiological state of a semi-arid forest with respect to drought years. Forest Ecology and Management 215 (2005) 239–250 R.J. FENSHAM and J.E. HOLMAN., 1999. Temporal and spatial patterns in drought-related tree dieback in Australian savanna. Journal of Applied Ecology (1999), 36, 1035 - 1050