Embed Size (px)
Citation preview
US Army Corps of Engineers
Event Study 2012 Low-Water and Mississippi River
Lock 27 Closures
August 2013
Cover photo by the Associated Press
Event Study 2012 Low-Water and Mississippi River
Lock 27 Closures
Prepared by US Army Corps of Engineers
Planning Center of Expertise for Inland Navigation
In Collaboration with US Army Corps of Engineers Institute for Water Resources
August 2013
Page intentionally left blank
ACKNOWLEDGEMENTS
The River Industry Executive Task Force (RIETF) the River Industry Action Council (RIAC) the American Corn Growers Association and the Waterways Council Inc offered valuable advice as the study team developed the survey instrument used in this study and provided greatly appreciated assistance in reaching waterway carriers and shippers with our survey The US Coast Guard was especially helpful in providing information on river conditions and the coordinated response of the towing industry the US Army Corps of Engineers and the Coast Guard Corps of Engineersrsquo Operations personnel in Vicksburg Mississippi St Louis Missouri and Louisville Kentucky provided extensive assistance on the Corpsrsquo response to the 2012 low water event Finally the study team is indebted to the waterway industry and the firms that rely on the inland waterways for providing information invaluable to gaining a sense of the importance of the Nationrsquos major inland navigation corridor and the consequences of serious disruptions in the services these waterways provide
___________________________________________________________
Executive Summary
Navigating the Mississippi River and most of its navigable tributaries in 2012 was very difficult due to the low water conditions that began in April and except for a short time in May remained in-place for much of the year1 These conditions continued off and on until March 2013 when spring flooding returned the Lower Mississippi to normal flows and caused flows in the Middle and Upper Mississippi to reach near record levels forcing another set of closures Similarly near record high flows in 2011 caused navigation disruptions Relatively low precipitation levels in the following winter of 201112 provided very little moisture for much of the region quickly changing its posture from flood to drought conditions by April 2012 This lack of region-wide precipitation led the entire Midwest and much of the Plains states into the most severe drought since 1988
With flows falling throughout the summer tow groundings began to occur the first was reported on 11 May 2012 on the heavily used Lower Mississippi River By July groundings were widespread and a total of 19 were reported during that month in all sections of the Mississippi River August had the highest number of groundings with 26 From June 2012 through January 2013 there were a total of 91 groundings on the main stem Mississippi According to the US Coast Guard 18 groundings on the Lower Mississippi led to closure events with more than 25 tows in queues In total these events caused 1130 tows and 17640 barges to be delayed Closures of the river occurred when tows needed to be pulled from bars or banks reassembled after breaking-up upon running aground or when channel work was required Industry worked together to free and re-assemble tows
Where groundings became frequent in specific areas the US Coast Guard the US Army Corps of Engineers and industry jointly determined when a river closure was necessary to allow the Corps to survey and dredge the channel and the Coast Guard to reset buoys that mark the channel By June draft restrictions were set at 10rsquo6rdquo northbound tow sizes were set to 42 barges per tow and southbound tows to 36 barges per tow In early July drafts were down to 9rsquo6rdquo and tow sizes were further reduced by late July drafts were restricted to 9rsquo northbound tow sizes were set to 20 loaded barges per tow and southbound tow sizes were set to 30 barges per tow By mid-August one way traffic was instituted in problem reaches drafts were limited to 9rsquo and tow sizes were limited further Draft and tow size restrictions were gradually relaxed but it was not until 14 December 2012 that all restrictions were lifted
On the Middle Mississippi between St Louis Missouri and Cairo Illinois low water conditions remained severe throughout the prime shipping season in the fall The Corps worked to mitigate low water effects by initiating drawdowns of reservoirs in Minnesota to increase flows and raise pool levels On 15 September 2012 both chambers at Mississippi River Locks and Dam 27 (LD27) closed when low water exposed the unarmored portion of a guide cell which was subsequently damaged by an approaching tow The damage to the cell hindered safe passage through the locks and caused an emergency closure of both lock
1 Low water as definedby reachinga ldquoWatchrdquo ldquoActionrdquo orldquoActionExtremeLowWaterrdquo conditionasdescribedinthe2004 Waterway Action Plan jointlypreparedbytheUSCoast Guard theUSArmyCorps of Engineers and thewaterwaycarriers
ES ‐ i
___________________________________________________________
chambers that lasted five days resulting in delays that approached 100 hours per tow December 2012 saw low water continuing to hamper navigation with conditions worsening to a point that the US Coast Guard ordered draft restrictions to 9rsquo from 10rsquo and restricted maximum tow size to help reduce groundings Due to the possibility of even greater restrictions to include possible complete closure the Corps of Engineers mobilized additional dredges and began blasting to remove rock ledges that threatened navigation at the two most critical points on the Middle Mississippi - Thebes and Grand Tower Illinois - in January 2013 Rock removal was completed by the end of February 2013 and higher winter precipitation levels began to improve water levels and navigation conditions By March increased flows returned navigation to normal only to be hindered by high water and flooding in the spring of 2013
Navigation on the lower Ohio River was maintained throughout this period Corps of Engineers Operations personnel credit the cooperation of Federal agencies effective communication between Federal agencies and stakeholders improved forecasting tools and water control efforts and the diligence of the Corps and Coast Guard in keeping the channel open and channel buoys set
Both the drought and accompanying low water on the Mississippi River were widely reported by local and national media outlets throughout 2012 Agricultural and navigation interests were the focal point of the Nationrsquos concern as the Corp of Engineers and the US Coast Guard employed extraordinary measures to keep shipping lanes safe and open These measures while mitigating the adverse circumstances to some extent did not prevent waterway stakeholders from absorbing additional costs
The Corps of Engineers decided to formulate an estimate of these costs in order to better understand the importance of these major waterways to commercial users A major part of this effort was a survey of both waterway carriers and shippers dependent upon the high traffic volume waterways that experienced low water conditions (the affected waterways were the Mississippi River (the Mississippi River between St Louis Missouri and Cairo Illinois and between Cairo and Baton Rouge Louisiana) the lower Illinois River and the lower Ohio River) Surveys sent to carriers and shippers were designed to elicit economic impact information related to this protracted period of low water to include the river closure due to the accident at LD27
The Corps surveyed 125 shippers and ten carriers The 73 shippers that responded represent 42 percent of all shipper traffic transiting the affected waterways Half of the respondents to the shipper survey indicated that they did not experience any significant effects on operations due to low water and an overwhelming percentage said they were unaffected by the LD27 closure Ten carriers were surveyed The six carriers responding represented 46 percent of all carrier traffic transiting the affected waterways All but one of the carriers responding indicated that they were affected by both low water and the LD27 closure with the low water being the more serious challenge The difference in shipper and carrier responses suggests that the shippers were somewhat insulated from these events by the strategic and tactical actions taken by the carriers that minimized impacts on the shippers
A telling indicator of the waterway carriersrsquo determination to satisfy shipper needs is the fact that while waterway traffic through the lower Ohio Illinois Middle Mississippi and Lower Mississippi was somewhat diminished due to reduced corn traffic (a result of drought-reduced production) traffic through the rock pinnacles at Thebes Illinois and low
ES ‐ ii
___________________________________________________________
water at locations like Greenville Mississippi was largely unchanged between 2011 and 2012 Moving cargo during this period required carriers to advance or delay shipments light load vessels (necessitating additional trips) reposition barges throughout the system to accommodate the need for additional barges restrict tow sizes (also necessitating more trips) and perform additional refleeting It cost responding carriers an estimated $807 million to alter operations in this fashion The carriers also faced $167 million in additional costs as a result of the LD27 closures and delays and tug costs of $02 million due to tow groundings Despite these actions shippers did not escape the effects of the low water In an effort to meet their needs shippers sought other sources for product sought other waterway routes and used overland transportation routes at a cost to responding shippers of $559 million The effect of the drought on agricultural production combined with increased transportation costs resulted in temporary plant closures and lost sales that the responding shippers estimated at $790 million
Low Water Cost Impacts ‐ 2012 Event (Costs in $000)
Cost Category Survey
Responses
Estimate for Firms Not
Responding Not Surveyed TOTAL
Transportation cost impacts Carrier cost impacts
Delays due to LD27 closure 1 $ 16100 ‐$ $ 16100 Other costs due to LD27 closure $ 573 417 $ $ 990 Groundings $ 164 119 $ $ 283 Altered operations $ 80723 58719 $ $ 139442
Shipper cost impacts $ 55860 64277 $ $ 120137 SUBTOTAL $ 153419 123532 $ $ 276951
Production cost impacts 2 $ 79000 86248 $ $ 165248 TOTAL $ 232419 209780 $ $ 442199
1 I ncl udes del a y cos t experi enc ed due to LD27 ma i n cha mber cl os ure Dec 2012 ‐Ma r 2013 to remove dama ged cel l
2 I ncl udes ec onomi c impact of reduced corn producti on and hi gher tra ns porta ti on cos ts due to low‐wa ter
Low water the five-day closure of LD27 in September 2012 and the subsequent 82 day closure of the main chamber between December 2012 and March 2013 imposed additional transportation costs of $1534 million on the companies that responded to the Corpsrsquo surveys Drought andor low water accounted for another $790 million in production losses bringing the total reported impact to $2324 million A simple extrapolation of the sample to the population of movements using the most affected waterways (the Middle Mississippi and Lower Mississippi River) either not sampled or not responding suggests that additional transportation costs totaled $2770 million and production impacts amounted to $1652 million for a total impact of $4422 million2
The value of the inland waterway system is reflected in the extraordinary efforts of the Federal agencies and the waterway industry On average shippers using the affected waterways realize an average savings of $26 per ton over alternative transportation modes In 2011 the total tonnage moving through these reaches was 2273 million tons From this
2 It is important to remember that not all waterways affected by the drought were covered by thissurvey
ES ‐ iii
___________________________________________________________
it is estimated that shippers using this segment of the inland waterway system save a total of $58 billion over the best alternative mode andor route of transportation The Coast Guard devoted additional resources to the helping manage the low water event but did not incur measurable additional expenditures of funds The three most affected Corps of Engineers districts expended $319 million to keep the lower Ohio lower Illinois Middle Mississippi and Lower Mississippi river channels open to navigation in the face of a severe drought While industry faced losses of an estimated $2770 million due to increased transportation costs shippers and the Nation were still able to realize a savings in transportation costs of an estimated $55 billion despite this extreme low water event These savings would have been in even greater jeopardy without the cooperative and coordinated efforts of the Corps the Coast Guard and industry partners
ES ‐ iv
Contents 1 PURPOSE AND INTRODUCTION 1
2 BACKGROUND 3
21 Drought 3
22 Low Water 5
3 WATERWAY TRAFFIC 9
31 General 9
32 Traffic Patterns 9
321 Waterway Reaches and States 9
322 Commodities 11
323 Monthly Shipping Patterns 13
33 Middle Mississippi - Traffic Past Thebes Illinois 15
34 Lower Mississippi - Traffic at Greenville Mississippi 16
35 Fleet Utilization 18
36 Summary and Conclusions 22
4 LD27 CLOSURE ANALYSIS 23
41 General 23
42 January and September 2012 Outages 23
421 Tow Arrivals 23
422 Tow Processing Time 24
423 Tow Delays 24
424 Cost Impact 25
43 December 2012 through March 2013 Main Chamber Closure 26
431 Tow Arrivals 26
432 Tow Processing Time 26
433 Tow Delays 27
444 Cost Impact 27
5 SHIPPER RESPONSE 29
51 Survey Procedures 29
52 Summary of Shipper Responses 30 ___________________________________________________________
___________________________________________________________
6 CARRIER RESPONSE 31
61 Survey Procedures 31
62 Summary of Carrier Canvas Responses 31
7 FEDERAL RESPONSE 33
8 FINDINGS 35
9 CONCLUSIONS 37
APPENDIX A ndash SHIPPER QUESTIONNAIRE 1
APPENDIX B ndash CARRIER QUESTIONNAIRE 1
___________________________________________________________
LIST OFTABLES
Table 1 US Corn and Soybean Production and Exports 4 Table 2 US Corn and Soybean Production 2010 ndash 2012 9 Table 3 Shipments and Receipts by State 10 Table 4 Traffic by Reach 10 Table 5 Traffic by Major Commodity 2007 - 2011 12 Table 6 Waterway Traffic Past Thebes Illinois 16 Table 7 Loaded Barges Past Greenville Mississippi ndash 2011 and 2012 17 Table 8 Barges Tows and Barges per Tow Selected Locks 19 Table 9 Costs Incurred by the Corps 33 Table 10 Survey Results - Low Water Cost Impacts 36 Table 11 Low Water Cost Impacts from 2012 Event 37
LIST OFFIGURES
Figure 1 The Mississippi River Basin 3 Figure 2 Extent and Depth of 2012 Drought 5 Figure 3 Water Levels in Memphis ndash 2011 and 2012 6 Figure 4 Mississippi River Stages at Vicksburg Mississippi 6 Figure 5 Groundings through 28 November 2012 as reported by the US Coast Guard 7 Figure 6 Removal of stone at rock pinnacle 8 Figure 7 Commodity Shares by Reach 11 Figure 8 Monthly Traffic at Selected Locks 2007 2011 and 2012 14 Figure 9 Powerhouse at Ohio River LD53 Spring 2011 15 Figure 10 Tows delayed Due to Low-water at Greenville Mississippi August 20 2012 17 Figure 11 Tow Counts at Selected Locks 2011 and 2012 18 Figure 12 Average Barge Loadings at Selected Locks 2011 amp 2012 20 Figure 13 Average Barge Loadings at Selected Locks 2007 - 2012 21 Figure 14 LD27 Tow Arrivals 2012 24 Figure 15 LD27 Average Hourly Delays 2012 25 Figure 16 LD27 Tow Arrivals December 2012 ndash March 2013 26 Figure 17 LD27 Minimum Maximum and Average Tow Delays December 2012 ndash March 2013 27
___________________________________________________________
1 PURPOSE AND INTRODUCTION
Lower than normal precipitation in the Mississippi River Basin recorded in the winter and spring of 2012 was an early indicator of what evolved into drought conditions throughout much of the basin Field crops in Midwestern states experienced extreme conditions of stress Reservoirs provided maximum supplies under approved operating procedures to augment flow for water quality and supplies and for inland navigation on the Mississippi River in particular Both the drought and accompanying low water on the Mississippi River were widely reported by local and national media outlets throughout 2012 Agricultural and navigation interests were the focal point of the Nationrsquos concern as the Corp of Engineers and the US Coast Guard employed extraordinary measures to keep shipping lanes safe and open These measures while mitigating the adverse circumstances to some extent did not prevent waterway stakeholders from absorbing additional costs
The Corps of Engineers decided to formulate an estimate of these costs in order to better understand the importance of these major waterways to commercial users A major part of this effort was a survey of both waterway carriers and shippers dependent upon the high traffic volume waterways that experienced low water conditions (the affected waterways were the Mississippi River (the Mississippi River between St Louis Missouri and Cairo Illinois and between Cairo and Baton Rouge Louisiana) the lower Illinois River and the lower Ohio River) Surveys sent to carriers and shippers were designed to elicit economic impact information related to this protracted period of low water to include the river closure due to the accident at LD27
This report focuses on the impact of the low flows on major commercial cargo arteries in the Mississippi River Basin ndash specifically the Mississippi Ohio and Illinois Rivers ndash and estimates economic impacts from drought-related low flows and associated unexpected closure of Locks and Dam 27 Costs incurred by the Federal government specifically the Corps of Engineers are reported to the extent they are available
This study relied upon readily available data from public Corps of Engineers and US Coast Guard sources to describe river conditions events that occurred as a result of low water conditions and efforts to manage vessel traffic A targeted survey of inland waterway carriers and shippers was used to estimate the economic effects of interruptions and disruptions to navigation that occurred as a result of the drought and associated low water conditions
Page1
Page2
Figure 1 The Mississippi River Basin
2 BACKGROUND
21 Drought
The drought of 2012 affected much of the Mississippi River Basin whose major streams are corridors of inland waterway commerce in the Midwest and Plains states (see FIGURE 1) Four waterway reaches that experienced low water conditions and carry bulk commodities in excess of 25 million tons annually were identified for closer examination in this study 1) the Ohio River between Smithland LD and the mouth of the Ohio River 2) the Illinois River between Peoria LD and the mouth of the Illinois 3) the Mississippi River between the confluence of the Ohio River and Baton Rouge Louisiana and 4) the Mississippi River between St Louis Missouri and the confluence of the Ohio In 2011 shippers in 20 states moved commodity through the four reaches with ten different states (Arkansas Illinois Indiana Kentucky Louisiana Missouri Mississippi Ohio Tennessee and West Virginia) in the top five in shipping or receiving commodities in one or more of these reaches
The US Department of Agriculture estimated that nearly 80 percent of agricultural land was affected by drought in 2012 with 70 ndash 75 percent of the corn and soybean production affected by severe or greater drought By September 2012 over 2000 counties were
Page3
designated disaster areas by USDA3 In the Midwest the drought destroyed or damaged corn and soybean crops in particular ndash both the region and producers of these commodities being served by the inland waterway system Corn production declined by 13 percent between the 2011 and 2012 marketing year soybeans by 3 percent and corn exports fell by 51 percent (see TABLE 1)
Table 1 US Corn and Soybean Production and Exports (in millions of bushels)
Ma rke t Ye a r 1 Production
Cha nge from
pre vious ye a r Ex ports
Cha nge from pre vious
year
200708 1303788 -- 243740 --200809 1209165 -7 184895 -24 200910 1309186 8 198002 7 201011 1244687 -5 183417 -7 201112 1235961 -1 154260 -16 201213 1078030 -13 75000 -51
Sourc e USDA Economic Research Service Feed Outlook 1 market year is from September to August
US Soybe a n Production a nd Ex ports 2007 to 201213
(in millions of bushels)
Market Year 1 Production
Cha nge from
previous year Ex ports
Change from
pre vious year
200708 267712 -- 115883 --
200809 296701 11 127929 10
200910 335901 13 149905 17
201011 332918 -1 150094 0
201112 309352 -7 136185 -9
201213 301500 -3 134500 -1
Source USDA Ec onomic Res earch Servic e US Oilcrops Yearb ook
1 market y ear is from September to August
Drought in western Texas spread throughout most of the Great Plains and into the lower Ohio Valley through the spring of 2012 (see FIGURE 2) and winter months of 2013 Extreme and Exceptional drought was persistent in the Great Plains states of South Dakota Nebraska Kansas Oklahoma and northern Texas ndash all major agricultural producing areas Extreme drought reached into the Midwest states in particular southern Minnesota Iowa Illinois Indiana and Missouri ndash all major producers of corn and soybeans4 The wheat crop
3 See the USDA Economic Research Service ldquoUS Drought 2012 Farm and Food Impactsrdquo athttpwwwersusdagovtopicsin‐the‐newsus‐drought‐2012‐farm‐and‐food‐impactsaspx4 Extremedroughts arecharacterized bycrop losses and widespread water shortages or restrictionsExceptionaldroughts are characterized by widespreadcroplosses shortages of waterinreservoirsstreamsand wellscreatingwateremergenciesSeehttpdroughtmonitorunleduclassifyhtm
Page4
was largely spared as it was harvested in late spring prior to the drought taking hold in these states
Figure 2 Extent and Depth of 2012 Drought
22 Low Water
In addition to agriculture the 2012 drought affected water supplies for industrial and municipal uses recreation and the ability to navigate on the Mississippi River and its navigable tributaries Small harbors and terminals saw rivers fall to levels not experienced in nearly 50 years (see FIGURE 3)
Page5
Figure 3 Water Levels in Memphis ndash 2011 and 2012
Figure 4 Mississippi River Stages at Vicksburg Mississippi
Low water conditions rivaled those observed during the 1988 drought event By November 2012 water levels on the Mississippi River fell below those experienced in 1988 (see FIGURE 4) Beginning in May 2012 the Mississippi River stage reached the lowest level observed in the past 112 years Heavy rain and flooding in the Mississippi River Basin ended the low water problems in March 2013
Page6
Figure 5 Groundings through 28 November 2012 as reported by the US Coast Guard
Low water on these major waterway transportation arteries hampered navigation Tows accustomed to wide and deep navigable channels began to suffer from groundings along the length of the Mississippi River (see FIGURE 5) At Mississippi River LD27 water levels fell below the armor-protected area of sheet pile guide cells What would ordinarily be routine impacts on the guide cell as tows aligned to enter the locks led to failure of the cell as impacts occurred on unprotected regions of the sheet pile protectionguide cell Failure of the cell and subsequent clean-up of gravel spilled from the ruptured cell resulted in closure of the Mississippi River at the location of LD27 for approximately five days from 14 September 2012 until 20 September 2012
Groundings of tows occurred along nearly the entire length of the Mississippi River and were especially problematic along the border of northern Illinois between Thebes and Grand Tower Illinois and in the general vicinity of Greenville Mississippi According to the US Coast Guard 18 groundings on the Lower Mississippi led to closure events with more than 25 tows in queues River closures became necessary when tows stuck in shallow water had to be removed when tows broke apart and barges had to be retrieved and reassembled or when it was determined that the channel needed to be surveyed dredged and channel buoys reset
Page7
Figure 6 Removal of stone at rock pinnacle
Water levels on the Mississippi River at Thebes Illinois and at Grand Tower Illinois exposed rock ledges that reduced navigable drafts to 9 feet (well below customary drafts of 10 and 11 feet) and restricted the channel to one-way traffic5 The Corps removed these hazards in early 2013 (see FIGURE 6)
5 According to the US Army Corps of Engineers St Louis District River Projects Manager there was one‐way traffic at the pinnacles with 12 hour closures each day during the removal from 1Jan 2013 to roughly 15 February 2013 There were also other reaches of the river where there wasinsufficientchannelwidthof therequireddepthto permit two‐way traffic
Page8
3 WATERWAY TRAFFIC
31 General
Waterway traffic examined in this section focuses on the Lower Mississippi River and lower reaches of the Upper Mississippi Illinois and Ohio Rivers While the drought also seriously affected waterways in the southwest and the Missouri River traffic flows on these other rivers is relatively small in comparison with the Mississippi Illinois and Ohio Rivers Comparable data through December 2012 was available from the US Army Corps of Engineers Waterborne Commerce Statistics (WCS) and Lock Performance Monitoring System (LPMS) data sets for convenience of comparison only data through December 2012 is examined in this section of the report
32 Traffic Patterns
With the exception of Minnesota major grain and oilseed producing states saw sharp percentage declines in production that exceeded what was a national decline (See TABLE 2) All of these major producing states are touched by navigable waterways The expectation is that this diminished production of corn and soybeans should be reflected in decreased waterway traffic in these commodities
Table 2 US Corn and Soybean Production 2010 ndash 2012
IL IN IA MN MO NE OH US Corn (000s bushels)
201000 1946800 89804000 2153250 1292100 369000 1469100 533010 12446865 201100 1946800 839500 2356400 1201200 349980 1536000 508760 12359612 201200 1286250 596920 1876900 1374450 247500 1292200 448950 10780296
change 2011 ‐ 12 ‐339 ‐289 ‐203 144 ‐293 ‐159 ‐118 ‐128 Soybeans (000s bushels)
201000 466075 258505 496230 328950 210405 267750 220320 3329181 201100 423225 240695 475345 274560 190165 261360 217920 3093524 201200 383560 223590 413850 300570 155170 207085 206100 3014998
change 2011 ‐ 12 ‐94 ‐71 ‐129 95 ‐184 ‐208 ‐54 ‐25 Source Crop Production 2012 Summary USDA National Agricultural Statis tics Service January 2013
321 Waterway Reaches and States
Four waterway reaches that experienced low water conditions and carry bulk commodities in excess of 25 million tons annually were identified for closer examination in this study 1) the Ohio River between Smithland LD and the mouth of the Ohio River 2) the Illinois River between Peoria LD and the mouth of the Illinois River 3) the Mississippi River between the confluence of the Ohio River and Baton Rouge Louisiana and 4) the Mississippi River between St Louis Missouri and the confluence of the Ohio In 2011 shippers in 20 states moved commodity through the four reaches with ten different states (Arkansas Illinois Indiana Kentucky Louisiana Missouri Mississippi Ohio Tennessee and West Virginia) in the top five in shipping or receiving commodities in one or more of these reaches (see TABLE 3)
Page9
Table 3 Shipments and Receipts by State
State
Ohio River ‐ Smithland LD to Cairo IL
Illinois River ‐ Peoria LD to the Mouth
Mississippi R ‐ Cairo IL to Baton Rouge LA
Mississippi River ‐ StLouis to Cairo IL
ship receive ship receive ship receive ship receive AL 1435 4 049 214 489 1340 2351 337 1840 AR 470 972 139 157 6634 6628 235 1336 FL ‐ 41 ‐ 6 30 151 2 64 IA 292 308 23 5 5088 1532 5380 2397 IL 27819 4 477 19 170 11 428 45735 10171 49496 14764 IN 5738 14523 686 863 4994 2713 595 3794 KY 26306 10540 214 438 20 197 6 953 902 1 465 LA 16743 37420 6782 13629 44 026 114 919 14 816 58 194 MN 173 122 14 149 4 860 2 384 5 048 3 021 MO 1992 683 938 152 21 414 3 750 25 302 5 681 MS 697 1383 175 104 4 473 4 508 264 1 005 NE ‐ ‐ ‐ ‐ 8 13 8 13 NY ‐ ‐ ‐ ‐ 2 ‐ ‐ ‐
OH 2940 9188 126 112 2011 4956 710 1939 OK 192 260 138 88 2795 2391 189 240 OT ‐ ‐ ‐ ‐ ‐ 10 ‐ 10 PA 1143 2266 12 54 860 1848 240 101 TN 2494 9005 82 719 5770 9870 257 6200 TX 2930 954 874 1257 5034 5046 1 017 2 996 WI 29 2 ‐ 4 633 243 664 975 WV 7984 3184 146 79 6650 2117 1115 542
Sour c e US Army Corps of Engi neer s Wa terbor ne Commer ce Sta ti s ti cs Center
Note OT (Other) designates moves to unidentified states
Between 2011 and 2012 the Illinois reach experienced the greatest percentage decline in traffic (47 percent) and the Mississippi River between St Louis and Cairo Illinois experienced the greatest tonnage decline at just over 32 million tons (see TABLE 4) The Mississippi River below Cairo Illinois actually showed an increase in traffic between 2011 and 2012
Table 4 Traffic by Reach (ktons)
Waterway Reach 2007 2008 2009 2010 2011 2012 1
Change 2011 to 2012
ktons Change
Ohio River ‐ Smi thland LD to Cairo IL 108746 113329 94639 101756 99378 98328 (1049) ‐11 Illinois River ‐ Peoria LD to the Mouth 32868 30212 29569 29267 29735 28324 (1411) ‐47 Missis s ippi River ‐ Cairo IL to Baton Rouge LA 185872 176329 166557 176879 182551 184779 2228 12 Missis s ippi River ‐ StL oui s to Cairo IL 109763 98572 104275 102896 106579 103359 (3219) ‐30 Sour ce US Ar my Corps of Engi n eer s Wa ter bor ne Co mmer c e Sta ti s ti c s Center
1 preliminary 2012
Many of the movements represented in the table above transit more than one of the waterway reaches being considered therefore total tonnage cannot be calculated simply by summing the traffic reported for individual reaches This value was drawn from the 2011 Waterborne Commerce Statistics which indicate that in 2011 the total tonnage moving through these reaches was 2273 million tons Using available transportation rate studies conducted for navigation improvement studies on the Upper Mississippi Illinois and Ohio River it is estimated that this
Page10
Ohi o River - Smith land t o Mouth 2011 coal Il linois River Peoria LD to Mouth 2011 aggregates
2
sulfur clay amp salt 4
o ilseeds 4 co rn
25
corn 6
cr ud e petrol aggregates 0
15
Mississippi River - St Louis to Cairo 2011 coal
coal 19
all other
cru de petrol 2
aggregates 9
sul fu r clay amp saft
3
12 15
salt 4
Mississippi River - Cairoto Baton Rouge 2011
8
Figure 7 Commodity Shmmiddotes by Reach
tollllage moves at an average umiddotansportation rate savings of $25 58 a ton It is therefore estimated that shippers using this segment of the inland wate1way system save a total of $58 billion over the best altemative mode andor route ofumiddotansportation
322 Commodities
Coal is the predominant commodity moving through the Ohio reach (see FIGURE 7) Com is the single m ost dominant commodity moving through the Illinois River reach though products in the all other group represent the maj ority of this Illinois River reach s tollllage Peumiddotoleum products at 45 million tons chemicals and fe1tilizers at 52 million tons and iron and steel products at 22 million tons are the primmy commodities in this group On both reaches of the Mississippi River coal is the lmmiddotgest single commodity by tons closely followed by com Agricultural products (all grains oilseeds vegetable products and feeds) amounted to 61 8 million tons or 34 percent of Cairo to Baton Rouge tollllage and 369 million tons or 35 of St Louis to Cairo tons
Traffic figmes by reach and by commodity shown in TABLE 5 begin to display the impact of both lower agricultmal production and low water levels on wate1way umiddotaffic The Ohio River wate1way reach showed only a slight decline (1 percent) but commodities with mmmiddotkets or som ces on the lower Mississippi and Gulf Coast showed declines in umiddotaffic between 2011 and 2012 typified by the sulfur clay and salt group 6 Salt com and stone all showed significant
6 According to LPMS data coal traffic at LD53 declined from 142 million tons to 12 9 million tons (a 136 percent decline) the latter half of2012 compared with the same period of2011 This fo llowed an 09 million ton increase (72 percent) for the first six months of2012 compared w ith the same period in 2011
Page 11
declines While corn shipment declines could be tied to decreased production lower stone and salt shipments were likely the result of low water conditions that affected the cost of shipment or an ability to delay shipment Oilseeds traffic grew by 25 percent reflecting a late season improvement in soybean harvest
Table 5 Traffic by Major Commodity 2007 - 2011 (ktons)
Waterway Reach 2007 2008 2009 2010 2011 2012 1 Change 2011 to 2012 ktons Change
Ohio River ‐ Smithland LD to Cairo IL 108746 113329 94639 101756 99378 98328 (1049) ‐11
coal 37737 46943 37792 38433 40526 41949 1423 35 crude petroleum 106 53 44 46 145 590 445 3072 aggregates 18394 17445 15703 17303 15437 13569 (1868) ‐121 sulfur clay amp salt 2468 3352 3387 3717 3552 2427 (1125) ‐317 corn 7320 6961 6616 7013 5518 4632 (886) ‐161 oilseeds 4058 3969 5004 5176 4189 5221 1033 247 all other 38664 34607 26093 30067 30012 29941 (70) ‐02
Illinois River ‐ Peoria LD to the Mouth 32868 30212 29569 29267 29735 28324 (1411) ‐47
coal 1597 1548 777 919 1727 1150 (576) ‐334 crude petroleum 15 1 21 6 30 583 554 18635 aggregates 874 499 495 232 564 743 178 316 sulfur clay amp s alt 1169 2090 2282 881 1125 882 (243) ‐216 corn 9839 8017 9643 9137 7549 4934 (2615) ‐346 oilseeds 1940 1650 2637 2769 2503 3808 1305 521 all other 17434 16407 13715 15323 16237 16224 (13) ‐01
Mississippi River ‐ Cairo IL to Baton Rouge LA 185872 176329 166557 176879 182551 184779 2228 12
coal 22208 26629 23326 23648 34122 37163 3041 89 crude petroleum 1383 1848 1852 1901 3984 5764 1780 447 aggregates 17923 18009 17741 18474 16035 14575 (1460) ‐91 sulfur clay amp s alt 5304 7863 7962 6322 6648 4639 (2010) ‐302 corn 35465 28293 30872 31835 28065 20842 (7223) ‐257 oilseeds 17966 17648 23807 25216 21324 28369 7045 330 all other 85622 76039 60998 69483 72373 73427 1055 15
Mississippi River ‐ StLouis to Cairo IL 109763 98572 104275 102896 106579 103359 (3219) ‐30
coal 26428 26228 27127 22262 25589 22290 (3299) ‐129 crude petroleum 375 725 677 891 3229 4847 1617 501 aggregates 9735 8691 8425 8335 7947 8799 852 107 sulfur clay amp s alt 2726 4389 4475 2481 3136 2160 (976) ‐311 corn 26951 19755 23504 23824 20760 14273 (6487) ‐312 oilseeds 9687 8642 12531 12471 10682 15354 4672 437 all other 33861 30142 27536 32632 35236 35638 402 11
Source US Army Corps of Engi neers Waterborne Commerce Stati s ti cs Center
1 Prel imi nary 2012
The Illinois River reach showed the greatest percentage decline between 2011 and 2012 (5 percent) with declines in corn (35 percent) coal (33 percent) and salt (22 percent) showing the largest decreases Coal declines were influenced by the closure of a coal-fired electric utility
Page12
plant in late 20117 Like the Ohio commodities moving to and from the lower Mississippi were most affected The Mississippi River between Cairo and Baton Rouge had sizable declines in salt (30 percent) and corn (26 percent) while oilseed traffic grew (33 percent) The Mississippi River between St Louis and Cairo declined the most in tonnage (32 million tons) with salt and corn both declining by 31 percent Oilseeds increased by 44 percent and stone by 10 percent Given the 51 percent decrease in US corn exports (refer to TABLE 1) it is not surprising that corn traffic to the Gulf would decline when approximately half of all US corn exports move by barge to the lower Mississippi and Gulf Coast The ldquoall otherrdquo commodity group was the least affected by the drought All four river reaches experienced sharp percentage increases in crude oil movements though the tonnages were relatively small in each reach These increases likely reflected the first significant movement of shale gas liquids on the inland waterway system
323 Monthly Shipping Patterns
The Corpsrsquo Lock Performance Monitoring System (LPMS) data has reliable information on tow transits commodity tonnages and barge counts by month at all Corps lock and dam projects Three locksndash Ohio River LD53 Mississippi River LD27 and Peoria LD ndash were selected for closer examination of shipping patterns (discussed in this section) and fleet utilization (discussed in the next section) Ohio River LD53 is the closest Ohio River lock to the mouth of the Ohio River so it offers a fair representation of traffic on the lower reach of the Ohio Similarly Peoria LD is closest to the mouth of the Illinois River and Mississippi River LD27 is the furthest downstream lock on the Mississippi Each offers fair representations of the Peoria to the mouth of the Illinois and St Louis to Cairo reaches of these two rivers respectively
As seen in FIGURE 8 monthly traffic at Ohio River LD53 ranged between 50 million and 70 million tons per month in the years selected for analysis (2007 2011 and 2012)
7 AmerenEnergy closedtheMeredosiaplant inlate 2011Seewwwfuturegenallianceorgcommunity‐cogen201303 accessed26July2013
Page13
8000000
7000000
6000000
5000000
~ 4000000 3000000
2000000
1000000
-
Ohio River LDS3 Traffic by Month
--- ~ -~ V- -
-
-
-
2007
2011
2012
9000000 8000000 7000000 6000000
~ 5000000 ~ 4000000
3000000 2000000 1000000
Mississippi River LD27 Traffic by Month
-
-
-
2007
2011
2012
3000000
2500000
2000000 Ill 1 1500000 01shy
1000000
500000
Peoria LD Traffic by Month
-
-
-
2007
2011
2012
Figure 8 Monthly Traffic at Selected Locks 2007 2011 and 2012
Page 14
Figure 9 Powerhouse at Ohio River LD53 Spring 2011
The range of variation would likely have been tighter except for the high water event in the spring of 2011 (see FIGURE 9) which caused a sharp drop in traffic in May of that year Traffic at Mississippi River LD27 and Peoria LD follows a more cyclical pattern than that shown on the Ohio River July and November are typically peak months at LD27 and July and NovemberDecember at Peoria LD Monthly volumes in 2012 mirrored those of 2011 at both locks though at lower levels particularly in the summer and fall when the drought was most intense
33 Middle Mississippi ‐Traffic Past Thebes Illinois Navigating the Middle Mississippi River between St Louis and Cairo Illinois especially in the vicinity of Thebes Illinois and Grand Tower Illinois was a serious challenge for vessel operators 8 These two stretches experienced low water that exposed rock ledges called pinnacles which exposed vessels to grounding and damage Traffic was restricted to one way for periods in the fall of 2012 and the US Coast Guard imposed tow size and draft restrictions Large towboats that customarily move through these reaches could not navigate the restricted draft around Thebes and Grand Tower Illinois necessitating the shuttling of barges through this reach and refleeting above and below the constrictions
Waterway carriers were apparently determined to satisfy shipper needs as traffic through the restricted reaches at Thebes Illinois was largely unchanged between 2011 and 2012 ( see TABLE 6) Declines in corn traffic related to lower corn production were replaced with higher downbound moves of soybean aggregates and crude petroleum
8 See httpwwwstltodaycomnewslocalmetrolow‐water‐on‐mississippi‐river‐causes‐barge‐companies‐to‐lightenarticle 2b1505f1‐ab93‐5e73‐9a36‐d43ff5c8c0b6html
Page15
Table 6 Waterway Traffic Past Thebes Illinois
2011 2012 LPMS Name Up Down Total Up Down Total
CoalLignite amp Coal Coke 2274342 20849891 23124233 2092647 18825680 20918327 Crude Petroleum 22853 3206496 3229349 29239 4780424 4809663 DistillateResidual amp Other Fuel Oils Lube Oil amp Greases 730648 2305378 3036026 614765 2113449 2728214 Petroleum Pitches Coke Asphal t Naptha and Sol vents 335480 2427538 2763018 342221 3161000 3503221 Ferti l izers 6004043 249240 6253283 5905454 229606 6135060 Other Chemicals and Related Products 2 800 138 2 417 289 5 217 427 2 760 812 2 127 573 4 888 385 Sand Gravel Stone Rock Li mes tone Soil Dredged Material 729938 5715696 6445634 807605 7380288 8187893 Iron Ore and Iron amp Steel Waste amp Scrap 331 790 1 042 578 1 374 368 252 297 918 336 1 170 633 Sulphur (Dry) Clay amp Salt 3020775 114884 3135659 2091825 100469 2192294 Slag 226099 150649 376748 362250 113363 475613 Building Cement amp Concrete Li me Glass 69839 3343391 3413230 76587 3914565 3991152 Primary Iron and Steel Products (IngotsBarsRodsetc) 2077909 414447 2492356 2498038 456312 2954350 Wheat 3366 1640911 1644277 5418 1406811 1412229 Corn 8956 20548560 20557516 327740 13783421 14111161 Oil seeds (Soybean Fl axs eed and Others) 68755 10534468 10603223 91354 15187093 15278447 Animal Feed Grain Mi l l Products Flour Processed Grains 52619 2972138 3024757 79030 2537614 2616644 All Others 1817209 953399 2770608 1833834 976248 2810082 TOTAL 20574759 78886953 99461712 20171116 78012252 98183368 Source Waterborne Commerce Statistics
Note Orange shaded cells denote commodities where declines greater than 1000000 tons were experienced between 2011 and 2012 while green shaded cells denote growth of greater than 1000000 tons between 2011 and 2012
34 Lower Mississippi ‐Traffic at Greenville Mississippi
With flows falling throughout the summer on the heavily used Lower Mississippi River tow groundings began to occur - the first being reported on 11 May 2012 Groundings led the US Coast Guard to restrict drafts and tow sizes on the Lower Mississippi where some reaches required dredging in order for vessels to safely navigate 9 One of the more widely reported events occurred on an 11-mile stretch of the river near Greenville Mississippi where intermittent river closures occurred to accommodate the freeing of grounded tows surveying of channel and dredging to open channel It was reported that on August 20 2012 that nearly 100 tows had been delayed near Greenville waiting for the channel to reopen10 Similar events occurred along the Lower Mississippi in locations including Memphis Tennessee Helena Arkansas and Natchez Mississippi
According to the US Coast Guard 18 groundings led to closure events with more than 25 tows in queues In total these events caused 1130 tows and 17640 barges to be delayed Closures of the river occurred when tows needed to be pulled from bars or banks reassembled after breaking-up upon running aground or when channel work was required Industry worked together to free and re-assemble tows Where groundings became frequent in specific areas the US Coast Guard the US Army Corps of Engineers and industry jointly determined when a river closure was necessary to allow the Corps to survey and dredge the channel and the Coast Guard to reset buoys that mark the channel By June draft restrictions were set at 10rsquo6rdquo northbound tow sizes to 42 barges per tow and southbound tows to 36 barges per tow In early July drafts were down to 9rsquo6rdquo and tow sizes further reduced in late July drafts were restricted to 9rsquo northbound tow sizes to 20 loaded barges per tow and southbound tow sizes to 30 barges per
9 httpcornandsoybeandigestcomissuesforced‐barge‐light‐loading‐low‐mississippi‐river accessed 31July201310 httpearthobservatorynasagovIOTDviewphpid=78927 accessedon31July2013
Page16
Figure 10 Tows delayed due to low-water at Greenville Mississippi August 20 2012 Source NASA See footnote number 7
tow By mid-August one way traffic was instituted in problem reaches drafts were limited to 9rsquo and tow sizes limited further Draft and tow size restrictions were gradually relaxed but it was not until 14 December 2012 that all restrictions were lifted
Like the Thebes Illinois constriction point the Greenville Mississippi constriction did not affect traffic levels in fact traffic increased by 2 million tons between 2011 and 2012 (see TABLE 7) The effects of the low water can be seen in the tons per loaded barge which declined by 46 tons on average for the entire year As with the constriction at Thebes waterway carriers were apparently determined to satisfy shipper needs though this came at higher transportation costs Corn harvests along the Lower Mississippi were less affected by the drought than in the traditional Corn Belt regions served by the Upper Mississippi Ohio and Illinois Rivers which coupled with stronger soybean traffic led to increased traffic through this reach as opposed to more steady traffic through Thebes
Table 7 Loaded Barges Past Greenville Mississippi ndash 2011 and 2012
2011 2012 Difference 2011 ‐ 2012
Loaded Barges 92108 95760 3652 Tons 163314542 165384334 2069792 Tons per Loaded Barge 17731 17271 (46)
Source US Army Corps of Engineers Waterborne Commerce Statistics Center
Page17
700
600
500
400
300
200
100
f- f-
f-f-r-
Ohio River LD53
Tow Counts 2011 amp 2012
r- f-I-- fshy f- f-
r- r- r- r-f- f- f- f-r- r- r- r-
f-f-
f-f-rshy
800
700
600
500
400
300
200
100
r-r-fshy1shy-shy
Mississippi River LD27 Tow Counts 2011 amp 2012
-shyt- t-r- r-r- r-f- fshy1shy 1shy-shy -shy
shyr-r-fshy1shy-shy
t-rshy1shy
fshy1shy-shy
-
400
350
300
250
200
150
100
so
1shy
f-f-tshy-shy
Peoria LD Tow Counts 2011 amp 2012
1shy 1shy r-shyf- f- f-f- f- f-t- t- tshy-shy -shy -shy
1shy
f-f-tshy-shy
Figure 11 Tow Counts at Selected Locks 2011 and 2012
35 Fleet Utilization
The C01ps Lock Perf01mance Monitoring System (LPMS) data was examined at the three gateway locks discussed above this time for evidence of altered vessel operation pattems As seen in FIGURE 11 the effect of the 2011 high water event on the lower Ohio River is reflected in lower tow counts in April and May of that year othetwise tow counts are fairly similar between 2011 and 2012 The droughts effect was more apparent at Mississippi River LD27 an d at Peoria LD where tow counts were down significantly between 2011 and 2012 dming the summer and fall months ---------------------------------------
Page 18
Barges per tow and composition of tows did not change dramatically at any of the three locks between 2011 and 2012 (see TABLE 8) The most significant change occurred at LD53 where barges per tow dropped from 117 per tow to 111 per tow while the percentage of empties increased by 3 percent Tow sizes at LD27 remained around 75 barges per tow and grew slightly from 64 to 67 barges per tow at Peoria LD Significantly fewer loaded barges were processed at each of the three locks
Table 8 Barges Tows and Barges per Tow Selected Locks Ba rge s TOTAL
Tow s Ba rges
pe r Tow Loaded Loaded Empty Empty Tota l LD 53
2007 48592 68 23187 32 71779 7039 102 2008 48009 68 22434 32 70443 6624 106 2009 40352 65 21706 35 62058 5489 113 2010 47030 67 23602 33 70632 5984 118 2011 47465 67 22863 33 70328 6021 117 2012 45064 64 25656 36 70720 6352 111
LD 27 2007 41019 67 20574 33 61593 7217 85 2008 35391 70 15343 30 50734 6456 79 2009 37259 64 20868 36 58127 6753 86 2010 35647 65 19299 35 54946 6792 81 2011 34799 68 16709 32 51508 6909 75 2012 34237 67 16904 33 51141 6713 76
Peoria 2007 15336 67 7519 33 22855 3264 70 2008 13526 69 5981 31 19507 3063 64 2009 13376 64 7677 36 21053 3028 70 2010 13452 65 7402 35 20854 3044 69 2011 13265 67 6621 33 19886 3087 64 2012 12702 67 6185 33 18887 2803 67
The effect on total tons of fewer loaded barges through these locks was heightened by lighter loadings measured in tons per barge (see FIGURE 12) which occurred in the late summer and fall of 2012 At LD27 loadings were down approximately 100 tons per barge in October November and December of 2012 when compared with the same months in 2011 and down approximately 75 tons per barge in October and November at Peoria LD
Page19
Ohio River LDS3 Aver age Barge Loadings
1850 ---------------------shy1800 +-------------------shy1750 -1-------=-------------shy1700
~ 1650 ~ 1600
1550 1500 1450 1400
1850 1800 1750 1700
~ 1650 ~ 1600
1550 1500 1450 1400
1850 1800 1750 1700
~ 1650 ~ 1600
1550 1500 1450 1400
Jan Feb Mar Apr May Jun Jul Aug 5ep Oct Nov Dec Ave
r r-r-r-rshyshy
Mississippi River LD27 Average Barge Loadings
r- r- r-r- r- r-r- r- r-r- r- r-r- r- rshyshy shy shy
r-
r- rshy shy
r- r- r-r- r- rshyshy shy -
Jan Feb Mar Apr May Jun Jul Aug 5ep Oct Nov Dec Ave
-shy
r-rshy-
Peori a LD Average Barge Loadings
r- r-r- r-
r- r- r-r- r- r-r- r- r-r- r- rshyshy shy shy
rshy - r-
r- r- r-r- rshy 1shy
r- r- r-r- rshy shyshy shy -
Jan Feb Mar Apr May Jun Jul Aug 5ep Oct Nov Dec Ave
Figure 12 Average Bar ge L oadings at Selected Locks 2011 amp 2012
The combination of fewer barges per tow and lighter loadings at LD27 and Peoria continued a trend at these two locks of fewer tons per tow (see FI GURE 13) A distinct pattem emerges at LD27 one that minors the pattem of grain shipments Significantly larger tons per tow occur during the peak grain shipping season These cyclical variations occur each year though the peaks an d valleys have smoothed with each passing year In 2012 the cyclical pattem is all but unnoticeable At LD53 the combination of smaller tows a greater percentage of empty barges
Page 20
LDS3 Tons per Tow by Month 2007 -2012
LD27 Tons per Tow by Months 2007 - 2012
Peoria LD Tons per Tow by Month 2007 -2012 10000
9000
8000
7000
6000
~ _ 5000
4000
3000
2000
1000
rJ A AA I IVV1 ~ AAV II1 v
1 y bull
Figure 13 Average Barge Loadings at Selected Locks 2007 - 2012
and somewhat lighter loadings caused tons per tow to drop steeply toward the end of2012 despite an increase ofover 300 tow transits that year
Page 21
36 Summary and Conclusions Traffic patterns were examined on the four high volume waterway segments affected by low water in 2012 With the exception of the Lower Mississippi from Cairo Illinois to Baton Rouge Louisiana each segment experienced lower traffic in 2012 than in 2011 Sharp declines in corn traffic undoubtedly related to a greatly diminished harvest explain most of the traffic decline though carriers continued to maintain volumes otherwise
When looking at monthly traffic levels reported in the LPMS data for the gateway locks to the Ohio Illinois and Upper Mississippi (Ohio River LD53 Peoria LD and LD 27) typical cyclical patterns of shipment are apparent in 2012 but at lower levels Vessel operators ran significantly fewer tows in the summer and fall moved fewer barges at LD27 and Peoria but more barges at OH53 ndash this increase being explained by the increased movement of empty barges Tows pushed fewer loaded barges that were more lightly loaded (100 tons per barge less than average at LD27) The end result was lower traffic at each of these three projects
Unfortunately there is no data equivalent to LPMS available at the constriction points on the Mississippi River at Thebes and Grand Tower Illinois that will describe how vessel operators configured their tows We do know that there were vessel draft restrictions that affected both loadings and the size of towboats as well as tow size restrictions According to the Waterborne Commerce Statistics waterway traffic at Thebes Illinois and Greenville Mississippi changed only slightly between 2011 and 2012 declining by 12 percent at Thebes and increasing by 12 percent at Greenville Average tons per barge declined at both locations for the year We also know from surveys and discussions with vessel operators (discussed in subsequent sections) that fleeting operations were initiated above and below the Middle Mississippi reach between Thebes and Grand Tower Illinois in order to optimize the use of a limited number of smaller towboats required through this reach while still utilizing the larger towboats that typically move through this area
Page22
4 LD27 CLOSURE ANALYSIS
41 General
Mississippi River Locks and Dam 27 (LD27) is located on the Upper Mississippi River at mile 1845 near Granite City Illinois and just above St Louis Missouri It is the 4th busiest lock in terms of tonnage processing 250 million tons of agricultural products 101 million tons of chemicals and 101 million tons of petroleum products in 2012 Three closures of special note occurred at this project in 2012 The first was a main chamber closure which occurred in January of 2012 The second was an emergency closure of both chambers caused by an accident related to low water conditions at the lock The third outage was a planned closure of the main chamber to remove the guide cell damaged during the September accident
The US Army Corps of Engineers Lock Performance Monitoring System (LPMS) collects traffic and processing data from each of its lock projects LPMS data for LD27 was analyzed in order to estimate the cost impact on waterway carriers of all three closures the latter two being directly related to the low-water experienced in 2012 The January 2012 closure analysis offers some perspective when evaluating the economic impact on carriers of the five day outage of the project that was related to low water Section 42 examines the first two closures and Section 43 the third closure that began in 2012 and ended in 2013
42 January and September 2012 Outages
The January 2012 closure was a scheduled closure of the 1200rsquo x 110rsquo main chamber The outage began on 4 January 2012 at 0433 hours and ended when the chamber was reopened on 15 March 2012 at 0039 hours The closure allowed for an embedded metal repair to be completed The main chamber was closed for 1700 hours or approximately 70 days and 20 hours The second closure occurred on 15 September 2012 at 0232 hours when a guide cell was ruptured by a tow allision The resulting gravel spill from within the cell and damage to the guide cell prohibited safe passage through the main chamber A little over 15 hours later at 1527 hours the auxiliary chamber closed resulting in a total river closure Both the main and auxiliary chambers were reopened 20 September 2012 at 0330 hours therefore for 5 days and 3 hours the Mississippi River was completely closed to waterway traffic at LD27
421 Tow Arrivals
FIGURE 14 shows the arrivals per day at LD27 for the months of January ndash September 2012 Average tow arrivals per day for the period outside the closures 15 March through 15 September 2012 was 190 tows per day Average arrivals per day for the first closure period 4 January through 15 March 2012 decreased from the 190 tows per day outside the closure period to 152 tows per day Average arrivals per day for the second closure period 15 September through 20 September 2012 were 116 tows per day versus the 190 tows per day outside the closure period
Page23
Lock 27 Upper Mississippi River Main and Auxil iary Tow Arrivals 2012 Chamber
35 ---------------------------------------------------------~~ Main Chamber Closed
15
10
0 ~--------------~----------------------------------------~~ J an Feb Mar Apr May Jun Jul Aug
5 ++---------------+----------------------------------------~~
Figure 14 LD27 Tow Arrivals 2012
422 Tow Processing Time
During the first closure of the 1200 main chamber that occmTed from Janumy through March 1089 tows umiddotansited LD27s auxilimy chamber The average processing time increased from 48 minutes for all tows outside the Janumy through Mmmiddotch 2012 closure to 78 minutes during the closure
At the beginning of the second main chamber closure from 0020 through 1527 on 15 September 2012 only two tows umiddotansited LD27 auxilimy chamber The average processing time increased from 48 minutes for all tows outside the September closure to 209 minutes during the closure
The 2012 closures increased the processing time 30 minutes per tow The 1091 tows that umiddotansited the auxilimy chamber during the main chamber closures caused an additional549 hours of tow umiddotansit time
423 Tow Delays
FIGURE 15 shows delays at LD27 for the period from Janumy- September 2012 Delays stmied building soon after the 1200 chamber closed and continued until17 Mmmiddotch 2012 at 0110 hours This means that the 1700 hour closure impacted traffic for 1749 hours The 49 hour difference represents the time required for the reopened chamber to serve th e tows in queue and bring the delay back to zero During the impact period 16366 hours of tow delay were experienced by 1148 tows This results in an average delay of 143 hourstow for the first closure in year 2012 from Janumy through March By compmmiddotison 4054 tows were served at
Page 24
LD27 outside the Januruy - Mrumiddotch and September 2012 closure periods The average nonnal delay per tow was 183 minutes or approximately 31 hours Given that the average additional delay per tow was 112 hours for the Januaty - Mrumiddotch closure and that 1 148 tows were impacted the closure caused 12866 hours of additional delay
With the September 2012 closure delays strut ed building soon after the 1200 and 600 chamber closed and continued until 25 September 2012 at 1135 hours This means that the 123 hour river closure impacted traffic for 251 hours The 128 hour difference represents the time required for the reopened chambers to serve the tows in queue and bring the delay back to zero During the impact period 6498 hours of tow delay were experienced by 141 tows This resulted in an average delay of46 hourstow Given that the average nonnal delay per tow was 31 hours the average additional delay per tow was 43 hours for the September closure and that 141 tows were impacted the closure caused 6068 hours of additional delay
A total of 1288 tows were impacted in 2012 which caused an additional delay of 18934 hours Therefore on average each tow experienced 147 hours more delay during the closure than n01mal The maximum delay was 127 hours
Lock 27 Upper Mississippi River Average Hou r ly Tow Delays - Year 2012 Main and
Auxili ary Chamber
120 - Main Chamber Closed
100 80
60
40
1 tJi20
A amp A AIt amp ~~ A middot AIAA 10 ~~~m~~~~m~~~~M~~~~M~~~~M~~~~M~~~~M~~~~M~~~~M~~~~M~~~~M~~~~M~~~~M~~~~M middotmiddot middotshy~~NNNMMVV~~~~~~~~~~~~~OOO~~NNNMMVVV~~~~~~~~~~~~OOO~~NNNMMVVV~~~~~~
~~~ bull -l-l-t-t-41ii~-l-l-t-t-lt-1 -t-t-t-t-t -l~ -t-tNNNlNiNNNN1~NNNNNNN
Jan Feb Mar Apr May Jun Jul Aug Sept
Figure 15 LD27 Average Hourly Delays 2012
424 Cost Impact
The analysis above shows that the Januruy through Mrumiddotch 2012 closure caused an additional 543 hours ofprocessing time and 12866 hours of delay Given this additional transit time and average hourly operating costs for tows at LD27 the Januruy through March closure cost caniers an additional $87 million to process through the lock The September closure caused an additional 5 hours ofprocessing time and 6068 hours of delay for a total closure cost of approximately $39 million While the 70 day closure of the main chamber resulted in additional
Page 25
costs of$124000 per day the much sholier 6 day closure (with 5 days oftotal river closure) cost industry a much higher $550000 per day in delay time
43 December 2012 through March 2013 Main Chamber Closure
The third an d fmal closure at LD27 occmTed between 10 December 2012 and 2 March 2013 when th e C01ps removed the guide cell damaged in September 2012 Removal of the guide cell necessitated closure of the main chamber (and some brief closures of the auxiliruy chamber) The main chamber was closed for 1968 hours or approximately 82 days
431 Tow Arrivals
FIGURE 16 shows the anivals per day at LD27 for the months ofNovember 2012 - April2013 Average tow ruTivals per day for the period outside the closures from 1 Jlme 2012 through 31 May 2013 were 183 tows per day Average ruTivals per day for the closure period 10 December 2012 through 2 March 2013 decreased to 127 tows per day
Lock 27 Upper Mississippi River Tow Arrivals Dec 2012 - Mar 2013
35
30 Main Chamber Closed
25 uj20 amp -uA I ~
I~ ~~ I A ~ I15 ~~ n ~~
~~~ - ~1J vr 1 A10 I
5
0
~
~~~O~~~N~~~~~O~~~N~~~M~~N~~~~~ON~~~~~Om~~~~Om~~N~~~m~~N~~~~~ ~~~~NNN ~~~NNNm NNNm NNN NNNm NNN
Nov Dec Jan Feb Mar Apr
Figure 16 L D27 Tow Arrivals December 2012 - March 2013
432 Tow Processing Time
During the closure of the 1200 chamber 35 of the tows through LD27 had to double cut - the tow fl otilla had to be broken into two pruis an d each prui of the fl otilla locked through separately This increased the average processing time fr om 51 minutes for all tows outside the December 2012 through March 2013 closure to 88 minutes during the closures During the closures 1032 tows tImiddotansited LD27 Given an increase in time of 37 minutes per tow an d 1032 tows an additional 643 hours of tow processing time was experienced during the closure
Page 26
433 Tow Delays
FIGURE 17 shows delays at LD27 for the December 2012 through March 2013 closm e period Delays statted building soon after the 1200 chambers closed on 10 December 2012 at 1530 homs and continued until 4 March 2013 at 0008 hom s This means th at th e 1968 hom closme impacted traffic for 2001 hom s The 33 hom difference represents th e time requir ed for th e reopened chamber to serve th e tows in queue an d bring the delay back to zero Dming the impact period 23058 hom s oftow delay were experienced by 1076 tows (total delay in all of 2011 was 9349 homs) This 23058 homs works out to an average delay of214 homstow for th e closm e period By comparison 5246 tows were served at LD27 outside the closm e period from 1 June 2012 through 31 May 2013 The average non nal delay per tow was 27 1 minutes or approximately 45 hom s Given that the average additional delay per tow was 17 hom s for th e December 2012 - March 2013 closme an d that 1076 tows were impacted the closme caused 18195 homs of additional delay The maximum delay experienced by a tow dming this closme was 805 homs
Minimum Average amp Maximum Tow Delays Lock 27 Upper Miss River
Dec 2012 middotMar 3
90
80
70 -f 60 ~ ~ 50 0 1shy 40 Q) Q
gt- 30 ca Q) 20 0
10
De Jan
Mar bull Minimum bull Average Maximum Apr
Figure 17 LD27 M inimum Maximum and Average Tow Delays December 2012- March 2013
444 Cost Impact
The most recent infon nation available indicates that the average tow transit costs at LD27 are about $648 per hom Given the analysis above which shows that this scheduled closm e caused an additional 643 hom s ofprocessing time and 18195 hom of delay the estimated additional transit time dming the closm e cost a total of $ 122 million
Page 27
Page28
5 SHIPPER RESPONSE
51 Survey Procedures
An OMB-approved Shipper Survey (Control 0710-0001) was used to capture and evaluate shipper reactions to the drought and the emergency closure of LD27 in September (see Appendix A) Shippers were defined as companies that receive commodity traffic transiting through multiple reaches on the Mississippi River The formal shipper survey was conducted between 7 March and 30 May 2013 The purposes of the survey were to find out what measures were taken by industry to mitigate the effects of the drought-related low water and emergency closure at LD27 and to estimate the total costs to industry that resulted from the events
At the outset of the process several steps were adopted for including firms in the survey First a list was compiled that showed the parent companies that operate at docks in the four affected waterways ndash the lower Ohio lower Illinois Middle Mississippi and Lower Mississippi Rivers ndash and that ship through LD27 The parent companyowner of each receiving dock was identified using information available to the Corps and grouped by parent company This allowed an estimate of tonnage by parent companyowner to be formulated Parent companies were then ranked in descending order by their total tonnage received For LD27 and each affected waterway the top 25 ranked by companies by tons shipped were selected to be surveyed Duplicate shippers (shippers that had a top 25 ranking in more than one reach) were included as one survey and the next largest company was added to obtain the top 25 unique companies to survey in the study area In all 125 shippers were sent surveys
Waterborne Commerce Statistics Center (WCSC) data for 2011 was used in assembling basic shipper information All of the contact information for the top ranking companies was determined by comparing several contact lists In the absence of any contact information the Internet was used as a search tool to verify correct contact information for these parent companies The 125 shippers were sent a mail survey followed by a telephone follow-up if the parent company or carrier sent no response after two weeks Stakeholders like the American Corn Growers Association the River Industry Action Council (RIAC) and the Waterways Council Incorporated (WCI) assisted by encouraging firms to respond by sending emails to all members late in the survey to encourage participation
According to survey respondents low water presented the greatest challenge to users of the Lower Mississippi from Cairo Illinois to Baton Rouge and the Middle Mississippi River between St Louis and Cairo Traffic on these two reaches totaled 2024 million tons in 2011
Page29
52 Summary of Shipper Responses
Responses to the survey were received from 73 companies representing a response rate of 59 percent and accounting for 42 percent of total 2011 traffic transiting the affected waterways Questions 1a and 1b were used to help determine if the shipper had any impacts from either the emergency lock closure event at LD27 or from the low water conditions Questions 2 and further into the survey were designed to be answered by shippers who had responded that they were impacted by either or both of these events From question 2 onwards the subset of respondents is less than the total that returned surveys because some shippers indicated that they were not impacted by either event in question An overwhelming percentage of respondents to the shipper survey said they were unaffected by the LD27 closure while half of the respondents indicated they experienced significant effects on operations due to low water In an effort to meet their needs shippers sought other sources for product sought other waterway routes and used overland transportation routes at a cost to responding shippers of $56 million The effect of the drought on agricultural production combined with increased transportation costs resulted in temporary plant closures and lost sales that the responding shippers estimated at $79 million
Page30
6 CARRIER RESPONSE
61 Survey Procedures
The Carrier Survey targeted the major towing companies that used the waterways affected by low water in 2012 (the lower Ohio the lower Illinois the Middle Mississippi and the Lower Mississippi Rivers) Appendix B contains the Carrier survey form The purpose of this survey was to identify carrier responses to the 2012 low water event and the LD27 closure Like the shipper survey the formal carrier survey was conducted between 1 March and 30 May 2013 The purpose of the surveys was to determine what measures were taken specifically by the carriers to adapt to the emergency closure at LD27 and drought conditions and what these measures cost
The firms included in the carrier survey were the 10 largest users of the affected waterways (in tonnage) for the years 2006 through 2010 Responses were received from six companies representing 46 percent of carrier traffic on these waterways According to survey respondents low water presented the greatest challenge to users of the Lower Mississippi from Cairo Illinois to Baton Rouge Louisiana and the Middle Mississippi River between St Louis Missouri and Cairo Traffic on these two reaches totaled 2024 million tons in 2011 Survey respondents accounted for 58 of the tonnage in these two reaches
62 Summary of Carrier Canvas Responses
Once the initial set of shippers and carriers for canvassing was established contacts were identified for each company This information was taken from publicly available sources and in some instances through the assistance of industry associations such as the American Corn Growers Association the River Industry Action Council (RIAC) and the Waterways Council Incorporated (WCI) These organizations were also of assistance in encouraging firms to respond by emailing members late in the survey process to encourage participation
Responses were received from six carriers (60) representing 59 percent of total traffic on the affected waterways All but one of the carriers responding indicated that they were affected by both low water and the LD27 closure with the low water being the more serious challenge Moving cargo during this period required carriers to advance or delay shipments light load vessels (necessitating additional trips) reposition barges throughout the system to accommodate the need for additional barges restrict tow sizes (also necessitating more trips) and perform additional refleeting These altered carrier operations cost responding carriers an estimated $807 million Carriers also experienced $167 million in additional costs due to the LD27 closure and delays and tug costs of $02 million due to tow grounding
Page31
Page32
7 FEDERAL RESPONSE
Federal stewards of the inland waterways were aided by past experiences like the 1988 drought and the low-water event on the Lower Mississippi River in 1997 and advancements in the data provided by the National Oceanographic and Atmospheric Administrationrsquos (NOAA) as well as hydrologic tools used by the Corps to forecast water levels These advancements improved the ability of the Corps and the Tennessee Valley Authority in controlling available water in efforts to keep navigation open on the lower Ohio and on the Mississippi Rivers The US Coast Guard took the lead in creating communication avenues between all stakeholders in managing vessel operation and reaching consensus on channel and vessel operational maintenance during the event According to representatives of the Coast Guard no additional expenditures of funds accompanied their extraordinary efforts
On the Ohio River the Corps of Engineers essentially borrowed resources from other locations to be repaid at some future date No emergency funding was made available Channel surveys were conducted more frequently on known trouble spots sometimes twice weekly The Louisville District estimated that dredging costs were approximately $21 million higher than in a typical year (see TABLE 9) The funds were drawn away from other projects in effect with the promise of repayment in a future year to accomplish work that could not be done as a result of moving funds to the lower Ohio
Table 9 Costs Incurred by the Corps
($millions)
District Added Cost Vicksburg $ 729 StLouis
dredging blasting LD27 1
subtotal
$ $ $
1190 970 097
$ 2257 Louisville $ 207 TOTAL $ 3193
1 Costs to bring LD27 into immediate s ervic e Inc ludes cos t of spud barge temporary helperboat assists and gravel cleanup
Source US Army Corps of Engineers Vicksburg St Louis and Louisville Districts
On the Mississippi River emergency funds were made available by Congress in 2011 in response to the flooding that year and any possible future emergencies The rock pinnacles at Thebes and Grand Tower Illinois were blasted and debris removed at an estimated cost of $97 million At LD27 the spilled gravel from the damaged cell and the cell itself were removed and
Page33
temporary safe passage accommodated at an estimated cost of $10 million11 St Louis District dredging was concentrated on the Middle Mississippi as the Lower Illinois was not severely affected Dredging completed by the Vicksburg District on the main stem Mississippi cost $73 million more than average dredging costs over the last several years
11 The Corps estimates it will cost another $35 million to replace the damaged cell This was not includedin thefederal cost
Page34
8 FINDINGS
Traffic patterns were examined on the four high volume waterway segments affected by low water in 2012 With the exception of the Lower Mississippi from Cairo Illinois to Baton Rouge Louisiana each segment experienced lower traffic in 2012 than in 2011 Sharp declines in corn traffic related to a greatly diminished harvest explain most of the traffic decline though carriers continued to maintain volumes of all other commodities otherwise
When looking at monthly traffic levels reported in the LPMS data for the gateway locks to the Ohio Illinois and Upper Mississippi (LD53 Peoria LD and LD 27) typical cyclical patterns of shipment are apparent in 2012 but at lower levels Vessel operators ran significantly fewer tows in the summer and fall moved fewer barges at LD27 and Peoria but more barges at OH53 ndash this increase is explained by the increased movement of empty barges Tows pushed fewer loaded barges that were more lightly loaded (100 tons per barge less than average at LD27) The end result was lower traffic at each of these three projects
Unfortunately there is no data equivalent to LPMS available at the constriction points on the Mississippi River at Thebes Illinois and Grand Tower Illinois that will describe how vessel operators configured tows by number of barges per tow We do know that there were vessel draft restrictions that affected both loadings and the size of towboats as well as tow size restrictions We also know from surveys and discussions with vessel operators (discussed in previous sections) that fleeting operations were initiated above and below these points in order to optimize the use of a limited number of smaller towboats required through this reach while still utilizing the larger towboats that typically move through this area
The Corps surveyed 125 shippers and ten carriers The 73 shippers that responded represent 42 percent of all shipper traffic transiting the affected waterways Half of the respondents to the shipper survey indicated that they did not experience any significant effects on operations due to low water and an overwhelming percentage said they were unaffected by the LD27 closure Ten carriers were surveyed The six carriers responding represented 46 percent of all carrier traffic transiting the affected waterways All but one of the carriers responding indicated that they were affected by both low water and the LD27 closure with the low water being the more serious challenge The difference in shipper and carrier responses suggests that the shippers were somewhat insulated from these events by the strategic and tactical actions taken by the carriers that minimized impacts on the shippers
Despite lower corn production and a 51 decline in corn exports waterway traffic through the Middle Mississippirsquos rock pinnacles at Thebes Illinois constriction was largely unchanged between 2011 and 2012 (though it is important to remember that the worst low water conditions were experienced from December 2012 through February 2013) Moving cargo during this period required carriers to advance or delay shipments light load vessels (necessitating additional trips) reposition barges throughout the system to accommodate the need for additional barges restrict tow sizes (also necessitating more trips) and perform additional refleeting It cost responding carriers an estimated $807 million to alter operations in this fashion (see TABLE
Page35
10) The carriers also faced $167 million in additional costs as a result of the LD27 closures and delays and tug costs of $02 million due to tow groundings Despite these actions shippers did not escape the effects of the low water In an effort to meet their needs shippers sought other sources for product sought other waterway routes and used overland transportation routes at a cost to responding shippers of $559 million The effect of the drought on agricultural production combined with increased transportation costs resulted in temporary plant closures and lost sales that the responding shippers estimated at $790 million
Table 10 Survey Results - Low Water Cost Impacts
Cost Category Cost ($000) Transportation cost impacts
Carrier cost impacts Delays due to LD27 clos ure 16100 $ Other costs due to LD27 clos ure 573$ Groundings 164 $ Altered operations 80723 $
Shipper cost impacts 55860 $ SUBTOTAL 153419$
Production cost impacts 79000$ TOTAL 232419$
Page36
9 CONCLUSIONS
Several observations can be made from an examination of the traffic data obtained from LPMS and WCSC sources and responses generated from the surveys of the navigation industry The obvious message is that a system that is not operating at a level of reliability expected by users will have economic consequences Resulting increases in transportation costs andor delays to the transportation of commodities will have an effect on the marketplace Either the producer will pay more thus reducing expected profit associated with their products or the end user will experience higher commodity prices at the market once prices are adjusted
The low water the 5-day closure of LD27 in September 2012 and the subsequent 82 day closure of the main chamber between December 2012 and March 2013 imposed additional transportation costs of $1534 million just on the companies that responded to the Corpsrsquo surveys Drought andor low water accounted for another $790 million in production losses bringing the total reported impact to $2324 million Shipper survey respondents averaged $098 per ton in production losses and $080 per ton in increased transportation costs as they shifted to other modes and routes These values were applied to tonnage not accounted for through the sample or for which no response was given Carrier survey respondents provided a range of cost impacts $009 per ton for production loss $0005 per ton for non-delay related operations during the LD27 closure $0001 per ton related to grounding logistics and $069 in added transit costs Using these values a simple extrapolation of the sample to the population of movements using the most affected waterways (the Middle Mississippi and Lower Mississippi River) either not sampled or not responding suggests that additional transportation costs totaled $2770 million and production impacts amounted to $1652 million for a total impact of $4422 million12
Table 11 Low Water Cost Impacts from 2012 Event (Costs in $000)
Cost Category Survey
Responses
Estimate for Firms Not
Responding Not Surveyed TOTAL
Transportation cost impacts Carrier cost impacts
Delays due to LD27 closure 1 $ 16100 ‐$ $ 16100 Other costs due to LD27 closure $ 573 417 $ $ 990 Groundings $ 164 119 $ $ 283 Altered operations $ 80723 58719 $ $ 139442
Shipper cost impacts $ 55860 64277 $ $ 120137 SUBTOTAL $ 153419 123532 $ $ 276951
Production cost impacts 2 $ 79000 86248 $ $ 165248 TOTAL $ 232419 209780 $ $ 442199
1 I ncl udes del a y cos t experi enc ed due to LD27 ma i n cha mber cl os ure Dec 2012 ‐Ma r 2013 to remove dama ged cel l
2 I ncl udes ec onomi c impact of reduced corn producti on and hi gher tra ns porta ti on cos ts due to low‐wa ter
12 It is important to remember that not all waterways affected by the drought were covered by this survey
Page37
Using available transportation rate studies conducted for navigation improvement studies on the Upper Mississippi Illinois and Ohio River it is estimated that this tonnage moves at an average transportation rate savings of $2558 a ton Therefore at 2011 traffic levels total savings on these rivers would likely have been an estimated at $58 billion dollars The three most affected Corps of Engineers districts expended $319 million to keep the lower Ohio lower Illinois Middle Mississippi and Lower Mississippi river channels open to navigation in extreme drought conditions enabling shippers to continue navigation While industry faced losses of an estimated $2770 million due to increased transportation costs through the cooperative and coordinated efforts of the Corps the Coast Guard and industry partners shippers and the Nation were able to realize a savings in transportation costs of an estimated $55 billion despite this extreme low water event
Page38
APPENDIX A ndash SHIPPER QUESTIONNAIRE
PageA‐1
OMB Control 0710-0001 Expiration date 02282015
2012 DROUGHTLOCK 27 CLOSURE ndash SHIPPER SURVEY
Date
Firm
Address
Phone
FAX
Point of Contact
Title
General Description of Firm and Products Produced
NOTE ALL RESPONSES WILL BE TREATED AS CONFIDENTIAL
1 Was your company impacted by the closure event at Lock 27 in 2012 Yes No Was your company impacted by low water associated with the Drought Low water conditions in 2012 Yes No (If no interview is complete)
2 Does your company have a response plan for these types of impacts If so did it result in additional work organization to implement or was it detailed enough to cover all the impacts
1
PageA‐2
OMB Control 0710-0001 Expirat ion date 0228201 5
2012 DROUGHTLOCK 27 CLOSURE- SHIPPER SURVEY
LD27 closure
only Low
wate1middot Descriptio n of Response
a No change in procedmes b Stockpiled product and waited for traffic to clear if closme or changed loading depth in barges for low wat er c Switched to all-overland mode for product delivety from existing somces d Switched to different watervray routing for product delivety from existing somces e Switched product somce to an entirely new somce f Ceased operations dming the period g Altered production during the period h Switched production to another facility i Purchased intermediate or final product rather than produced j Other or combinations of the above (Please explain)
3 During th e 2012 event (either Low water or Lock 27 closure) what was your companys response Please indicate with an x in the appropriate box
4 Ifyou have checked c or d in question 3 please complete the following table
Movement Commodity Affected tonnage
Origin (City State)
Destination (City State)
Deliverd $ ton
plio1middot to drou2ht
Delivered $to n
during drou2ht
Examples
I Com 12000 Minneapolis New Orleans $30 $35
MN LA
2 Lube oils 4000 Houston TX Huntington wv $40 $50
2
PageA-3
OMB Contro l 0710-0001 Expiration date 02 282015
2012 DROUGHTLOCK 27 CLOSURE - SHIPPER SURVEY
5 Ifyou checked e in question 2 please complete the following table
Movement Commodity Affected tonnage
P reshydrou ght Origin
(City State)
Ch an ged Origin
(City State)
Destination (City State)
Deliver d $ton
pri01middot to drought
Delivered $ton
dming drought
Examples
1 Com 12000 Minneapolis MN
Cincinnati OH
New Orleans LA
$30 $35
2 Lube oils 4000 Houston TX Ashland KY
Pittsburgh PA $40 $50
6 Ifyou checked response a orb lmder question 3 how were your total production costs affected during the period of closure at Lock 27 or Drought-related low water (total increase in cost if applicable) Please explain
7 Ifyou checked response f under question 3 what was the total estimated loss to your fi1m as a result of ceasing production (during the closure period at Lock 27 or Drought)
3
Page A-4
OMB Control 0710-0001 Expiration date 02282015
2012 DROUGHTLOCK 27 CLOSURE ndash SHIPPER SURVEY
8 If you checked response ldquogrdquo under question 3 what was the total estimated loss to your firm as a result of altering production processes (during the closure period at Lock 27 or Drought)
9 If you checked response ldquohrdquo under question 3 what was the total increase in costs to your firm as a result of changing production locations (during the closure period at Lock 27 or Drought)
10 If you checked ldquoirdquo under question 3 to what extent did purchasing intermediate or final product increase your companyrsquos total costs (during the closure period at Lock 27 or Drought)
11 If you checked response ldquojrdquo under question 3 to what extent did the other measures or combination of measures undertaken as a result of the closure increase your companyrsquos total production costs (during the closure period at Lock 27 or Drought)
4
PageA‐5
OMB Control 0710-0001 Expiration date 02282015
2012 DROUGHTLOCK 27 CLOSURE ndash SHIPPER SURVEY
12 Have these events (drought-related low water or Lock 27 closure) caused your company to alter its long-term transportation strategy (eg switch to all-overland modes increase stockpiles etc) How will this impact your total commodity transportation or other costs (per year) Please explain
13 Has the (drought-related low water or Lock 27 closure) caused your company to take any other long-term permanent measures Please explain How will this affect your companyrsquos long-term operating costs (per year)
14 Has your company been impacted by other navigation system disruptions this shipping season (these would be other than the Low water from the drought or the Lock 27 closure)
5
PageA‐6
Event Date 2 Short-term response 3 Long-term responseExample
McAlpine closure
Jan ndash Feb 2006 Diverted to overland modes
none
OMB Control 0710-0001 Expiration date 02282015
2012 DROUGHTLOCK 27 CLOSURE ndash SHIPPER SURVEY
15 If your company has experienced significant navigation disruptions1 prior to this shipping season please complete the following table
1 Significant navigation system disruptions are defined as disruptions that result in delays to your shipment of more than 48 hours (include scheduled and unscheduled lock outages accidents and low and high water events)
2 Short term response refers to the response actions detailed in question 2 a No change in procedures b Stockpiled product and waited for traffic to clear or light loaded for low water c Switched to all-overland mode for product delivery from existing sources d Switched to different waterway routing for product delivery from existing sources e Switched product source to an entirely new source f Ceased operations during the period of closurelow water g Altered production during the period of closurelow water h Switched production to another facility i Purchased intermediate or final product rather than produced j Other or combinations of the above (Please explain)
3 Long term response refers to a modification of your long term business plan to include altering your long-term transportation strategy (eg switch to all-overland modes increase stockpiles etc) Other long term responses might include sourcing commodities at alternate sites or moving production activities to a different location
6
PageA‐7
PageA‐8
APPENDIX B ndash CARRIER QUESTIONNAIRE
[Typetext] PageB‐1
Waterway Carrier Interview Questions Effects of the 2012 Drought and LD27 Closure
Name of towing company -----------shyLocatio n -----------Name and title of Point of Co ntact ----------------shyPhone number ( )________ email _________
PART 1 LOW WATER DUE TO DROUGHT CONDITIO NS
1 Did your firm experience a reduction in tonnage carried on the Mississippi Ill ino is or Ohio waterways in 2012 Please verify data fo r 2010 and 2011 indicating your estimates for 2012 in table below
Operat o r Traffic Destined fo r Lower Mississippi Ports (2010 and 2011 from WCSC)
Origin 2010 2011 2012
Mississippi above St Louis Mississippi St Louis to Cairo Mississippi south of St Louis Ill inois River Ohio River
2 What facto rs led to changes in t raffic between 2011 and 2012 For example drought condit ions that affected agricultural production low water that affected your abi lit y to operate efficiently loss or gain of a contract(s) increased competit ion from rail or other factors - please specify and ind icate re lative weight of each
3 Have you had to change the way you operate your vessel fleet due to the drought If so what changes did you make and when did these occur
1
[Type text] Page B-2
4 The t wo ta bles below are intended to describe how your operat ions are affected by water depth a nd flows on the Cairo - St Louis reach of the Mississippi Rive r
a Do the operat ionalchanges suggested in t he tables below for the Cairo - St Louis reach (Upper Reach) describe the way you would operate given t he gage readings and flow shown for these two reaches in t he t ables If yes please indicate in the appropriate box in the table below with a Y if no please indicate what restrict ions you impose on your operations given t he gage and flow readings provided
Upper Rea ch- Navigation Restriction
St Louis Gage Reading
Flow (CFSOOO)
Navigation Restriction
Carriers Nav Restriction Followed
Above 20 Above 90 No restriction 00 to 20 74 to 90 25 barges -25 to 00 55 to 74 20 barges -35 to -25 485 to 55 16 barges -40 to -35 46 to 485 85 ft draft -45 to shy 4 0 44to47 80 ft draft Below -45 Below 44 Navigat ion halts
b What is t he number of tows- by size of tow horsepower and draft - that you operate through the St Louis to Cairo reach of the Mississippi For each foot of draft t hat is lost what is your added cost per t rip Please use the table below in making your response
Upper Reach- Tows moved thru the St Louis- Cairo reach in 2011 (or year not affect ed by low water)
Tow size Towboat Horseshypower
Barge Draft
Cost ton of loading below desired barge draft
Barges tow
No of tows 05 10 15 20 25 30 35 4 0
1 - 8 9 - 15
16 - 19 17 - 20 21- 25
gt25
2
[Type text] Page B-3
5 The t wo tables below are intended to describe how your operat ions are affect ed by water depth a nd flows on the Mississippi River sout h of Cairo
a Do the operat ional changes suggested in t he tables below for the Lower Reac h of the Mississippi River sout h of Cairo describe the way you would operate given the gage readings and flow shown for these two reaches in the tables If yes please indicate in t he appropriate box in t he table below with a Y if no please indicate what rest rictions you impose o n your operations given the gage and flow readings provided
Lower Reach- Navigation Restriction
Cairo Gage Reading
Flow (CFS in OOOs)
Navigation Restrictions
Carriers Nav Restriction Followed
Above 118 Above 189 No restriction 60 to 118 111 to 189 25 barges per tow
50 to 60 95 to 111 85 ft draft and 20 barges
35 TO 50 805 to 95 8 ft draft and 12 barges
Below 35 Below 805 Navigation halts
b What is t he number of tows- by size of tow horsepower and draft - that you operate on the Lower Reach of t he Mississippi south of Cairo For each foot of draft t hat is lost what is your added cost per trip Please use t he table below in making your response
Lower Reach- Tows moved through the reach south of St Louis in 2011 (or a yea r not affected by low water)
Tow size Towboat Barge Cost ton of loading below desired barge draft
Barges tow
No of tows
Horseshypower
Draft 05 10 15 20 25 30 35 4 0
1 - 12 13 - 16
17 - 20 21- 25 gt25
6 If you light load due t o low water would you proceed entire t rip as originally light loaded or top off
below Cairo or maybe add additional barges to w here the normal t ons per horsepowe r ratio is
achieved If latter how would this be done and at what cost
3
[Type text] Page B-4
7 Did any of your tows experience a grounding If yes how many total occurrences did you experience and what was the impact on your firm Please indicate your response below
total groundings
events with tows delayed more than 8 hours cost of delays
events involving lightering cargo cost of lightering
events involving towboat assists cost of towboat assists
8 What was major impact of low water due to the drought in terms of effect on your operations ‐
increased operating cost Lost business Equipment damage Safety concerns Groundings
Efficient dispatch of fleet Others
9 Please indicate the economic impact of low water levels on your company in the table below (please
include figures from your response to 5 above)
Indicate Cost with an ldquoXrdquo
if this applies to your firm
Description of impact Costton Tons
Affected Total cost
Increased transit time (including delays) Increased cost due to restricted tow sizes Increased costs due to light loading Idle vesselslost revenue Damaged equipment Increased managementlogistics costs Other (please specify)
4
[Typetext] PageB‐5
PART 2 CLOSURE OF LD27
10 If you have tows already at the lock do you generally wait until it reopens
11 What is typical amount of time you will wait at a lock for it to reopen before you decide to do
something else What do you do if you decide not to wait any longer What factors affect this
decision If you re‐dispatch the tow what does this cost
12 If you have tows underway in the system and a closure occurs at a lock to be transited do you
continue to the closure point wait elsewhere or re‐dispatch the tow What factors affect this decision
13 Please indicate the economic impact of the closure of LD27 on your company in the table below
Indicate Cost with an ldquoXrdquo
if this applies to your firm
Description of impact Costton Tons
Affected Total cost
Delay costs at the lock Delays in place (dock or port) Idle vesselslost revenue Increased managementlogistics costs costs (including re‐dispatching) Other (please specify)
PART 3 FINAL COMMENTS
14 Do you have any other information that would help us describe and quantify the economic impact on
waterway carriers associated with low water due to the drought of 2012 andor the closure of LD27
5
[Typetext] PageB‐6

___________________________________________________________
chambers that lasted five days resulting in delays that approached 100 hours per tow December 2012 saw low water continuing to hamper navigation with conditions worsening to a point that the US Coast Guard ordered draft restrictions to 9rsquo from 10rsquo and restricted maximum tow size to help reduce groundings Due to the possibility of even greater restrictions to include possible complete closure the Corps of Engineers mobilized additional dredges and began blasting to remove rock ledges that threatened navigation at the two most critical points on the Middle Mississippi - Thebes and Grand Tower Illinois - in January 2013 Rock removal was completed by the end of February 2013 and higher winter precipitation levels began to improve water levels and navigation conditions By March increased flows returned navigation to normal only to be hindered by high water and flooding in the spring of 2013
Navigation on the lower Ohio River was maintained throughout this period Corps of Engineers Operations personnel credit the cooperation of Federal agencies effective communication between Federal agencies and stakeholders improved forecasting tools and water control efforts and the diligence of the Corps and Coast Guard in keeping the channel open and channel buoys set
Both the drought and accompanying low water on the Mississippi River were widely reported by local and national media outlets throughout 2012 Agricultural and navigation interests were the focal point of the Nationrsquos concern as the Corp of Engineers and the US Coast Guard employed extraordinary measures to keep shipping lanes safe and open These measures while mitigating the adverse circumstances to some extent did not prevent waterway stakeholders from absorbing additional costs
The Corps of Engineers decided to formulate an estimate of these costs in order to better understand the importance of these major waterways to commercial users A major part of this effort was a survey of both waterway carriers and shippers dependent upon the high traffic volume waterways that experienced low water conditions (the affected waterways were the Mississippi River (the Mississippi River between St Louis Missouri and Cairo Illinois and between Cairo and Baton Rouge Louisiana) the lower Illinois River and the lower Ohio River) Surveys sent to carriers and shippers were designed to elicit economic impact information related to this protracted period of low water to include the river closure due to the accident at LD27
The Corps surveyed 125 shippers and ten carriers The 73 shippers that responded represent 42 percent of all shipper traffic transiting the affected waterways Half of the respondents to the shipper survey indicated that they did not experience any significant effects on operations due to low water and an overwhelming percentage said they were unaffected by the LD27 closure Ten carriers were surveyed The six carriers responding represented 46 percent of all carrier traffic transiting the affected waterways All but one of the carriers responding indicated that they were affected by both low water and the LD27 closure with the low water being the more serious challenge The difference in shipper and carrier responses suggests that the shippers were somewhat insulated from these events by the strategic and tactical actions taken by the carriers that minimized impacts on the shippers
A telling indicator of the waterway carriersrsquo determination to satisfy shipper needs is the fact that while waterway traffic through the lower Ohio Illinois Middle Mississippi and Lower Mississippi was somewhat diminished due to reduced corn traffic (a result of drought-reduced production) traffic through the rock pinnacles at Thebes Illinois and low
ES ‐ ii
___________________________________________________________
water at locations like Greenville Mississippi was largely unchanged between 2011 and 2012 Moving cargo during this period required carriers to advance or delay shipments light load vessels (necessitating additional trips) reposition barges throughout the system to accommodate the need for additional barges restrict tow sizes (also necessitating more trips) and perform additional refleeting It cost responding carriers an estimated $807 million to alter operations in this fashion The carriers also faced $167 million in additional costs as a result of the LD27 closures and delays and tug costs of $02 million due to tow groundings Despite these actions shippers did not escape the effects of the low water In an effort to meet their needs shippers sought other sources for product sought other waterway routes and used overland transportation routes at a cost to responding shippers of $559 million The effect of the drought on agricultural production combined with increased transportation costs resulted in temporary plant closures and lost sales that the responding shippers estimated at $790 million
Low Water Cost Impacts ‐ 2012 Event (Costs in $000)
Cost Category Survey
Responses
Estimate for Firms Not
Responding Not Surveyed TOTAL
Transportation cost impacts Carrier cost impacts
Delays due to LD27 closure 1 $ 16100 ‐$ $ 16100 Other costs due to LD27 closure $ 573 417 $ $ 990 Groundings $ 164 119 $ $ 283 Altered operations $ 80723 58719 $ $ 139442
Shipper cost impacts $ 55860 64277 $ $ 120137 SUBTOTAL $ 153419 123532 $ $ 276951
Production cost impacts 2 $ 79000 86248 $ $ 165248 TOTAL $ 232419 209780 $ $ 442199
1 I ncl udes del a y cos t experi enc ed due to LD27 ma i n cha mber cl os ure Dec 2012 ‐Ma r 2013 to remove dama ged cel l
2 I ncl udes ec onomi c impact of reduced corn producti on and hi gher tra ns porta ti on cos ts due to low‐wa ter
Low water the five-day closure of LD27 in September 2012 and the subsequent 82 day closure of the main chamber between December 2012 and March 2013 imposed additional transportation costs of $1534 million on the companies that responded to the Corpsrsquo surveys Drought andor low water accounted for another $790 million in production losses bringing the total reported impact to $2324 million A simple extrapolation of the sample to the population of movements using the most affected waterways (the Middle Mississippi and Lower Mississippi River) either not sampled or not responding suggests that additional transportation costs totaled $2770 million and production impacts amounted to $1652 million for a total impact of $4422 million2
The value of the inland waterway system is reflected in the extraordinary efforts of the Federal agencies and the waterway industry On average shippers using the affected waterways realize an average savings of $26 per ton over alternative transportation modes In 2011 the total tonnage moving through these reaches was 2273 million tons From this
2 It is important to remember that not all waterways affected by the drought were covered by thissurvey
ES ‐ iii
___________________________________________________________
it is estimated that shippers using this segment of the inland waterway system save a total of $58 billion over the best alternative mode andor route of transportation The Coast Guard devoted additional resources to the helping manage the low water event but did not incur measurable additional expenditures of funds The three most affected Corps of Engineers districts expended $319 million to keep the lower Ohio lower Illinois Middle Mississippi and Lower Mississippi river channels open to navigation in the face of a severe drought While industry faced losses of an estimated $2770 million due to increased transportation costs shippers and the Nation were still able to realize a savings in transportation costs of an estimated $55 billion despite this extreme low water event These savings would have been in even greater jeopardy without the cooperative and coordinated efforts of the Corps the Coast Guard and industry partners
ES ‐ iv
Contents 1 PURPOSE AND INTRODUCTION 1
2 BACKGROUND 3
21 Drought 3
22 Low Water 5
3 WATERWAY TRAFFIC 9
31 General 9
32 Traffic Patterns 9
321 Waterway Reaches and States 9
322 Commodities 11
323 Monthly Shipping Patterns 13
33 Middle Mississippi - Traffic Past Thebes Illinois 15
34 Lower Mississippi - Traffic at Greenville Mississippi 16
35 Fleet Utilization 18
36 Summary and Conclusions 22
4 LD27 CLOSURE ANALYSIS 23
41 General 23
42 January and September 2012 Outages 23
421 Tow Arrivals 23
422 Tow Processing Time 24
423 Tow Delays 24
424 Cost Impact 25
43 December 2012 through March 2013 Main Chamber Closure 26
431 Tow Arrivals 26
432 Tow Processing Time 26
433 Tow Delays 27
444 Cost Impact 27
5 SHIPPER RESPONSE 29
51 Survey Procedures 29
52 Summary of Shipper Responses 30 ___________________________________________________________
___________________________________________________________
6 CARRIER RESPONSE 31
61 Survey Procedures 31
62 Summary of Carrier Canvas Responses 31
7 FEDERAL RESPONSE 33
8 FINDINGS 35
9 CONCLUSIONS 37
APPENDIX A ndash SHIPPER QUESTIONNAIRE 1
APPENDIX B ndash CARRIER QUESTIONNAIRE 1
___________________________________________________________
LIST OFTABLES
Table 1 US Corn and Soybean Production and Exports 4 Table 2 US Corn and Soybean Production 2010 ndash 2012 9 Table 3 Shipments and Receipts by State 10 Table 4 Traffic by Reach 10 Table 5 Traffic by Major Commodity 2007 - 2011 12 Table 6 Waterway Traffic Past Thebes Illinois 16 Table 7 Loaded Barges Past Greenville Mississippi ndash 2011 and 2012 17 Table 8 Barges Tows and Barges per Tow Selected Locks 19 Table 9 Costs Incurred by the Corps 33 Table 10 Survey Results - Low Water Cost Impacts 36 Table 11 Low Water Cost Impacts from 2012 Event 37
LIST OFFIGURES
Figure 1 The Mississippi River Basin 3 Figure 2 Extent and Depth of 2012 Drought 5 Figure 3 Water Levels in Memphis ndash 2011 and 2012 6 Figure 4 Mississippi River Stages at Vicksburg Mississippi 6 Figure 5 Groundings through 28 November 2012 as reported by the US Coast Guard 7 Figure 6 Removal of stone at rock pinnacle 8 Figure 7 Commodity Shares by Reach 11 Figure 8 Monthly Traffic at Selected Locks 2007 2011 and 2012 14 Figure 9 Powerhouse at Ohio River LD53 Spring 2011 15 Figure 10 Tows delayed Due to Low-water at Greenville Mississippi August 20 2012 17 Figure 11 Tow Counts at Selected Locks 2011 and 2012 18 Figure 12 Average Barge Loadings at Selected Locks 2011 amp 2012 20 Figure 13 Average Barge Loadings at Selected Locks 2007 - 2012 21 Figure 14 LD27 Tow Arrivals 2012 24 Figure 15 LD27 Average Hourly Delays 2012 25 Figure 16 LD27 Tow Arrivals December 2012 ndash March 2013 26 Figure 17 LD27 Minimum Maximum and Average Tow Delays December 2012 ndash March 2013 27
___________________________________________________________
1 PURPOSE AND INTRODUCTION
Lower than normal precipitation in the Mississippi River Basin recorded in the winter and spring of 2012 was an early indicator of what evolved into drought conditions throughout much of the basin Field crops in Midwestern states experienced extreme conditions of stress Reservoirs provided maximum supplies under approved operating procedures to augment flow for water quality and supplies and for inland navigation on the Mississippi River in particular Both the drought and accompanying low water on the Mississippi River were widely reported by local and national media outlets throughout 2012 Agricultural and navigation interests were the focal point of the Nationrsquos concern as the Corp of Engineers and the US Coast Guard employed extraordinary measures to keep shipping lanes safe and open These measures while mitigating the adverse circumstances to some extent did not prevent waterway stakeholders from absorbing additional costs
The Corps of Engineers decided to formulate an estimate of these costs in order to better understand the importance of these major waterways to commercial users A major part of this effort was a survey of both waterway carriers and shippers dependent upon the high traffic volume waterways that experienced low water conditions (the affected waterways were the Mississippi River (the Mississippi River between St Louis Missouri and Cairo Illinois and between Cairo and Baton Rouge Louisiana) the lower Illinois River and the lower Ohio River) Surveys sent to carriers and shippers were designed to elicit economic impact information related to this protracted period of low water to include the river closure due to the accident at LD27
This report focuses on the impact of the low flows on major commercial cargo arteries in the Mississippi River Basin ndash specifically the Mississippi Ohio and Illinois Rivers ndash and estimates economic impacts from drought-related low flows and associated unexpected closure of Locks and Dam 27 Costs incurred by the Federal government specifically the Corps of Engineers are reported to the extent they are available
This study relied upon readily available data from public Corps of Engineers and US Coast Guard sources to describe river conditions events that occurred as a result of low water conditions and efforts to manage vessel traffic A targeted survey of inland waterway carriers and shippers was used to estimate the economic effects of interruptions and disruptions to navigation that occurred as a result of the drought and associated low water conditions
Page1
Page2
Figure 1 The Mississippi River Basin
2 BACKGROUND
21 Drought
The drought of 2012 affected much of the Mississippi River Basin whose major streams are corridors of inland waterway commerce in the Midwest and Plains states (see FIGURE 1) Four waterway reaches that experienced low water conditions and carry bulk commodities in excess of 25 million tons annually were identified for closer examination in this study 1) the Ohio River between Smithland LD and the mouth of the Ohio River 2) the Illinois River between Peoria LD and the mouth of the Illinois 3) the Mississippi River between the confluence of the Ohio River and Baton Rouge Louisiana and 4) the Mississippi River between St Louis Missouri and the confluence of the Ohio In 2011 shippers in 20 states moved commodity through the four reaches with ten different states (Arkansas Illinois Indiana Kentucky Louisiana Missouri Mississippi Ohio Tennessee and West Virginia) in the top five in shipping or receiving commodities in one or more of these reaches
The US Department of Agriculture estimated that nearly 80 percent of agricultural land was affected by drought in 2012 with 70 ndash 75 percent of the corn and soybean production affected by severe or greater drought By September 2012 over 2000 counties were
Page3
designated disaster areas by USDA3 In the Midwest the drought destroyed or damaged corn and soybean crops in particular ndash both the region and producers of these commodities being served by the inland waterway system Corn production declined by 13 percent between the 2011 and 2012 marketing year soybeans by 3 percent and corn exports fell by 51 percent (see TABLE 1)
Table 1 US Corn and Soybean Production and Exports (in millions of bushels)
Ma rke t Ye a r 1 Production
Cha nge from
pre vious ye a r Ex ports
Cha nge from pre vious
year
200708 1303788 -- 243740 --200809 1209165 -7 184895 -24 200910 1309186 8 198002 7 201011 1244687 -5 183417 -7 201112 1235961 -1 154260 -16 201213 1078030 -13 75000 -51
Sourc e USDA Economic Research Service Feed Outlook 1 market year is from September to August
US Soybe a n Production a nd Ex ports 2007 to 201213
(in millions of bushels)
Market Year 1 Production
Cha nge from
previous year Ex ports
Change from
pre vious year
200708 267712 -- 115883 --
200809 296701 11 127929 10
200910 335901 13 149905 17
201011 332918 -1 150094 0
201112 309352 -7 136185 -9
201213 301500 -3 134500 -1
Source USDA Ec onomic Res earch Servic e US Oilcrops Yearb ook
1 market y ear is from September to August
Drought in western Texas spread throughout most of the Great Plains and into the lower Ohio Valley through the spring of 2012 (see FIGURE 2) and winter months of 2013 Extreme and Exceptional drought was persistent in the Great Plains states of South Dakota Nebraska Kansas Oklahoma and northern Texas ndash all major agricultural producing areas Extreme drought reached into the Midwest states in particular southern Minnesota Iowa Illinois Indiana and Missouri ndash all major producers of corn and soybeans4 The wheat crop
3 See the USDA Economic Research Service ldquoUS Drought 2012 Farm and Food Impactsrdquo athttpwwwersusdagovtopicsin‐the‐newsus‐drought‐2012‐farm‐and‐food‐impactsaspx4 Extremedroughts arecharacterized bycrop losses and widespread water shortages or restrictionsExceptionaldroughts are characterized by widespreadcroplosses shortages of waterinreservoirsstreamsand wellscreatingwateremergenciesSeehttpdroughtmonitorunleduclassifyhtm
Page4
was largely spared as it was harvested in late spring prior to the drought taking hold in these states
Figure 2 Extent and Depth of 2012 Drought
22 Low Water
In addition to agriculture the 2012 drought affected water supplies for industrial and municipal uses recreation and the ability to navigate on the Mississippi River and its navigable tributaries Small harbors and terminals saw rivers fall to levels not experienced in nearly 50 years (see FIGURE 3)
Page5
Figure 3 Water Levels in Memphis ndash 2011 and 2012
Figure 4 Mississippi River Stages at Vicksburg Mississippi
Low water conditions rivaled those observed during the 1988 drought event By November 2012 water levels on the Mississippi River fell below those experienced in 1988 (see FIGURE 4) Beginning in May 2012 the Mississippi River stage reached the lowest level observed in the past 112 years Heavy rain and flooding in the Mississippi River Basin ended the low water problems in March 2013
Page6
Figure 5 Groundings through 28 November 2012 as reported by the US Coast Guard
Low water on these major waterway transportation arteries hampered navigation Tows accustomed to wide and deep navigable channels began to suffer from groundings along the length of the Mississippi River (see FIGURE 5) At Mississippi River LD27 water levels fell below the armor-protected area of sheet pile guide cells What would ordinarily be routine impacts on the guide cell as tows aligned to enter the locks led to failure of the cell as impacts occurred on unprotected regions of the sheet pile protectionguide cell Failure of the cell and subsequent clean-up of gravel spilled from the ruptured cell resulted in closure of the Mississippi River at the location of LD27 for approximately five days from 14 September 2012 until 20 September 2012
Groundings of tows occurred along nearly the entire length of the Mississippi River and were especially problematic along the border of northern Illinois between Thebes and Grand Tower Illinois and in the general vicinity of Greenville Mississippi According to the US Coast Guard 18 groundings on the Lower Mississippi led to closure events with more than 25 tows in queues River closures became necessary when tows stuck in shallow water had to be removed when tows broke apart and barges had to be retrieved and reassembled or when it was determined that the channel needed to be surveyed dredged and channel buoys reset
Page7
Figure 6 Removal of stone at rock pinnacle
Water levels on the Mississippi River at Thebes Illinois and at Grand Tower Illinois exposed rock ledges that reduced navigable drafts to 9 feet (well below customary drafts of 10 and 11 feet) and restricted the channel to one-way traffic5 The Corps removed these hazards in early 2013 (see FIGURE 6)
5 According to the US Army Corps of Engineers St Louis District River Projects Manager there was one‐way traffic at the pinnacles with 12 hour closures each day during the removal from 1Jan 2013 to roughly 15 February 2013 There were also other reaches of the river where there wasinsufficientchannelwidthof therequireddepthto permit two‐way traffic
Page8
3 WATERWAY TRAFFIC
31 General
Waterway traffic examined in this section focuses on the Lower Mississippi River and lower reaches of the Upper Mississippi Illinois and Ohio Rivers While the drought also seriously affected waterways in the southwest and the Missouri River traffic flows on these other rivers is relatively small in comparison with the Mississippi Illinois and Ohio Rivers Comparable data through December 2012 was available from the US Army Corps of Engineers Waterborne Commerce Statistics (WCS) and Lock Performance Monitoring System (LPMS) data sets for convenience of comparison only data through December 2012 is examined in this section of the report
32 Traffic Patterns
With the exception of Minnesota major grain and oilseed producing states saw sharp percentage declines in production that exceeded what was a national decline (See TABLE 2) All of these major producing states are touched by navigable waterways The expectation is that this diminished production of corn and soybeans should be reflected in decreased waterway traffic in these commodities
Table 2 US Corn and Soybean Production 2010 ndash 2012
IL IN IA MN MO NE OH US Corn (000s bushels)
201000 1946800 89804000 2153250 1292100 369000 1469100 533010 12446865 201100 1946800 839500 2356400 1201200 349980 1536000 508760 12359612 201200 1286250 596920 1876900 1374450 247500 1292200 448950 10780296
change 2011 ‐ 12 ‐339 ‐289 ‐203 144 ‐293 ‐159 ‐118 ‐128 Soybeans (000s bushels)
201000 466075 258505 496230 328950 210405 267750 220320 3329181 201100 423225 240695 475345 274560 190165 261360 217920 3093524 201200 383560 223590 413850 300570 155170 207085 206100 3014998
change 2011 ‐ 12 ‐94 ‐71 ‐129 95 ‐184 ‐208 ‐54 ‐25 Source Crop Production 2012 Summary USDA National Agricultural Statis tics Service January 2013
321 Waterway Reaches and States
Four waterway reaches that experienced low water conditions and carry bulk commodities in excess of 25 million tons annually were identified for closer examination in this study 1) the Ohio River between Smithland LD and the mouth of the Ohio River 2) the Illinois River between Peoria LD and the mouth of the Illinois River 3) the Mississippi River between the confluence of the Ohio River and Baton Rouge Louisiana and 4) the Mississippi River between St Louis Missouri and the confluence of the Ohio In 2011 shippers in 20 states moved commodity through the four reaches with ten different states (Arkansas Illinois Indiana Kentucky Louisiana Missouri Mississippi Ohio Tennessee and West Virginia) in the top five in shipping or receiving commodities in one or more of these reaches (see TABLE 3)
Page9
Table 3 Shipments and Receipts by State
State
Ohio River ‐ Smithland LD to Cairo IL
Illinois River ‐ Peoria LD to the Mouth
Mississippi R ‐ Cairo IL to Baton Rouge LA
Mississippi River ‐ StLouis to Cairo IL
ship receive ship receive ship receive ship receive AL 1435 4 049 214 489 1340 2351 337 1840 AR 470 972 139 157 6634 6628 235 1336 FL ‐ 41 ‐ 6 30 151 2 64 IA 292 308 23 5 5088 1532 5380 2397 IL 27819 4 477 19 170 11 428 45735 10171 49496 14764 IN 5738 14523 686 863 4994 2713 595 3794 KY 26306 10540 214 438 20 197 6 953 902 1 465 LA 16743 37420 6782 13629 44 026 114 919 14 816 58 194 MN 173 122 14 149 4 860 2 384 5 048 3 021 MO 1992 683 938 152 21 414 3 750 25 302 5 681 MS 697 1383 175 104 4 473 4 508 264 1 005 NE ‐ ‐ ‐ ‐ 8 13 8 13 NY ‐ ‐ ‐ ‐ 2 ‐ ‐ ‐
OH 2940 9188 126 112 2011 4956 710 1939 OK 192 260 138 88 2795 2391 189 240 OT ‐ ‐ ‐ ‐ ‐ 10 ‐ 10 PA 1143 2266 12 54 860 1848 240 101 TN 2494 9005 82 719 5770 9870 257 6200 TX 2930 954 874 1257 5034 5046 1 017 2 996 WI 29 2 ‐ 4 633 243 664 975 WV 7984 3184 146 79 6650 2117 1115 542
Sour c e US Army Corps of Engi neer s Wa terbor ne Commer ce Sta ti s ti cs Center
Note OT (Other) designates moves to unidentified states
Between 2011 and 2012 the Illinois reach experienced the greatest percentage decline in traffic (47 percent) and the Mississippi River between St Louis and Cairo Illinois experienced the greatest tonnage decline at just over 32 million tons (see TABLE 4) The Mississippi River below Cairo Illinois actually showed an increase in traffic between 2011 and 2012
Table 4 Traffic by Reach (ktons)
Waterway Reach 2007 2008 2009 2010 2011 2012 1
Change 2011 to 2012
ktons Change
Ohio River ‐ Smi thland LD to Cairo IL 108746 113329 94639 101756 99378 98328 (1049) ‐11 Illinois River ‐ Peoria LD to the Mouth 32868 30212 29569 29267 29735 28324 (1411) ‐47 Missis s ippi River ‐ Cairo IL to Baton Rouge LA 185872 176329 166557 176879 182551 184779 2228 12 Missis s ippi River ‐ StL oui s to Cairo IL 109763 98572 104275 102896 106579 103359 (3219) ‐30 Sour ce US Ar my Corps of Engi n eer s Wa ter bor ne Co mmer c e Sta ti s ti c s Center
1 preliminary 2012
Many of the movements represented in the table above transit more than one of the waterway reaches being considered therefore total tonnage cannot be calculated simply by summing the traffic reported for individual reaches This value was drawn from the 2011 Waterborne Commerce Statistics which indicate that in 2011 the total tonnage moving through these reaches was 2273 million tons Using available transportation rate studies conducted for navigation improvement studies on the Upper Mississippi Illinois and Ohio River it is estimated that this
Page10
Ohi o River - Smith land t o Mouth 2011 coal Il linois River Peoria LD to Mouth 2011 aggregates
2
sulfur clay amp salt 4
o ilseeds 4 co rn
25
corn 6
cr ud e petrol aggregates 0
15
Mississippi River - St Louis to Cairo 2011 coal
coal 19
all other
cru de petrol 2
aggregates 9
sul fu r clay amp saft
3
12 15
salt 4
Mississippi River - Cairoto Baton Rouge 2011
8
Figure 7 Commodity Shmmiddotes by Reach
tollllage moves at an average umiddotansportation rate savings of $25 58 a ton It is therefore estimated that shippers using this segment of the inland wate1way system save a total of $58 billion over the best altemative mode andor route ofumiddotansportation
322 Commodities
Coal is the predominant commodity moving through the Ohio reach (see FIGURE 7) Com is the single m ost dominant commodity moving through the Illinois River reach though products in the all other group represent the maj ority of this Illinois River reach s tollllage Peumiddotoleum products at 45 million tons chemicals and fe1tilizers at 52 million tons and iron and steel products at 22 million tons are the primmy commodities in this group On both reaches of the Mississippi River coal is the lmmiddotgest single commodity by tons closely followed by com Agricultural products (all grains oilseeds vegetable products and feeds) amounted to 61 8 million tons or 34 percent of Cairo to Baton Rouge tollllage and 369 million tons or 35 of St Louis to Cairo tons
Traffic figmes by reach and by commodity shown in TABLE 5 begin to display the impact of both lower agricultmal production and low water levels on wate1way umiddotaffic The Ohio River wate1way reach showed only a slight decline (1 percent) but commodities with mmmiddotkets or som ces on the lower Mississippi and Gulf Coast showed declines in umiddotaffic between 2011 and 2012 typified by the sulfur clay and salt group 6 Salt com and stone all showed significant
6 According to LPMS data coal traffic at LD53 declined from 142 million tons to 12 9 million tons (a 136 percent decline) the latter half of2012 compared with the same period of2011 This fo llowed an 09 million ton increase (72 percent) for the first six months of2012 compared w ith the same period in 2011
Page 11
declines While corn shipment declines could be tied to decreased production lower stone and salt shipments were likely the result of low water conditions that affected the cost of shipment or an ability to delay shipment Oilseeds traffic grew by 25 percent reflecting a late season improvement in soybean harvest
Table 5 Traffic by Major Commodity 2007 - 2011 (ktons)
Waterway Reach 2007 2008 2009 2010 2011 2012 1 Change 2011 to 2012 ktons Change
Ohio River ‐ Smithland LD to Cairo IL 108746 113329 94639 101756 99378 98328 (1049) ‐11
coal 37737 46943 37792 38433 40526 41949 1423 35 crude petroleum 106 53 44 46 145 590 445 3072 aggregates 18394 17445 15703 17303 15437 13569 (1868) ‐121 sulfur clay amp salt 2468 3352 3387 3717 3552 2427 (1125) ‐317 corn 7320 6961 6616 7013 5518 4632 (886) ‐161 oilseeds 4058 3969 5004 5176 4189 5221 1033 247 all other 38664 34607 26093 30067 30012 29941 (70) ‐02
Illinois River ‐ Peoria LD to the Mouth 32868 30212 29569 29267 29735 28324 (1411) ‐47
coal 1597 1548 777 919 1727 1150 (576) ‐334 crude petroleum 15 1 21 6 30 583 554 18635 aggregates 874 499 495 232 564 743 178 316 sulfur clay amp s alt 1169 2090 2282 881 1125 882 (243) ‐216 corn 9839 8017 9643 9137 7549 4934 (2615) ‐346 oilseeds 1940 1650 2637 2769 2503 3808 1305 521 all other 17434 16407 13715 15323 16237 16224 (13) ‐01
Mississippi River ‐ Cairo IL to Baton Rouge LA 185872 176329 166557 176879 182551 184779 2228 12
coal 22208 26629 23326 23648 34122 37163 3041 89 crude petroleum 1383 1848 1852 1901 3984 5764 1780 447 aggregates 17923 18009 17741 18474 16035 14575 (1460) ‐91 sulfur clay amp s alt 5304 7863 7962 6322 6648 4639 (2010) ‐302 corn 35465 28293 30872 31835 28065 20842 (7223) ‐257 oilseeds 17966 17648 23807 25216 21324 28369 7045 330 all other 85622 76039 60998 69483 72373 73427 1055 15
Mississippi River ‐ StLouis to Cairo IL 109763 98572 104275 102896 106579 103359 (3219) ‐30
coal 26428 26228 27127 22262 25589 22290 (3299) ‐129 crude petroleum 375 725 677 891 3229 4847 1617 501 aggregates 9735 8691 8425 8335 7947 8799 852 107 sulfur clay amp s alt 2726 4389 4475 2481 3136 2160 (976) ‐311 corn 26951 19755 23504 23824 20760 14273 (6487) ‐312 oilseeds 9687 8642 12531 12471 10682 15354 4672 437 all other 33861 30142 27536 32632 35236 35638 402 11
Source US Army Corps of Engi neers Waterborne Commerce Stati s ti cs Center
1 Prel imi nary 2012
The Illinois River reach showed the greatest percentage decline between 2011 and 2012 (5 percent) with declines in corn (35 percent) coal (33 percent) and salt (22 percent) showing the largest decreases Coal declines were influenced by the closure of a coal-fired electric utility
Page12
plant in late 20117 Like the Ohio commodities moving to and from the lower Mississippi were most affected The Mississippi River between Cairo and Baton Rouge had sizable declines in salt (30 percent) and corn (26 percent) while oilseed traffic grew (33 percent) The Mississippi River between St Louis and Cairo declined the most in tonnage (32 million tons) with salt and corn both declining by 31 percent Oilseeds increased by 44 percent and stone by 10 percent Given the 51 percent decrease in US corn exports (refer to TABLE 1) it is not surprising that corn traffic to the Gulf would decline when approximately half of all US corn exports move by barge to the lower Mississippi and Gulf Coast The ldquoall otherrdquo commodity group was the least affected by the drought All four river reaches experienced sharp percentage increases in crude oil movements though the tonnages were relatively small in each reach These increases likely reflected the first significant movement of shale gas liquids on the inland waterway system
323 Monthly Shipping Patterns
The Corpsrsquo Lock Performance Monitoring System (LPMS) data has reliable information on tow transits commodity tonnages and barge counts by month at all Corps lock and dam projects Three locksndash Ohio River LD53 Mississippi River LD27 and Peoria LD ndash were selected for closer examination of shipping patterns (discussed in this section) and fleet utilization (discussed in the next section) Ohio River LD53 is the closest Ohio River lock to the mouth of the Ohio River so it offers a fair representation of traffic on the lower reach of the Ohio Similarly Peoria LD is closest to the mouth of the Illinois River and Mississippi River LD27 is the furthest downstream lock on the Mississippi Each offers fair representations of the Peoria to the mouth of the Illinois and St Louis to Cairo reaches of these two rivers respectively
As seen in FIGURE 8 monthly traffic at Ohio River LD53 ranged between 50 million and 70 million tons per month in the years selected for analysis (2007 2011 and 2012)
7 AmerenEnergy closedtheMeredosiaplant inlate 2011Seewwwfuturegenallianceorgcommunity‐cogen201303 accessed26July2013
Page13
8000000
7000000
6000000
5000000
~ 4000000 3000000
2000000
1000000
-
Ohio River LDS3 Traffic by Month
--- ~ -~ V- -
-
-
-
2007
2011
2012
9000000 8000000 7000000 6000000
~ 5000000 ~ 4000000
3000000 2000000 1000000
Mississippi River LD27 Traffic by Month
-
-
-
2007
2011
2012
3000000
2500000
2000000 Ill 1 1500000 01shy
1000000
500000
Peoria LD Traffic by Month
-
-
-
2007
2011
2012
Figure 8 Monthly Traffic at Selected Locks 2007 2011 and 2012
Page 14
Figure 9 Powerhouse at Ohio River LD53 Spring 2011
The range of variation would likely have been tighter except for the high water event in the spring of 2011 (see FIGURE 9) which caused a sharp drop in traffic in May of that year Traffic at Mississippi River LD27 and Peoria LD follows a more cyclical pattern than that shown on the Ohio River July and November are typically peak months at LD27 and July and NovemberDecember at Peoria LD Monthly volumes in 2012 mirrored those of 2011 at both locks though at lower levels particularly in the summer and fall when the drought was most intense
33 Middle Mississippi ‐Traffic Past Thebes Illinois Navigating the Middle Mississippi River between St Louis and Cairo Illinois especially in the vicinity of Thebes Illinois and Grand Tower Illinois was a serious challenge for vessel operators 8 These two stretches experienced low water that exposed rock ledges called pinnacles which exposed vessels to grounding and damage Traffic was restricted to one way for periods in the fall of 2012 and the US Coast Guard imposed tow size and draft restrictions Large towboats that customarily move through these reaches could not navigate the restricted draft around Thebes and Grand Tower Illinois necessitating the shuttling of barges through this reach and refleeting above and below the constrictions
Waterway carriers were apparently determined to satisfy shipper needs as traffic through the restricted reaches at Thebes Illinois was largely unchanged between 2011 and 2012 ( see TABLE 6) Declines in corn traffic related to lower corn production were replaced with higher downbound moves of soybean aggregates and crude petroleum
8 See httpwwwstltodaycomnewslocalmetrolow‐water‐on‐mississippi‐river‐causes‐barge‐companies‐to‐lightenarticle 2b1505f1‐ab93‐5e73‐9a36‐d43ff5c8c0b6html
Page15
Table 6 Waterway Traffic Past Thebes Illinois
2011 2012 LPMS Name Up Down Total Up Down Total
CoalLignite amp Coal Coke 2274342 20849891 23124233 2092647 18825680 20918327 Crude Petroleum 22853 3206496 3229349 29239 4780424 4809663 DistillateResidual amp Other Fuel Oils Lube Oil amp Greases 730648 2305378 3036026 614765 2113449 2728214 Petroleum Pitches Coke Asphal t Naptha and Sol vents 335480 2427538 2763018 342221 3161000 3503221 Ferti l izers 6004043 249240 6253283 5905454 229606 6135060 Other Chemicals and Related Products 2 800 138 2 417 289 5 217 427 2 760 812 2 127 573 4 888 385 Sand Gravel Stone Rock Li mes tone Soil Dredged Material 729938 5715696 6445634 807605 7380288 8187893 Iron Ore and Iron amp Steel Waste amp Scrap 331 790 1 042 578 1 374 368 252 297 918 336 1 170 633 Sulphur (Dry) Clay amp Salt 3020775 114884 3135659 2091825 100469 2192294 Slag 226099 150649 376748 362250 113363 475613 Building Cement amp Concrete Li me Glass 69839 3343391 3413230 76587 3914565 3991152 Primary Iron and Steel Products (IngotsBarsRodsetc) 2077909 414447 2492356 2498038 456312 2954350 Wheat 3366 1640911 1644277 5418 1406811 1412229 Corn 8956 20548560 20557516 327740 13783421 14111161 Oil seeds (Soybean Fl axs eed and Others) 68755 10534468 10603223 91354 15187093 15278447 Animal Feed Grain Mi l l Products Flour Processed Grains 52619 2972138 3024757 79030 2537614 2616644 All Others 1817209 953399 2770608 1833834 976248 2810082 TOTAL 20574759 78886953 99461712 20171116 78012252 98183368 Source Waterborne Commerce Statistics
Note Orange shaded cells denote commodities where declines greater than 1000000 tons were experienced between 2011 and 2012 while green shaded cells denote growth of greater than 1000000 tons between 2011 and 2012
34 Lower Mississippi ‐Traffic at Greenville Mississippi
With flows falling throughout the summer on the heavily used Lower Mississippi River tow groundings began to occur - the first being reported on 11 May 2012 Groundings led the US Coast Guard to restrict drafts and tow sizes on the Lower Mississippi where some reaches required dredging in order for vessels to safely navigate 9 One of the more widely reported events occurred on an 11-mile stretch of the river near Greenville Mississippi where intermittent river closures occurred to accommodate the freeing of grounded tows surveying of channel and dredging to open channel It was reported that on August 20 2012 that nearly 100 tows had been delayed near Greenville waiting for the channel to reopen10 Similar events occurred along the Lower Mississippi in locations including Memphis Tennessee Helena Arkansas and Natchez Mississippi
According to the US Coast Guard 18 groundings led to closure events with more than 25 tows in queues In total these events caused 1130 tows and 17640 barges to be delayed Closures of the river occurred when tows needed to be pulled from bars or banks reassembled after breaking-up upon running aground or when channel work was required Industry worked together to free and re-assemble tows Where groundings became frequent in specific areas the US Coast Guard the US Army Corps of Engineers and industry jointly determined when a river closure was necessary to allow the Corps to survey and dredge the channel and the Coast Guard to reset buoys that mark the channel By June draft restrictions were set at 10rsquo6rdquo northbound tow sizes to 42 barges per tow and southbound tows to 36 barges per tow In early July drafts were down to 9rsquo6rdquo and tow sizes further reduced in late July drafts were restricted to 9rsquo northbound tow sizes to 20 loaded barges per tow and southbound tow sizes to 30 barges per
9 httpcornandsoybeandigestcomissuesforced‐barge‐light‐loading‐low‐mississippi‐river accessed 31July201310 httpearthobservatorynasagovIOTDviewphpid=78927 accessedon31July2013
Page16
Figure 10 Tows delayed due to low-water at Greenville Mississippi August 20 2012 Source NASA See footnote number 7
tow By mid-August one way traffic was instituted in problem reaches drafts were limited to 9rsquo and tow sizes limited further Draft and tow size restrictions were gradually relaxed but it was not until 14 December 2012 that all restrictions were lifted
Like the Thebes Illinois constriction point the Greenville Mississippi constriction did not affect traffic levels in fact traffic increased by 2 million tons between 2011 and 2012 (see TABLE 7) The effects of the low water can be seen in the tons per loaded barge which declined by 46 tons on average for the entire year As with the constriction at Thebes waterway carriers were apparently determined to satisfy shipper needs though this came at higher transportation costs Corn harvests along the Lower Mississippi were less affected by the drought than in the traditional Corn Belt regions served by the Upper Mississippi Ohio and Illinois Rivers which coupled with stronger soybean traffic led to increased traffic through this reach as opposed to more steady traffic through Thebes
Table 7 Loaded Barges Past Greenville Mississippi ndash 2011 and 2012
2011 2012 Difference 2011 ‐ 2012
Loaded Barges 92108 95760 3652 Tons 163314542 165384334 2069792 Tons per Loaded Barge 17731 17271 (46)
Source US Army Corps of Engineers Waterborne Commerce Statistics Center
Page17
700
600
500
400
300
200
100
f- f-
f-f-r-
Ohio River LD53
Tow Counts 2011 amp 2012
r- f-I-- fshy f- f-
r- r- r- r-f- f- f- f-r- r- r- r-
f-f-
f-f-rshy
800
700
600
500
400
300
200
100
r-r-fshy1shy-shy
Mississippi River LD27 Tow Counts 2011 amp 2012
-shyt- t-r- r-r- r-f- fshy1shy 1shy-shy -shy
shyr-r-fshy1shy-shy
t-rshy1shy
fshy1shy-shy
-
400
350
300
250
200
150
100
so
1shy
f-f-tshy-shy
Peoria LD Tow Counts 2011 amp 2012
1shy 1shy r-shyf- f- f-f- f- f-t- t- tshy-shy -shy -shy
1shy
f-f-tshy-shy
Figure 11 Tow Counts at Selected Locks 2011 and 2012
35 Fleet Utilization
The C01ps Lock Perf01mance Monitoring System (LPMS) data was examined at the three gateway locks discussed above this time for evidence of altered vessel operation pattems As seen in FIGURE 11 the effect of the 2011 high water event on the lower Ohio River is reflected in lower tow counts in April and May of that year othetwise tow counts are fairly similar between 2011 and 2012 The droughts effect was more apparent at Mississippi River LD27 an d at Peoria LD where tow counts were down significantly between 2011 and 2012 dming the summer and fall months ---------------------------------------
Page 18
Barges per tow and composition of tows did not change dramatically at any of the three locks between 2011 and 2012 (see TABLE 8) The most significant change occurred at LD53 where barges per tow dropped from 117 per tow to 111 per tow while the percentage of empties increased by 3 percent Tow sizes at LD27 remained around 75 barges per tow and grew slightly from 64 to 67 barges per tow at Peoria LD Significantly fewer loaded barges were processed at each of the three locks
Table 8 Barges Tows and Barges per Tow Selected Locks Ba rge s TOTAL
Tow s Ba rges
pe r Tow Loaded Loaded Empty Empty Tota l LD 53
2007 48592 68 23187 32 71779 7039 102 2008 48009 68 22434 32 70443 6624 106 2009 40352 65 21706 35 62058 5489 113 2010 47030 67 23602 33 70632 5984 118 2011 47465 67 22863 33 70328 6021 117 2012 45064 64 25656 36 70720 6352 111
LD 27 2007 41019 67 20574 33 61593 7217 85 2008 35391 70 15343 30 50734 6456 79 2009 37259 64 20868 36 58127 6753 86 2010 35647 65 19299 35 54946 6792 81 2011 34799 68 16709 32 51508 6909 75 2012 34237 67 16904 33 51141 6713 76
Peoria 2007 15336 67 7519 33 22855 3264 70 2008 13526 69 5981 31 19507 3063 64 2009 13376 64 7677 36 21053 3028 70 2010 13452 65 7402 35 20854 3044 69 2011 13265 67 6621 33 19886 3087 64 2012 12702 67 6185 33 18887 2803 67
The effect on total tons of fewer loaded barges through these locks was heightened by lighter loadings measured in tons per barge (see FIGURE 12) which occurred in the late summer and fall of 2012 At LD27 loadings were down approximately 100 tons per barge in October November and December of 2012 when compared with the same months in 2011 and down approximately 75 tons per barge in October and November at Peoria LD
Page19
Ohio River LDS3 Aver age Barge Loadings
1850 ---------------------shy1800 +-------------------shy1750 -1-------=-------------shy1700
~ 1650 ~ 1600
1550 1500 1450 1400
1850 1800 1750 1700
~ 1650 ~ 1600
1550 1500 1450 1400
1850 1800 1750 1700
~ 1650 ~ 1600
1550 1500 1450 1400
Jan Feb Mar Apr May Jun Jul Aug 5ep Oct Nov Dec Ave
r r-r-r-rshyshy
Mississippi River LD27 Average Barge Loadings
r- r- r-r- r- r-r- r- r-r- r- r-r- r- rshyshy shy shy
r-
r- rshy shy
r- r- r-r- r- rshyshy shy -
Jan Feb Mar Apr May Jun Jul Aug 5ep Oct Nov Dec Ave
-shy
r-rshy-
Peori a LD Average Barge Loadings
r- r-r- r-
r- r- r-r- r- r-r- r- r-r- r- rshyshy shy shy
rshy - r-
r- r- r-r- rshy 1shy
r- r- r-r- rshy shyshy shy -
Jan Feb Mar Apr May Jun Jul Aug 5ep Oct Nov Dec Ave
Figure 12 Average Bar ge L oadings at Selected Locks 2011 amp 2012
The combination of fewer barges per tow and lighter loadings at LD27 and Peoria continued a trend at these two locks of fewer tons per tow (see FI GURE 13) A distinct pattem emerges at LD27 one that minors the pattem of grain shipments Significantly larger tons per tow occur during the peak grain shipping season These cyclical variations occur each year though the peaks an d valleys have smoothed with each passing year In 2012 the cyclical pattem is all but unnoticeable At LD53 the combination of smaller tows a greater percentage of empty barges
Page 20
LDS3 Tons per Tow by Month 2007 -2012
LD27 Tons per Tow by Months 2007 - 2012
Peoria LD Tons per Tow by Month 2007 -2012 10000
9000
8000
7000
6000
~ _ 5000
4000
3000
2000
1000
rJ A AA I IVV1 ~ AAV II1 v
1 y bull
Figure 13 Average Barge Loadings at Selected Locks 2007 - 2012
and somewhat lighter loadings caused tons per tow to drop steeply toward the end of2012 despite an increase ofover 300 tow transits that year
Page 21
36 Summary and Conclusions Traffic patterns were examined on the four high volume waterway segments affected by low water in 2012 With the exception of the Lower Mississippi from Cairo Illinois to Baton Rouge Louisiana each segment experienced lower traffic in 2012 than in 2011 Sharp declines in corn traffic undoubtedly related to a greatly diminished harvest explain most of the traffic decline though carriers continued to maintain volumes otherwise
When looking at monthly traffic levels reported in the LPMS data for the gateway locks to the Ohio Illinois and Upper Mississippi (Ohio River LD53 Peoria LD and LD 27) typical cyclical patterns of shipment are apparent in 2012 but at lower levels Vessel operators ran significantly fewer tows in the summer and fall moved fewer barges at LD27 and Peoria but more barges at OH53 ndash this increase being explained by the increased movement of empty barges Tows pushed fewer loaded barges that were more lightly loaded (100 tons per barge less than average at LD27) The end result was lower traffic at each of these three projects
Unfortunately there is no data equivalent to LPMS available at the constriction points on the Mississippi River at Thebes and Grand Tower Illinois that will describe how vessel operators configured their tows We do know that there were vessel draft restrictions that affected both loadings and the size of towboats as well as tow size restrictions According to the Waterborne Commerce Statistics waterway traffic at Thebes Illinois and Greenville Mississippi changed only slightly between 2011 and 2012 declining by 12 percent at Thebes and increasing by 12 percent at Greenville Average tons per barge declined at both locations for the year We also know from surveys and discussions with vessel operators (discussed in subsequent sections) that fleeting operations were initiated above and below the Middle Mississippi reach between Thebes and Grand Tower Illinois in order to optimize the use of a limited number of smaller towboats required through this reach while still utilizing the larger towboats that typically move through this area
Page22
4 LD27 CLOSURE ANALYSIS
41 General
Mississippi River Locks and Dam 27 (LD27) is located on the Upper Mississippi River at mile 1845 near Granite City Illinois and just above St Louis Missouri It is the 4th busiest lock in terms of tonnage processing 250 million tons of agricultural products 101 million tons of chemicals and 101 million tons of petroleum products in 2012 Three closures of special note occurred at this project in 2012 The first was a main chamber closure which occurred in January of 2012 The second was an emergency closure of both chambers caused by an accident related to low water conditions at the lock The third outage was a planned closure of the main chamber to remove the guide cell damaged during the September accident
The US Army Corps of Engineers Lock Performance Monitoring System (LPMS) collects traffic and processing data from each of its lock projects LPMS data for LD27 was analyzed in order to estimate the cost impact on waterway carriers of all three closures the latter two being directly related to the low-water experienced in 2012 The January 2012 closure analysis offers some perspective when evaluating the economic impact on carriers of the five day outage of the project that was related to low water Section 42 examines the first two closures and Section 43 the third closure that began in 2012 and ended in 2013
42 January and September 2012 Outages
The January 2012 closure was a scheduled closure of the 1200rsquo x 110rsquo main chamber The outage began on 4 January 2012 at 0433 hours and ended when the chamber was reopened on 15 March 2012 at 0039 hours The closure allowed for an embedded metal repair to be completed The main chamber was closed for 1700 hours or approximately 70 days and 20 hours The second closure occurred on 15 September 2012 at 0232 hours when a guide cell was ruptured by a tow allision The resulting gravel spill from within the cell and damage to the guide cell prohibited safe passage through the main chamber A little over 15 hours later at 1527 hours the auxiliary chamber closed resulting in a total river closure Both the main and auxiliary chambers were reopened 20 September 2012 at 0330 hours therefore for 5 days and 3 hours the Mississippi River was completely closed to waterway traffic at LD27
421 Tow Arrivals
FIGURE 14 shows the arrivals per day at LD27 for the months of January ndash September 2012 Average tow arrivals per day for the period outside the closures 15 March through 15 September 2012 was 190 tows per day Average arrivals per day for the first closure period 4 January through 15 March 2012 decreased from the 190 tows per day outside the closure period to 152 tows per day Average arrivals per day for the second closure period 15 September through 20 September 2012 were 116 tows per day versus the 190 tows per day outside the closure period
Page23
Lock 27 Upper Mississippi River Main and Auxil iary Tow Arrivals 2012 Chamber
35 ---------------------------------------------------------~~ Main Chamber Closed
15
10
0 ~--------------~----------------------------------------~~ J an Feb Mar Apr May Jun Jul Aug
5 ++---------------+----------------------------------------~~
Figure 14 LD27 Tow Arrivals 2012
422 Tow Processing Time
During the first closure of the 1200 main chamber that occmTed from Janumy through March 1089 tows umiddotansited LD27s auxilimy chamber The average processing time increased from 48 minutes for all tows outside the Janumy through Mmmiddotch 2012 closure to 78 minutes during the closure
At the beginning of the second main chamber closure from 0020 through 1527 on 15 September 2012 only two tows umiddotansited LD27 auxilimy chamber The average processing time increased from 48 minutes for all tows outside the September closure to 209 minutes during the closure
The 2012 closures increased the processing time 30 minutes per tow The 1091 tows that umiddotansited the auxilimy chamber during the main chamber closures caused an additional549 hours of tow umiddotansit time
423 Tow Delays
FIGURE 15 shows delays at LD27 for the period from Janumy- September 2012 Delays stmied building soon after the 1200 chamber closed and continued until17 Mmmiddotch 2012 at 0110 hours This means that the 1700 hour closure impacted traffic for 1749 hours The 49 hour difference represents the time required for the reopened chamber to serve th e tows in queue and bring the delay back to zero During the impact period 16366 hours of tow delay were experienced by 1148 tows This results in an average delay of 143 hourstow for the first closure in year 2012 from Janumy through March By compmmiddotison 4054 tows were served at
Page 24
LD27 outside the Januruy - Mrumiddotch and September 2012 closure periods The average nonnal delay per tow was 183 minutes or approximately 31 hours Given that the average additional delay per tow was 112 hours for the Januaty - Mrumiddotch closure and that 1 148 tows were impacted the closure caused 12866 hours of additional delay
With the September 2012 closure delays strut ed building soon after the 1200 and 600 chamber closed and continued until 25 September 2012 at 1135 hours This means that the 123 hour river closure impacted traffic for 251 hours The 128 hour difference represents the time required for the reopened chambers to serve the tows in queue and bring the delay back to zero During the impact period 6498 hours of tow delay were experienced by 141 tows This resulted in an average delay of46 hourstow Given that the average nonnal delay per tow was 31 hours the average additional delay per tow was 43 hours for the September closure and that 141 tows were impacted the closure caused 6068 hours of additional delay
A total of 1288 tows were impacted in 2012 which caused an additional delay of 18934 hours Therefore on average each tow experienced 147 hours more delay during the closure than n01mal The maximum delay was 127 hours
Lock 27 Upper Mississippi River Average Hou r ly Tow Delays - Year 2012 Main and
Auxili ary Chamber
120 - Main Chamber Closed
100 80
60
40
1 tJi20
A amp A AIt amp ~~ A middot AIAA 10 ~~~m~~~~m~~~~M~~~~M~~~~M~~~~M~~~~M~~~~M~~~~M~~~~M~~~~M~~~~M~~~~M~~~~M middotmiddot middotshy~~NNNMMVV~~~~~~~~~~~~~OOO~~NNNMMVVV~~~~~~~~~~~~OOO~~NNNMMVVV~~~~~~
~~~ bull -l-l-t-t-41ii~-l-l-t-t-lt-1 -t-t-t-t-t -l~ -t-tNNNlNiNNNN1~NNNNNNN
Jan Feb Mar Apr May Jun Jul Aug Sept
Figure 15 LD27 Average Hourly Delays 2012
424 Cost Impact
The analysis above shows that the Januruy through Mrumiddotch 2012 closure caused an additional 543 hours ofprocessing time and 12866 hours of delay Given this additional transit time and average hourly operating costs for tows at LD27 the Januruy through March closure cost caniers an additional $87 million to process through the lock The September closure caused an additional 5 hours ofprocessing time and 6068 hours of delay for a total closure cost of approximately $39 million While the 70 day closure of the main chamber resulted in additional
Page 25
costs of$124000 per day the much sholier 6 day closure (with 5 days oftotal river closure) cost industry a much higher $550000 per day in delay time
43 December 2012 through March 2013 Main Chamber Closure
The third an d fmal closure at LD27 occmTed between 10 December 2012 and 2 March 2013 when th e C01ps removed the guide cell damaged in September 2012 Removal of the guide cell necessitated closure of the main chamber (and some brief closures of the auxiliruy chamber) The main chamber was closed for 1968 hours or approximately 82 days
431 Tow Arrivals
FIGURE 16 shows the anivals per day at LD27 for the months ofNovember 2012 - April2013 Average tow ruTivals per day for the period outside the closures from 1 Jlme 2012 through 31 May 2013 were 183 tows per day Average ruTivals per day for the closure period 10 December 2012 through 2 March 2013 decreased to 127 tows per day
Lock 27 Upper Mississippi River Tow Arrivals Dec 2012 - Mar 2013
35
30 Main Chamber Closed
25 uj20 amp -uA I ~
I~ ~~ I A ~ I15 ~~ n ~~
~~~ - ~1J vr 1 A10 I
5
0
~
~~~O~~~N~~~~~O~~~N~~~M~~N~~~~~ON~~~~~Om~~~~Om~~N~~~m~~N~~~~~ ~~~~NNN ~~~NNNm NNNm NNN NNNm NNN
Nov Dec Jan Feb Mar Apr
Figure 16 L D27 Tow Arrivals December 2012 - March 2013
432 Tow Processing Time
During the closure of the 1200 chamber 35 of the tows through LD27 had to double cut - the tow fl otilla had to be broken into two pruis an d each prui of the fl otilla locked through separately This increased the average processing time fr om 51 minutes for all tows outside the December 2012 through March 2013 closure to 88 minutes during the closures During the closures 1032 tows tImiddotansited LD27 Given an increase in time of 37 minutes per tow an d 1032 tows an additional 643 hours of tow processing time was experienced during the closure
Page 26
433 Tow Delays
FIGURE 17 shows delays at LD27 for the December 2012 through March 2013 closm e period Delays statted building soon after the 1200 chambers closed on 10 December 2012 at 1530 homs and continued until 4 March 2013 at 0008 hom s This means th at th e 1968 hom closme impacted traffic for 2001 hom s The 33 hom difference represents th e time requir ed for th e reopened chamber to serve th e tows in queue an d bring the delay back to zero Dming the impact period 23058 hom s oftow delay were experienced by 1076 tows (total delay in all of 2011 was 9349 homs) This 23058 homs works out to an average delay of214 homstow for th e closm e period By comparison 5246 tows were served at LD27 outside the closm e period from 1 June 2012 through 31 May 2013 The average non nal delay per tow was 27 1 minutes or approximately 45 hom s Given that the average additional delay per tow was 17 hom s for th e December 2012 - March 2013 closme an d that 1076 tows were impacted the closme caused 18195 homs of additional delay The maximum delay experienced by a tow dming this closme was 805 homs
Minimum Average amp Maximum Tow Delays Lock 27 Upper Miss River
Dec 2012 middotMar 3
90
80
70 -f 60 ~ ~ 50 0 1shy 40 Q) Q
gt- 30 ca Q) 20 0
10
De Jan
Mar bull Minimum bull Average Maximum Apr
Figure 17 LD27 M inimum Maximum and Average Tow Delays December 2012- March 2013
444 Cost Impact
The most recent infon nation available indicates that the average tow transit costs at LD27 are about $648 per hom Given the analysis above which shows that this scheduled closm e caused an additional 643 hom s ofprocessing time and 18195 hom of delay the estimated additional transit time dming the closm e cost a total of $ 122 million
Page 27
Page28
5 SHIPPER RESPONSE
51 Survey Procedures
An OMB-approved Shipper Survey (Control 0710-0001) was used to capture and evaluate shipper reactions to the drought and the emergency closure of LD27 in September (see Appendix A) Shippers were defined as companies that receive commodity traffic transiting through multiple reaches on the Mississippi River The formal shipper survey was conducted between 7 March and 30 May 2013 The purposes of the survey were to find out what measures were taken by industry to mitigate the effects of the drought-related low water and emergency closure at LD27 and to estimate the total costs to industry that resulted from the events
At the outset of the process several steps were adopted for including firms in the survey First a list was compiled that showed the parent companies that operate at docks in the four affected waterways ndash the lower Ohio lower Illinois Middle Mississippi and Lower Mississippi Rivers ndash and that ship through LD27 The parent companyowner of each receiving dock was identified using information available to the Corps and grouped by parent company This allowed an estimate of tonnage by parent companyowner to be formulated Parent companies were then ranked in descending order by their total tonnage received For LD27 and each affected waterway the top 25 ranked by companies by tons shipped were selected to be surveyed Duplicate shippers (shippers that had a top 25 ranking in more than one reach) were included as one survey and the next largest company was added to obtain the top 25 unique companies to survey in the study area In all 125 shippers were sent surveys
Waterborne Commerce Statistics Center (WCSC) data for 2011 was used in assembling basic shipper information All of the contact information for the top ranking companies was determined by comparing several contact lists In the absence of any contact information the Internet was used as a search tool to verify correct contact information for these parent companies The 125 shippers were sent a mail survey followed by a telephone follow-up if the parent company or carrier sent no response after two weeks Stakeholders like the American Corn Growers Association the River Industry Action Council (RIAC) and the Waterways Council Incorporated (WCI) assisted by encouraging firms to respond by sending emails to all members late in the survey to encourage participation
According to survey respondents low water presented the greatest challenge to users of the Lower Mississippi from Cairo Illinois to Baton Rouge and the Middle Mississippi River between St Louis and Cairo Traffic on these two reaches totaled 2024 million tons in 2011
Page29
52 Summary of Shipper Responses
Responses to the survey were received from 73 companies representing a response rate of 59 percent and accounting for 42 percent of total 2011 traffic transiting the affected waterways Questions 1a and 1b were used to help determine if the shipper had any impacts from either the emergency lock closure event at LD27 or from the low water conditions Questions 2 and further into the survey were designed to be answered by shippers who had responded that they were impacted by either or both of these events From question 2 onwards the subset of respondents is less than the total that returned surveys because some shippers indicated that they were not impacted by either event in question An overwhelming percentage of respondents to the shipper survey said they were unaffected by the LD27 closure while half of the respondents indicated they experienced significant effects on operations due to low water In an effort to meet their needs shippers sought other sources for product sought other waterway routes and used overland transportation routes at a cost to responding shippers of $56 million The effect of the drought on agricultural production combined with increased transportation costs resulted in temporary plant closures and lost sales that the responding shippers estimated at $79 million
Page30
6 CARRIER RESPONSE
61 Survey Procedures
The Carrier Survey targeted the major towing companies that used the waterways affected by low water in 2012 (the lower Ohio the lower Illinois the Middle Mississippi and the Lower Mississippi Rivers) Appendix B contains the Carrier survey form The purpose of this survey was to identify carrier responses to the 2012 low water event and the LD27 closure Like the shipper survey the formal carrier survey was conducted between 1 March and 30 May 2013 The purpose of the surveys was to determine what measures were taken specifically by the carriers to adapt to the emergency closure at LD27 and drought conditions and what these measures cost
The firms included in the carrier survey were the 10 largest users of the affected waterways (in tonnage) for the years 2006 through 2010 Responses were received from six companies representing 46 percent of carrier traffic on these waterways According to survey respondents low water presented the greatest challenge to users of the Lower Mississippi from Cairo Illinois to Baton Rouge Louisiana and the Middle Mississippi River between St Louis Missouri and Cairo Traffic on these two reaches totaled 2024 million tons in 2011 Survey respondents accounted for 58 of the tonnage in these two reaches
62 Summary of Carrier Canvas Responses
Once the initial set of shippers and carriers for canvassing was established contacts were identified for each company This information was taken from publicly available sources and in some instances through the assistance of industry associations such as the American Corn Growers Association the River Industry Action Council (RIAC) and the Waterways Council Incorporated (WCI) These organizations were also of assistance in encouraging firms to respond by emailing members late in the survey process to encourage participation
Responses were received from six carriers (60) representing 59 percent of total traffic on the affected waterways All but one of the carriers responding indicated that they were affected by both low water and the LD27 closure with the low water being the more serious challenge Moving cargo during this period required carriers to advance or delay shipments light load vessels (necessitating additional trips) reposition barges throughout the system to accommodate the need for additional barges restrict tow sizes (also necessitating more trips) and perform additional refleeting These altered carrier operations cost responding carriers an estimated $807 million Carriers also experienced $167 million in additional costs due to the LD27 closure and delays and tug costs of $02 million due to tow grounding
Page31
Page32
7 FEDERAL RESPONSE
Federal stewards of the inland waterways were aided by past experiences like the 1988 drought and the low-water event on the Lower Mississippi River in 1997 and advancements in the data provided by the National Oceanographic and Atmospheric Administrationrsquos (NOAA) as well as hydrologic tools used by the Corps to forecast water levels These advancements improved the ability of the Corps and the Tennessee Valley Authority in controlling available water in efforts to keep navigation open on the lower Ohio and on the Mississippi Rivers The US Coast Guard took the lead in creating communication avenues between all stakeholders in managing vessel operation and reaching consensus on channel and vessel operational maintenance during the event According to representatives of the Coast Guard no additional expenditures of funds accompanied their extraordinary efforts
On the Ohio River the Corps of Engineers essentially borrowed resources from other locations to be repaid at some future date No emergency funding was made available Channel surveys were conducted more frequently on known trouble spots sometimes twice weekly The Louisville District estimated that dredging costs were approximately $21 million higher than in a typical year (see TABLE 9) The funds were drawn away from other projects in effect with the promise of repayment in a future year to accomplish work that could not be done as a result of moving funds to the lower Ohio
Table 9 Costs Incurred by the Corps
($millions)
District Added Cost Vicksburg $ 729 StLouis
dredging blasting LD27 1
subtotal
$ $ $
1190 970 097
$ 2257 Louisville $ 207 TOTAL $ 3193
1 Costs to bring LD27 into immediate s ervic e Inc ludes cos t of spud barge temporary helperboat assists and gravel cleanup
Source US Army Corps of Engineers Vicksburg St Louis and Louisville Districts
On the Mississippi River emergency funds were made available by Congress in 2011 in response to the flooding that year and any possible future emergencies The rock pinnacles at Thebes and Grand Tower Illinois were blasted and debris removed at an estimated cost of $97 million At LD27 the spilled gravel from the damaged cell and the cell itself were removed and
Page33
temporary safe passage accommodated at an estimated cost of $10 million11 St Louis District dredging was concentrated on the Middle Mississippi as the Lower Illinois was not severely affected Dredging completed by the Vicksburg District on the main stem Mississippi cost $73 million more than average dredging costs over the last several years
11 The Corps estimates it will cost another $35 million to replace the damaged cell This was not includedin thefederal cost
Page34
8 FINDINGS
Traffic patterns were examined on the four high volume waterway segments affected by low water in 2012 With the exception of the Lower Mississippi from Cairo Illinois to Baton Rouge Louisiana each segment experienced lower traffic in 2012 than in 2011 Sharp declines in corn traffic related to a greatly diminished harvest explain most of the traffic decline though carriers continued to maintain volumes of all other commodities otherwise
When looking at monthly traffic levels reported in the LPMS data for the gateway locks to the Ohio Illinois and Upper Mississippi (LD53 Peoria LD and LD 27) typical cyclical patterns of shipment are apparent in 2012 but at lower levels Vessel operators ran significantly fewer tows in the summer and fall moved fewer barges at LD27 and Peoria but more barges at OH53 ndash this increase is explained by the increased movement of empty barges Tows pushed fewer loaded barges that were more lightly loaded (100 tons per barge less than average at LD27) The end result was lower traffic at each of these three projects
Unfortunately there is no data equivalent to LPMS available at the constriction points on the Mississippi River at Thebes Illinois and Grand Tower Illinois that will describe how vessel operators configured tows by number of barges per tow We do know that there were vessel draft restrictions that affected both loadings and the size of towboats as well as tow size restrictions We also know from surveys and discussions with vessel operators (discussed in previous sections) that fleeting operations were initiated above and below these points in order to optimize the use of a limited number of smaller towboats required through this reach while still utilizing the larger towboats that typically move through this area
The Corps surveyed 125 shippers and ten carriers The 73 shippers that responded represent 42 percent of all shipper traffic transiting the affected waterways Half of the respondents to the shipper survey indicated that they did not experience any significant effects on operations due to low water and an overwhelming percentage said they were unaffected by the LD27 closure Ten carriers were surveyed The six carriers responding represented 46 percent of all carrier traffic transiting the affected waterways All but one of the carriers responding indicated that they were affected by both low water and the LD27 closure with the low water being the more serious challenge The difference in shipper and carrier responses suggests that the shippers were somewhat insulated from these events by the strategic and tactical actions taken by the carriers that minimized impacts on the shippers
Despite lower corn production and a 51 decline in corn exports waterway traffic through the Middle Mississippirsquos rock pinnacles at Thebes Illinois constriction was largely unchanged between 2011 and 2012 (though it is important to remember that the worst low water conditions were experienced from December 2012 through February 2013) Moving cargo during this period required carriers to advance or delay shipments light load vessels (necessitating additional trips) reposition barges throughout the system to accommodate the need for additional barges restrict tow sizes (also necessitating more trips) and perform additional refleeting It cost responding carriers an estimated $807 million to alter operations in this fashion (see TABLE
Page35
10) The carriers also faced $167 million in additional costs as a result of the LD27 closures and delays and tug costs of $02 million due to tow groundings Despite these actions shippers did not escape the effects of the low water In an effort to meet their needs shippers sought other sources for product sought other waterway routes and used overland transportation routes at a cost to responding shippers of $559 million The effect of the drought on agricultural production combined with increased transportation costs resulted in temporary plant closures and lost sales that the responding shippers estimated at $790 million
Table 10 Survey Results - Low Water Cost Impacts
Cost Category Cost ($000) Transportation cost impacts
Carrier cost impacts Delays due to LD27 clos ure 16100 $ Other costs due to LD27 clos ure 573$ Groundings 164 $ Altered operations 80723 $
Shipper cost impacts 55860 $ SUBTOTAL 153419$
Production cost impacts 79000$ TOTAL 232419$
Page36
9 CONCLUSIONS
Several observations can be made from an examination of the traffic data obtained from LPMS and WCSC sources and responses generated from the surveys of the navigation industry The obvious message is that a system that is not operating at a level of reliability expected by users will have economic consequences Resulting increases in transportation costs andor delays to the transportation of commodities will have an effect on the marketplace Either the producer will pay more thus reducing expected profit associated with their products or the end user will experience higher commodity prices at the market once prices are adjusted
The low water the 5-day closure of LD27 in September 2012 and the subsequent 82 day closure of the main chamber between December 2012 and March 2013 imposed additional transportation costs of $1534 million just on the companies that responded to the Corpsrsquo surveys Drought andor low water accounted for another $790 million in production losses bringing the total reported impact to $2324 million Shipper survey respondents averaged $098 per ton in production losses and $080 per ton in increased transportation costs as they shifted to other modes and routes These values were applied to tonnage not accounted for through the sample or for which no response was given Carrier survey respondents provided a range of cost impacts $009 per ton for production loss $0005 per ton for non-delay related operations during the LD27 closure $0001 per ton related to grounding logistics and $069 in added transit costs Using these values a simple extrapolation of the sample to the population of movements using the most affected waterways (the Middle Mississippi and Lower Mississippi River) either not sampled or not responding suggests that additional transportation costs totaled $2770 million and production impacts amounted to $1652 million for a total impact of $4422 million12
Table 11 Low Water Cost Impacts from 2012 Event (Costs in $000)
Cost Category Survey
Responses
Estimate for Firms Not
Responding Not Surveyed TOTAL
Transportation cost impacts Carrier cost impacts
Delays due to LD27 closure 1 $ 16100 ‐$ $ 16100 Other costs due to LD27 closure $ 573 417 $ $ 990 Groundings $ 164 119 $ $ 283 Altered operations $ 80723 58719 $ $ 139442
Shipper cost impacts $ 55860 64277 $ $ 120137 SUBTOTAL $ 153419 123532 $ $ 276951
Production cost impacts 2 $ 79000 86248 $ $ 165248 TOTAL $ 232419 209780 $ $ 442199
1 I ncl udes del a y cos t experi enc ed due to LD27 ma i n cha mber cl os ure Dec 2012 ‐Ma r 2013 to remove dama ged cel l
2 I ncl udes ec onomi c impact of reduced corn producti on and hi gher tra ns porta ti on cos ts due to low‐wa ter
12 It is important to remember that not all waterways affected by the drought were covered by this survey
Page37
Using available transportation rate studies conducted for navigation improvement studies on the Upper Mississippi Illinois and Ohio River it is estimated that this tonnage moves at an average transportation rate savings of $2558 a ton Therefore at 2011 traffic levels total savings on these rivers would likely have been an estimated at $58 billion dollars The three most affected Corps of Engineers districts expended $319 million to keep the lower Ohio lower Illinois Middle Mississippi and Lower Mississippi river channels open to navigation in extreme drought conditions enabling shippers to continue navigation While industry faced losses of an estimated $2770 million due to increased transportation costs through the cooperative and coordinated efforts of the Corps the Coast Guard and industry partners shippers and the Nation were able to realize a savings in transportation costs of an estimated $55 billion despite this extreme low water event
Page38
APPENDIX A ndash SHIPPER QUESTIONNAIRE
PageA‐1
OMB Control 0710-0001 Expiration date 02282015
2012 DROUGHTLOCK 27 CLOSURE ndash SHIPPER SURVEY
Date
Firm
Address
Phone
FAX
Point of Contact
Title
General Description of Firm and Products Produced
NOTE ALL RESPONSES WILL BE TREATED AS CONFIDENTIAL
1 Was your company impacted by the closure event at Lock 27 in 2012 Yes No Was your company impacted by low water associated with the Drought Low water conditions in 2012 Yes No (If no interview is complete)
2 Does your company have a response plan for these types of impacts If so did it result in additional work organization to implement or was it detailed enough to cover all the impacts
1
PageA‐2
OMB Control 0710-0001 Expirat ion date 0228201 5
2012 DROUGHTLOCK 27 CLOSURE- SHIPPER SURVEY
LD27 closure
only Low
wate1middot Descriptio n of Response
a No change in procedmes b Stockpiled product and waited for traffic to clear if closme or changed loading depth in barges for low wat er c Switched to all-overland mode for product delivety from existing somces d Switched to different watervray routing for product delivety from existing somces e Switched product somce to an entirely new somce f Ceased operations dming the period g Altered production during the period h Switched production to another facility i Purchased intermediate or final product rather than produced j Other or combinations of the above (Please explain)
3 During th e 2012 event (either Low water or Lock 27 closure) what was your companys response Please indicate with an x in the appropriate box
4 Ifyou have checked c or d in question 3 please complete the following table
Movement Commodity Affected tonnage
Origin (City State)
Destination (City State)
Deliverd $ ton
plio1middot to drou2ht
Delivered $to n
during drou2ht
Examples
I Com 12000 Minneapolis New Orleans $30 $35
MN LA
2 Lube oils 4000 Houston TX Huntington wv $40 $50
2
PageA-3
OMB Contro l 0710-0001 Expiration date 02 282015
2012 DROUGHTLOCK 27 CLOSURE - SHIPPER SURVEY
5 Ifyou checked e in question 2 please complete the following table
Movement Commodity Affected tonnage
P reshydrou ght Origin
(City State)
Ch an ged Origin
(City State)
Destination (City State)
Deliver d $ton
pri01middot to drought
Delivered $ton
dming drought
Examples
1 Com 12000 Minneapolis MN
Cincinnati OH
New Orleans LA
$30 $35
2 Lube oils 4000 Houston TX Ashland KY
Pittsburgh PA $40 $50
6 Ifyou checked response a orb lmder question 3 how were your total production costs affected during the period of closure at Lock 27 or Drought-related low water (total increase in cost if applicable) Please explain
7 Ifyou checked response f under question 3 what was the total estimated loss to your fi1m as a result of ceasing production (during the closure period at Lock 27 or Drought)
3
Page A-4
OMB Control 0710-0001 Expiration date 02282015
2012 DROUGHTLOCK 27 CLOSURE ndash SHIPPER SURVEY
8 If you checked response ldquogrdquo under question 3 what was the total estimated loss to your firm as a result of altering production processes (during the closure period at Lock 27 or Drought)
9 If you checked response ldquohrdquo under question 3 what was the total increase in costs to your firm as a result of changing production locations (during the closure period at Lock 27 or Drought)
10 If you checked ldquoirdquo under question 3 to what extent did purchasing intermediate or final product increase your companyrsquos total costs (during the closure period at Lock 27 or Drought)
11 If you checked response ldquojrdquo under question 3 to what extent did the other measures or combination of measures undertaken as a result of the closure increase your companyrsquos total production costs (during the closure period at Lock 27 or Drought)
4
PageA‐5
OMB Control 0710-0001 Expiration date 02282015
2012 DROUGHTLOCK 27 CLOSURE ndash SHIPPER SURVEY
12 Have these events (drought-related low water or Lock 27 closure) caused your company to alter its long-term transportation strategy (eg switch to all-overland modes increase stockpiles etc) How will this impact your total commodity transportation or other costs (per year) Please explain
13 Has the (drought-related low water or Lock 27 closure) caused your company to take any other long-term permanent measures Please explain How will this affect your companyrsquos long-term operating costs (per year)
14 Has your company been impacted by other navigation system disruptions this shipping season (these would be other than the Low water from the drought or the Lock 27 closure)
5
PageA‐6
Event Date 2 Short-term response 3 Long-term responseExample
McAlpine closure
Jan ndash Feb 2006 Diverted to overland modes
none
OMB Control 0710-0001 Expiration date 02282015
2012 DROUGHTLOCK 27 CLOSURE ndash SHIPPER SURVEY
15 If your company has experienced significant navigation disruptions1 prior to this shipping season please complete the following table
1 Significant navigation system disruptions are defined as disruptions that result in delays to your shipment of more than 48 hours (include scheduled and unscheduled lock outages accidents and low and high water events)
2 Short term response refers to the response actions detailed in question 2 a No change in procedures b Stockpiled product and waited for traffic to clear or light loaded for low water c Switched to all-overland mode for product delivery from existing sources d Switched to different waterway routing for product delivery from existing sources e Switched product source to an entirely new source f Ceased operations during the period of closurelow water g Altered production during the period of closurelow water h Switched production to another facility i Purchased intermediate or final product rather than produced j Other or combinations of the above (Please explain)
3 Long term response refers to a modification of your long term business plan to include altering your long-term transportation strategy (eg switch to all-overland modes increase stockpiles etc) Other long term responses might include sourcing commodities at alternate sites or moving production activities to a different location
6
PageA‐7
PageA‐8
APPENDIX B ndash CARRIER QUESTIONNAIRE
[Typetext] PageB‐1
Waterway Carrier Interview Questions Effects of the 2012 Drought and LD27 Closure
Name of towing company -----------shyLocatio n -----------Name and title of Point of Co ntact ----------------shyPhone number ( )________ email _________
PART 1 LOW WATER DUE TO DROUGHT CONDITIO NS
1 Did your firm experience a reduction in tonnage carried on the Mississippi Ill ino is or Ohio waterways in 2012 Please verify data fo r 2010 and 2011 indicating your estimates for 2012 in table below
Operat o r Traffic Destined fo r Lower Mississippi Ports (2010 and 2011 from WCSC)
Origin 2010 2011 2012
Mississippi above St Louis Mississippi St Louis to Cairo Mississippi south of St Louis Ill inois River Ohio River
2 What facto rs led to changes in t raffic between 2011 and 2012 For example drought condit ions that affected agricultural production low water that affected your abi lit y to operate efficiently loss or gain of a contract(s) increased competit ion from rail or other factors - please specify and ind icate re lative weight of each
3 Have you had to change the way you operate your vessel fleet due to the drought If so what changes did you make and when did these occur
1
[Type text] Page B-2
4 The t wo ta bles below are intended to describe how your operat ions are affected by water depth a nd flows on the Cairo - St Louis reach of the Mississippi Rive r
a Do the operat ionalchanges suggested in t he tables below for the Cairo - St Louis reach (Upper Reach) describe the way you would operate given t he gage readings and flow shown for these two reaches in t he t ables If yes please indicate in the appropriate box in the table below with a Y if no please indicate what restrict ions you impose on your operations given t he gage and flow readings provided
Upper Rea ch- Navigation Restriction
St Louis Gage Reading
Flow (CFSOOO)
Navigation Restriction
Carriers Nav Restriction Followed
Above 20 Above 90 No restriction 00 to 20 74 to 90 25 barges -25 to 00 55 to 74 20 barges -35 to -25 485 to 55 16 barges -40 to -35 46 to 485 85 ft draft -45 to shy 4 0 44to47 80 ft draft Below -45 Below 44 Navigat ion halts
b What is t he number of tows- by size of tow horsepower and draft - that you operate through the St Louis to Cairo reach of the Mississippi For each foot of draft t hat is lost what is your added cost per t rip Please use the table below in making your response
Upper Reach- Tows moved thru the St Louis- Cairo reach in 2011 (or year not affect ed by low water)
Tow size Towboat Horseshypower
Barge Draft
Cost ton of loading below desired barge draft
Barges tow
No of tows 05 10 15 20 25 30 35 4 0
1 - 8 9 - 15
16 - 19 17 - 20 21- 25
gt25
2
[Type text] Page B-3
5 The t wo tables below are intended to describe how your operat ions are affect ed by water depth a nd flows on the Mississippi River sout h of Cairo
a Do the operat ional changes suggested in t he tables below for the Lower Reac h of the Mississippi River sout h of Cairo describe the way you would operate given the gage readings and flow shown for these two reaches in the tables If yes please indicate in t he appropriate box in t he table below with a Y if no please indicate what rest rictions you impose o n your operations given the gage and flow readings provided
Lower Reach- Navigation Restriction
Cairo Gage Reading
Flow (CFS in OOOs)
Navigation Restrictions
Carriers Nav Restriction Followed
Above 118 Above 189 No restriction 60 to 118 111 to 189 25 barges per tow
50 to 60 95 to 111 85 ft draft and 20 barges
35 TO 50 805 to 95 8 ft draft and 12 barges
Below 35 Below 805 Navigation halts
b What is t he number of tows- by size of tow horsepower and draft - that you operate on the Lower Reach of t he Mississippi south of Cairo For each foot of draft t hat is lost what is your added cost per trip Please use t he table below in making your response
Lower Reach- Tows moved through the reach south of St Louis in 2011 (or a yea r not affected by low water)
Tow size Towboat Barge Cost ton of loading below desired barge draft
Barges tow
No of tows
Horseshypower
Draft 05 10 15 20 25 30 35 4 0
1 - 12 13 - 16
17 - 20 21- 25 gt25
6 If you light load due t o low water would you proceed entire t rip as originally light loaded or top off
below Cairo or maybe add additional barges to w here the normal t ons per horsepowe r ratio is
achieved If latter how would this be done and at what cost
3
[Type text] Page B-4
7 Did any of your tows experience a grounding If yes how many total occurrences did you experience and what was the impact on your firm Please indicate your response below
total groundings
events with tows delayed more than 8 hours cost of delays
events involving lightering cargo cost of lightering
events involving towboat assists cost of towboat assists
8 What was major impact of low water due to the drought in terms of effect on your operations ‐
increased operating cost Lost business Equipment damage Safety concerns Groundings
Efficient dispatch of fleet Others
9 Please indicate the economic impact of low water levels on your company in the table below (please
include figures from your response to 5 above)
Indicate Cost with an ldquoXrdquo
if this applies to your firm
Description of impact Costton Tons
Affected Total cost
Increased transit time (including delays) Increased cost due to restricted tow sizes Increased costs due to light loading Idle vesselslost revenue Damaged equipment Increased managementlogistics costs Other (please specify)
4
[Typetext] PageB‐5
PART 2 CLOSURE OF LD27
10 If you have tows already at the lock do you generally wait until it reopens
11 What is typical amount of time you will wait at a lock for it to reopen before you decide to do
something else What do you do if you decide not to wait any longer What factors affect this
decision If you re‐dispatch the tow what does this cost
12 If you have tows underway in the system and a closure occurs at a lock to be transited do you
continue to the closure point wait elsewhere or re‐dispatch the tow What factors affect this decision
13 Please indicate the economic impact of the closure of LD27 on your company in the table below
Indicate Cost with an ldquoXrdquo
if this applies to your firm
Description of impact Costton Tons
Affected Total cost
Delay costs at the lock Delays in place (dock or port) Idle vesselslost revenue Increased managementlogistics costs costs (including re‐dispatching) Other (please specify)
PART 3 FINAL COMMENTS
14 Do you have any other information that would help us describe and quantify the economic impact on
waterway carriers associated with low water due to the drought of 2012 andor the closure of LD27
5
[Typetext] PageB‐6
___________________________________________________________
water at locations like Greenville Mississippi was largely unchanged between 2011 and 2012 Moving cargo during this period required carriers to advance or delay shipments light load vessels (necessitating additional trips) reposition barges throughout the system to accommodate the need for additional barges restrict tow sizes (also necessitating more trips) and perform additional refleeting It cost responding carriers an estimated $807 million to alter operations in this fashion The carriers also faced $167 million in additional costs as a result of the LD27 closures and delays and tug costs of $02 million due to tow groundings Despite these actions shippers did not escape the effects of the low water In an effort to meet their needs shippers sought other sources for product sought other waterway routes and used overland transportation routes at a cost to responding shippers of $559 million The effect of the drought on agricultural production combined with increased transportation costs resulted in temporary plant closures and lost sales that the responding shippers estimated at $790 million
Low Water Cost Impacts ‐ 2012 Event (Costs in $000)
Cost Category Survey
Responses
Estimate for Firms Not
Responding Not Surveyed TOTAL
Transportation cost impacts Carrier cost impacts
Delays due to LD27 closure 1 $ 16100 ‐$ $ 16100 Other costs due to LD27 closure $ 573 417 $ $ 990 Groundings $ 164 119 $ $ 283 Altered operations $ 80723 58719 $ $ 139442
Shipper cost impacts $ 55860 64277 $ $ 120137 SUBTOTAL $ 153419 123532 $ $ 276951
Production cost impacts 2 $ 79000 86248 $ $ 165248 TOTAL $ 232419 209780 $ $ 442199
1 I ncl udes del a y cos t experi enc ed due to LD27 ma i n cha mber cl os ure Dec 2012 ‐Ma r 2013 to remove dama ged cel l
2 I ncl udes ec onomi c impact of reduced corn producti on and hi gher tra ns porta ti on cos ts due to low‐wa ter
Low water the five-day closure of LD27 in September 2012 and the subsequent 82 day closure of the main chamber between December 2012 and March 2013 imposed additional transportation costs of $1534 million on the companies that responded to the Corpsrsquo surveys Drought andor low water accounted for another $790 million in production losses bringing the total reported impact to $2324 million A simple extrapolation of the sample to the population of movements using the most affected waterways (the Middle Mississippi and Lower Mississippi River) either not sampled or not responding suggests that additional transportation costs totaled $2770 million and production impacts amounted to $1652 million for a total impact of $4422 million2
The value of the inland waterway system is reflected in the extraordinary efforts of the Federal agencies and the waterway industry On average shippers using the affected waterways realize an average savings of $26 per ton over alternative transportation modes In 2011 the total tonnage moving through these reaches was 2273 million tons From this
2 It is important to remember that not all waterways affected by the drought were covered by thissurvey
ES ‐ iii
___________________________________________________________
it is estimated that shippers using this segment of the inland waterway system save a total of $58 billion over the best alternative mode andor route of transportation The Coast Guard devoted additional resources to the helping manage the low water event but did not incur measurable additional expenditures of funds The three most affected Corps of Engineers districts expended $319 million to keep the lower Ohio lower Illinois Middle Mississippi and Lower Mississippi river channels open to navigation in the face of a severe drought While industry faced losses of an estimated $2770 million due to increased transportation costs shippers and the Nation were still able to realize a savings in transportation costs of an estimated $55 billion despite this extreme low water event These savings would have been in even greater jeopardy without the cooperative and coordinated efforts of the Corps the Coast Guard and industry partners
ES ‐ iv
Contents 1 PURPOSE AND INTRODUCTION 1
2 BACKGROUND 3
21 Drought 3
22 Low Water 5
3 WATERWAY TRAFFIC 9
31 General 9
32 Traffic Patterns 9
321 Waterway Reaches and States 9
322 Commodities 11
323 Monthly Shipping Patterns 13
33 Middle Mississippi - Traffic Past Thebes Illinois 15
34 Lower Mississippi - Traffic at Greenville Mississippi 16
35 Fleet Utilization 18
36 Summary and Conclusions 22
4 LD27 CLOSURE ANALYSIS 23
41 General 23
42 January and September 2012 Outages 23
421 Tow Arrivals 23
422 Tow Processing Time 24
423 Tow Delays 24
424 Cost Impact 25
43 December 2012 through March 2013 Main Chamber Closure 26
431 Tow Arrivals 26
432 Tow Processing Time 26
433 Tow Delays 27
444 Cost Impact 27
5 SHIPPER RESPONSE 29
51 Survey Procedures 29
52 Summary of Shipper Responses 30 ___________________________________________________________
___________________________________________________________
6 CARRIER RESPONSE 31
61 Survey Procedures 31
62 Summary of Carrier Canvas Responses 31
7 FEDERAL RESPONSE 33
8 FINDINGS 35
9 CONCLUSIONS 37
APPENDIX A ndash SHIPPER QUESTIONNAIRE 1
APPENDIX B ndash CARRIER QUESTIONNAIRE 1
___________________________________________________________
LIST OFTABLES
Table 1 US Corn and Soybean Production and Exports 4 Table 2 US Corn and Soybean Production 2010 ndash 2012 9 Table 3 Shipments and Receipts by State 10 Table 4 Traffic by Reach 10 Table 5 Traffic by Major Commodity 2007 - 2011 12 Table 6 Waterway Traffic Past Thebes Illinois 16 Table 7 Loaded Barges Past Greenville Mississippi ndash 2011 and 2012 17 Table 8 Barges Tows and Barges per Tow Selected Locks 19 Table 9 Costs Incurred by the Corps 33 Table 10 Survey Results - Low Water Cost Impacts 36 Table 11 Low Water Cost Impacts from 2012 Event 37
LIST OFFIGURES
Figure 1 The Mississippi River Basin 3 Figure 2 Extent and Depth of 2012 Drought 5 Figure 3 Water Levels in Memphis ndash 2011 and 2012 6 Figure 4 Mississippi River Stages at Vicksburg Mississippi 6 Figure 5 Groundings through 28 November 2012 as reported by the US Coast Guard 7 Figure 6 Removal of stone at rock pinnacle 8 Figure 7 Commodity Shares by Reach 11 Figure 8 Monthly Traffic at Selected Locks 2007 2011 and 2012 14 Figure 9 Powerhouse at Ohio River LD53 Spring 2011 15 Figure 10 Tows delayed Due to Low-water at Greenville Mississippi August 20 2012 17 Figure 11 Tow Counts at Selected Locks 2011 and 2012 18 Figure 12 Average Barge Loadings at Selected Locks 2011 amp 2012 20 Figure 13 Average Barge Loadings at Selected Locks 2007 - 2012 21 Figure 14 LD27 Tow Arrivals 2012 24 Figure 15 LD27 Average Hourly Delays 2012 25 Figure 16 LD27 Tow Arrivals December 2012 ndash March 2013 26 Figure 17 LD27 Minimum Maximum and Average Tow Delays December 2012 ndash March 2013 27
___________________________________________________________
1 PURPOSE AND INTRODUCTION
Lower than normal precipitation in the Mississippi River Basin recorded in the winter and spring of 2012 was an early indicator of what evolved into drought conditions throughout much of the basin Field crops in Midwestern states experienced extreme conditions of stress Reservoirs provided maximum supplies under approved operating procedures to augment flow for water quality and supplies and for inland navigation on the Mississippi River in particular Both the drought and accompanying low water on the Mississippi River were widely reported by local and national media outlets throughout 2012 Agricultural and navigation interests were the focal point of the Nationrsquos concern as the Corp of Engineers and the US Coast Guard employed extraordinary measures to keep shipping lanes safe and open These measures while mitigating the adverse circumstances to some extent did not prevent waterway stakeholders from absorbing additional costs
The Corps of Engineers decided to formulate an estimate of these costs in order to better understand the importance of these major waterways to commercial users A major part of this effort was a survey of both waterway carriers and shippers dependent upon the high traffic volume waterways that experienced low water conditions (the affected waterways were the Mississippi River (the Mississippi River between St Louis Missouri and Cairo Illinois and between Cairo and Baton Rouge Louisiana) the lower Illinois River and the lower Ohio River) Surveys sent to carriers and shippers were designed to elicit economic impact information related to this protracted period of low water to include the river closure due to the accident at LD27
This report focuses on the impact of the low flows on major commercial cargo arteries in the Mississippi River Basin ndash specifically the Mississippi Ohio and Illinois Rivers ndash and estimates economic impacts from drought-related low flows and associated unexpected closure of Locks and Dam 27 Costs incurred by the Federal government specifically the Corps of Engineers are reported to the extent they are available
This study relied upon readily available data from public Corps of Engineers and US Coast Guard sources to describe river conditions events that occurred as a result of low water conditions and efforts to manage vessel traffic A targeted survey of inland waterway carriers and shippers was used to estimate the economic effects of interruptions and disruptions to navigation that occurred as a result of the drought and associated low water conditions
Page1
Page2
Figure 1 The Mississippi River Basin
2 BACKGROUND
21 Drought
The drought of 2012 affected much of the Mississippi River Basin whose major streams are corridors of inland waterway commerce in the Midwest and Plains states (see FIGURE 1) Four waterway reaches that experienced low water conditions and carry bulk commodities in excess of 25 million tons annually were identified for closer examination in this study 1) the Ohio River between Smithland LD and the mouth of the Ohio River 2) the Illinois River between Peoria LD and the mouth of the Illinois 3) the Mississippi River between the confluence of the Ohio River and Baton Rouge Louisiana and 4) the Mississippi River between St Louis Missouri and the confluence of the Ohio In 2011 shippers in 20 states moved commodity through the four reaches with ten different states (Arkansas Illinois Indiana Kentucky Louisiana Missouri Mississippi Ohio Tennessee and West Virginia) in the top five in shipping or receiving commodities in one or more of these reaches
The US Department of Agriculture estimated that nearly 80 percent of agricultural land was affected by drought in 2012 with 70 ndash 75 percent of the corn and soybean production affected by severe or greater drought By September 2012 over 2000 counties were
Page3
designated disaster areas by USDA3 In the Midwest the drought destroyed or damaged corn and soybean crops in particular ndash both the region and producers of these commodities being served by the inland waterway system Corn production declined by 13 percent between the 2011 and 2012 marketing year soybeans by 3 percent and corn exports fell by 51 percent (see TABLE 1)
Table 1 US Corn and Soybean Production and Exports (in millions of bushels)
Ma rke t Ye a r 1 Production
Cha nge from
pre vious ye a r Ex ports
Cha nge from pre vious
year
200708 1303788 -- 243740 --200809 1209165 -7 184895 -24 200910 1309186 8 198002 7 201011 1244687 -5 183417 -7 201112 1235961 -1 154260 -16 201213 1078030 -13 75000 -51
Sourc e USDA Economic Research Service Feed Outlook 1 market year is from September to August
US Soybe a n Production a nd Ex ports 2007 to 201213
(in millions of bushels)
Market Year 1 Production
Cha nge from
previous year Ex ports
Change from
pre vious year
200708 267712 -- 115883 --
200809 296701 11 127929 10
200910 335901 13 149905 17
201011 332918 -1 150094 0
201112 309352 -7 136185 -9
201213 301500 -3 134500 -1
Source USDA Ec onomic Res earch Servic e US Oilcrops Yearb ook
1 market y ear is from September to August
Drought in western Texas spread throughout most of the Great Plains and into the lower Ohio Valley through the spring of 2012 (see FIGURE 2) and winter months of 2013 Extreme and Exceptional drought was persistent in the Great Plains states of South Dakota Nebraska Kansas Oklahoma and northern Texas ndash all major agricultural producing areas Extreme drought reached into the Midwest states in particular southern Minnesota Iowa Illinois Indiana and Missouri ndash all major producers of corn and soybeans4 The wheat crop
3 See the USDA Economic Research Service ldquoUS Drought 2012 Farm and Food Impactsrdquo athttpwwwersusdagovtopicsin‐the‐newsus‐drought‐2012‐farm‐and‐food‐impactsaspx4 Extremedroughts arecharacterized bycrop losses and widespread water shortages or restrictionsExceptionaldroughts are characterized by widespreadcroplosses shortages of waterinreservoirsstreamsand wellscreatingwateremergenciesSeehttpdroughtmonitorunleduclassifyhtm
Page4
was largely spared as it was harvested in late spring prior to the drought taking hold in these states
Figure 2 Extent and Depth of 2012 Drought
22 Low Water
In addition to agriculture the 2012 drought affected water supplies for industrial and municipal uses recreation and the ability to navigate on the Mississippi River and its navigable tributaries Small harbors and terminals saw rivers fall to levels not experienced in nearly 50 years (see FIGURE 3)
Page5
Figure 3 Water Levels in Memphis ndash 2011 and 2012
Figure 4 Mississippi River Stages at Vicksburg Mississippi
Low water conditions rivaled those observed during the 1988 drought event By November 2012 water levels on the Mississippi River fell below those experienced in 1988 (see FIGURE 4) Beginning in May 2012 the Mississippi River stage reached the lowest level observed in the past 112 years Heavy rain and flooding in the Mississippi River Basin ended the low water problems in March 2013
Page6
Figure 5 Groundings through 28 November 2012 as reported by the US Coast Guard
Low water on these major waterway transportation arteries hampered navigation Tows accustomed to wide and deep navigable channels began to suffer from groundings along the length of the Mississippi River (see FIGURE 5) At Mississippi River LD27 water levels fell below the armor-protected area of sheet pile guide cells What would ordinarily be routine impacts on the guide cell as tows aligned to enter the locks led to failure of the cell as impacts occurred on unprotected regions of the sheet pile protectionguide cell Failure of the cell and subsequent clean-up of gravel spilled from the ruptured cell resulted in closure of the Mississippi River at the location of LD27 for approximately five days from 14 September 2012 until 20 September 2012
Groundings of tows occurred along nearly the entire length of the Mississippi River and were especially problematic along the border of northern Illinois between Thebes and Grand Tower Illinois and in the general vicinity of Greenville Mississippi According to the US Coast Guard 18 groundings on the Lower Mississippi led to closure events with more than 25 tows in queues River closures became necessary when tows stuck in shallow water had to be removed when tows broke apart and barges had to be retrieved and reassembled or when it was determined that the channel needed to be surveyed dredged and channel buoys reset
Page7
Figure 6 Removal of stone at rock pinnacle
Water levels on the Mississippi River at Thebes Illinois and at Grand Tower Illinois exposed rock ledges that reduced navigable drafts to 9 feet (well below customary drafts of 10 and 11 feet) and restricted the channel to one-way traffic5 The Corps removed these hazards in early 2013 (see FIGURE 6)
5 According to the US Army Corps of Engineers St Louis District River Projects Manager there was one‐way traffic at the pinnacles with 12 hour closures each day during the removal from 1Jan 2013 to roughly 15 February 2013 There were also other reaches of the river where there wasinsufficientchannelwidthof therequireddepthto permit two‐way traffic
Page8
3 WATERWAY TRAFFIC
31 General
Waterway traffic examined in this section focuses on the Lower Mississippi River and lower reaches of the Upper Mississippi Illinois and Ohio Rivers While the drought also seriously affected waterways in the southwest and the Missouri River traffic flows on these other rivers is relatively small in comparison with the Mississippi Illinois and Ohio Rivers Comparable data through December 2012 was available from the US Army Corps of Engineers Waterborne Commerce Statistics (WCS) and Lock Performance Monitoring System (LPMS) data sets for convenience of comparison only data through December 2012 is examined in this section of the report
32 Traffic Patterns
With the exception of Minnesota major grain and oilseed producing states saw sharp percentage declines in production that exceeded what was a national decline (See TABLE 2) All of these major producing states are touched by navigable waterways The expectation is that this diminished production of corn and soybeans should be reflected in decreased waterway traffic in these commodities
Table 2 US Corn and Soybean Production 2010 ndash 2012
IL IN IA MN MO NE OH US Corn (000s bushels)
201000 1946800 89804000 2153250 1292100 369000 1469100 533010 12446865 201100 1946800 839500 2356400 1201200 349980 1536000 508760 12359612 201200 1286250 596920 1876900 1374450 247500 1292200 448950 10780296
change 2011 ‐ 12 ‐339 ‐289 ‐203 144 ‐293 ‐159 ‐118 ‐128 Soybeans (000s bushels)
201000 466075 258505 496230 328950 210405 267750 220320 3329181 201100 423225 240695 475345 274560 190165 261360 217920 3093524 201200 383560 223590 413850 300570 155170 207085 206100 3014998
change 2011 ‐ 12 ‐94 ‐71 ‐129 95 ‐184 ‐208 ‐54 ‐25 Source Crop Production 2012 Summary USDA National Agricultural Statis tics Service January 2013
321 Waterway Reaches and States
Four waterway reaches that experienced low water conditions and carry bulk commodities in excess of 25 million tons annually were identified for closer examination in this study 1) the Ohio River between Smithland LD and the mouth of the Ohio River 2) the Illinois River between Peoria LD and the mouth of the Illinois River 3) the Mississippi River between the confluence of the Ohio River and Baton Rouge Louisiana and 4) the Mississippi River between St Louis Missouri and the confluence of the Ohio In 2011 shippers in 20 states moved commodity through the four reaches with ten different states (Arkansas Illinois Indiana Kentucky Louisiana Missouri Mississippi Ohio Tennessee and West Virginia) in the top five in shipping or receiving commodities in one or more of these reaches (see TABLE 3)
Page9
Table 3 Shipments and Receipts by State
State
Ohio River ‐ Smithland LD to Cairo IL
Illinois River ‐ Peoria LD to the Mouth
Mississippi R ‐ Cairo IL to Baton Rouge LA
Mississippi River ‐ StLouis to Cairo IL
ship receive ship receive ship receive ship receive AL 1435 4 049 214 489 1340 2351 337 1840 AR 470 972 139 157 6634 6628 235 1336 FL ‐ 41 ‐ 6 30 151 2 64 IA 292 308 23 5 5088 1532 5380 2397 IL 27819 4 477 19 170 11 428 45735 10171 49496 14764 IN 5738 14523 686 863 4994 2713 595 3794 KY 26306 10540 214 438 20 197 6 953 902 1 465 LA 16743 37420 6782 13629 44 026 114 919 14 816 58 194 MN 173 122 14 149 4 860 2 384 5 048 3 021 MO 1992 683 938 152 21 414 3 750 25 302 5 681 MS 697 1383 175 104 4 473 4 508 264 1 005 NE ‐ ‐ ‐ ‐ 8 13 8 13 NY ‐ ‐ ‐ ‐ 2 ‐ ‐ ‐
OH 2940 9188 126 112 2011 4956 710 1939 OK 192 260 138 88 2795 2391 189 240 OT ‐ ‐ ‐ ‐ ‐ 10 ‐ 10 PA 1143 2266 12 54 860 1848 240 101 TN 2494 9005 82 719 5770 9870 257 6200 TX 2930 954 874 1257 5034 5046 1 017 2 996 WI 29 2 ‐ 4 633 243 664 975 WV 7984 3184 146 79 6650 2117 1115 542
Sour c e US Army Corps of Engi neer s Wa terbor ne Commer ce Sta ti s ti cs Center
Note OT (Other) designates moves to unidentified states
Between 2011 and 2012 the Illinois reach experienced the greatest percentage decline in traffic (47 percent) and the Mississippi River between St Louis and Cairo Illinois experienced the greatest tonnage decline at just over 32 million tons (see TABLE 4) The Mississippi River below Cairo Illinois actually showed an increase in traffic between 2011 and 2012
Table 4 Traffic by Reach (ktons)
Waterway Reach 2007 2008 2009 2010 2011 2012 1
Change 2011 to 2012
ktons Change
Ohio River ‐ Smi thland LD to Cairo IL 108746 113329 94639 101756 99378 98328 (1049) ‐11 Illinois River ‐ Peoria LD to the Mouth 32868 30212 29569 29267 29735 28324 (1411) ‐47 Missis s ippi River ‐ Cairo IL to Baton Rouge LA 185872 176329 166557 176879 182551 184779 2228 12 Missis s ippi River ‐ StL oui s to Cairo IL 109763 98572 104275 102896 106579 103359 (3219) ‐30 Sour ce US Ar my Corps of Engi n eer s Wa ter bor ne Co mmer c e Sta ti s ti c s Center
1 preliminary 2012
Many of the movements represented in the table above transit more than one of the waterway reaches being considered therefore total tonnage cannot be calculated simply by summing the traffic reported for individual reaches This value was drawn from the 2011 Waterborne Commerce Statistics which indicate that in 2011 the total tonnage moving through these reaches was 2273 million tons Using available transportation rate studies conducted for navigation improvement studies on the Upper Mississippi Illinois and Ohio River it is estimated that this
Page10
Ohi o River - Smith land t o Mouth 2011 coal Il linois River Peoria LD to Mouth 2011 aggregates
2
sulfur clay amp salt 4
o ilseeds 4 co rn
25
corn 6
cr ud e petrol aggregates 0
15
Mississippi River - St Louis to Cairo 2011 coal
coal 19
all other
cru de petrol 2
aggregates 9
sul fu r clay amp saft
3
12 15
salt 4
Mississippi River - Cairoto Baton Rouge 2011
8
Figure 7 Commodity Shmmiddotes by Reach
tollllage moves at an average umiddotansportation rate savings of $25 58 a ton It is therefore estimated that shippers using this segment of the inland wate1way system save a total of $58 billion over the best altemative mode andor route ofumiddotansportation
322 Commodities
Coal is the predominant commodity moving through the Ohio reach (see FIGURE 7) Com is the single m ost dominant commodity moving through the Illinois River reach though products in the all other group represent the maj ority of this Illinois River reach s tollllage Peumiddotoleum products at 45 million tons chemicals and fe1tilizers at 52 million tons and iron and steel products at 22 million tons are the primmy commodities in this group On both reaches of the Mississippi River coal is the lmmiddotgest single commodity by tons closely followed by com Agricultural products (all grains oilseeds vegetable products and feeds) amounted to 61 8 million tons or 34 percent of Cairo to Baton Rouge tollllage and 369 million tons or 35 of St Louis to Cairo tons
Traffic figmes by reach and by commodity shown in TABLE 5 begin to display the impact of both lower agricultmal production and low water levels on wate1way umiddotaffic The Ohio River wate1way reach showed only a slight decline (1 percent) but commodities with mmmiddotkets or som ces on the lower Mississippi and Gulf Coast showed declines in umiddotaffic between 2011 and 2012 typified by the sulfur clay and salt group 6 Salt com and stone all showed significant
6 According to LPMS data coal traffic at LD53 declined from 142 million tons to 12 9 million tons (a 136 percent decline) the latter half of2012 compared with the same period of2011 This fo llowed an 09 million ton increase (72 percent) for the first six months of2012 compared w ith the same period in 2011
Page 11
declines While corn shipment declines could be tied to decreased production lower stone and salt shipments were likely the result of low water conditions that affected the cost of shipment or an ability to delay shipment Oilseeds traffic grew by 25 percent reflecting a late season improvement in soybean harvest
Table 5 Traffic by Major Commodity 2007 - 2011 (ktons)
Waterway Reach 2007 2008 2009 2010 2011 2012 1 Change 2011 to 2012 ktons Change
Ohio River ‐ Smithland LD to Cairo IL 108746 113329 94639 101756 99378 98328 (1049) ‐11
coal 37737 46943 37792 38433 40526 41949 1423 35 crude petroleum 106 53 44 46 145 590 445 3072 aggregates 18394 17445 15703 17303 15437 13569 (1868) ‐121 sulfur clay amp salt 2468 3352 3387 3717 3552 2427 (1125) ‐317 corn 7320 6961 6616 7013 5518 4632 (886) ‐161 oilseeds 4058 3969 5004 5176 4189 5221 1033 247 all other 38664 34607 26093 30067 30012 29941 (70) ‐02
Illinois River ‐ Peoria LD to the Mouth 32868 30212 29569 29267 29735 28324 (1411) ‐47
coal 1597 1548 777 919 1727 1150 (576) ‐334 crude petroleum 15 1 21 6 30 583 554 18635 aggregates 874 499 495 232 564 743 178 316 sulfur clay amp s alt 1169 2090 2282 881 1125 882 (243) ‐216 corn 9839 8017 9643 9137 7549 4934 (2615) ‐346 oilseeds 1940 1650 2637 2769 2503 3808 1305 521 all other 17434 16407 13715 15323 16237 16224 (13) ‐01
Mississippi River ‐ Cairo IL to Baton Rouge LA 185872 176329 166557 176879 182551 184779 2228 12
coal 22208 26629 23326 23648 34122 37163 3041 89 crude petroleum 1383 1848 1852 1901 3984 5764 1780 447 aggregates 17923 18009 17741 18474 16035 14575 (1460) ‐91 sulfur clay amp s alt 5304 7863 7962 6322 6648 4639 (2010) ‐302 corn 35465 28293 30872 31835 28065 20842 (7223) ‐257 oilseeds 17966 17648 23807 25216 21324 28369 7045 330 all other 85622 76039 60998 69483 72373 73427 1055 15
Mississippi River ‐ StLouis to Cairo IL 109763 98572 104275 102896 106579 103359 (3219) ‐30
coal 26428 26228 27127 22262 25589 22290 (3299) ‐129 crude petroleum 375 725 677 891 3229 4847 1617 501 aggregates 9735 8691 8425 8335 7947 8799 852 107 sulfur clay amp s alt 2726 4389 4475 2481 3136 2160 (976) ‐311 corn 26951 19755 23504 23824 20760 14273 (6487) ‐312 oilseeds 9687 8642 12531 12471 10682 15354 4672 437 all other 33861 30142 27536 32632 35236 35638 402 11
Source US Army Corps of Engi neers Waterborne Commerce Stati s ti cs Center
1 Prel imi nary 2012
The Illinois River reach showed the greatest percentage decline between 2011 and 2012 (5 percent) with declines in corn (35 percent) coal (33 percent) and salt (22 percent) showing the largest decreases Coal declines were influenced by the closure of a coal-fired electric utility
Page12
plant in late 20117 Like the Ohio commodities moving to and from the lower Mississippi were most affected The Mississippi River between Cairo and Baton Rouge had sizable declines in salt (30 percent) and corn (26 percent) while oilseed traffic grew (33 percent) The Mississippi River between St Louis and Cairo declined the most in tonnage (32 million tons) with salt and corn both declining by 31 percent Oilseeds increased by 44 percent and stone by 10 percent Given the 51 percent decrease in US corn exports (refer to TABLE 1) it is not surprising that corn traffic to the Gulf would decline when approximately half of all US corn exports move by barge to the lower Mississippi and Gulf Coast The ldquoall otherrdquo commodity group was the least affected by the drought All four river reaches experienced sharp percentage increases in crude oil movements though the tonnages were relatively small in each reach These increases likely reflected the first significant movement of shale gas liquids on the inland waterway system
323 Monthly Shipping Patterns
The Corpsrsquo Lock Performance Monitoring System (LPMS) data has reliable information on tow transits commodity tonnages and barge counts by month at all Corps lock and dam projects Three locksndash Ohio River LD53 Mississippi River LD27 and Peoria LD ndash were selected for closer examination of shipping patterns (discussed in this section) and fleet utilization (discussed in the next section) Ohio River LD53 is the closest Ohio River lock to the mouth of the Ohio River so it offers a fair representation of traffic on the lower reach of the Ohio Similarly Peoria LD is closest to the mouth of the Illinois River and Mississippi River LD27 is the furthest downstream lock on the Mississippi Each offers fair representations of the Peoria to the mouth of the Illinois and St Louis to Cairo reaches of these two rivers respectively
As seen in FIGURE 8 monthly traffic at Ohio River LD53 ranged between 50 million and 70 million tons per month in the years selected for analysis (2007 2011 and 2012)
7 AmerenEnergy closedtheMeredosiaplant inlate 2011Seewwwfuturegenallianceorgcommunity‐cogen201303 accessed26July2013
Page13
8000000
7000000
6000000
5000000
~ 4000000 3000000
2000000
1000000
-
Ohio River LDS3 Traffic by Month
--- ~ -~ V- -
-
-
-
2007
2011
2012
9000000 8000000 7000000 6000000
~ 5000000 ~ 4000000
3000000 2000000 1000000
Mississippi River LD27 Traffic by Month
-
-
-
2007
2011
2012
3000000
2500000
2000000 Ill 1 1500000 01shy
1000000
500000
Peoria LD Traffic by Month
-
-
-
2007
2011
2012
Figure 8 Monthly Traffic at Selected Locks 2007 2011 and 2012
Page 14
Figure 9 Powerhouse at Ohio River LD53 Spring 2011
The range of variation would likely have been tighter except for the high water event in the spring of 2011 (see FIGURE 9) which caused a sharp drop in traffic in May of that year Traffic at Mississippi River LD27 and Peoria LD follows a more cyclical pattern than that shown on the Ohio River July and November are typically peak months at LD27 and July and NovemberDecember at Peoria LD Monthly volumes in 2012 mirrored those of 2011 at both locks though at lower levels particularly in the summer and fall when the drought was most intense
33 Middle Mississippi ‐Traffic Past Thebes Illinois Navigating the Middle Mississippi River between St Louis and Cairo Illinois especially in the vicinity of Thebes Illinois and Grand Tower Illinois was a serious challenge for vessel operators 8 These two stretches experienced low water that exposed rock ledges called pinnacles which exposed vessels to grounding and damage Traffic was restricted to one way for periods in the fall of 2012 and the US Coast Guard imposed tow size and draft restrictions Large towboats that customarily move through these reaches could not navigate the restricted draft around Thebes and Grand Tower Illinois necessitating the shuttling of barges through this reach and refleeting above and below the constrictions
Waterway carriers were apparently determined to satisfy shipper needs as traffic through the restricted reaches at Thebes Illinois was largely unchanged between 2011 and 2012 ( see TABLE 6) Declines in corn traffic related to lower corn production were replaced with higher downbound moves of soybean aggregates and crude petroleum
8 See httpwwwstltodaycomnewslocalmetrolow‐water‐on‐mississippi‐river‐causes‐barge‐companies‐to‐lightenarticle 2b1505f1‐ab93‐5e73‐9a36‐d43ff5c8c0b6html
Page15
Table 6 Waterway Traffic Past Thebes Illinois
2011 2012 LPMS Name Up Down Total Up Down Total
CoalLignite amp Coal Coke 2274342 20849891 23124233 2092647 18825680 20918327 Crude Petroleum 22853 3206496 3229349 29239 4780424 4809663 DistillateResidual amp Other Fuel Oils Lube Oil amp Greases 730648 2305378 3036026 614765 2113449 2728214 Petroleum Pitches Coke Asphal t Naptha and Sol vents 335480 2427538 2763018 342221 3161000 3503221 Ferti l izers 6004043 249240 6253283 5905454 229606 6135060 Other Chemicals and Related Products 2 800 138 2 417 289 5 217 427 2 760 812 2 127 573 4 888 385 Sand Gravel Stone Rock Li mes tone Soil Dredged Material 729938 5715696 6445634 807605 7380288 8187893 Iron Ore and Iron amp Steel Waste amp Scrap 331 790 1 042 578 1 374 368 252 297 918 336 1 170 633 Sulphur (Dry) Clay amp Salt 3020775 114884 3135659 2091825 100469 2192294 Slag 226099 150649 376748 362250 113363 475613 Building Cement amp Concrete Li me Glass 69839 3343391 3413230 76587 3914565 3991152 Primary Iron and Steel Products (IngotsBarsRodsetc) 2077909 414447 2492356 2498038 456312 2954350 Wheat 3366 1640911 1644277 5418 1406811 1412229 Corn 8956 20548560 20557516 327740 13783421 14111161 Oil seeds (Soybean Fl axs eed and Others) 68755 10534468 10603223 91354 15187093 15278447 Animal Feed Grain Mi l l Products Flour Processed Grains 52619 2972138 3024757 79030 2537614 2616644 All Others 1817209 953399 2770608 1833834 976248 2810082 TOTAL 20574759 78886953 99461712 20171116 78012252 98183368 Source Waterborne Commerce Statistics
Note Orange shaded cells denote commodities where declines greater than 1000000 tons were experienced between 2011 and 2012 while green shaded cells denote growth of greater than 1000000 tons between 2011 and 2012
34 Lower Mississippi ‐Traffic at Greenville Mississippi
With flows falling throughout the summer on the heavily used Lower Mississippi River tow groundings began to occur - the first being reported on 11 May 2012 Groundings led the US Coast Guard to restrict drafts and tow sizes on the Lower Mississippi where some reaches required dredging in order for vessels to safely navigate 9 One of the more widely reported events occurred on an 11-mile stretch of the river near Greenville Mississippi where intermittent river closures occurred to accommodate the freeing of grounded tows surveying of channel and dredging to open channel It was reported that on August 20 2012 that nearly 100 tows had been delayed near Greenville waiting for the channel to reopen10 Similar events occurred along the Lower Mississippi in locations including Memphis Tennessee Helena Arkansas and Natchez Mississippi
According to the US Coast Guard 18 groundings led to closure events with more than 25 tows in queues In total these events caused 1130 tows and 17640 barges to be delayed Closures of the river occurred when tows needed to be pulled from bars or banks reassembled after breaking-up upon running aground or when channel work was required Industry worked together to free and re-assemble tows Where groundings became frequent in specific areas the US Coast Guard the US Army Corps of Engineers and industry jointly determined when a river closure was necessary to allow the Corps to survey and dredge the channel and the Coast Guard to reset buoys that mark the channel By June draft restrictions were set at 10rsquo6rdquo northbound tow sizes to 42 barges per tow and southbound tows to 36 barges per tow In early July drafts were down to 9rsquo6rdquo and tow sizes further reduced in late July drafts were restricted to 9rsquo northbound tow sizes to 20 loaded barges per tow and southbound tow sizes to 30 barges per
9 httpcornandsoybeandigestcomissuesforced‐barge‐light‐loading‐low‐mississippi‐river accessed 31July201310 httpearthobservatorynasagovIOTDviewphpid=78927 accessedon31July2013
Page16
Figure 10 Tows delayed due to low-water at Greenville Mississippi August 20 2012 Source NASA See footnote number 7
tow By mid-August one way traffic was instituted in problem reaches drafts were limited to 9rsquo and tow sizes limited further Draft and tow size restrictions were gradually relaxed but it was not until 14 December 2012 that all restrictions were lifted
Like the Thebes Illinois constriction point the Greenville Mississippi constriction did not affect traffic levels in fact traffic increased by 2 million tons between 2011 and 2012 (see TABLE 7) The effects of the low water can be seen in the tons per loaded barge which declined by 46 tons on average for the entire year As with the constriction at Thebes waterway carriers were apparently determined to satisfy shipper needs though this came at higher transportation costs Corn harvests along the Lower Mississippi were less affected by the drought than in the traditional Corn Belt regions served by the Upper Mississippi Ohio and Illinois Rivers which coupled with stronger soybean traffic led to increased traffic through this reach as opposed to more steady traffic through Thebes
Table 7 Loaded Barges Past Greenville Mississippi ndash 2011 and 2012
2011 2012 Difference 2011 ‐ 2012
Loaded Barges 92108 95760 3652 Tons 163314542 165384334 2069792 Tons per Loaded Barge 17731 17271 (46)
Source US Army Corps of Engineers Waterborne Commerce Statistics Center
Page17
700
600
500
400
300
200
100
f- f-
f-f-r-
Ohio River LD53
Tow Counts 2011 amp 2012
r- f-I-- fshy f- f-
r- r- r- r-f- f- f- f-r- r- r- r-
f-f-
f-f-rshy
800
700
600
500
400
300
200
100
r-r-fshy1shy-shy
Mississippi River LD27 Tow Counts 2011 amp 2012
-shyt- t-r- r-r- r-f- fshy1shy 1shy-shy -shy
shyr-r-fshy1shy-shy
t-rshy1shy
fshy1shy-shy
-
400
350
300
250
200
150
100
so
1shy
f-f-tshy-shy
Peoria LD Tow Counts 2011 amp 2012
1shy 1shy r-shyf- f- f-f- f- f-t- t- tshy-shy -shy -shy
1shy
f-f-tshy-shy
Figure 11 Tow Counts at Selected Locks 2011 and 2012
35 Fleet Utilization
The C01ps Lock Perf01mance Monitoring System (LPMS) data was examined at the three gateway locks discussed above this time for evidence of altered vessel operation pattems As seen in FIGURE 11 the effect of the 2011 high water event on the lower Ohio River is reflected in lower tow counts in April and May of that year othetwise tow counts are fairly similar between 2011 and 2012 The droughts effect was more apparent at Mississippi River LD27 an d at Peoria LD where tow counts were down significantly between 2011 and 2012 dming the summer and fall months ---------------------------------------
Page 18
Barges per tow and composition of tows did not change dramatically at any of the three locks between 2011 and 2012 (see TABLE 8) The most significant change occurred at LD53 where barges per tow dropped from 117 per tow to 111 per tow while the percentage of empties increased by 3 percent Tow sizes at LD27 remained around 75 barges per tow and grew slightly from 64 to 67 barges per tow at Peoria LD Significantly fewer loaded barges were processed at each of the three locks
Table 8 Barges Tows and Barges per Tow Selected Locks Ba rge s TOTAL
Tow s Ba rges
pe r Tow Loaded Loaded Empty Empty Tota l LD 53
2007 48592 68 23187 32 71779 7039 102 2008 48009 68 22434 32 70443 6624 106 2009 40352 65 21706 35 62058 5489 113 2010 47030 67 23602 33 70632 5984 118 2011 47465 67 22863 33 70328 6021 117 2012 45064 64 25656 36 70720 6352 111
LD 27 2007 41019 67 20574 33 61593 7217 85 2008 35391 70 15343 30 50734 6456 79 2009 37259 64 20868 36 58127 6753 86 2010 35647 65 19299 35 54946 6792 81 2011 34799 68 16709 32 51508 6909 75 2012 34237 67 16904 33 51141 6713 76
Peoria 2007 15336 67 7519 33 22855 3264 70 2008 13526 69 5981 31 19507 3063 64 2009 13376 64 7677 36 21053 3028 70 2010 13452 65 7402 35 20854 3044 69 2011 13265 67 6621 33 19886 3087 64 2012 12702 67 6185 33 18887 2803 67
The effect on total tons of fewer loaded barges through these locks was heightened by lighter loadings measured in tons per barge (see FIGURE 12) which occurred in the late summer and fall of 2012 At LD27 loadings were down approximately 100 tons per barge in October November and December of 2012 when compared with the same months in 2011 and down approximately 75 tons per barge in October and November at Peoria LD
Page19
Ohio River LDS3 Aver age Barge Loadings
1850 ---------------------shy1800 +-------------------shy1750 -1-------=-------------shy1700
~ 1650 ~ 1600
1550 1500 1450 1400
1850 1800 1750 1700
~ 1650 ~ 1600
1550 1500 1450 1400
1850 1800 1750 1700
~ 1650 ~ 1600
1550 1500 1450 1400
Jan Feb Mar Apr May Jun Jul Aug 5ep Oct Nov Dec Ave
r r-r-r-rshyshy
Mississippi River LD27 Average Barge Loadings
r- r- r-r- r- r-r- r- r-r- r- r-r- r- rshyshy shy shy
r-
r- rshy shy
r- r- r-r- r- rshyshy shy -
Jan Feb Mar Apr May Jun Jul Aug 5ep Oct Nov Dec Ave
-shy
r-rshy-
Peori a LD Average Barge Loadings
r- r-r- r-
r- r- r-r- r- r-r- r- r-r- r- rshyshy shy shy
rshy - r-
r- r- r-r- rshy 1shy
r- r- r-r- rshy shyshy shy -
Jan Feb Mar Apr May Jun Jul Aug 5ep Oct Nov Dec Ave
Figure 12 Average Bar ge L oadings at Selected Locks 2011 amp 2012
The combination of fewer barges per tow and lighter loadings at LD27 and Peoria continued a trend at these two locks of fewer tons per tow (see FI GURE 13) A distinct pattem emerges at LD27 one that minors the pattem of grain shipments Significantly larger tons per tow occur during the peak grain shipping season These cyclical variations occur each year though the peaks an d valleys have smoothed with each passing year In 2012 the cyclical pattem is all but unnoticeable At LD53 the combination of smaller tows a greater percentage of empty barges
Page 20
LDS3 Tons per Tow by Month 2007 -2012
LD27 Tons per Tow by Months 2007 - 2012
Peoria LD Tons per Tow by Month 2007 -2012 10000
9000
8000
7000
6000
~ _ 5000
4000
3000
2000
1000
rJ A AA I IVV1 ~ AAV II1 v
1 y bull
Figure 13 Average Barge Loadings at Selected Locks 2007 - 2012
and somewhat lighter loadings caused tons per tow to drop steeply toward the end of2012 despite an increase ofover 300 tow transits that year
Page 21
36 Summary and Conclusions Traffic patterns were examined on the four high volume waterway segments affected by low water in 2012 With the exception of the Lower Mississippi from Cairo Illinois to Baton Rouge Louisiana each segment experienced lower traffic in 2012 than in 2011 Sharp declines in corn traffic undoubtedly related to a greatly diminished harvest explain most of the traffic decline though carriers continued to maintain volumes otherwise
When looking at monthly traffic levels reported in the LPMS data for the gateway locks to the Ohio Illinois and Upper Mississippi (Ohio River LD53 Peoria LD and LD 27) typical cyclical patterns of shipment are apparent in 2012 but at lower levels Vessel operators ran significantly fewer tows in the summer and fall moved fewer barges at LD27 and Peoria but more barges at OH53 ndash this increase being explained by the increased movement of empty barges Tows pushed fewer loaded barges that were more lightly loaded (100 tons per barge less than average at LD27) The end result was lower traffic at each of these three projects
Unfortunately there is no data equivalent to LPMS available at the constriction points on the Mississippi River at Thebes and Grand Tower Illinois that will describe how vessel operators configured their tows We do know that there were vessel draft restrictions that affected both loadings and the size of towboats as well as tow size restrictions According to the Waterborne Commerce Statistics waterway traffic at Thebes Illinois and Greenville Mississippi changed only slightly between 2011 and 2012 declining by 12 percent at Thebes and increasing by 12 percent at Greenville Average tons per barge declined at both locations for the year We also know from surveys and discussions with vessel operators (discussed in subsequent sections) that fleeting operations were initiated above and below the Middle Mississippi reach between Thebes and Grand Tower Illinois in order to optimize the use of a limited number of smaller towboats required through this reach while still utilizing the larger towboats that typically move through this area
Page22
4 LD27 CLOSURE ANALYSIS
41 General
Mississippi River Locks and Dam 27 (LD27) is located on the Upper Mississippi River at mile 1845 near Granite City Illinois and just above St Louis Missouri It is the 4th busiest lock in terms of tonnage processing 250 million tons of agricultural products 101 million tons of chemicals and 101 million tons of petroleum products in 2012 Three closures of special note occurred at this project in 2012 The first was a main chamber closure which occurred in January of 2012 The second was an emergency closure of both chambers caused by an accident related to low water conditions at the lock The third outage was a planned closure of the main chamber to remove the guide cell damaged during the September accident
The US Army Corps of Engineers Lock Performance Monitoring System (LPMS) collects traffic and processing data from each of its lock projects LPMS data for LD27 was analyzed in order to estimate the cost impact on waterway carriers of all three closures the latter two being directly related to the low-water experienced in 2012 The January 2012 closure analysis offers some perspective when evaluating the economic impact on carriers of the five day outage of the project that was related to low water Section 42 examines the first two closures and Section 43 the third closure that began in 2012 and ended in 2013
42 January and September 2012 Outages
The January 2012 closure was a scheduled closure of the 1200rsquo x 110rsquo main chamber The outage began on 4 January 2012 at 0433 hours and ended when the chamber was reopened on 15 March 2012 at 0039 hours The closure allowed for an embedded metal repair to be completed The main chamber was closed for 1700 hours or approximately 70 days and 20 hours The second closure occurred on 15 September 2012 at 0232 hours when a guide cell was ruptured by a tow allision The resulting gravel spill from within the cell and damage to the guide cell prohibited safe passage through the main chamber A little over 15 hours later at 1527 hours the auxiliary chamber closed resulting in a total river closure Both the main and auxiliary chambers were reopened 20 September 2012 at 0330 hours therefore for 5 days and 3 hours the Mississippi River was completely closed to waterway traffic at LD27
421 Tow Arrivals
FIGURE 14 shows the arrivals per day at LD27 for the months of January ndash September 2012 Average tow arrivals per day for the period outside the closures 15 March through 15 September 2012 was 190 tows per day Average arrivals per day for the first closure period 4 January through 15 March 2012 decreased from the 190 tows per day outside the closure period to 152 tows per day Average arrivals per day for the second closure period 15 September through 20 September 2012 were 116 tows per day versus the 190 tows per day outside the closure period
Page23
Lock 27 Upper Mississippi River Main and Auxil iary Tow Arrivals 2012 Chamber
35 ---------------------------------------------------------~~ Main Chamber Closed
15
10
0 ~--------------~----------------------------------------~~ J an Feb Mar Apr May Jun Jul Aug
5 ++---------------+----------------------------------------~~
Figure 14 LD27 Tow Arrivals 2012
422 Tow Processing Time
During the first closure of the 1200 main chamber that occmTed from Janumy through March 1089 tows umiddotansited LD27s auxilimy chamber The average processing time increased from 48 minutes for all tows outside the Janumy through Mmmiddotch 2012 closure to 78 minutes during the closure
At the beginning of the second main chamber closure from 0020 through 1527 on 15 September 2012 only two tows umiddotansited LD27 auxilimy chamber The average processing time increased from 48 minutes for all tows outside the September closure to 209 minutes during the closure
The 2012 closures increased the processing time 30 minutes per tow The 1091 tows that umiddotansited the auxilimy chamber during the main chamber closures caused an additional549 hours of tow umiddotansit time
423 Tow Delays
FIGURE 15 shows delays at LD27 for the period from Janumy- September 2012 Delays stmied building soon after the 1200 chamber closed and continued until17 Mmmiddotch 2012 at 0110 hours This means that the 1700 hour closure impacted traffic for 1749 hours The 49 hour difference represents the time required for the reopened chamber to serve th e tows in queue and bring the delay back to zero During the impact period 16366 hours of tow delay were experienced by 1148 tows This results in an average delay of 143 hourstow for the first closure in year 2012 from Janumy through March By compmmiddotison 4054 tows were served at
Page 24
LD27 outside the Januruy - Mrumiddotch and September 2012 closure periods The average nonnal delay per tow was 183 minutes or approximately 31 hours Given that the average additional delay per tow was 112 hours for the Januaty - Mrumiddotch closure and that 1 148 tows were impacted the closure caused 12866 hours of additional delay
With the September 2012 closure delays strut ed building soon after the 1200 and 600 chamber closed and continued until 25 September 2012 at 1135 hours This means that the 123 hour river closure impacted traffic for 251 hours The 128 hour difference represents the time required for the reopened chambers to serve the tows in queue and bring the delay back to zero During the impact period 6498 hours of tow delay were experienced by 141 tows This resulted in an average delay of46 hourstow Given that the average nonnal delay per tow was 31 hours the average additional delay per tow was 43 hours for the September closure and that 141 tows were impacted the closure caused 6068 hours of additional delay
A total of 1288 tows were impacted in 2012 which caused an additional delay of 18934 hours Therefore on average each tow experienced 147 hours more delay during the closure than n01mal The maximum delay was 127 hours
Lock 27 Upper Mississippi River Average Hou r ly Tow Delays - Year 2012 Main and
Auxili ary Chamber
120 - Main Chamber Closed
100 80
60
40
1 tJi20
A amp A AIt amp ~~ A middot AIAA 10 ~~~m~~~~m~~~~M~~~~M~~~~M~~~~M~~~~M~~~~M~~~~M~~~~M~~~~M~~~~M~~~~M~~~~M middotmiddot middotshy~~NNNMMVV~~~~~~~~~~~~~OOO~~NNNMMVVV~~~~~~~~~~~~OOO~~NNNMMVVV~~~~~~
~~~ bull -l-l-t-t-41ii~-l-l-t-t-lt-1 -t-t-t-t-t -l~ -t-tNNNlNiNNNN1~NNNNNNN
Jan Feb Mar Apr May Jun Jul Aug Sept
Figure 15 LD27 Average Hourly Delays 2012
424 Cost Impact
The analysis above shows that the Januruy through Mrumiddotch 2012 closure caused an additional 543 hours ofprocessing time and 12866 hours of delay Given this additional transit time and average hourly operating costs for tows at LD27 the Januruy through March closure cost caniers an additional $87 million to process through the lock The September closure caused an additional 5 hours ofprocessing time and 6068 hours of delay for a total closure cost of approximately $39 million While the 70 day closure of the main chamber resulted in additional
Page 25
costs of$124000 per day the much sholier 6 day closure (with 5 days oftotal river closure) cost industry a much higher $550000 per day in delay time
43 December 2012 through March 2013 Main Chamber Closure
The third an d fmal closure at LD27 occmTed between 10 December 2012 and 2 March 2013 when th e C01ps removed the guide cell damaged in September 2012 Removal of the guide cell necessitated closure of the main chamber (and some brief closures of the auxiliruy chamber) The main chamber was closed for 1968 hours or approximately 82 days
431 Tow Arrivals
FIGURE 16 shows the anivals per day at LD27 for the months ofNovember 2012 - April2013 Average tow ruTivals per day for the period outside the closures from 1 Jlme 2012 through 31 May 2013 were 183 tows per day Average ruTivals per day for the closure period 10 December 2012 through 2 March 2013 decreased to 127 tows per day
Lock 27 Upper Mississippi River Tow Arrivals Dec 2012 - Mar 2013
35
30 Main Chamber Closed
25 uj20 amp -uA I ~
I~ ~~ I A ~ I15 ~~ n ~~
~~~ - ~1J vr 1 A10 I
5
0
~
~~~O~~~N~~~~~O~~~N~~~M~~N~~~~~ON~~~~~Om~~~~Om~~N~~~m~~N~~~~~ ~~~~NNN ~~~NNNm NNNm NNN NNNm NNN
Nov Dec Jan Feb Mar Apr
Figure 16 L D27 Tow Arrivals December 2012 - March 2013
432 Tow Processing Time
During the closure of the 1200 chamber 35 of the tows through LD27 had to double cut - the tow fl otilla had to be broken into two pruis an d each prui of the fl otilla locked through separately This increased the average processing time fr om 51 minutes for all tows outside the December 2012 through March 2013 closure to 88 minutes during the closures During the closures 1032 tows tImiddotansited LD27 Given an increase in time of 37 minutes per tow an d 1032 tows an additional 643 hours of tow processing time was experienced during the closure
Page 26
433 Tow Delays
FIGURE 17 shows delays at LD27 for the December 2012 through March 2013 closm e period Delays statted building soon after the 1200 chambers closed on 10 December 2012 at 1530 homs and continued until 4 March 2013 at 0008 hom s This means th at th e 1968 hom closme impacted traffic for 2001 hom s The 33 hom difference represents th e time requir ed for th e reopened chamber to serve th e tows in queue an d bring the delay back to zero Dming the impact period 23058 hom s oftow delay were experienced by 1076 tows (total delay in all of 2011 was 9349 homs) This 23058 homs works out to an average delay of214 homstow for th e closm e period By comparison 5246 tows were served at LD27 outside the closm e period from 1 June 2012 through 31 May 2013 The average non nal delay per tow was 27 1 minutes or approximately 45 hom s Given that the average additional delay per tow was 17 hom s for th e December 2012 - March 2013 closme an d that 1076 tows were impacted the closme caused 18195 homs of additional delay The maximum delay experienced by a tow dming this closme was 805 homs
Minimum Average amp Maximum Tow Delays Lock 27 Upper Miss River
Dec 2012 middotMar 3
90
80
70 -f 60 ~ ~ 50 0 1shy 40 Q) Q
gt- 30 ca Q) 20 0
10
De Jan
Mar bull Minimum bull Average Maximum Apr
Figure 17 LD27 M inimum Maximum and Average Tow Delays December 2012- March 2013
444 Cost Impact
The most recent infon nation available indicates that the average tow transit costs at LD27 are about $648 per hom Given the analysis above which shows that this scheduled closm e caused an additional 643 hom s ofprocessing time and 18195 hom of delay the estimated additional transit time dming the closm e cost a total of $ 122 million
Page 27
Page28
5 SHIPPER RESPONSE
51 Survey Procedures
An OMB-approved Shipper Survey (Control 0710-0001) was used to capture and evaluate shipper reactions to the drought and the emergency closure of LD27 in September (see Appendix A) Shippers were defined as companies that receive commodity traffic transiting through multiple reaches on the Mississippi River The formal shipper survey was conducted between 7 March and 30 May 2013 The purposes of the survey were to find out what measures were taken by industry to mitigate the effects of the drought-related low water and emergency closure at LD27 and to estimate the total costs to industry that resulted from the events
At the outset of the process several steps were adopted for including firms in the survey First a list was compiled that showed the parent companies that operate at docks in the four affected waterways ndash the lower Ohio lower Illinois Middle Mississippi and Lower Mississippi Rivers ndash and that ship through LD27 The parent companyowner of each receiving dock was identified using information available to the Corps and grouped by parent company This allowed an estimate of tonnage by parent companyowner to be formulated Parent companies were then ranked in descending order by their total tonnage received For LD27 and each affected waterway the top 25 ranked by companies by tons shipped were selected to be surveyed Duplicate shippers (shippers that had a top 25 ranking in more than one reach) were included as one survey and the next largest company was added to obtain the top 25 unique companies to survey in the study area In all 125 shippers were sent surveys
Waterborne Commerce Statistics Center (WCSC) data for 2011 was used in assembling basic shipper information All of the contact information for the top ranking companies was determined by comparing several contact lists In the absence of any contact information the Internet was used as a search tool to verify correct contact information for these parent companies The 125 shippers were sent a mail survey followed by a telephone follow-up if the parent company or carrier sent no response after two weeks Stakeholders like the American Corn Growers Association the River Industry Action Council (RIAC) and the Waterways Council Incorporated (WCI) assisted by encouraging firms to respond by sending emails to all members late in the survey to encourage participation
According to survey respondents low water presented the greatest challenge to users of the Lower Mississippi from Cairo Illinois to Baton Rouge and the Middle Mississippi River between St Louis and Cairo Traffic on these two reaches totaled 2024 million tons in 2011
Page29
52 Summary of Shipper Responses
Responses to the survey were received from 73 companies representing a response rate of 59 percent and accounting for 42 percent of total 2011 traffic transiting the affected waterways Questions 1a and 1b were used to help determine if the shipper had any impacts from either the emergency lock closure event at LD27 or from the low water conditions Questions 2 and further into the survey were designed to be answered by shippers who had responded that they were impacted by either or both of these events From question 2 onwards the subset of respondents is less than the total that returned surveys because some shippers indicated that they were not impacted by either event in question An overwhelming percentage of respondents to the shipper survey said they were unaffected by the LD27 closure while half of the respondents indicated they experienced significant effects on operations due to low water In an effort to meet their needs shippers sought other sources for product sought other waterway routes and used overland transportation routes at a cost to responding shippers of $56 million The effect of the drought on agricultural production combined with increased transportation costs resulted in temporary plant closures and lost sales that the responding shippers estimated at $79 million
Page30
6 CARRIER RESPONSE
61 Survey Procedures
The Carrier Survey targeted the major towing companies that used the waterways affected by low water in 2012 (the lower Ohio the lower Illinois the Middle Mississippi and the Lower Mississippi Rivers) Appendix B contains the Carrier survey form The purpose of this survey was to identify carrier responses to the 2012 low water event and the LD27 closure Like the shipper survey the formal carrier survey was conducted between 1 March and 30 May 2013 The purpose of the surveys was to determine what measures were taken specifically by the carriers to adapt to the emergency closure at LD27 and drought conditions and what these measures cost
The firms included in the carrier survey were the 10 largest users of the affected waterways (in tonnage) for the years 2006 through 2010 Responses were received from six companies representing 46 percent of carrier traffic on these waterways According to survey respondents low water presented the greatest challenge to users of the Lower Mississippi from Cairo Illinois to Baton Rouge Louisiana and the Middle Mississippi River between St Louis Missouri and Cairo Traffic on these two reaches totaled 2024 million tons in 2011 Survey respondents accounted for 58 of the tonnage in these two reaches
62 Summary of Carrier Canvas Responses
Once the initial set of shippers and carriers for canvassing was established contacts were identified for each company This information was taken from publicly available sources and in some instances through the assistance of industry associations such as the American Corn Growers Association the River Industry Action Council (RIAC) and the Waterways Council Incorporated (WCI) These organizations were also of assistance in encouraging firms to respond by emailing members late in the survey process to encourage participation
Responses were received from six carriers (60) representing 59 percent of total traffic on the affected waterways All but one of the carriers responding indicated that they were affected by both low water and the LD27 closure with the low water being the more serious challenge Moving cargo during this period required carriers to advance or delay shipments light load vessels (necessitating additional trips) reposition barges throughout the system to accommodate the need for additional barges restrict tow sizes (also necessitating more trips) and perform additional refleeting These altered carrier operations cost responding carriers an estimated $807 million Carriers also experienced $167 million in additional costs due to the LD27 closure and delays and tug costs of $02 million due to tow grounding
Page31
Page32
7 FEDERAL RESPONSE
Federal stewards of the inland waterways were aided by past experiences like the 1988 drought and the low-water event on the Lower Mississippi River in 1997 and advancements in the data provided by the National Oceanographic and Atmospheric Administrationrsquos (NOAA) as well as hydrologic tools used by the Corps to forecast water levels These advancements improved the ability of the Corps and the Tennessee Valley Authority in controlling available water in efforts to keep navigation open on the lower Ohio and on the Mississippi Rivers The US Coast Guard took the lead in creating communication avenues between all stakeholders in managing vessel operation and reaching consensus on channel and vessel operational maintenance during the event According to representatives of the Coast Guard no additional expenditures of funds accompanied their extraordinary efforts
On the Ohio River the Corps of Engineers essentially borrowed resources from other locations to be repaid at some future date No emergency funding was made available Channel surveys were conducted more frequently on known trouble spots sometimes twice weekly The Louisville District estimated that dredging costs were approximately $21 million higher than in a typical year (see TABLE 9) The funds were drawn away from other projects in effect with the promise of repayment in a future year to accomplish work that could not be done as a result of moving funds to the lower Ohio
Table 9 Costs Incurred by the Corps
($millions)
District Added Cost Vicksburg $ 729 StLouis
dredging blasting LD27 1
subtotal
$ $ $
1190 970 097
$ 2257 Louisville $ 207 TOTAL $ 3193
1 Costs to bring LD27 into immediate s ervic e Inc ludes cos t of spud barge temporary helperboat assists and gravel cleanup
Source US Army Corps of Engineers Vicksburg St Louis and Louisville Districts
On the Mississippi River emergency funds were made available by Congress in 2011 in response to the flooding that year and any possible future emergencies The rock pinnacles at Thebes and Grand Tower Illinois were blasted and debris removed at an estimated cost of $97 million At LD27 the spilled gravel from the damaged cell and the cell itself were removed and
Page33
temporary safe passage accommodated at an estimated cost of $10 million11 St Louis District dredging was concentrated on the Middle Mississippi as the Lower Illinois was not severely affected Dredging completed by the Vicksburg District on the main stem Mississippi cost $73 million more than average dredging costs over the last several years
11 The Corps estimates it will cost another $35 million to replace the damaged cell This was not includedin thefederal cost
Page34
8 FINDINGS
Traffic patterns were examined on the four high volume waterway segments affected by low water in 2012 With the exception of the Lower Mississippi from Cairo Illinois to Baton Rouge Louisiana each segment experienced lower traffic in 2012 than in 2011 Sharp declines in corn traffic related to a greatly diminished harvest explain most of the traffic decline though carriers continued to maintain volumes of all other commodities otherwise
When looking at monthly traffic levels reported in the LPMS data for the gateway locks to the Ohio Illinois and Upper Mississippi (LD53 Peoria LD and LD 27) typical cyclical patterns of shipment are apparent in 2012 but at lower levels Vessel operators ran significantly fewer tows in the summer and fall moved fewer barges at LD27 and Peoria but more barges at OH53 ndash this increase is explained by the increased movement of empty barges Tows pushed fewer loaded barges that were more lightly loaded (100 tons per barge less than average at LD27) The end result was lower traffic at each of these three projects
Unfortunately there is no data equivalent to LPMS available at the constriction points on the Mississippi River at Thebes Illinois and Grand Tower Illinois that will describe how vessel operators configured tows by number of barges per tow We do know that there were vessel draft restrictions that affected both loadings and the size of towboats as well as tow size restrictions We also know from surveys and discussions with vessel operators (discussed in previous sections) that fleeting operations were initiated above and below these points in order to optimize the use of a limited number of smaller towboats required through this reach while still utilizing the larger towboats that typically move through this area
The Corps surveyed 125 shippers and ten carriers The 73 shippers that responded represent 42 percent of all shipper traffic transiting the affected waterways Half of the respondents to the shipper survey indicated that they did not experience any significant effects on operations due to low water and an overwhelming percentage said they were unaffected by the LD27 closure Ten carriers were surveyed The six carriers responding represented 46 percent of all carrier traffic transiting the affected waterways All but one of the carriers responding indicated that they were affected by both low water and the LD27 closure with the low water being the more serious challenge The difference in shipper and carrier responses suggests that the shippers were somewhat insulated from these events by the strategic and tactical actions taken by the carriers that minimized impacts on the shippers
Despite lower corn production and a 51 decline in corn exports waterway traffic through the Middle Mississippirsquos rock pinnacles at Thebes Illinois constriction was largely unchanged between 2011 and 2012 (though it is important to remember that the worst low water conditions were experienced from December 2012 through February 2013) Moving cargo during this period required carriers to advance or delay shipments light load vessels (necessitating additional trips) reposition barges throughout the system to accommodate the need for additional barges restrict tow sizes (also necessitating more trips) and perform additional refleeting It cost responding carriers an estimated $807 million to alter operations in this fashion (see TABLE
Page35
10) The carriers also faced $167 million in additional costs as a result of the LD27 closures and delays and tug costs of $02 million due to tow groundings Despite these actions shippers did not escape the effects of the low water In an effort to meet their needs shippers sought other sources for product sought other waterway routes and used overland transportation routes at a cost to responding shippers of $559 million The effect of the drought on agricultural production combined with increased transportation costs resulted in temporary plant closures and lost sales that the responding shippers estimated at $790 million
Table 10 Survey Results - Low Water Cost Impacts
Cost Category Cost ($000) Transportation cost impacts
Carrier cost impacts Delays due to LD27 clos ure 16100 $ Other costs due to LD27 clos ure 573$ Groundings 164 $ Altered operations 80723 $
Shipper cost impacts 55860 $ SUBTOTAL 153419$
Production cost impacts 79000$ TOTAL 232419$
Page36
9 CONCLUSIONS
Several observations can be made from an examination of the traffic data obtained from LPMS and WCSC sources and responses generated from the surveys of the navigation industry The obvious message is that a system that is not operating at a level of reliability expected by users will have economic consequences Resulting increases in transportation costs andor delays to the transportation of commodities will have an effect on the marketplace Either the producer will pay more thus reducing expected profit associated with their products or the end user will experience higher commodity prices at the market once prices are adjusted
The low water the 5-day closure of LD27 in September 2012 and the subsequent 82 day closure of the main chamber between December 2012 and March 2013 imposed additional transportation costs of $1534 million just on the companies that responded to the Corpsrsquo surveys Drought andor low water accounted for another $790 million in production losses bringing the total reported impact to $2324 million Shipper survey respondents averaged $098 per ton in production losses and $080 per ton in increased transportation costs as they shifted to other modes and routes These values were applied to tonnage not accounted for through the sample or for which no response was given Carrier survey respondents provided a range of cost impacts $009 per ton for production loss $0005 per ton for non-delay related operations during the LD27 closure $0001 per ton related to grounding logistics and $069 in added transit costs Using these values a simple extrapolation of the sample to the population of movements using the most affected waterways (the Middle Mississippi and Lower Mississippi River) either not sampled or not responding suggests that additional transportation costs totaled $2770 million and production impacts amounted to $1652 million for a total impact of $4422 million12
Table 11 Low Water Cost Impacts from 2012 Event (Costs in $000)
Cost Category Survey
Responses
Estimate for Firms Not
Responding Not Surveyed TOTAL
Transportation cost impacts Carrier cost impacts
Delays due to LD27 closure 1 $ 16100 ‐$ $ 16100 Other costs due to LD27 closure $ 573 417 $ $ 990 Groundings $ 164 119 $ $ 283 Altered operations $ 80723 58719 $ $ 139442
Shipper cost impacts $ 55860 64277 $ $ 120137 SUBTOTAL $ 153419 123532 $ $ 276951
Production cost impacts 2 $ 79000 86248 $ $ 165248 TOTAL $ 232419 209780 $ $ 442199
1 I ncl udes del a y cos t experi enc ed due to LD27 ma i n cha mber cl os ure Dec 2012 ‐Ma r 2013 to remove dama ged cel l
2 I ncl udes ec onomi c impact of reduced corn producti on and hi gher tra ns porta ti on cos ts due to low‐wa ter
12 It is important to remember that not all waterways affected by the drought were covered by this survey
Page37
Using available transportation rate studies conducted for navigation improvement studies on the Upper Mississippi Illinois and Ohio River it is estimated that this tonnage moves at an average transportation rate savings of $2558 a ton Therefore at 2011 traffic levels total savings on these rivers would likely have been an estimated at $58 billion dollars The three most affected Corps of Engineers districts expended $319 million to keep the lower Ohio lower Illinois Middle Mississippi and Lower Mississippi river channels open to navigation in extreme drought conditions enabling shippers to continue navigation While industry faced losses of an estimated $2770 million due to increased transportation costs through the cooperative and coordinated efforts of the Corps the Coast Guard and industry partners shippers and the Nation were able to realize a savings in transportation costs of an estimated $55 billion despite this extreme low water event
Page38
APPENDIX A ndash SHIPPER QUESTIONNAIRE
PageA‐1
OMB Control 0710-0001 Expiration date 02282015
2012 DROUGHTLOCK 27 CLOSURE ndash SHIPPER SURVEY
Date
Firm
Address
Phone
FAX
Point of Contact
Title
General Description of Firm and Products Produced
NOTE ALL RESPONSES WILL BE TREATED AS CONFIDENTIAL
1 Was your company impacted by the closure event at Lock 27 in 2012 Yes No Was your company impacted by low water associated with the Drought Low water conditions in 2012 Yes No (If no interview is complete)
2 Does your company have a response plan for these types of impacts If so did it result in additional work organization to implement or was it detailed enough to cover all the impacts
1
PageA‐2
OMB Control 0710-0001 Expirat ion date 0228201 5
2012 DROUGHTLOCK 27 CLOSURE- SHIPPER SURVEY
LD27 closure
only Low
wate1middot Descriptio n of Response
a No change in procedmes b Stockpiled product and waited for traffic to clear if closme or changed loading depth in barges for low wat er c Switched to all-overland mode for product delivety from existing somces d Switched to different watervray routing for product delivety from existing somces e Switched product somce to an entirely new somce f Ceased operations dming the period g Altered production during the period h Switched production to another facility i Purchased intermediate or final product rather than produced j Other or combinations of the above (Please explain)
3 During th e 2012 event (either Low water or Lock 27 closure) what was your companys response Please indicate with an x in the appropriate box
4 Ifyou have checked c or d in question 3 please complete the following table
Movement Commodity Affected tonnage
Origin (City State)
Destination (City State)
Deliverd $ ton
plio1middot to drou2ht
Delivered $to n
during drou2ht
Examples
I Com 12000 Minneapolis New Orleans $30 $35
MN LA
2 Lube oils 4000 Houston TX Huntington wv $40 $50
2
PageA-3
OMB Contro l 0710-0001 Expiration date 02 282015
2012 DROUGHTLOCK 27 CLOSURE - SHIPPER SURVEY
5 Ifyou checked e in question 2 please complete the following table
Movement Commodity Affected tonnage
P reshydrou ght Origin
(City State)
Ch an ged Origin
(City State)
Destination (City State)
Deliver d $ton
pri01middot to drought
Delivered $ton
dming drought
Examples
1 Com 12000 Minneapolis MN
Cincinnati OH
New Orleans LA
$30 $35
2 Lube oils 4000 Houston TX Ashland KY
Pittsburgh PA $40 $50
6 Ifyou checked response a orb lmder question 3 how were your total production costs affected during the period of closure at Lock 27 or Drought-related low water (total increase in cost if applicable) Please explain
7 Ifyou checked response f under question 3 what was the total estimated loss to your fi1m as a result of ceasing production (during the closure period at Lock 27 or Drought)
3
Page A-4
OMB Control 0710-0001 Expiration date 02282015
2012 DROUGHTLOCK 27 CLOSURE ndash SHIPPER SURVEY
8 If you checked response ldquogrdquo under question 3 what was the total estimated loss to your firm as a result of altering production processes (during the closure period at Lock 27 or Drought)
9 If you checked response ldquohrdquo under question 3 what was the total increase in costs to your firm as a result of changing production locations (during the closure period at Lock 27 or Drought)
10 If you checked ldquoirdquo under question 3 to what extent did purchasing intermediate or final product increase your companyrsquos total costs (during the closure period at Lock 27 or Drought)
11 If you checked response ldquojrdquo under question 3 to what extent did the other measures or combination of measures undertaken as a result of the closure increase your companyrsquos total production costs (during the closure period at Lock 27 or Drought)
4
PageA‐5
OMB Control 0710-0001 Expiration date 02282015
2012 DROUGHTLOCK 27 CLOSURE ndash SHIPPER SURVEY
12 Have these events (drought-related low water or Lock 27 closure) caused your company to alter its long-term transportation strategy (eg switch to all-overland modes increase stockpiles etc) How will this impact your total commodity transportation or other costs (per year) Please explain
13 Has the (drought-related low water or Lock 27 closure) caused your company to take any other long-term permanent measures Please explain How will this affect your companyrsquos long-term operating costs (per year)
14 Has your company been impacted by other navigation system disruptions this shipping season (these would be other than the Low water from the drought or the Lock 27 closure)
5
PageA‐6
Event Date 2 Short-term response 3 Long-term responseExample
McAlpine closure
Jan ndash Feb 2006 Diverted to overland modes
none
OMB Control 0710-0001 Expiration date 02282015
2012 DROUGHTLOCK 27 CLOSURE ndash SHIPPER SURVEY
15 If your company has experienced significant navigation disruptions1 prior to this shipping season please complete the following table
1 Significant navigation system disruptions are defined as disruptions that result in delays to your shipment of more than 48 hours (include scheduled and unscheduled lock outages accidents and low and high water events)
2 Short term response refers to the response actions detailed in question 2 a No change in procedures b Stockpiled product and waited for traffic to clear or light loaded for low water c Switched to all-overland mode for product delivery from existing sources d Switched to different waterway routing for product delivery from existing sources e Switched product source to an entirely new source f Ceased operations during the period of closurelow water g Altered production during the period of closurelow water h Switched production to another facility i Purchased intermediate or final product rather than produced j Other or combinations of the above (Please explain)
3 Long term response refers to a modification of your long term business plan to include altering your long-term transportation strategy (eg switch to all-overland modes increase stockpiles etc) Other long term responses might include sourcing commodities at alternate sites or moving production activities to a different location
6
PageA‐7
PageA‐8
APPENDIX B ndash CARRIER QUESTIONNAIRE
[Typetext] PageB‐1
Waterway Carrier Interview Questions Effects of the 2012 Drought and LD27 Closure
Name of towing company -----------shyLocatio n -----------Name and title of Point of Co ntact ----------------shyPhone number ( )________ email _________
PART 1 LOW WATER DUE TO DROUGHT CONDITIO NS
1 Did your firm experience a reduction in tonnage carried on the Mississippi Ill ino is or Ohio waterways in 2012 Please verify data fo r 2010 and 2011 indicating your estimates for 2012 in table below
Operat o r Traffic Destined fo r Lower Mississippi Ports (2010 and 2011 from WCSC)
Origin 2010 2011 2012
Mississippi above St Louis Mississippi St Louis to Cairo Mississippi south of St Louis Ill inois River Ohio River
2 What facto rs led to changes in t raffic between 2011 and 2012 For example drought condit ions that affected agricultural production low water that affected your abi lit y to operate efficiently loss or gain of a contract(s) increased competit ion from rail or other factors - please specify and ind icate re lative weight of each
3 Have you had to change the way you operate your vessel fleet due to the drought If so what changes did you make and when did these occur
1
[Type text] Page B-2
4 The t wo ta bles below are intended to describe how your operat ions are affected by water depth a nd flows on the Cairo - St Louis reach of the Mississippi Rive r
a Do the operat ionalchanges suggested in t he tables below for the Cairo - St Louis reach (Upper Reach) describe the way you would operate given t he gage readings and flow shown for these two reaches in t he t ables If yes please indicate in the appropriate box in the table below with a Y if no please indicate what restrict ions you impose on your operations given t he gage and flow readings provided
Upper Rea ch- Navigation Restriction
St Louis Gage Reading
Flow (CFSOOO)
Navigation Restriction
Carriers Nav Restriction Followed
Above 20 Above 90 No restriction 00 to 20 74 to 90 25 barges -25 to 00 55 to 74 20 barges -35 to -25 485 to 55 16 barges -40 to -35 46 to 485 85 ft draft -45 to shy 4 0 44to47 80 ft draft Below -45 Below 44 Navigat ion halts
b What is t he number of tows- by size of tow horsepower and draft - that you operate through the St Louis to Cairo reach of the Mississippi For each foot of draft t hat is lost what is your added cost per t rip Please use the table below in making your response
Upper Reach- Tows moved thru the St Louis- Cairo reach in 2011 (or year not affect ed by low water)
Tow size Towboat Horseshypower
Barge Draft
Cost ton of loading below desired barge draft
Barges tow
No of tows 05 10 15 20 25 30 35 4 0
1 - 8 9 - 15
16 - 19 17 - 20 21- 25
gt25
2
[Type text] Page B-3
5 The t wo tables below are intended to describe how your operat ions are affect ed by water depth a nd flows on the Mississippi River sout h of Cairo
a Do the operat ional changes suggested in t he tables below for the Lower Reac h of the Mississippi River sout h of Cairo describe the way you would operate given the gage readings and flow shown for these two reaches in the tables If yes please indicate in t he appropriate box in t he table below with a Y if no please indicate what rest rictions you impose o n your operations given the gage and flow readings provided
Lower Reach- Navigation Restriction
Cairo Gage Reading
Flow (CFS in OOOs)
Navigation Restrictions
Carriers Nav Restriction Followed
Above 118 Above 189 No restriction 60 to 118 111 to 189 25 barges per tow
50 to 60 95 to 111 85 ft draft and 20 barges
35 TO 50 805 to 95 8 ft draft and 12 barges
Below 35 Below 805 Navigation halts
b What is t he number of tows- by size of tow horsepower and draft - that you operate on the Lower Reach of t he Mississippi south of Cairo For each foot of draft t hat is lost what is your added cost per trip Please use t he table below in making your response
Lower Reach- Tows moved through the reach south of St Louis in 2011 (or a yea r not affected by low water)
Tow size Towboat Barge Cost ton of loading below desired barge draft
Barges tow
No of tows
Horseshypower
Draft 05 10 15 20 25 30 35 4 0
1 - 12 13 - 16
17 - 20 21- 25 gt25
6 If you light load due t o low water would you proceed entire t rip as originally light loaded or top off
below Cairo or maybe add additional barges to w here the normal t ons per horsepowe r ratio is
achieved If latter how would this be done and at what cost
3
[Type text] Page B-4
7 Did any of your tows experience a grounding If yes how many total occurrences did you experience and what was the impact on your firm Please indicate your response below
total groundings
events with tows delayed more than 8 hours cost of delays
events involving lightering cargo cost of lightering
events involving towboat assists cost of towboat assists
8 What was major impact of low water due to the drought in terms of effect on your operations ‐
increased operating cost Lost business Equipment damage Safety concerns Groundings
Efficient dispatch of fleet Others
9 Please indicate the economic impact of low water levels on your company in the table below (please
include figures from your response to 5 above)
Indicate Cost with an ldquoXrdquo
if this applies to your firm
Description of impact Costton Tons
Affected Total cost
Increased transit time (including delays) Increased cost due to restricted tow sizes Increased costs due to light loading Idle vesselslost revenue Damaged equipment Increased managementlogistics costs Other (please specify)
4
[Typetext] PageB‐5
PART 2 CLOSURE OF LD27
10 If you have tows already at the lock do you generally wait until it reopens
11 What is typical amount of time you will wait at a lock for it to reopen before you decide to do
something else What do you do if you decide not to wait any longer What factors affect this
decision If you re‐dispatch the tow what does this cost
12 If you have tows underway in the system and a closure occurs at a lock to be transited do you
continue to the closure point wait elsewhere or re‐dispatch the tow What factors affect this decision
13 Please indicate the economic impact of the closure of LD27 on your company in the table below
Indicate Cost with an ldquoXrdquo
if this applies to your firm
Description of impact Costton Tons
Affected Total cost
Delay costs at the lock Delays in place (dock or port) Idle vesselslost revenue Increased managementlogistics costs costs (including re‐dispatching) Other (please specify)
PART 3 FINAL COMMENTS
14 Do you have any other information that would help us describe and quantify the economic impact on
waterway carriers associated with low water due to the drought of 2012 andor the closure of LD27
5
[Typetext] PageB‐6

___________________________________________________________
it is estimated that shippers using this segment of the inland waterway system save a total of $58 billion over the best alternative mode andor route of transportation The Coast Guard devoted additional resources to the helping manage the low water event but did not incur measurable additional expenditures of funds The three most affected Corps of Engineers districts expended $319 million to keep the lower Ohio lower Illinois Middle Mississippi and Lower Mississippi river channels open to navigation in the face of a severe drought While industry faced losses of an estimated $2770 million due to increased transportation costs shippers and the Nation were still able to realize a savings in transportation costs of an estimated $55 billion despite this extreme low water event These savings would have been in even greater jeopardy without the cooperative and coordinated efforts of the Corps the Coast Guard and industry partners
ES ‐ iv
Contents 1 PURPOSE AND INTRODUCTION 1
2 BACKGROUND 3
21 Drought 3
22 Low Water 5
3 WATERWAY TRAFFIC 9
31 General 9
32 Traffic Patterns 9
321 Waterway Reaches and States 9
322 Commodities 11
323 Monthly Shipping Patterns 13
33 Middle Mississippi - Traffic Past Thebes Illinois 15
34 Lower Mississippi - Traffic at Greenville Mississippi 16
35 Fleet Utilization 18
36 Summary and Conclusions 22
4 LD27 CLOSURE ANALYSIS 23
41 General 23
42 January and September 2012 Outages 23
421 Tow Arrivals 23
422 Tow Processing Time 24
423 Tow Delays 24
424 Cost Impact 25
43 December 2012 through March 2013 Main Chamber Closure 26
431 Tow Arrivals 26
432 Tow Processing Time 26
433 Tow Delays 27
444 Cost Impact 27
5 SHIPPER RESPONSE 29
51 Survey Procedures 29
52 Summary of Shipper Responses 30 ___________________________________________________________
___________________________________________________________
6 CARRIER RESPONSE 31
61 Survey Procedures 31
62 Summary of Carrier Canvas Responses 31
7 FEDERAL RESPONSE 33
8 FINDINGS 35
9 CONCLUSIONS 37
APPENDIX A ndash SHIPPER QUESTIONNAIRE 1
APPENDIX B ndash CARRIER QUESTIONNAIRE 1
___________________________________________________________
LIST OFTABLES
Table 1 US Corn and Soybean Production and Exports 4 Table 2 US Corn and Soybean Production 2010 ndash 2012 9 Table 3 Shipments and Receipts by State 10 Table 4 Traffic by Reach 10 Table 5 Traffic by Major Commodity 2007 - 2011 12 Table 6 Waterway Traffic Past Thebes Illinois 16 Table 7 Loaded Barges Past Greenville Mississippi ndash 2011 and 2012 17 Table 8 Barges Tows and Barges per Tow Selected Locks 19 Table 9 Costs Incurred by the Corps 33 Table 10 Survey Results - Low Water Cost Impacts 36 Table 11 Low Water Cost Impacts from 2012 Event 37
LIST OFFIGURES
Figure 1 The Mississippi River Basin 3 Figure 2 Extent and Depth of 2012 Drought 5 Figure 3 Water Levels in Memphis ndash 2011 and 2012 6 Figure 4 Mississippi River Stages at Vicksburg Mississippi 6 Figure 5 Groundings through 28 November 2012 as reported by the US Coast Guard 7 Figure 6 Removal of stone at rock pinnacle 8 Figure 7 Commodity Shares by Reach 11 Figure 8 Monthly Traffic at Selected Locks 2007 2011 and 2012 14 Figure 9 Powerhouse at Ohio River LD53 Spring 2011 15 Figure 10 Tows delayed Due to Low-water at Greenville Mississippi August 20 2012 17 Figure 11 Tow Counts at Selected Locks 2011 and 2012 18 Figure 12 Average Barge Loadings at Selected Locks 2011 amp 2012 20 Figure 13 Average Barge Loadings at Selected Locks 2007 - 2012 21 Figure 14 LD27 Tow Arrivals 2012 24 Figure 15 LD27 Average Hourly Delays 2012 25 Figure 16 LD27 Tow Arrivals December 2012 ndash March 2013 26 Figure 17 LD27 Minimum Maximum and Average Tow Delays December 2012 ndash March 2013 27
___________________________________________________________
1 PURPOSE AND INTRODUCTION
Lower than normal precipitation in the Mississippi River Basin recorded in the winter and spring of 2012 was an early indicator of what evolved into drought conditions throughout much of the basin Field crops in Midwestern states experienced extreme conditions of stress Reservoirs provided maximum supplies under approved operating procedures to augment flow for water quality and supplies and for inland navigation on the Mississippi River in particular Both the drought and accompanying low water on the Mississippi River were widely reported by local and national media outlets throughout 2012 Agricultural and navigation interests were the focal point of the Nationrsquos concern as the Corp of Engineers and the US Coast Guard employed extraordinary measures to keep shipping lanes safe and open These measures while mitigating the adverse circumstances to some extent did not prevent waterway stakeholders from absorbing additional costs
The Corps of Engineers decided to formulate an estimate of these costs in order to better understand the importance of these major waterways to commercial users A major part of this effort was a survey of both waterway carriers and shippers dependent upon the high traffic volume waterways that experienced low water conditions (the affected waterways were the Mississippi River (the Mississippi River between St Louis Missouri and Cairo Illinois and between Cairo and Baton Rouge Louisiana) the lower Illinois River and the lower Ohio River) Surveys sent to carriers and shippers were designed to elicit economic impact information related to this protracted period of low water to include the river closure due to the accident at LD27
This report focuses on the impact of the low flows on major commercial cargo arteries in the Mississippi River Basin ndash specifically the Mississippi Ohio and Illinois Rivers ndash and estimates economic impacts from drought-related low flows and associated unexpected closure of Locks and Dam 27 Costs incurred by the Federal government specifically the Corps of Engineers are reported to the extent they are available
This study relied upon readily available data from public Corps of Engineers and US Coast Guard sources to describe river conditions events that occurred as a result of low water conditions and efforts to manage vessel traffic A targeted survey of inland waterway carriers and shippers was used to estimate the economic effects of interruptions and disruptions to navigation that occurred as a result of the drought and associated low water conditions
Page1
Page2
Figure 1 The Mississippi River Basin
2 BACKGROUND
21 Drought
The drought of 2012 affected much of the Mississippi River Basin whose major streams are corridors of inland waterway commerce in the Midwest and Plains states (see FIGURE 1) Four waterway reaches that experienced low water conditions and carry bulk commodities in excess of 25 million tons annually were identified for closer examination in this study 1) the Ohio River between Smithland LD and the mouth of the Ohio River 2) the Illinois River between Peoria LD and the mouth of the Illinois 3) the Mississippi River between the confluence of the Ohio River and Baton Rouge Louisiana and 4) the Mississippi River between St Louis Missouri and the confluence of the Ohio In 2011 shippers in 20 states moved commodity through the four reaches with ten different states (Arkansas Illinois Indiana Kentucky Louisiana Missouri Mississippi Ohio Tennessee and West Virginia) in the top five in shipping or receiving commodities in one or more of these reaches
The US Department of Agriculture estimated that nearly 80 percent of agricultural land was affected by drought in 2012 with 70 ndash 75 percent of the corn and soybean production affected by severe or greater drought By September 2012 over 2000 counties were
Page3
designated disaster areas by USDA3 In the Midwest the drought destroyed or damaged corn and soybean crops in particular ndash both the region and producers of these commodities being served by the inland waterway system Corn production declined by 13 percent between the 2011 and 2012 marketing year soybeans by 3 percent and corn exports fell by 51 percent (see TABLE 1)
Table 1 US Corn and Soybean Production and Exports (in millions of bushels)
Ma rke t Ye a r 1 Production
Cha nge from
pre vious ye a r Ex ports
Cha nge from pre vious
year
200708 1303788 -- 243740 --200809 1209165 -7 184895 -24 200910 1309186 8 198002 7 201011 1244687 -5 183417 -7 201112 1235961 -1 154260 -16 201213 1078030 -13 75000 -51
Sourc e USDA Economic Research Service Feed Outlook 1 market year is from September to August
US Soybe a n Production a nd Ex ports 2007 to 201213
(in millions of bushels)
Market Year 1 Production
Cha nge from
previous year Ex ports
Change from
pre vious year
200708 267712 -- 115883 --
200809 296701 11 127929 10
200910 335901 13 149905 17
201011 332918 -1 150094 0
201112 309352 -7 136185 -9
201213 301500 -3 134500 -1
Source USDA Ec onomic Res earch Servic e US Oilcrops Yearb ook
1 market y ear is from September to August
Drought in western Texas spread throughout most of the Great Plains and into the lower Ohio Valley through the spring of 2012 (see FIGURE 2) and winter months of 2013 Extreme and Exceptional drought was persistent in the Great Plains states of South Dakota Nebraska Kansas Oklahoma and northern Texas ndash all major agricultural producing areas Extreme drought reached into the Midwest states in particular southern Minnesota Iowa Illinois Indiana and Missouri ndash all major producers of corn and soybeans4 The wheat crop
3 See the USDA Economic Research Service ldquoUS Drought 2012 Farm and Food Impactsrdquo athttpwwwersusdagovtopicsin‐the‐newsus‐drought‐2012‐farm‐and‐food‐impactsaspx4 Extremedroughts arecharacterized bycrop losses and widespread water shortages or restrictionsExceptionaldroughts are characterized by widespreadcroplosses shortages of waterinreservoirsstreamsand wellscreatingwateremergenciesSeehttpdroughtmonitorunleduclassifyhtm
Page4
was largely spared as it was harvested in late spring prior to the drought taking hold in these states
Figure 2 Extent and Depth of 2012 Drought
22 Low Water
In addition to agriculture the 2012 drought affected water supplies for industrial and municipal uses recreation and the ability to navigate on the Mississippi River and its navigable tributaries Small harbors and terminals saw rivers fall to levels not experienced in nearly 50 years (see FIGURE 3)
Page5
Figure 3 Water Levels in Memphis ndash 2011 and 2012
Figure 4 Mississippi River Stages at Vicksburg Mississippi
Low water conditions rivaled those observed during the 1988 drought event By November 2012 water levels on the Mississippi River fell below those experienced in 1988 (see FIGURE 4) Beginning in May 2012 the Mississippi River stage reached the lowest level observed in the past 112 years Heavy rain and flooding in the Mississippi River Basin ended the low water problems in March 2013
Page6
Figure 5 Groundings through 28 November 2012 as reported by the US Coast Guard
Low water on these major waterway transportation arteries hampered navigation Tows accustomed to wide and deep navigable channels began to suffer from groundings along the length of the Mississippi River (see FIGURE 5) At Mississippi River LD27 water levels fell below the armor-protected area of sheet pile guide cells What would ordinarily be routine impacts on the guide cell as tows aligned to enter the locks led to failure of the cell as impacts occurred on unprotected regions of the sheet pile protectionguide cell Failure of the cell and subsequent clean-up of gravel spilled from the ruptured cell resulted in closure of the Mississippi River at the location of LD27 for approximately five days from 14 September 2012 until 20 September 2012
Groundings of tows occurred along nearly the entire length of the Mississippi River and were especially problematic along the border of northern Illinois between Thebes and Grand Tower Illinois and in the general vicinity of Greenville Mississippi According to the US Coast Guard 18 groundings on the Lower Mississippi led to closure events with more than 25 tows in queues River closures became necessary when tows stuck in shallow water had to be removed when tows broke apart and barges had to be retrieved and reassembled or when it was determined that the channel needed to be surveyed dredged and channel buoys reset
Page7
Figure 6 Removal of stone at rock pinnacle
Water levels on the Mississippi River at Thebes Illinois and at Grand Tower Illinois exposed rock ledges that reduced navigable drafts to 9 feet (well below customary drafts of 10 and 11 feet) and restricted the channel to one-way traffic5 The Corps removed these hazards in early 2013 (see FIGURE 6)
5 According to the US Army Corps of Engineers St Louis District River Projects Manager there was one‐way traffic at the pinnacles with 12 hour closures each day during the removal from 1Jan 2013 to roughly 15 February 2013 There were also other reaches of the river where there wasinsufficientchannelwidthof therequireddepthto permit two‐way traffic
Page8
3 WATERWAY TRAFFIC
31 General
Waterway traffic examined in this section focuses on the Lower Mississippi River and lower reaches of the Upper Mississippi Illinois and Ohio Rivers While the drought also seriously affected waterways in the southwest and the Missouri River traffic flows on these other rivers is relatively small in comparison with the Mississippi Illinois and Ohio Rivers Comparable data through December 2012 was available from the US Army Corps of Engineers Waterborne Commerce Statistics (WCS) and Lock Performance Monitoring System (LPMS) data sets for convenience of comparison only data through December 2012 is examined in this section of the report
32 Traffic Patterns
With the exception of Minnesota major grain and oilseed producing states saw sharp percentage declines in production that exceeded what was a national decline (See TABLE 2) All of these major producing states are touched by navigable waterways The expectation is that this diminished production of corn and soybeans should be reflected in decreased waterway traffic in these commodities
Table 2 US Corn and Soybean Production 2010 ndash 2012
IL IN IA MN MO NE OH US Corn (000s bushels)
201000 1946800 89804000 2153250 1292100 369000 1469100 533010 12446865 201100 1946800 839500 2356400 1201200 349980 1536000 508760 12359612 201200 1286250 596920 1876900 1374450 247500 1292200 448950 10780296
change 2011 ‐ 12 ‐339 ‐289 ‐203 144 ‐293 ‐159 ‐118 ‐128 Soybeans (000s bushels)
201000 466075 258505 496230 328950 210405 267750 220320 3329181 201100 423225 240695 475345 274560 190165 261360 217920 3093524 201200 383560 223590 413850 300570 155170 207085 206100 3014998
change 2011 ‐ 12 ‐94 ‐71 ‐129 95 ‐184 ‐208 ‐54 ‐25 Source Crop Production 2012 Summary USDA National Agricultural Statis tics Service January 2013
321 Waterway Reaches and States
Four waterway reaches that experienced low water conditions and carry bulk commodities in excess of 25 million tons annually were identified for closer examination in this study 1) the Ohio River between Smithland LD and the mouth of the Ohio River 2) the Illinois River between Peoria LD and the mouth of the Illinois River 3) the Mississippi River between the confluence of the Ohio River and Baton Rouge Louisiana and 4) the Mississippi River between St Louis Missouri and the confluence of the Ohio In 2011 shippers in 20 states moved commodity through the four reaches with ten different states (Arkansas Illinois Indiana Kentucky Louisiana Missouri Mississippi Ohio Tennessee and West Virginia) in the top five in shipping or receiving commodities in one or more of these reaches (see TABLE 3)
Page9
Table 3 Shipments and Receipts by State
State
Ohio River ‐ Smithland LD to Cairo IL
Illinois River ‐ Peoria LD to the Mouth
Mississippi R ‐ Cairo IL to Baton Rouge LA
Mississippi River ‐ StLouis to Cairo IL
ship receive ship receive ship receive ship receive AL 1435 4 049 214 489 1340 2351 337 1840 AR 470 972 139 157 6634 6628 235 1336 FL ‐ 41 ‐ 6 30 151 2 64 IA 292 308 23 5 5088 1532 5380 2397 IL 27819 4 477 19 170 11 428 45735 10171 49496 14764 IN 5738 14523 686 863 4994 2713 595 3794 KY 26306 10540 214 438 20 197 6 953 902 1 465 LA 16743 37420 6782 13629 44 026 114 919 14 816 58 194 MN 173 122 14 149 4 860 2 384 5 048 3 021 MO 1992 683 938 152 21 414 3 750 25 302 5 681 MS 697 1383 175 104 4 473 4 508 264 1 005 NE ‐ ‐ ‐ ‐ 8 13 8 13 NY ‐ ‐ ‐ ‐ 2 ‐ ‐ ‐
OH 2940 9188 126 112 2011 4956 710 1939 OK 192 260 138 88 2795 2391 189 240 OT ‐ ‐ ‐ ‐ ‐ 10 ‐ 10 PA 1143 2266 12 54 860 1848 240 101 TN 2494 9005 82 719 5770 9870 257 6200 TX 2930 954 874 1257 5034 5046 1 017 2 996 WI 29 2 ‐ 4 633 243 664 975 WV 7984 3184 146 79 6650 2117 1115 542
Sour c e US Army Corps of Engi neer s Wa terbor ne Commer ce Sta ti s ti cs Center
Note OT (Other) designates moves to unidentified states
Between 2011 and 2012 the Illinois reach experienced the greatest percentage decline in traffic (47 percent) and the Mississippi River between St Louis and Cairo Illinois experienced the greatest tonnage decline at just over 32 million tons (see TABLE 4) The Mississippi River below Cairo Illinois actually showed an increase in traffic between 2011 and 2012
Table 4 Traffic by Reach (ktons)
Waterway Reach 2007 2008 2009 2010 2011 2012 1
Change 2011 to 2012
ktons Change
Ohio River ‐ Smi thland LD to Cairo IL 108746 113329 94639 101756 99378 98328 (1049) ‐11 Illinois River ‐ Peoria LD to the Mouth 32868 30212 29569 29267 29735 28324 (1411) ‐47 Missis s ippi River ‐ Cairo IL to Baton Rouge LA 185872 176329 166557 176879 182551 184779 2228 12 Missis s ippi River ‐ StL oui s to Cairo IL 109763 98572 104275 102896 106579 103359 (3219) ‐30 Sour ce US Ar my Corps of Engi n eer s Wa ter bor ne Co mmer c e Sta ti s ti c s Center
1 preliminary 2012
Many of the movements represented in the table above transit more than one of the waterway reaches being considered therefore total tonnage cannot be calculated simply by summing the traffic reported for individual reaches This value was drawn from the 2011 Waterborne Commerce Statistics which indicate that in 2011 the total tonnage moving through these reaches was 2273 million tons Using available transportation rate studies conducted for navigation improvement studies on the Upper Mississippi Illinois and Ohio River it is estimated that this
Page10
Ohi o River - Smith land t o Mouth 2011 coal Il linois River Peoria LD to Mouth 2011 aggregates
2
sulfur clay amp salt 4
o ilseeds 4 co rn
25
corn 6
cr ud e petrol aggregates 0
15
Mississippi River - St Louis to Cairo 2011 coal
coal 19
all other
cru de petrol 2
aggregates 9
sul fu r clay amp saft
3
12 15
salt 4
Mississippi River - Cairoto Baton Rouge 2011
8
Figure 7 Commodity Shmmiddotes by Reach
tollllage moves at an average umiddotansportation rate savings of $25 58 a ton It is therefore estimated that shippers using this segment of the inland wate1way system save a total of $58 billion over the best altemative mode andor route ofumiddotansportation
322 Commodities
Coal is the predominant commodity moving through the Ohio reach (see FIGURE 7) Com is the single m ost dominant commodity moving through the Illinois River reach though products in the all other group represent the maj ority of this Illinois River reach s tollllage Peumiddotoleum products at 45 million tons chemicals and fe1tilizers at 52 million tons and iron and steel products at 22 million tons are the primmy commodities in this group On both reaches of the Mississippi River coal is the lmmiddotgest single commodity by tons closely followed by com Agricultural products (all grains oilseeds vegetable products and feeds) amounted to 61 8 million tons or 34 percent of Cairo to Baton Rouge tollllage and 369 million tons or 35 of St Louis to Cairo tons
Traffic figmes by reach and by commodity shown in TABLE 5 begin to display the impact of both lower agricultmal production and low water levels on wate1way umiddotaffic The Ohio River wate1way reach showed only a slight decline (1 percent) but commodities with mmmiddotkets or som ces on the lower Mississippi and Gulf Coast showed declines in umiddotaffic between 2011 and 2012 typified by the sulfur clay and salt group 6 Salt com and stone all showed significant
6 According to LPMS data coal traffic at LD53 declined from 142 million tons to 12 9 million tons (a 136 percent decline) the latter half of2012 compared with the same period of2011 This fo llowed an 09 million ton increase (72 percent) for the first six months of2012 compared w ith the same period in 2011
Page 11
declines While corn shipment declines could be tied to decreased production lower stone and salt shipments were likely the result of low water conditions that affected the cost of shipment or an ability to delay shipment Oilseeds traffic grew by 25 percent reflecting a late season improvement in soybean harvest
Table 5 Traffic by Major Commodity 2007 - 2011 (ktons)
Waterway Reach 2007 2008 2009 2010 2011 2012 1 Change 2011 to 2012 ktons Change
Ohio River ‐ Smithland LD to Cairo IL 108746 113329 94639 101756 99378 98328 (1049) ‐11
coal 37737 46943 37792 38433 40526 41949 1423 35 crude petroleum 106 53 44 46 145 590 445 3072 aggregates 18394 17445 15703 17303 15437 13569 (1868) ‐121 sulfur clay amp salt 2468 3352 3387 3717 3552 2427 (1125) ‐317 corn 7320 6961 6616 7013 5518 4632 (886) ‐161 oilseeds 4058 3969 5004 5176 4189 5221 1033 247 all other 38664 34607 26093 30067 30012 29941 (70) ‐02
Illinois River ‐ Peoria LD to the Mouth 32868 30212 29569 29267 29735 28324 (1411) ‐47
coal 1597 1548 777 919 1727 1150 (576) ‐334 crude petroleum 15 1 21 6 30 583 554 18635 aggregates 874 499 495 232 564 743 178 316 sulfur clay amp s alt 1169 2090 2282 881 1125 882 (243) ‐216 corn 9839 8017 9643 9137 7549 4934 (2615) ‐346 oilseeds 1940 1650 2637 2769 2503 3808 1305 521 all other 17434 16407 13715 15323 16237 16224 (13) ‐01
Mississippi River ‐ Cairo IL to Baton Rouge LA 185872 176329 166557 176879 182551 184779 2228 12
coal 22208 26629 23326 23648 34122 37163 3041 89 crude petroleum 1383 1848 1852 1901 3984 5764 1780 447 aggregates 17923 18009 17741 18474 16035 14575 (1460) ‐91 sulfur clay amp s alt 5304 7863 7962 6322 6648 4639 (2010) ‐302 corn 35465 28293 30872 31835 28065 20842 (7223) ‐257 oilseeds 17966 17648 23807 25216 21324 28369 7045 330 all other 85622 76039 60998 69483 72373 73427 1055 15
Mississippi River ‐ StLouis to Cairo IL 109763 98572 104275 102896 106579 103359 (3219) ‐30
coal 26428 26228 27127 22262 25589 22290 (3299) ‐129 crude petroleum 375 725 677 891 3229 4847 1617 501 aggregates 9735 8691 8425 8335 7947 8799 852 107 sulfur clay amp s alt 2726 4389 4475 2481 3136 2160 (976) ‐311 corn 26951 19755 23504 23824 20760 14273 (6487) ‐312 oilseeds 9687 8642 12531 12471 10682 15354 4672 437 all other 33861 30142 27536 32632 35236 35638 402 11
Source US Army Corps of Engi neers Waterborne Commerce Stati s ti cs Center
1 Prel imi nary 2012
The Illinois River reach showed the greatest percentage decline between 2011 and 2012 (5 percent) with declines in corn (35 percent) coal (33 percent) and salt (22 percent) showing the largest decreases Coal declines were influenced by the closure of a coal-fired electric utility
Page12
plant in late 20117 Like the Ohio commodities moving to and from the lower Mississippi were most affected The Mississippi River between Cairo and Baton Rouge had sizable declines in salt (30 percent) and corn (26 percent) while oilseed traffic grew (33 percent) The Mississippi River between St Louis and Cairo declined the most in tonnage (32 million tons) with salt and corn both declining by 31 percent Oilseeds increased by 44 percent and stone by 10 percent Given the 51 percent decrease in US corn exports (refer to TABLE 1) it is not surprising that corn traffic to the Gulf would decline when approximately half of all US corn exports move by barge to the lower Mississippi and Gulf Coast The ldquoall otherrdquo commodity group was the least affected by the drought All four river reaches experienced sharp percentage increases in crude oil movements though the tonnages were relatively small in each reach These increases likely reflected the first significant movement of shale gas liquids on the inland waterway system
323 Monthly Shipping Patterns
The Corpsrsquo Lock Performance Monitoring System (LPMS) data has reliable information on tow transits commodity tonnages and barge counts by month at all Corps lock and dam projects Three locksndash Ohio River LD53 Mississippi River LD27 and Peoria LD ndash were selected for closer examination of shipping patterns (discussed in this section) and fleet utilization (discussed in the next section) Ohio River LD53 is the closest Ohio River lock to the mouth of the Ohio River so it offers a fair representation of traffic on the lower reach of the Ohio Similarly Peoria LD is closest to the mouth of the Illinois River and Mississippi River LD27 is the furthest downstream lock on the Mississippi Each offers fair representations of the Peoria to the mouth of the Illinois and St Louis to Cairo reaches of these two rivers respectively
As seen in FIGURE 8 monthly traffic at Ohio River LD53 ranged between 50 million and 70 million tons per month in the years selected for analysis (2007 2011 and 2012)
7 AmerenEnergy closedtheMeredosiaplant inlate 2011Seewwwfuturegenallianceorgcommunity‐cogen201303 accessed26July2013
Page13
8000000
7000000
6000000
5000000
~ 4000000 3000000
2000000
1000000
-
Ohio River LDS3 Traffic by Month
--- ~ -~ V- -
-
-
-
2007
2011
2012
9000000 8000000 7000000 6000000
~ 5000000 ~ 4000000
3000000 2000000 1000000
Mississippi River LD27 Traffic by Month
-
-
-
2007
2011
2012
3000000
2500000
2000000 Ill 1 1500000 01shy
1000000
500000
Peoria LD Traffic by Month
-
-
-
2007
2011
2012
Figure 8 Monthly Traffic at Selected Locks 2007 2011 and 2012
Page 14
Figure 9 Powerhouse at Ohio River LD53 Spring 2011
The range of variation would likely have been tighter except for the high water event in the spring of 2011 (see FIGURE 9) which caused a sharp drop in traffic in May of that year Traffic at Mississippi River LD27 and Peoria LD follows a more cyclical pattern than that shown on the Ohio River July and November are typically peak months at LD27 and July and NovemberDecember at Peoria LD Monthly volumes in 2012 mirrored those of 2011 at both locks though at lower levels particularly in the summer and fall when the drought was most intense
33 Middle Mississippi ‐Traffic Past Thebes Illinois Navigating the Middle Mississippi River between St Louis and Cairo Illinois especially in the vicinity of Thebes Illinois and Grand Tower Illinois was a serious challenge for vessel operators 8 These two stretches experienced low water that exposed rock ledges called pinnacles which exposed vessels to grounding and damage Traffic was restricted to one way for periods in the fall of 2012 and the US Coast Guard imposed tow size and draft restrictions Large towboats that customarily move through these reaches could not navigate the restricted draft around Thebes and Grand Tower Illinois necessitating the shuttling of barges through this reach and refleeting above and below the constrictions
Waterway carriers were apparently determined to satisfy shipper needs as traffic through the restricted reaches at Thebes Illinois was largely unchanged between 2011 and 2012 ( see TABLE 6) Declines in corn traffic related to lower corn production were replaced with higher downbound moves of soybean aggregates and crude petroleum
8 See httpwwwstltodaycomnewslocalmetrolow‐water‐on‐mississippi‐river‐causes‐barge‐companies‐to‐lightenarticle 2b1505f1‐ab93‐5e73‐9a36‐d43ff5c8c0b6html
Page15
Table 6 Waterway Traffic Past Thebes Illinois
2011 2012 LPMS Name Up Down Total Up Down Total
CoalLignite amp Coal Coke 2274342 20849891 23124233 2092647 18825680 20918327 Crude Petroleum 22853 3206496 3229349 29239 4780424 4809663 DistillateResidual amp Other Fuel Oils Lube Oil amp Greases 730648 2305378 3036026 614765 2113449 2728214 Petroleum Pitches Coke Asphal t Naptha and Sol vents 335480 2427538 2763018 342221 3161000 3503221 Ferti l izers 6004043 249240 6253283 5905454 229606 6135060 Other Chemicals and Related Products 2 800 138 2 417 289 5 217 427 2 760 812 2 127 573 4 888 385 Sand Gravel Stone Rock Li mes tone Soil Dredged Material 729938 5715696 6445634 807605 7380288 8187893 Iron Ore and Iron amp Steel Waste amp Scrap 331 790 1 042 578 1 374 368 252 297 918 336 1 170 633 Sulphur (Dry) Clay amp Salt 3020775 114884 3135659 2091825 100469 2192294 Slag 226099 150649 376748 362250 113363 475613 Building Cement amp Concrete Li me Glass 69839 3343391 3413230 76587 3914565 3991152 Primary Iron and Steel Products (IngotsBarsRodsetc) 2077909 414447 2492356 2498038 456312 2954350 Wheat 3366 1640911 1644277 5418 1406811 1412229 Corn 8956 20548560 20557516 327740 13783421 14111161 Oil seeds (Soybean Fl axs eed and Others) 68755 10534468 10603223 91354 15187093 15278447 Animal Feed Grain Mi l l Products Flour Processed Grains 52619 2972138 3024757 79030 2537614 2616644 All Others 1817209 953399 2770608 1833834 976248 2810082 TOTAL 20574759 78886953 99461712 20171116 78012252 98183368 Source Waterborne Commerce Statistics
Note Orange shaded cells denote commodities where declines greater than 1000000 tons were experienced between 2011 and 2012 while green shaded cells denote growth of greater than 1000000 tons between 2011 and 2012
34 Lower Mississippi ‐Traffic at Greenville Mississippi
With flows falling throughout the summer on the heavily used Lower Mississippi River tow groundings began to occur - the first being reported on 11 May 2012 Groundings led the US Coast Guard to restrict drafts and tow sizes on the Lower Mississippi where some reaches required dredging in order for vessels to safely navigate 9 One of the more widely reported events occurred on an 11-mile stretch of the river near Greenville Mississippi where intermittent river closures occurred to accommodate the freeing of grounded tows surveying of channel and dredging to open channel It was reported that on August 20 2012 that nearly 100 tows had been delayed near Greenville waiting for the channel to reopen10 Similar events occurred along the Lower Mississippi in locations including Memphis Tennessee Helena Arkansas and Natchez Mississippi
According to the US Coast Guard 18 groundings led to closure events with more than 25 tows in queues In total these events caused 1130 tows and 17640 barges to be delayed Closures of the river occurred when tows needed to be pulled from bars or banks reassembled after breaking-up upon running aground or when channel work was required Industry worked together to free and re-assemble tows Where groundings became frequent in specific areas the US Coast Guard the US Army Corps of Engineers and industry jointly determined when a river closure was necessary to allow the Corps to survey and dredge the channel and the Coast Guard to reset buoys that mark the channel By June draft restrictions were set at 10rsquo6rdquo northbound tow sizes to 42 barges per tow and southbound tows to 36 barges per tow In early July drafts were down to 9rsquo6rdquo and tow sizes further reduced in late July drafts were restricted to 9rsquo northbound tow sizes to 20 loaded barges per tow and southbound tow sizes to 30 barges per
9 httpcornandsoybeandigestcomissuesforced‐barge‐light‐loading‐low‐mississippi‐river accessed 31July201310 httpearthobservatorynasagovIOTDviewphpid=78927 accessedon31July2013
Page16
Figure 10 Tows delayed due to low-water at Greenville Mississippi August 20 2012 Source NASA See footnote number 7
tow By mid-August one way traffic was instituted in problem reaches drafts were limited to 9rsquo and tow sizes limited further Draft and tow size restrictions were gradually relaxed but it was not until 14 December 2012 that all restrictions were lifted
Like the Thebes Illinois constriction point the Greenville Mississippi constriction did not affect traffic levels in fact traffic increased by 2 million tons between 2011 and 2012 (see TABLE 7) The effects of the low water can be seen in the tons per loaded barge which declined by 46 tons on average for the entire year As with the constriction at Thebes waterway carriers were apparently determined to satisfy shipper needs though this came at higher transportation costs Corn harvests along the Lower Mississippi were less affected by the drought than in the traditional Corn Belt regions served by the Upper Mississippi Ohio and Illinois Rivers which coupled with stronger soybean traffic led to increased traffic through this reach as opposed to more steady traffic through Thebes
Table 7 Loaded Barges Past Greenville Mississippi ndash 2011 and 2012
2011 2012 Difference 2011 ‐ 2012
Loaded Barges 92108 95760 3652 Tons 163314542 165384334 2069792 Tons per Loaded Barge 17731 17271 (46)
Source US Army Corps of Engineers Waterborne Commerce Statistics Center
Page17
700
600
500
400
300
200
100
f- f-
f-f-r-
Ohio River LD53
Tow Counts 2011 amp 2012
r- f-I-- fshy f- f-
r- r- r- r-f- f- f- f-r- r- r- r-
f-f-
f-f-rshy
800
700
600
500
400
300
200
100
r-r-fshy1shy-shy
Mississippi River LD27 Tow Counts 2011 amp 2012
-shyt- t-r- r-r- r-f- fshy1shy 1shy-shy -shy
shyr-r-fshy1shy-shy
t-rshy1shy
fshy1shy-shy
-
400
350
300
250
200
150
100
so
1shy
f-f-tshy-shy
Peoria LD Tow Counts 2011 amp 2012
1shy 1shy r-shyf- f- f-f- f- f-t- t- tshy-shy -shy -shy
1shy
f-f-tshy-shy
Figure 11 Tow Counts at Selected Locks 2011 and 2012
35 Fleet Utilization
The C01ps Lock Perf01mance Monitoring System (LPMS) data was examined at the three gateway locks discussed above this time for evidence of altered vessel operation pattems As seen in FIGURE 11 the effect of the 2011 high water event on the lower Ohio River is reflected in lower tow counts in April and May of that year othetwise tow counts are fairly similar between 2011 and 2012 The droughts effect was more apparent at Mississippi River LD27 an d at Peoria LD where tow counts were down significantly between 2011 and 2012 dming the summer and fall months ---------------------------------------
Page 18
Barges per tow and composition of tows did not change dramatically at any of the three locks between 2011 and 2012 (see TABLE 8) The most significant change occurred at LD53 where barges per tow dropped from 117 per tow to 111 per tow while the percentage of empties increased by 3 percent Tow sizes at LD27 remained around 75 barges per tow and grew slightly from 64 to 67 barges per tow at Peoria LD Significantly fewer loaded barges were processed at each of the three locks
Table 8 Barges Tows and Barges per Tow Selected Locks Ba rge s TOTAL
Tow s Ba rges
pe r Tow Loaded Loaded Empty Empty Tota l LD 53
2007 48592 68 23187 32 71779 7039 102 2008 48009 68 22434 32 70443 6624 106 2009 40352 65 21706 35 62058 5489 113 2010 47030 67 23602 33 70632 5984 118 2011 47465 67 22863 33 70328 6021 117 2012 45064 64 25656 36 70720 6352 111
LD 27 2007 41019 67 20574 33 61593 7217 85 2008 35391 70 15343 30 50734 6456 79 2009 37259 64 20868 36 58127 6753 86 2010 35647 65 19299 35 54946 6792 81 2011 34799 68 16709 32 51508 6909 75 2012 34237 67 16904 33 51141 6713 76
Peoria 2007 15336 67 7519 33 22855 3264 70 2008 13526 69 5981 31 19507 3063 64 2009 13376 64 7677 36 21053 3028 70 2010 13452 65 7402 35 20854 3044 69 2011 13265 67 6621 33 19886 3087 64 2012 12702 67 6185 33 18887 2803 67
The effect on total tons of fewer loaded barges through these locks was heightened by lighter loadings measured in tons per barge (see FIGURE 12) which occurred in the late summer and fall of 2012 At LD27 loadings were down approximately 100 tons per barge in October November and December of 2012 when compared with the same months in 2011 and down approximately 75 tons per barge in October and November at Peoria LD
Page19
Ohio River LDS3 Aver age Barge Loadings
1850 ---------------------shy1800 +-------------------shy1750 -1-------=-------------shy1700
~ 1650 ~ 1600
1550 1500 1450 1400
1850 1800 1750 1700
~ 1650 ~ 1600
1550 1500 1450 1400
1850 1800 1750 1700
~ 1650 ~ 1600
1550 1500 1450 1400
Jan Feb Mar Apr May Jun Jul Aug 5ep Oct Nov Dec Ave
r r-r-r-rshyshy
Mississippi River LD27 Average Barge Loadings
r- r- r-r- r- r-r- r- r-r- r- r-r- r- rshyshy shy shy
r-
r- rshy shy
r- r- r-r- r- rshyshy shy -
Jan Feb Mar Apr May Jun Jul Aug 5ep Oct Nov Dec Ave
-shy
r-rshy-
Peori a LD Average Barge Loadings
r- r-r- r-
r- r- r-r- r- r-r- r- r-r- r- rshyshy shy shy
rshy - r-
r- r- r-r- rshy 1shy
r- r- r-r- rshy shyshy shy -
Jan Feb Mar Apr May Jun Jul Aug 5ep Oct Nov Dec Ave
Figure 12 Average Bar ge L oadings at Selected Locks 2011 amp 2012
The combination of fewer barges per tow and lighter loadings at LD27 and Peoria continued a trend at these two locks of fewer tons per tow (see FI GURE 13) A distinct pattem emerges at LD27 one that minors the pattem of grain shipments Significantly larger tons per tow occur during the peak grain shipping season These cyclical variations occur each year though the peaks an d valleys have smoothed with each passing year In 2012 the cyclical pattem is all but unnoticeable At LD53 the combination of smaller tows a greater percentage of empty barges
Page 20
LDS3 Tons per Tow by Month 2007 -2012
LD27 Tons per Tow by Months 2007 - 2012
Peoria LD Tons per Tow by Month 2007 -2012 10000
9000
8000
7000
6000
~ _ 5000
4000
3000
2000
1000
rJ A AA I IVV1 ~ AAV II1 v
1 y bull
Figure 13 Average Barge Loadings at Selected Locks 2007 - 2012
and somewhat lighter loadings caused tons per tow to drop steeply toward the end of2012 despite an increase ofover 300 tow transits that year
Page 21
36 Summary and Conclusions Traffic patterns were examined on the four high volume waterway segments affected by low water in 2012 With the exception of the Lower Mississippi from Cairo Illinois to Baton Rouge Louisiana each segment experienced lower traffic in 2012 than in 2011 Sharp declines in corn traffic undoubtedly related to a greatly diminished harvest explain most of the traffic decline though carriers continued to maintain volumes otherwise
When looking at monthly traffic levels reported in the LPMS data for the gateway locks to the Ohio Illinois and Upper Mississippi (Ohio River LD53 Peoria LD and LD 27) typical cyclical patterns of shipment are apparent in 2012 but at lower levels Vessel operators ran significantly fewer tows in the summer and fall moved fewer barges at LD27 and Peoria but more barges at OH53 ndash this increase being explained by the increased movement of empty barges Tows pushed fewer loaded barges that were more lightly loaded (100 tons per barge less than average at LD27) The end result was lower traffic at each of these three projects
Unfortunately there is no data equivalent to LPMS available at the constriction points on the Mississippi River at Thebes and Grand Tower Illinois that will describe how vessel operators configured their tows We do know that there were vessel draft restrictions that affected both loadings and the size of towboats as well as tow size restrictions According to the Waterborne Commerce Statistics waterway traffic at Thebes Illinois and Greenville Mississippi changed only slightly between 2011 and 2012 declining by 12 percent at Thebes and increasing by 12 percent at Greenville Average tons per barge declined at both locations for the year We also know from surveys and discussions with vessel operators (discussed in subsequent sections) that fleeting operations were initiated above and below the Middle Mississippi reach between Thebes and Grand Tower Illinois in order to optimize the use of a limited number of smaller towboats required through this reach while still utilizing the larger towboats that typically move through this area
Page22
4 LD27 CLOSURE ANALYSIS
41 General
Mississippi River Locks and Dam 27 (LD27) is located on the Upper Mississippi River at mile 1845 near Granite City Illinois and just above St Louis Missouri It is the 4th busiest lock in terms of tonnage processing 250 million tons of agricultural products 101 million tons of chemicals and 101 million tons of petroleum products in 2012 Three closures of special note occurred at this project in 2012 The first was a main chamber closure which occurred in January of 2012 The second was an emergency closure of both chambers caused by an accident related to low water conditions at the lock The third outage was a planned closure of the main chamber to remove the guide cell damaged during the September accident
The US Army Corps of Engineers Lock Performance Monitoring System (LPMS) collects traffic and processing data from each of its lock projects LPMS data for LD27 was analyzed in order to estimate the cost impact on waterway carriers of all three closures the latter two being directly related to the low-water experienced in 2012 The January 2012 closure analysis offers some perspective when evaluating the economic impact on carriers of the five day outage of the project that was related to low water Section 42 examines the first two closures and Section 43 the third closure that began in 2012 and ended in 2013
42 January and September 2012 Outages
The January 2012 closure was a scheduled closure of the 1200rsquo x 110rsquo main chamber The outage began on 4 January 2012 at 0433 hours and ended when the chamber was reopened on 15 March 2012 at 0039 hours The closure allowed for an embedded metal repair to be completed The main chamber was closed for 1700 hours or approximately 70 days and 20 hours The second closure occurred on 15 September 2012 at 0232 hours when a guide cell was ruptured by a tow allision The resulting gravel spill from within the cell and damage to the guide cell prohibited safe passage through the main chamber A little over 15 hours later at 1527 hours the auxiliary chamber closed resulting in a total river closure Both the main and auxiliary chambers were reopened 20 September 2012 at 0330 hours therefore for 5 days and 3 hours the Mississippi River was completely closed to waterway traffic at LD27
421 Tow Arrivals
FIGURE 14 shows the arrivals per day at LD27 for the months of January ndash September 2012 Average tow arrivals per day for the period outside the closures 15 March through 15 September 2012 was 190 tows per day Average arrivals per day for the first closure period 4 January through 15 March 2012 decreased from the 190 tows per day outside the closure period to 152 tows per day Average arrivals per day for the second closure period 15 September through 20 September 2012 were 116 tows per day versus the 190 tows per day outside the closure period
Page23
Lock 27 Upper Mississippi River Main and Auxil iary Tow Arrivals 2012 Chamber
35 ---------------------------------------------------------~~ Main Chamber Closed
15
10
0 ~--------------~----------------------------------------~~ J an Feb Mar Apr May Jun Jul Aug
5 ++---------------+----------------------------------------~~
Figure 14 LD27 Tow Arrivals 2012
422 Tow Processing Time
During the first closure of the 1200 main chamber that occmTed from Janumy through March 1089 tows umiddotansited LD27s auxilimy chamber The average processing time increased from 48 minutes for all tows outside the Janumy through Mmmiddotch 2012 closure to 78 minutes during the closure
At the beginning of the second main chamber closure from 0020 through 1527 on 15 September 2012 only two tows umiddotansited LD27 auxilimy chamber The average processing time increased from 48 minutes for all tows outside the September closure to 209 minutes during the closure
The 2012 closures increased the processing time 30 minutes per tow The 1091 tows that umiddotansited the auxilimy chamber during the main chamber closures caused an additional549 hours of tow umiddotansit time
423 Tow Delays
FIGURE 15 shows delays at LD27 for the period from Janumy- September 2012 Delays stmied building soon after the 1200 chamber closed and continued until17 Mmmiddotch 2012 at 0110 hours This means that the 1700 hour closure impacted traffic for 1749 hours The 49 hour difference represents the time required for the reopened chamber to serve th e tows in queue and bring the delay back to zero During the impact period 16366 hours of tow delay were experienced by 1148 tows This results in an average delay of 143 hourstow for the first closure in year 2012 from Janumy through March By compmmiddotison 4054 tows were served at
Page 24
LD27 outside the Januruy - Mrumiddotch and September 2012 closure periods The average nonnal delay per tow was 183 minutes or approximately 31 hours Given that the average additional delay per tow was 112 hours for the Januaty - Mrumiddotch closure and that 1 148 tows were impacted the closure caused 12866 hours of additional delay
With the September 2012 closure delays strut ed building soon after the 1200 and 600 chamber closed and continued until 25 September 2012 at 1135 hours This means that the 123 hour river closure impacted traffic for 251 hours The 128 hour difference represents the time required for the reopened chambers to serve the tows in queue and bring the delay back to zero During the impact period 6498 hours of tow delay were experienced by 141 tows This resulted in an average delay of46 hourstow Given that the average nonnal delay per tow was 31 hours the average additional delay per tow was 43 hours for the September closure and that 141 tows were impacted the closure caused 6068 hours of additional delay
A total of 1288 tows were impacted in 2012 which caused an additional delay of 18934 hours Therefore on average each tow experienced 147 hours more delay during the closure than n01mal The maximum delay was 127 hours
Lock 27 Upper Mississippi River Average Hou r ly Tow Delays - Year 2012 Main and
Auxili ary Chamber
120 - Main Chamber Closed
100 80
60
40
1 tJi20
A amp A AIt amp ~~ A middot AIAA 10 ~~~m~~~~m~~~~M~~~~M~~~~M~~~~M~~~~M~~~~M~~~~M~~~~M~~~~M~~~~M~~~~M~~~~M middotmiddot middotshy~~NNNMMVV~~~~~~~~~~~~~OOO~~NNNMMVVV~~~~~~~~~~~~OOO~~NNNMMVVV~~~~~~
~~~ bull -l-l-t-t-41ii~-l-l-t-t-lt-1 -t-t-t-t-t -l~ -t-tNNNlNiNNNN1~NNNNNNN
Jan Feb Mar Apr May Jun Jul Aug Sept
Figure 15 LD27 Average Hourly Delays 2012
424 Cost Impact
The analysis above shows that the Januruy through Mrumiddotch 2012 closure caused an additional 543 hours ofprocessing time and 12866 hours of delay Given this additional transit time and average hourly operating costs for tows at LD27 the Januruy through March closure cost caniers an additional $87 million to process through the lock The September closure caused an additional 5 hours ofprocessing time and 6068 hours of delay for a total closure cost of approximately $39 million While the 70 day closure of the main chamber resulted in additional
Page 25
costs of$124000 per day the much sholier 6 day closure (with 5 days oftotal river closure) cost industry a much higher $550000 per day in delay time
43 December 2012 through March 2013 Main Chamber Closure
The third an d fmal closure at LD27 occmTed between 10 December 2012 and 2 March 2013 when th e C01ps removed the guide cell damaged in September 2012 Removal of the guide cell necessitated closure of the main chamber (and some brief closures of the auxiliruy chamber) The main chamber was closed for 1968 hours or approximately 82 days
431 Tow Arrivals
FIGURE 16 shows the anivals per day at LD27 for the months ofNovember 2012 - April2013 Average tow ruTivals per day for the period outside the closures from 1 Jlme 2012 through 31 May 2013 were 183 tows per day Average ruTivals per day for the closure period 10 December 2012 through 2 March 2013 decreased to 127 tows per day
Lock 27 Upper Mississippi River Tow Arrivals Dec 2012 - Mar 2013
35
30 Main Chamber Closed
25 uj20 amp -uA I ~
I~ ~~ I A ~ I15 ~~ n ~~
~~~ - ~1J vr 1 A10 I
5
0
~
~~~O~~~N~~~~~O~~~N~~~M~~N~~~~~ON~~~~~Om~~~~Om~~N~~~m~~N~~~~~ ~~~~NNN ~~~NNNm NNNm NNN NNNm NNN
Nov Dec Jan Feb Mar Apr
Figure 16 L D27 Tow Arrivals December 2012 - March 2013
432 Tow Processing Time
During the closure of the 1200 chamber 35 of the tows through LD27 had to double cut - the tow fl otilla had to be broken into two pruis an d each prui of the fl otilla locked through separately This increased the average processing time fr om 51 minutes for all tows outside the December 2012 through March 2013 closure to 88 minutes during the closures During the closures 1032 tows tImiddotansited LD27 Given an increase in time of 37 minutes per tow an d 1032 tows an additional 643 hours of tow processing time was experienced during the closure
Page 26
433 Tow Delays
FIGURE 17 shows delays at LD27 for the December 2012 through March 2013 closm e period Delays statted building soon after the 1200 chambers closed on 10 December 2012 at 1530 homs and continued until 4 March 2013 at 0008 hom s This means th at th e 1968 hom closme impacted traffic for 2001 hom s The 33 hom difference represents th e time requir ed for th e reopened chamber to serve th e tows in queue an d bring the delay back to zero Dming the impact period 23058 hom s oftow delay were experienced by 1076 tows (total delay in all of 2011 was 9349 homs) This 23058 homs works out to an average delay of214 homstow for th e closm e period By comparison 5246 tows were served at LD27 outside the closm e period from 1 June 2012 through 31 May 2013 The average non nal delay per tow was 27 1 minutes or approximately 45 hom s Given that the average additional delay per tow was 17 hom s for th e December 2012 - March 2013 closme an d that 1076 tows were impacted the closme caused 18195 homs of additional delay The maximum delay experienced by a tow dming this closme was 805 homs
Minimum Average amp Maximum Tow Delays Lock 27 Upper Miss River
Dec 2012 middotMar 3
90
80
70 -f 60 ~ ~ 50 0 1shy 40 Q) Q
gt- 30 ca Q) 20 0
10
De Jan
Mar bull Minimum bull Average Maximum Apr
Figure 17 LD27 M inimum Maximum and Average Tow Delays December 2012- March 2013
444 Cost Impact
The most recent infon nation available indicates that the average tow transit costs at LD27 are about $648 per hom Given the analysis above which shows that this scheduled closm e caused an additional 643 hom s ofprocessing time and 18195 hom of delay the estimated additional transit time dming the closm e cost a total of $ 122 million
Page 27
Page28
5 SHIPPER RESPONSE
51 Survey Procedures
An OMB-approved Shipper Survey (Control 0710-0001) was used to capture and evaluate shipper reactions to the drought and the emergency closure of LD27 in September (see Appendix A) Shippers were defined as companies that receive commodity traffic transiting through multiple reaches on the Mississippi River The formal shipper survey was conducted between 7 March and 30 May 2013 The purposes of the survey were to find out what measures were taken by industry to mitigate the effects of the drought-related low water and emergency closure at LD27 and to estimate the total costs to industry that resulted from the events
At the outset of the process several steps were adopted for including firms in the survey First a list was compiled that showed the parent companies that operate at docks in the four affected waterways ndash the lower Ohio lower Illinois Middle Mississippi and Lower Mississippi Rivers ndash and that ship through LD27 The parent companyowner of each receiving dock was identified using information available to the Corps and grouped by parent company This allowed an estimate of tonnage by parent companyowner to be formulated Parent companies were then ranked in descending order by their total tonnage received For LD27 and each affected waterway the top 25 ranked by companies by tons shipped were selected to be surveyed Duplicate shippers (shippers that had a top 25 ranking in more than one reach) were included as one survey and the next largest company was added to obtain the top 25 unique companies to survey in the study area In all 125 shippers were sent surveys
Waterborne Commerce Statistics Center (WCSC) data for 2011 was used in assembling basic shipper information All of the contact information for the top ranking companies was determined by comparing several contact lists In the absence of any contact information the Internet was used as a search tool to verify correct contact information for these parent companies The 125 shippers were sent a mail survey followed by a telephone follow-up if the parent company or carrier sent no response after two weeks Stakeholders like the American Corn Growers Association the River Industry Action Council (RIAC) and the Waterways Council Incorporated (WCI) assisted by encouraging firms to respond by sending emails to all members late in the survey to encourage participation
According to survey respondents low water presented the greatest challenge to users of the Lower Mississippi from Cairo Illinois to Baton Rouge and the Middle Mississippi River between St Louis and Cairo Traffic on these two reaches totaled 2024 million tons in 2011
Page29
52 Summary of Shipper Responses
Responses to the survey were received from 73 companies representing a response rate of 59 percent and accounting for 42 percent of total 2011 traffic transiting the affected waterways Questions 1a and 1b were used to help determine if the shipper had any impacts from either the emergency lock closure event at LD27 or from the low water conditions Questions 2 and further into the survey were designed to be answered by shippers who had responded that they were impacted by either or both of these events From question 2 onwards the subset of respondents is less than the total that returned surveys because some shippers indicated that they were not impacted by either event in question An overwhelming percentage of respondents to the shipper survey said they were unaffected by the LD27 closure while half of the respondents indicated they experienced significant effects on operations due to low water In an effort to meet their needs shippers sought other sources for product sought other waterway routes and used overland transportation routes at a cost to responding shippers of $56 million The effect of the drought on agricultural production combined with increased transportation costs resulted in temporary plant closures and lost sales that the responding shippers estimated at $79 million
Page30
6 CARRIER RESPONSE
61 Survey Procedures
The Carrier Survey targeted the major towing companies that used the waterways affected by low water in 2012 (the lower Ohio the lower Illinois the Middle Mississippi and the Lower Mississippi Rivers) Appendix B contains the Carrier survey form The purpose of this survey was to identify carrier responses to the 2012 low water event and the LD27 closure Like the shipper survey the formal carrier survey was conducted between 1 March and 30 May 2013 The purpose of the surveys was to determine what measures were taken specifically by the carriers to adapt to the emergency closure at LD27 and drought conditions and what these measures cost
The firms included in the carrier survey were the 10 largest users of the affected waterways (in tonnage) for the years 2006 through 2010 Responses were received from six companies representing 46 percent of carrier traffic on these waterways According to survey respondents low water presented the greatest challenge to users of the Lower Mississippi from Cairo Illinois to Baton Rouge Louisiana and the Middle Mississippi River between St Louis Missouri and Cairo Traffic on these two reaches totaled 2024 million tons in 2011 Survey respondents accounted for 58 of the tonnage in these two reaches
62 Summary of Carrier Canvas Responses
Once the initial set of shippers and carriers for canvassing was established contacts were identified for each company This information was taken from publicly available sources and in some instances through the assistance of industry associations such as the American Corn Growers Association the River Industry Action Council (RIAC) and the Waterways Council Incorporated (WCI) These organizations were also of assistance in encouraging firms to respond by emailing members late in the survey process to encourage participation
Responses were received from six carriers (60) representing 59 percent of total traffic on the affected waterways All but one of the carriers responding indicated that they were affected by both low water and the LD27 closure with the low water being the more serious challenge Moving cargo during this period required carriers to advance or delay shipments light load vessels (necessitating additional trips) reposition barges throughout the system to accommodate the need for additional barges restrict tow sizes (also necessitating more trips) and perform additional refleeting These altered carrier operations cost responding carriers an estimated $807 million Carriers also experienced $167 million in additional costs due to the LD27 closure and delays and tug costs of $02 million due to tow grounding
Page31
Page32
7 FEDERAL RESPONSE
Federal stewards of the inland waterways were aided by past experiences like the 1988 drought and the low-water event on the Lower Mississippi River in 1997 and advancements in the data provided by the National Oceanographic and Atmospheric Administrationrsquos (NOAA) as well as hydrologic tools used by the Corps to forecast water levels These advancements improved the ability of the Corps and the Tennessee Valley Authority in controlling available water in efforts to keep navigation open on the lower Ohio and on the Mississippi Rivers The US Coast Guard took the lead in creating communication avenues between all stakeholders in managing vessel operation and reaching consensus on channel and vessel operational maintenance during the event According to representatives of the Coast Guard no additional expenditures of funds accompanied their extraordinary efforts
On the Ohio River the Corps of Engineers essentially borrowed resources from other locations to be repaid at some future date No emergency funding was made available Channel surveys were conducted more frequently on known trouble spots sometimes twice weekly The Louisville District estimated that dredging costs were approximately $21 million higher than in a typical year (see TABLE 9) The funds were drawn away from other projects in effect with the promise of repayment in a future year to accomplish work that could not be done as a result of moving funds to the lower Ohio
Table 9 Costs Incurred by the Corps
($millions)
District Added Cost Vicksburg $ 729 StLouis
dredging blasting LD27 1
subtotal
$ $ $
1190 970 097
$ 2257 Louisville $ 207 TOTAL $ 3193
1 Costs to bring LD27 into immediate s ervic e Inc ludes cos t of spud barge temporary helperboat assists and gravel cleanup
Source US Army Corps of Engineers Vicksburg St Louis and Louisville Districts
On the Mississippi River emergency funds were made available by Congress in 2011 in response to the flooding that year and any possible future emergencies The rock pinnacles at Thebes and Grand Tower Illinois were blasted and debris removed at an estimated cost of $97 million At LD27 the spilled gravel from the damaged cell and the cell itself were removed and
Page33
temporary safe passage accommodated at an estimated cost of $10 million11 St Louis District dredging was concentrated on the Middle Mississippi as the Lower Illinois was not severely affected Dredging completed by the Vicksburg District on the main stem Mississippi cost $73 million more than average dredging costs over the last several years
11 The Corps estimates it will cost another $35 million to replace the damaged cell This was not includedin thefederal cost
Page34
8 FINDINGS
Traffic patterns were examined on the four high volume waterway segments affected by low water in 2012 With the exception of the Lower Mississippi from Cairo Illinois to Baton Rouge Louisiana each segment experienced lower traffic in 2012 than in 2011 Sharp declines in corn traffic related to a greatly diminished harvest explain most of the traffic decline though carriers continued to maintain volumes of all other commodities otherwise
When looking at monthly traffic levels reported in the LPMS data for the gateway locks to the Ohio Illinois and Upper Mississippi (LD53 Peoria LD and LD 27) typical cyclical patterns of shipment are apparent in 2012 but at lower levels Vessel operators ran significantly fewer tows in the summer and fall moved fewer barges at LD27 and Peoria but more barges at OH53 ndash this increase is explained by the increased movement of empty barges Tows pushed fewer loaded barges that were more lightly loaded (100 tons per barge less than average at LD27) The end result was lower traffic at each of these three projects
Unfortunately there is no data equivalent to LPMS available at the constriction points on the Mississippi River at Thebes Illinois and Grand Tower Illinois that will describe how vessel operators configured tows by number of barges per tow We do know that there were vessel draft restrictions that affected both loadings and the size of towboats as well as tow size restrictions We also know from surveys and discussions with vessel operators (discussed in previous sections) that fleeting operations were initiated above and below these points in order to optimize the use of a limited number of smaller towboats required through this reach while still utilizing the larger towboats that typically move through this area
The Corps surveyed 125 shippers and ten carriers The 73 shippers that responded represent 42 percent of all shipper traffic transiting the affected waterways Half of the respondents to the shipper survey indicated that they did not experience any significant effects on operations due to low water and an overwhelming percentage said they were unaffected by the LD27 closure Ten carriers were surveyed The six carriers responding represented 46 percent of all carrier traffic transiting the affected waterways All but one of the carriers responding indicated that they were affected by both low water and the LD27 closure with the low water being the more serious challenge The difference in shipper and carrier responses suggests that the shippers were somewhat insulated from these events by the strategic and tactical actions taken by the carriers that minimized impacts on the shippers
Despite lower corn production and a 51 decline in corn exports waterway traffic through the Middle Mississippirsquos rock pinnacles at Thebes Illinois constriction was largely unchanged between 2011 and 2012 (though it is important to remember that the worst low water conditions were experienced from December 2012 through February 2013) Moving cargo during this period required carriers to advance or delay shipments light load vessels (necessitating additional trips) reposition barges throughout the system to accommodate the need for additional barges restrict tow sizes (also necessitating more trips) and perform additional refleeting It cost responding carriers an estimated $807 million to alter operations in this fashion (see TABLE
Page35
10) The carriers also faced $167 million in additional costs as a result of the LD27 closures and delays and tug costs of $02 million due to tow groundings Despite these actions shippers did not escape the effects of the low water In an effort to meet their needs shippers sought other sources for product sought other waterway routes and used overland transportation routes at a cost to responding shippers of $559 million The effect of the drought on agricultural production combined with increased transportation costs resulted in temporary plant closures and lost sales that the responding shippers estimated at $790 million
Table 10 Survey Results - Low Water Cost Impacts
Cost Category Cost ($000) Transportation cost impacts
Carrier cost impacts Delays due to LD27 clos ure 16100 $ Other costs due to LD27 clos ure 573$ Groundings 164 $ Altered operations 80723 $
Shipper cost impacts 55860 $ SUBTOTAL 153419$
Production cost impacts 79000$ TOTAL 232419$
Page36
9 CONCLUSIONS
Several observations can be made from an examination of the traffic data obtained from LPMS and WCSC sources and responses generated from the surveys of the navigation industry The obvious message is that a system that is not operating at a level of reliability expected by users will have economic consequences Resulting increases in transportation costs andor delays to the transportation of commodities will have an effect on the marketplace Either the producer will pay more thus reducing expected profit associated with their products or the end user will experience higher commodity prices at the market once prices are adjusted
The low water the 5-day closure of LD27 in September 2012 and the subsequent 82 day closure of the main chamber between December 2012 and March 2013 imposed additional transportation costs of $1534 million just on the companies that responded to the Corpsrsquo surveys Drought andor low water accounted for another $790 million in production losses bringing the total reported impact to $2324 million Shipper survey respondents averaged $098 per ton in production losses and $080 per ton in increased transportation costs as they shifted to other modes and routes These values were applied to tonnage not accounted for through the sample or for which no response was given Carrier survey respondents provided a range of cost impacts $009 per ton for production loss $0005 per ton for non-delay related operations during the LD27 closure $0001 per ton related to grounding logistics and $069 in added transit costs Using these values a simple extrapolation of the sample to the population of movements using the most affected waterways (the Middle Mississippi and Lower Mississippi River) either not sampled or not responding suggests that additional transportation costs totaled $2770 million and production impacts amounted to $1652 million for a total impact of $4422 million12
Table 11 Low Water Cost Impacts from 2012 Event (Costs in $000)
Cost Category Survey
Responses
Estimate for Firms Not
Responding Not Surveyed TOTAL
Transportation cost impacts Carrier cost impacts
Delays due to LD27 closure 1 $ 16100 ‐$ $ 16100 Other costs due to LD27 closure $ 573 417 $ $ 990 Groundings $ 164 119 $ $ 283 Altered operations $ 80723 58719 $ $ 139442
Shipper cost impacts $ 55860 64277 $ $ 120137 SUBTOTAL $ 153419 123532 $ $ 276951
Production cost impacts 2 $ 79000 86248 $ $ 165248 TOTAL $ 232419 209780 $ $ 442199
1 I ncl udes del a y cos t experi enc ed due to LD27 ma i n cha mber cl os ure Dec 2012 ‐Ma r 2013 to remove dama ged cel l
2 I ncl udes ec onomi c impact of reduced corn producti on and hi gher tra ns porta ti on cos ts due to low‐wa ter
12 It is important to remember that not all waterways affected by the drought were covered by this survey
Page37
Using available transportation rate studies conducted for navigation improvement studies on the Upper Mississippi Illinois and Ohio River it is estimated that this tonnage moves at an average transportation rate savings of $2558 a ton Therefore at 2011 traffic levels total savings on these rivers would likely have been an estimated at $58 billion dollars The three most affected Corps of Engineers districts expended $319 million to keep the lower Ohio lower Illinois Middle Mississippi and Lower Mississippi river channels open to navigation in extreme drought conditions enabling shippers to continue navigation While industry faced losses of an estimated $2770 million due to increased transportation costs through the cooperative and coordinated efforts of the Corps the Coast Guard and industry partners shippers and the Nation were able to realize a savings in transportation costs of an estimated $55 billion despite this extreme low water event
Page38
APPENDIX A ndash SHIPPER QUESTIONNAIRE
PageA‐1
OMB Control 0710-0001 Expiration date 02282015
2012 DROUGHTLOCK 27 CLOSURE ndash SHIPPER SURVEY
Date
Firm
Address
Phone
FAX
Point of Contact
Title
General Description of Firm and Products Produced
NOTE ALL RESPONSES WILL BE TREATED AS CONFIDENTIAL
1 Was your company impacted by the closure event at Lock 27 in 2012 Yes No Was your company impacted by low water associated with the Drought Low water conditions in 2012 Yes No (If no interview is complete)
2 Does your company have a response plan for these types of impacts If so did it result in additional work organization to implement or was it detailed enough to cover all the impacts
1
PageA‐2
OMB Control 0710-0001 Expirat ion date 0228201 5
2012 DROUGHTLOCK 27 CLOSURE- SHIPPER SURVEY
LD27 closure
only Low
wate1middot Descriptio n of Response
a No change in procedmes b Stockpiled product and waited for traffic to clear if closme or changed loading depth in barges for low wat er c Switched to all-overland mode for product delivety from existing somces d Switched to different watervray routing for product delivety from existing somces e Switched product somce to an entirely new somce f Ceased operations dming the period g Altered production during the period h Switched production to another facility i Purchased intermediate or final product rather than produced j Other or combinations of the above (Please explain)
3 During th e 2012 event (either Low water or Lock 27 closure) what was your companys response Please indicate with an x in the appropriate box
4 Ifyou have checked c or d in question 3 please complete the following table
Movement Commodity Affected tonnage
Origin (City State)
Destination (City State)
Deliverd $ ton
plio1middot to drou2ht
Delivered $to n
during drou2ht
Examples
I Com 12000 Minneapolis New Orleans $30 $35
MN LA
2 Lube oils 4000 Houston TX Huntington wv $40 $50
2
PageA-3
OMB Contro l 0710-0001 Expiration date 02 282015
2012 DROUGHTLOCK 27 CLOSURE - SHIPPER SURVEY
5 Ifyou checked e in question 2 please complete the following table
Movement Commodity Affected tonnage
P reshydrou ght Origin
(City State)
Ch an ged Origin
(City State)
Destination (City State)
Deliver d $ton
pri01middot to drought
Delivered $ton
dming drought
Examples
1 Com 12000 Minneapolis MN
Cincinnati OH
New Orleans LA
$30 $35
2 Lube oils 4000 Houston TX Ashland KY
Pittsburgh PA $40 $50
6 Ifyou checked response a orb lmder question 3 how were your total production costs affected during the period of closure at Lock 27 or Drought-related low water (total increase in cost if applicable) Please explain
7 Ifyou checked response f under question 3 what was the total estimated loss to your fi1m as a result of ceasing production (during the closure period at Lock 27 or Drought)
3
Page A-4
OMB Control 0710-0001 Expiration date 02282015
2012 DROUGHTLOCK 27 CLOSURE ndash SHIPPER SURVEY
8 If you checked response ldquogrdquo under question 3 what was the total estimated loss to your firm as a result of altering production processes (during the closure period at Lock 27 or Drought)
9 If you checked response ldquohrdquo under question 3 what was the total increase in costs to your firm as a result of changing production locations (during the closure period at Lock 27 or Drought)
10 If you checked ldquoirdquo under question 3 to what extent did purchasing intermediate or final product increase your companyrsquos total costs (during the closure period at Lock 27 or Drought)
11 If you checked response ldquojrdquo under question 3 to what extent did the other measures or combination of measures undertaken as a result of the closure increase your companyrsquos total production costs (during the closure period at Lock 27 or Drought)
4
PageA‐5
OMB Control 0710-0001 Expiration date 02282015
2012 DROUGHTLOCK 27 CLOSURE ndash SHIPPER SURVEY
12 Have these events (drought-related low water or Lock 27 closure) caused your company to alter its long-term transportation strategy (eg switch to all-overland modes increase stockpiles etc) How will this impact your total commodity transportation or other costs (per year) Please explain
13 Has the (drought-related low water or Lock 27 closure) caused your company to take any other long-term permanent measures Please explain How will this affect your companyrsquos long-term operating costs (per year)
14 Has your company been impacted by other navigation system disruptions this shipping season (these would be other than the Low water from the drought or the Lock 27 closure)
5
PageA‐6
Event Date 2 Short-term response 3 Long-term responseExample
McAlpine closure
Jan ndash Feb 2006 Diverted to overland modes
none
OMB Control 0710-0001 Expiration date 02282015
2012 DROUGHTLOCK 27 CLOSURE ndash SHIPPER SURVEY
15 If your company has experienced significant navigation disruptions1 prior to this shipping season please complete the following table
1 Significant navigation system disruptions are defined as disruptions that result in delays to your shipment of more than 48 hours (include scheduled and unscheduled lock outages accidents and low and high water events)
2 Short term response refers to the response actions detailed in question 2 a No change in procedures b Stockpiled product and waited for traffic to clear or light loaded for low water c Switched to all-overland mode for product delivery from existing sources d Switched to different waterway routing for product delivery from existing sources e Switched product source to an entirely new source f Ceased operations during the period of closurelow water g Altered production during the period of closurelow water h Switched production to another facility i Purchased intermediate or final product rather than produced j Other or combinations of the above (Please explain)
3 Long term response refers to a modification of your long term business plan to include altering your long-term transportation strategy (eg switch to all-overland modes increase stockpiles etc) Other long term responses might include sourcing commodities at alternate sites or moving production activities to a different location
6
PageA‐7
PageA‐8
APPENDIX B ndash CARRIER QUESTIONNAIRE
[Typetext] PageB‐1
Waterway Carrier Interview Questions Effects of the 2012 Drought and LD27 Closure
Name of towing company -----------shyLocatio n -----------Name and title of Point of Co ntact ----------------shyPhone number ( )________ email _________
PART 1 LOW WATER DUE TO DROUGHT CONDITIO NS
1 Did your firm experience a reduction in tonnage carried on the Mississippi Ill ino is or Ohio waterways in 2012 Please verify data fo r 2010 and 2011 indicating your estimates for 2012 in table below
Operat o r Traffic Destined fo r Lower Mississippi Ports (2010 and 2011 from WCSC)
Origin 2010 2011 2012
Mississippi above St Louis Mississippi St Louis to Cairo Mississippi south of St Louis Ill inois River Ohio River
2 What facto rs led to changes in t raffic between 2011 and 2012 For example drought condit ions that affected agricultural production low water that affected your abi lit y to operate efficiently loss or gain of a contract(s) increased competit ion from rail or other factors - please specify and ind icate re lative weight of each
3 Have you had to change the way you operate your vessel fleet due to the drought If so what changes did you make and when did these occur
1
[Type text] Page B-2
4 The t wo ta bles below are intended to describe how your operat ions are affected by water depth a nd flows on the Cairo - St Louis reach of the Mississippi Rive r
a Do the operat ionalchanges suggested in t he tables below for the Cairo - St Louis reach (Upper Reach) describe the way you would operate given t he gage readings and flow shown for these two reaches in t he t ables If yes please indicate in the appropriate box in the table below with a Y if no please indicate what restrict ions you impose on your operations given t he gage and flow readings provided
Upper Rea ch- Navigation Restriction
St Louis Gage Reading
Flow (CFSOOO)
Navigation Restriction
Carriers Nav Restriction Followed
Above 20 Above 90 No restriction 00 to 20 74 to 90 25 barges -25 to 00 55 to 74 20 barges -35 to -25 485 to 55 16 barges -40 to -35 46 to 485 85 ft draft -45 to shy 4 0 44to47 80 ft draft Below -45 Below 44 Navigat ion halts
b What is t he number of tows- by size of tow horsepower and draft - that you operate through the St Louis to Cairo reach of the Mississippi For each foot of draft t hat is lost what is your added cost per t rip Please use the table below in making your response
Upper Reach- Tows moved thru the St Louis- Cairo reach in 2011 (or year not affect ed by low water)
Tow size Towboat Horseshypower
Barge Draft
Cost ton of loading below desired barge draft
Barges tow
No of tows 05 10 15 20 25 30 35 4 0
1 - 8 9 - 15
16 - 19 17 - 20 21- 25
gt25
2
[Type text] Page B-3
5 The t wo tables below are intended to describe how your operat ions are affect ed by water depth a nd flows on the Mississippi River sout h of Cairo
a Do the operat ional changes suggested in t he tables below for the Lower Reac h of the Mississippi River sout h of Cairo describe the way you would operate given the gage readings and flow shown for these two reaches in the tables If yes please indicate in t he appropriate box in t he table below with a Y if no please indicate what rest rictions you impose o n your operations given the gage and flow readings provided
Lower Reach- Navigation Restriction
Cairo Gage Reading
Flow (CFS in OOOs)
Navigation Restrictions
Carriers Nav Restriction Followed
Above 118 Above 189 No restriction 60 to 118 111 to 189 25 barges per tow
50 to 60 95 to 111 85 ft draft and 20 barges
35 TO 50 805 to 95 8 ft draft and 12 barges
Below 35 Below 805 Navigation halts
b What is t he number of tows- by size of tow horsepower and draft - that you operate on the Lower Reach of t he Mississippi south of Cairo For each foot of draft t hat is lost what is your added cost per trip Please use t he table below in making your response
Lower Reach- Tows moved through the reach south of St Louis in 2011 (or a yea r not affected by low water)
Tow size Towboat Barge Cost ton of loading below desired barge draft
Barges tow
No of tows
Horseshypower
Draft 05 10 15 20 25 30 35 4 0
1 - 12 13 - 16
17 - 20 21- 25 gt25
6 If you light load due t o low water would you proceed entire t rip as originally light loaded or top off
below Cairo or maybe add additional barges to w here the normal t ons per horsepowe r ratio is
achieved If latter how would this be done and at what cost
3
[Type text] Page B-4
7 Did any of your tows experience a grounding If yes how many total occurrences did you experience and what was the impact on your firm Please indicate your response below
total groundings
events with tows delayed more than 8 hours cost of delays
events involving lightering cargo cost of lightering
events involving towboat assists cost of towboat assists
8 What was major impact of low water due to the drought in terms of effect on your operations ‐
increased operating cost Lost business Equipment damage Safety concerns Groundings
Efficient dispatch of fleet Others
9 Please indicate the economic impact of low water levels on your company in the table below (please
include figures from your response to 5 above)
Indicate Cost with an ldquoXrdquo
if this applies to your firm
Description of impact Costton Tons
Affected Total cost
Increased transit time (including delays) Increased cost due to restricted tow sizes Increased costs due to light loading Idle vesselslost revenue Damaged equipment Increased managementlogistics costs Other (please specify)
4
[Typetext] PageB‐5
PART 2 CLOSURE OF LD27
10 If you have tows already at the lock do you generally wait until it reopens
11 What is typical amount of time you will wait at a lock for it to reopen before you decide to do
something else What do you do if you decide not to wait any longer What factors affect this
decision If you re‐dispatch the tow what does this cost
12 If you have tows underway in the system and a closure occurs at a lock to be transited do you
continue to the closure point wait elsewhere or re‐dispatch the tow What factors affect this decision
13 Please indicate the economic impact of the closure of LD27 on your company in the table below
Indicate Cost with an ldquoXrdquo
if this applies to your firm
Description of impact Costton Tons
Affected Total cost
Delay costs at the lock Delays in place (dock or port) Idle vesselslost revenue Increased managementlogistics costs costs (including re‐dispatching) Other (please specify)
PART 3 FINAL COMMENTS
14 Do you have any other information that would help us describe and quantify the economic impact on
waterway carriers associated with low water due to the drought of 2012 andor the closure of LD27
5
[Typetext] PageB‐6
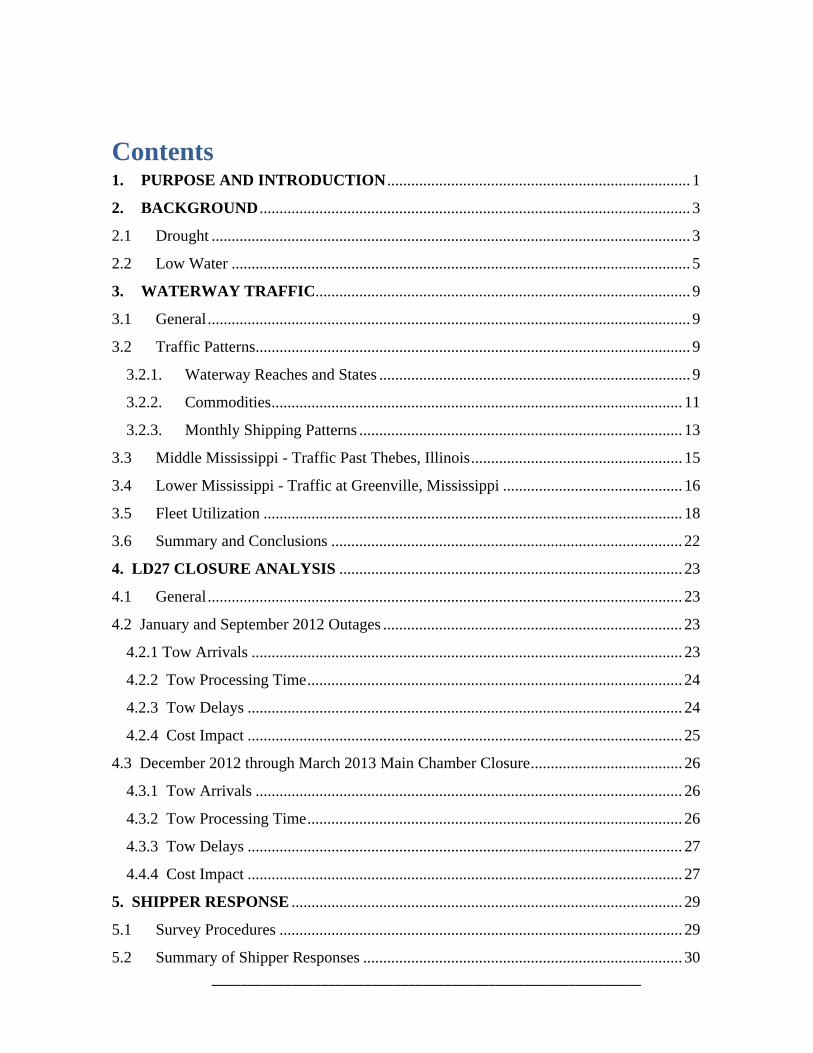
___________________________________________________________
6 CARRIER RESPONSE 31
61 Survey Procedures 31
62 Summary of Carrier Canvas Responses 31
7 FEDERAL RESPONSE 33
8 FINDINGS 35
9 CONCLUSIONS 37
APPENDIX A ndash SHIPPER QUESTIONNAIRE 1
APPENDIX B ndash CARRIER QUESTIONNAIRE 1
___________________________________________________________
LIST OFTABLES
Table 1 US Corn and Soybean Production and Exports 4 Table 2 US Corn and Soybean Production 2010 ndash 2012 9 Table 3 Shipments and Receipts by State 10 Table 4 Traffic by Reach 10 Table 5 Traffic by Major Commodity 2007 - 2011 12 Table 6 Waterway Traffic Past Thebes Illinois 16 Table 7 Loaded Barges Past Greenville Mississippi ndash 2011 and 2012 17 Table 8 Barges Tows and Barges per Tow Selected Locks 19 Table 9 Costs Incurred by the Corps 33 Table 10 Survey Results - Low Water Cost Impacts 36 Table 11 Low Water Cost Impacts from 2012 Event 37
LIST OFFIGURES
Figure 1 The Mississippi River Basin 3 Figure 2 Extent and Depth of 2012 Drought 5 Figure 3 Water Levels in Memphis ndash 2011 and 2012 6 Figure 4 Mississippi River Stages at Vicksburg Mississippi 6 Figure 5 Groundings through 28 November 2012 as reported by the US Coast Guard 7 Figure 6 Removal of stone at rock pinnacle 8 Figure 7 Commodity Shares by Reach 11 Figure 8 Monthly Traffic at Selected Locks 2007 2011 and 2012 14 Figure 9 Powerhouse at Ohio River LD53 Spring 2011 15 Figure 10 Tows delayed Due to Low-water at Greenville Mississippi August 20 2012 17 Figure 11 Tow Counts at Selected Locks 2011 and 2012 18 Figure 12 Average Barge Loadings at Selected Locks 2011 amp 2012 20 Figure 13 Average Barge Loadings at Selected Locks 2007 - 2012 21 Figure 14 LD27 Tow Arrivals 2012 24 Figure 15 LD27 Average Hourly Delays 2012 25 Figure 16 LD27 Tow Arrivals December 2012 ndash March 2013 26 Figure 17 LD27 Minimum Maximum and Average Tow Delays December 2012 ndash March 2013 27
___________________________________________________________
1 PURPOSE AND INTRODUCTION
Lower than normal precipitation in the Mississippi River Basin recorded in the winter and spring of 2012 was an early indicator of what evolved into drought conditions throughout much of the basin Field crops in Midwestern states experienced extreme conditions of stress Reservoirs provided maximum supplies under approved operating procedures to augment flow for water quality and supplies and for inland navigation on the Mississippi River in particular Both the drought and accompanying low water on the Mississippi River were widely reported by local and national media outlets throughout 2012 Agricultural and navigation interests were the focal point of the Nationrsquos concern as the Corp of Engineers and the US Coast Guard employed extraordinary measures to keep shipping lanes safe and open These measures while mitigating the adverse circumstances to some extent did not prevent waterway stakeholders from absorbing additional costs
The Corps of Engineers decided to formulate an estimate of these costs in order to better understand the importance of these major waterways to commercial users A major part of this effort was a survey of both waterway carriers and shippers dependent upon the high traffic volume waterways that experienced low water conditions (the affected waterways were the Mississippi River (the Mississippi River between St Louis Missouri and Cairo Illinois and between Cairo and Baton Rouge Louisiana) the lower Illinois River and the lower Ohio River) Surveys sent to carriers and shippers were designed to elicit economic impact information related to this protracted period of low water to include the river closure due to the accident at LD27
This report focuses on the impact of the low flows on major commercial cargo arteries in the Mississippi River Basin ndash specifically the Mississippi Ohio and Illinois Rivers ndash and estimates economic impacts from drought-related low flows and associated unexpected closure of Locks and Dam 27 Costs incurred by the Federal government specifically the Corps of Engineers are reported to the extent they are available
This study relied upon readily available data from public Corps of Engineers and US Coast Guard sources to describe river conditions events that occurred as a result of low water conditions and efforts to manage vessel traffic A targeted survey of inland waterway carriers and shippers was used to estimate the economic effects of interruptions and disruptions to navigation that occurred as a result of the drought and associated low water conditions
Page1
Page2
Figure 1 The Mississippi River Basin
2 BACKGROUND
21 Drought
The drought of 2012 affected much of the Mississippi River Basin whose major streams are corridors of inland waterway commerce in the Midwest and Plains states (see FIGURE 1) Four waterway reaches that experienced low water conditions and carry bulk commodities in excess of 25 million tons annually were identified for closer examination in this study 1) the Ohio River between Smithland LD and the mouth of the Ohio River 2) the Illinois River between Peoria LD and the mouth of the Illinois 3) the Mississippi River between the confluence of the Ohio River and Baton Rouge Louisiana and 4) the Mississippi River between St Louis Missouri and the confluence of the Ohio In 2011 shippers in 20 states moved commodity through the four reaches with ten different states (Arkansas Illinois Indiana Kentucky Louisiana Missouri Mississippi Ohio Tennessee and West Virginia) in the top five in shipping or receiving commodities in one or more of these reaches
The US Department of Agriculture estimated that nearly 80 percent of agricultural land was affected by drought in 2012 with 70 ndash 75 percent of the corn and soybean production affected by severe or greater drought By September 2012 over 2000 counties were
Page3
designated disaster areas by USDA3 In the Midwest the drought destroyed or damaged corn and soybean crops in particular ndash both the region and producers of these commodities being served by the inland waterway system Corn production declined by 13 percent between the 2011 and 2012 marketing year soybeans by 3 percent and corn exports fell by 51 percent (see TABLE 1)
Table 1 US Corn and Soybean Production and Exports (in millions of bushels)
Ma rke t Ye a r 1 Production
Cha nge from
pre vious ye a r Ex ports
Cha nge from pre vious
year
200708 1303788 -- 243740 --200809 1209165 -7 184895 -24 200910 1309186 8 198002 7 201011 1244687 -5 183417 -7 201112 1235961 -1 154260 -16 201213 1078030 -13 75000 -51
Sourc e USDA Economic Research Service Feed Outlook 1 market year is from September to August
US Soybe a n Production a nd Ex ports 2007 to 201213
(in millions of bushels)
Market Year 1 Production
Cha nge from
previous year Ex ports
Change from
pre vious year
200708 267712 -- 115883 --
200809 296701 11 127929 10
200910 335901 13 149905 17
201011 332918 -1 150094 0
201112 309352 -7 136185 -9
201213 301500 -3 134500 -1
Source USDA Ec onomic Res earch Servic e US Oilcrops Yearb ook
1 market y ear is from September to August
Drought in western Texas spread throughout most of the Great Plains and into the lower Ohio Valley through the spring of 2012 (see FIGURE 2) and winter months of 2013 Extreme and Exceptional drought was persistent in the Great Plains states of South Dakota Nebraska Kansas Oklahoma and northern Texas ndash all major agricultural producing areas Extreme drought reached into the Midwest states in particular southern Minnesota Iowa Illinois Indiana and Missouri ndash all major producers of corn and soybeans4 The wheat crop
3 See the USDA Economic Research Service ldquoUS Drought 2012 Farm and Food Impactsrdquo athttpwwwersusdagovtopicsin‐the‐newsus‐drought‐2012‐farm‐and‐food‐impactsaspx4 Extremedroughts arecharacterized bycrop losses and widespread water shortages or restrictionsExceptionaldroughts are characterized by widespreadcroplosses shortages of waterinreservoirsstreamsand wellscreatingwateremergenciesSeehttpdroughtmonitorunleduclassifyhtm
Page4
was largely spared as it was harvested in late spring prior to the drought taking hold in these states
Figure 2 Extent and Depth of 2012 Drought
22 Low Water
In addition to agriculture the 2012 drought affected water supplies for industrial and municipal uses recreation and the ability to navigate on the Mississippi River and its navigable tributaries Small harbors and terminals saw rivers fall to levels not experienced in nearly 50 years (see FIGURE 3)
Page5
Figure 3 Water Levels in Memphis ndash 2011 and 2012
Figure 4 Mississippi River Stages at Vicksburg Mississippi
Low water conditions rivaled those observed during the 1988 drought event By November 2012 water levels on the Mississippi River fell below those experienced in 1988 (see FIGURE 4) Beginning in May 2012 the Mississippi River stage reached the lowest level observed in the past 112 years Heavy rain and flooding in the Mississippi River Basin ended the low water problems in March 2013
Page6
Figure 5 Groundings through 28 November 2012 as reported by the US Coast Guard
Low water on these major waterway transportation arteries hampered navigation Tows accustomed to wide and deep navigable channels began to suffer from groundings along the length of the Mississippi River (see FIGURE 5) At Mississippi River LD27 water levels fell below the armor-protected area of sheet pile guide cells What would ordinarily be routine impacts on the guide cell as tows aligned to enter the locks led to failure of the cell as impacts occurred on unprotected regions of the sheet pile protectionguide cell Failure of the cell and subsequent clean-up of gravel spilled from the ruptured cell resulted in closure of the Mississippi River at the location of LD27 for approximately five days from 14 September 2012 until 20 September 2012
Groundings of tows occurred along nearly the entire length of the Mississippi River and were especially problematic along the border of northern Illinois between Thebes and Grand Tower Illinois and in the general vicinity of Greenville Mississippi According to the US Coast Guard 18 groundings on the Lower Mississippi led to closure events with more than 25 tows in queues River closures became necessary when tows stuck in shallow water had to be removed when tows broke apart and barges had to be retrieved and reassembled or when it was determined that the channel needed to be surveyed dredged and channel buoys reset
Page7
Figure 6 Removal of stone at rock pinnacle
Water levels on the Mississippi River at Thebes Illinois and at Grand Tower Illinois exposed rock ledges that reduced navigable drafts to 9 feet (well below customary drafts of 10 and 11 feet) and restricted the channel to one-way traffic5 The Corps removed these hazards in early 2013 (see FIGURE 6)
5 According to the US Army Corps of Engineers St Louis District River Projects Manager there was one‐way traffic at the pinnacles with 12 hour closures each day during the removal from 1Jan 2013 to roughly 15 February 2013 There were also other reaches of the river where there wasinsufficientchannelwidthof therequireddepthto permit two‐way traffic
Page8
3 WATERWAY TRAFFIC
31 General
Waterway traffic examined in this section focuses on the Lower Mississippi River and lower reaches of the Upper Mississippi Illinois and Ohio Rivers While the drought also seriously affected waterways in the southwest and the Missouri River traffic flows on these other rivers is relatively small in comparison with the Mississippi Illinois and Ohio Rivers Comparable data through December 2012 was available from the US Army Corps of Engineers Waterborne Commerce Statistics (WCS) and Lock Performance Monitoring System (LPMS) data sets for convenience of comparison only data through December 2012 is examined in this section of the report
32 Traffic Patterns
With the exception of Minnesota major grain and oilseed producing states saw sharp percentage declines in production that exceeded what was a national decline (See TABLE 2) All of these major producing states are touched by navigable waterways The expectation is that this diminished production of corn and soybeans should be reflected in decreased waterway traffic in these commodities
Table 2 US Corn and Soybean Production 2010 ndash 2012
IL IN IA MN MO NE OH US Corn (000s bushels)
201000 1946800 89804000 2153250 1292100 369000 1469100 533010 12446865 201100 1946800 839500 2356400 1201200 349980 1536000 508760 12359612 201200 1286250 596920 1876900 1374450 247500 1292200 448950 10780296
change 2011 ‐ 12 ‐339 ‐289 ‐203 144 ‐293 ‐159 ‐118 ‐128 Soybeans (000s bushels)
201000 466075 258505 496230 328950 210405 267750 220320 3329181 201100 423225 240695 475345 274560 190165 261360 217920 3093524 201200 383560 223590 413850 300570 155170 207085 206100 3014998
change 2011 ‐ 12 ‐94 ‐71 ‐129 95 ‐184 ‐208 ‐54 ‐25 Source Crop Production 2012 Summary USDA National Agricultural Statis tics Service January 2013
321 Waterway Reaches and States
Four waterway reaches that experienced low water conditions and carry bulk commodities in excess of 25 million tons annually were identified for closer examination in this study 1) the Ohio River between Smithland LD and the mouth of the Ohio River 2) the Illinois River between Peoria LD and the mouth of the Illinois River 3) the Mississippi River between the confluence of the Ohio River and Baton Rouge Louisiana and 4) the Mississippi River between St Louis Missouri and the confluence of the Ohio In 2011 shippers in 20 states moved commodity through the four reaches with ten different states (Arkansas Illinois Indiana Kentucky Louisiana Missouri Mississippi Ohio Tennessee and West Virginia) in the top five in shipping or receiving commodities in one or more of these reaches (see TABLE 3)
Page9
Table 3 Shipments and Receipts by State
State
Ohio River ‐ Smithland LD to Cairo IL
Illinois River ‐ Peoria LD to the Mouth
Mississippi R ‐ Cairo IL to Baton Rouge LA
Mississippi River ‐ StLouis to Cairo IL
ship receive ship receive ship receive ship receive AL 1435 4 049 214 489 1340 2351 337 1840 AR 470 972 139 157 6634 6628 235 1336 FL ‐ 41 ‐ 6 30 151 2 64 IA 292 308 23 5 5088 1532 5380 2397 IL 27819 4 477 19 170 11 428 45735 10171 49496 14764 IN 5738 14523 686 863 4994 2713 595 3794 KY 26306 10540 214 438 20 197 6 953 902 1 465 LA 16743 37420 6782 13629 44 026 114 919 14 816 58 194 MN 173 122 14 149 4 860 2 384 5 048 3 021 MO 1992 683 938 152 21 414 3 750 25 302 5 681 MS 697 1383 175 104 4 473 4 508 264 1 005 NE ‐ ‐ ‐ ‐ 8 13 8 13 NY ‐ ‐ ‐ ‐ 2 ‐ ‐ ‐
OH 2940 9188 126 112 2011 4956 710 1939 OK 192 260 138 88 2795 2391 189 240 OT ‐ ‐ ‐ ‐ ‐ 10 ‐ 10 PA 1143 2266 12 54 860 1848 240 101 TN 2494 9005 82 719 5770 9870 257 6200 TX 2930 954 874 1257 5034 5046 1 017 2 996 WI 29 2 ‐ 4 633 243 664 975 WV 7984 3184 146 79 6650 2117 1115 542
Sour c e US Army Corps of Engi neer s Wa terbor ne Commer ce Sta ti s ti cs Center
Note OT (Other) designates moves to unidentified states
Between 2011 and 2012 the Illinois reach experienced the greatest percentage decline in traffic (47 percent) and the Mississippi River between St Louis and Cairo Illinois experienced the greatest tonnage decline at just over 32 million tons (see TABLE 4) The Mississippi River below Cairo Illinois actually showed an increase in traffic between 2011 and 2012
Table 4 Traffic by Reach (ktons)
Waterway Reach 2007 2008 2009 2010 2011 2012 1
Change 2011 to 2012
ktons Change
Ohio River ‐ Smi thland LD to Cairo IL 108746 113329 94639 101756 99378 98328 (1049) ‐11 Illinois River ‐ Peoria LD to the Mouth 32868 30212 29569 29267 29735 28324 (1411) ‐47 Missis s ippi River ‐ Cairo IL to Baton Rouge LA 185872 176329 166557 176879 182551 184779 2228 12 Missis s ippi River ‐ StL oui s to Cairo IL 109763 98572 104275 102896 106579 103359 (3219) ‐30 Sour ce US Ar my Corps of Engi n eer s Wa ter bor ne Co mmer c e Sta ti s ti c s Center
1 preliminary 2012
Many of the movements represented in the table above transit more than one of the waterway reaches being considered therefore total tonnage cannot be calculated simply by summing the traffic reported for individual reaches This value was drawn from the 2011 Waterborne Commerce Statistics which indicate that in 2011 the total tonnage moving through these reaches was 2273 million tons Using available transportation rate studies conducted for navigation improvement studies on the Upper Mississippi Illinois and Ohio River it is estimated that this
Page10
Ohi o River - Smith land t o Mouth 2011 coal Il linois River Peoria LD to Mouth 2011 aggregates
2
sulfur clay amp salt 4
o ilseeds 4 co rn
25
corn 6
cr ud e petrol aggregates 0
15
Mississippi River - St Louis to Cairo 2011 coal
coal 19
all other
cru de petrol 2
aggregates 9
sul fu r clay amp saft
3
12 15
salt 4
Mississippi River - Cairoto Baton Rouge 2011
8
Figure 7 Commodity Shmmiddotes by Reach
tollllage moves at an average umiddotansportation rate savings of $25 58 a ton It is therefore estimated that shippers using this segment of the inland wate1way system save a total of $58 billion over the best altemative mode andor route ofumiddotansportation
322 Commodities
Coal is the predominant commodity moving through the Ohio reach (see FIGURE 7) Com is the single m ost dominant commodity moving through the Illinois River reach though products in the all other group represent the maj ority of this Illinois River reach s tollllage Peumiddotoleum products at 45 million tons chemicals and fe1tilizers at 52 million tons and iron and steel products at 22 million tons are the primmy commodities in this group On both reaches of the Mississippi River coal is the lmmiddotgest single commodity by tons closely followed by com Agricultural products (all grains oilseeds vegetable products and feeds) amounted to 61 8 million tons or 34 percent of Cairo to Baton Rouge tollllage and 369 million tons or 35 of St Louis to Cairo tons
Traffic figmes by reach and by commodity shown in TABLE 5 begin to display the impact of both lower agricultmal production and low water levels on wate1way umiddotaffic The Ohio River wate1way reach showed only a slight decline (1 percent) but commodities with mmmiddotkets or som ces on the lower Mississippi and Gulf Coast showed declines in umiddotaffic between 2011 and 2012 typified by the sulfur clay and salt group 6 Salt com and stone all showed significant
6 According to LPMS data coal traffic at LD53 declined from 142 million tons to 12 9 million tons (a 136 percent decline) the latter half of2012 compared with the same period of2011 This fo llowed an 09 million ton increase (72 percent) for the first six months of2012 compared w ith the same period in 2011
Page 11
declines While corn shipment declines could be tied to decreased production lower stone and salt shipments were likely the result of low water conditions that affected the cost of shipment or an ability to delay shipment Oilseeds traffic grew by 25 percent reflecting a late season improvement in soybean harvest
Table 5 Traffic by Major Commodity 2007 - 2011 (ktons)
Waterway Reach 2007 2008 2009 2010 2011 2012 1 Change 2011 to 2012 ktons Change
Ohio River ‐ Smithland LD to Cairo IL 108746 113329 94639 101756 99378 98328 (1049) ‐11
coal 37737 46943 37792 38433 40526 41949 1423 35 crude petroleum 106 53 44 46 145 590 445 3072 aggregates 18394 17445 15703 17303 15437 13569 (1868) ‐121 sulfur clay amp salt 2468 3352 3387 3717 3552 2427 (1125) ‐317 corn 7320 6961 6616 7013 5518 4632 (886) ‐161 oilseeds 4058 3969 5004 5176 4189 5221 1033 247 all other 38664 34607 26093 30067 30012 29941 (70) ‐02
Illinois River ‐ Peoria LD to the Mouth 32868 30212 29569 29267 29735 28324 (1411) ‐47
coal 1597 1548 777 919 1727 1150 (576) ‐334 crude petroleum 15 1 21 6 30 583 554 18635 aggregates 874 499 495 232 564 743 178 316 sulfur clay amp s alt 1169 2090 2282 881 1125 882 (243) ‐216 corn 9839 8017 9643 9137 7549 4934 (2615) ‐346 oilseeds 1940 1650 2637 2769 2503 3808 1305 521 all other 17434 16407 13715 15323 16237 16224 (13) ‐01
Mississippi River ‐ Cairo IL to Baton Rouge LA 185872 176329 166557 176879 182551 184779 2228 12
coal 22208 26629 23326 23648 34122 37163 3041 89 crude petroleum 1383 1848 1852 1901 3984 5764 1780 447 aggregates 17923 18009 17741 18474 16035 14575 (1460) ‐91 sulfur clay amp s alt 5304 7863 7962 6322 6648 4639 (2010) ‐302 corn 35465 28293 30872 31835 28065 20842 (7223) ‐257 oilseeds 17966 17648 23807 25216 21324 28369 7045 330 all other 85622 76039 60998 69483 72373 73427 1055 15
Mississippi River ‐ StLouis to Cairo IL 109763 98572 104275 102896 106579 103359 (3219) ‐30
coal 26428 26228 27127 22262 25589 22290 (3299) ‐129 crude petroleum 375 725 677 891 3229 4847 1617 501 aggregates 9735 8691 8425 8335 7947 8799 852 107 sulfur clay amp s alt 2726 4389 4475 2481 3136 2160 (976) ‐311 corn 26951 19755 23504 23824 20760 14273 (6487) ‐312 oilseeds 9687 8642 12531 12471 10682 15354 4672 437 all other 33861 30142 27536 32632 35236 35638 402 11
Source US Army Corps of Engi neers Waterborne Commerce Stati s ti cs Center
1 Prel imi nary 2012
The Illinois River reach showed the greatest percentage decline between 2011 and 2012 (5 percent) with declines in corn (35 percent) coal (33 percent) and salt (22 percent) showing the largest decreases Coal declines were influenced by the closure of a coal-fired electric utility
Page12
plant in late 20117 Like the Ohio commodities moving to and from the lower Mississippi were most affected The Mississippi River between Cairo and Baton Rouge had sizable declines in salt (30 percent) and corn (26 percent) while oilseed traffic grew (33 percent) The Mississippi River between St Louis and Cairo declined the most in tonnage (32 million tons) with salt and corn both declining by 31 percent Oilseeds increased by 44 percent and stone by 10 percent Given the 51 percent decrease in US corn exports (refer to TABLE 1) it is not surprising that corn traffic to the Gulf would decline when approximately half of all US corn exports move by barge to the lower Mississippi and Gulf Coast The ldquoall otherrdquo commodity group was the least affected by the drought All four river reaches experienced sharp percentage increases in crude oil movements though the tonnages were relatively small in each reach These increases likely reflected the first significant movement of shale gas liquids on the inland waterway system
323 Monthly Shipping Patterns
The Corpsrsquo Lock Performance Monitoring System (LPMS) data has reliable information on tow transits commodity tonnages and barge counts by month at all Corps lock and dam projects Three locksndash Ohio River LD53 Mississippi River LD27 and Peoria LD ndash were selected for closer examination of shipping patterns (discussed in this section) and fleet utilization (discussed in the next section) Ohio River LD53 is the closest Ohio River lock to the mouth of the Ohio River so it offers a fair representation of traffic on the lower reach of the Ohio Similarly Peoria LD is closest to the mouth of the Illinois River and Mississippi River LD27 is the furthest downstream lock on the Mississippi Each offers fair representations of the Peoria to the mouth of the Illinois and St Louis to Cairo reaches of these two rivers respectively
As seen in FIGURE 8 monthly traffic at Ohio River LD53 ranged between 50 million and 70 million tons per month in the years selected for analysis (2007 2011 and 2012)
7 AmerenEnergy closedtheMeredosiaplant inlate 2011Seewwwfuturegenallianceorgcommunity‐cogen201303 accessed26July2013
Page13
8000000
7000000
6000000
5000000
~ 4000000 3000000
2000000
1000000
-
Ohio River LDS3 Traffic by Month
--- ~ -~ V- -
-
-
-
2007
2011
2012
9000000 8000000 7000000 6000000
~ 5000000 ~ 4000000
3000000 2000000 1000000
Mississippi River LD27 Traffic by Month
-
-
-
2007
2011
2012
3000000
2500000
2000000 Ill 1 1500000 01shy
1000000
500000
Peoria LD Traffic by Month
-
-
-
2007
2011
2012
Figure 8 Monthly Traffic at Selected Locks 2007 2011 and 2012
Page 14
Figure 9 Powerhouse at Ohio River LD53 Spring 2011
The range of variation would likely have been tighter except for the high water event in the spring of 2011 (see FIGURE 9) which caused a sharp drop in traffic in May of that year Traffic at Mississippi River LD27 and Peoria LD follows a more cyclical pattern than that shown on the Ohio River July and November are typically peak months at LD27 and July and NovemberDecember at Peoria LD Monthly volumes in 2012 mirrored those of 2011 at both locks though at lower levels particularly in the summer and fall when the drought was most intense
33 Middle Mississippi ‐Traffic Past Thebes Illinois Navigating the Middle Mississippi River between St Louis and Cairo Illinois especially in the vicinity of Thebes Illinois and Grand Tower Illinois was a serious challenge for vessel operators 8 These two stretches experienced low water that exposed rock ledges called pinnacles which exposed vessels to grounding and damage Traffic was restricted to one way for periods in the fall of 2012 and the US Coast Guard imposed tow size and draft restrictions Large towboats that customarily move through these reaches could not navigate the restricted draft around Thebes and Grand Tower Illinois necessitating the shuttling of barges through this reach and refleeting above and below the constrictions
Waterway carriers were apparently determined to satisfy shipper needs as traffic through the restricted reaches at Thebes Illinois was largely unchanged between 2011 and 2012 ( see TABLE 6) Declines in corn traffic related to lower corn production were replaced with higher downbound moves of soybean aggregates and crude petroleum
8 See httpwwwstltodaycomnewslocalmetrolow‐water‐on‐mississippi‐river‐causes‐barge‐companies‐to‐lightenarticle 2b1505f1‐ab93‐5e73‐9a36‐d43ff5c8c0b6html
Page15
Table 6 Waterway Traffic Past Thebes Illinois
2011 2012 LPMS Name Up Down Total Up Down Total
CoalLignite amp Coal Coke 2274342 20849891 23124233 2092647 18825680 20918327 Crude Petroleum 22853 3206496 3229349 29239 4780424 4809663 DistillateResidual amp Other Fuel Oils Lube Oil amp Greases 730648 2305378 3036026 614765 2113449 2728214 Petroleum Pitches Coke Asphal t Naptha and Sol vents 335480 2427538 2763018 342221 3161000 3503221 Ferti l izers 6004043 249240 6253283 5905454 229606 6135060 Other Chemicals and Related Products 2 800 138 2 417 289 5 217 427 2 760 812 2 127 573 4 888 385 Sand Gravel Stone Rock Li mes tone Soil Dredged Material 729938 5715696 6445634 807605 7380288 8187893 Iron Ore and Iron amp Steel Waste amp Scrap 331 790 1 042 578 1 374 368 252 297 918 336 1 170 633 Sulphur (Dry) Clay amp Salt 3020775 114884 3135659 2091825 100469 2192294 Slag 226099 150649 376748 362250 113363 475613 Building Cement amp Concrete Li me Glass 69839 3343391 3413230 76587 3914565 3991152 Primary Iron and Steel Products (IngotsBarsRodsetc) 2077909 414447 2492356 2498038 456312 2954350 Wheat 3366 1640911 1644277 5418 1406811 1412229 Corn 8956 20548560 20557516 327740 13783421 14111161 Oil seeds (Soybean Fl axs eed and Others) 68755 10534468 10603223 91354 15187093 15278447 Animal Feed Grain Mi l l Products Flour Processed Grains 52619 2972138 3024757 79030 2537614 2616644 All Others 1817209 953399 2770608 1833834 976248 2810082 TOTAL 20574759 78886953 99461712 20171116 78012252 98183368 Source Waterborne Commerce Statistics
Note Orange shaded cells denote commodities where declines greater than 1000000 tons were experienced between 2011 and 2012 while green shaded cells denote growth of greater than 1000000 tons between 2011 and 2012
34 Lower Mississippi ‐Traffic at Greenville Mississippi
With flows falling throughout the summer on the heavily used Lower Mississippi River tow groundings began to occur - the first being reported on 11 May 2012 Groundings led the US Coast Guard to restrict drafts and tow sizes on the Lower Mississippi where some reaches required dredging in order for vessels to safely navigate 9 One of the more widely reported events occurred on an 11-mile stretch of the river near Greenville Mississippi where intermittent river closures occurred to accommodate the freeing of grounded tows surveying of channel and dredging to open channel It was reported that on August 20 2012 that nearly 100 tows had been delayed near Greenville waiting for the channel to reopen10 Similar events occurred along the Lower Mississippi in locations including Memphis Tennessee Helena Arkansas and Natchez Mississippi
According to the US Coast Guard 18 groundings led to closure events with more than 25 tows in queues In total these events caused 1130 tows and 17640 barges to be delayed Closures of the river occurred when tows needed to be pulled from bars or banks reassembled after breaking-up upon running aground or when channel work was required Industry worked together to free and re-assemble tows Where groundings became frequent in specific areas the US Coast Guard the US Army Corps of Engineers and industry jointly determined when a river closure was necessary to allow the Corps to survey and dredge the channel and the Coast Guard to reset buoys that mark the channel By June draft restrictions were set at 10rsquo6rdquo northbound tow sizes to 42 barges per tow and southbound tows to 36 barges per tow In early July drafts were down to 9rsquo6rdquo and tow sizes further reduced in late July drafts were restricted to 9rsquo northbound tow sizes to 20 loaded barges per tow and southbound tow sizes to 30 barges per
9 httpcornandsoybeandigestcomissuesforced‐barge‐light‐loading‐low‐mississippi‐river accessed 31July201310 httpearthobservatorynasagovIOTDviewphpid=78927 accessedon31July2013
Page16
Figure 10 Tows delayed due to low-water at Greenville Mississippi August 20 2012 Source NASA See footnote number 7
tow By mid-August one way traffic was instituted in problem reaches drafts were limited to 9rsquo and tow sizes limited further Draft and tow size restrictions were gradually relaxed but it was not until 14 December 2012 that all restrictions were lifted
Like the Thebes Illinois constriction point the Greenville Mississippi constriction did not affect traffic levels in fact traffic increased by 2 million tons between 2011 and 2012 (see TABLE 7) The effects of the low water can be seen in the tons per loaded barge which declined by 46 tons on average for the entire year As with the constriction at Thebes waterway carriers were apparently determined to satisfy shipper needs though this came at higher transportation costs Corn harvests along the Lower Mississippi were less affected by the drought than in the traditional Corn Belt regions served by the Upper Mississippi Ohio and Illinois Rivers which coupled with stronger soybean traffic led to increased traffic through this reach as opposed to more steady traffic through Thebes
Table 7 Loaded Barges Past Greenville Mississippi ndash 2011 and 2012
2011 2012 Difference 2011 ‐ 2012
Loaded Barges 92108 95760 3652 Tons 163314542 165384334 2069792 Tons per Loaded Barge 17731 17271 (46)
Source US Army Corps of Engineers Waterborne Commerce Statistics Center
Page17
700
600
500
400
300
200
100
f- f-
f-f-r-
Ohio River LD53
Tow Counts 2011 amp 2012
r- f-I-- fshy f- f-
r- r- r- r-f- f- f- f-r- r- r- r-
f-f-
f-f-rshy
800
700
600
500
400
300
200
100
r-r-fshy1shy-shy
Mississippi River LD27 Tow Counts 2011 amp 2012
-shyt- t-r- r-r- r-f- fshy1shy 1shy-shy -shy
shyr-r-fshy1shy-shy
t-rshy1shy
fshy1shy-shy
-
400
350
300
250
200
150
100
so
1shy
f-f-tshy-shy
Peoria LD Tow Counts 2011 amp 2012
1shy 1shy r-shyf- f- f-f- f- f-t- t- tshy-shy -shy -shy
1shy
f-f-tshy-shy
Figure 11 Tow Counts at Selected Locks 2011 and 2012
35 Fleet Utilization
The C01ps Lock Perf01mance Monitoring System (LPMS) data was examined at the three gateway locks discussed above this time for evidence of altered vessel operation pattems As seen in FIGURE 11 the effect of the 2011 high water event on the lower Ohio River is reflected in lower tow counts in April and May of that year othetwise tow counts are fairly similar between 2011 and 2012 The droughts effect was more apparent at Mississippi River LD27 an d at Peoria LD where tow counts were down significantly between 2011 and 2012 dming the summer and fall months ---------------------------------------
Page 18
Barges per tow and composition of tows did not change dramatically at any of the three locks between 2011 and 2012 (see TABLE 8) The most significant change occurred at LD53 where barges per tow dropped from 117 per tow to 111 per tow while the percentage of empties increased by 3 percent Tow sizes at LD27 remained around 75 barges per tow and grew slightly from 64 to 67 barges per tow at Peoria LD Significantly fewer loaded barges were processed at each of the three locks
Table 8 Barges Tows and Barges per Tow Selected Locks Ba rge s TOTAL
Tow s Ba rges
pe r Tow Loaded Loaded Empty Empty Tota l LD 53
2007 48592 68 23187 32 71779 7039 102 2008 48009 68 22434 32 70443 6624 106 2009 40352 65 21706 35 62058 5489 113 2010 47030 67 23602 33 70632 5984 118 2011 47465 67 22863 33 70328 6021 117 2012 45064 64 25656 36 70720 6352 111
LD 27 2007 41019 67 20574 33 61593 7217 85 2008 35391 70 15343 30 50734 6456 79 2009 37259 64 20868 36 58127 6753 86 2010 35647 65 19299 35 54946 6792 81 2011 34799 68 16709 32 51508 6909 75 2012 34237 67 16904 33 51141 6713 76
Peoria 2007 15336 67 7519 33 22855 3264 70 2008 13526 69 5981 31 19507 3063 64 2009 13376 64 7677 36 21053 3028 70 2010 13452 65 7402 35 20854 3044 69 2011 13265 67 6621 33 19886 3087 64 2012 12702 67 6185 33 18887 2803 67
The effect on total tons of fewer loaded barges through these locks was heightened by lighter loadings measured in tons per barge (see FIGURE 12) which occurred in the late summer and fall of 2012 At LD27 loadings were down approximately 100 tons per barge in October November and December of 2012 when compared with the same months in 2011 and down approximately 75 tons per barge in October and November at Peoria LD
Page19
Ohio River LDS3 Aver age Barge Loadings
1850 ---------------------shy1800 +-------------------shy1750 -1-------=-------------shy1700
~ 1650 ~ 1600
1550 1500 1450 1400
1850 1800 1750 1700
~ 1650 ~ 1600
1550 1500 1450 1400
1850 1800 1750 1700
~ 1650 ~ 1600
1550 1500 1450 1400
Jan Feb Mar Apr May Jun Jul Aug 5ep Oct Nov Dec Ave
r r-r-r-rshyshy
Mississippi River LD27 Average Barge Loadings
r- r- r-r- r- r-r- r- r-r- r- r-r- r- rshyshy shy shy
r-
r- rshy shy
r- r- r-r- r- rshyshy shy -
Jan Feb Mar Apr May Jun Jul Aug 5ep Oct Nov Dec Ave
-shy
r-rshy-
Peori a LD Average Barge Loadings
r- r-r- r-
r- r- r-r- r- r-r- r- r-r- r- rshyshy shy shy
rshy - r-
r- r- r-r- rshy 1shy
r- r- r-r- rshy shyshy shy -
Jan Feb Mar Apr May Jun Jul Aug 5ep Oct Nov Dec Ave
Figure 12 Average Bar ge L oadings at Selected Locks 2011 amp 2012
The combination of fewer barges per tow and lighter loadings at LD27 and Peoria continued a trend at these two locks of fewer tons per tow (see FI GURE 13) A distinct pattem emerges at LD27 one that minors the pattem of grain shipments Significantly larger tons per tow occur during the peak grain shipping season These cyclical variations occur each year though the peaks an d valleys have smoothed with each passing year In 2012 the cyclical pattem is all but unnoticeable At LD53 the combination of smaller tows a greater percentage of empty barges
Page 20
LDS3 Tons per Tow by Month 2007 -2012
LD27 Tons per Tow by Months 2007 - 2012
Peoria LD Tons per Tow by Month 2007 -2012 10000
9000
8000
7000
6000
~ _ 5000
4000
3000
2000
1000
rJ A AA I IVV1 ~ AAV II1 v
1 y bull
Figure 13 Average Barge Loadings at Selected Locks 2007 - 2012
and somewhat lighter loadings caused tons per tow to drop steeply toward the end of2012 despite an increase ofover 300 tow transits that year
Page 21
36 Summary and Conclusions Traffic patterns were examined on the four high volume waterway segments affected by low water in 2012 With the exception of the Lower Mississippi from Cairo Illinois to Baton Rouge Louisiana each segment experienced lower traffic in 2012 than in 2011 Sharp declines in corn traffic undoubtedly related to a greatly diminished harvest explain most of the traffic decline though carriers continued to maintain volumes otherwise
When looking at monthly traffic levels reported in the LPMS data for the gateway locks to the Ohio Illinois and Upper Mississippi (Ohio River LD53 Peoria LD and LD 27) typical cyclical patterns of shipment are apparent in 2012 but at lower levels Vessel operators ran significantly fewer tows in the summer and fall moved fewer barges at LD27 and Peoria but more barges at OH53 ndash this increase being explained by the increased movement of empty barges Tows pushed fewer loaded barges that were more lightly loaded (100 tons per barge less than average at LD27) The end result was lower traffic at each of these three projects
Unfortunately there is no data equivalent to LPMS available at the constriction points on the Mississippi River at Thebes and Grand Tower Illinois that will describe how vessel operators configured their tows We do know that there were vessel draft restrictions that affected both loadings and the size of towboats as well as tow size restrictions According to the Waterborne Commerce Statistics waterway traffic at Thebes Illinois and Greenville Mississippi changed only slightly between 2011 and 2012 declining by 12 percent at Thebes and increasing by 12 percent at Greenville Average tons per barge declined at both locations for the year We also know from surveys and discussions with vessel operators (discussed in subsequent sections) that fleeting operations were initiated above and below the Middle Mississippi reach between Thebes and Grand Tower Illinois in order to optimize the use of a limited number of smaller towboats required through this reach while still utilizing the larger towboats that typically move through this area
Page22
4 LD27 CLOSURE ANALYSIS
41 General
Mississippi River Locks and Dam 27 (LD27) is located on the Upper Mississippi River at mile 1845 near Granite City Illinois and just above St Louis Missouri It is the 4th busiest lock in terms of tonnage processing 250 million tons of agricultural products 101 million tons of chemicals and 101 million tons of petroleum products in 2012 Three closures of special note occurred at this project in 2012 The first was a main chamber closure which occurred in January of 2012 The second was an emergency closure of both chambers caused by an accident related to low water conditions at the lock The third outage was a planned closure of the main chamber to remove the guide cell damaged during the September accident
The US Army Corps of Engineers Lock Performance Monitoring System (LPMS) collects traffic and processing data from each of its lock projects LPMS data for LD27 was analyzed in order to estimate the cost impact on waterway carriers of all three closures the latter two being directly related to the low-water experienced in 2012 The January 2012 closure analysis offers some perspective when evaluating the economic impact on carriers of the five day outage of the project that was related to low water Section 42 examines the first two closures and Section 43 the third closure that began in 2012 and ended in 2013
42 January and September 2012 Outages
The January 2012 closure was a scheduled closure of the 1200rsquo x 110rsquo main chamber The outage began on 4 January 2012 at 0433 hours and ended when the chamber was reopened on 15 March 2012 at 0039 hours The closure allowed for an embedded metal repair to be completed The main chamber was closed for 1700 hours or approximately 70 days and 20 hours The second closure occurred on 15 September 2012 at 0232 hours when a guide cell was ruptured by a tow allision The resulting gravel spill from within the cell and damage to the guide cell prohibited safe passage through the main chamber A little over 15 hours later at 1527 hours the auxiliary chamber closed resulting in a total river closure Both the main and auxiliary chambers were reopened 20 September 2012 at 0330 hours therefore for 5 days and 3 hours the Mississippi River was completely closed to waterway traffic at LD27
421 Tow Arrivals
FIGURE 14 shows the arrivals per day at LD27 for the months of January ndash September 2012 Average tow arrivals per day for the period outside the closures 15 March through 15 September 2012 was 190 tows per day Average arrivals per day for the first closure period 4 January through 15 March 2012 decreased from the 190 tows per day outside the closure period to 152 tows per day Average arrivals per day for the second closure period 15 September through 20 September 2012 were 116 tows per day versus the 190 tows per day outside the closure period
Page23
Lock 27 Upper Mississippi River Main and Auxil iary Tow Arrivals 2012 Chamber
35 ---------------------------------------------------------~~ Main Chamber Closed
15
10
0 ~--------------~----------------------------------------~~ J an Feb Mar Apr May Jun Jul Aug
5 ++---------------+----------------------------------------~~
Figure 14 LD27 Tow Arrivals 2012
422 Tow Processing Time
During the first closure of the 1200 main chamber that occmTed from Janumy through March 1089 tows umiddotansited LD27s auxilimy chamber The average processing time increased from 48 minutes for all tows outside the Janumy through Mmmiddotch 2012 closure to 78 minutes during the closure
At the beginning of the second main chamber closure from 0020 through 1527 on 15 September 2012 only two tows umiddotansited LD27 auxilimy chamber The average processing time increased from 48 minutes for all tows outside the September closure to 209 minutes during the closure
The 2012 closures increased the processing time 30 minutes per tow The 1091 tows that umiddotansited the auxilimy chamber during the main chamber closures caused an additional549 hours of tow umiddotansit time
423 Tow Delays
FIGURE 15 shows delays at LD27 for the period from Janumy- September 2012 Delays stmied building soon after the 1200 chamber closed and continued until17 Mmmiddotch 2012 at 0110 hours This means that the 1700 hour closure impacted traffic for 1749 hours The 49 hour difference represents the time required for the reopened chamber to serve th e tows in queue and bring the delay back to zero During the impact period 16366 hours of tow delay were experienced by 1148 tows This results in an average delay of 143 hourstow for the first closure in year 2012 from Janumy through March By compmmiddotison 4054 tows were served at
Page 24
LD27 outside the Januruy - Mrumiddotch and September 2012 closure periods The average nonnal delay per tow was 183 minutes or approximately 31 hours Given that the average additional delay per tow was 112 hours for the Januaty - Mrumiddotch closure and that 1 148 tows were impacted the closure caused 12866 hours of additional delay
With the September 2012 closure delays strut ed building soon after the 1200 and 600 chamber closed and continued until 25 September 2012 at 1135 hours This means that the 123 hour river closure impacted traffic for 251 hours The 128 hour difference represents the time required for the reopened chambers to serve the tows in queue and bring the delay back to zero During the impact period 6498 hours of tow delay were experienced by 141 tows This resulted in an average delay of46 hourstow Given that the average nonnal delay per tow was 31 hours the average additional delay per tow was 43 hours for the September closure and that 141 tows were impacted the closure caused 6068 hours of additional delay
A total of 1288 tows were impacted in 2012 which caused an additional delay of 18934 hours Therefore on average each tow experienced 147 hours more delay during the closure than n01mal The maximum delay was 127 hours
Lock 27 Upper Mississippi River Average Hou r ly Tow Delays - Year 2012 Main and
Auxili ary Chamber
120 - Main Chamber Closed
100 80
60
40
1 tJi20
A amp A AIt amp ~~ A middot AIAA 10 ~~~m~~~~m~~~~M~~~~M~~~~M~~~~M~~~~M~~~~M~~~~M~~~~M~~~~M~~~~M~~~~M~~~~M middotmiddot middotshy~~NNNMMVV~~~~~~~~~~~~~OOO~~NNNMMVVV~~~~~~~~~~~~OOO~~NNNMMVVV~~~~~~
~~~ bull -l-l-t-t-41ii~-l-l-t-t-lt-1 -t-t-t-t-t -l~ -t-tNNNlNiNNNN1~NNNNNNN
Jan Feb Mar Apr May Jun Jul Aug Sept
Figure 15 LD27 Average Hourly Delays 2012
424 Cost Impact
The analysis above shows that the Januruy through Mrumiddotch 2012 closure caused an additional 543 hours ofprocessing time and 12866 hours of delay Given this additional transit time and average hourly operating costs for tows at LD27 the Januruy through March closure cost caniers an additional $87 million to process through the lock The September closure caused an additional 5 hours ofprocessing time and 6068 hours of delay for a total closure cost of approximately $39 million While the 70 day closure of the main chamber resulted in additional
Page 25
costs of$124000 per day the much sholier 6 day closure (with 5 days oftotal river closure) cost industry a much higher $550000 per day in delay time
43 December 2012 through March 2013 Main Chamber Closure
The third an d fmal closure at LD27 occmTed between 10 December 2012 and 2 March 2013 when th e C01ps removed the guide cell damaged in September 2012 Removal of the guide cell necessitated closure of the main chamber (and some brief closures of the auxiliruy chamber) The main chamber was closed for 1968 hours or approximately 82 days
431 Tow Arrivals
FIGURE 16 shows the anivals per day at LD27 for the months ofNovember 2012 - April2013 Average tow ruTivals per day for the period outside the closures from 1 Jlme 2012 through 31 May 2013 were 183 tows per day Average ruTivals per day for the closure period 10 December 2012 through 2 March 2013 decreased to 127 tows per day
Lock 27 Upper Mississippi River Tow Arrivals Dec 2012 - Mar 2013
35
30 Main Chamber Closed
25 uj20 amp -uA I ~
I~ ~~ I A ~ I15 ~~ n ~~
~~~ - ~1J vr 1 A10 I
5
0
~
~~~O~~~N~~~~~O~~~N~~~M~~N~~~~~ON~~~~~Om~~~~Om~~N~~~m~~N~~~~~ ~~~~NNN ~~~NNNm NNNm NNN NNNm NNN
Nov Dec Jan Feb Mar Apr
Figure 16 L D27 Tow Arrivals December 2012 - March 2013
432 Tow Processing Time
During the closure of the 1200 chamber 35 of the tows through LD27 had to double cut - the tow fl otilla had to be broken into two pruis an d each prui of the fl otilla locked through separately This increased the average processing time fr om 51 minutes for all tows outside the December 2012 through March 2013 closure to 88 minutes during the closures During the closures 1032 tows tImiddotansited LD27 Given an increase in time of 37 minutes per tow an d 1032 tows an additional 643 hours of tow processing time was experienced during the closure
Page 26
433 Tow Delays
FIGURE 17 shows delays at LD27 for the December 2012 through March 2013 closm e period Delays statted building soon after the 1200 chambers closed on 10 December 2012 at 1530 homs and continued until 4 March 2013 at 0008 hom s This means th at th e 1968 hom closme impacted traffic for 2001 hom s The 33 hom difference represents th e time requir ed for th e reopened chamber to serve th e tows in queue an d bring the delay back to zero Dming the impact period 23058 hom s oftow delay were experienced by 1076 tows (total delay in all of 2011 was 9349 homs) This 23058 homs works out to an average delay of214 homstow for th e closm e period By comparison 5246 tows were served at LD27 outside the closm e period from 1 June 2012 through 31 May 2013 The average non nal delay per tow was 27 1 minutes or approximately 45 hom s Given that the average additional delay per tow was 17 hom s for th e December 2012 - March 2013 closme an d that 1076 tows were impacted the closme caused 18195 homs of additional delay The maximum delay experienced by a tow dming this closme was 805 homs
Minimum Average amp Maximum Tow Delays Lock 27 Upper Miss River
Dec 2012 middotMar 3
90
80
70 -f 60 ~ ~ 50 0 1shy 40 Q) Q
gt- 30 ca Q) 20 0
10
De Jan
Mar bull Minimum bull Average Maximum Apr
Figure 17 LD27 M inimum Maximum and Average Tow Delays December 2012- March 2013
444 Cost Impact
The most recent infon nation available indicates that the average tow transit costs at LD27 are about $648 per hom Given the analysis above which shows that this scheduled closm e caused an additional 643 hom s ofprocessing time and 18195 hom of delay the estimated additional transit time dming the closm e cost a total of $ 122 million
Page 27
Page28
5 SHIPPER RESPONSE
51 Survey Procedures
An OMB-approved Shipper Survey (Control 0710-0001) was used to capture and evaluate shipper reactions to the drought and the emergency closure of LD27 in September (see Appendix A) Shippers were defined as companies that receive commodity traffic transiting through multiple reaches on the Mississippi River The formal shipper survey was conducted between 7 March and 30 May 2013 The purposes of the survey were to find out what measures were taken by industry to mitigate the effects of the drought-related low water and emergency closure at LD27 and to estimate the total costs to industry that resulted from the events
At the outset of the process several steps were adopted for including firms in the survey First a list was compiled that showed the parent companies that operate at docks in the four affected waterways ndash the lower Ohio lower Illinois Middle Mississippi and Lower Mississippi Rivers ndash and that ship through LD27 The parent companyowner of each receiving dock was identified using information available to the Corps and grouped by parent company This allowed an estimate of tonnage by parent companyowner to be formulated Parent companies were then ranked in descending order by their total tonnage received For LD27 and each affected waterway the top 25 ranked by companies by tons shipped were selected to be surveyed Duplicate shippers (shippers that had a top 25 ranking in more than one reach) were included as one survey and the next largest company was added to obtain the top 25 unique companies to survey in the study area In all 125 shippers were sent surveys
Waterborne Commerce Statistics Center (WCSC) data for 2011 was used in assembling basic shipper information All of the contact information for the top ranking companies was determined by comparing several contact lists In the absence of any contact information the Internet was used as a search tool to verify correct contact information for these parent companies The 125 shippers were sent a mail survey followed by a telephone follow-up if the parent company or carrier sent no response after two weeks Stakeholders like the American Corn Growers Association the River Industry Action Council (RIAC) and the Waterways Council Incorporated (WCI) assisted by encouraging firms to respond by sending emails to all members late in the survey to encourage participation
According to survey respondents low water presented the greatest challenge to users of the Lower Mississippi from Cairo Illinois to Baton Rouge and the Middle Mississippi River between St Louis and Cairo Traffic on these two reaches totaled 2024 million tons in 2011
Page29
52 Summary of Shipper Responses
Responses to the survey were received from 73 companies representing a response rate of 59 percent and accounting for 42 percent of total 2011 traffic transiting the affected waterways Questions 1a and 1b were used to help determine if the shipper had any impacts from either the emergency lock closure event at LD27 or from the low water conditions Questions 2 and further into the survey were designed to be answered by shippers who had responded that they were impacted by either or both of these events From question 2 onwards the subset of respondents is less than the total that returned surveys because some shippers indicated that they were not impacted by either event in question An overwhelming percentage of respondents to the shipper survey said they were unaffected by the LD27 closure while half of the respondents indicated they experienced significant effects on operations due to low water In an effort to meet their needs shippers sought other sources for product sought other waterway routes and used overland transportation routes at a cost to responding shippers of $56 million The effect of the drought on agricultural production combined with increased transportation costs resulted in temporary plant closures and lost sales that the responding shippers estimated at $79 million
Page30
6 CARRIER RESPONSE
61 Survey Procedures
The Carrier Survey targeted the major towing companies that used the waterways affected by low water in 2012 (the lower Ohio the lower Illinois the Middle Mississippi and the Lower Mississippi Rivers) Appendix B contains the Carrier survey form The purpose of this survey was to identify carrier responses to the 2012 low water event and the LD27 closure Like the shipper survey the formal carrier survey was conducted between 1 March and 30 May 2013 The purpose of the surveys was to determine what measures were taken specifically by the carriers to adapt to the emergency closure at LD27 and drought conditions and what these measures cost
The firms included in the carrier survey were the 10 largest users of the affected waterways (in tonnage) for the years 2006 through 2010 Responses were received from six companies representing 46 percent of carrier traffic on these waterways According to survey respondents low water presented the greatest challenge to users of the Lower Mississippi from Cairo Illinois to Baton Rouge Louisiana and the Middle Mississippi River between St Louis Missouri and Cairo Traffic on these two reaches totaled 2024 million tons in 2011 Survey respondents accounted for 58 of the tonnage in these two reaches
62 Summary of Carrier Canvas Responses
Once the initial set of shippers and carriers for canvassing was established contacts were identified for each company This information was taken from publicly available sources and in some instances through the assistance of industry associations such as the American Corn Growers Association the River Industry Action Council (RIAC) and the Waterways Council Incorporated (WCI) These organizations were also of assistance in encouraging firms to respond by emailing members late in the survey process to encourage participation
Responses were received from six carriers (60) representing 59 percent of total traffic on the affected waterways All but one of the carriers responding indicated that they were affected by both low water and the LD27 closure with the low water being the more serious challenge Moving cargo during this period required carriers to advance or delay shipments light load vessels (necessitating additional trips) reposition barges throughout the system to accommodate the need for additional barges restrict tow sizes (also necessitating more trips) and perform additional refleeting These altered carrier operations cost responding carriers an estimated $807 million Carriers also experienced $167 million in additional costs due to the LD27 closure and delays and tug costs of $02 million due to tow grounding
Page31
Page32
7 FEDERAL RESPONSE
Federal stewards of the inland waterways were aided by past experiences like the 1988 drought and the low-water event on the Lower Mississippi River in 1997 and advancements in the data provided by the National Oceanographic and Atmospheric Administrationrsquos (NOAA) as well as hydrologic tools used by the Corps to forecast water levels These advancements improved the ability of the Corps and the Tennessee Valley Authority in controlling available water in efforts to keep navigation open on the lower Ohio and on the Mississippi Rivers The US Coast Guard took the lead in creating communication avenues between all stakeholders in managing vessel operation and reaching consensus on channel and vessel operational maintenance during the event According to representatives of the Coast Guard no additional expenditures of funds accompanied their extraordinary efforts
On the Ohio River the Corps of Engineers essentially borrowed resources from other locations to be repaid at some future date No emergency funding was made available Channel surveys were conducted more frequently on known trouble spots sometimes twice weekly The Louisville District estimated that dredging costs were approximately $21 million higher than in a typical year (see TABLE 9) The funds were drawn away from other projects in effect with the promise of repayment in a future year to accomplish work that could not be done as a result of moving funds to the lower Ohio
Table 9 Costs Incurred by the Corps
($millions)
District Added Cost Vicksburg $ 729 StLouis
dredging blasting LD27 1
subtotal
$ $ $
1190 970 097
$ 2257 Louisville $ 207 TOTAL $ 3193
1 Costs to bring LD27 into immediate s ervic e Inc ludes cos t of spud barge temporary helperboat assists and gravel cleanup
Source US Army Corps of Engineers Vicksburg St Louis and Louisville Districts
On the Mississippi River emergency funds were made available by Congress in 2011 in response to the flooding that year and any possible future emergencies The rock pinnacles at Thebes and Grand Tower Illinois were blasted and debris removed at an estimated cost of $97 million At LD27 the spilled gravel from the damaged cell and the cell itself were removed and
Page33
temporary safe passage accommodated at an estimated cost of $10 million11 St Louis District dredging was concentrated on the Middle Mississippi as the Lower Illinois was not severely affected Dredging completed by the Vicksburg District on the main stem Mississippi cost $73 million more than average dredging costs over the last several years
11 The Corps estimates it will cost another $35 million to replace the damaged cell This was not includedin thefederal cost
Page34
8 FINDINGS
Traffic patterns were examined on the four high volume waterway segments affected by low water in 2012 With the exception of the Lower Mississippi from Cairo Illinois to Baton Rouge Louisiana each segment experienced lower traffic in 2012 than in 2011 Sharp declines in corn traffic related to a greatly diminished harvest explain most of the traffic decline though carriers continued to maintain volumes of all other commodities otherwise
When looking at monthly traffic levels reported in the LPMS data for the gateway locks to the Ohio Illinois and Upper Mississippi (LD53 Peoria LD and LD 27) typical cyclical patterns of shipment are apparent in 2012 but at lower levels Vessel operators ran significantly fewer tows in the summer and fall moved fewer barges at LD27 and Peoria but more barges at OH53 ndash this increase is explained by the increased movement of empty barges Tows pushed fewer loaded barges that were more lightly loaded (100 tons per barge less than average at LD27) The end result was lower traffic at each of these three projects
Unfortunately there is no data equivalent to LPMS available at the constriction points on the Mississippi River at Thebes Illinois and Grand Tower Illinois that will describe how vessel operators configured tows by number of barges per tow We do know that there were vessel draft restrictions that affected both loadings and the size of towboats as well as tow size restrictions We also know from surveys and discussions with vessel operators (discussed in previous sections) that fleeting operations were initiated above and below these points in order to optimize the use of a limited number of smaller towboats required through this reach while still utilizing the larger towboats that typically move through this area
The Corps surveyed 125 shippers and ten carriers The 73 shippers that responded represent 42 percent of all shipper traffic transiting the affected waterways Half of the respondents to the shipper survey indicated that they did not experience any significant effects on operations due to low water and an overwhelming percentage said they were unaffected by the LD27 closure Ten carriers were surveyed The six carriers responding represented 46 percent of all carrier traffic transiting the affected waterways All but one of the carriers responding indicated that they were affected by both low water and the LD27 closure with the low water being the more serious challenge The difference in shipper and carrier responses suggests that the shippers were somewhat insulated from these events by the strategic and tactical actions taken by the carriers that minimized impacts on the shippers
Despite lower corn production and a 51 decline in corn exports waterway traffic through the Middle Mississippirsquos rock pinnacles at Thebes Illinois constriction was largely unchanged between 2011 and 2012 (though it is important to remember that the worst low water conditions were experienced from December 2012 through February 2013) Moving cargo during this period required carriers to advance or delay shipments light load vessels (necessitating additional trips) reposition barges throughout the system to accommodate the need for additional barges restrict tow sizes (also necessitating more trips) and perform additional refleeting It cost responding carriers an estimated $807 million to alter operations in this fashion (see TABLE
Page35
10) The carriers also faced $167 million in additional costs as a result of the LD27 closures and delays and tug costs of $02 million due to tow groundings Despite these actions shippers did not escape the effects of the low water In an effort to meet their needs shippers sought other sources for product sought other waterway routes and used overland transportation routes at a cost to responding shippers of $559 million The effect of the drought on agricultural production combined with increased transportation costs resulted in temporary plant closures and lost sales that the responding shippers estimated at $790 million
Table 10 Survey Results - Low Water Cost Impacts
Cost Category Cost ($000) Transportation cost impacts
Carrier cost impacts Delays due to LD27 clos ure 16100 $ Other costs due to LD27 clos ure 573$ Groundings 164 $ Altered operations 80723 $
Shipper cost impacts 55860 $ SUBTOTAL 153419$
Production cost impacts 79000$ TOTAL 232419$
Page36
9 CONCLUSIONS
Several observations can be made from an examination of the traffic data obtained from LPMS and WCSC sources and responses generated from the surveys of the navigation industry The obvious message is that a system that is not operating at a level of reliability expected by users will have economic consequences Resulting increases in transportation costs andor delays to the transportation of commodities will have an effect on the marketplace Either the producer will pay more thus reducing expected profit associated with their products or the end user will experience higher commodity prices at the market once prices are adjusted
The low water the 5-day closure of LD27 in September 2012 and the subsequent 82 day closure of the main chamber between December 2012 and March 2013 imposed additional transportation costs of $1534 million just on the companies that responded to the Corpsrsquo surveys Drought andor low water accounted for another $790 million in production losses bringing the total reported impact to $2324 million Shipper survey respondents averaged $098 per ton in production losses and $080 per ton in increased transportation costs as they shifted to other modes and routes These values were applied to tonnage not accounted for through the sample or for which no response was given Carrier survey respondents provided a range of cost impacts $009 per ton for production loss $0005 per ton for non-delay related operations during the LD27 closure $0001 per ton related to grounding logistics and $069 in added transit costs Using these values a simple extrapolation of the sample to the population of movements using the most affected waterways (the Middle Mississippi and Lower Mississippi River) either not sampled or not responding suggests that additional transportation costs totaled $2770 million and production impacts amounted to $1652 million for a total impact of $4422 million12
Table 11 Low Water Cost Impacts from 2012 Event (Costs in $000)
Cost Category Survey
Responses
Estimate for Firms Not
Responding Not Surveyed TOTAL
Transportation cost impacts Carrier cost impacts
Delays due to LD27 closure 1 $ 16100 ‐$ $ 16100 Other costs due to LD27 closure $ 573 417 $ $ 990 Groundings $ 164 119 $ $ 283 Altered operations $ 80723 58719 $ $ 139442
Shipper cost impacts $ 55860 64277 $ $ 120137 SUBTOTAL $ 153419 123532 $ $ 276951
Production cost impacts 2 $ 79000 86248 $ $ 165248 TOTAL $ 232419 209780 $ $ 442199
1 I ncl udes del a y cos t experi enc ed due to LD27 ma i n cha mber cl os ure Dec 2012 ‐Ma r 2013 to remove dama ged cel l
2 I ncl udes ec onomi c impact of reduced corn producti on and hi gher tra ns porta ti on cos ts due to low‐wa ter
12 It is important to remember that not all waterways affected by the drought were covered by this survey
Page37
Using available transportation rate studies conducted for navigation improvement studies on the Upper Mississippi Illinois and Ohio River it is estimated that this tonnage moves at an average transportation rate savings of $2558 a ton Therefore at 2011 traffic levels total savings on these rivers would likely have been an estimated at $58 billion dollars The three most affected Corps of Engineers districts expended $319 million to keep the lower Ohio lower Illinois Middle Mississippi and Lower Mississippi river channels open to navigation in extreme drought conditions enabling shippers to continue navigation While industry faced losses of an estimated $2770 million due to increased transportation costs through the cooperative and coordinated efforts of the Corps the Coast Guard and industry partners shippers and the Nation were able to realize a savings in transportation costs of an estimated $55 billion despite this extreme low water event
Page38
APPENDIX A ndash SHIPPER QUESTIONNAIRE
PageA‐1
OMB Control 0710-0001 Expiration date 02282015
2012 DROUGHTLOCK 27 CLOSURE ndash SHIPPER SURVEY
Date
Firm
Address
Phone
FAX
Point of Contact
Title
General Description of Firm and Products Produced
NOTE ALL RESPONSES WILL BE TREATED AS CONFIDENTIAL
1 Was your company impacted by the closure event at Lock 27 in 2012 Yes No Was your company impacted by low water associated with the Drought Low water conditions in 2012 Yes No (If no interview is complete)
2 Does your company have a response plan for these types of impacts If so did it result in additional work organization to implement or was it detailed enough to cover all the impacts
1
PageA‐2
OMB Control 0710-0001 Expirat ion date 0228201 5
2012 DROUGHTLOCK 27 CLOSURE- SHIPPER SURVEY
LD27 closure
only Low
wate1middot Descriptio n of Response
a No change in procedmes b Stockpiled product and waited for traffic to clear if closme or changed loading depth in barges for low wat er c Switched to all-overland mode for product delivety from existing somces d Switched to different watervray routing for product delivety from existing somces e Switched product somce to an entirely new somce f Ceased operations dming the period g Altered production during the period h Switched production to another facility i Purchased intermediate or final product rather than produced j Other or combinations of the above (Please explain)
3 During th e 2012 event (either Low water or Lock 27 closure) what was your companys response Please indicate with an x in the appropriate box
4 Ifyou have checked c or d in question 3 please complete the following table
Movement Commodity Affected tonnage
Origin (City State)
Destination (City State)
Deliverd $ ton
plio1middot to drou2ht
Delivered $to n
during drou2ht
Examples
I Com 12000 Minneapolis New Orleans $30 $35
MN LA
2 Lube oils 4000 Houston TX Huntington wv $40 $50
2
PageA-3
OMB Contro l 0710-0001 Expiration date 02 282015
2012 DROUGHTLOCK 27 CLOSURE - SHIPPER SURVEY
5 Ifyou checked e in question 2 please complete the following table
Movement Commodity Affected tonnage
P reshydrou ght Origin
(City State)
Ch an ged Origin
(City State)
Destination (City State)
Deliver d $ton
pri01middot to drought
Delivered $ton
dming drought
Examples
1 Com 12000 Minneapolis MN
Cincinnati OH
New Orleans LA
$30 $35
2 Lube oils 4000 Houston TX Ashland KY
Pittsburgh PA $40 $50
6 Ifyou checked response a orb lmder question 3 how were your total production costs affected during the period of closure at Lock 27 or Drought-related low water (total increase in cost if applicable) Please explain
7 Ifyou checked response f under question 3 what was the total estimated loss to your fi1m as a result of ceasing production (during the closure period at Lock 27 or Drought)
3
Page A-4
OMB Control 0710-0001 Expiration date 02282015
2012 DROUGHTLOCK 27 CLOSURE ndash SHIPPER SURVEY
8 If you checked response ldquogrdquo under question 3 what was the total estimated loss to your firm as a result of altering production processes (during the closure period at Lock 27 or Drought)
9 If you checked response ldquohrdquo under question 3 what was the total increase in costs to your firm as a result of changing production locations (during the closure period at Lock 27 or Drought)
10 If you checked ldquoirdquo under question 3 to what extent did purchasing intermediate or final product increase your companyrsquos total costs (during the closure period at Lock 27 or Drought)
11 If you checked response ldquojrdquo under question 3 to what extent did the other measures or combination of measures undertaken as a result of the closure increase your companyrsquos total production costs (during the closure period at Lock 27 or Drought)
4
PageA‐5
OMB Control 0710-0001 Expiration date 02282015
2012 DROUGHTLOCK 27 CLOSURE ndash SHIPPER SURVEY
12 Have these events (drought-related low water or Lock 27 closure) caused your company to alter its long-term transportation strategy (eg switch to all-overland modes increase stockpiles etc) How will this impact your total commodity transportation or other costs (per year) Please explain
13 Has the (drought-related low water or Lock 27 closure) caused your company to take any other long-term permanent measures Please explain How will this affect your companyrsquos long-term operating costs (per year)
14 Has your company been impacted by other navigation system disruptions this shipping season (these would be other than the Low water from the drought or the Lock 27 closure)
5
PageA‐6
Event Date 2 Short-term response 3 Long-term responseExample
McAlpine closure
Jan ndash Feb 2006 Diverted to overland modes
none
OMB Control 0710-0001 Expiration date 02282015
2012 DROUGHTLOCK 27 CLOSURE ndash SHIPPER SURVEY
15 If your company has experienced significant navigation disruptions1 prior to this shipping season please complete the following table
1 Significant navigation system disruptions are defined as disruptions that result in delays to your shipment of more than 48 hours (include scheduled and unscheduled lock outages accidents and low and high water events)
2 Short term response refers to the response actions detailed in question 2 a No change in procedures b Stockpiled product and waited for traffic to clear or light loaded for low water c Switched to all-overland mode for product delivery from existing sources d Switched to different waterway routing for product delivery from existing sources e Switched product source to an entirely new source f Ceased operations during the period of closurelow water g Altered production during the period of closurelow water h Switched production to another facility i Purchased intermediate or final product rather than produced j Other or combinations of the above (Please explain)
3 Long term response refers to a modification of your long term business plan to include altering your long-term transportation strategy (eg switch to all-overland modes increase stockpiles etc) Other long term responses might include sourcing commodities at alternate sites or moving production activities to a different location
6
PageA‐7
PageA‐8
APPENDIX B ndash CARRIER QUESTIONNAIRE
[Typetext] PageB‐1
Waterway Carrier Interview Questions Effects of the 2012 Drought and LD27 Closure
Name of towing company -----------shyLocatio n -----------Name and title of Point of Co ntact ----------------shyPhone number ( )________ email _________
PART 1 LOW WATER DUE TO DROUGHT CONDITIO NS
1 Did your firm experience a reduction in tonnage carried on the Mississippi Ill ino is or Ohio waterways in 2012 Please verify data fo r 2010 and 2011 indicating your estimates for 2012 in table below
Operat o r Traffic Destined fo r Lower Mississippi Ports (2010 and 2011 from WCSC)
Origin 2010 2011 2012
Mississippi above St Louis Mississippi St Louis to Cairo Mississippi south of St Louis Ill inois River Ohio River
2 What facto rs led to changes in t raffic between 2011 and 2012 For example drought condit ions that affected agricultural production low water that affected your abi lit y to operate efficiently loss or gain of a contract(s) increased competit ion from rail or other factors - please specify and ind icate re lative weight of each
3 Have you had to change the way you operate your vessel fleet due to the drought If so what changes did you make and when did these occur
1
[Type text] Page B-2
4 The t wo ta bles below are intended to describe how your operat ions are affected by water depth a nd flows on the Cairo - St Louis reach of the Mississippi Rive r
a Do the operat ionalchanges suggested in t he tables below for the Cairo - St Louis reach (Upper Reach) describe the way you would operate given t he gage readings and flow shown for these two reaches in t he t ables If yes please indicate in the appropriate box in the table below with a Y if no please indicate what restrict ions you impose on your operations given t he gage and flow readings provided
Upper Rea ch- Navigation Restriction
St Louis Gage Reading
Flow (CFSOOO)
Navigation Restriction
Carriers Nav Restriction Followed
Above 20 Above 90 No restriction 00 to 20 74 to 90 25 barges -25 to 00 55 to 74 20 barges -35 to -25 485 to 55 16 barges -40 to -35 46 to 485 85 ft draft -45 to shy 4 0 44to47 80 ft draft Below -45 Below 44 Navigat ion halts
b What is t he number of tows- by size of tow horsepower and draft - that you operate through the St Louis to Cairo reach of the Mississippi For each foot of draft t hat is lost what is your added cost per t rip Please use the table below in making your response
Upper Reach- Tows moved thru the St Louis- Cairo reach in 2011 (or year not affect ed by low water)
Tow size Towboat Horseshypower
Barge Draft
Cost ton of loading below desired barge draft
Barges tow
No of tows 05 10 15 20 25 30 35 4 0
1 - 8 9 - 15
16 - 19 17 - 20 21- 25
gt25
2
[Type text] Page B-3
5 The t wo tables below are intended to describe how your operat ions are affect ed by water depth a nd flows on the Mississippi River sout h of Cairo
a Do the operat ional changes suggested in t he tables below for the Lower Reac h of the Mississippi River sout h of Cairo describe the way you would operate given the gage readings and flow shown for these two reaches in the tables If yes please indicate in t he appropriate box in t he table below with a Y if no please indicate what rest rictions you impose o n your operations given the gage and flow readings provided
Lower Reach- Navigation Restriction
Cairo Gage Reading
Flow (CFS in OOOs)
Navigation Restrictions
Carriers Nav Restriction Followed
Above 118 Above 189 No restriction 60 to 118 111 to 189 25 barges per tow
50 to 60 95 to 111 85 ft draft and 20 barges
35 TO 50 805 to 95 8 ft draft and 12 barges
Below 35 Below 805 Navigation halts
b What is t he number of tows- by size of tow horsepower and draft - that you operate on the Lower Reach of t he Mississippi south of Cairo For each foot of draft t hat is lost what is your added cost per trip Please use t he table below in making your response
Lower Reach- Tows moved through the reach south of St Louis in 2011 (or a yea r not affected by low water)
Tow size Towboat Barge Cost ton of loading below desired barge draft
Barges tow
No of tows
Horseshypower
Draft 05 10 15 20 25 30 35 4 0
1 - 12 13 - 16
17 - 20 21- 25 gt25
6 If you light load due t o low water would you proceed entire t rip as originally light loaded or top off
below Cairo or maybe add additional barges to w here the normal t ons per horsepowe r ratio is
achieved If latter how would this be done and at what cost
3
[Type text] Page B-4
7 Did any of your tows experience a grounding If yes how many total occurrences did you experience and what was the impact on your firm Please indicate your response below
total groundings
events with tows delayed more than 8 hours cost of delays
events involving lightering cargo cost of lightering
events involving towboat assists cost of towboat assists
8 What was major impact of low water due to the drought in terms of effect on your operations ‐
increased operating cost Lost business Equipment damage Safety concerns Groundings
Efficient dispatch of fleet Others
9 Please indicate the economic impact of low water levels on your company in the table below (please
include figures from your response to 5 above)
Indicate Cost with an ldquoXrdquo
if this applies to your firm
Description of impact Costton Tons
Affected Total cost
Increased transit time (including delays) Increased cost due to restricted tow sizes Increased costs due to light loading Idle vesselslost revenue Damaged equipment Increased managementlogistics costs Other (please specify)
4
[Typetext] PageB‐5
PART 2 CLOSURE OF LD27
10 If you have tows already at the lock do you generally wait until it reopens
11 What is typical amount of time you will wait at a lock for it to reopen before you decide to do
something else What do you do if you decide not to wait any longer What factors affect this
decision If you re‐dispatch the tow what does this cost
12 If you have tows underway in the system and a closure occurs at a lock to be transited do you
continue to the closure point wait elsewhere or re‐dispatch the tow What factors affect this decision
13 Please indicate the economic impact of the closure of LD27 on your company in the table below
Indicate Cost with an ldquoXrdquo
if this applies to your firm
Description of impact Costton Tons
Affected Total cost
Delay costs at the lock Delays in place (dock or port) Idle vesselslost revenue Increased managementlogistics costs costs (including re‐dispatching) Other (please specify)
PART 3 FINAL COMMENTS
14 Do you have any other information that would help us describe and quantify the economic impact on
waterway carriers associated with low water due to the drought of 2012 andor the closure of LD27
5
[Typetext] PageB‐6
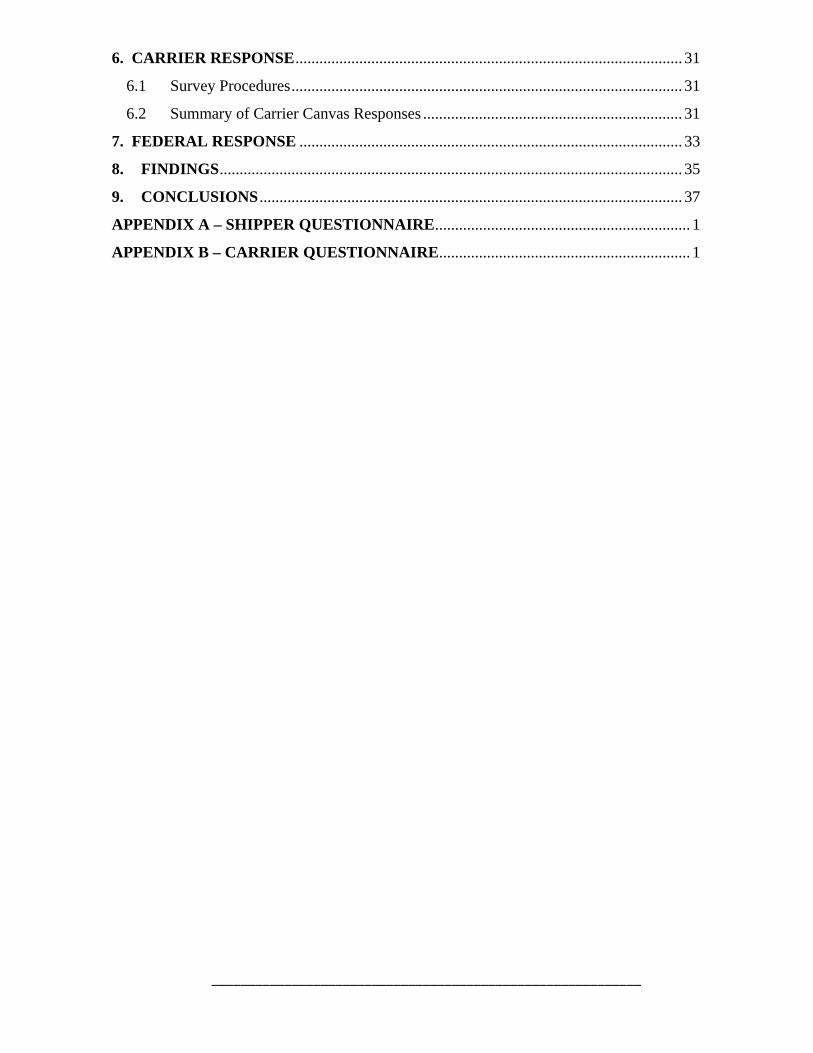
___________________________________________________________
LIST OFTABLES
Table 1 US Corn and Soybean Production and Exports 4 Table 2 US Corn and Soybean Production 2010 ndash 2012 9 Table 3 Shipments and Receipts by State 10 Table 4 Traffic by Reach 10 Table 5 Traffic by Major Commodity 2007 - 2011 12 Table 6 Waterway Traffic Past Thebes Illinois 16 Table 7 Loaded Barges Past Greenville Mississippi ndash 2011 and 2012 17 Table 8 Barges Tows and Barges per Tow Selected Locks 19 Table 9 Costs Incurred by the Corps 33 Table 10 Survey Results - Low Water Cost Impacts 36 Table 11 Low Water Cost Impacts from 2012 Event 37
LIST OFFIGURES
Figure 1 The Mississippi River Basin 3 Figure 2 Extent and Depth of 2012 Drought 5 Figure 3 Water Levels in Memphis ndash 2011 and 2012 6 Figure 4 Mississippi River Stages at Vicksburg Mississippi 6 Figure 5 Groundings through 28 November 2012 as reported by the US Coast Guard 7 Figure 6 Removal of stone at rock pinnacle 8 Figure 7 Commodity Shares by Reach 11 Figure 8 Monthly Traffic at Selected Locks 2007 2011 and 2012 14 Figure 9 Powerhouse at Ohio River LD53 Spring 2011 15 Figure 10 Tows delayed Due to Low-water at Greenville Mississippi August 20 2012 17 Figure 11 Tow Counts at Selected Locks 2011 and 2012 18 Figure 12 Average Barge Loadings at Selected Locks 2011 amp 2012 20 Figure 13 Average Barge Loadings at Selected Locks 2007 - 2012 21 Figure 14 LD27 Tow Arrivals 2012 24 Figure 15 LD27 Average Hourly Delays 2012 25 Figure 16 LD27 Tow Arrivals December 2012 ndash March 2013 26 Figure 17 LD27 Minimum Maximum and Average Tow Delays December 2012 ndash March 2013 27
___________________________________________________________
1 PURPOSE AND INTRODUCTION
Lower than normal precipitation in the Mississippi River Basin recorded in the winter and spring of 2012 was an early indicator of what evolved into drought conditions throughout much of the basin Field crops in Midwestern states experienced extreme conditions of stress Reservoirs provided maximum supplies under approved operating procedures to augment flow for water quality and supplies and for inland navigation on the Mississippi River in particular Both the drought and accompanying low water on the Mississippi River were widely reported by local and national media outlets throughout 2012 Agricultural and navigation interests were the focal point of the Nationrsquos concern as the Corp of Engineers and the US Coast Guard employed extraordinary measures to keep shipping lanes safe and open These measures while mitigating the adverse circumstances to some extent did not prevent waterway stakeholders from absorbing additional costs
The Corps of Engineers decided to formulate an estimate of these costs in order to better understand the importance of these major waterways to commercial users A major part of this effort was a survey of both waterway carriers and shippers dependent upon the high traffic volume waterways that experienced low water conditions (the affected waterways were the Mississippi River (the Mississippi River between St Louis Missouri and Cairo Illinois and between Cairo and Baton Rouge Louisiana) the lower Illinois River and the lower Ohio River) Surveys sent to carriers and shippers were designed to elicit economic impact information related to this protracted period of low water to include the river closure due to the accident at LD27
This report focuses on the impact of the low flows on major commercial cargo arteries in the Mississippi River Basin ndash specifically the Mississippi Ohio and Illinois Rivers ndash and estimates economic impacts from drought-related low flows and associated unexpected closure of Locks and Dam 27 Costs incurred by the Federal government specifically the Corps of Engineers are reported to the extent they are available
This study relied upon readily available data from public Corps of Engineers and US Coast Guard sources to describe river conditions events that occurred as a result of low water conditions and efforts to manage vessel traffic A targeted survey of inland waterway carriers and shippers was used to estimate the economic effects of interruptions and disruptions to navigation that occurred as a result of the drought and associated low water conditions
Page1
Page2
Figure 1 The Mississippi River Basin
2 BACKGROUND
21 Drought
The drought of 2012 affected much of the Mississippi River Basin whose major streams are corridors of inland waterway commerce in the Midwest and Plains states (see FIGURE 1) Four waterway reaches that experienced low water conditions and carry bulk commodities in excess of 25 million tons annually were identified for closer examination in this study 1) the Ohio River between Smithland LD and the mouth of the Ohio River 2) the Illinois River between Peoria LD and the mouth of the Illinois 3) the Mississippi River between the confluence of the Ohio River and Baton Rouge Louisiana and 4) the Mississippi River between St Louis Missouri and the confluence of the Ohio In 2011 shippers in 20 states moved commodity through the four reaches with ten different states (Arkansas Illinois Indiana Kentucky Louisiana Missouri Mississippi Ohio Tennessee and West Virginia) in the top five in shipping or receiving commodities in one or more of these reaches
The US Department of Agriculture estimated that nearly 80 percent of agricultural land was affected by drought in 2012 with 70 ndash 75 percent of the corn and soybean production affected by severe or greater drought By September 2012 over 2000 counties were
Page3
designated disaster areas by USDA3 In the Midwest the drought destroyed or damaged corn and soybean crops in particular ndash both the region and producers of these commodities being served by the inland waterway system Corn production declined by 13 percent between the 2011 and 2012 marketing year soybeans by 3 percent and corn exports fell by 51 percent (see TABLE 1)
Table 1 US Corn and Soybean Production and Exports (in millions of bushels)
Ma rke t Ye a r 1 Production
Cha nge from
pre vious ye a r Ex ports
Cha nge from pre vious
year
200708 1303788 -- 243740 --200809 1209165 -7 184895 -24 200910 1309186 8 198002 7 201011 1244687 -5 183417 -7 201112 1235961 -1 154260 -16 201213 1078030 -13 75000 -51
Sourc e USDA Economic Research Service Feed Outlook 1 market year is from September to August
US Soybe a n Production a nd Ex ports 2007 to 201213
(in millions of bushels)
Market Year 1 Production
Cha nge from
previous year Ex ports
Change from
pre vious year
200708 267712 -- 115883 --
200809 296701 11 127929 10
200910 335901 13 149905 17
201011 332918 -1 150094 0
201112 309352 -7 136185 -9
201213 301500 -3 134500 -1
Source USDA Ec onomic Res earch Servic e US Oilcrops Yearb ook
1 market y ear is from September to August
Drought in western Texas spread throughout most of the Great Plains and into the lower Ohio Valley through the spring of 2012 (see FIGURE 2) and winter months of 2013 Extreme and Exceptional drought was persistent in the Great Plains states of South Dakota Nebraska Kansas Oklahoma and northern Texas ndash all major agricultural producing areas Extreme drought reached into the Midwest states in particular southern Minnesota Iowa Illinois Indiana and Missouri ndash all major producers of corn and soybeans4 The wheat crop
3 See the USDA Economic Research Service ldquoUS Drought 2012 Farm and Food Impactsrdquo athttpwwwersusdagovtopicsin‐the‐newsus‐drought‐2012‐farm‐and‐food‐impactsaspx4 Extremedroughts arecharacterized bycrop losses and widespread water shortages or restrictionsExceptionaldroughts are characterized by widespreadcroplosses shortages of waterinreservoirsstreamsand wellscreatingwateremergenciesSeehttpdroughtmonitorunleduclassifyhtm
Page4
was largely spared as it was harvested in late spring prior to the drought taking hold in these states
Figure 2 Extent and Depth of 2012 Drought
22 Low Water
In addition to agriculture the 2012 drought affected water supplies for industrial and municipal uses recreation and the ability to navigate on the Mississippi River and its navigable tributaries Small harbors and terminals saw rivers fall to levels not experienced in nearly 50 years (see FIGURE 3)
Page5
Figure 3 Water Levels in Memphis ndash 2011 and 2012
Figure 4 Mississippi River Stages at Vicksburg Mississippi
Low water conditions rivaled those observed during the 1988 drought event By November 2012 water levels on the Mississippi River fell below those experienced in 1988 (see FIGURE 4) Beginning in May 2012 the Mississippi River stage reached the lowest level observed in the past 112 years Heavy rain and flooding in the Mississippi River Basin ended the low water problems in March 2013
Page6
Figure 5 Groundings through 28 November 2012 as reported by the US Coast Guard
Low water on these major waterway transportation arteries hampered navigation Tows accustomed to wide and deep navigable channels began to suffer from groundings along the length of the Mississippi River (see FIGURE 5) At Mississippi River LD27 water levels fell below the armor-protected area of sheet pile guide cells What would ordinarily be routine impacts on the guide cell as tows aligned to enter the locks led to failure of the cell as impacts occurred on unprotected regions of the sheet pile protectionguide cell Failure of the cell and subsequent clean-up of gravel spilled from the ruptured cell resulted in closure of the Mississippi River at the location of LD27 for approximately five days from 14 September 2012 until 20 September 2012
Groundings of tows occurred along nearly the entire length of the Mississippi River and were especially problematic along the border of northern Illinois between Thebes and Grand Tower Illinois and in the general vicinity of Greenville Mississippi According to the US Coast Guard 18 groundings on the Lower Mississippi led to closure events with more than 25 tows in queues River closures became necessary when tows stuck in shallow water had to be removed when tows broke apart and barges had to be retrieved and reassembled or when it was determined that the channel needed to be surveyed dredged and channel buoys reset
Page7
Figure 6 Removal of stone at rock pinnacle
Water levels on the Mississippi River at Thebes Illinois and at Grand Tower Illinois exposed rock ledges that reduced navigable drafts to 9 feet (well below customary drafts of 10 and 11 feet) and restricted the channel to one-way traffic5 The Corps removed these hazards in early 2013 (see FIGURE 6)
5 According to the US Army Corps of Engineers St Louis District River Projects Manager there was one‐way traffic at the pinnacles with 12 hour closures each day during the removal from 1Jan 2013 to roughly 15 February 2013 There were also other reaches of the river where there wasinsufficientchannelwidthof therequireddepthto permit two‐way traffic
Page8
3 WATERWAY TRAFFIC
31 General
Waterway traffic examined in this section focuses on the Lower Mississippi River and lower reaches of the Upper Mississippi Illinois and Ohio Rivers While the drought also seriously affected waterways in the southwest and the Missouri River traffic flows on these other rivers is relatively small in comparison with the Mississippi Illinois and Ohio Rivers Comparable data through December 2012 was available from the US Army Corps of Engineers Waterborne Commerce Statistics (WCS) and Lock Performance Monitoring System (LPMS) data sets for convenience of comparison only data through December 2012 is examined in this section of the report
32 Traffic Patterns
With the exception of Minnesota major grain and oilseed producing states saw sharp percentage declines in production that exceeded what was a national decline (See TABLE 2) All of these major producing states are touched by navigable waterways The expectation is that this diminished production of corn and soybeans should be reflected in decreased waterway traffic in these commodities
Table 2 US Corn and Soybean Production 2010 ndash 2012
IL IN IA MN MO NE OH US Corn (000s bushels)
201000 1946800 89804000 2153250 1292100 369000 1469100 533010 12446865 201100 1946800 839500 2356400 1201200 349980 1536000 508760 12359612 201200 1286250 596920 1876900 1374450 247500 1292200 448950 10780296
change 2011 ‐ 12 ‐339 ‐289 ‐203 144 ‐293 ‐159 ‐118 ‐128 Soybeans (000s bushels)
201000 466075 258505 496230 328950 210405 267750 220320 3329181 201100 423225 240695 475345 274560 190165 261360 217920 3093524 201200 383560 223590 413850 300570 155170 207085 206100 3014998
change 2011 ‐ 12 ‐94 ‐71 ‐129 95 ‐184 ‐208 ‐54 ‐25 Source Crop Production 2012 Summary USDA National Agricultural Statis tics Service January 2013
321 Waterway Reaches and States
Four waterway reaches that experienced low water conditions and carry bulk commodities in excess of 25 million tons annually were identified for closer examination in this study 1) the Ohio River between Smithland LD and the mouth of the Ohio River 2) the Illinois River between Peoria LD and the mouth of the Illinois River 3) the Mississippi River between the confluence of the Ohio River and Baton Rouge Louisiana and 4) the Mississippi River between St Louis Missouri and the confluence of the Ohio In 2011 shippers in 20 states moved commodity through the four reaches with ten different states (Arkansas Illinois Indiana Kentucky Louisiana Missouri Mississippi Ohio Tennessee and West Virginia) in the top five in shipping or receiving commodities in one or more of these reaches (see TABLE 3)
Page9
Table 3 Shipments and Receipts by State
State
Ohio River ‐ Smithland LD to Cairo IL
Illinois River ‐ Peoria LD to the Mouth
Mississippi R ‐ Cairo IL to Baton Rouge LA
Mississippi River ‐ StLouis to Cairo IL
ship receive ship receive ship receive ship receive AL 1435 4 049 214 489 1340 2351 337 1840 AR 470 972 139 157 6634 6628 235 1336 FL ‐ 41 ‐ 6 30 151 2 64 IA 292 308 23 5 5088 1532 5380 2397 IL 27819 4 477 19 170 11 428 45735 10171 49496 14764 IN 5738 14523 686 863 4994 2713 595 3794 KY 26306 10540 214 438 20 197 6 953 902 1 465 LA 16743 37420 6782 13629 44 026 114 919 14 816 58 194 MN 173 122 14 149 4 860 2 384 5 048 3 021 MO 1992 683 938 152 21 414 3 750 25 302 5 681 MS 697 1383 175 104 4 473 4 508 264 1 005 NE ‐ ‐ ‐ ‐ 8 13 8 13 NY ‐ ‐ ‐ ‐ 2 ‐ ‐ ‐
OH 2940 9188 126 112 2011 4956 710 1939 OK 192 260 138 88 2795 2391 189 240 OT ‐ ‐ ‐ ‐ ‐ 10 ‐ 10 PA 1143 2266 12 54 860 1848 240 101 TN 2494 9005 82 719 5770 9870 257 6200 TX 2930 954 874 1257 5034 5046 1 017 2 996 WI 29 2 ‐ 4 633 243 664 975 WV 7984 3184 146 79 6650 2117 1115 542
Sour c e US Army Corps of Engi neer s Wa terbor ne Commer ce Sta ti s ti cs Center
Note OT (Other) designates moves to unidentified states
Between 2011 and 2012 the Illinois reach experienced the greatest percentage decline in traffic (47 percent) and the Mississippi River between St Louis and Cairo Illinois experienced the greatest tonnage decline at just over 32 million tons (see TABLE 4) The Mississippi River below Cairo Illinois actually showed an increase in traffic between 2011 and 2012
Table 4 Traffic by Reach (ktons)
Waterway Reach 2007 2008 2009 2010 2011 2012 1
Change 2011 to 2012
ktons Change
Ohio River ‐ Smi thland LD to Cairo IL 108746 113329 94639 101756 99378 98328 (1049) ‐11 Illinois River ‐ Peoria LD to the Mouth 32868 30212 29569 29267 29735 28324 (1411) ‐47 Missis s ippi River ‐ Cairo IL to Baton Rouge LA 185872 176329 166557 176879 182551 184779 2228 12 Missis s ippi River ‐ StL oui s to Cairo IL 109763 98572 104275 102896 106579 103359 (3219) ‐30 Sour ce US Ar my Corps of Engi n eer s Wa ter bor ne Co mmer c e Sta ti s ti c s Center
1 preliminary 2012
Many of the movements represented in the table above transit more than one of the waterway reaches being considered therefore total tonnage cannot be calculated simply by summing the traffic reported for individual reaches This value was drawn from the 2011 Waterborne Commerce Statistics which indicate that in 2011 the total tonnage moving through these reaches was 2273 million tons Using available transportation rate studies conducted for navigation improvement studies on the Upper Mississippi Illinois and Ohio River it is estimated that this
Page10
Ohi o River - Smith land t o Mouth 2011 coal Il linois River Peoria LD to Mouth 2011 aggregates
2
sulfur clay amp salt 4
o ilseeds 4 co rn
25
corn 6
cr ud e petrol aggregates 0
15
Mississippi River - St Louis to Cairo 2011 coal
coal 19
all other
cru de petrol 2
aggregates 9
sul fu r clay amp saft
3
12 15
salt 4
Mississippi River - Cairoto Baton Rouge 2011
8
Figure 7 Commodity Shmmiddotes by Reach
tollllage moves at an average umiddotansportation rate savings of $25 58 a ton It is therefore estimated that shippers using this segment of the inland wate1way system save a total of $58 billion over the best altemative mode andor route ofumiddotansportation
322 Commodities
Coal is the predominant commodity moving through the Ohio reach (see FIGURE 7) Com is the single m ost dominant commodity moving through the Illinois River reach though products in the all other group represent the maj ority of this Illinois River reach s tollllage Peumiddotoleum products at 45 million tons chemicals and fe1tilizers at 52 million tons and iron and steel products at 22 million tons are the primmy commodities in this group On both reaches of the Mississippi River coal is the lmmiddotgest single commodity by tons closely followed by com Agricultural products (all grains oilseeds vegetable products and feeds) amounted to 61 8 million tons or 34 percent of Cairo to Baton Rouge tollllage and 369 million tons or 35 of St Louis to Cairo tons
Traffic figmes by reach and by commodity shown in TABLE 5 begin to display the impact of both lower agricultmal production and low water levels on wate1way umiddotaffic The Ohio River wate1way reach showed only a slight decline (1 percent) but commodities with mmmiddotkets or som ces on the lower Mississippi and Gulf Coast showed declines in umiddotaffic between 2011 and 2012 typified by the sulfur clay and salt group 6 Salt com and stone all showed significant
6 According to LPMS data coal traffic at LD53 declined from 142 million tons to 12 9 million tons (a 136 percent decline) the latter half of2012 compared with the same period of2011 This fo llowed an 09 million ton increase (72 percent) for the first six months of2012 compared w ith the same period in 2011
Page 11
declines While corn shipment declines could be tied to decreased production lower stone and salt shipments were likely the result of low water conditions that affected the cost of shipment or an ability to delay shipment Oilseeds traffic grew by 25 percent reflecting a late season improvement in soybean harvest
Table 5 Traffic by Major Commodity 2007 - 2011 (ktons)
Waterway Reach 2007 2008 2009 2010 2011 2012 1 Change 2011 to 2012 ktons Change
Ohio River ‐ Smithland LD to Cairo IL 108746 113329 94639 101756 99378 98328 (1049) ‐11
coal 37737 46943 37792 38433 40526 41949 1423 35 crude petroleum 106 53 44 46 145 590 445 3072 aggregates 18394 17445 15703 17303 15437 13569 (1868) ‐121 sulfur clay amp salt 2468 3352 3387 3717 3552 2427 (1125) ‐317 corn 7320 6961 6616 7013 5518 4632 (886) ‐161 oilseeds 4058 3969 5004 5176 4189 5221 1033 247 all other 38664 34607 26093 30067 30012 29941 (70) ‐02
Illinois River ‐ Peoria LD to the Mouth 32868 30212 29569 29267 29735 28324 (1411) ‐47
coal 1597 1548 777 919 1727 1150 (576) ‐334 crude petroleum 15 1 21 6 30 583 554 18635 aggregates 874 499 495 232 564 743 178 316 sulfur clay amp s alt 1169 2090 2282 881 1125 882 (243) ‐216 corn 9839 8017 9643 9137 7549 4934 (2615) ‐346 oilseeds 1940 1650 2637 2769 2503 3808 1305 521 all other 17434 16407 13715 15323 16237 16224 (13) ‐01
Mississippi River ‐ Cairo IL to Baton Rouge LA 185872 176329 166557 176879 182551 184779 2228 12
coal 22208 26629 23326 23648 34122 37163 3041 89 crude petroleum 1383 1848 1852 1901 3984 5764 1780 447 aggregates 17923 18009 17741 18474 16035 14575 (1460) ‐91 sulfur clay amp s alt 5304 7863 7962 6322 6648 4639 (2010) ‐302 corn 35465 28293 30872 31835 28065 20842 (7223) ‐257 oilseeds 17966 17648 23807 25216 21324 28369 7045 330 all other 85622 76039 60998 69483 72373 73427 1055 15
Mississippi River ‐ StLouis to Cairo IL 109763 98572 104275 102896 106579 103359 (3219) ‐30
coal 26428 26228 27127 22262 25589 22290 (3299) ‐129 crude petroleum 375 725 677 891 3229 4847 1617 501 aggregates 9735 8691 8425 8335 7947 8799 852 107 sulfur clay amp s alt 2726 4389 4475 2481 3136 2160 (976) ‐311 corn 26951 19755 23504 23824 20760 14273 (6487) ‐312 oilseeds 9687 8642 12531 12471 10682 15354 4672 437 all other 33861 30142 27536 32632 35236 35638 402 11
Source US Army Corps of Engi neers Waterborne Commerce Stati s ti cs Center
1 Prel imi nary 2012
The Illinois River reach showed the greatest percentage decline between 2011 and 2012 (5 percent) with declines in corn (35 percent) coal (33 percent) and salt (22 percent) showing the largest decreases Coal declines were influenced by the closure of a coal-fired electric utility
Page12
plant in late 20117 Like the Ohio commodities moving to and from the lower Mississippi were most affected The Mississippi River between Cairo and Baton Rouge had sizable declines in salt (30 percent) and corn (26 percent) while oilseed traffic grew (33 percent) The Mississippi River between St Louis and Cairo declined the most in tonnage (32 million tons) with salt and corn both declining by 31 percent Oilseeds increased by 44 percent and stone by 10 percent Given the 51 percent decrease in US corn exports (refer to TABLE 1) it is not surprising that corn traffic to the Gulf would decline when approximately half of all US corn exports move by barge to the lower Mississippi and Gulf Coast The ldquoall otherrdquo commodity group was the least affected by the drought All four river reaches experienced sharp percentage increases in crude oil movements though the tonnages were relatively small in each reach These increases likely reflected the first significant movement of shale gas liquids on the inland waterway system
323 Monthly Shipping Patterns
The Corpsrsquo Lock Performance Monitoring System (LPMS) data has reliable information on tow transits commodity tonnages and barge counts by month at all Corps lock and dam projects Three locksndash Ohio River LD53 Mississippi River LD27 and Peoria LD ndash were selected for closer examination of shipping patterns (discussed in this section) and fleet utilization (discussed in the next section) Ohio River LD53 is the closest Ohio River lock to the mouth of the Ohio River so it offers a fair representation of traffic on the lower reach of the Ohio Similarly Peoria LD is closest to the mouth of the Illinois River and Mississippi River LD27 is the furthest downstream lock on the Mississippi Each offers fair representations of the Peoria to the mouth of the Illinois and St Louis to Cairo reaches of these two rivers respectively
As seen in FIGURE 8 monthly traffic at Ohio River LD53 ranged between 50 million and 70 million tons per month in the years selected for analysis (2007 2011 and 2012)
7 AmerenEnergy closedtheMeredosiaplant inlate 2011Seewwwfuturegenallianceorgcommunity‐cogen201303 accessed26July2013
Page13
8000000
7000000
6000000
5000000
~ 4000000 3000000
2000000
1000000
-
Ohio River LDS3 Traffic by Month
--- ~ -~ V- -
-
-
-
2007
2011
2012
9000000 8000000 7000000 6000000
~ 5000000 ~ 4000000
3000000 2000000 1000000
Mississippi River LD27 Traffic by Month
-
-
-
2007
2011
2012
3000000
2500000
2000000 Ill 1 1500000 01shy
1000000
500000
Peoria LD Traffic by Month
-
-
-
2007
2011
2012
Figure 8 Monthly Traffic at Selected Locks 2007 2011 and 2012
Page 14
Figure 9 Powerhouse at Ohio River LD53 Spring 2011
The range of variation would likely have been tighter except for the high water event in the spring of 2011 (see FIGURE 9) which caused a sharp drop in traffic in May of that year Traffic at Mississippi River LD27 and Peoria LD follows a more cyclical pattern than that shown on the Ohio River July and November are typically peak months at LD27 and July and NovemberDecember at Peoria LD Monthly volumes in 2012 mirrored those of 2011 at both locks though at lower levels particularly in the summer and fall when the drought was most intense
33 Middle Mississippi ‐Traffic Past Thebes Illinois Navigating the Middle Mississippi River between St Louis and Cairo Illinois especially in the vicinity of Thebes Illinois and Grand Tower Illinois was a serious challenge for vessel operators 8 These two stretches experienced low water that exposed rock ledges called pinnacles which exposed vessels to grounding and damage Traffic was restricted to one way for periods in the fall of 2012 and the US Coast Guard imposed tow size and draft restrictions Large towboats that customarily move through these reaches could not navigate the restricted draft around Thebes and Grand Tower Illinois necessitating the shuttling of barges through this reach and refleeting above and below the constrictions
Waterway carriers were apparently determined to satisfy shipper needs as traffic through the restricted reaches at Thebes Illinois was largely unchanged between 2011 and 2012 ( see TABLE 6) Declines in corn traffic related to lower corn production were replaced with higher downbound moves of soybean aggregates and crude petroleum
8 See httpwwwstltodaycomnewslocalmetrolow‐water‐on‐mississippi‐river‐causes‐barge‐companies‐to‐lightenarticle 2b1505f1‐ab93‐5e73‐9a36‐d43ff5c8c0b6html
Page15
Table 6 Waterway Traffic Past Thebes Illinois
2011 2012 LPMS Name Up Down Total Up Down Total
CoalLignite amp Coal Coke 2274342 20849891 23124233 2092647 18825680 20918327 Crude Petroleum 22853 3206496 3229349 29239 4780424 4809663 DistillateResidual amp Other Fuel Oils Lube Oil amp Greases 730648 2305378 3036026 614765 2113449 2728214 Petroleum Pitches Coke Asphal t Naptha and Sol vents 335480 2427538 2763018 342221 3161000 3503221 Ferti l izers 6004043 249240 6253283 5905454 229606 6135060 Other Chemicals and Related Products 2 800 138 2 417 289 5 217 427 2 760 812 2 127 573 4 888 385 Sand Gravel Stone Rock Li mes tone Soil Dredged Material 729938 5715696 6445634 807605 7380288 8187893 Iron Ore and Iron amp Steel Waste amp Scrap 331 790 1 042 578 1 374 368 252 297 918 336 1 170 633 Sulphur (Dry) Clay amp Salt 3020775 114884 3135659 2091825 100469 2192294 Slag 226099 150649 376748 362250 113363 475613 Building Cement amp Concrete Li me Glass 69839 3343391 3413230 76587 3914565 3991152 Primary Iron and Steel Products (IngotsBarsRodsetc) 2077909 414447 2492356 2498038 456312 2954350 Wheat 3366 1640911 1644277 5418 1406811 1412229 Corn 8956 20548560 20557516 327740 13783421 14111161 Oil seeds (Soybean Fl axs eed and Others) 68755 10534468 10603223 91354 15187093 15278447 Animal Feed Grain Mi l l Products Flour Processed Grains 52619 2972138 3024757 79030 2537614 2616644 All Others 1817209 953399 2770608 1833834 976248 2810082 TOTAL 20574759 78886953 99461712 20171116 78012252 98183368 Source Waterborne Commerce Statistics
Note Orange shaded cells denote commodities where declines greater than 1000000 tons were experienced between 2011 and 2012 while green shaded cells denote growth of greater than 1000000 tons between 2011 and 2012
34 Lower Mississippi ‐Traffic at Greenville Mississippi
With flows falling throughout the summer on the heavily used Lower Mississippi River tow groundings began to occur - the first being reported on 11 May 2012 Groundings led the US Coast Guard to restrict drafts and tow sizes on the Lower Mississippi where some reaches required dredging in order for vessels to safely navigate 9 One of the more widely reported events occurred on an 11-mile stretch of the river near Greenville Mississippi where intermittent river closures occurred to accommodate the freeing of grounded tows surveying of channel and dredging to open channel It was reported that on August 20 2012 that nearly 100 tows had been delayed near Greenville waiting for the channel to reopen10 Similar events occurred along the Lower Mississippi in locations including Memphis Tennessee Helena Arkansas and Natchez Mississippi
According to the US Coast Guard 18 groundings led to closure events with more than 25 tows in queues In total these events caused 1130 tows and 17640 barges to be delayed Closures of the river occurred when tows needed to be pulled from bars or banks reassembled after breaking-up upon running aground or when channel work was required Industry worked together to free and re-assemble tows Where groundings became frequent in specific areas the US Coast Guard the US Army Corps of Engineers and industry jointly determined when a river closure was necessary to allow the Corps to survey and dredge the channel and the Coast Guard to reset buoys that mark the channel By June draft restrictions were set at 10rsquo6rdquo northbound tow sizes to 42 barges per tow and southbound tows to 36 barges per tow In early July drafts were down to 9rsquo6rdquo and tow sizes further reduced in late July drafts were restricted to 9rsquo northbound tow sizes to 20 loaded barges per tow and southbound tow sizes to 30 barges per
9 httpcornandsoybeandigestcomissuesforced‐barge‐light‐loading‐low‐mississippi‐river accessed 31July201310 httpearthobservatorynasagovIOTDviewphpid=78927 accessedon31July2013
Page16
Figure 10 Tows delayed due to low-water at Greenville Mississippi August 20 2012 Source NASA See footnote number 7
tow By mid-August one way traffic was instituted in problem reaches drafts were limited to 9rsquo and tow sizes limited further Draft and tow size restrictions were gradually relaxed but it was not until 14 December 2012 that all restrictions were lifted
Like the Thebes Illinois constriction point the Greenville Mississippi constriction did not affect traffic levels in fact traffic increased by 2 million tons between 2011 and 2012 (see TABLE 7) The effects of the low water can be seen in the tons per loaded barge which declined by 46 tons on average for the entire year As with the constriction at Thebes waterway carriers were apparently determined to satisfy shipper needs though this came at higher transportation costs Corn harvests along the Lower Mississippi were less affected by the drought than in the traditional Corn Belt regions served by the Upper Mississippi Ohio and Illinois Rivers which coupled with stronger soybean traffic led to increased traffic through this reach as opposed to more steady traffic through Thebes
Table 7 Loaded Barges Past Greenville Mississippi ndash 2011 and 2012
2011 2012 Difference 2011 ‐ 2012
Loaded Barges 92108 95760 3652 Tons 163314542 165384334 2069792 Tons per Loaded Barge 17731 17271 (46)
Source US Army Corps of Engineers Waterborne Commerce Statistics Center
Page17
700
600
500
400
300
200
100
f- f-
f-f-r-
Ohio River LD53
Tow Counts 2011 amp 2012
r- f-I-- fshy f- f-
r- r- r- r-f- f- f- f-r- r- r- r-
f-f-
f-f-rshy
800
700
600
500
400
300
200
100
r-r-fshy1shy-shy
Mississippi River LD27 Tow Counts 2011 amp 2012
-shyt- t-r- r-r- r-f- fshy1shy 1shy-shy -shy
shyr-r-fshy1shy-shy
t-rshy1shy
fshy1shy-shy
-
400
350
300
250
200
150
100
so
1shy
f-f-tshy-shy
Peoria LD Tow Counts 2011 amp 2012
1shy 1shy r-shyf- f- f-f- f- f-t- t- tshy-shy -shy -shy
1shy
f-f-tshy-shy
Figure 11 Tow Counts at Selected Locks 2011 and 2012
35 Fleet Utilization
The C01ps Lock Perf01mance Monitoring System (LPMS) data was examined at the three gateway locks discussed above this time for evidence of altered vessel operation pattems As seen in FIGURE 11 the effect of the 2011 high water event on the lower Ohio River is reflected in lower tow counts in April and May of that year othetwise tow counts are fairly similar between 2011 and 2012 The droughts effect was more apparent at Mississippi River LD27 an d at Peoria LD where tow counts were down significantly between 2011 and 2012 dming the summer and fall months ---------------------------------------
Page 18
Barges per tow and composition of tows did not change dramatically at any of the three locks between 2011 and 2012 (see TABLE 8) The most significant change occurred at LD53 where barges per tow dropped from 117 per tow to 111 per tow while the percentage of empties increased by 3 percent Tow sizes at LD27 remained around 75 barges per tow and grew slightly from 64 to 67 barges per tow at Peoria LD Significantly fewer loaded barges were processed at each of the three locks
Table 8 Barges Tows and Barges per Tow Selected Locks Ba rge s TOTAL
Tow s Ba rges
pe r Tow Loaded Loaded Empty Empty Tota l LD 53
2007 48592 68 23187 32 71779 7039 102 2008 48009 68 22434 32 70443 6624 106 2009 40352 65 21706 35 62058 5489 113 2010 47030 67 23602 33 70632 5984 118 2011 47465 67 22863 33 70328 6021 117 2012 45064 64 25656 36 70720 6352 111
LD 27 2007 41019 67 20574 33 61593 7217 85 2008 35391 70 15343 30 50734 6456 79 2009 37259 64 20868 36 58127 6753 86 2010 35647 65 19299 35 54946 6792 81 2011 34799 68 16709 32 51508 6909 75 2012 34237 67 16904 33 51141 6713 76
Peoria 2007 15336 67 7519 33 22855 3264 70 2008 13526 69 5981 31 19507 3063 64 2009 13376 64 7677 36 21053 3028 70 2010 13452 65 7402 35 20854 3044 69 2011 13265 67 6621 33 19886 3087 64 2012 12702 67 6185 33 18887 2803 67
The effect on total tons of fewer loaded barges through these locks was heightened by lighter loadings measured in tons per barge (see FIGURE 12) which occurred in the late summer and fall of 2012 At LD27 loadings were down approximately 100 tons per barge in October November and December of 2012 when compared with the same months in 2011 and down approximately 75 tons per barge in October and November at Peoria LD
Page19
Ohio River LDS3 Aver age Barge Loadings
1850 ---------------------shy1800 +-------------------shy1750 -1-------=-------------shy1700
~ 1650 ~ 1600
1550 1500 1450 1400
1850 1800 1750 1700
~ 1650 ~ 1600
1550 1500 1450 1400
1850 1800 1750 1700
~ 1650 ~ 1600
1550 1500 1450 1400
Jan Feb Mar Apr May Jun Jul Aug 5ep Oct Nov Dec Ave
r r-r-r-rshyshy
Mississippi River LD27 Average Barge Loadings
r- r- r-r- r- r-r- r- r-r- r- r-r- r- rshyshy shy shy
r-
r- rshy shy
r- r- r-r- r- rshyshy shy -
Jan Feb Mar Apr May Jun Jul Aug 5ep Oct Nov Dec Ave
-shy
r-rshy-
Peori a LD Average Barge Loadings
r- r-r- r-
r- r- r-r- r- r-r- r- r-r- r- rshyshy shy shy
rshy - r-
r- r- r-r- rshy 1shy
r- r- r-r- rshy shyshy shy -
Jan Feb Mar Apr May Jun Jul Aug 5ep Oct Nov Dec Ave
Figure 12 Average Bar ge L oadings at Selected Locks 2011 amp 2012
The combination of fewer barges per tow and lighter loadings at LD27 and Peoria continued a trend at these two locks of fewer tons per tow (see FI GURE 13) A distinct pattem emerges at LD27 one that minors the pattem of grain shipments Significantly larger tons per tow occur during the peak grain shipping season These cyclical variations occur each year though the peaks an d valleys have smoothed with each passing year In 2012 the cyclical pattem is all but unnoticeable At LD53 the combination of smaller tows a greater percentage of empty barges
Page 20
LDS3 Tons per Tow by Month 2007 -2012
LD27 Tons per Tow by Months 2007 - 2012
Peoria LD Tons per Tow by Month 2007 -2012 10000
9000
8000
7000
6000
~ _ 5000
4000
3000
2000
1000
rJ A AA I IVV1 ~ AAV II1 v
1 y bull
Figure 13 Average Barge Loadings at Selected Locks 2007 - 2012
and somewhat lighter loadings caused tons per tow to drop steeply toward the end of2012 despite an increase ofover 300 tow transits that year
Page 21
36 Summary and Conclusions Traffic patterns were examined on the four high volume waterway segments affected by low water in 2012 With the exception of the Lower Mississippi from Cairo Illinois to Baton Rouge Louisiana each segment experienced lower traffic in 2012 than in 2011 Sharp declines in corn traffic undoubtedly related to a greatly diminished harvest explain most of the traffic decline though carriers continued to maintain volumes otherwise
When looking at monthly traffic levels reported in the LPMS data for the gateway locks to the Ohio Illinois and Upper Mississippi (Ohio River LD53 Peoria LD and LD 27) typical cyclical patterns of shipment are apparent in 2012 but at lower levels Vessel operators ran significantly fewer tows in the summer and fall moved fewer barges at LD27 and Peoria but more barges at OH53 ndash this increase being explained by the increased movement of empty barges Tows pushed fewer loaded barges that were more lightly loaded (100 tons per barge less than average at LD27) The end result was lower traffic at each of these three projects
Unfortunately there is no data equivalent to LPMS available at the constriction points on the Mississippi River at Thebes and Grand Tower Illinois that will describe how vessel operators configured their tows We do know that there were vessel draft restrictions that affected both loadings and the size of towboats as well as tow size restrictions According to the Waterborne Commerce Statistics waterway traffic at Thebes Illinois and Greenville Mississippi changed only slightly between 2011 and 2012 declining by 12 percent at Thebes and increasing by 12 percent at Greenville Average tons per barge declined at both locations for the year We also know from surveys and discussions with vessel operators (discussed in subsequent sections) that fleeting operations were initiated above and below the Middle Mississippi reach between Thebes and Grand Tower Illinois in order to optimize the use of a limited number of smaller towboats required through this reach while still utilizing the larger towboats that typically move through this area
Page22
4 LD27 CLOSURE ANALYSIS
41 General
Mississippi River Locks and Dam 27 (LD27) is located on the Upper Mississippi River at mile 1845 near Granite City Illinois and just above St Louis Missouri It is the 4th busiest lock in terms of tonnage processing 250 million tons of agricultural products 101 million tons of chemicals and 101 million tons of petroleum products in 2012 Three closures of special note occurred at this project in 2012 The first was a main chamber closure which occurred in January of 2012 The second was an emergency closure of both chambers caused by an accident related to low water conditions at the lock The third outage was a planned closure of the main chamber to remove the guide cell damaged during the September accident
The US Army Corps of Engineers Lock Performance Monitoring System (LPMS) collects traffic and processing data from each of its lock projects LPMS data for LD27 was analyzed in order to estimate the cost impact on waterway carriers of all three closures the latter two being directly related to the low-water experienced in 2012 The January 2012 closure analysis offers some perspective when evaluating the economic impact on carriers of the five day outage of the project that was related to low water Section 42 examines the first two closures and Section 43 the third closure that began in 2012 and ended in 2013
42 January and September 2012 Outages
The January 2012 closure was a scheduled closure of the 1200rsquo x 110rsquo main chamber The outage began on 4 January 2012 at 0433 hours and ended when the chamber was reopened on 15 March 2012 at 0039 hours The closure allowed for an embedded metal repair to be completed The main chamber was closed for 1700 hours or approximately 70 days and 20 hours The second closure occurred on 15 September 2012 at 0232 hours when a guide cell was ruptured by a tow allision The resulting gravel spill from within the cell and damage to the guide cell prohibited safe passage through the main chamber A little over 15 hours later at 1527 hours the auxiliary chamber closed resulting in a total river closure Both the main and auxiliary chambers were reopened 20 September 2012 at 0330 hours therefore for 5 days and 3 hours the Mississippi River was completely closed to waterway traffic at LD27
421 Tow Arrivals
FIGURE 14 shows the arrivals per day at LD27 for the months of January ndash September 2012 Average tow arrivals per day for the period outside the closures 15 March through 15 September 2012 was 190 tows per day Average arrivals per day for the first closure period 4 January through 15 March 2012 decreased from the 190 tows per day outside the closure period to 152 tows per day Average arrivals per day for the second closure period 15 September through 20 September 2012 were 116 tows per day versus the 190 tows per day outside the closure period
Page23
Lock 27 Upper Mississippi River Main and Auxil iary Tow Arrivals 2012 Chamber
35 ---------------------------------------------------------~~ Main Chamber Closed
15
10
0 ~--------------~----------------------------------------~~ J an Feb Mar Apr May Jun Jul Aug
5 ++---------------+----------------------------------------~~
Figure 14 LD27 Tow Arrivals 2012
422 Tow Processing Time
During the first closure of the 1200 main chamber that occmTed from Janumy through March 1089 tows umiddotansited LD27s auxilimy chamber The average processing time increased from 48 minutes for all tows outside the Janumy through Mmmiddotch 2012 closure to 78 minutes during the closure
At the beginning of the second main chamber closure from 0020 through 1527 on 15 September 2012 only two tows umiddotansited LD27 auxilimy chamber The average processing time increased from 48 minutes for all tows outside the September closure to 209 minutes during the closure
The 2012 closures increased the processing time 30 minutes per tow The 1091 tows that umiddotansited the auxilimy chamber during the main chamber closures caused an additional549 hours of tow umiddotansit time
423 Tow Delays
FIGURE 15 shows delays at LD27 for the period from Janumy- September 2012 Delays stmied building soon after the 1200 chamber closed and continued until17 Mmmiddotch 2012 at 0110 hours This means that the 1700 hour closure impacted traffic for 1749 hours The 49 hour difference represents the time required for the reopened chamber to serve th e tows in queue and bring the delay back to zero During the impact period 16366 hours of tow delay were experienced by 1148 tows This results in an average delay of 143 hourstow for the first closure in year 2012 from Janumy through March By compmmiddotison 4054 tows were served at
Page 24
LD27 outside the Januruy - Mrumiddotch and September 2012 closure periods The average nonnal delay per tow was 183 minutes or approximately 31 hours Given that the average additional delay per tow was 112 hours for the Januaty - Mrumiddotch closure and that 1 148 tows were impacted the closure caused 12866 hours of additional delay
With the September 2012 closure delays strut ed building soon after the 1200 and 600 chamber closed and continued until 25 September 2012 at 1135 hours This means that the 123 hour river closure impacted traffic for 251 hours The 128 hour difference represents the time required for the reopened chambers to serve the tows in queue and bring the delay back to zero During the impact period 6498 hours of tow delay were experienced by 141 tows This resulted in an average delay of46 hourstow Given that the average nonnal delay per tow was 31 hours the average additional delay per tow was 43 hours for the September closure and that 141 tows were impacted the closure caused 6068 hours of additional delay
A total of 1288 tows were impacted in 2012 which caused an additional delay of 18934 hours Therefore on average each tow experienced 147 hours more delay during the closure than n01mal The maximum delay was 127 hours
Lock 27 Upper Mississippi River Average Hou r ly Tow Delays - Year 2012 Main and
Auxili ary Chamber
120 - Main Chamber Closed
100 80
60
40
1 tJi20
A amp A AIt amp ~~ A middot AIAA 10 ~~~m~~~~m~~~~M~~~~M~~~~M~~~~M~~~~M~~~~M~~~~M~~~~M~~~~M~~~~M~~~~M~~~~M middotmiddot middotshy~~NNNMMVV~~~~~~~~~~~~~OOO~~NNNMMVVV~~~~~~~~~~~~OOO~~NNNMMVVV~~~~~~
~~~ bull -l-l-t-t-41ii~-l-l-t-t-lt-1 -t-t-t-t-t -l~ -t-tNNNlNiNNNN1~NNNNNNN
Jan Feb Mar Apr May Jun Jul Aug Sept
Figure 15 LD27 Average Hourly Delays 2012
424 Cost Impact
The analysis above shows that the Januruy through Mrumiddotch 2012 closure caused an additional 543 hours ofprocessing time and 12866 hours of delay Given this additional transit time and average hourly operating costs for tows at LD27 the Januruy through March closure cost caniers an additional $87 million to process through the lock The September closure caused an additional 5 hours ofprocessing time and 6068 hours of delay for a total closure cost of approximately $39 million While the 70 day closure of the main chamber resulted in additional
Page 25
costs of$124000 per day the much sholier 6 day closure (with 5 days oftotal river closure) cost industry a much higher $550000 per day in delay time
43 December 2012 through March 2013 Main Chamber Closure
The third an d fmal closure at LD27 occmTed between 10 December 2012 and 2 March 2013 when th e C01ps removed the guide cell damaged in September 2012 Removal of the guide cell necessitated closure of the main chamber (and some brief closures of the auxiliruy chamber) The main chamber was closed for 1968 hours or approximately 82 days
431 Tow Arrivals
FIGURE 16 shows the anivals per day at LD27 for the months ofNovember 2012 - April2013 Average tow ruTivals per day for the period outside the closures from 1 Jlme 2012 through 31 May 2013 were 183 tows per day Average ruTivals per day for the closure period 10 December 2012 through 2 March 2013 decreased to 127 tows per day
Lock 27 Upper Mississippi River Tow Arrivals Dec 2012 - Mar 2013
35
30 Main Chamber Closed
25 uj20 amp -uA I ~
I~ ~~ I A ~ I15 ~~ n ~~
~~~ - ~1J vr 1 A10 I
5
0
~
~~~O~~~N~~~~~O~~~N~~~M~~N~~~~~ON~~~~~Om~~~~Om~~N~~~m~~N~~~~~ ~~~~NNN ~~~NNNm NNNm NNN NNNm NNN
Nov Dec Jan Feb Mar Apr
Figure 16 L D27 Tow Arrivals December 2012 - March 2013
432 Tow Processing Time
During the closure of the 1200 chamber 35 of the tows through LD27 had to double cut - the tow fl otilla had to be broken into two pruis an d each prui of the fl otilla locked through separately This increased the average processing time fr om 51 minutes for all tows outside the December 2012 through March 2013 closure to 88 minutes during the closures During the closures 1032 tows tImiddotansited LD27 Given an increase in time of 37 minutes per tow an d 1032 tows an additional 643 hours of tow processing time was experienced during the closure
Page 26
433 Tow Delays
FIGURE 17 shows delays at LD27 for the December 2012 through March 2013 closm e period Delays statted building soon after the 1200 chambers closed on 10 December 2012 at 1530 homs and continued until 4 March 2013 at 0008 hom s This means th at th e 1968 hom closme impacted traffic for 2001 hom s The 33 hom difference represents th e time requir ed for th e reopened chamber to serve th e tows in queue an d bring the delay back to zero Dming the impact period 23058 hom s oftow delay were experienced by 1076 tows (total delay in all of 2011 was 9349 homs) This 23058 homs works out to an average delay of214 homstow for th e closm e period By comparison 5246 tows were served at LD27 outside the closm e period from 1 June 2012 through 31 May 2013 The average non nal delay per tow was 27 1 minutes or approximately 45 hom s Given that the average additional delay per tow was 17 hom s for th e December 2012 - March 2013 closme an d that 1076 tows were impacted the closme caused 18195 homs of additional delay The maximum delay experienced by a tow dming this closme was 805 homs
Minimum Average amp Maximum Tow Delays Lock 27 Upper Miss River
Dec 2012 middotMar 3
90
80
70 -f 60 ~ ~ 50 0 1shy 40 Q) Q
gt- 30 ca Q) 20 0
10
De Jan
Mar bull Minimum bull Average Maximum Apr
Figure 17 LD27 M inimum Maximum and Average Tow Delays December 2012- March 2013
444 Cost Impact
The most recent infon nation available indicates that the average tow transit costs at LD27 are about $648 per hom Given the analysis above which shows that this scheduled closm e caused an additional 643 hom s ofprocessing time and 18195 hom of delay the estimated additional transit time dming the closm e cost a total of $ 122 million
Page 27
Page28
5 SHIPPER RESPONSE
51 Survey Procedures
An OMB-approved Shipper Survey (Control 0710-0001) was used to capture and evaluate shipper reactions to the drought and the emergency closure of LD27 in September (see Appendix A) Shippers were defined as companies that receive commodity traffic transiting through multiple reaches on the Mississippi River The formal shipper survey was conducted between 7 March and 30 May 2013 The purposes of the survey were to find out what measures were taken by industry to mitigate the effects of the drought-related low water and emergency closure at LD27 and to estimate the total costs to industry that resulted from the events
At the outset of the process several steps were adopted for including firms in the survey First a list was compiled that showed the parent companies that operate at docks in the four affected waterways ndash the lower Ohio lower Illinois Middle Mississippi and Lower Mississippi Rivers ndash and that ship through LD27 The parent companyowner of each receiving dock was identified using information available to the Corps and grouped by parent company This allowed an estimate of tonnage by parent companyowner to be formulated Parent companies were then ranked in descending order by their total tonnage received For LD27 and each affected waterway the top 25 ranked by companies by tons shipped were selected to be surveyed Duplicate shippers (shippers that had a top 25 ranking in more than one reach) were included as one survey and the next largest company was added to obtain the top 25 unique companies to survey in the study area In all 125 shippers were sent surveys
Waterborne Commerce Statistics Center (WCSC) data for 2011 was used in assembling basic shipper information All of the contact information for the top ranking companies was determined by comparing several contact lists In the absence of any contact information the Internet was used as a search tool to verify correct contact information for these parent companies The 125 shippers were sent a mail survey followed by a telephone follow-up if the parent company or carrier sent no response after two weeks Stakeholders like the American Corn Growers Association the River Industry Action Council (RIAC) and the Waterways Council Incorporated (WCI) assisted by encouraging firms to respond by sending emails to all members late in the survey to encourage participation
According to survey respondents low water presented the greatest challenge to users of the Lower Mississippi from Cairo Illinois to Baton Rouge and the Middle Mississippi River between St Louis and Cairo Traffic on these two reaches totaled 2024 million tons in 2011
Page29
52 Summary of Shipper Responses
Responses to the survey were received from 73 companies representing a response rate of 59 percent and accounting for 42 percent of total 2011 traffic transiting the affected waterways Questions 1a and 1b were used to help determine if the shipper had any impacts from either the emergency lock closure event at LD27 or from the low water conditions Questions 2 and further into the survey were designed to be answered by shippers who had responded that they were impacted by either or both of these events From question 2 onwards the subset of respondents is less than the total that returned surveys because some shippers indicated that they were not impacted by either event in question An overwhelming percentage of respondents to the shipper survey said they were unaffected by the LD27 closure while half of the respondents indicated they experienced significant effects on operations due to low water In an effort to meet their needs shippers sought other sources for product sought other waterway routes and used overland transportation routes at a cost to responding shippers of $56 million The effect of the drought on agricultural production combined with increased transportation costs resulted in temporary plant closures and lost sales that the responding shippers estimated at $79 million
Page30
6 CARRIER RESPONSE
61 Survey Procedures
The Carrier Survey targeted the major towing companies that used the waterways affected by low water in 2012 (the lower Ohio the lower Illinois the Middle Mississippi and the Lower Mississippi Rivers) Appendix B contains the Carrier survey form The purpose of this survey was to identify carrier responses to the 2012 low water event and the LD27 closure Like the shipper survey the formal carrier survey was conducted between 1 March and 30 May 2013 The purpose of the surveys was to determine what measures were taken specifically by the carriers to adapt to the emergency closure at LD27 and drought conditions and what these measures cost
The firms included in the carrier survey were the 10 largest users of the affected waterways (in tonnage) for the years 2006 through 2010 Responses were received from six companies representing 46 percent of carrier traffic on these waterways According to survey respondents low water presented the greatest challenge to users of the Lower Mississippi from Cairo Illinois to Baton Rouge Louisiana and the Middle Mississippi River between St Louis Missouri and Cairo Traffic on these two reaches totaled 2024 million tons in 2011 Survey respondents accounted for 58 of the tonnage in these two reaches
62 Summary of Carrier Canvas Responses
Once the initial set of shippers and carriers for canvassing was established contacts were identified for each company This information was taken from publicly available sources and in some instances through the assistance of industry associations such as the American Corn Growers Association the River Industry Action Council (RIAC) and the Waterways Council Incorporated (WCI) These organizations were also of assistance in encouraging firms to respond by emailing members late in the survey process to encourage participation
Responses were received from six carriers (60) representing 59 percent of total traffic on the affected waterways All but one of the carriers responding indicated that they were affected by both low water and the LD27 closure with the low water being the more serious challenge Moving cargo during this period required carriers to advance or delay shipments light load vessels (necessitating additional trips) reposition barges throughout the system to accommodate the need for additional barges restrict tow sizes (also necessitating more trips) and perform additional refleeting These altered carrier operations cost responding carriers an estimated $807 million Carriers also experienced $167 million in additional costs due to the LD27 closure and delays and tug costs of $02 million due to tow grounding
Page31
Page32
7 FEDERAL RESPONSE
Federal stewards of the inland waterways were aided by past experiences like the 1988 drought and the low-water event on the Lower Mississippi River in 1997 and advancements in the data provided by the National Oceanographic and Atmospheric Administrationrsquos (NOAA) as well as hydrologic tools used by the Corps to forecast water levels These advancements improved the ability of the Corps and the Tennessee Valley Authority in controlling available water in efforts to keep navigation open on the lower Ohio and on the Mississippi Rivers The US Coast Guard took the lead in creating communication avenues between all stakeholders in managing vessel operation and reaching consensus on channel and vessel operational maintenance during the event According to representatives of the Coast Guard no additional expenditures of funds accompanied their extraordinary efforts
On the Ohio River the Corps of Engineers essentially borrowed resources from other locations to be repaid at some future date No emergency funding was made available Channel surveys were conducted more frequently on known trouble spots sometimes twice weekly The Louisville District estimated that dredging costs were approximately $21 million higher than in a typical year (see TABLE 9) The funds were drawn away from other projects in effect with the promise of repayment in a future year to accomplish work that could not be done as a result of moving funds to the lower Ohio
Table 9 Costs Incurred by the Corps
($millions)
District Added Cost Vicksburg $ 729 StLouis
dredging blasting LD27 1
subtotal
$ $ $
1190 970 097
$ 2257 Louisville $ 207 TOTAL $ 3193
1 Costs to bring LD27 into immediate s ervic e Inc ludes cos t of spud barge temporary helperboat assists and gravel cleanup
Source US Army Corps of Engineers Vicksburg St Louis and Louisville Districts
On the Mississippi River emergency funds were made available by Congress in 2011 in response to the flooding that year and any possible future emergencies The rock pinnacles at Thebes and Grand Tower Illinois were blasted and debris removed at an estimated cost of $97 million At LD27 the spilled gravel from the damaged cell and the cell itself were removed and
Page33
temporary safe passage accommodated at an estimated cost of $10 million11 St Louis District dredging was concentrated on the Middle Mississippi as the Lower Illinois was not severely affected Dredging completed by the Vicksburg District on the main stem Mississippi cost $73 million more than average dredging costs over the last several years
11 The Corps estimates it will cost another $35 million to replace the damaged cell This was not includedin thefederal cost
Page34
8 FINDINGS
Traffic patterns were examined on the four high volume waterway segments affected by low water in 2012 With the exception of the Lower Mississippi from Cairo Illinois to Baton Rouge Louisiana each segment experienced lower traffic in 2012 than in 2011 Sharp declines in corn traffic related to a greatly diminished harvest explain most of the traffic decline though carriers continued to maintain volumes of all other commodities otherwise
When looking at monthly traffic levels reported in the LPMS data for the gateway locks to the Ohio Illinois and Upper Mississippi (LD53 Peoria LD and LD 27) typical cyclical patterns of shipment are apparent in 2012 but at lower levels Vessel operators ran significantly fewer tows in the summer and fall moved fewer barges at LD27 and Peoria but more barges at OH53 ndash this increase is explained by the increased movement of empty barges Tows pushed fewer loaded barges that were more lightly loaded (100 tons per barge less than average at LD27) The end result was lower traffic at each of these three projects
Unfortunately there is no data equivalent to LPMS available at the constriction points on the Mississippi River at Thebes Illinois and Grand Tower Illinois that will describe how vessel operators configured tows by number of barges per tow We do know that there were vessel draft restrictions that affected both loadings and the size of towboats as well as tow size restrictions We also know from surveys and discussions with vessel operators (discussed in previous sections) that fleeting operations were initiated above and below these points in order to optimize the use of a limited number of smaller towboats required through this reach while still utilizing the larger towboats that typically move through this area
The Corps surveyed 125 shippers and ten carriers The 73 shippers that responded represent 42 percent of all shipper traffic transiting the affected waterways Half of the respondents to the shipper survey indicated that they did not experience any significant effects on operations due to low water and an overwhelming percentage said they were unaffected by the LD27 closure Ten carriers were surveyed The six carriers responding represented 46 percent of all carrier traffic transiting the affected waterways All but one of the carriers responding indicated that they were affected by both low water and the LD27 closure with the low water being the more serious challenge The difference in shipper and carrier responses suggests that the shippers were somewhat insulated from these events by the strategic and tactical actions taken by the carriers that minimized impacts on the shippers
Despite lower corn production and a 51 decline in corn exports waterway traffic through the Middle Mississippirsquos rock pinnacles at Thebes Illinois constriction was largely unchanged between 2011 and 2012 (though it is important to remember that the worst low water conditions were experienced from December 2012 through February 2013) Moving cargo during this period required carriers to advance or delay shipments light load vessels (necessitating additional trips) reposition barges throughout the system to accommodate the need for additional barges restrict tow sizes (also necessitating more trips) and perform additional refleeting It cost responding carriers an estimated $807 million to alter operations in this fashion (see TABLE
Page35
10) The carriers also faced $167 million in additional costs as a result of the LD27 closures and delays and tug costs of $02 million due to tow groundings Despite these actions shippers did not escape the effects of the low water In an effort to meet their needs shippers sought other sources for product sought other waterway routes and used overland transportation routes at a cost to responding shippers of $559 million The effect of the drought on agricultural production combined with increased transportation costs resulted in temporary plant closures and lost sales that the responding shippers estimated at $790 million
Table 10 Survey Results - Low Water Cost Impacts
Cost Category Cost ($000) Transportation cost impacts
Carrier cost impacts Delays due to LD27 clos ure 16100 $ Other costs due to LD27 clos ure 573$ Groundings 164 $ Altered operations 80723 $
Shipper cost impacts 55860 $ SUBTOTAL 153419$
Production cost impacts 79000$ TOTAL 232419$
Page36
9 CONCLUSIONS
Several observations can be made from an examination of the traffic data obtained from LPMS and WCSC sources and responses generated from the surveys of the navigation industry The obvious message is that a system that is not operating at a level of reliability expected by users will have economic consequences Resulting increases in transportation costs andor delays to the transportation of commodities will have an effect on the marketplace Either the producer will pay more thus reducing expected profit associated with their products or the end user will experience higher commodity prices at the market once prices are adjusted
The low water the 5-day closure of LD27 in September 2012 and the subsequent 82 day closure of the main chamber between December 2012 and March 2013 imposed additional transportation costs of $1534 million just on the companies that responded to the Corpsrsquo surveys Drought andor low water accounted for another $790 million in production losses bringing the total reported impact to $2324 million Shipper survey respondents averaged $098 per ton in production losses and $080 per ton in increased transportation costs as they shifted to other modes and routes These values were applied to tonnage not accounted for through the sample or for which no response was given Carrier survey respondents provided a range of cost impacts $009 per ton for production loss $0005 per ton for non-delay related operations during the LD27 closure $0001 per ton related to grounding logistics and $069 in added transit costs Using these values a simple extrapolation of the sample to the population of movements using the most affected waterways (the Middle Mississippi and Lower Mississippi River) either not sampled or not responding suggests that additional transportation costs totaled $2770 million and production impacts amounted to $1652 million for a total impact of $4422 million12
Table 11 Low Water Cost Impacts from 2012 Event (Costs in $000)
Cost Category Survey
Responses
Estimate for Firms Not
Responding Not Surveyed TOTAL
Transportation cost impacts Carrier cost impacts
Delays due to LD27 closure 1 $ 16100 ‐$ $ 16100 Other costs due to LD27 closure $ 573 417 $ $ 990 Groundings $ 164 119 $ $ 283 Altered operations $ 80723 58719 $ $ 139442
Shipper cost impacts $ 55860 64277 $ $ 120137 SUBTOTAL $ 153419 123532 $ $ 276951
Production cost impacts 2 $ 79000 86248 $ $ 165248 TOTAL $ 232419 209780 $ $ 442199
1 I ncl udes del a y cos t experi enc ed due to LD27 ma i n cha mber cl os ure Dec 2012 ‐Ma r 2013 to remove dama ged cel l
2 I ncl udes ec onomi c impact of reduced corn producti on and hi gher tra ns porta ti on cos ts due to low‐wa ter
12 It is important to remember that not all waterways affected by the drought were covered by this survey
Page37
Using available transportation rate studies conducted for navigation improvement studies on the Upper Mississippi Illinois and Ohio River it is estimated that this tonnage moves at an average transportation rate savings of $2558 a ton Therefore at 2011 traffic levels total savings on these rivers would likely have been an estimated at $58 billion dollars The three most affected Corps of Engineers districts expended $319 million to keep the lower Ohio lower Illinois Middle Mississippi and Lower Mississippi river channels open to navigation in extreme drought conditions enabling shippers to continue navigation While industry faced losses of an estimated $2770 million due to increased transportation costs through the cooperative and coordinated efforts of the Corps the Coast Guard and industry partners shippers and the Nation were able to realize a savings in transportation costs of an estimated $55 billion despite this extreme low water event
Page38
APPENDIX A ndash SHIPPER QUESTIONNAIRE
PageA‐1
OMB Control 0710-0001 Expiration date 02282015
2012 DROUGHTLOCK 27 CLOSURE ndash SHIPPER SURVEY
Date
Firm
Address
Phone
FAX
Point of Contact
Title
General Description of Firm and Products Produced
NOTE ALL RESPONSES WILL BE TREATED AS CONFIDENTIAL
1 Was your company impacted by the closure event at Lock 27 in 2012 Yes No Was your company impacted by low water associated with the Drought Low water conditions in 2012 Yes No (If no interview is complete)
2 Does your company have a response plan for these types of impacts If so did it result in additional work organization to implement or was it detailed enough to cover all the impacts
1
PageA‐2
OMB Control 0710-0001 Expirat ion date 0228201 5
2012 DROUGHTLOCK 27 CLOSURE- SHIPPER SURVEY
LD27 closure
only Low
wate1middot Descriptio n of Response
a No change in procedmes b Stockpiled product and waited for traffic to clear if closme or changed loading depth in barges for low wat er c Switched to all-overland mode for product delivety from existing somces d Switched to different watervray routing for product delivety from existing somces e Switched product somce to an entirely new somce f Ceased operations dming the period g Altered production during the period h Switched production to another facility i Purchased intermediate or final product rather than produced j Other or combinations of the above (Please explain)
3 During th e 2012 event (either Low water or Lock 27 closure) what was your companys response Please indicate with an x in the appropriate box
4 Ifyou have checked c or d in question 3 please complete the following table
Movement Commodity Affected tonnage
Origin (City State)
Destination (City State)
Deliverd $ ton
plio1middot to drou2ht
Delivered $to n
during drou2ht
Examples
I Com 12000 Minneapolis New Orleans $30 $35
MN LA
2 Lube oils 4000 Houston TX Huntington wv $40 $50
2
PageA-3
OMB Contro l 0710-0001 Expiration date 02 282015
2012 DROUGHTLOCK 27 CLOSURE - SHIPPER SURVEY
5 Ifyou checked e in question 2 please complete the following table
Movement Commodity Affected tonnage
P reshydrou ght Origin
(City State)
Ch an ged Origin
(City State)
Destination (City State)
Deliver d $ton
pri01middot to drought
Delivered $ton
dming drought
Examples
1 Com 12000 Minneapolis MN
Cincinnati OH
New Orleans LA
$30 $35
2 Lube oils 4000 Houston TX Ashland KY
Pittsburgh PA $40 $50
6 Ifyou checked response a orb lmder question 3 how were your total production costs affected during the period of closure at Lock 27 or Drought-related low water (total increase in cost if applicable) Please explain
7 Ifyou checked response f under question 3 what was the total estimated loss to your fi1m as a result of ceasing production (during the closure period at Lock 27 or Drought)
3
Page A-4
OMB Control 0710-0001 Expiration date 02282015
2012 DROUGHTLOCK 27 CLOSURE ndash SHIPPER SURVEY
8 If you checked response ldquogrdquo under question 3 what was the total estimated loss to your firm as a result of altering production processes (during the closure period at Lock 27 or Drought)
9 If you checked response ldquohrdquo under question 3 what was the total increase in costs to your firm as a result of changing production locations (during the closure period at Lock 27 or Drought)
10 If you checked ldquoirdquo under question 3 to what extent did purchasing intermediate or final product increase your companyrsquos total costs (during the closure period at Lock 27 or Drought)
11 If you checked response ldquojrdquo under question 3 to what extent did the other measures or combination of measures undertaken as a result of the closure increase your companyrsquos total production costs (during the closure period at Lock 27 or Drought)
4
PageA‐5
OMB Control 0710-0001 Expiration date 02282015
2012 DROUGHTLOCK 27 CLOSURE ndash SHIPPER SURVEY
12 Have these events (drought-related low water or Lock 27 closure) caused your company to alter its long-term transportation strategy (eg switch to all-overland modes increase stockpiles etc) How will this impact your total commodity transportation or other costs (per year) Please explain
13 Has the (drought-related low water or Lock 27 closure) caused your company to take any other long-term permanent measures Please explain How will this affect your companyrsquos long-term operating costs (per year)
14 Has your company been impacted by other navigation system disruptions this shipping season (these would be other than the Low water from the drought or the Lock 27 closure)
5
PageA‐6
Event Date 2 Short-term response 3 Long-term responseExample
McAlpine closure
Jan ndash Feb 2006 Diverted to overland modes
none
OMB Control 0710-0001 Expiration date 02282015
2012 DROUGHTLOCK 27 CLOSURE ndash SHIPPER SURVEY
15 If your company has experienced significant navigation disruptions1 prior to this shipping season please complete the following table
1 Significant navigation system disruptions are defined as disruptions that result in delays to your shipment of more than 48 hours (include scheduled and unscheduled lock outages accidents and low and high water events)
2 Short term response refers to the response actions detailed in question 2 a No change in procedures b Stockpiled product and waited for traffic to clear or light loaded for low water c Switched to all-overland mode for product delivery from existing sources d Switched to different waterway routing for product delivery from existing sources e Switched product source to an entirely new source f Ceased operations during the period of closurelow water g Altered production during the period of closurelow water h Switched production to another facility i Purchased intermediate or final product rather than produced j Other or combinations of the above (Please explain)
3 Long term response refers to a modification of your long term business plan to include altering your long-term transportation strategy (eg switch to all-overland modes increase stockpiles etc) Other long term responses might include sourcing commodities at alternate sites or moving production activities to a different location
6
PageA‐7
PageA‐8
APPENDIX B ndash CARRIER QUESTIONNAIRE
[Typetext] PageB‐1
Waterway Carrier Interview Questions Effects of the 2012 Drought and LD27 Closure
Name of towing company -----------shyLocatio n -----------Name and title of Point of Co ntact ----------------shyPhone number ( )________ email _________
PART 1 LOW WATER DUE TO DROUGHT CONDITIO NS
1 Did your firm experience a reduction in tonnage carried on the Mississippi Ill ino is or Ohio waterways in 2012 Please verify data fo r 2010 and 2011 indicating your estimates for 2012 in table below
Operat o r Traffic Destined fo r Lower Mississippi Ports (2010 and 2011 from WCSC)
Origin 2010 2011 2012
Mississippi above St Louis Mississippi St Louis to Cairo Mississippi south of St Louis Ill inois River Ohio River
2 What facto rs led to changes in t raffic between 2011 and 2012 For example drought condit ions that affected agricultural production low water that affected your abi lit y to operate efficiently loss or gain of a contract(s) increased competit ion from rail or other factors - please specify and ind icate re lative weight of each
3 Have you had to change the way you operate your vessel fleet due to the drought If so what changes did you make and when did these occur
1
[Type text] Page B-2
4 The t wo ta bles below are intended to describe how your operat ions are affected by water depth a nd flows on the Cairo - St Louis reach of the Mississippi Rive r
a Do the operat ionalchanges suggested in t he tables below for the Cairo - St Louis reach (Upper Reach) describe the way you would operate given t he gage readings and flow shown for these two reaches in t he t ables If yes please indicate in the appropriate box in the table below with a Y if no please indicate what restrict ions you impose on your operations given t he gage and flow readings provided
Upper Rea ch- Navigation Restriction
St Louis Gage Reading
Flow (CFSOOO)
Navigation Restriction
Carriers Nav Restriction Followed
Above 20 Above 90 No restriction 00 to 20 74 to 90 25 barges -25 to 00 55 to 74 20 barges -35 to -25 485 to 55 16 barges -40 to -35 46 to 485 85 ft draft -45 to shy 4 0 44to47 80 ft draft Below -45 Below 44 Navigat ion halts
b What is t he number of tows- by size of tow horsepower and draft - that you operate through the St Louis to Cairo reach of the Mississippi For each foot of draft t hat is lost what is your added cost per t rip Please use the table below in making your response
Upper Reach- Tows moved thru the St Louis- Cairo reach in 2011 (or year not affect ed by low water)
Tow size Towboat Horseshypower
Barge Draft
Cost ton of loading below desired barge draft
Barges tow
No of tows 05 10 15 20 25 30 35 4 0
1 - 8 9 - 15
16 - 19 17 - 20 21- 25
gt25
2
[Type text] Page B-3
5 The t wo tables below are intended to describe how your operat ions are affect ed by water depth a nd flows on the Mississippi River sout h of Cairo
a Do the operat ional changes suggested in t he tables below for the Lower Reac h of the Mississippi River sout h of Cairo describe the way you would operate given the gage readings and flow shown for these two reaches in the tables If yes please indicate in t he appropriate box in t he table below with a Y if no please indicate what rest rictions you impose o n your operations given the gage and flow readings provided
Lower Reach- Navigation Restriction
Cairo Gage Reading
Flow (CFS in OOOs)
Navigation Restrictions
Carriers Nav Restriction Followed
Above 118 Above 189 No restriction 60 to 118 111 to 189 25 barges per tow
50 to 60 95 to 111 85 ft draft and 20 barges
35 TO 50 805 to 95 8 ft draft and 12 barges
Below 35 Below 805 Navigation halts
b What is t he number of tows- by size of tow horsepower and draft - that you operate on the Lower Reach of t he Mississippi south of Cairo For each foot of draft t hat is lost what is your added cost per trip Please use t he table below in making your response
Lower Reach- Tows moved through the reach south of St Louis in 2011 (or a yea r not affected by low water)
Tow size Towboat Barge Cost ton of loading below desired barge draft
Barges tow
No of tows
Horseshypower
Draft 05 10 15 20 25 30 35 4 0
1 - 12 13 - 16
17 - 20 21- 25 gt25
6 If you light load due t o low water would you proceed entire t rip as originally light loaded or top off
below Cairo or maybe add additional barges to w here the normal t ons per horsepowe r ratio is
achieved If latter how would this be done and at what cost
3
[Type text] Page B-4
7 Did any of your tows experience a grounding If yes how many total occurrences did you experience and what was the impact on your firm Please indicate your response below
total groundings
events with tows delayed more than 8 hours cost of delays
events involving lightering cargo cost of lightering
events involving towboat assists cost of towboat assists
8 What was major impact of low water due to the drought in terms of effect on your operations ‐
increased operating cost Lost business Equipment damage Safety concerns Groundings
Efficient dispatch of fleet Others
9 Please indicate the economic impact of low water levels on your company in the table below (please
include figures from your response to 5 above)
Indicate Cost with an ldquoXrdquo
if this applies to your firm
Description of impact Costton Tons
Affected Total cost
Increased transit time (including delays) Increased cost due to restricted tow sizes Increased costs due to light loading Idle vesselslost revenue Damaged equipment Increased managementlogistics costs Other (please specify)
4
[Typetext] PageB‐5
PART 2 CLOSURE OF LD27
10 If you have tows already at the lock do you generally wait until it reopens
11 What is typical amount of time you will wait at a lock for it to reopen before you decide to do
something else What do you do if you decide not to wait any longer What factors affect this
decision If you re‐dispatch the tow what does this cost
12 If you have tows underway in the system and a closure occurs at a lock to be transited do you
continue to the closure point wait elsewhere or re‐dispatch the tow What factors affect this decision
13 Please indicate the economic impact of the closure of LD27 on your company in the table below
Indicate Cost with an ldquoXrdquo
if this applies to your firm
Description of impact Costton Tons
Affected Total cost
Delay costs at the lock Delays in place (dock or port) Idle vesselslost revenue Increased managementlogistics costs costs (including re‐dispatching) Other (please specify)
PART 3 FINAL COMMENTS
14 Do you have any other information that would help us describe and quantify the economic impact on
waterway carriers associated with low water due to the drought of 2012 andor the closure of LD27
5
[Typetext] PageB‐6
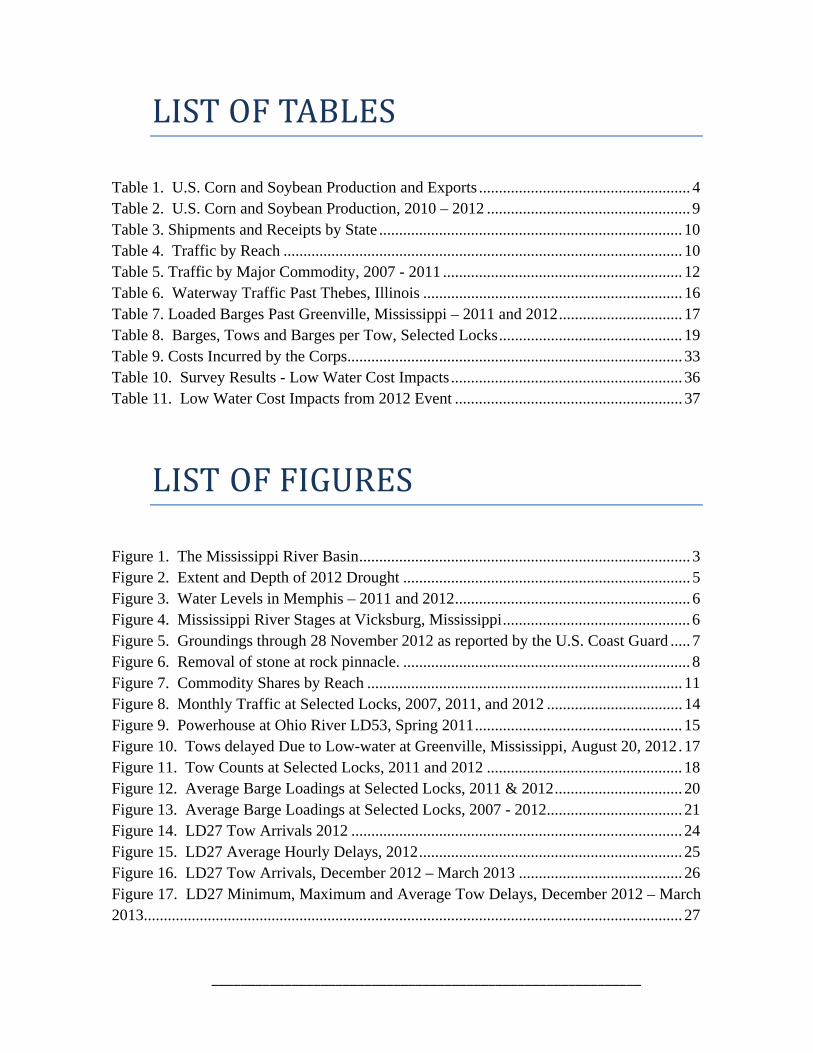
___________________________________________________________
1 PURPOSE AND INTRODUCTION
Lower than normal precipitation in the Mississippi River Basin recorded in the winter and spring of 2012 was an early indicator of what evolved into drought conditions throughout much of the basin Field crops in Midwestern states experienced extreme conditions of stress Reservoirs provided maximum supplies under approved operating procedures to augment flow for water quality and supplies and for inland navigation on the Mississippi River in particular Both the drought and accompanying low water on the Mississippi River were widely reported by local and national media outlets throughout 2012 Agricultural and navigation interests were the focal point of the Nationrsquos concern as the Corp of Engineers and the US Coast Guard employed extraordinary measures to keep shipping lanes safe and open These measures while mitigating the adverse circumstances to some extent did not prevent waterway stakeholders from absorbing additional costs
The Corps of Engineers decided to formulate an estimate of these costs in order to better understand the importance of these major waterways to commercial users A major part of this effort was a survey of both waterway carriers and shippers dependent upon the high traffic volume waterways that experienced low water conditions (the affected waterways were the Mississippi River (the Mississippi River between St Louis Missouri and Cairo Illinois and between Cairo and Baton Rouge Louisiana) the lower Illinois River and the lower Ohio River) Surveys sent to carriers and shippers were designed to elicit economic impact information related to this protracted period of low water to include the river closure due to the accident at LD27
This report focuses on the impact of the low flows on major commercial cargo arteries in the Mississippi River Basin ndash specifically the Mississippi Ohio and Illinois Rivers ndash and estimates economic impacts from drought-related low flows and associated unexpected closure of Locks and Dam 27 Costs incurred by the Federal government specifically the Corps of Engineers are reported to the extent they are available
This study relied upon readily available data from public Corps of Engineers and US Coast Guard sources to describe river conditions events that occurred as a result of low water conditions and efforts to manage vessel traffic A targeted survey of inland waterway carriers and shippers was used to estimate the economic effects of interruptions and disruptions to navigation that occurred as a result of the drought and associated low water conditions
Page1
Page2
Figure 1 The Mississippi River Basin
2 BACKGROUND
21 Drought
The drought of 2012 affected much of the Mississippi River Basin whose major streams are corridors of inland waterway commerce in the Midwest and Plains states (see FIGURE 1) Four waterway reaches that experienced low water conditions and carry bulk commodities in excess of 25 million tons annually were identified for closer examination in this study 1) the Ohio River between Smithland LD and the mouth of the Ohio River 2) the Illinois River between Peoria LD and the mouth of the Illinois 3) the Mississippi River between the confluence of the Ohio River and Baton Rouge Louisiana and 4) the Mississippi River between St Louis Missouri and the confluence of the Ohio In 2011 shippers in 20 states moved commodity through the four reaches with ten different states (Arkansas Illinois Indiana Kentucky Louisiana Missouri Mississippi Ohio Tennessee and West Virginia) in the top five in shipping or receiving commodities in one or more of these reaches
The US Department of Agriculture estimated that nearly 80 percent of agricultural land was affected by drought in 2012 with 70 ndash 75 percent of the corn and soybean production affected by severe or greater drought By September 2012 over 2000 counties were
Page3
designated disaster areas by USDA3 In the Midwest the drought destroyed or damaged corn and soybean crops in particular ndash both the region and producers of these commodities being served by the inland waterway system Corn production declined by 13 percent between the 2011 and 2012 marketing year soybeans by 3 percent and corn exports fell by 51 percent (see TABLE 1)
Table 1 US Corn and Soybean Production and Exports (in millions of bushels)
Ma rke t Ye a r 1 Production
Cha nge from
pre vious ye a r Ex ports
Cha nge from pre vious
year
200708 1303788 -- 243740 --200809 1209165 -7 184895 -24 200910 1309186 8 198002 7 201011 1244687 -5 183417 -7 201112 1235961 -1 154260 -16 201213 1078030 -13 75000 -51
Sourc e USDA Economic Research Service Feed Outlook 1 market year is from September to August
US Soybe a n Production a nd Ex ports 2007 to 201213
(in millions of bushels)
Market Year 1 Production
Cha nge from
previous year Ex ports
Change from
pre vious year
200708 267712 -- 115883 --
200809 296701 11 127929 10
200910 335901 13 149905 17
201011 332918 -1 150094 0
201112 309352 -7 136185 -9
201213 301500 -3 134500 -1
Source USDA Ec onomic Res earch Servic e US Oilcrops Yearb ook
1 market y ear is from September to August
Drought in western Texas spread throughout most of the Great Plains and into the lower Ohio Valley through the spring of 2012 (see FIGURE 2) and winter months of 2013 Extreme and Exceptional drought was persistent in the Great Plains states of South Dakota Nebraska Kansas Oklahoma and northern Texas ndash all major agricultural producing areas Extreme drought reached into the Midwest states in particular southern Minnesota Iowa Illinois Indiana and Missouri ndash all major producers of corn and soybeans4 The wheat crop
3 See the USDA Economic Research Service ldquoUS Drought 2012 Farm and Food Impactsrdquo athttpwwwersusdagovtopicsin‐the‐newsus‐drought‐2012‐farm‐and‐food‐impactsaspx4 Extremedroughts arecharacterized bycrop losses and widespread water shortages or restrictionsExceptionaldroughts are characterized by widespreadcroplosses shortages of waterinreservoirsstreamsand wellscreatingwateremergenciesSeehttpdroughtmonitorunleduclassifyhtm
Page4
was largely spared as it was harvested in late spring prior to the drought taking hold in these states
Figure 2 Extent and Depth of 2012 Drought
22 Low Water
In addition to agriculture the 2012 drought affected water supplies for industrial and municipal uses recreation and the ability to navigate on the Mississippi River and its navigable tributaries Small harbors and terminals saw rivers fall to levels not experienced in nearly 50 years (see FIGURE 3)
Page5
Figure 3 Water Levels in Memphis ndash 2011 and 2012
Figure 4 Mississippi River Stages at Vicksburg Mississippi
Low water conditions rivaled those observed during the 1988 drought event By November 2012 water levels on the Mississippi River fell below those experienced in 1988 (see FIGURE 4) Beginning in May 2012 the Mississippi River stage reached the lowest level observed in the past 112 years Heavy rain and flooding in the Mississippi River Basin ended the low water problems in March 2013
Page6
Figure 5 Groundings through 28 November 2012 as reported by the US Coast Guard
Low water on these major waterway transportation arteries hampered navigation Tows accustomed to wide and deep navigable channels began to suffer from groundings along the length of the Mississippi River (see FIGURE 5) At Mississippi River LD27 water levels fell below the armor-protected area of sheet pile guide cells What would ordinarily be routine impacts on the guide cell as tows aligned to enter the locks led to failure of the cell as impacts occurred on unprotected regions of the sheet pile protectionguide cell Failure of the cell and subsequent clean-up of gravel spilled from the ruptured cell resulted in closure of the Mississippi River at the location of LD27 for approximately five days from 14 September 2012 until 20 September 2012
Groundings of tows occurred along nearly the entire length of the Mississippi River and were especially problematic along the border of northern Illinois between Thebes and Grand Tower Illinois and in the general vicinity of Greenville Mississippi According to the US Coast Guard 18 groundings on the Lower Mississippi led to closure events with more than 25 tows in queues River closures became necessary when tows stuck in shallow water had to be removed when tows broke apart and barges had to be retrieved and reassembled or when it was determined that the channel needed to be surveyed dredged and channel buoys reset
Page7
Figure 6 Removal of stone at rock pinnacle
Water levels on the Mississippi River at Thebes Illinois and at Grand Tower Illinois exposed rock ledges that reduced navigable drafts to 9 feet (well below customary drafts of 10 and 11 feet) and restricted the channel to one-way traffic5 The Corps removed these hazards in early 2013 (see FIGURE 6)
5 According to the US Army Corps of Engineers St Louis District River Projects Manager there was one‐way traffic at the pinnacles with 12 hour closures each day during the removal from 1Jan 2013 to roughly 15 February 2013 There were also other reaches of the river where there wasinsufficientchannelwidthof therequireddepthto permit two‐way traffic
Page8
3 WATERWAY TRAFFIC
31 General
Waterway traffic examined in this section focuses on the Lower Mississippi River and lower reaches of the Upper Mississippi Illinois and Ohio Rivers While the drought also seriously affected waterways in the southwest and the Missouri River traffic flows on these other rivers is relatively small in comparison with the Mississippi Illinois and Ohio Rivers Comparable data through December 2012 was available from the US Army Corps of Engineers Waterborne Commerce Statistics (WCS) and Lock Performance Monitoring System (LPMS) data sets for convenience of comparison only data through December 2012 is examined in this section of the report
32 Traffic Patterns
With the exception of Minnesota major grain and oilseed producing states saw sharp percentage declines in production that exceeded what was a national decline (See TABLE 2) All of these major producing states are touched by navigable waterways The expectation is that this diminished production of corn and soybeans should be reflected in decreased waterway traffic in these commodities
Table 2 US Corn and Soybean Production 2010 ndash 2012
IL IN IA MN MO NE OH US Corn (000s bushels)
201000 1946800 89804000 2153250 1292100 369000 1469100 533010 12446865 201100 1946800 839500 2356400 1201200 349980 1536000 508760 12359612 201200 1286250 596920 1876900 1374450 247500 1292200 448950 10780296
change 2011 ‐ 12 ‐339 ‐289 ‐203 144 ‐293 ‐159 ‐118 ‐128 Soybeans (000s bushels)
201000 466075 258505 496230 328950 210405 267750 220320 3329181 201100 423225 240695 475345 274560 190165 261360 217920 3093524 201200 383560 223590 413850 300570 155170 207085 206100 3014998
change 2011 ‐ 12 ‐94 ‐71 ‐129 95 ‐184 ‐208 ‐54 ‐25 Source Crop Production 2012 Summary USDA National Agricultural Statis tics Service January 2013
321 Waterway Reaches and States
Four waterway reaches that experienced low water conditions and carry bulk commodities in excess of 25 million tons annually were identified for closer examination in this study 1) the Ohio River between Smithland LD and the mouth of the Ohio River 2) the Illinois River between Peoria LD and the mouth of the Illinois River 3) the Mississippi River between the confluence of the Ohio River and Baton Rouge Louisiana and 4) the Mississippi River between St Louis Missouri and the confluence of the Ohio In 2011 shippers in 20 states moved commodity through the four reaches with ten different states (Arkansas Illinois Indiana Kentucky Louisiana Missouri Mississippi Ohio Tennessee and West Virginia) in the top five in shipping or receiving commodities in one or more of these reaches (see TABLE 3)
Page9
Table 3 Shipments and Receipts by State
State
Ohio River ‐ Smithland LD to Cairo IL
Illinois River ‐ Peoria LD to the Mouth
Mississippi R ‐ Cairo IL to Baton Rouge LA
Mississippi River ‐ StLouis to Cairo IL
ship receive ship receive ship receive ship receive AL 1435 4 049 214 489 1340 2351 337 1840 AR 470 972 139 157 6634 6628 235 1336 FL ‐ 41 ‐ 6 30 151 2 64 IA 292 308 23 5 5088 1532 5380 2397 IL 27819 4 477 19 170 11 428 45735 10171 49496 14764 IN 5738 14523 686 863 4994 2713 595 3794 KY 26306 10540 214 438 20 197 6 953 902 1 465 LA 16743 37420 6782 13629 44 026 114 919 14 816 58 194 MN 173 122 14 149 4 860 2 384 5 048 3 021 MO 1992 683 938 152 21 414 3 750 25 302 5 681 MS 697 1383 175 104 4 473 4 508 264 1 005 NE ‐ ‐ ‐ ‐ 8 13 8 13 NY ‐ ‐ ‐ ‐ 2 ‐ ‐ ‐
OH 2940 9188 126 112 2011 4956 710 1939 OK 192 260 138 88 2795 2391 189 240 OT ‐ ‐ ‐ ‐ ‐ 10 ‐ 10 PA 1143 2266 12 54 860 1848 240 101 TN 2494 9005 82 719 5770 9870 257 6200 TX 2930 954 874 1257 5034 5046 1 017 2 996 WI 29 2 ‐ 4 633 243 664 975 WV 7984 3184 146 79 6650 2117 1115 542
Sour c e US Army Corps of Engi neer s Wa terbor ne Commer ce Sta ti s ti cs Center
Note OT (Other) designates moves to unidentified states
Between 2011 and 2012 the Illinois reach experienced the greatest percentage decline in traffic (47 percent) and the Mississippi River between St Louis and Cairo Illinois experienced the greatest tonnage decline at just over 32 million tons (see TABLE 4) The Mississippi River below Cairo Illinois actually showed an increase in traffic between 2011 and 2012
Table 4 Traffic by Reach (ktons)
Waterway Reach 2007 2008 2009 2010 2011 2012 1
Change 2011 to 2012
ktons Change
Ohio River ‐ Smi thland LD to Cairo IL 108746 113329 94639 101756 99378 98328 (1049) ‐11 Illinois River ‐ Peoria LD to the Mouth 32868 30212 29569 29267 29735 28324 (1411) ‐47 Missis s ippi River ‐ Cairo IL to Baton Rouge LA 185872 176329 166557 176879 182551 184779 2228 12 Missis s ippi River ‐ StL oui s to Cairo IL 109763 98572 104275 102896 106579 103359 (3219) ‐30 Sour ce US Ar my Corps of Engi n eer s Wa ter bor ne Co mmer c e Sta ti s ti c s Center
1 preliminary 2012
Many of the movements represented in the table above transit more than one of the waterway reaches being considered therefore total tonnage cannot be calculated simply by summing the traffic reported for individual reaches This value was drawn from the 2011 Waterborne Commerce Statistics which indicate that in 2011 the total tonnage moving through these reaches was 2273 million tons Using available transportation rate studies conducted for navigation improvement studies on the Upper Mississippi Illinois and Ohio River it is estimated that this
Page10
Ohi o River - Smith land t o Mouth 2011 coal Il linois River Peoria LD to Mouth 2011 aggregates
2
sulfur clay amp salt 4
o ilseeds 4 co rn
25
corn 6
cr ud e petrol aggregates 0
15
Mississippi River - St Louis to Cairo 2011 coal
coal 19
all other
cru de petrol 2
aggregates 9
sul fu r clay amp saft
3
12 15
salt 4
Mississippi River - Cairoto Baton Rouge 2011
8
Figure 7 Commodity Shmmiddotes by Reach
tollllage moves at an average umiddotansportation rate savings of $25 58 a ton It is therefore estimated that shippers using this segment of the inland wate1way system save a total of $58 billion over the best altemative mode andor route ofumiddotansportation
322 Commodities
Coal is the predominant commodity moving through the Ohio reach (see FIGURE 7) Com is the single m ost dominant commodity moving through the Illinois River reach though products in the all other group represent the maj ority of this Illinois River reach s tollllage Peumiddotoleum products at 45 million tons chemicals and fe1tilizers at 52 million tons and iron and steel products at 22 million tons are the primmy commodities in this group On both reaches of the Mississippi River coal is the lmmiddotgest single commodity by tons closely followed by com Agricultural products (all grains oilseeds vegetable products and feeds) amounted to 61 8 million tons or 34 percent of Cairo to Baton Rouge tollllage and 369 million tons or 35 of St Louis to Cairo tons
Traffic figmes by reach and by commodity shown in TABLE 5 begin to display the impact of both lower agricultmal production and low water levels on wate1way umiddotaffic The Ohio River wate1way reach showed only a slight decline (1 percent) but commodities with mmmiddotkets or som ces on the lower Mississippi and Gulf Coast showed declines in umiddotaffic between 2011 and 2012 typified by the sulfur clay and salt group 6 Salt com and stone all showed significant
6 According to LPMS data coal traffic at LD53 declined from 142 million tons to 12 9 million tons (a 136 percent decline) the latter half of2012 compared with the same period of2011 This fo llowed an 09 million ton increase (72 percent) for the first six months of2012 compared w ith the same period in 2011
Page 11
declines While corn shipment declines could be tied to decreased production lower stone and salt shipments were likely the result of low water conditions that affected the cost of shipment or an ability to delay shipment Oilseeds traffic grew by 25 percent reflecting a late season improvement in soybean harvest
Table 5 Traffic by Major Commodity 2007 - 2011 (ktons)
Waterway Reach 2007 2008 2009 2010 2011 2012 1 Change 2011 to 2012 ktons Change
Ohio River ‐ Smithland LD to Cairo IL 108746 113329 94639 101756 99378 98328 (1049) ‐11
coal 37737 46943 37792 38433 40526 41949 1423 35 crude petroleum 106 53 44 46 145 590 445 3072 aggregates 18394 17445 15703 17303 15437 13569 (1868) ‐121 sulfur clay amp salt 2468 3352 3387 3717 3552 2427 (1125) ‐317 corn 7320 6961 6616 7013 5518 4632 (886) ‐161 oilseeds 4058 3969 5004 5176 4189 5221 1033 247 all other 38664 34607 26093 30067 30012 29941 (70) ‐02
Illinois River ‐ Peoria LD to the Mouth 32868 30212 29569 29267 29735 28324 (1411) ‐47
coal 1597 1548 777 919 1727 1150 (576) ‐334 crude petroleum 15 1 21 6 30 583 554 18635 aggregates 874 499 495 232 564 743 178 316 sulfur clay amp s alt 1169 2090 2282 881 1125 882 (243) ‐216 corn 9839 8017 9643 9137 7549 4934 (2615) ‐346 oilseeds 1940 1650 2637 2769 2503 3808 1305 521 all other 17434 16407 13715 15323 16237 16224 (13) ‐01
Mississippi River ‐ Cairo IL to Baton Rouge LA 185872 176329 166557 176879 182551 184779 2228 12
coal 22208 26629 23326 23648 34122 37163 3041 89 crude petroleum 1383 1848 1852 1901 3984 5764 1780 447 aggregates 17923 18009 17741 18474 16035 14575 (1460) ‐91 sulfur clay amp s alt 5304 7863 7962 6322 6648 4639 (2010) ‐302 corn 35465 28293 30872 31835 28065 20842 (7223) ‐257 oilseeds 17966 17648 23807 25216 21324 28369 7045 330 all other 85622 76039 60998 69483 72373 73427 1055 15
Mississippi River ‐ StLouis to Cairo IL 109763 98572 104275 102896 106579 103359 (3219) ‐30
coal 26428 26228 27127 22262 25589 22290 (3299) ‐129 crude petroleum 375 725 677 891 3229 4847 1617 501 aggregates 9735 8691 8425 8335 7947 8799 852 107 sulfur clay amp s alt 2726 4389 4475 2481 3136 2160 (976) ‐311 corn 26951 19755 23504 23824 20760 14273 (6487) ‐312 oilseeds 9687 8642 12531 12471 10682 15354 4672 437 all other 33861 30142 27536 32632 35236 35638 402 11
Source US Army Corps of Engi neers Waterborne Commerce Stati s ti cs Center
1 Prel imi nary 2012
The Illinois River reach showed the greatest percentage decline between 2011 and 2012 (5 percent) with declines in corn (35 percent) coal (33 percent) and salt (22 percent) showing the largest decreases Coal declines were influenced by the closure of a coal-fired electric utility
Page12
plant in late 20117 Like the Ohio commodities moving to and from the lower Mississippi were most affected The Mississippi River between Cairo and Baton Rouge had sizable declines in salt (30 percent) and corn (26 percent) while oilseed traffic grew (33 percent) The Mississippi River between St Louis and Cairo declined the most in tonnage (32 million tons) with salt and corn both declining by 31 percent Oilseeds increased by 44 percent and stone by 10 percent Given the 51 percent decrease in US corn exports (refer to TABLE 1) it is not surprising that corn traffic to the Gulf would decline when approximately half of all US corn exports move by barge to the lower Mississippi and Gulf Coast The ldquoall otherrdquo commodity group was the least affected by the drought All four river reaches experienced sharp percentage increases in crude oil movements though the tonnages were relatively small in each reach These increases likely reflected the first significant movement of shale gas liquids on the inland waterway system
323 Monthly Shipping Patterns
The Corpsrsquo Lock Performance Monitoring System (LPMS) data has reliable information on tow transits commodity tonnages and barge counts by month at all Corps lock and dam projects Three locksndash Ohio River LD53 Mississippi River LD27 and Peoria LD ndash were selected for closer examination of shipping patterns (discussed in this section) and fleet utilization (discussed in the next section) Ohio River LD53 is the closest Ohio River lock to the mouth of the Ohio River so it offers a fair representation of traffic on the lower reach of the Ohio Similarly Peoria LD is closest to the mouth of the Illinois River and Mississippi River LD27 is the furthest downstream lock on the Mississippi Each offers fair representations of the Peoria to the mouth of the Illinois and St Louis to Cairo reaches of these two rivers respectively
As seen in FIGURE 8 monthly traffic at Ohio River LD53 ranged between 50 million and 70 million tons per month in the years selected for analysis (2007 2011 and 2012)
7 AmerenEnergy closedtheMeredosiaplant inlate 2011Seewwwfuturegenallianceorgcommunity‐cogen201303 accessed26July2013
Page13
8000000
7000000
6000000
5000000
~ 4000000 3000000
2000000
1000000
-
Ohio River LDS3 Traffic by Month
--- ~ -~ V- -
-
-
-
2007
2011
2012
9000000 8000000 7000000 6000000
~ 5000000 ~ 4000000
3000000 2000000 1000000
Mississippi River LD27 Traffic by Month
-
-
-
2007
2011
2012
3000000
2500000
2000000 Ill 1 1500000 01shy
1000000
500000
Peoria LD Traffic by Month
-
-
-
2007
2011
2012
Figure 8 Monthly Traffic at Selected Locks 2007 2011 and 2012
Page 14
Figure 9 Powerhouse at Ohio River LD53 Spring 2011
The range of variation would likely have been tighter except for the high water event in the spring of 2011 (see FIGURE 9) which caused a sharp drop in traffic in May of that year Traffic at Mississippi River LD27 and Peoria LD follows a more cyclical pattern than that shown on the Ohio River July and November are typically peak months at LD27 and July and NovemberDecember at Peoria LD Monthly volumes in 2012 mirrored those of 2011 at both locks though at lower levels particularly in the summer and fall when the drought was most intense
33 Middle Mississippi ‐Traffic Past Thebes Illinois Navigating the Middle Mississippi River between St Louis and Cairo Illinois especially in the vicinity of Thebes Illinois and Grand Tower Illinois was a serious challenge for vessel operators 8 These two stretches experienced low water that exposed rock ledges called pinnacles which exposed vessels to grounding and damage Traffic was restricted to one way for periods in the fall of 2012 and the US Coast Guard imposed tow size and draft restrictions Large towboats that customarily move through these reaches could not navigate the restricted draft around Thebes and Grand Tower Illinois necessitating the shuttling of barges through this reach and refleeting above and below the constrictions
Waterway carriers were apparently determined to satisfy shipper needs as traffic through the restricted reaches at Thebes Illinois was largely unchanged between 2011 and 2012 ( see TABLE 6) Declines in corn traffic related to lower corn production were replaced with higher downbound moves of soybean aggregates and crude petroleum
8 See httpwwwstltodaycomnewslocalmetrolow‐water‐on‐mississippi‐river‐causes‐barge‐companies‐to‐lightenarticle 2b1505f1‐ab93‐5e73‐9a36‐d43ff5c8c0b6html
Page15
Table 6 Waterway Traffic Past Thebes Illinois
2011 2012 LPMS Name Up Down Total Up Down Total
CoalLignite amp Coal Coke 2274342 20849891 23124233 2092647 18825680 20918327 Crude Petroleum 22853 3206496 3229349 29239 4780424 4809663 DistillateResidual amp Other Fuel Oils Lube Oil amp Greases 730648 2305378 3036026 614765 2113449 2728214 Petroleum Pitches Coke Asphal t Naptha and Sol vents 335480 2427538 2763018 342221 3161000 3503221 Ferti l izers 6004043 249240 6253283 5905454 229606 6135060 Other Chemicals and Related Products 2 800 138 2 417 289 5 217 427 2 760 812 2 127 573 4 888 385 Sand Gravel Stone Rock Li mes tone Soil Dredged Material 729938 5715696 6445634 807605 7380288 8187893 Iron Ore and Iron amp Steel Waste amp Scrap 331 790 1 042 578 1 374 368 252 297 918 336 1 170 633 Sulphur (Dry) Clay amp Salt 3020775 114884 3135659 2091825 100469 2192294 Slag 226099 150649 376748 362250 113363 475613 Building Cement amp Concrete Li me Glass 69839 3343391 3413230 76587 3914565 3991152 Primary Iron and Steel Products (IngotsBarsRodsetc) 2077909 414447 2492356 2498038 456312 2954350 Wheat 3366 1640911 1644277 5418 1406811 1412229 Corn 8956 20548560 20557516 327740 13783421 14111161 Oil seeds (Soybean Fl axs eed and Others) 68755 10534468 10603223 91354 15187093 15278447 Animal Feed Grain Mi l l Products Flour Processed Grains 52619 2972138 3024757 79030 2537614 2616644 All Others 1817209 953399 2770608 1833834 976248 2810082 TOTAL 20574759 78886953 99461712 20171116 78012252 98183368 Source Waterborne Commerce Statistics
Note Orange shaded cells denote commodities where declines greater than 1000000 tons were experienced between 2011 and 2012 while green shaded cells denote growth of greater than 1000000 tons between 2011 and 2012
34 Lower Mississippi ‐Traffic at Greenville Mississippi
With flows falling throughout the summer on the heavily used Lower Mississippi River tow groundings began to occur - the first being reported on 11 May 2012 Groundings led the US Coast Guard to restrict drafts and tow sizes on the Lower Mississippi where some reaches required dredging in order for vessels to safely navigate 9 One of the more widely reported events occurred on an 11-mile stretch of the river near Greenville Mississippi where intermittent river closures occurred to accommodate the freeing of grounded tows surveying of channel and dredging to open channel It was reported that on August 20 2012 that nearly 100 tows had been delayed near Greenville waiting for the channel to reopen10 Similar events occurred along the Lower Mississippi in locations including Memphis Tennessee Helena Arkansas and Natchez Mississippi
According to the US Coast Guard 18 groundings led to closure events with more than 25 tows in queues In total these events caused 1130 tows and 17640 barges to be delayed Closures of the river occurred when tows needed to be pulled from bars or banks reassembled after breaking-up upon running aground or when channel work was required Industry worked together to free and re-assemble tows Where groundings became frequent in specific areas the US Coast Guard the US Army Corps of Engineers and industry jointly determined when a river closure was necessary to allow the Corps to survey and dredge the channel and the Coast Guard to reset buoys that mark the channel By June draft restrictions were set at 10rsquo6rdquo northbound tow sizes to 42 barges per tow and southbound tows to 36 barges per tow In early July drafts were down to 9rsquo6rdquo and tow sizes further reduced in late July drafts were restricted to 9rsquo northbound tow sizes to 20 loaded barges per tow and southbound tow sizes to 30 barges per
9 httpcornandsoybeandigestcomissuesforced‐barge‐light‐loading‐low‐mississippi‐river accessed 31July201310 httpearthobservatorynasagovIOTDviewphpid=78927 accessedon31July2013
Page16
Figure 10 Tows delayed due to low-water at Greenville Mississippi August 20 2012 Source NASA See footnote number 7
tow By mid-August one way traffic was instituted in problem reaches drafts were limited to 9rsquo and tow sizes limited further Draft and tow size restrictions were gradually relaxed but it was not until 14 December 2012 that all restrictions were lifted
Like the Thebes Illinois constriction point the Greenville Mississippi constriction did not affect traffic levels in fact traffic increased by 2 million tons between 2011 and 2012 (see TABLE 7) The effects of the low water can be seen in the tons per loaded barge which declined by 46 tons on average for the entire year As with the constriction at Thebes waterway carriers were apparently determined to satisfy shipper needs though this came at higher transportation costs Corn harvests along the Lower Mississippi were less affected by the drought than in the traditional Corn Belt regions served by the Upper Mississippi Ohio and Illinois Rivers which coupled with stronger soybean traffic led to increased traffic through this reach as opposed to more steady traffic through Thebes
Table 7 Loaded Barges Past Greenville Mississippi ndash 2011 and 2012
2011 2012 Difference 2011 ‐ 2012
Loaded Barges 92108 95760 3652 Tons 163314542 165384334 2069792 Tons per Loaded Barge 17731 17271 (46)
Source US Army Corps of Engineers Waterborne Commerce Statistics Center
Page17
700
600
500
400
300
200
100
f- f-
f-f-r-
Ohio River LD53
Tow Counts 2011 amp 2012
r- f-I-- fshy f- f-
r- r- r- r-f- f- f- f-r- r- r- r-
f-f-
f-f-rshy
800
700
600
500
400
300
200
100
r-r-fshy1shy-shy
Mississippi River LD27 Tow Counts 2011 amp 2012
-shyt- t-r- r-r- r-f- fshy1shy 1shy-shy -shy
shyr-r-fshy1shy-shy
t-rshy1shy
fshy1shy-shy
-
400
350
300
250
200
150
100
so
1shy
f-f-tshy-shy
Peoria LD Tow Counts 2011 amp 2012
1shy 1shy r-shyf- f- f-f- f- f-t- t- tshy-shy -shy -shy
1shy
f-f-tshy-shy
Figure 11 Tow Counts at Selected Locks 2011 and 2012
35 Fleet Utilization
The C01ps Lock Perf01mance Monitoring System (LPMS) data was examined at the three gateway locks discussed above this time for evidence of altered vessel operation pattems As seen in FIGURE 11 the effect of the 2011 high water event on the lower Ohio River is reflected in lower tow counts in April and May of that year othetwise tow counts are fairly similar between 2011 and 2012 The droughts effect was more apparent at Mississippi River LD27 an d at Peoria LD where tow counts were down significantly between 2011 and 2012 dming the summer and fall months ---------------------------------------
Page 18
Barges per tow and composition of tows did not change dramatically at any of the three locks between 2011 and 2012 (see TABLE 8) The most significant change occurred at LD53 where barges per tow dropped from 117 per tow to 111 per tow while the percentage of empties increased by 3 percent Tow sizes at LD27 remained around 75 barges per tow and grew slightly from 64 to 67 barges per tow at Peoria LD Significantly fewer loaded barges were processed at each of the three locks
Table 8 Barges Tows and Barges per Tow Selected Locks Ba rge s TOTAL
Tow s Ba rges
pe r Tow Loaded Loaded Empty Empty Tota l LD 53
2007 48592 68 23187 32 71779 7039 102 2008 48009 68 22434 32 70443 6624 106 2009 40352 65 21706 35 62058 5489 113 2010 47030 67 23602 33 70632 5984 118 2011 47465 67 22863 33 70328 6021 117 2012 45064 64 25656 36 70720 6352 111
LD 27 2007 41019 67 20574 33 61593 7217 85 2008 35391 70 15343 30 50734 6456 79 2009 37259 64 20868 36 58127 6753 86 2010 35647 65 19299 35 54946 6792 81 2011 34799 68 16709 32 51508 6909 75 2012 34237 67 16904 33 51141 6713 76
Peoria 2007 15336 67 7519 33 22855 3264 70 2008 13526 69 5981 31 19507 3063 64 2009 13376 64 7677 36 21053 3028 70 2010 13452 65 7402 35 20854 3044 69 2011 13265 67 6621 33 19886 3087 64 2012 12702 67 6185 33 18887 2803 67
The effect on total tons of fewer loaded barges through these locks was heightened by lighter loadings measured in tons per barge (see FIGURE 12) which occurred in the late summer and fall of 2012 At LD27 loadings were down approximately 100 tons per barge in October November and December of 2012 when compared with the same months in 2011 and down approximately 75 tons per barge in October and November at Peoria LD
Page19
Ohio River LDS3 Aver age Barge Loadings
1850 ---------------------shy1800 +-------------------shy1750 -1-------=-------------shy1700
~ 1650 ~ 1600
1550 1500 1450 1400
1850 1800 1750 1700
~ 1650 ~ 1600
1550 1500 1450 1400
1850 1800 1750 1700
~ 1650 ~ 1600
1550 1500 1450 1400
Jan Feb Mar Apr May Jun Jul Aug 5ep Oct Nov Dec Ave
r r-r-r-rshyshy
Mississippi River LD27 Average Barge Loadings
r- r- r-r- r- r-r- r- r-r- r- r-r- r- rshyshy shy shy
r-
r- rshy shy
r- r- r-r- r- rshyshy shy -
Jan Feb Mar Apr May Jun Jul Aug 5ep Oct Nov Dec Ave
-shy
r-rshy-
Peori a LD Average Barge Loadings
r- r-r- r-
r- r- r-r- r- r-r- r- r-r- r- rshyshy shy shy
rshy - r-
r- r- r-r- rshy 1shy
r- r- r-r- rshy shyshy shy -
Jan Feb Mar Apr May Jun Jul Aug 5ep Oct Nov Dec Ave
Figure 12 Average Bar ge L oadings at Selected Locks 2011 amp 2012
The combination of fewer barges per tow and lighter loadings at LD27 and Peoria continued a trend at these two locks of fewer tons per tow (see FI GURE 13) A distinct pattem emerges at LD27 one that minors the pattem of grain shipments Significantly larger tons per tow occur during the peak grain shipping season These cyclical variations occur each year though the peaks an d valleys have smoothed with each passing year In 2012 the cyclical pattem is all but unnoticeable At LD53 the combination of smaller tows a greater percentage of empty barges
Page 20
LDS3 Tons per Tow by Month 2007 -2012
LD27 Tons per Tow by Months 2007 - 2012
Peoria LD Tons per Tow by Month 2007 -2012 10000
9000
8000
7000
6000
~ _ 5000
4000
3000
2000
1000
rJ A AA I IVV1 ~ AAV II1 v
1 y bull
Figure 13 Average Barge Loadings at Selected Locks 2007 - 2012
and somewhat lighter loadings caused tons per tow to drop steeply toward the end of2012 despite an increase ofover 300 tow transits that year
Page 21
36 Summary and Conclusions Traffic patterns were examined on the four high volume waterway segments affected by low water in 2012 With the exception of the Lower Mississippi from Cairo Illinois to Baton Rouge Louisiana each segment experienced lower traffic in 2012 than in 2011 Sharp declines in corn traffic undoubtedly related to a greatly diminished harvest explain most of the traffic decline though carriers continued to maintain volumes otherwise
When looking at monthly traffic levels reported in the LPMS data for the gateway locks to the Ohio Illinois and Upper Mississippi (Ohio River LD53 Peoria LD and LD 27) typical cyclical patterns of shipment are apparent in 2012 but at lower levels Vessel operators ran significantly fewer tows in the summer and fall moved fewer barges at LD27 and Peoria but more barges at OH53 ndash this increase being explained by the increased movement of empty barges Tows pushed fewer loaded barges that were more lightly loaded (100 tons per barge less than average at LD27) The end result was lower traffic at each of these three projects
Unfortunately there is no data equivalent to LPMS available at the constriction points on the Mississippi River at Thebes and Grand Tower Illinois that will describe how vessel operators configured their tows We do know that there were vessel draft restrictions that affected both loadings and the size of towboats as well as tow size restrictions According to the Waterborne Commerce Statistics waterway traffic at Thebes Illinois and Greenville Mississippi changed only slightly between 2011 and 2012 declining by 12 percent at Thebes and increasing by 12 percent at Greenville Average tons per barge declined at both locations for the year We also know from surveys and discussions with vessel operators (discussed in subsequent sections) that fleeting operations were initiated above and below the Middle Mississippi reach between Thebes and Grand Tower Illinois in order to optimize the use of a limited number of smaller towboats required through this reach while still utilizing the larger towboats that typically move through this area
Page22
4 LD27 CLOSURE ANALYSIS
41 General
Mississippi River Locks and Dam 27 (LD27) is located on the Upper Mississippi River at mile 1845 near Granite City Illinois and just above St Louis Missouri It is the 4th busiest lock in terms of tonnage processing 250 million tons of agricultural products 101 million tons of chemicals and 101 million tons of petroleum products in 2012 Three closures of special note occurred at this project in 2012 The first was a main chamber closure which occurred in January of 2012 The second was an emergency closure of both chambers caused by an accident related to low water conditions at the lock The third outage was a planned closure of the main chamber to remove the guide cell damaged during the September accident
The US Army Corps of Engineers Lock Performance Monitoring System (LPMS) collects traffic and processing data from each of its lock projects LPMS data for LD27 was analyzed in order to estimate the cost impact on waterway carriers of all three closures the latter two being directly related to the low-water experienced in 2012 The January 2012 closure analysis offers some perspective when evaluating the economic impact on carriers of the five day outage of the project that was related to low water Section 42 examines the first two closures and Section 43 the third closure that began in 2012 and ended in 2013
42 January and September 2012 Outages
The January 2012 closure was a scheduled closure of the 1200rsquo x 110rsquo main chamber The outage began on 4 January 2012 at 0433 hours and ended when the chamber was reopened on 15 March 2012 at 0039 hours The closure allowed for an embedded metal repair to be completed The main chamber was closed for 1700 hours or approximately 70 days and 20 hours The second closure occurred on 15 September 2012 at 0232 hours when a guide cell was ruptured by a tow allision The resulting gravel spill from within the cell and damage to the guide cell prohibited safe passage through the main chamber A little over 15 hours later at 1527 hours the auxiliary chamber closed resulting in a total river closure Both the main and auxiliary chambers were reopened 20 September 2012 at 0330 hours therefore for 5 days and 3 hours the Mississippi River was completely closed to waterway traffic at LD27
421 Tow Arrivals
FIGURE 14 shows the arrivals per day at LD27 for the months of January ndash September 2012 Average tow arrivals per day for the period outside the closures 15 March through 15 September 2012 was 190 tows per day Average arrivals per day for the first closure period 4 January through 15 March 2012 decreased from the 190 tows per day outside the closure period to 152 tows per day Average arrivals per day for the second closure period 15 September through 20 September 2012 were 116 tows per day versus the 190 tows per day outside the closure period
Page23
Lock 27 Upper Mississippi River Main and Auxil iary Tow Arrivals 2012 Chamber
35 ---------------------------------------------------------~~ Main Chamber Closed
15
10
0 ~--------------~----------------------------------------~~ J an Feb Mar Apr May Jun Jul Aug
5 ++---------------+----------------------------------------~~
Figure 14 LD27 Tow Arrivals 2012
422 Tow Processing Time
During the first closure of the 1200 main chamber that occmTed from Janumy through March 1089 tows umiddotansited LD27s auxilimy chamber The average processing time increased from 48 minutes for all tows outside the Janumy through Mmmiddotch 2012 closure to 78 minutes during the closure
At the beginning of the second main chamber closure from 0020 through 1527 on 15 September 2012 only two tows umiddotansited LD27 auxilimy chamber The average processing time increased from 48 minutes for all tows outside the September closure to 209 minutes during the closure
The 2012 closures increased the processing time 30 minutes per tow The 1091 tows that umiddotansited the auxilimy chamber during the main chamber closures caused an additional549 hours of tow umiddotansit time
423 Tow Delays
FIGURE 15 shows delays at LD27 for the period from Janumy- September 2012 Delays stmied building soon after the 1200 chamber closed and continued until17 Mmmiddotch 2012 at 0110 hours This means that the 1700 hour closure impacted traffic for 1749 hours The 49 hour difference represents the time required for the reopened chamber to serve th e tows in queue and bring the delay back to zero During the impact period 16366 hours of tow delay were experienced by 1148 tows This results in an average delay of 143 hourstow for the first closure in year 2012 from Janumy through March By compmmiddotison 4054 tows were served at
Page 24
LD27 outside the Januruy - Mrumiddotch and September 2012 closure periods The average nonnal delay per tow was 183 minutes or approximately 31 hours Given that the average additional delay per tow was 112 hours for the Januaty - Mrumiddotch closure and that 1 148 tows were impacted the closure caused 12866 hours of additional delay
With the September 2012 closure delays strut ed building soon after the 1200 and 600 chamber closed and continued until 25 September 2012 at 1135 hours This means that the 123 hour river closure impacted traffic for 251 hours The 128 hour difference represents the time required for the reopened chambers to serve the tows in queue and bring the delay back to zero During the impact period 6498 hours of tow delay were experienced by 141 tows This resulted in an average delay of46 hourstow Given that the average nonnal delay per tow was 31 hours the average additional delay per tow was 43 hours for the September closure and that 141 tows were impacted the closure caused 6068 hours of additional delay
A total of 1288 tows were impacted in 2012 which caused an additional delay of 18934 hours Therefore on average each tow experienced 147 hours more delay during the closure than n01mal The maximum delay was 127 hours
Lock 27 Upper Mississippi River Average Hou r ly Tow Delays - Year 2012 Main and
Auxili ary Chamber
120 - Main Chamber Closed
100 80
60
40
1 tJi20
A amp A AIt amp ~~ A middot AIAA 10 ~~~m~~~~m~~~~M~~~~M~~~~M~~~~M~~~~M~~~~M~~~~M~~~~M~~~~M~~~~M~~~~M~~~~M middotmiddot middotshy~~NNNMMVV~~~~~~~~~~~~~OOO~~NNNMMVVV~~~~~~~~~~~~OOO~~NNNMMVVV~~~~~~
~~~ bull -l-l-t-t-41ii~-l-l-t-t-lt-1 -t-t-t-t-t -l~ -t-tNNNlNiNNNN1~NNNNNNN
Jan Feb Mar Apr May Jun Jul Aug Sept
Figure 15 LD27 Average Hourly Delays 2012
424 Cost Impact
The analysis above shows that the Januruy through Mrumiddotch 2012 closure caused an additional 543 hours ofprocessing time and 12866 hours of delay Given this additional transit time and average hourly operating costs for tows at LD27 the Januruy through March closure cost caniers an additional $87 million to process through the lock The September closure caused an additional 5 hours ofprocessing time and 6068 hours of delay for a total closure cost of approximately $39 million While the 70 day closure of the main chamber resulted in additional
Page 25
costs of$124000 per day the much sholier 6 day closure (with 5 days oftotal river closure) cost industry a much higher $550000 per day in delay time
43 December 2012 through March 2013 Main Chamber Closure
The third an d fmal closure at LD27 occmTed between 10 December 2012 and 2 March 2013 when th e C01ps removed the guide cell damaged in September 2012 Removal of the guide cell necessitated closure of the main chamber (and some brief closures of the auxiliruy chamber) The main chamber was closed for 1968 hours or approximately 82 days
431 Tow Arrivals
FIGURE 16 shows the anivals per day at LD27 for the months ofNovember 2012 - April2013 Average tow ruTivals per day for the period outside the closures from 1 Jlme 2012 through 31 May 2013 were 183 tows per day Average ruTivals per day for the closure period 10 December 2012 through 2 March 2013 decreased to 127 tows per day
Lock 27 Upper Mississippi River Tow Arrivals Dec 2012 - Mar 2013
35
30 Main Chamber Closed
25 uj20 amp -uA I ~
I~ ~~ I A ~ I15 ~~ n ~~
~~~ - ~1J vr 1 A10 I
5
0
~
~~~O~~~N~~~~~O~~~N~~~M~~N~~~~~ON~~~~~Om~~~~Om~~N~~~m~~N~~~~~ ~~~~NNN ~~~NNNm NNNm NNN NNNm NNN
Nov Dec Jan Feb Mar Apr
Figure 16 L D27 Tow Arrivals December 2012 - March 2013
432 Tow Processing Time
During the closure of the 1200 chamber 35 of the tows through LD27 had to double cut - the tow fl otilla had to be broken into two pruis an d each prui of the fl otilla locked through separately This increased the average processing time fr om 51 minutes for all tows outside the December 2012 through March 2013 closure to 88 minutes during the closures During the closures 1032 tows tImiddotansited LD27 Given an increase in time of 37 minutes per tow an d 1032 tows an additional 643 hours of tow processing time was experienced during the closure
Page 26
433 Tow Delays
FIGURE 17 shows delays at LD27 for the December 2012 through March 2013 closm e period Delays statted building soon after the 1200 chambers closed on 10 December 2012 at 1530 homs and continued until 4 March 2013 at 0008 hom s This means th at th e 1968 hom closme impacted traffic for 2001 hom s The 33 hom difference represents th e time requir ed for th e reopened chamber to serve th e tows in queue an d bring the delay back to zero Dming the impact period 23058 hom s oftow delay were experienced by 1076 tows (total delay in all of 2011 was 9349 homs) This 23058 homs works out to an average delay of214 homstow for th e closm e period By comparison 5246 tows were served at LD27 outside the closm e period from 1 June 2012 through 31 May 2013 The average non nal delay per tow was 27 1 minutes or approximately 45 hom s Given that the average additional delay per tow was 17 hom s for th e December 2012 - March 2013 closme an d that 1076 tows were impacted the closme caused 18195 homs of additional delay The maximum delay experienced by a tow dming this closme was 805 homs
Minimum Average amp Maximum Tow Delays Lock 27 Upper Miss River
Dec 2012 middotMar 3
90
80
70 -f 60 ~ ~ 50 0 1shy 40 Q) Q
gt- 30 ca Q) 20 0
10
De Jan
Mar bull Minimum bull Average Maximum Apr
Figure 17 LD27 M inimum Maximum and Average Tow Delays December 2012- March 2013
444 Cost Impact
The most recent infon nation available indicates that the average tow transit costs at LD27 are about $648 per hom Given the analysis above which shows that this scheduled closm e caused an additional 643 hom s ofprocessing time and 18195 hom of delay the estimated additional transit time dming the closm e cost a total of $ 122 million
Page 27
Page28
5 SHIPPER RESPONSE
51 Survey Procedures
An OMB-approved Shipper Survey (Control 0710-0001) was used to capture and evaluate shipper reactions to the drought and the emergency closure of LD27 in September (see Appendix A) Shippers were defined as companies that receive commodity traffic transiting through multiple reaches on the Mississippi River The formal shipper survey was conducted between 7 March and 30 May 2013 The purposes of the survey were to find out what measures were taken by industry to mitigate the effects of the drought-related low water and emergency closure at LD27 and to estimate the total costs to industry that resulted from the events
At the outset of the process several steps were adopted for including firms in the survey First a list was compiled that showed the parent companies that operate at docks in the four affected waterways ndash the lower Ohio lower Illinois Middle Mississippi and Lower Mississippi Rivers ndash and that ship through LD27 The parent companyowner of each receiving dock was identified using information available to the Corps and grouped by parent company This allowed an estimate of tonnage by parent companyowner to be formulated Parent companies were then ranked in descending order by their total tonnage received For LD27 and each affected waterway the top 25 ranked by companies by tons shipped were selected to be surveyed Duplicate shippers (shippers that had a top 25 ranking in more than one reach) were included as one survey and the next largest company was added to obtain the top 25 unique companies to survey in the study area In all 125 shippers were sent surveys
Waterborne Commerce Statistics Center (WCSC) data for 2011 was used in assembling basic shipper information All of the contact information for the top ranking companies was determined by comparing several contact lists In the absence of any contact information the Internet was used as a search tool to verify correct contact information for these parent companies The 125 shippers were sent a mail survey followed by a telephone follow-up if the parent company or carrier sent no response after two weeks Stakeholders like the American Corn Growers Association the River Industry Action Council (RIAC) and the Waterways Council Incorporated (WCI) assisted by encouraging firms to respond by sending emails to all members late in the survey to encourage participation
According to survey respondents low water presented the greatest challenge to users of the Lower Mississippi from Cairo Illinois to Baton Rouge and the Middle Mississippi River between St Louis and Cairo Traffic on these two reaches totaled 2024 million tons in 2011
Page29
52 Summary of Shipper Responses
Responses to the survey were received from 73 companies representing a response rate of 59 percent and accounting for 42 percent of total 2011 traffic transiting the affected waterways Questions 1a and 1b were used to help determine if the shipper had any impacts from either the emergency lock closure event at LD27 or from the low water conditions Questions 2 and further into the survey were designed to be answered by shippers who had responded that they were impacted by either or both of these events From question 2 onwards the subset of respondents is less than the total that returned surveys because some shippers indicated that they were not impacted by either event in question An overwhelming percentage of respondents to the shipper survey said they were unaffected by the LD27 closure while half of the respondents indicated they experienced significant effects on operations due to low water In an effort to meet their needs shippers sought other sources for product sought other waterway routes and used overland transportation routes at a cost to responding shippers of $56 million The effect of the drought on agricultural production combined with increased transportation costs resulted in temporary plant closures and lost sales that the responding shippers estimated at $79 million
Page30
6 CARRIER RESPONSE
61 Survey Procedures
The Carrier Survey targeted the major towing companies that used the waterways affected by low water in 2012 (the lower Ohio the lower Illinois the Middle Mississippi and the Lower Mississippi Rivers) Appendix B contains the Carrier survey form The purpose of this survey was to identify carrier responses to the 2012 low water event and the LD27 closure Like the shipper survey the formal carrier survey was conducted between 1 March and 30 May 2013 The purpose of the surveys was to determine what measures were taken specifically by the carriers to adapt to the emergency closure at LD27 and drought conditions and what these measures cost
The firms included in the carrier survey were the 10 largest users of the affected waterways (in tonnage) for the years 2006 through 2010 Responses were received from six companies representing 46 percent of carrier traffic on these waterways According to survey respondents low water presented the greatest challenge to users of the Lower Mississippi from Cairo Illinois to Baton Rouge Louisiana and the Middle Mississippi River between St Louis Missouri and Cairo Traffic on these two reaches totaled 2024 million tons in 2011 Survey respondents accounted for 58 of the tonnage in these two reaches
62 Summary of Carrier Canvas Responses
Once the initial set of shippers and carriers for canvassing was established contacts were identified for each company This information was taken from publicly available sources and in some instances through the assistance of industry associations such as the American Corn Growers Association the River Industry Action Council (RIAC) and the Waterways Council Incorporated (WCI) These organizations were also of assistance in encouraging firms to respond by emailing members late in the survey process to encourage participation
Responses were received from six carriers (60) representing 59 percent of total traffic on the affected waterways All but one of the carriers responding indicated that they were affected by both low water and the LD27 closure with the low water being the more serious challenge Moving cargo during this period required carriers to advance or delay shipments light load vessels (necessitating additional trips) reposition barges throughout the system to accommodate the need for additional barges restrict tow sizes (also necessitating more trips) and perform additional refleeting These altered carrier operations cost responding carriers an estimated $807 million Carriers also experienced $167 million in additional costs due to the LD27 closure and delays and tug costs of $02 million due to tow grounding
Page31
Page32
7 FEDERAL RESPONSE
Federal stewards of the inland waterways were aided by past experiences like the 1988 drought and the low-water event on the Lower Mississippi River in 1997 and advancements in the data provided by the National Oceanographic and Atmospheric Administrationrsquos (NOAA) as well as hydrologic tools used by the Corps to forecast water levels These advancements improved the ability of the Corps and the Tennessee Valley Authority in controlling available water in efforts to keep navigation open on the lower Ohio and on the Mississippi Rivers The US Coast Guard took the lead in creating communication avenues between all stakeholders in managing vessel operation and reaching consensus on channel and vessel operational maintenance during the event According to representatives of the Coast Guard no additional expenditures of funds accompanied their extraordinary efforts
On the Ohio River the Corps of Engineers essentially borrowed resources from other locations to be repaid at some future date No emergency funding was made available Channel surveys were conducted more frequently on known trouble spots sometimes twice weekly The Louisville District estimated that dredging costs were approximately $21 million higher than in a typical year (see TABLE 9) The funds were drawn away from other projects in effect with the promise of repayment in a future year to accomplish work that could not be done as a result of moving funds to the lower Ohio
Table 9 Costs Incurred by the Corps
($millions)
District Added Cost Vicksburg $ 729 StLouis
dredging blasting LD27 1
subtotal
$ $ $
1190 970 097
$ 2257 Louisville $ 207 TOTAL $ 3193
1 Costs to bring LD27 into immediate s ervic e Inc ludes cos t of spud barge temporary helperboat assists and gravel cleanup
Source US Army Corps of Engineers Vicksburg St Louis and Louisville Districts
On the Mississippi River emergency funds were made available by Congress in 2011 in response to the flooding that year and any possible future emergencies The rock pinnacles at Thebes and Grand Tower Illinois were blasted and debris removed at an estimated cost of $97 million At LD27 the spilled gravel from the damaged cell and the cell itself were removed and
Page33
temporary safe passage accommodated at an estimated cost of $10 million11 St Louis District dredging was concentrated on the Middle Mississippi as the Lower Illinois was not severely affected Dredging completed by the Vicksburg District on the main stem Mississippi cost $73 million more than average dredging costs over the last several years
11 The Corps estimates it will cost another $35 million to replace the damaged cell This was not includedin thefederal cost
Page34
8 FINDINGS
Traffic patterns were examined on the four high volume waterway segments affected by low water in 2012 With the exception of the Lower Mississippi from Cairo Illinois to Baton Rouge Louisiana each segment experienced lower traffic in 2012 than in 2011 Sharp declines in corn traffic related to a greatly diminished harvest explain most of the traffic decline though carriers continued to maintain volumes of all other commodities otherwise
When looking at monthly traffic levels reported in the LPMS data for the gateway locks to the Ohio Illinois and Upper Mississippi (LD53 Peoria LD and LD 27) typical cyclical patterns of shipment are apparent in 2012 but at lower levels Vessel operators ran significantly fewer tows in the summer and fall moved fewer barges at LD27 and Peoria but more barges at OH53 ndash this increase is explained by the increased movement of empty barges Tows pushed fewer loaded barges that were more lightly loaded (100 tons per barge less than average at LD27) The end result was lower traffic at each of these three projects
Unfortunately there is no data equivalent to LPMS available at the constriction points on the Mississippi River at Thebes Illinois and Grand Tower Illinois that will describe how vessel operators configured tows by number of barges per tow We do know that there were vessel draft restrictions that affected both loadings and the size of towboats as well as tow size restrictions We also know from surveys and discussions with vessel operators (discussed in previous sections) that fleeting operations were initiated above and below these points in order to optimize the use of a limited number of smaller towboats required through this reach while still utilizing the larger towboats that typically move through this area
The Corps surveyed 125 shippers and ten carriers The 73 shippers that responded represent 42 percent of all shipper traffic transiting the affected waterways Half of the respondents to the shipper survey indicated that they did not experience any significant effects on operations due to low water and an overwhelming percentage said they were unaffected by the LD27 closure Ten carriers were surveyed The six carriers responding represented 46 percent of all carrier traffic transiting the affected waterways All but one of the carriers responding indicated that they were affected by both low water and the LD27 closure with the low water being the more serious challenge The difference in shipper and carrier responses suggests that the shippers were somewhat insulated from these events by the strategic and tactical actions taken by the carriers that minimized impacts on the shippers
Despite lower corn production and a 51 decline in corn exports waterway traffic through the Middle Mississippirsquos rock pinnacles at Thebes Illinois constriction was largely unchanged between 2011 and 2012 (though it is important to remember that the worst low water conditions were experienced from December 2012 through February 2013) Moving cargo during this period required carriers to advance or delay shipments light load vessels (necessitating additional trips) reposition barges throughout the system to accommodate the need for additional barges restrict tow sizes (also necessitating more trips) and perform additional refleeting It cost responding carriers an estimated $807 million to alter operations in this fashion (see TABLE
Page35
10) The carriers also faced $167 million in additional costs as a result of the LD27 closures and delays and tug costs of $02 million due to tow groundings Despite these actions shippers did not escape the effects of the low water In an effort to meet their needs shippers sought other sources for product sought other waterway routes and used overland transportation routes at a cost to responding shippers of $559 million The effect of the drought on agricultural production combined with increased transportation costs resulted in temporary plant closures and lost sales that the responding shippers estimated at $790 million
Table 10 Survey Results - Low Water Cost Impacts
Cost Category Cost ($000) Transportation cost impacts
Carrier cost impacts Delays due to LD27 clos ure 16100 $ Other costs due to LD27 clos ure 573$ Groundings 164 $ Altered operations 80723 $
Shipper cost impacts 55860 $ SUBTOTAL 153419$
Production cost impacts 79000$ TOTAL 232419$
Page36
9 CONCLUSIONS
Several observations can be made from an examination of the traffic data obtained from LPMS and WCSC sources and responses generated from the surveys of the navigation industry The obvious message is that a system that is not operating at a level of reliability expected by users will have economic consequences Resulting increases in transportation costs andor delays to the transportation of commodities will have an effect on the marketplace Either the producer will pay more thus reducing expected profit associated with their products or the end user will experience higher commodity prices at the market once prices are adjusted
The low water the 5-day closure of LD27 in September 2012 and the subsequent 82 day closure of the main chamber between December 2012 and March 2013 imposed additional transportation costs of $1534 million just on the companies that responded to the Corpsrsquo surveys Drought andor low water accounted for another $790 million in production losses bringing the total reported impact to $2324 million Shipper survey respondents averaged $098 per ton in production losses and $080 per ton in increased transportation costs as they shifted to other modes and routes These values were applied to tonnage not accounted for through the sample or for which no response was given Carrier survey respondents provided a range of cost impacts $009 per ton for production loss $0005 per ton for non-delay related operations during the LD27 closure $0001 per ton related to grounding logistics and $069 in added transit costs Using these values a simple extrapolation of the sample to the population of movements using the most affected waterways (the Middle Mississippi and Lower Mississippi River) either not sampled or not responding suggests that additional transportation costs totaled $2770 million and production impacts amounted to $1652 million for a total impact of $4422 million12
Table 11 Low Water Cost Impacts from 2012 Event (Costs in $000)
Cost Category Survey
Responses
Estimate for Firms Not
Responding Not Surveyed TOTAL
Transportation cost impacts Carrier cost impacts
Delays due to LD27 closure 1 $ 16100 ‐$ $ 16100 Other costs due to LD27 closure $ 573 417 $ $ 990 Groundings $ 164 119 $ $ 283 Altered operations $ 80723 58719 $ $ 139442
Shipper cost impacts $ 55860 64277 $ $ 120137 SUBTOTAL $ 153419 123532 $ $ 276951
Production cost impacts 2 $ 79000 86248 $ $ 165248 TOTAL $ 232419 209780 $ $ 442199
1 I ncl udes del a y cos t experi enc ed due to LD27 ma i n cha mber cl os ure Dec 2012 ‐Ma r 2013 to remove dama ged cel l
2 I ncl udes ec onomi c impact of reduced corn producti on and hi gher tra ns porta ti on cos ts due to low‐wa ter
12 It is important to remember that not all waterways affected by the drought were covered by this survey
Page37
Using available transportation rate studies conducted for navigation improvement studies on the Upper Mississippi Illinois and Ohio River it is estimated that this tonnage moves at an average transportation rate savings of $2558 a ton Therefore at 2011 traffic levels total savings on these rivers would likely have been an estimated at $58 billion dollars The three most affected Corps of Engineers districts expended $319 million to keep the lower Ohio lower Illinois Middle Mississippi and Lower Mississippi river channels open to navigation in extreme drought conditions enabling shippers to continue navigation While industry faced losses of an estimated $2770 million due to increased transportation costs through the cooperative and coordinated efforts of the Corps the Coast Guard and industry partners shippers and the Nation were able to realize a savings in transportation costs of an estimated $55 billion despite this extreme low water event
Page38
APPENDIX A ndash SHIPPER QUESTIONNAIRE
PageA‐1
OMB Control 0710-0001 Expiration date 02282015
2012 DROUGHTLOCK 27 CLOSURE ndash SHIPPER SURVEY
Date
Firm
Address
Phone
FAX
Point of Contact
Title
General Description of Firm and Products Produced
NOTE ALL RESPONSES WILL BE TREATED AS CONFIDENTIAL
1 Was your company impacted by the closure event at Lock 27 in 2012 Yes No Was your company impacted by low water associated with the Drought Low water conditions in 2012 Yes No (If no interview is complete)
2 Does your company have a response plan for these types of impacts If so did it result in additional work organization to implement or was it detailed enough to cover all the impacts
1
PageA‐2
OMB Control 0710-0001 Expirat ion date 0228201 5
2012 DROUGHTLOCK 27 CLOSURE- SHIPPER SURVEY
LD27 closure
only Low
wate1middot Descriptio n of Response
a No change in procedmes b Stockpiled product and waited for traffic to clear if closme or changed loading depth in barges for low wat er c Switched to all-overland mode for product delivety from existing somces d Switched to different watervray routing for product delivety from existing somces e Switched product somce to an entirely new somce f Ceased operations dming the period g Altered production during the period h Switched production to another facility i Purchased intermediate or final product rather than produced j Other or combinations of the above (Please explain)
3 During th e 2012 event (either Low water or Lock 27 closure) what was your companys response Please indicate with an x in the appropriate box
4 Ifyou have checked c or d in question 3 please complete the following table
Movement Commodity Affected tonnage
Origin (City State)
Destination (City State)
Deliverd $ ton
plio1middot to drou2ht
Delivered $to n
during drou2ht
Examples
I Com 12000 Minneapolis New Orleans $30 $35
MN LA
2 Lube oils 4000 Houston TX Huntington wv $40 $50
2
PageA-3
OMB Contro l 0710-0001 Expiration date 02 282015
2012 DROUGHTLOCK 27 CLOSURE - SHIPPER SURVEY
5 Ifyou checked e in question 2 please complete the following table
Movement Commodity Affected tonnage
P reshydrou ght Origin
(City State)
Ch an ged Origin
(City State)
Destination (City State)
Deliver d $ton
pri01middot to drought
Delivered $ton
dming drought
Examples
1 Com 12000 Minneapolis MN
Cincinnati OH
New Orleans LA
$30 $35
2 Lube oils 4000 Houston TX Ashland KY
Pittsburgh PA $40 $50
6 Ifyou checked response a orb lmder question 3 how were your total production costs affected during the period of closure at Lock 27 or Drought-related low water (total increase in cost if applicable) Please explain
7 Ifyou checked response f under question 3 what was the total estimated loss to your fi1m as a result of ceasing production (during the closure period at Lock 27 or Drought)
3
Page A-4
OMB Control 0710-0001 Expiration date 02282015
2012 DROUGHTLOCK 27 CLOSURE ndash SHIPPER SURVEY
8 If you checked response ldquogrdquo under question 3 what was the total estimated loss to your firm as a result of altering production processes (during the closure period at Lock 27 or Drought)
9 If you checked response ldquohrdquo under question 3 what was the total increase in costs to your firm as a result of changing production locations (during the closure period at Lock 27 or Drought)
10 If you checked ldquoirdquo under question 3 to what extent did purchasing intermediate or final product increase your companyrsquos total costs (during the closure period at Lock 27 or Drought)
11 If you checked response ldquojrdquo under question 3 to what extent did the other measures or combination of measures undertaken as a result of the closure increase your companyrsquos total production costs (during the closure period at Lock 27 or Drought)
4
PageA‐5
OMB Control 0710-0001 Expiration date 02282015
2012 DROUGHTLOCK 27 CLOSURE ndash SHIPPER SURVEY
12 Have these events (drought-related low water or Lock 27 closure) caused your company to alter its long-term transportation strategy (eg switch to all-overland modes increase stockpiles etc) How will this impact your total commodity transportation or other costs (per year) Please explain
13 Has the (drought-related low water or Lock 27 closure) caused your company to take any other long-term permanent measures Please explain How will this affect your companyrsquos long-term operating costs (per year)
14 Has your company been impacted by other navigation system disruptions this shipping season (these would be other than the Low water from the drought or the Lock 27 closure)
5
PageA‐6
Event Date 2 Short-term response 3 Long-term responseExample
McAlpine closure
Jan ndash Feb 2006 Diverted to overland modes
none
OMB Control 0710-0001 Expiration date 02282015
2012 DROUGHTLOCK 27 CLOSURE ndash SHIPPER SURVEY
15 If your company has experienced significant navigation disruptions1 prior to this shipping season please complete the following table
1 Significant navigation system disruptions are defined as disruptions that result in delays to your shipment of more than 48 hours (include scheduled and unscheduled lock outages accidents and low and high water events)
2 Short term response refers to the response actions detailed in question 2 a No change in procedures b Stockpiled product and waited for traffic to clear or light loaded for low water c Switched to all-overland mode for product delivery from existing sources d Switched to different waterway routing for product delivery from existing sources e Switched product source to an entirely new source f Ceased operations during the period of closurelow water g Altered production during the period of closurelow water h Switched production to another facility i Purchased intermediate or final product rather than produced j Other or combinations of the above (Please explain)
3 Long term response refers to a modification of your long term business plan to include altering your long-term transportation strategy (eg switch to all-overland modes increase stockpiles etc) Other long term responses might include sourcing commodities at alternate sites or moving production activities to a different location
6
PageA‐7
PageA‐8
APPENDIX B ndash CARRIER QUESTIONNAIRE
[Typetext] PageB‐1
Waterway Carrier Interview Questions Effects of the 2012 Drought and LD27 Closure
Name of towing company -----------shyLocatio n -----------Name and title of Point of Co ntact ----------------shyPhone number ( )________ email _________
PART 1 LOW WATER DUE TO DROUGHT CONDITIO NS
1 Did your firm experience a reduction in tonnage carried on the Mississippi Ill ino is or Ohio waterways in 2012 Please verify data fo r 2010 and 2011 indicating your estimates for 2012 in table below
Operat o r Traffic Destined fo r Lower Mississippi Ports (2010 and 2011 from WCSC)
Origin 2010 2011 2012
Mississippi above St Louis Mississippi St Louis to Cairo Mississippi south of St Louis Ill inois River Ohio River
2 What facto rs led to changes in t raffic between 2011 and 2012 For example drought condit ions that affected agricultural production low water that affected your abi lit y to operate efficiently loss or gain of a contract(s) increased competit ion from rail or other factors - please specify and ind icate re lative weight of each
3 Have you had to change the way you operate your vessel fleet due to the drought If so what changes did you make and when did these occur
1
[Type text] Page B-2
4 The t wo ta bles below are intended to describe how your operat ions are affected by water depth a nd flows on the Cairo - St Louis reach of the Mississippi Rive r
a Do the operat ionalchanges suggested in t he tables below for the Cairo - St Louis reach (Upper Reach) describe the way you would operate given t he gage readings and flow shown for these two reaches in t he t ables If yes please indicate in the appropriate box in the table below with a Y if no please indicate what restrict ions you impose on your operations given t he gage and flow readings provided
Upper Rea ch- Navigation Restriction
St Louis Gage Reading
Flow (CFSOOO)
Navigation Restriction
Carriers Nav Restriction Followed
Above 20 Above 90 No restriction 00 to 20 74 to 90 25 barges -25 to 00 55 to 74 20 barges -35 to -25 485 to 55 16 barges -40 to -35 46 to 485 85 ft draft -45 to shy 4 0 44to47 80 ft draft Below -45 Below 44 Navigat ion halts
b What is t he number of tows- by size of tow horsepower and draft - that you operate through the St Louis to Cairo reach of the Mississippi For each foot of draft t hat is lost what is your added cost per t rip Please use the table below in making your response
Upper Reach- Tows moved thru the St Louis- Cairo reach in 2011 (or year not affect ed by low water)
Tow size Towboat Horseshypower
Barge Draft
Cost ton of loading below desired barge draft
Barges tow
No of tows 05 10 15 20 25 30 35 4 0
1 - 8 9 - 15
16 - 19 17 - 20 21- 25
gt25
2
[Type text] Page B-3
5 The t wo tables below are intended to describe how your operat ions are affect ed by water depth a nd flows on the Mississippi River sout h of Cairo
a Do the operat ional changes suggested in t he tables below for the Lower Reac h of the Mississippi River sout h of Cairo describe the way you would operate given the gage readings and flow shown for these two reaches in the tables If yes please indicate in t he appropriate box in t he table below with a Y if no please indicate what rest rictions you impose o n your operations given the gage and flow readings provided
Lower Reach- Navigation Restriction
Cairo Gage Reading
Flow (CFS in OOOs)
Navigation Restrictions
Carriers Nav Restriction Followed
Above 118 Above 189 No restriction 60 to 118 111 to 189 25 barges per tow
50 to 60 95 to 111 85 ft draft and 20 barges
35 TO 50 805 to 95 8 ft draft and 12 barges
Below 35 Below 805 Navigation halts
b What is t he number of tows- by size of tow horsepower and draft - that you operate on the Lower Reach of t he Mississippi south of Cairo For each foot of draft t hat is lost what is your added cost per trip Please use t he table below in making your response
Lower Reach- Tows moved through the reach south of St Louis in 2011 (or a yea r not affected by low water)
Tow size Towboat Barge Cost ton of loading below desired barge draft
Barges tow
No of tows
Horseshypower
Draft 05 10 15 20 25 30 35 4 0
1 - 12 13 - 16
17 - 20 21- 25 gt25
6 If you light load due t o low water would you proceed entire t rip as originally light loaded or top off
below Cairo or maybe add additional barges to w here the normal t ons per horsepowe r ratio is
achieved If latter how would this be done and at what cost
3
[Type text] Page B-4
7 Did any of your tows experience a grounding If yes how many total occurrences did you experience and what was the impact on your firm Please indicate your response below
total groundings
events with tows delayed more than 8 hours cost of delays
events involving lightering cargo cost of lightering
events involving towboat assists cost of towboat assists
8 What was major impact of low water due to the drought in terms of effect on your operations ‐
increased operating cost Lost business Equipment damage Safety concerns Groundings
Efficient dispatch of fleet Others
9 Please indicate the economic impact of low water levels on your company in the table below (please
include figures from your response to 5 above)
Indicate Cost with an ldquoXrdquo
if this applies to your firm
Description of impact Costton Tons
Affected Total cost
Increased transit time (including delays) Increased cost due to restricted tow sizes Increased costs due to light loading Idle vesselslost revenue Damaged equipment Increased managementlogistics costs Other (please specify)
4
[Typetext] PageB‐5
PART 2 CLOSURE OF LD27
10 If you have tows already at the lock do you generally wait until it reopens
11 What is typical amount of time you will wait at a lock for it to reopen before you decide to do
something else What do you do if you decide not to wait any longer What factors affect this
decision If you re‐dispatch the tow what does this cost
12 If you have tows underway in the system and a closure occurs at a lock to be transited do you
continue to the closure point wait elsewhere or re‐dispatch the tow What factors affect this decision
13 Please indicate the economic impact of the closure of LD27 on your company in the table below
Indicate Cost with an ldquoXrdquo
if this applies to your firm
Description of impact Costton Tons
Affected Total cost
Delay costs at the lock Delays in place (dock or port) Idle vesselslost revenue Increased managementlogistics costs costs (including re‐dispatching) Other (please specify)
PART 3 FINAL COMMENTS
14 Do you have any other information that would help us describe and quantify the economic impact on
waterway carriers associated with low water due to the drought of 2012 andor the closure of LD27
5
[Typetext] PageB‐6
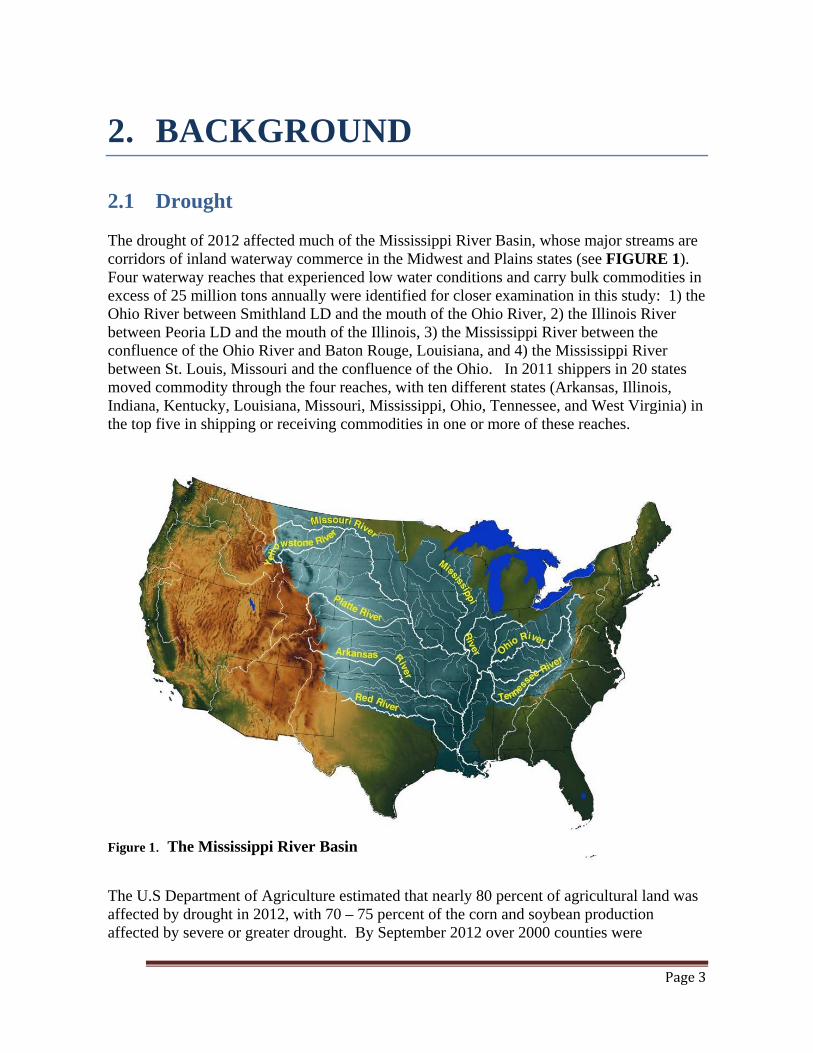
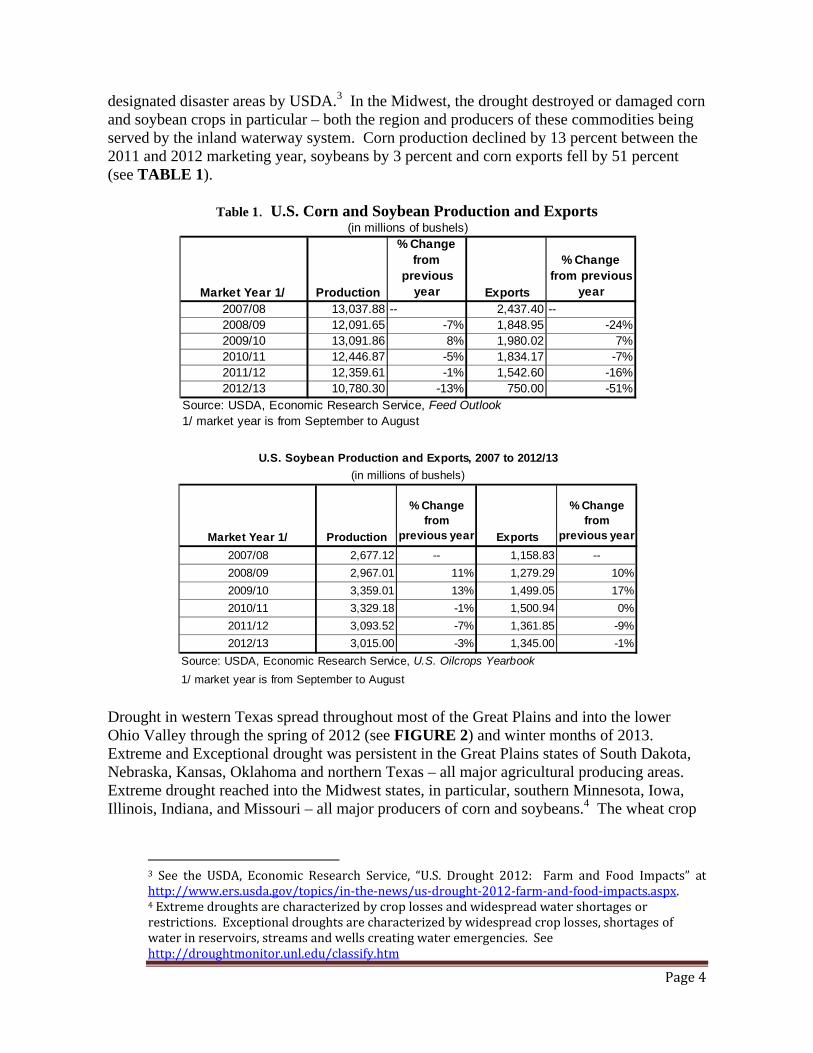
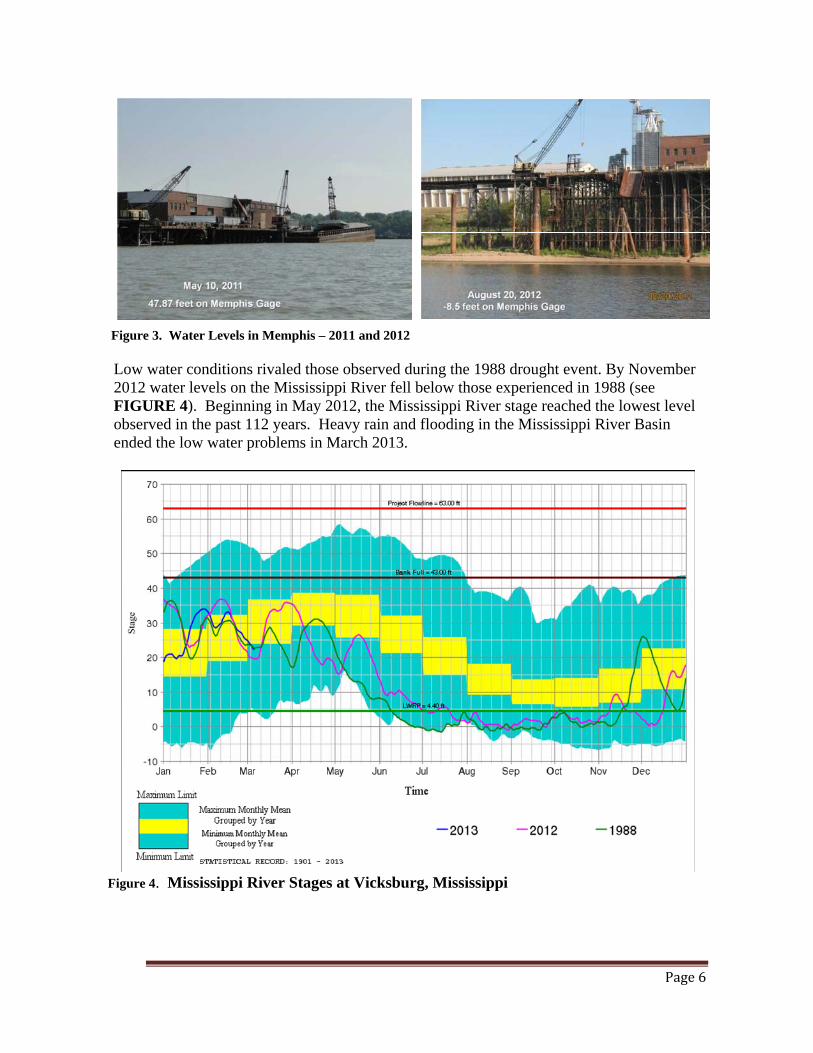
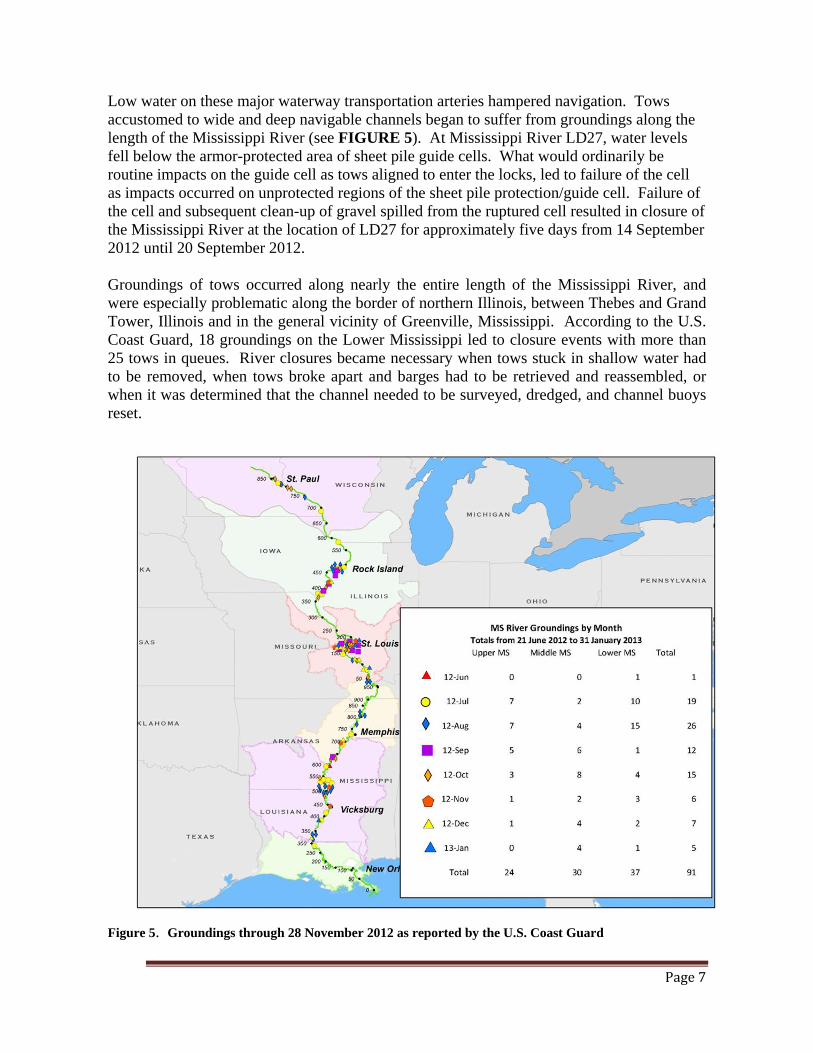
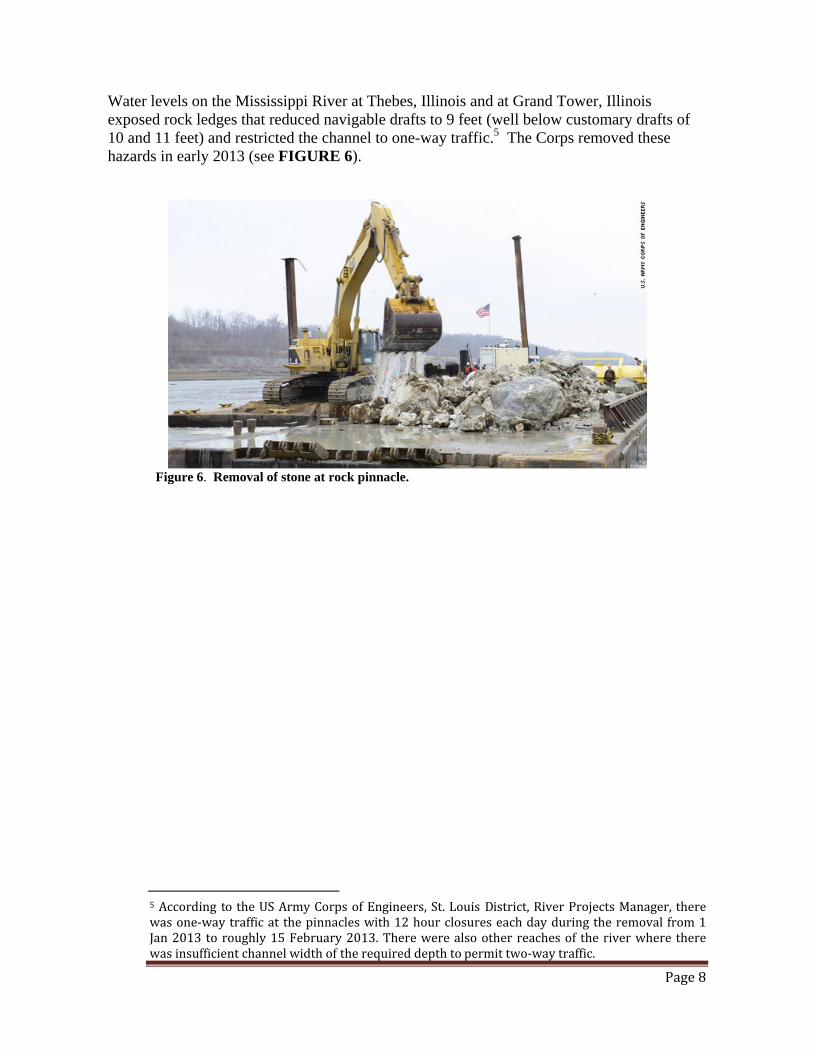
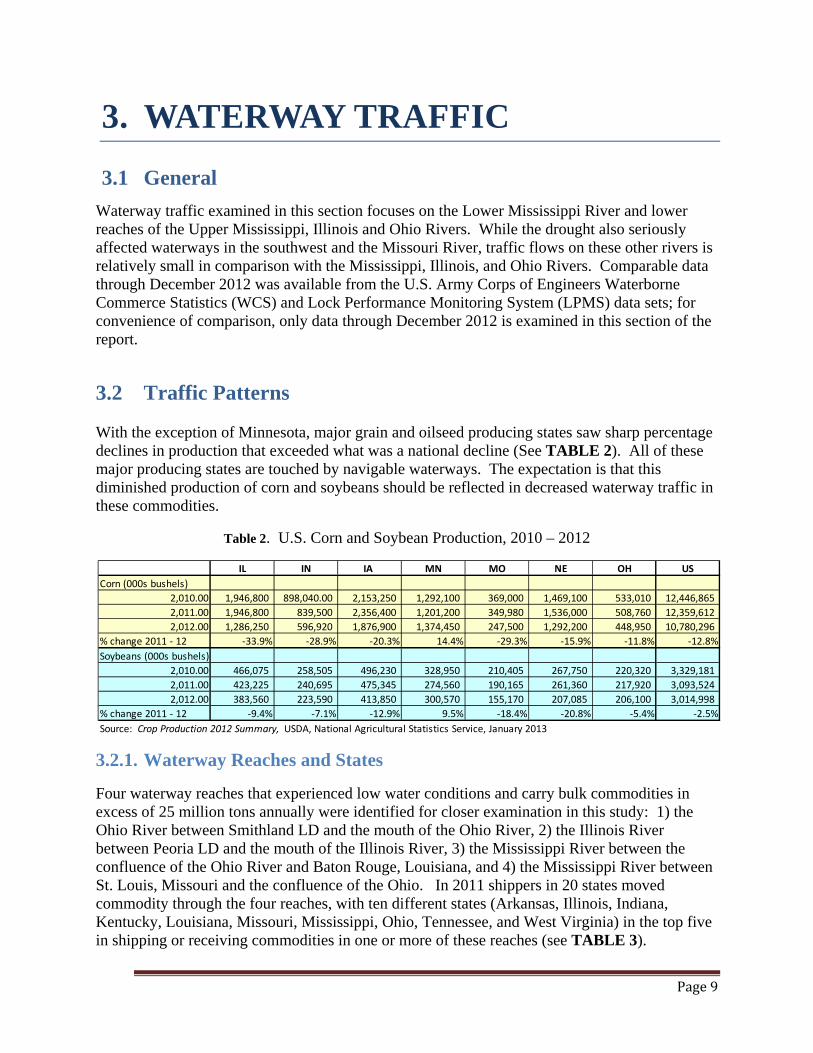
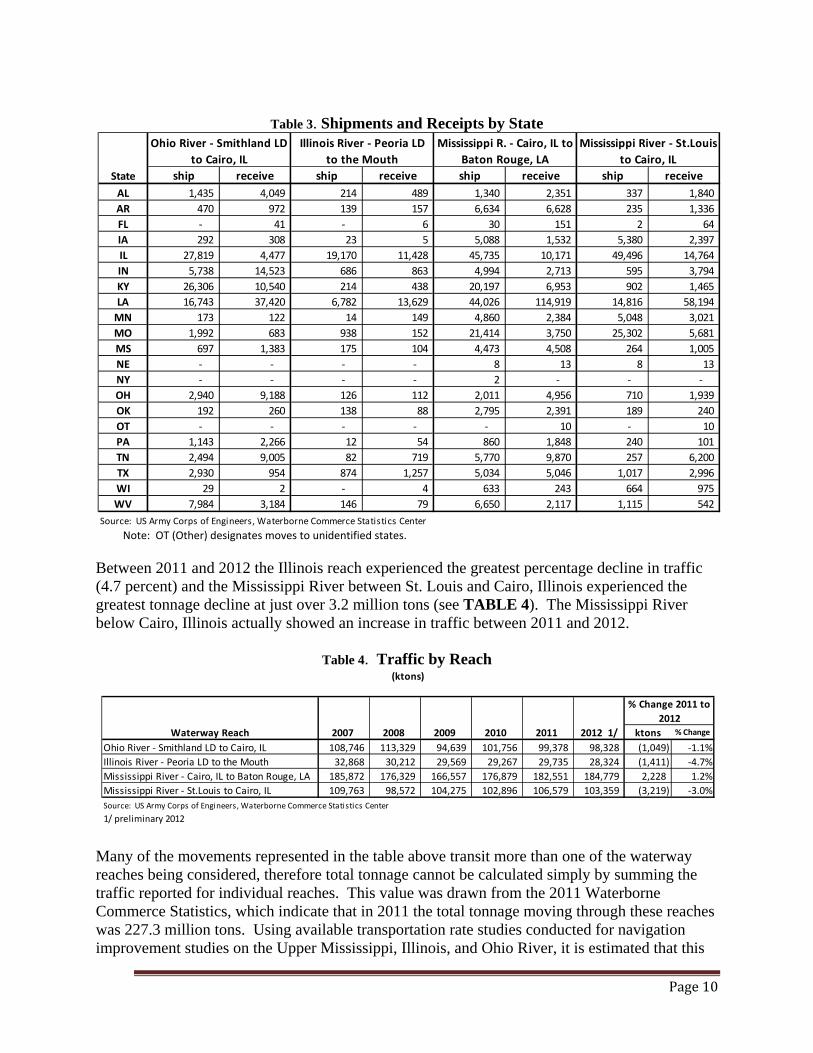
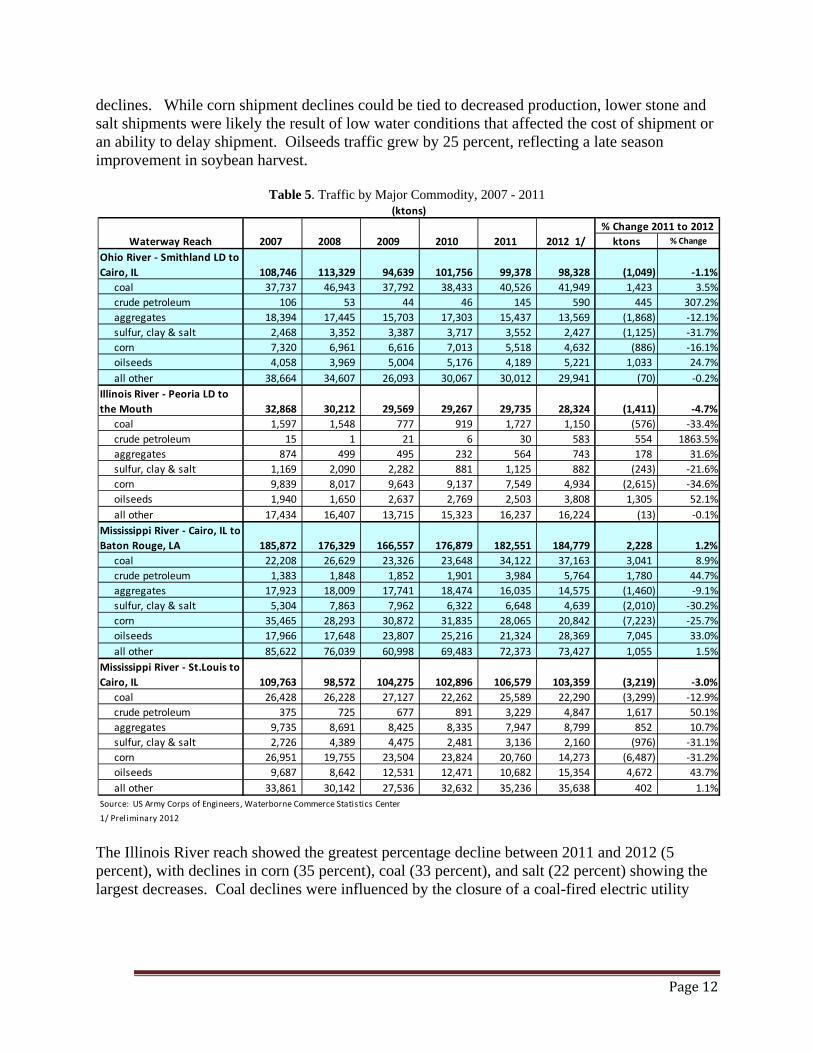
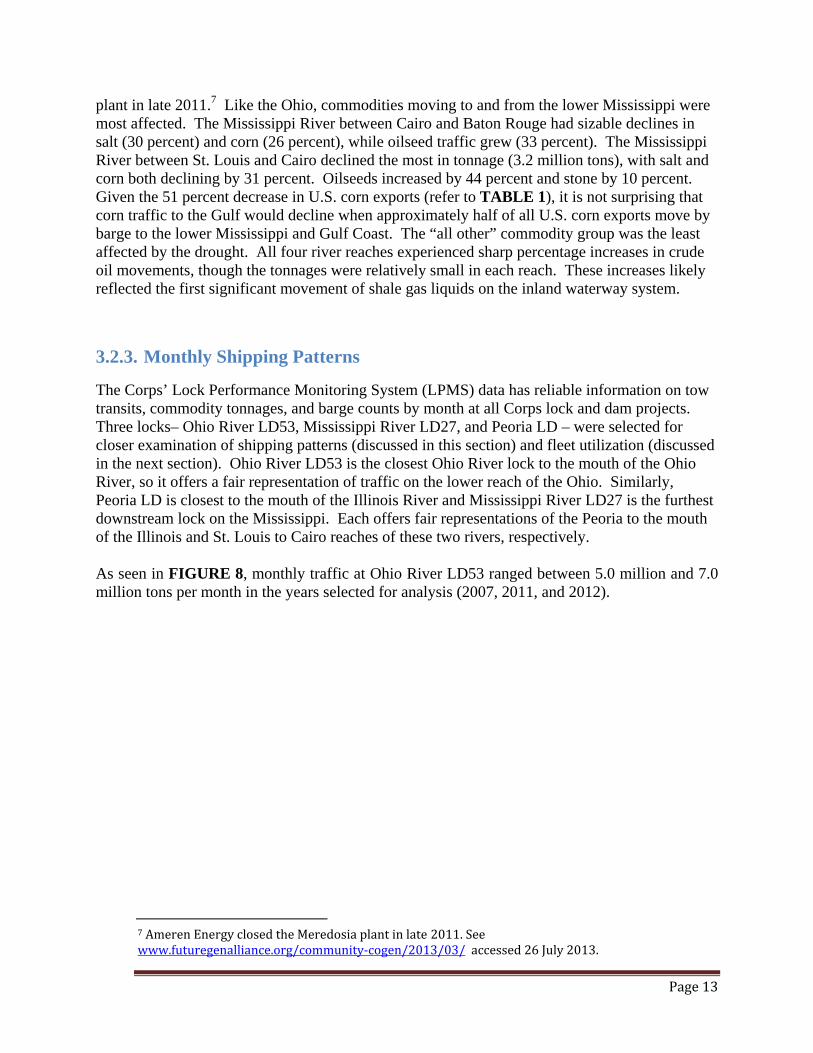
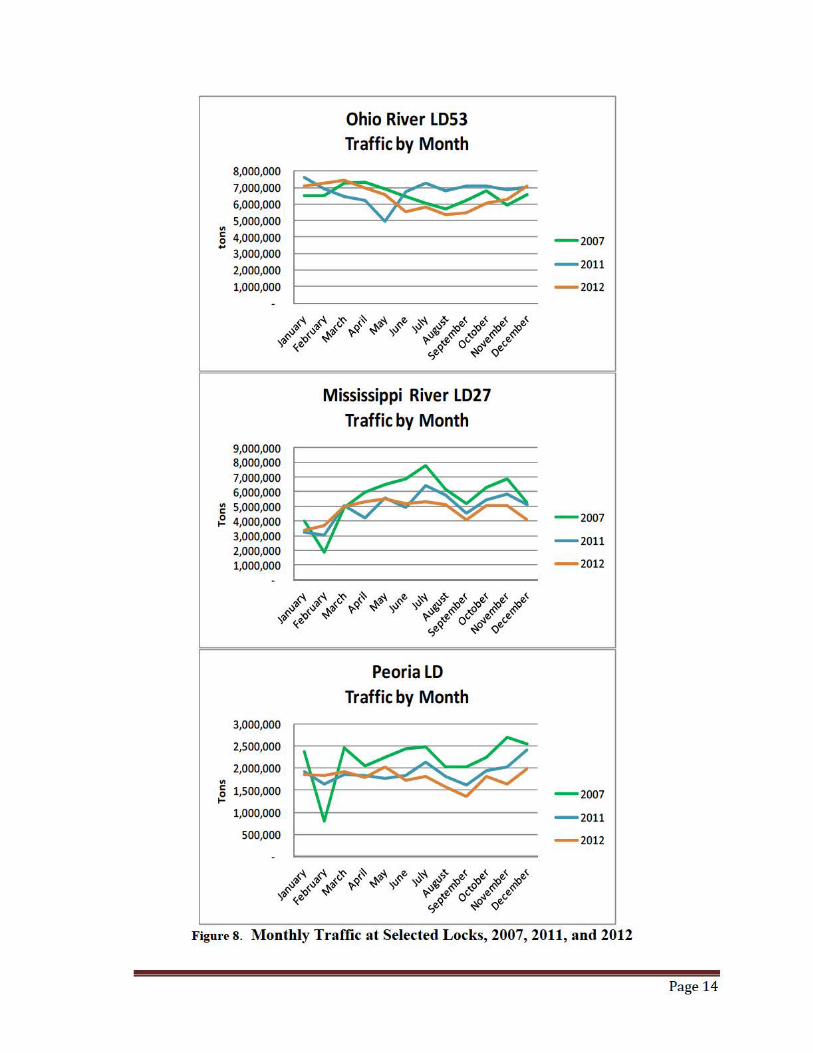
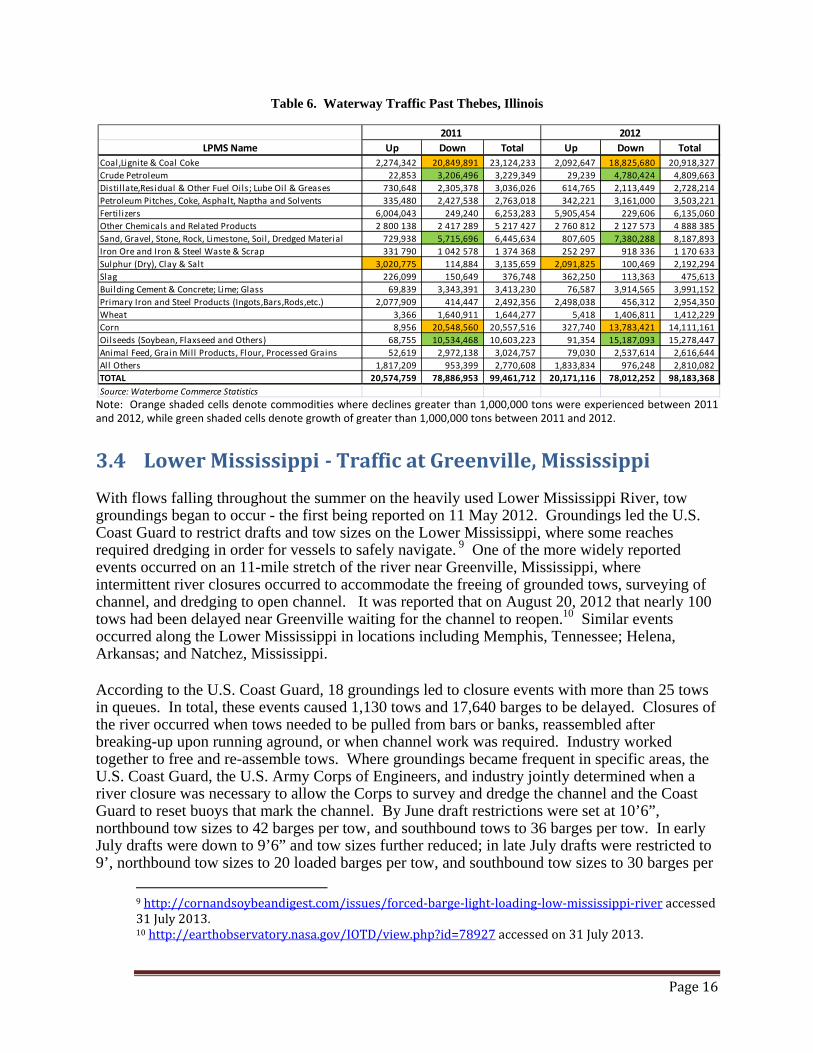
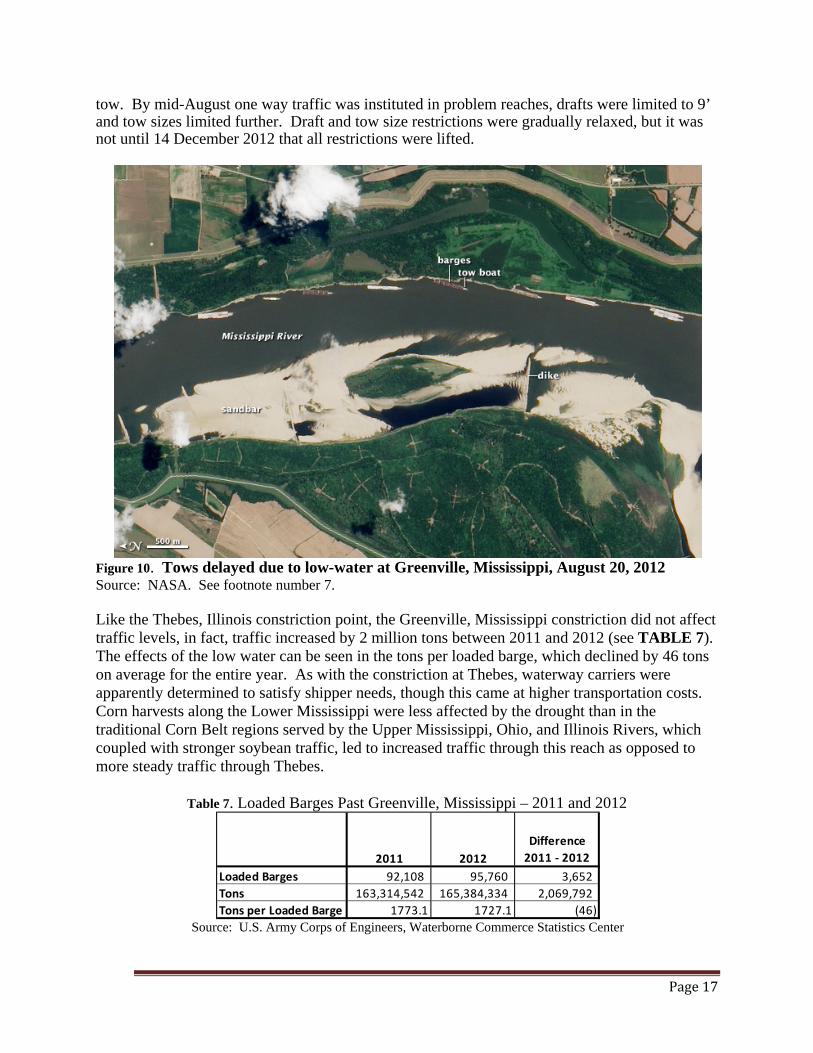
700
600
500
400
300
200
100
f- f-
f-f-r-
Ohio River LD53
Tow Counts 2011 amp 2012
r- f-I-- fshy f- f-
r- r- r- r-f- f- f- f-r- r- r- r-
f-f-
f-f-rshy
800
700
600
500
400
300
200
100
r-r-fshy1shy-shy
Mississippi River LD27 Tow Counts 2011 amp 2012
-shyt- t-r- r-r- r-f- fshy1shy 1shy-shy -shy
shyr-r-fshy1shy-shy
t-rshy1shy
fshy1shy-shy
-
400
350
300
250
200
150
100
so
1shy
f-f-tshy-shy
Peoria LD Tow Counts 2011 amp 2012
1shy 1shy r-shyf- f- f-f- f- f-t- t- tshy-shy -shy -shy
1shy
f-f-tshy-shy
Figure 11 Tow Counts at Selected Locks 2011 and 2012
35 Fleet Utilization
The C01ps Lock Perf01mance Monitoring System (LPMS) data was examined at the three gateway locks discussed above this time for evidence of altered vessel operation pattems As seen in FIGURE 11 the effect of the 2011 high water event on the lower Ohio River is reflected in lower tow counts in April and May of that year othetwise tow counts are fairly similar between 2011 and 2012 The droughts effect was more apparent at Mississippi River LD27 an d at Peoria LD where tow counts were down significantly between 2011 and 2012 dming the summer and fall months ---------------------------------------
Page 18
Barges per tow and composition of tows did not change dramatically at any of the three locks between 2011 and 2012 (see TABLE 8) The most significant change occurred at LD53 where barges per tow dropped from 117 per tow to 111 per tow while the percentage of empties increased by 3 percent Tow sizes at LD27 remained around 75 barges per tow and grew slightly from 64 to 67 barges per tow at Peoria LD Significantly fewer loaded barges were processed at each of the three locks
Table 8 Barges Tows and Barges per Tow Selected Locks Ba rge s TOTAL
Tow s Ba rges
pe r Tow Loaded Loaded Empty Empty Tota l LD 53
2007 48592 68 23187 32 71779 7039 102 2008 48009 68 22434 32 70443 6624 106 2009 40352 65 21706 35 62058 5489 113 2010 47030 67 23602 33 70632 5984 118 2011 47465 67 22863 33 70328 6021 117 2012 45064 64 25656 36 70720 6352 111
LD 27 2007 41019 67 20574 33 61593 7217 85 2008 35391 70 15343 30 50734 6456 79 2009 37259 64 20868 36 58127 6753 86 2010 35647 65 19299 35 54946 6792 81 2011 34799 68 16709 32 51508 6909 75 2012 34237 67 16904 33 51141 6713 76
Peoria 2007 15336 67 7519 33 22855 3264 70 2008 13526 69 5981 31 19507 3063 64 2009 13376 64 7677 36 21053 3028 70 2010 13452 65 7402 35 20854 3044 69 2011 13265 67 6621 33 19886 3087 64 2012 12702 67 6185 33 18887 2803 67
The effect on total tons of fewer loaded barges through these locks was heightened by lighter loadings measured in tons per barge (see FIGURE 12) which occurred in the late summer and fall of 2012 At LD27 loadings were down approximately 100 tons per barge in October November and December of 2012 when compared with the same months in 2011 and down approximately 75 tons per barge in October and November at Peoria LD
Page19
Ohio River LDS3 Aver age Barge Loadings
1850 ---------------------shy1800 +-------------------shy1750 -1-------=-------------shy1700
~ 1650 ~ 1600
1550 1500 1450 1400
1850 1800 1750 1700
~ 1650 ~ 1600
1550 1500 1450 1400
1850 1800 1750 1700
~ 1650 ~ 1600
1550 1500 1450 1400
Jan Feb Mar Apr May Jun Jul Aug 5ep Oct Nov Dec Ave
r r-r-r-rshyshy
Mississippi River LD27 Average Barge Loadings
r- r- r-r- r- r-r- r- r-r- r- r-r- r- rshyshy shy shy
r-
r- rshy shy
r- r- r-r- r- rshyshy shy -
Jan Feb Mar Apr May Jun Jul Aug 5ep Oct Nov Dec Ave
-shy
r-rshy-
Peori a LD Average Barge Loadings
r- r-r- r-
r- r- r-r- r- r-r- r- r-r- r- rshyshy shy shy
rshy - r-
r- r- r-r- rshy 1shy
r- r- r-r- rshy shyshy shy -
Jan Feb Mar Apr May Jun Jul Aug 5ep Oct Nov Dec Ave
Figure 12 Average Bar ge L oadings at Selected Locks 2011 amp 2012
The combination of fewer barges per tow and lighter loadings at LD27 and Peoria continued a trend at these two locks of fewer tons per tow (see FI GURE 13) A distinct pattem emerges at LD27 one that minors the pattem of grain shipments Significantly larger tons per tow occur during the peak grain shipping season These cyclical variations occur each year though the peaks an d valleys have smoothed with each passing year In 2012 the cyclical pattem is all but unnoticeable At LD53 the combination of smaller tows a greater percentage of empty barges
Page 20
LDS3 Tons per Tow by Month 2007 -2012
LD27 Tons per Tow by Months 2007 - 2012
Peoria LD Tons per Tow by Month 2007 -2012 10000
9000
8000
7000
6000
~ _ 5000
4000
3000
2000
1000
rJ A AA I IVV1 ~ AAV II1 v
1 y bull
Figure 13 Average Barge Loadings at Selected Locks 2007 - 2012
and somewhat lighter loadings caused tons per tow to drop steeply toward the end of2012 despite an increase ofover 300 tow transits that year
Page 21
36 Summary and Conclusions Traffic patterns were examined on the four high volume waterway segments affected by low water in 2012 With the exception of the Lower Mississippi from Cairo Illinois to Baton Rouge Louisiana each segment experienced lower traffic in 2012 than in 2011 Sharp declines in corn traffic undoubtedly related to a greatly diminished harvest explain most of the traffic decline though carriers continued to maintain volumes otherwise
When looking at monthly traffic levels reported in the LPMS data for the gateway locks to the Ohio Illinois and Upper Mississippi (Ohio River LD53 Peoria LD and LD 27) typical cyclical patterns of shipment are apparent in 2012 but at lower levels Vessel operators ran significantly fewer tows in the summer and fall moved fewer barges at LD27 and Peoria but more barges at OH53 ndash this increase being explained by the increased movement of empty barges Tows pushed fewer loaded barges that were more lightly loaded (100 tons per barge less than average at LD27) The end result was lower traffic at each of these three projects
Unfortunately there is no data equivalent to LPMS available at the constriction points on the Mississippi River at Thebes and Grand Tower Illinois that will describe how vessel operators configured their tows We do know that there were vessel draft restrictions that affected both loadings and the size of towboats as well as tow size restrictions According to the Waterborne Commerce Statistics waterway traffic at Thebes Illinois and Greenville Mississippi changed only slightly between 2011 and 2012 declining by 12 percent at Thebes and increasing by 12 percent at Greenville Average tons per barge declined at both locations for the year We also know from surveys and discussions with vessel operators (discussed in subsequent sections) that fleeting operations were initiated above and below the Middle Mississippi reach between Thebes and Grand Tower Illinois in order to optimize the use of a limited number of smaller towboats required through this reach while still utilizing the larger towboats that typically move through this area
Page22
4 LD27 CLOSURE ANALYSIS
41 General
Mississippi River Locks and Dam 27 (LD27) is located on the Upper Mississippi River at mile 1845 near Granite City Illinois and just above St Louis Missouri It is the 4th busiest lock in terms of tonnage processing 250 million tons of agricultural products 101 million tons of chemicals and 101 million tons of petroleum products in 2012 Three closures of special note occurred at this project in 2012 The first was a main chamber closure which occurred in January of 2012 The second was an emergency closure of both chambers caused by an accident related to low water conditions at the lock The third outage was a planned closure of the main chamber to remove the guide cell damaged during the September accident
The US Army Corps of Engineers Lock Performance Monitoring System (LPMS) collects traffic and processing data from each of its lock projects LPMS data for LD27 was analyzed in order to estimate the cost impact on waterway carriers of all three closures the latter two being directly related to the low-water experienced in 2012 The January 2012 closure analysis offers some perspective when evaluating the economic impact on carriers of the five day outage of the project that was related to low water Section 42 examines the first two closures and Section 43 the third closure that began in 2012 and ended in 2013
42 January and September 2012 Outages
The January 2012 closure was a scheduled closure of the 1200rsquo x 110rsquo main chamber The outage began on 4 January 2012 at 0433 hours and ended when the chamber was reopened on 15 March 2012 at 0039 hours The closure allowed for an embedded metal repair to be completed The main chamber was closed for 1700 hours or approximately 70 days and 20 hours The second closure occurred on 15 September 2012 at 0232 hours when a guide cell was ruptured by a tow allision The resulting gravel spill from within the cell and damage to the guide cell prohibited safe passage through the main chamber A little over 15 hours later at 1527 hours the auxiliary chamber closed resulting in a total river closure Both the main and auxiliary chambers were reopened 20 September 2012 at 0330 hours therefore for 5 days and 3 hours the Mississippi River was completely closed to waterway traffic at LD27
421 Tow Arrivals
FIGURE 14 shows the arrivals per day at LD27 for the months of January ndash September 2012 Average tow arrivals per day for the period outside the closures 15 March through 15 September 2012 was 190 tows per day Average arrivals per day for the first closure period 4 January through 15 March 2012 decreased from the 190 tows per day outside the closure period to 152 tows per day Average arrivals per day for the second closure period 15 September through 20 September 2012 were 116 tows per day versus the 190 tows per day outside the closure period
Page23
Lock 27 Upper Mississippi River Main and Auxil iary Tow Arrivals 2012 Chamber
35 ---------------------------------------------------------~~ Main Chamber Closed
15
10
0 ~--------------~----------------------------------------~~ J an Feb Mar Apr May Jun Jul Aug
5 ++---------------+----------------------------------------~~
Figure 14 LD27 Tow Arrivals 2012
422 Tow Processing Time
During the first closure of the 1200 main chamber that occmTed from Janumy through March 1089 tows umiddotansited LD27s auxilimy chamber The average processing time increased from 48 minutes for all tows outside the Janumy through Mmmiddotch 2012 closure to 78 minutes during the closure
At the beginning of the second main chamber closure from 0020 through 1527 on 15 September 2012 only two tows umiddotansited LD27 auxilimy chamber The average processing time increased from 48 minutes for all tows outside the September closure to 209 minutes during the closure
The 2012 closures increased the processing time 30 minutes per tow The 1091 tows that umiddotansited the auxilimy chamber during the main chamber closures caused an additional549 hours of tow umiddotansit time
423 Tow Delays
FIGURE 15 shows delays at LD27 for the period from Janumy- September 2012 Delays stmied building soon after the 1200 chamber closed and continued until17 Mmmiddotch 2012 at 0110 hours This means that the 1700 hour closure impacted traffic for 1749 hours The 49 hour difference represents the time required for the reopened chamber to serve th e tows in queue and bring the delay back to zero During the impact period 16366 hours of tow delay were experienced by 1148 tows This results in an average delay of 143 hourstow for the first closure in year 2012 from Janumy through March By compmmiddotison 4054 tows were served at
Page 24
LD27 outside the Januruy - Mrumiddotch and September 2012 closure periods The average nonnal delay per tow was 183 minutes or approximately 31 hours Given that the average additional delay per tow was 112 hours for the Januaty - Mrumiddotch closure and that 1 148 tows were impacted the closure caused 12866 hours of additional delay
With the September 2012 closure delays strut ed building soon after the 1200 and 600 chamber closed and continued until 25 September 2012 at 1135 hours This means that the 123 hour river closure impacted traffic for 251 hours The 128 hour difference represents the time required for the reopened chambers to serve the tows in queue and bring the delay back to zero During the impact period 6498 hours of tow delay were experienced by 141 tows This resulted in an average delay of46 hourstow Given that the average nonnal delay per tow was 31 hours the average additional delay per tow was 43 hours for the September closure and that 141 tows were impacted the closure caused 6068 hours of additional delay
A total of 1288 tows were impacted in 2012 which caused an additional delay of 18934 hours Therefore on average each tow experienced 147 hours more delay during the closure than n01mal The maximum delay was 127 hours
Lock 27 Upper Mississippi River Average Hou r ly Tow Delays - Year 2012 Main and
Auxili ary Chamber
120 - Main Chamber Closed
100 80
60
40
1 tJi20
A amp A AIt amp ~~ A middot AIAA 10 ~~~m~~~~m~~~~M~~~~M~~~~M~~~~M~~~~M~~~~M~~~~M~~~~M~~~~M~~~~M~~~~M~~~~M middotmiddot middotshy~~NNNMMVV~~~~~~~~~~~~~OOO~~NNNMMVVV~~~~~~~~~~~~OOO~~NNNMMVVV~~~~~~
~~~ bull -l-l-t-t-41ii~-l-l-t-t-lt-1 -t-t-t-t-t -l~ -t-tNNNlNiNNNN1~NNNNNNN
Jan Feb Mar Apr May Jun Jul Aug Sept
Figure 15 LD27 Average Hourly Delays 2012
424 Cost Impact
The analysis above shows that the Januruy through Mrumiddotch 2012 closure caused an additional 543 hours ofprocessing time and 12866 hours of delay Given this additional transit time and average hourly operating costs for tows at LD27 the Januruy through March closure cost caniers an additional $87 million to process through the lock The September closure caused an additional 5 hours ofprocessing time and 6068 hours of delay for a total closure cost of approximately $39 million While the 70 day closure of the main chamber resulted in additional
Page 25
costs of$124000 per day the much sholier 6 day closure (with 5 days oftotal river closure) cost industry a much higher $550000 per day in delay time
43 December 2012 through March 2013 Main Chamber Closure
The third an d fmal closure at LD27 occmTed between 10 December 2012 and 2 March 2013 when th e C01ps removed the guide cell damaged in September 2012 Removal of the guide cell necessitated closure of the main chamber (and some brief closures of the auxiliruy chamber) The main chamber was closed for 1968 hours or approximately 82 days
431 Tow Arrivals
FIGURE 16 shows the anivals per day at LD27 for the months ofNovember 2012 - April2013 Average tow ruTivals per day for the period outside the closures from 1 Jlme 2012 through 31 May 2013 were 183 tows per day Average ruTivals per day for the closure period 10 December 2012 through 2 March 2013 decreased to 127 tows per day
Lock 27 Upper Mississippi River Tow Arrivals Dec 2012 - Mar 2013
35
30 Main Chamber Closed
25 uj20 amp -uA I ~
I~ ~~ I A ~ I15 ~~ n ~~
~~~ - ~1J vr 1 A10 I
5
0
~
~~~O~~~N~~~~~O~~~N~~~M~~N~~~~~ON~~~~~Om~~~~Om~~N~~~m~~N~~~~~ ~~~~NNN ~~~NNNm NNNm NNN NNNm NNN
Nov Dec Jan Feb Mar Apr
Figure 16 L D27 Tow Arrivals December 2012 - March 2013
432 Tow Processing Time
During the closure of the 1200 chamber 35 of the tows through LD27 had to double cut - the tow fl otilla had to be broken into two pruis an d each prui of the fl otilla locked through separately This increased the average processing time fr om 51 minutes for all tows outside the December 2012 through March 2013 closure to 88 minutes during the closures During the closures 1032 tows tImiddotansited LD27 Given an increase in time of 37 minutes per tow an d 1032 tows an additional 643 hours of tow processing time was experienced during the closure
Page 26
433 Tow Delays
FIGURE 17 shows delays at LD27 for the December 2012 through March 2013 closm e period Delays statted building soon after the 1200 chambers closed on 10 December 2012 at 1530 homs and continued until 4 March 2013 at 0008 hom s This means th at th e 1968 hom closme impacted traffic for 2001 hom s The 33 hom difference represents th e time requir ed for th e reopened chamber to serve th e tows in queue an d bring the delay back to zero Dming the impact period 23058 hom s oftow delay were experienced by 1076 tows (total delay in all of 2011 was 9349 homs) This 23058 homs works out to an average delay of214 homstow for th e closm e period By comparison 5246 tows were served at LD27 outside the closm e period from 1 June 2012 through 31 May 2013 The average non nal delay per tow was 27 1 minutes or approximately 45 hom s Given that the average additional delay per tow was 17 hom s for th e December 2012 - March 2013 closme an d that 1076 tows were impacted the closme caused 18195 homs of additional delay The maximum delay experienced by a tow dming this closme was 805 homs
Minimum Average amp Maximum Tow Delays Lock 27 Upper Miss River
Dec 2012 middotMar 3
90
80
70 -f 60 ~ ~ 50 0 1shy 40 Q) Q
gt- 30 ca Q) 20 0
10
De Jan
Mar bull Minimum bull Average Maximum Apr
Figure 17 LD27 M inimum Maximum and Average Tow Delays December 2012- March 2013
444 Cost Impact
The most recent infon nation available indicates that the average tow transit costs at LD27 are about $648 per hom Given the analysis above which shows that this scheduled closm e caused an additional 643 hom s ofprocessing time and 18195 hom of delay the estimated additional transit time dming the closm e cost a total of $ 122 million
Page 27
Page28
5 SHIPPER RESPONSE
51 Survey Procedures
An OMB-approved Shipper Survey (Control 0710-0001) was used to capture and evaluate shipper reactions to the drought and the emergency closure of LD27 in September (see Appendix A) Shippers were defined as companies that receive commodity traffic transiting through multiple reaches on the Mississippi River The formal shipper survey was conducted between 7 March and 30 May 2013 The purposes of the survey were to find out what measures were taken by industry to mitigate the effects of the drought-related low water and emergency closure at LD27 and to estimate the total costs to industry that resulted from the events
At the outset of the process several steps were adopted for including firms in the survey First a list was compiled that showed the parent companies that operate at docks in the four affected waterways ndash the lower Ohio lower Illinois Middle Mississippi and Lower Mississippi Rivers ndash and that ship through LD27 The parent companyowner of each receiving dock was identified using information available to the Corps and grouped by parent company This allowed an estimate of tonnage by parent companyowner to be formulated Parent companies were then ranked in descending order by their total tonnage received For LD27 and each affected waterway the top 25 ranked by companies by tons shipped were selected to be surveyed Duplicate shippers (shippers that had a top 25 ranking in more than one reach) were included as one survey and the next largest company was added to obtain the top 25 unique companies to survey in the study area In all 125 shippers were sent surveys
Waterborne Commerce Statistics Center (WCSC) data for 2011 was used in assembling basic shipper information All of the contact information for the top ranking companies was determined by comparing several contact lists In the absence of any contact information the Internet was used as a search tool to verify correct contact information for these parent companies The 125 shippers were sent a mail survey followed by a telephone follow-up if the parent company or carrier sent no response after two weeks Stakeholders like the American Corn Growers Association the River Industry Action Council (RIAC) and the Waterways Council Incorporated (WCI) assisted by encouraging firms to respond by sending emails to all members late in the survey to encourage participation
According to survey respondents low water presented the greatest challenge to users of the Lower Mississippi from Cairo Illinois to Baton Rouge and the Middle Mississippi River between St Louis and Cairo Traffic on these two reaches totaled 2024 million tons in 2011
Page29
52 Summary of Shipper Responses
Responses to the survey were received from 73 companies representing a response rate of 59 percent and accounting for 42 percent of total 2011 traffic transiting the affected waterways Questions 1a and 1b were used to help determine if the shipper had any impacts from either the emergency lock closure event at LD27 or from the low water conditions Questions 2 and further into the survey were designed to be answered by shippers who had responded that they were impacted by either or both of these events From question 2 onwards the subset of respondents is less than the total that returned surveys because some shippers indicated that they were not impacted by either event in question An overwhelming percentage of respondents to the shipper survey said they were unaffected by the LD27 closure while half of the respondents indicated they experienced significant effects on operations due to low water In an effort to meet their needs shippers sought other sources for product sought other waterway routes and used overland transportation routes at a cost to responding shippers of $56 million The effect of the drought on agricultural production combined with increased transportation costs resulted in temporary plant closures and lost sales that the responding shippers estimated at $79 million
Page30
6 CARRIER RESPONSE
61 Survey Procedures
The Carrier Survey targeted the major towing companies that used the waterways affected by low water in 2012 (the lower Ohio the lower Illinois the Middle Mississippi and the Lower Mississippi Rivers) Appendix B contains the Carrier survey form The purpose of this survey was to identify carrier responses to the 2012 low water event and the LD27 closure Like the shipper survey the formal carrier survey was conducted between 1 March and 30 May 2013 The purpose of the surveys was to determine what measures were taken specifically by the carriers to adapt to the emergency closure at LD27 and drought conditions and what these measures cost
The firms included in the carrier survey were the 10 largest users of the affected waterways (in tonnage) for the years 2006 through 2010 Responses were received from six companies representing 46 percent of carrier traffic on these waterways According to survey respondents low water presented the greatest challenge to users of the Lower Mississippi from Cairo Illinois to Baton Rouge Louisiana and the Middle Mississippi River between St Louis Missouri and Cairo Traffic on these two reaches totaled 2024 million tons in 2011 Survey respondents accounted for 58 of the tonnage in these two reaches
62 Summary of Carrier Canvas Responses
Once the initial set of shippers and carriers for canvassing was established contacts were identified for each company This information was taken from publicly available sources and in some instances through the assistance of industry associations such as the American Corn Growers Association the River Industry Action Council (RIAC) and the Waterways Council Incorporated (WCI) These organizations were also of assistance in encouraging firms to respond by emailing members late in the survey process to encourage participation
Responses were received from six carriers (60) representing 59 percent of total traffic on the affected waterways All but one of the carriers responding indicated that they were affected by both low water and the LD27 closure with the low water being the more serious challenge Moving cargo during this period required carriers to advance or delay shipments light load vessels (necessitating additional trips) reposition barges throughout the system to accommodate the need for additional barges restrict tow sizes (also necessitating more trips) and perform additional refleeting These altered carrier operations cost responding carriers an estimated $807 million Carriers also experienced $167 million in additional costs due to the LD27 closure and delays and tug costs of $02 million due to tow grounding
Page31
Page32
7 FEDERAL RESPONSE
Federal stewards of the inland waterways were aided by past experiences like the 1988 drought and the low-water event on the Lower Mississippi River in 1997 and advancements in the data provided by the National Oceanographic and Atmospheric Administrationrsquos (NOAA) as well as hydrologic tools used by the Corps to forecast water levels These advancements improved the ability of the Corps and the Tennessee Valley Authority in controlling available water in efforts to keep navigation open on the lower Ohio and on the Mississippi Rivers The US Coast Guard took the lead in creating communication avenues between all stakeholders in managing vessel operation and reaching consensus on channel and vessel operational maintenance during the event According to representatives of the Coast Guard no additional expenditures of funds accompanied their extraordinary efforts
On the Ohio River the Corps of Engineers essentially borrowed resources from other locations to be repaid at some future date No emergency funding was made available Channel surveys were conducted more frequently on known trouble spots sometimes twice weekly The Louisville District estimated that dredging costs were approximately $21 million higher than in a typical year (see TABLE 9) The funds were drawn away from other projects in effect with the promise of repayment in a future year to accomplish work that could not be done as a result of moving funds to the lower Ohio
Table 9 Costs Incurred by the Corps
($millions)
District Added Cost Vicksburg $ 729 StLouis
dredging blasting LD27 1
subtotal
$ $ $
1190 970 097
$ 2257 Louisville $ 207 TOTAL $ 3193
1 Costs to bring LD27 into immediate s ervic e Inc ludes cos t of spud barge temporary helperboat assists and gravel cleanup
Source US Army Corps of Engineers Vicksburg St Louis and Louisville Districts
On the Mississippi River emergency funds were made available by Congress in 2011 in response to the flooding that year and any possible future emergencies The rock pinnacles at Thebes and Grand Tower Illinois were blasted and debris removed at an estimated cost of $97 million At LD27 the spilled gravel from the damaged cell and the cell itself were removed and
Page33
temporary safe passage accommodated at an estimated cost of $10 million11 St Louis District dredging was concentrated on the Middle Mississippi as the Lower Illinois was not severely affected Dredging completed by the Vicksburg District on the main stem Mississippi cost $73 million more than average dredging costs over the last several years
11 The Corps estimates it will cost another $35 million to replace the damaged cell This was not includedin thefederal cost
Page34
8 FINDINGS
Traffic patterns were examined on the four high volume waterway segments affected by low water in 2012 With the exception of the Lower Mississippi from Cairo Illinois to Baton Rouge Louisiana each segment experienced lower traffic in 2012 than in 2011 Sharp declines in corn traffic related to a greatly diminished harvest explain most of the traffic decline though carriers continued to maintain volumes of all other commodities otherwise
When looking at monthly traffic levels reported in the LPMS data for the gateway locks to the Ohio Illinois and Upper Mississippi (LD53 Peoria LD and LD 27) typical cyclical patterns of shipment are apparent in 2012 but at lower levels Vessel operators ran significantly fewer tows in the summer and fall moved fewer barges at LD27 and Peoria but more barges at OH53 ndash this increase is explained by the increased movement of empty barges Tows pushed fewer loaded barges that were more lightly loaded (100 tons per barge less than average at LD27) The end result was lower traffic at each of these three projects
Unfortunately there is no data equivalent to LPMS available at the constriction points on the Mississippi River at Thebes Illinois and Grand Tower Illinois that will describe how vessel operators configured tows by number of barges per tow We do know that there were vessel draft restrictions that affected both loadings and the size of towboats as well as tow size restrictions We also know from surveys and discussions with vessel operators (discussed in previous sections) that fleeting operations were initiated above and below these points in order to optimize the use of a limited number of smaller towboats required through this reach while still utilizing the larger towboats that typically move through this area
The Corps surveyed 125 shippers and ten carriers The 73 shippers that responded represent 42 percent of all shipper traffic transiting the affected waterways Half of the respondents to the shipper survey indicated that they did not experience any significant effects on operations due to low water and an overwhelming percentage said they were unaffected by the LD27 closure Ten carriers were surveyed The six carriers responding represented 46 percent of all carrier traffic transiting the affected waterways All but one of the carriers responding indicated that they were affected by both low water and the LD27 closure with the low water being the more serious challenge The difference in shipper and carrier responses suggests that the shippers were somewhat insulated from these events by the strategic and tactical actions taken by the carriers that minimized impacts on the shippers
Despite lower corn production and a 51 decline in corn exports waterway traffic through the Middle Mississippirsquos rock pinnacles at Thebes Illinois constriction was largely unchanged between 2011 and 2012 (though it is important to remember that the worst low water conditions were experienced from December 2012 through February 2013) Moving cargo during this period required carriers to advance or delay shipments light load vessels (necessitating additional trips) reposition barges throughout the system to accommodate the need for additional barges restrict tow sizes (also necessitating more trips) and perform additional refleeting It cost responding carriers an estimated $807 million to alter operations in this fashion (see TABLE
Page35
10) The carriers also faced $167 million in additional costs as a result of the LD27 closures and delays and tug costs of $02 million due to tow groundings Despite these actions shippers did not escape the effects of the low water In an effort to meet their needs shippers sought other sources for product sought other waterway routes and used overland transportation routes at a cost to responding shippers of $559 million The effect of the drought on agricultural production combined with increased transportation costs resulted in temporary plant closures and lost sales that the responding shippers estimated at $790 million
Table 10 Survey Results - Low Water Cost Impacts
Cost Category Cost ($000) Transportation cost impacts
Carrier cost impacts Delays due to LD27 clos ure 16100 $ Other costs due to LD27 clos ure 573$ Groundings 164 $ Altered operations 80723 $
Shipper cost impacts 55860 $ SUBTOTAL 153419$
Production cost impacts 79000$ TOTAL 232419$
Page36
9 CONCLUSIONS
Several observations can be made from an examination of the traffic data obtained from LPMS and WCSC sources and responses generated from the surveys of the navigation industry The obvious message is that a system that is not operating at a level of reliability expected by users will have economic consequences Resulting increases in transportation costs andor delays to the transportation of commodities will have an effect on the marketplace Either the producer will pay more thus reducing expected profit associated with their products or the end user will experience higher commodity prices at the market once prices are adjusted
The low water the 5-day closure of LD27 in September 2012 and the subsequent 82 day closure of the main chamber between December 2012 and March 2013 imposed additional transportation costs of $1534 million just on the companies that responded to the Corpsrsquo surveys Drought andor low water accounted for another $790 million in production losses bringing the total reported impact to $2324 million Shipper survey respondents averaged $098 per ton in production losses and $080 per ton in increased transportation costs as they shifted to other modes and routes These values were applied to tonnage not accounted for through the sample or for which no response was given Carrier survey respondents provided a range of cost impacts $009 per ton for production loss $0005 per ton for non-delay related operations during the LD27 closure $0001 per ton related to grounding logistics and $069 in added transit costs Using these values a simple extrapolation of the sample to the population of movements using the most affected waterways (the Middle Mississippi and Lower Mississippi River) either not sampled or not responding suggests that additional transportation costs totaled $2770 million and production impacts amounted to $1652 million for a total impact of $4422 million12
Table 11 Low Water Cost Impacts from 2012 Event (Costs in $000)
Cost Category Survey
Responses
Estimate for Firms Not
Responding Not Surveyed TOTAL
Transportation cost impacts Carrier cost impacts
Delays due to LD27 closure 1 $ 16100 ‐$ $ 16100 Other costs due to LD27 closure $ 573 417 $ $ 990 Groundings $ 164 119 $ $ 283 Altered operations $ 80723 58719 $ $ 139442
Shipper cost impacts $ 55860 64277 $ $ 120137 SUBTOTAL $ 153419 123532 $ $ 276951
Production cost impacts 2 $ 79000 86248 $ $ 165248 TOTAL $ 232419 209780 $ $ 442199
1 I ncl udes del a y cos t experi enc ed due to LD27 ma i n cha mber cl os ure Dec 2012 ‐Ma r 2013 to remove dama ged cel l
2 I ncl udes ec onomi c impact of reduced corn producti on and hi gher tra ns porta ti on cos ts due to low‐wa ter
12 It is important to remember that not all waterways affected by the drought were covered by this survey
Page37
Using available transportation rate studies conducted for navigation improvement studies on the Upper Mississippi Illinois and Ohio River it is estimated that this tonnage moves at an average transportation rate savings of $2558 a ton Therefore at 2011 traffic levels total savings on these rivers would likely have been an estimated at $58 billion dollars The three most affected Corps of Engineers districts expended $319 million to keep the lower Ohio lower Illinois Middle Mississippi and Lower Mississippi river channels open to navigation in extreme drought conditions enabling shippers to continue navigation While industry faced losses of an estimated $2770 million due to increased transportation costs through the cooperative and coordinated efforts of the Corps the Coast Guard and industry partners shippers and the Nation were able to realize a savings in transportation costs of an estimated $55 billion despite this extreme low water event
Page38
APPENDIX A ndash SHIPPER QUESTIONNAIRE
PageA‐1
OMB Control 0710-0001 Expiration date 02282015
2012 DROUGHTLOCK 27 CLOSURE ndash SHIPPER SURVEY
Date
Firm
Address
Phone
FAX
Point of Contact
Title
General Description of Firm and Products Produced
NOTE ALL RESPONSES WILL BE TREATED AS CONFIDENTIAL
1 Was your company impacted by the closure event at Lock 27 in 2012 Yes No Was your company impacted by low water associated with the Drought Low water conditions in 2012 Yes No (If no interview is complete)
2 Does your company have a response plan for these types of impacts If so did it result in additional work organization to implement or was it detailed enough to cover all the impacts
1
PageA‐2
OMB Control 0710-0001 Expirat ion date 0228201 5
2012 DROUGHTLOCK 27 CLOSURE- SHIPPER SURVEY
LD27 closure
only Low
wate1middot Descriptio n of Response
a No change in procedmes b Stockpiled product and waited for traffic to clear if closme or changed loading depth in barges for low wat er c Switched to all-overland mode for product delivety from existing somces d Switched to different watervray routing for product delivety from existing somces e Switched product somce to an entirely new somce f Ceased operations dming the period g Altered production during the period h Switched production to another facility i Purchased intermediate or final product rather than produced j Other or combinations of the above (Please explain)
3 During th e 2012 event (either Low water or Lock 27 closure) what was your companys response Please indicate with an x in the appropriate box
4 Ifyou have checked c or d in question 3 please complete the following table
Movement Commodity Affected tonnage
Origin (City State)
Destination (City State)
Deliverd $ ton
plio1middot to drou2ht
Delivered $to n
during drou2ht
Examples
I Com 12000 Minneapolis New Orleans $30 $35
MN LA
2 Lube oils 4000 Houston TX Huntington wv $40 $50
2
PageA-3
OMB Contro l 0710-0001 Expiration date 02 282015
2012 DROUGHTLOCK 27 CLOSURE - SHIPPER SURVEY
5 Ifyou checked e in question 2 please complete the following table
Movement Commodity Affected tonnage
P reshydrou ght Origin
(City State)
Ch an ged Origin
(City State)
Destination (City State)
Deliver d $ton
pri01middot to drought
Delivered $ton
dming drought
Examples
1 Com 12000 Minneapolis MN
Cincinnati OH
New Orleans LA
$30 $35
2 Lube oils 4000 Houston TX Ashland KY
Pittsburgh PA $40 $50
6 Ifyou checked response a orb lmder question 3 how were your total production costs affected during the period of closure at Lock 27 or Drought-related low water (total increase in cost if applicable) Please explain
7 Ifyou checked response f under question 3 what was the total estimated loss to your fi1m as a result of ceasing production (during the closure period at Lock 27 or Drought)
3
Page A-4
OMB Control 0710-0001 Expiration date 02282015
2012 DROUGHTLOCK 27 CLOSURE ndash SHIPPER SURVEY
8 If you checked response ldquogrdquo under question 3 what was the total estimated loss to your firm as a result of altering production processes (during the closure period at Lock 27 or Drought)
9 If you checked response ldquohrdquo under question 3 what was the total increase in costs to your firm as a result of changing production locations (during the closure period at Lock 27 or Drought)
10 If you checked ldquoirdquo under question 3 to what extent did purchasing intermediate or final product increase your companyrsquos total costs (during the closure period at Lock 27 or Drought)
11 If you checked response ldquojrdquo under question 3 to what extent did the other measures or combination of measures undertaken as a result of the closure increase your companyrsquos total production costs (during the closure period at Lock 27 or Drought)
4
PageA‐5
OMB Control 0710-0001 Expiration date 02282015
2012 DROUGHTLOCK 27 CLOSURE ndash SHIPPER SURVEY
12 Have these events (drought-related low water or Lock 27 closure) caused your company to alter its long-term transportation strategy (eg switch to all-overland modes increase stockpiles etc) How will this impact your total commodity transportation or other costs (per year) Please explain
13 Has the (drought-related low water or Lock 27 closure) caused your company to take any other long-term permanent measures Please explain How will this affect your companyrsquos long-term operating costs (per year)
14 Has your company been impacted by other navigation system disruptions this shipping season (these would be other than the Low water from the drought or the Lock 27 closure)
5
PageA‐6
Event Date 2 Short-term response 3 Long-term responseExample
McAlpine closure
Jan ndash Feb 2006 Diverted to overland modes
none
OMB Control 0710-0001 Expiration date 02282015
2012 DROUGHTLOCK 27 CLOSURE ndash SHIPPER SURVEY
15 If your company has experienced significant navigation disruptions1 prior to this shipping season please complete the following table
1 Significant navigation system disruptions are defined as disruptions that result in delays to your shipment of more than 48 hours (include scheduled and unscheduled lock outages accidents and low and high water events)
2 Short term response refers to the response actions detailed in question 2 a No change in procedures b Stockpiled product and waited for traffic to clear or light loaded for low water c Switched to all-overland mode for product delivery from existing sources d Switched to different waterway routing for product delivery from existing sources e Switched product source to an entirely new source f Ceased operations during the period of closurelow water g Altered production during the period of closurelow water h Switched production to another facility i Purchased intermediate or final product rather than produced j Other or combinations of the above (Please explain)
3 Long term response refers to a modification of your long term business plan to include altering your long-term transportation strategy (eg switch to all-overland modes increase stockpiles etc) Other long term responses might include sourcing commodities at alternate sites or moving production activities to a different location
6
PageA‐7
PageA‐8
APPENDIX B ndash CARRIER QUESTIONNAIRE
[Typetext] PageB‐1
Waterway Carrier Interview Questions Effects of the 2012 Drought and LD27 Closure
Name of towing company -----------shyLocatio n -----------Name and title of Point of Co ntact ----------------shyPhone number ( )________ email _________
PART 1 LOW WATER DUE TO DROUGHT CONDITIO NS
1 Did your firm experience a reduction in tonnage carried on the Mississippi Ill ino is or Ohio waterways in 2012 Please verify data fo r 2010 and 2011 indicating your estimates for 2012 in table below
Operat o r Traffic Destined fo r Lower Mississippi Ports (2010 and 2011 from WCSC)
Origin 2010 2011 2012
Mississippi above St Louis Mississippi St Louis to Cairo Mississippi south of St Louis Ill inois River Ohio River
2 What facto rs led to changes in t raffic between 2011 and 2012 For example drought condit ions that affected agricultural production low water that affected your abi lit y to operate efficiently loss or gain of a contract(s) increased competit ion from rail or other factors - please specify and ind icate re lative weight of each
3 Have you had to change the way you operate your vessel fleet due to the drought If so what changes did you make and when did these occur
1
[Type text] Page B-2
4 The t wo ta bles below are intended to describe how your operat ions are affected by water depth a nd flows on the Cairo - St Louis reach of the Mississippi Rive r
a Do the operat ionalchanges suggested in t he tables below for the Cairo - St Louis reach (Upper Reach) describe the way you would operate given t he gage readings and flow shown for these two reaches in t he t ables If yes please indicate in the appropriate box in the table below with a Y if no please indicate what restrict ions you impose on your operations given t he gage and flow readings provided
Upper Rea ch- Navigation Restriction
St Louis Gage Reading
Flow (CFSOOO)
Navigation Restriction
Carriers Nav Restriction Followed
Above 20 Above 90 No restriction 00 to 20 74 to 90 25 barges -25 to 00 55 to 74 20 barges -35 to -25 485 to 55 16 barges -40 to -35 46 to 485 85 ft draft -45 to shy 4 0 44to47 80 ft draft Below -45 Below 44 Navigat ion halts
b What is t he number of tows- by size of tow horsepower and draft - that you operate through the St Louis to Cairo reach of the Mississippi For each foot of draft t hat is lost what is your added cost per t rip Please use the table below in making your response
Upper Reach- Tows moved thru the St Louis- Cairo reach in 2011 (or year not affect ed by low water)
Tow size Towboat Horseshypower
Barge Draft
Cost ton of loading below desired barge draft
Barges tow
No of tows 05 10 15 20 25 30 35 4 0
1 - 8 9 - 15
16 - 19 17 - 20 21- 25
gt25
2
[Type text] Page B-3
5 The t wo tables below are intended to describe how your operat ions are affect ed by water depth a nd flows on the Mississippi River sout h of Cairo
a Do the operat ional changes suggested in t he tables below for the Lower Reac h of the Mississippi River sout h of Cairo describe the way you would operate given the gage readings and flow shown for these two reaches in the tables If yes please indicate in t he appropriate box in t he table below with a Y if no please indicate what rest rictions you impose o n your operations given the gage and flow readings provided
Lower Reach- Navigation Restriction
Cairo Gage Reading
Flow (CFS in OOOs)
Navigation Restrictions
Carriers Nav Restriction Followed
Above 118 Above 189 No restriction 60 to 118 111 to 189 25 barges per tow
50 to 60 95 to 111 85 ft draft and 20 barges
35 TO 50 805 to 95 8 ft draft and 12 barges
Below 35 Below 805 Navigation halts
b What is t he number of tows- by size of tow horsepower and draft - that you operate on the Lower Reach of t he Mississippi south of Cairo For each foot of draft t hat is lost what is your added cost per trip Please use t he table below in making your response
Lower Reach- Tows moved through the reach south of St Louis in 2011 (or a yea r not affected by low water)
Tow size Towboat Barge Cost ton of loading below desired barge draft
Barges tow
No of tows
Horseshypower
Draft 05 10 15 20 25 30 35 4 0
1 - 12 13 - 16
17 - 20 21- 25 gt25
6 If you light load due t o low water would you proceed entire t rip as originally light loaded or top off
below Cairo or maybe add additional barges to w here the normal t ons per horsepowe r ratio is
achieved If latter how would this be done and at what cost
3
[Type text] Page B-4
7 Did any of your tows experience a grounding If yes how many total occurrences did you experience and what was the impact on your firm Please indicate your response below
total groundings
events with tows delayed more than 8 hours cost of delays
events involving lightering cargo cost of lightering
events involving towboat assists cost of towboat assists
8 What was major impact of low water due to the drought in terms of effect on your operations ‐
increased operating cost Lost business Equipment damage Safety concerns Groundings
Efficient dispatch of fleet Others
9 Please indicate the economic impact of low water levels on your company in the table below (please
include figures from your response to 5 above)
Indicate Cost with an ldquoXrdquo
if this applies to your firm
Description of impact Costton Tons
Affected Total cost
Increased transit time (including delays) Increased cost due to restricted tow sizes Increased costs due to light loading Idle vesselslost revenue Damaged equipment Increased managementlogistics costs Other (please specify)
4
[Typetext] PageB‐5
PART 2 CLOSURE OF LD27
10 If you have tows already at the lock do you generally wait until it reopens
11 What is typical amount of time you will wait at a lock for it to reopen before you decide to do
something else What do you do if you decide not to wait any longer What factors affect this
decision If you re‐dispatch the tow what does this cost
12 If you have tows underway in the system and a closure occurs at a lock to be transited do you
continue to the closure point wait elsewhere or re‐dispatch the tow What factors affect this decision
13 Please indicate the economic impact of the closure of LD27 on your company in the table below
Indicate Cost with an ldquoXrdquo
if this applies to your firm
Description of impact Costton Tons
Affected Total cost
Delay costs at the lock Delays in place (dock or port) Idle vesselslost revenue Increased managementlogistics costs costs (including re‐dispatching) Other (please specify)
PART 3 FINAL COMMENTS
14 Do you have any other information that would help us describe and quantify the economic impact on
waterway carriers associated with low water due to the drought of 2012 andor the closure of LD27
5
[Typetext] PageB‐6
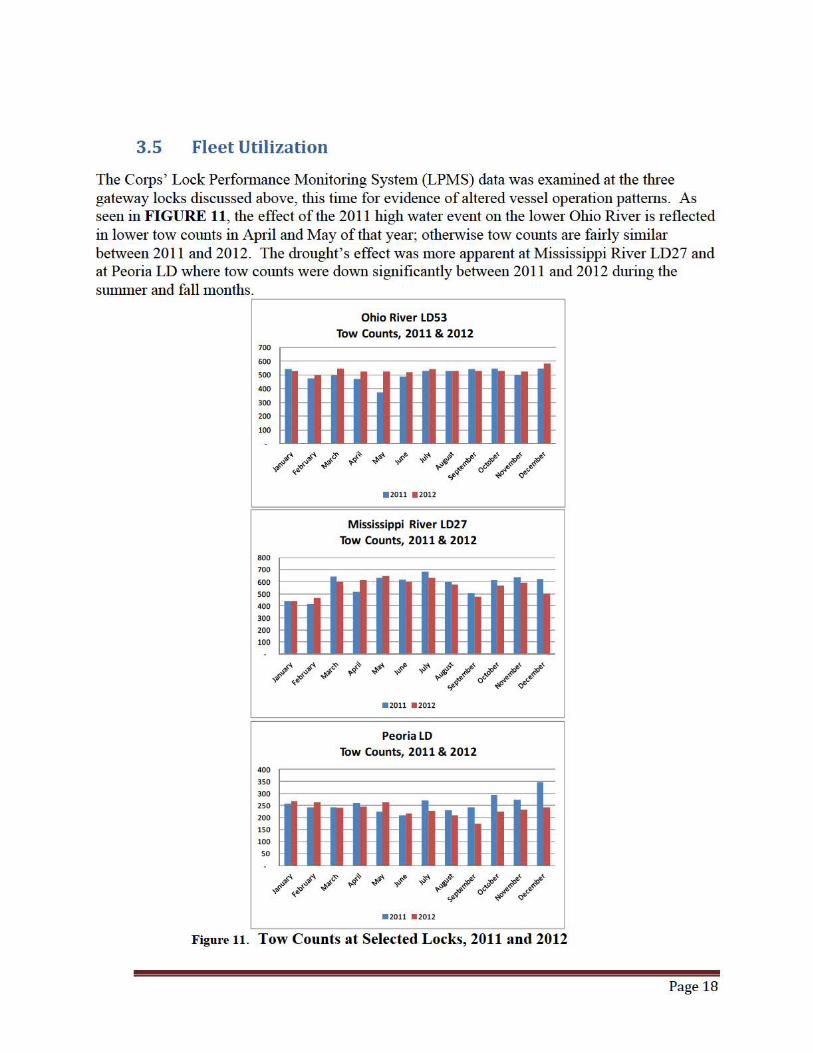
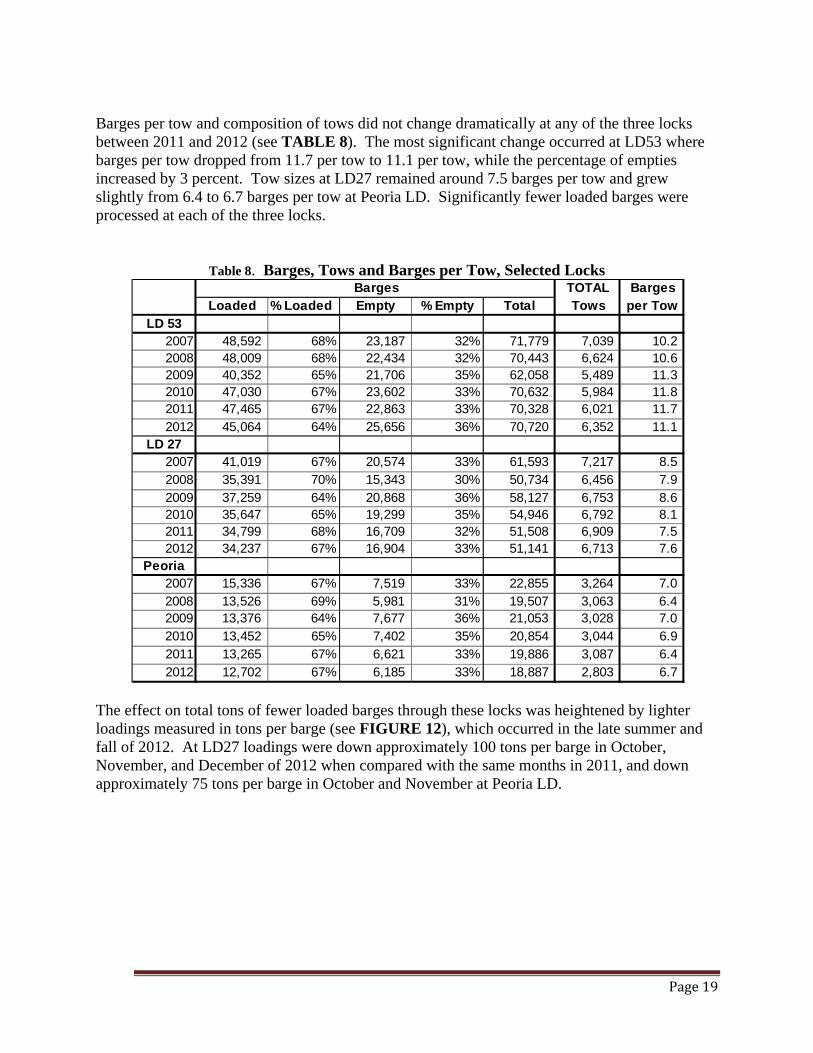
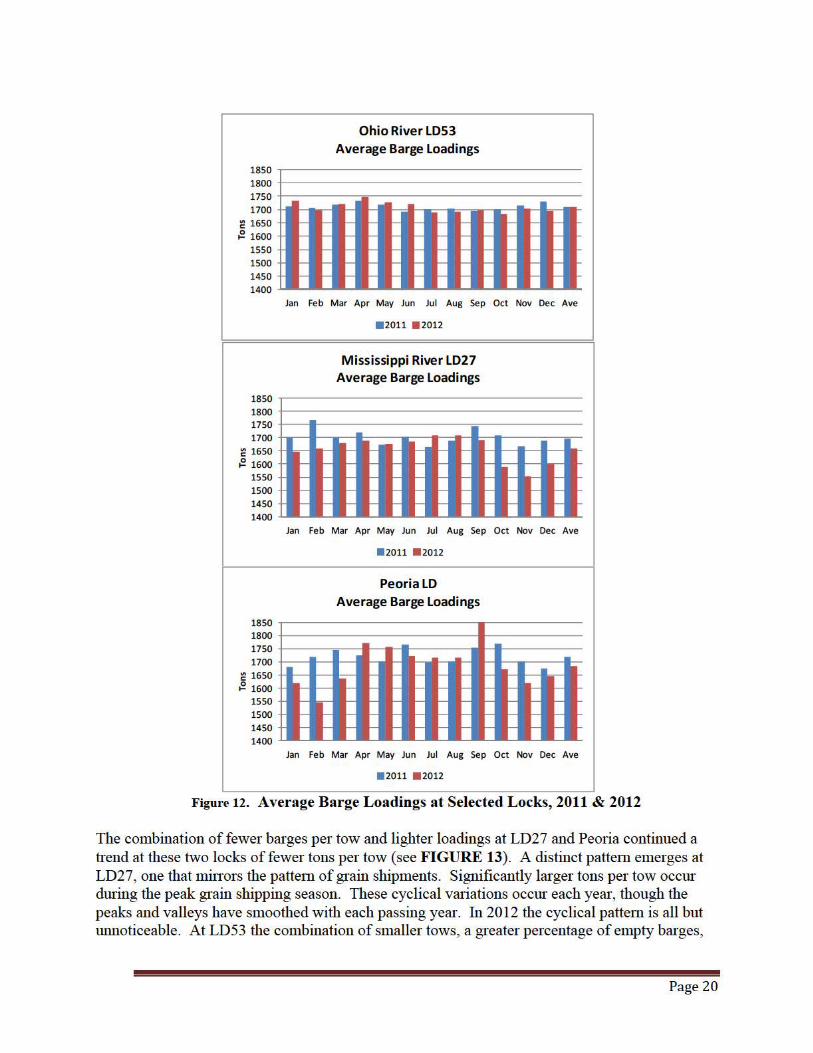
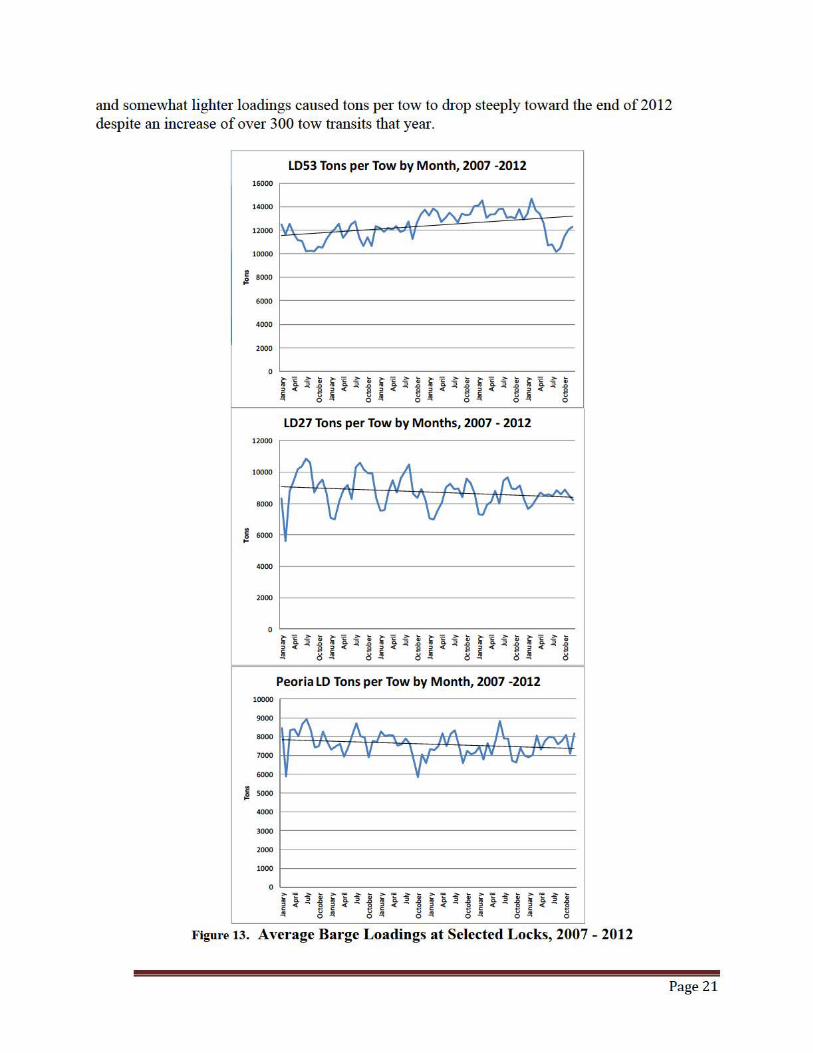
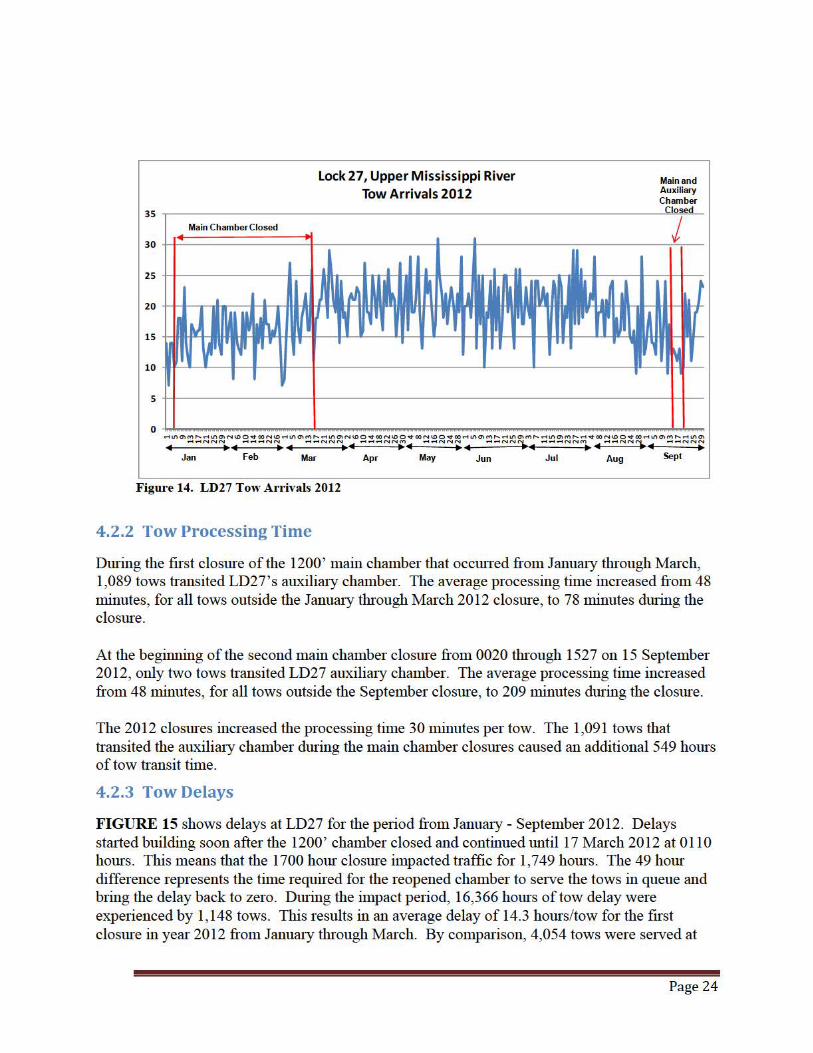
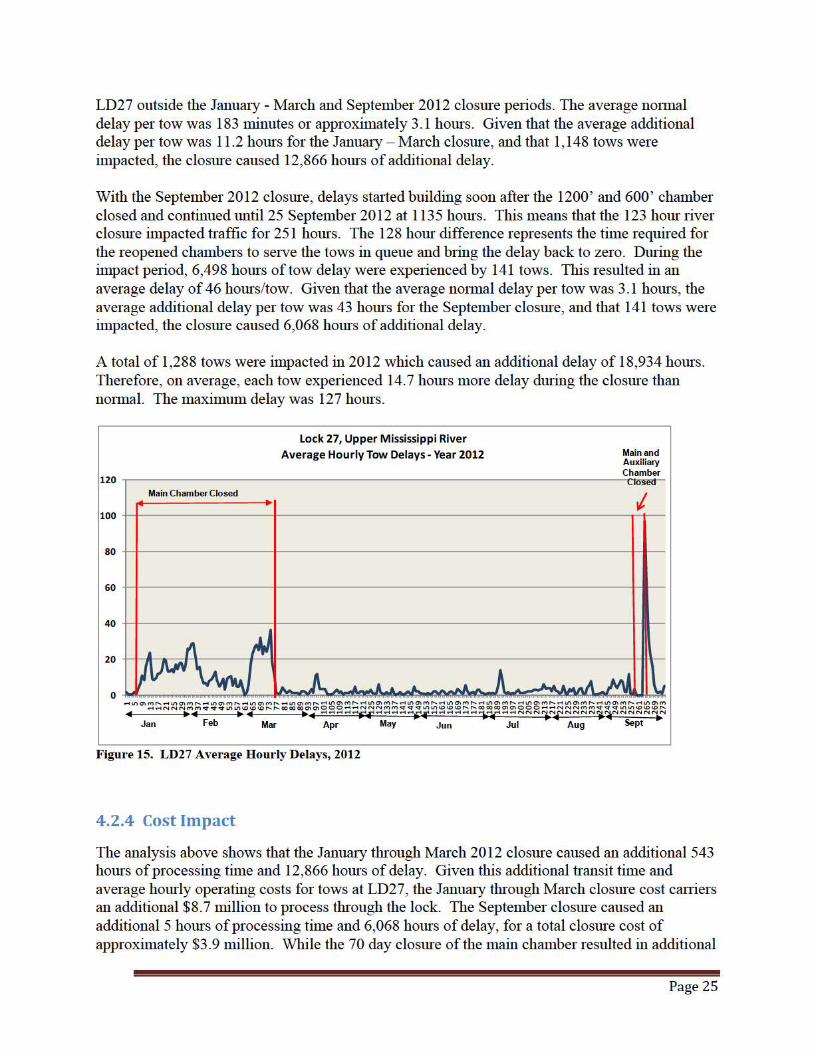
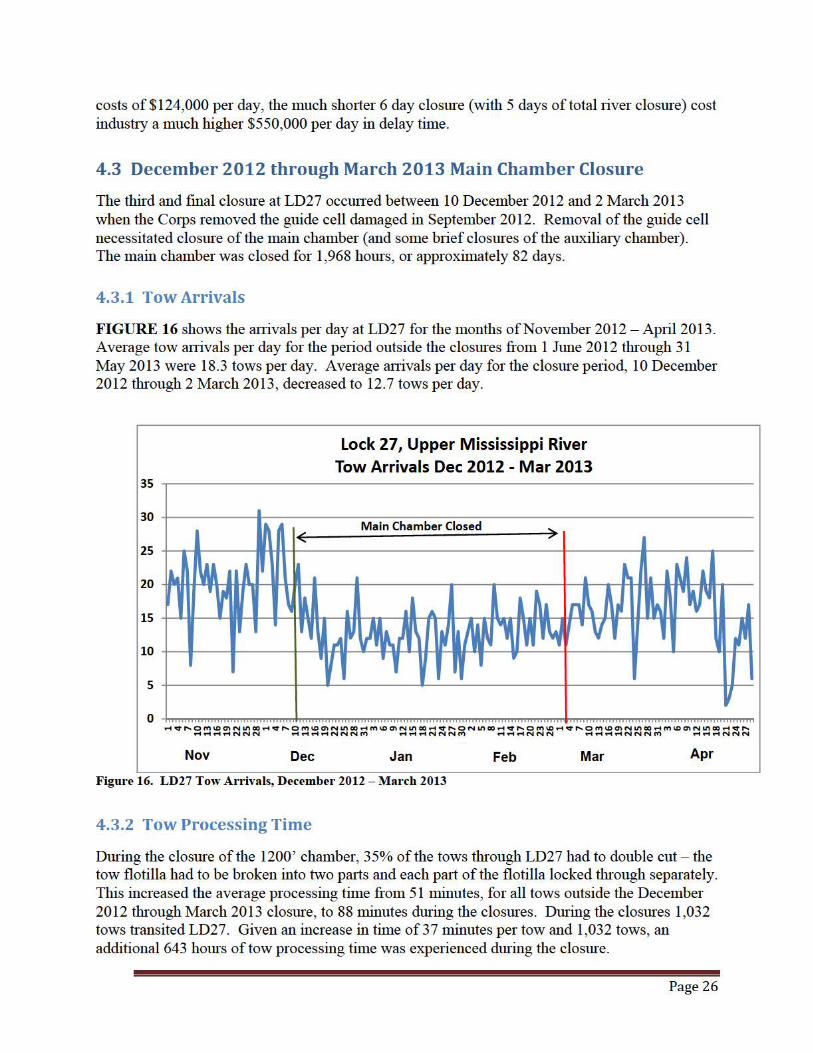
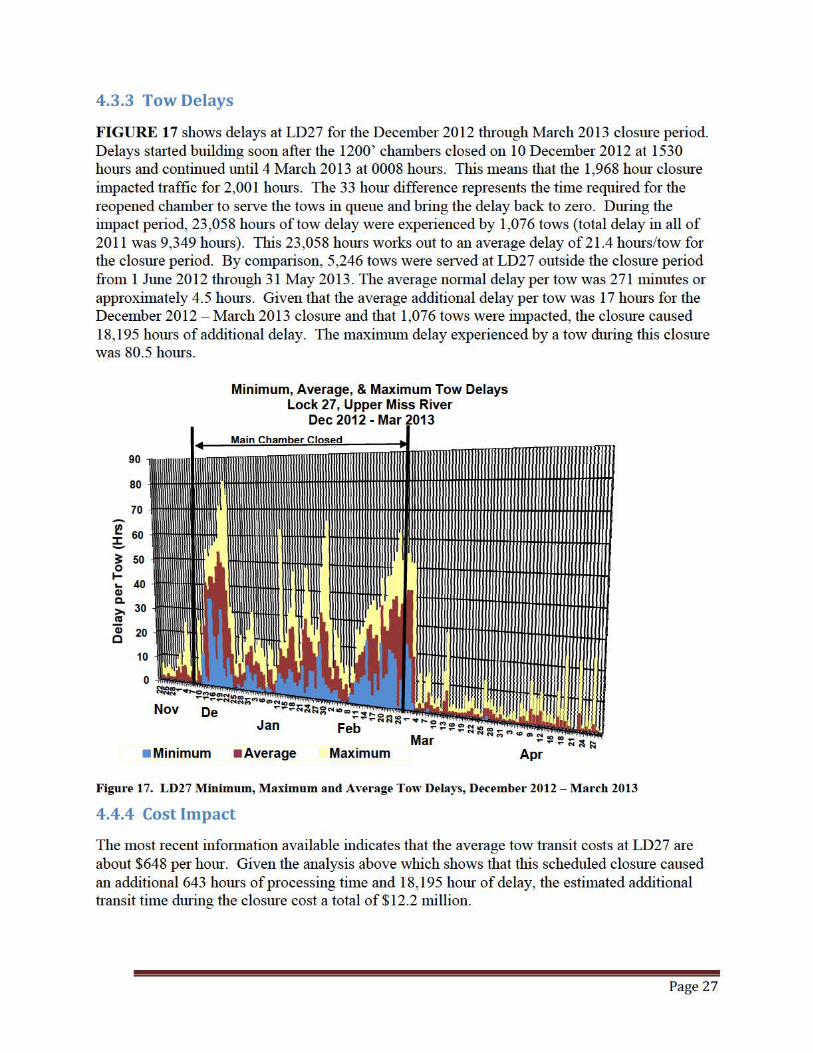
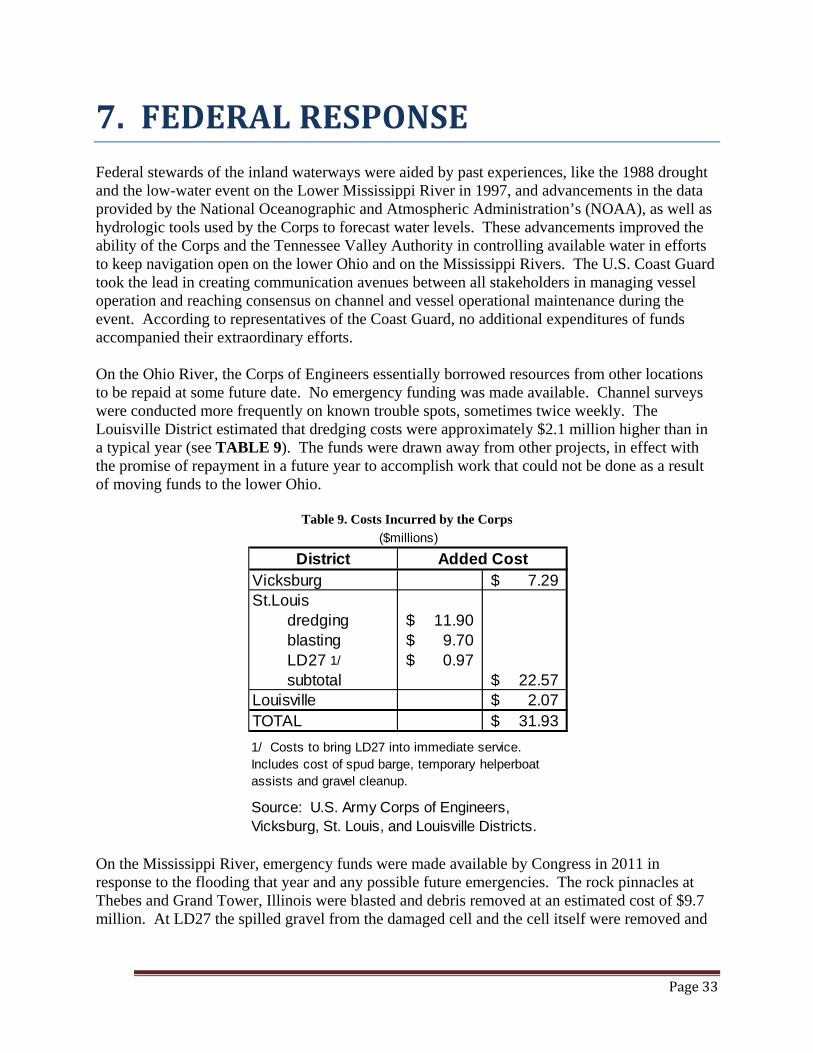
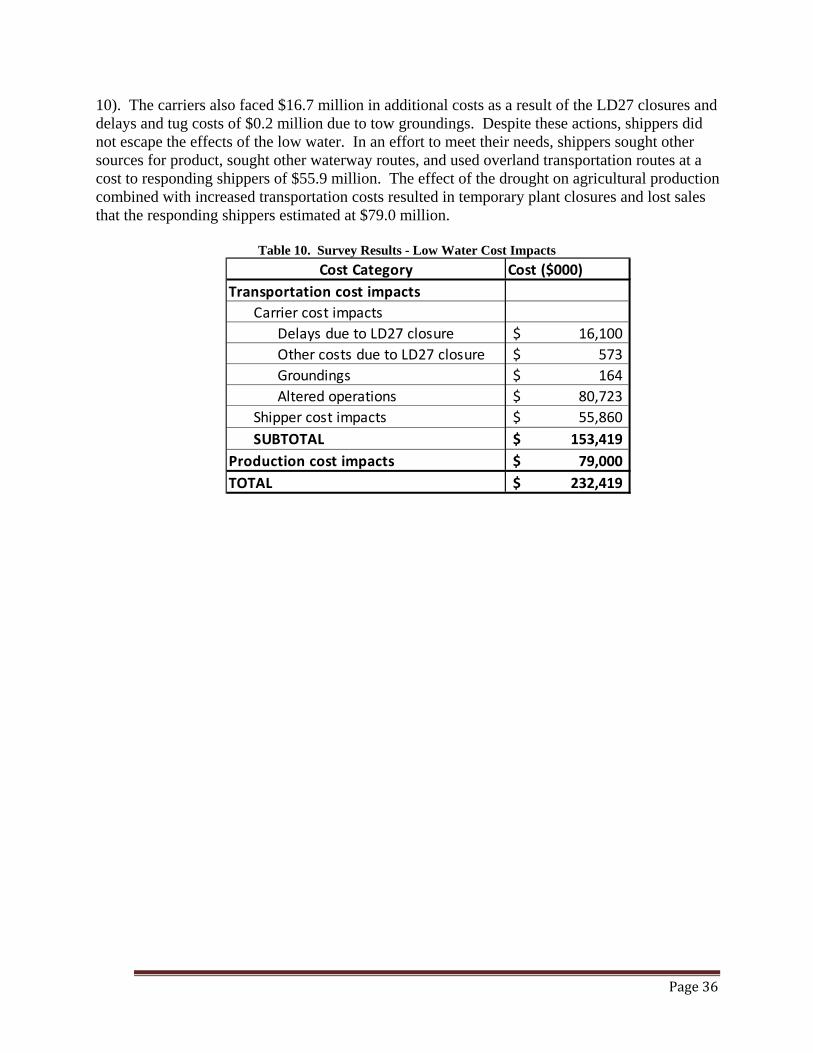

OMB Control 0710-0001 Expiration date 02282015
2012 DROUGHTLOCK 27 CLOSURE ndash SHIPPER SURVEY
Date
Firm
Address
Phone
FAX
Point of Contact
Title
General Description of Firm and Products Produced
NOTE ALL RESPONSES WILL BE TREATED AS CONFIDENTIAL
1 Was your company impacted by the closure event at Lock 27 in 2012 Yes No Was your company impacted by low water associated with the Drought Low water conditions in 2012 Yes No (If no interview is complete)
2 Does your company have a response plan for these types of impacts If so did it result in additional work organization to implement or was it detailed enough to cover all the impacts
1
PageA‐2
OMB Control 0710-0001 Expirat ion date 0228201 5
2012 DROUGHTLOCK 27 CLOSURE- SHIPPER SURVEY
LD27 closure
only Low
wate1middot Descriptio n of Response
a No change in procedmes b Stockpiled product and waited for traffic to clear if closme or changed loading depth in barges for low wat er c Switched to all-overland mode for product delivety from existing somces d Switched to different watervray routing for product delivety from existing somces e Switched product somce to an entirely new somce f Ceased operations dming the period g Altered production during the period h Switched production to another facility i Purchased intermediate or final product rather than produced j Other or combinations of the above (Please explain)
3 During th e 2012 event (either Low water or Lock 27 closure) what was your companys response Please indicate with an x in the appropriate box
4 Ifyou have checked c or d in question 3 please complete the following table
Movement Commodity Affected tonnage
Origin (City State)
Destination (City State)
Deliverd $ ton
plio1middot to drou2ht
Delivered $to n
during drou2ht
Examples
I Com 12000 Minneapolis New Orleans $30 $35
MN LA
2 Lube oils 4000 Houston TX Huntington wv $40 $50
2
PageA-3
OMB Contro l 0710-0001 Expiration date 02 282015
2012 DROUGHTLOCK 27 CLOSURE - SHIPPER SURVEY
5 Ifyou checked e in question 2 please complete the following table
Movement Commodity Affected tonnage
P reshydrou ght Origin
(City State)
Ch an ged Origin
(City State)
Destination (City State)
Deliver d $ton
pri01middot to drought
Delivered $ton
dming drought
Examples
1 Com 12000 Minneapolis MN
Cincinnati OH
New Orleans LA
$30 $35
2 Lube oils 4000 Houston TX Ashland KY
Pittsburgh PA $40 $50
6 Ifyou checked response a orb lmder question 3 how were your total production costs affected during the period of closure at Lock 27 or Drought-related low water (total increase in cost if applicable) Please explain
7 Ifyou checked response f under question 3 what was the total estimated loss to your fi1m as a result of ceasing production (during the closure period at Lock 27 or Drought)
3
Page A-4
OMB Control 0710-0001 Expiration date 02282015
2012 DROUGHTLOCK 27 CLOSURE ndash SHIPPER SURVEY
8 If you checked response ldquogrdquo under question 3 what was the total estimated loss to your firm as a result of altering production processes (during the closure period at Lock 27 or Drought)
9 If you checked response ldquohrdquo under question 3 what was the total increase in costs to your firm as a result of changing production locations (during the closure period at Lock 27 or Drought)
10 If you checked ldquoirdquo under question 3 to what extent did purchasing intermediate or final product increase your companyrsquos total costs (during the closure period at Lock 27 or Drought)
11 If you checked response ldquojrdquo under question 3 to what extent did the other measures or combination of measures undertaken as a result of the closure increase your companyrsquos total production costs (during the closure period at Lock 27 or Drought)
4
PageA‐5
OMB Control 0710-0001 Expiration date 02282015
2012 DROUGHTLOCK 27 CLOSURE ndash SHIPPER SURVEY
12 Have these events (drought-related low water or Lock 27 closure) caused your company to alter its long-term transportation strategy (eg switch to all-overland modes increase stockpiles etc) How will this impact your total commodity transportation or other costs (per year) Please explain
13 Has the (drought-related low water or Lock 27 closure) caused your company to take any other long-term permanent measures Please explain How will this affect your companyrsquos long-term operating costs (per year)
14 Has your company been impacted by other navigation system disruptions this shipping season (these would be other than the Low water from the drought or the Lock 27 closure)
5
PageA‐6
Event Date 2 Short-term response 3 Long-term responseExample
McAlpine closure
Jan ndash Feb 2006 Diverted to overland modes
none
OMB Control 0710-0001 Expiration date 02282015
2012 DROUGHTLOCK 27 CLOSURE ndash SHIPPER SURVEY
15 If your company has experienced significant navigation disruptions1 prior to this shipping season please complete the following table
1 Significant navigation system disruptions are defined as disruptions that result in delays to your shipment of more than 48 hours (include scheduled and unscheduled lock outages accidents and low and high water events)
2 Short term response refers to the response actions detailed in question 2 a No change in procedures b Stockpiled product and waited for traffic to clear or light loaded for low water c Switched to all-overland mode for product delivery from existing sources d Switched to different waterway routing for product delivery from existing sources e Switched product source to an entirely new source f Ceased operations during the period of closurelow water g Altered production during the period of closurelow water h Switched production to another facility i Purchased intermediate or final product rather than produced j Other or combinations of the above (Please explain)
3 Long term response refers to a modification of your long term business plan to include altering your long-term transportation strategy (eg switch to all-overland modes increase stockpiles etc) Other long term responses might include sourcing commodities at alternate sites or moving production activities to a different location
6
PageA‐7
PageA‐8
APPENDIX B ndash CARRIER QUESTIONNAIRE
[Typetext] PageB‐1
Waterway Carrier Interview Questions Effects of the 2012 Drought and LD27 Closure
Name of towing company -----------shyLocatio n -----------Name and title of Point of Co ntact ----------------shyPhone number ( )________ email _________
PART 1 LOW WATER DUE TO DROUGHT CONDITIO NS
1 Did your firm experience a reduction in tonnage carried on the Mississippi Ill ino is or Ohio waterways in 2012 Please verify data fo r 2010 and 2011 indicating your estimates for 2012 in table below
Operat o r Traffic Destined fo r Lower Mississippi Ports (2010 and 2011 from WCSC)
Origin 2010 2011 2012
Mississippi above St Louis Mississippi St Louis to Cairo Mississippi south of St Louis Ill inois River Ohio River
2 What facto rs led to changes in t raffic between 2011 and 2012 For example drought condit ions that affected agricultural production low water that affected your abi lit y to operate efficiently loss or gain of a contract(s) increased competit ion from rail or other factors - please specify and ind icate re lative weight of each
3 Have you had to change the way you operate your vessel fleet due to the drought If so what changes did you make and when did these occur
1
[Type text] Page B-2
4 The t wo ta bles below are intended to describe how your operat ions are affected by water depth a nd flows on the Cairo - St Louis reach of the Mississippi Rive r
a Do the operat ionalchanges suggested in t he tables below for the Cairo - St Louis reach (Upper Reach) describe the way you would operate given t he gage readings and flow shown for these two reaches in t he t ables If yes please indicate in the appropriate box in the table below with a Y if no please indicate what restrict ions you impose on your operations given t he gage and flow readings provided
Upper Rea ch- Navigation Restriction
St Louis Gage Reading
Flow (CFSOOO)
Navigation Restriction
Carriers Nav Restriction Followed
Above 20 Above 90 No restriction 00 to 20 74 to 90 25 barges -25 to 00 55 to 74 20 barges -35 to -25 485 to 55 16 barges -40 to -35 46 to 485 85 ft draft -45 to shy 4 0 44to47 80 ft draft Below -45 Below 44 Navigat ion halts
b What is t he number of tows- by size of tow horsepower and draft - that you operate through the St Louis to Cairo reach of the Mississippi For each foot of draft t hat is lost what is your added cost per t rip Please use the table below in making your response
Upper Reach- Tows moved thru the St Louis- Cairo reach in 2011 (or year not affect ed by low water)
Tow size Towboat Horseshypower
Barge Draft
Cost ton of loading below desired barge draft
Barges tow
No of tows 05 10 15 20 25 30 35 4 0
1 - 8 9 - 15
16 - 19 17 - 20 21- 25
gt25
2
[Type text] Page B-3
5 The t wo tables below are intended to describe how your operat ions are affect ed by water depth a nd flows on the Mississippi River sout h of Cairo
a Do the operat ional changes suggested in t he tables below for the Lower Reac h of the Mississippi River sout h of Cairo describe the way you would operate given the gage readings and flow shown for these two reaches in the tables If yes please indicate in t he appropriate box in t he table below with a Y if no please indicate what rest rictions you impose o n your operations given the gage and flow readings provided
Lower Reach- Navigation Restriction
Cairo Gage Reading
Flow (CFS in OOOs)
Navigation Restrictions
Carriers Nav Restriction Followed
Above 118 Above 189 No restriction 60 to 118 111 to 189 25 barges per tow
50 to 60 95 to 111 85 ft draft and 20 barges
35 TO 50 805 to 95 8 ft draft and 12 barges
Below 35 Below 805 Navigation halts
b What is t he number of tows- by size of tow horsepower and draft - that you operate on the Lower Reach of t he Mississippi south of Cairo For each foot of draft t hat is lost what is your added cost per trip Please use t he table below in making your response
Lower Reach- Tows moved through the reach south of St Louis in 2011 (or a yea r not affected by low water)
Tow size Towboat Barge Cost ton of loading below desired barge draft
Barges tow
No of tows
Horseshypower
Draft 05 10 15 20 25 30 35 4 0
1 - 12 13 - 16
17 - 20 21- 25 gt25
6 If you light load due t o low water would you proceed entire t rip as originally light loaded or top off
below Cairo or maybe add additional barges to w here the normal t ons per horsepowe r ratio is
achieved If latter how would this be done and at what cost
3
[Type text] Page B-4
7 Did any of your tows experience a grounding If yes how many total occurrences did you experience and what was the impact on your firm Please indicate your response below
total groundings
events with tows delayed more than 8 hours cost of delays
events involving lightering cargo cost of lightering
events involving towboat assists cost of towboat assists
8 What was major impact of low water due to the drought in terms of effect on your operations ‐
increased operating cost Lost business Equipment damage Safety concerns Groundings
Efficient dispatch of fleet Others
9 Please indicate the economic impact of low water levels on your company in the table below (please
include figures from your response to 5 above)
Indicate Cost with an ldquoXrdquo
if this applies to your firm
Description of impact Costton Tons
Affected Total cost
Increased transit time (including delays) Increased cost due to restricted tow sizes Increased costs due to light loading Idle vesselslost revenue Damaged equipment Increased managementlogistics costs Other (please specify)
4
[Typetext] PageB‐5
PART 2 CLOSURE OF LD27
10 If you have tows already at the lock do you generally wait until it reopens
11 What is typical amount of time you will wait at a lock for it to reopen before you decide to do
something else What do you do if you decide not to wait any longer What factors affect this
decision If you re‐dispatch the tow what does this cost
12 If you have tows underway in the system and a closure occurs at a lock to be transited do you
continue to the closure point wait elsewhere or re‐dispatch the tow What factors affect this decision
13 Please indicate the economic impact of the closure of LD27 on your company in the table below
Indicate Cost with an ldquoXrdquo
if this applies to your firm
Description of impact Costton Tons
Affected Total cost
Delay costs at the lock Delays in place (dock or port) Idle vesselslost revenue Increased managementlogistics costs costs (including re‐dispatching) Other (please specify)
PART 3 FINAL COMMENTS
14 Do you have any other information that would help us describe and quantify the economic impact on
waterway carriers associated with low water due to the drought of 2012 andor the closure of LD27
5
[Typetext] PageB‐6
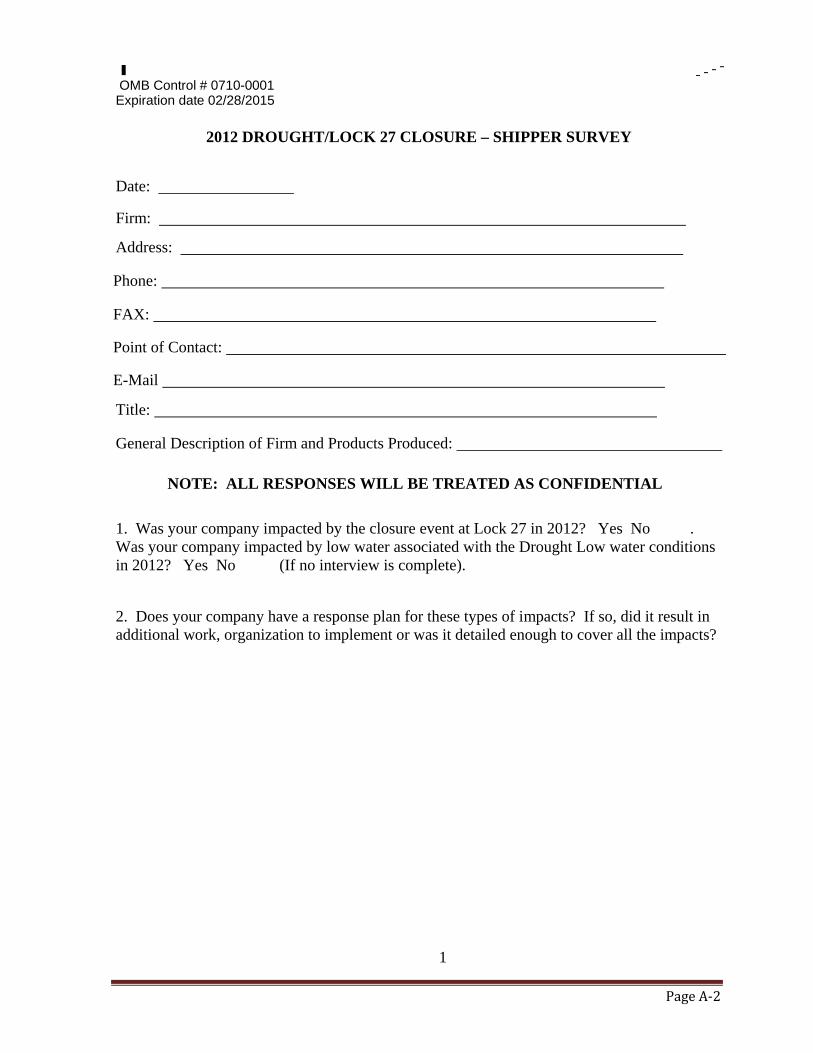
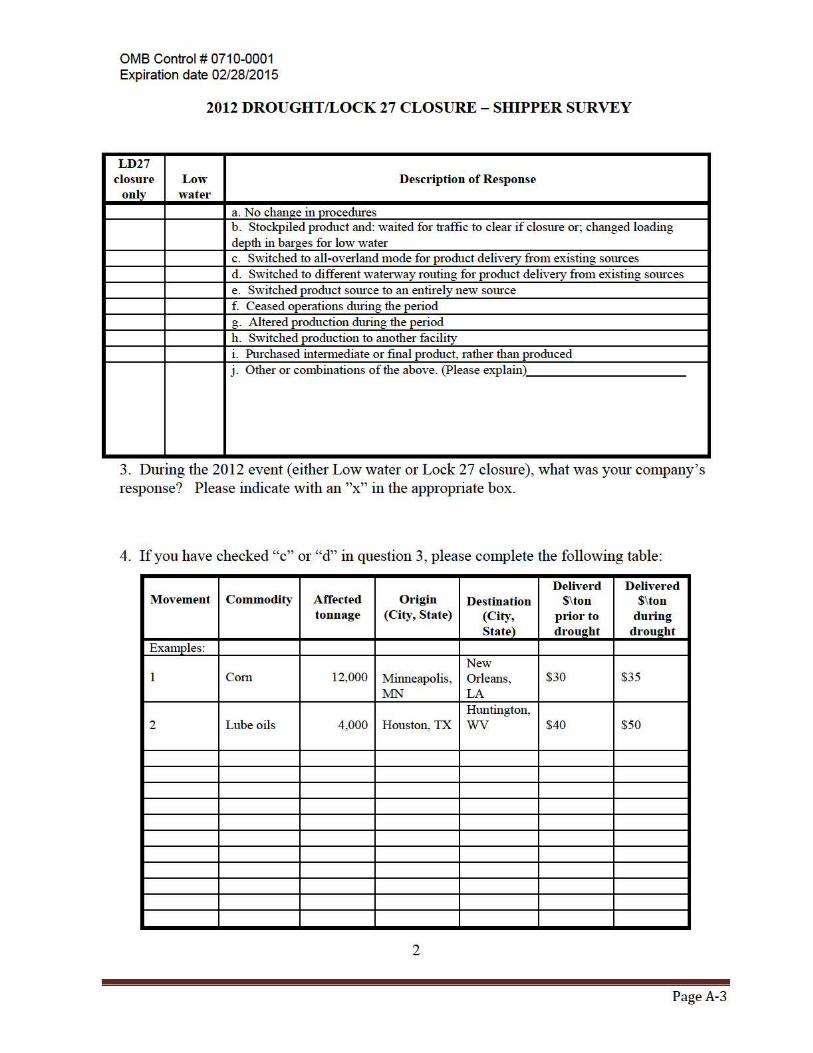
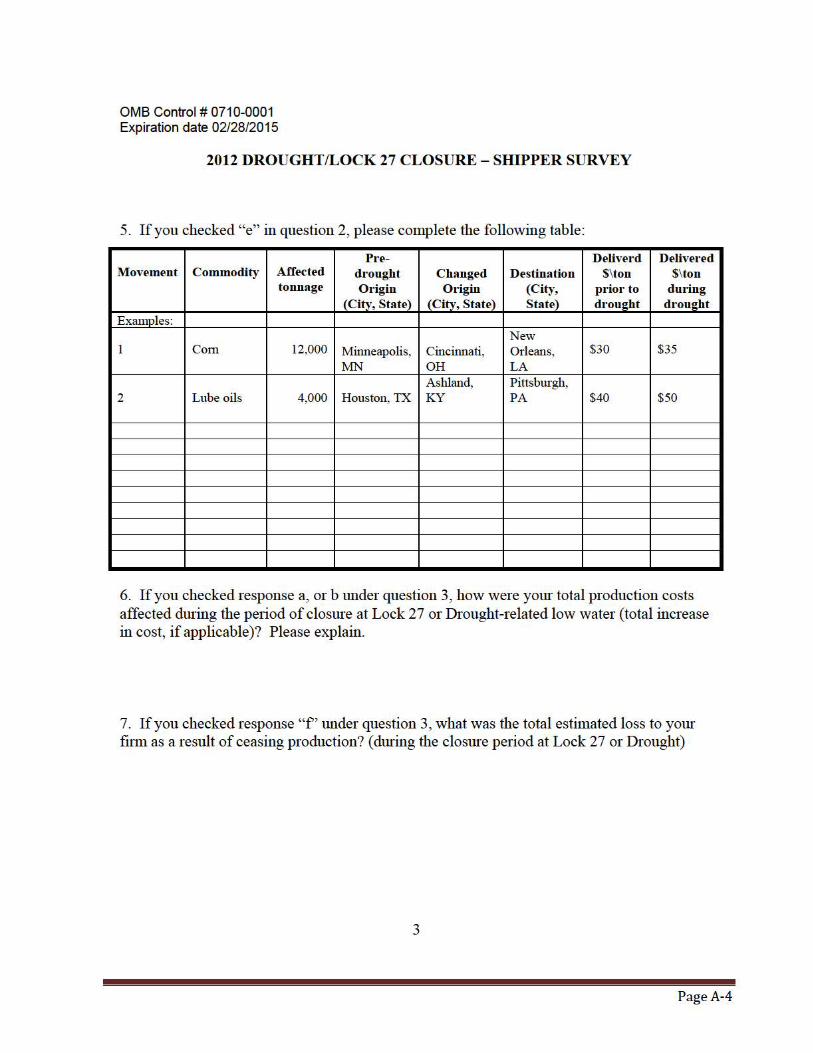
OMB Control 0710-0001 Expiration date 02282015
2012 DROUGHTLOCK 27 CLOSURE ndash SHIPPER SURVEY
8 If you checked response ldquogrdquo under question 3 what was the total estimated loss to your firm as a result of altering production processes (during the closure period at Lock 27 or Drought)
9 If you checked response ldquohrdquo under question 3 what was the total increase in costs to your firm as a result of changing production locations (during the closure period at Lock 27 or Drought)
10 If you checked ldquoirdquo under question 3 to what extent did purchasing intermediate or final product increase your companyrsquos total costs (during the closure period at Lock 27 or Drought)
11 If you checked response ldquojrdquo under question 3 to what extent did the other measures or combination of measures undertaken as a result of the closure increase your companyrsquos total production costs (during the closure period at Lock 27 or Drought)
4
PageA‐5
OMB Control 0710-0001 Expiration date 02282015
2012 DROUGHTLOCK 27 CLOSURE ndash SHIPPER SURVEY
12 Have these events (drought-related low water or Lock 27 closure) caused your company to alter its long-term transportation strategy (eg switch to all-overland modes increase stockpiles etc) How will this impact your total commodity transportation or other costs (per year) Please explain
13 Has the (drought-related low water or Lock 27 closure) caused your company to take any other long-term permanent measures Please explain How will this affect your companyrsquos long-term operating costs (per year)
14 Has your company been impacted by other navigation system disruptions this shipping season (these would be other than the Low water from the drought or the Lock 27 closure)
5
PageA‐6
Event Date 2 Short-term response 3 Long-term responseExample
McAlpine closure
Jan ndash Feb 2006 Diverted to overland modes
none
OMB Control 0710-0001 Expiration date 02282015
2012 DROUGHTLOCK 27 CLOSURE ndash SHIPPER SURVEY
15 If your company has experienced significant navigation disruptions1 prior to this shipping season please complete the following table
1 Significant navigation system disruptions are defined as disruptions that result in delays to your shipment of more than 48 hours (include scheduled and unscheduled lock outages accidents and low and high water events)
2 Short term response refers to the response actions detailed in question 2 a No change in procedures b Stockpiled product and waited for traffic to clear or light loaded for low water c Switched to all-overland mode for product delivery from existing sources d Switched to different waterway routing for product delivery from existing sources e Switched product source to an entirely new source f Ceased operations during the period of closurelow water g Altered production during the period of closurelow water h Switched production to another facility i Purchased intermediate or final product rather than produced j Other or combinations of the above (Please explain)
3 Long term response refers to a modification of your long term business plan to include altering your long-term transportation strategy (eg switch to all-overland modes increase stockpiles etc) Other long term responses might include sourcing commodities at alternate sites or moving production activities to a different location
6
PageA‐7
PageA‐8
APPENDIX B ndash CARRIER QUESTIONNAIRE
[Typetext] PageB‐1
Waterway Carrier Interview Questions Effects of the 2012 Drought and LD27 Closure
Name of towing company -----------shyLocatio n -----------Name and title of Point of Co ntact ----------------shyPhone number ( )________ email _________
PART 1 LOW WATER DUE TO DROUGHT CONDITIO NS
1 Did your firm experience a reduction in tonnage carried on the Mississippi Ill ino is or Ohio waterways in 2012 Please verify data fo r 2010 and 2011 indicating your estimates for 2012 in table below
Operat o r Traffic Destined fo r Lower Mississippi Ports (2010 and 2011 from WCSC)
Origin 2010 2011 2012
Mississippi above St Louis Mississippi St Louis to Cairo Mississippi south of St Louis Ill inois River Ohio River
2 What facto rs led to changes in t raffic between 2011 and 2012 For example drought condit ions that affected agricultural production low water that affected your abi lit y to operate efficiently loss or gain of a contract(s) increased competit ion from rail or other factors - please specify and ind icate re lative weight of each
3 Have you had to change the way you operate your vessel fleet due to the drought If so what changes did you make and when did these occur
1
[Type text] Page B-2
4 The t wo ta bles below are intended to describe how your operat ions are affected by water depth a nd flows on the Cairo - St Louis reach of the Mississippi Rive r
a Do the operat ionalchanges suggested in t he tables below for the Cairo - St Louis reach (Upper Reach) describe the way you would operate given t he gage readings and flow shown for these two reaches in t he t ables If yes please indicate in the appropriate box in the table below with a Y if no please indicate what restrict ions you impose on your operations given t he gage and flow readings provided
Upper Rea ch- Navigation Restriction
St Louis Gage Reading
Flow (CFSOOO)
Navigation Restriction
Carriers Nav Restriction Followed
Above 20 Above 90 No restriction 00 to 20 74 to 90 25 barges -25 to 00 55 to 74 20 barges -35 to -25 485 to 55 16 barges -40 to -35 46 to 485 85 ft draft -45 to shy 4 0 44to47 80 ft draft Below -45 Below 44 Navigat ion halts
b What is t he number of tows- by size of tow horsepower and draft - that you operate through the St Louis to Cairo reach of the Mississippi For each foot of draft t hat is lost what is your added cost per t rip Please use the table below in making your response
Upper Reach- Tows moved thru the St Louis- Cairo reach in 2011 (or year not affect ed by low water)
Tow size Towboat Horseshypower
Barge Draft
Cost ton of loading below desired barge draft
Barges tow
No of tows 05 10 15 20 25 30 35 4 0
1 - 8 9 - 15
16 - 19 17 - 20 21- 25
gt25
2
[Type text] Page B-3
5 The t wo tables below are intended to describe how your operat ions are affect ed by water depth a nd flows on the Mississippi River sout h of Cairo
a Do the operat ional changes suggested in t he tables below for the Lower Reac h of the Mississippi River sout h of Cairo describe the way you would operate given the gage readings and flow shown for these two reaches in the tables If yes please indicate in t he appropriate box in t he table below with a Y if no please indicate what rest rictions you impose o n your operations given the gage and flow readings provided
Lower Reach- Navigation Restriction
Cairo Gage Reading
Flow (CFS in OOOs)
Navigation Restrictions
Carriers Nav Restriction Followed
Above 118 Above 189 No restriction 60 to 118 111 to 189 25 barges per tow
50 to 60 95 to 111 85 ft draft and 20 barges
35 TO 50 805 to 95 8 ft draft and 12 barges
Below 35 Below 805 Navigation halts
b What is t he number of tows- by size of tow horsepower and draft - that you operate on the Lower Reach of t he Mississippi south of Cairo For each foot of draft t hat is lost what is your added cost per trip Please use t he table below in making your response
Lower Reach- Tows moved through the reach south of St Louis in 2011 (or a yea r not affected by low water)
Tow size Towboat Barge Cost ton of loading below desired barge draft
Barges tow
No of tows
Horseshypower
Draft 05 10 15 20 25 30 35 4 0
1 - 12 13 - 16
17 - 20 21- 25 gt25
6 If you light load due t o low water would you proceed entire t rip as originally light loaded or top off
below Cairo or maybe add additional barges to w here the normal t ons per horsepowe r ratio is
achieved If latter how would this be done and at what cost
3
[Type text] Page B-4
7 Did any of your tows experience a grounding If yes how many total occurrences did you experience and what was the impact on your firm Please indicate your response below
total groundings
events with tows delayed more than 8 hours cost of delays
events involving lightering cargo cost of lightering
events involving towboat assists cost of towboat assists
8 What was major impact of low water due to the drought in terms of effect on your operations ‐
increased operating cost Lost business Equipment damage Safety concerns Groundings
Efficient dispatch of fleet Others
9 Please indicate the economic impact of low water levels on your company in the table below (please
include figures from your response to 5 above)
Indicate Cost with an ldquoXrdquo
if this applies to your firm
Description of impact Costton Tons
Affected Total cost
Increased transit time (including delays) Increased cost due to restricted tow sizes Increased costs due to light loading Idle vesselslost revenue Damaged equipment Increased managementlogistics costs Other (please specify)
4
[Typetext] PageB‐5
PART 2 CLOSURE OF LD27
10 If you have tows already at the lock do you generally wait until it reopens
11 What is typical amount of time you will wait at a lock for it to reopen before you decide to do
something else What do you do if you decide not to wait any longer What factors affect this
decision If you re‐dispatch the tow what does this cost
12 If you have tows underway in the system and a closure occurs at a lock to be transited do you
continue to the closure point wait elsewhere or re‐dispatch the tow What factors affect this decision
13 Please indicate the economic impact of the closure of LD27 on your company in the table below
Indicate Cost with an ldquoXrdquo
if this applies to your firm
Description of impact Costton Tons
Affected Total cost
Delay costs at the lock Delays in place (dock or port) Idle vesselslost revenue Increased managementlogistics costs costs (including re‐dispatching) Other (please specify)
PART 3 FINAL COMMENTS
14 Do you have any other information that would help us describe and quantify the economic impact on
waterway carriers associated with low water due to the drought of 2012 andor the closure of LD27
5
[Typetext] PageB‐6
OMB Control 0710-0001 Expiration date 02282015
2012 DROUGHTLOCK 27 CLOSURE ndash SHIPPER SURVEY
12 Have these events (drought-related low water or Lock 27 closure) caused your company to alter its long-term transportation strategy (eg switch to all-overland modes increase stockpiles etc) How will this impact your total commodity transportation or other costs (per year) Please explain
13 Has the (drought-related low water or Lock 27 closure) caused your company to take any other long-term permanent measures Please explain How will this affect your companyrsquos long-term operating costs (per year)
14 Has your company been impacted by other navigation system disruptions this shipping season (these would be other than the Low water from the drought or the Lock 27 closure)
5
PageA‐6
Event Date 2 Short-term response 3 Long-term responseExample
McAlpine closure
Jan ndash Feb 2006 Diverted to overland modes
none
OMB Control 0710-0001 Expiration date 02282015
2012 DROUGHTLOCK 27 CLOSURE ndash SHIPPER SURVEY
15 If your company has experienced significant navigation disruptions1 prior to this shipping season please complete the following table
1 Significant navigation system disruptions are defined as disruptions that result in delays to your shipment of more than 48 hours (include scheduled and unscheduled lock outages accidents and low and high water events)
2 Short term response refers to the response actions detailed in question 2 a No change in procedures b Stockpiled product and waited for traffic to clear or light loaded for low water c Switched to all-overland mode for product delivery from existing sources d Switched to different waterway routing for product delivery from existing sources e Switched product source to an entirely new source f Ceased operations during the period of closurelow water g Altered production during the period of closurelow water h Switched production to another facility i Purchased intermediate or final product rather than produced j Other or combinations of the above (Please explain)
3 Long term response refers to a modification of your long term business plan to include altering your long-term transportation strategy (eg switch to all-overland modes increase stockpiles etc) Other long term responses might include sourcing commodities at alternate sites or moving production activities to a different location
6
PageA‐7
PageA‐8
APPENDIX B ndash CARRIER QUESTIONNAIRE
[Typetext] PageB‐1
Waterway Carrier Interview Questions Effects of the 2012 Drought and LD27 Closure
Name of towing company -----------shyLocatio n -----------Name and title of Point of Co ntact ----------------shyPhone number ( )________ email _________
PART 1 LOW WATER DUE TO DROUGHT CONDITIO NS
1 Did your firm experience a reduction in tonnage carried on the Mississippi Ill ino is or Ohio waterways in 2012 Please verify data fo r 2010 and 2011 indicating your estimates for 2012 in table below
Operat o r Traffic Destined fo r Lower Mississippi Ports (2010 and 2011 from WCSC)
Origin 2010 2011 2012
Mississippi above St Louis Mississippi St Louis to Cairo Mississippi south of St Louis Ill inois River Ohio River
2 What facto rs led to changes in t raffic between 2011 and 2012 For example drought condit ions that affected agricultural production low water that affected your abi lit y to operate efficiently loss or gain of a contract(s) increased competit ion from rail or other factors - please specify and ind icate re lative weight of each
3 Have you had to change the way you operate your vessel fleet due to the drought If so what changes did you make and when did these occur
1
[Type text] Page B-2
4 The t wo ta bles below are intended to describe how your operat ions are affected by water depth a nd flows on the Cairo - St Louis reach of the Mississippi Rive r
a Do the operat ionalchanges suggested in t he tables below for the Cairo - St Louis reach (Upper Reach) describe the way you would operate given t he gage readings and flow shown for these two reaches in t he t ables If yes please indicate in the appropriate box in the table below with a Y if no please indicate what restrict ions you impose on your operations given t he gage and flow readings provided
Upper Rea ch- Navigation Restriction
St Louis Gage Reading
Flow (CFSOOO)
Navigation Restriction
Carriers Nav Restriction Followed
Above 20 Above 90 No restriction 00 to 20 74 to 90 25 barges -25 to 00 55 to 74 20 barges -35 to -25 485 to 55 16 barges -40 to -35 46 to 485 85 ft draft -45 to shy 4 0 44to47 80 ft draft Below -45 Below 44 Navigat ion halts
b What is t he number of tows- by size of tow horsepower and draft - that you operate through the St Louis to Cairo reach of the Mississippi For each foot of draft t hat is lost what is your added cost per t rip Please use the table below in making your response
Upper Reach- Tows moved thru the St Louis- Cairo reach in 2011 (or year not affect ed by low water)
Tow size Towboat Horseshypower
Barge Draft
Cost ton of loading below desired barge draft
Barges tow
No of tows 05 10 15 20 25 30 35 4 0
1 - 8 9 - 15
16 - 19 17 - 20 21- 25
gt25
2
[Type text] Page B-3
5 The t wo tables below are intended to describe how your operat ions are affect ed by water depth a nd flows on the Mississippi River sout h of Cairo
a Do the operat ional changes suggested in t he tables below for the Lower Reac h of the Mississippi River sout h of Cairo describe the way you would operate given the gage readings and flow shown for these two reaches in the tables If yes please indicate in t he appropriate box in t he table below with a Y if no please indicate what rest rictions you impose o n your operations given the gage and flow readings provided
Lower Reach- Navigation Restriction
Cairo Gage Reading
Flow (CFS in OOOs)
Navigation Restrictions
Carriers Nav Restriction Followed
Above 118 Above 189 No restriction 60 to 118 111 to 189 25 barges per tow
50 to 60 95 to 111 85 ft draft and 20 barges
35 TO 50 805 to 95 8 ft draft and 12 barges
Below 35 Below 805 Navigation halts
b What is t he number of tows- by size of tow horsepower and draft - that you operate on the Lower Reach of t he Mississippi south of Cairo For each foot of draft t hat is lost what is your added cost per trip Please use t he table below in making your response
Lower Reach- Tows moved through the reach south of St Louis in 2011 (or a yea r not affected by low water)
Tow size Towboat Barge Cost ton of loading below desired barge draft
Barges tow
No of tows
Horseshypower
Draft 05 10 15 20 25 30 35 4 0
1 - 12 13 - 16
17 - 20 21- 25 gt25
6 If you light load due t o low water would you proceed entire t rip as originally light loaded or top off
below Cairo or maybe add additional barges to w here the normal t ons per horsepowe r ratio is
achieved If latter how would this be done and at what cost
3
[Type text] Page B-4
7 Did any of your tows experience a grounding If yes how many total occurrences did you experience and what was the impact on your firm Please indicate your response below
total groundings
events with tows delayed more than 8 hours cost of delays
events involving lightering cargo cost of lightering
events involving towboat assists cost of towboat assists
8 What was major impact of low water due to the drought in terms of effect on your operations ‐
increased operating cost Lost business Equipment damage Safety concerns Groundings
Efficient dispatch of fleet Others
9 Please indicate the economic impact of low water levels on your company in the table below (please
include figures from your response to 5 above)
Indicate Cost with an ldquoXrdquo
if this applies to your firm
Description of impact Costton Tons
Affected Total cost
Increased transit time (including delays) Increased cost due to restricted tow sizes Increased costs due to light loading Idle vesselslost revenue Damaged equipment Increased managementlogistics costs Other (please specify)
4
[Typetext] PageB‐5
PART 2 CLOSURE OF LD27
10 If you have tows already at the lock do you generally wait until it reopens
11 What is typical amount of time you will wait at a lock for it to reopen before you decide to do
something else What do you do if you decide not to wait any longer What factors affect this
decision If you re‐dispatch the tow what does this cost
12 If you have tows underway in the system and a closure occurs at a lock to be transited do you
continue to the closure point wait elsewhere or re‐dispatch the tow What factors affect this decision
13 Please indicate the economic impact of the closure of LD27 on your company in the table below
Indicate Cost with an ldquoXrdquo
if this applies to your firm
Description of impact Costton Tons
Affected Total cost
Delay costs at the lock Delays in place (dock or port) Idle vesselslost revenue Increased managementlogistics costs costs (including re‐dispatching) Other (please specify)
PART 3 FINAL COMMENTS
14 Do you have any other information that would help us describe and quantify the economic impact on
waterway carriers associated with low water due to the drought of 2012 andor the closure of LD27
5
[Typetext] PageB‐6
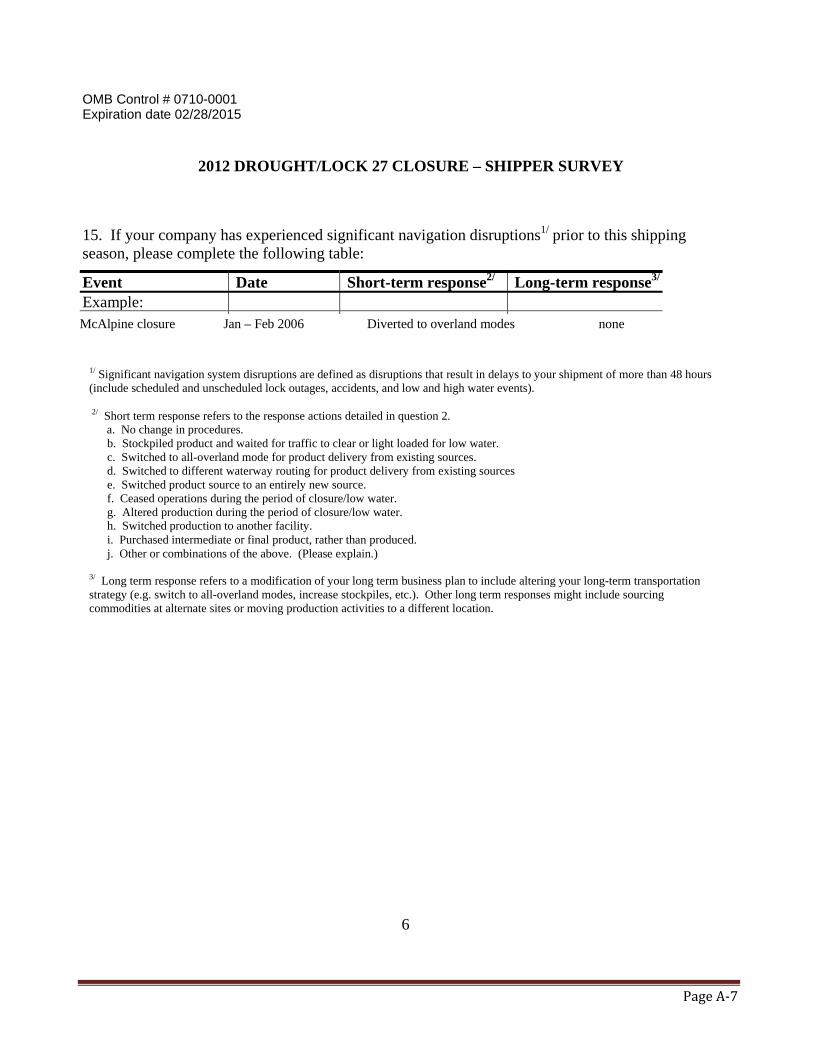
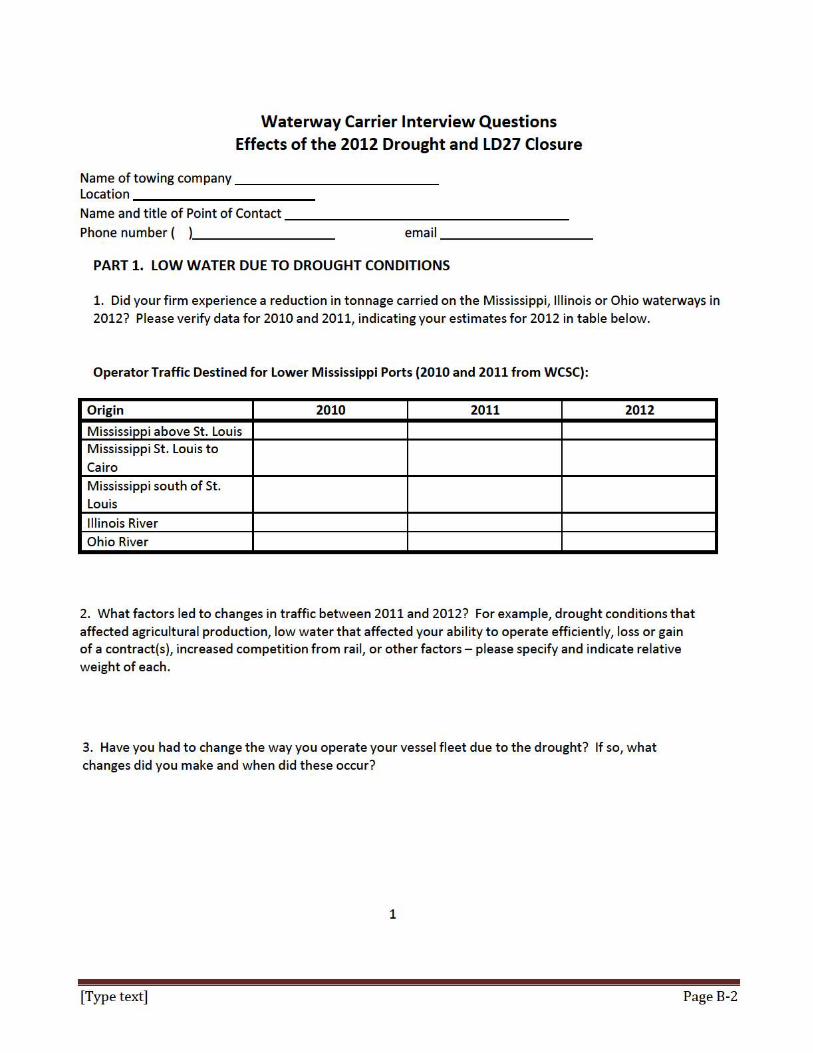
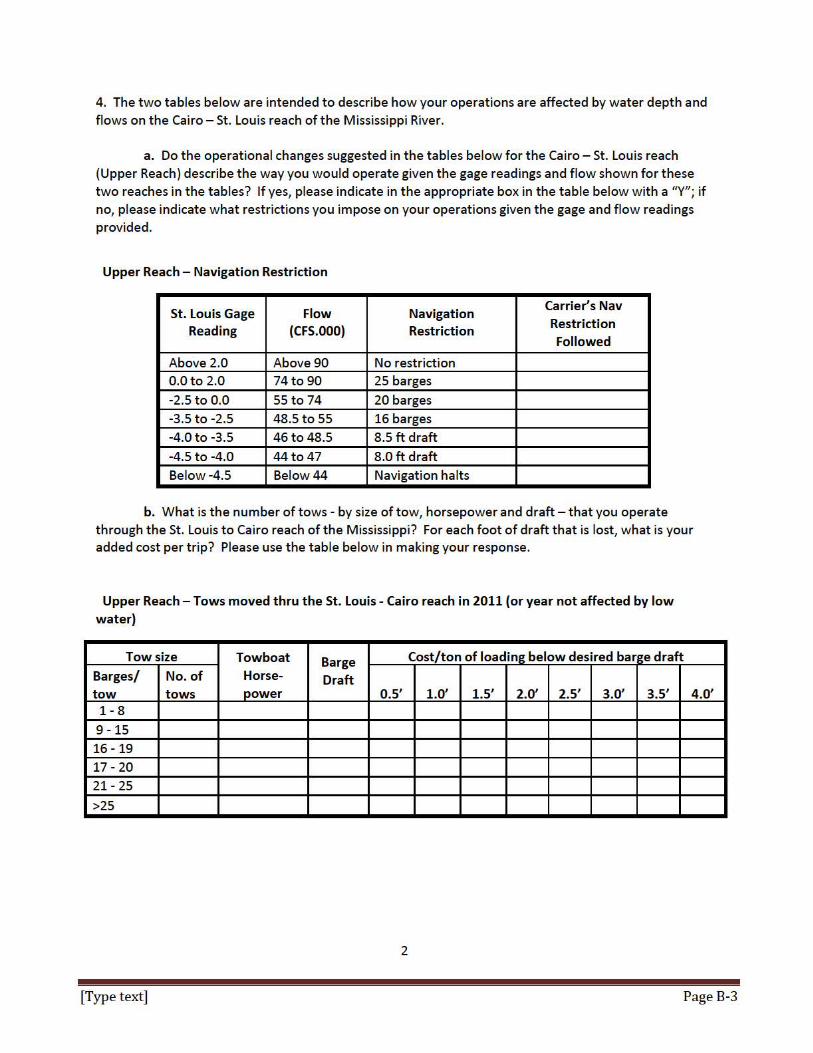
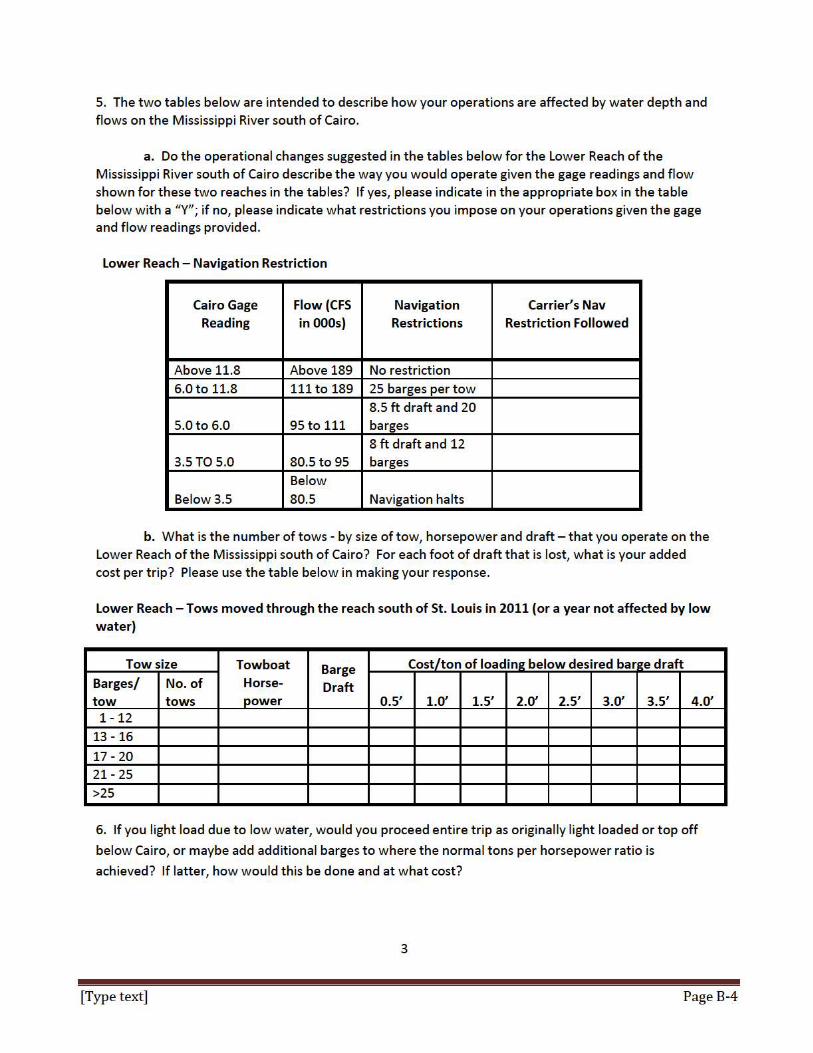
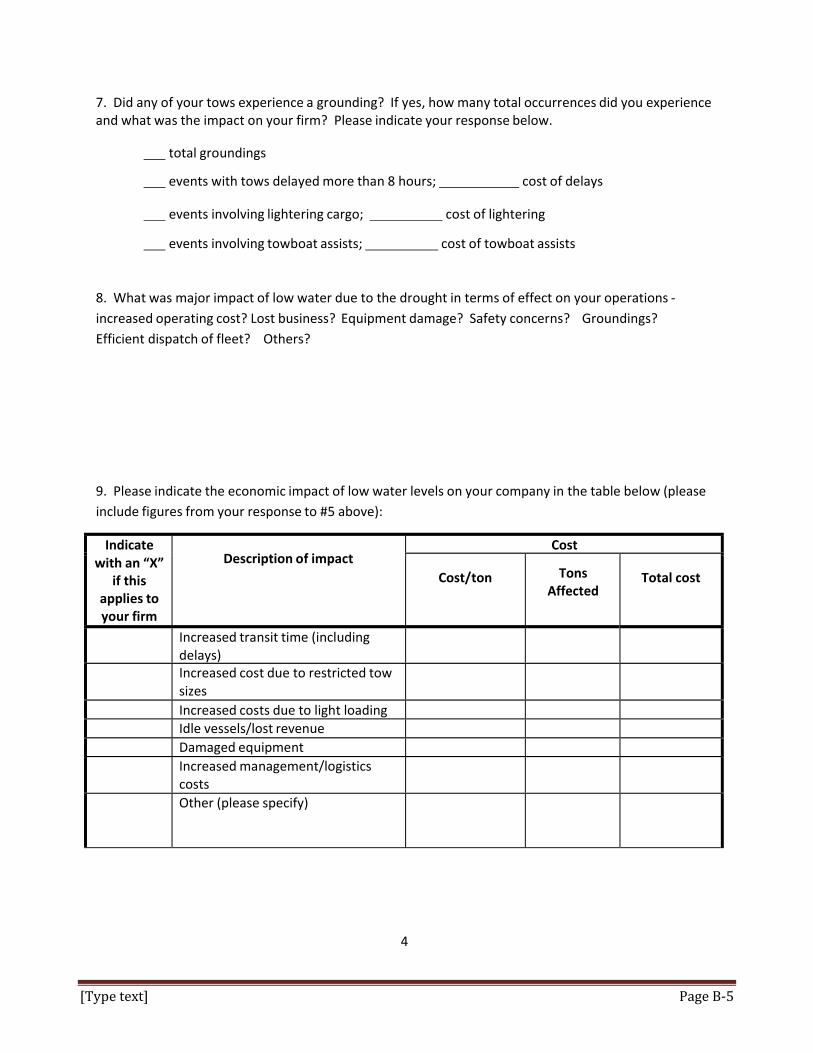