Embed Size (px)
Citation preview
Drops, Slugs, and Flooding in PolymerElectrolyte Membrane Fuel Cells
Erin Kimball, Tamara Whitaker, Yannis G. Kevrekidis, and Jay B. BenzigerDept. of Chemical Engineering, Princeton University, Princeton, NJ 08544
DOI 10.1002/aic.11464Published online March 26, 2008 in Wiley InterScience (www.interscience.wiley.com).
The process of flooding has been examined with a single-channel fuel cell that per-mits direct observation of liquid water motion and local current density. As productwater flows through the largest pores in the hydrophobic GDL, drops detach from thesurface, aggregate, and form slugs. Flooding in polymer electrolyte membrane (PEM)fuel cells occurs when liquid water slugs accumulate in the gas flow channel, inhibi-ting reactant transport. Because of the importance of gravity, we observe differentcharacteristics with different orientations of the flow channels. Liquid water may fallaway from the GDL and be pushed out with minimal effect on the local current den-sity, accumulate on the GDL surface and cause local fluctuations, or become a pulsat-ing flow of liquid slugs and cause periodic oscillations. We show that flooding in PEMfuel cells is gravity-dependent and the local current densities depend on dynamics ofliquid slugs moving through the flow channels. � 2008 American Institute of Chemical
Engineers AIChE J, 54: 1313–1332, 2008
Keywords: multi-phase flow, fuel cells, porous media, transport
Introduction
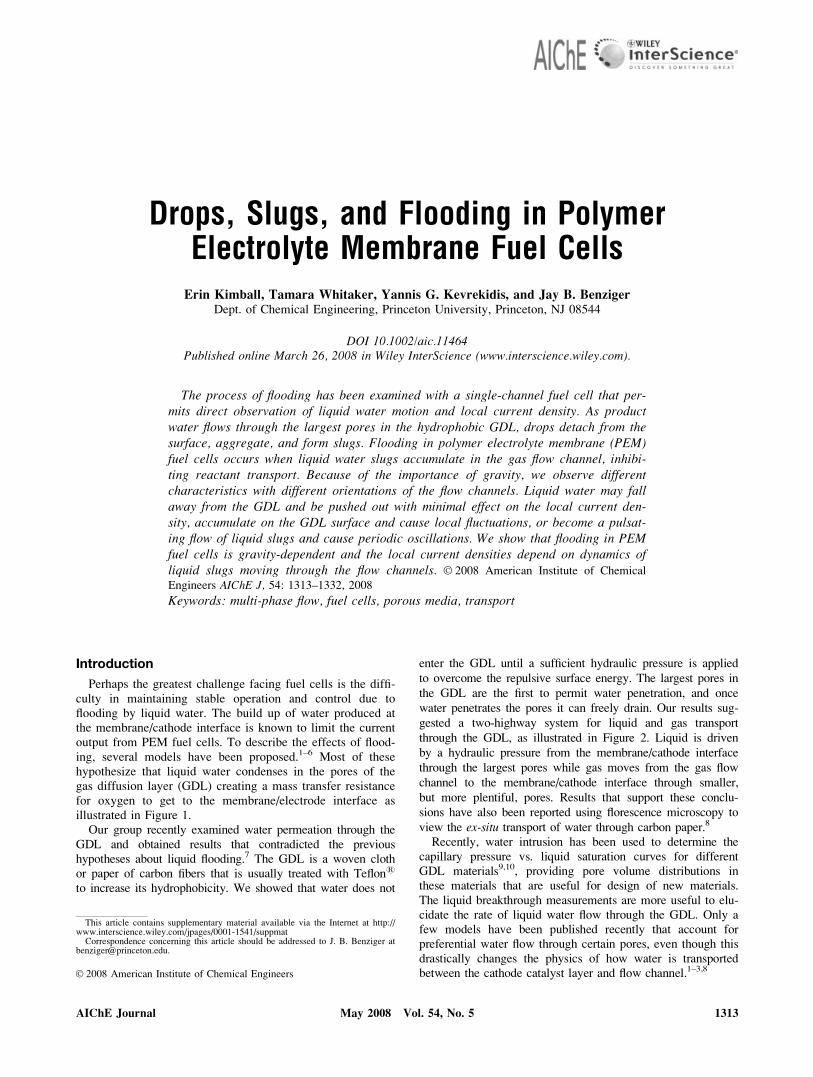
Perhaps the greatest challenge facing fuel cells is the diffi-culty in maintaining stable operation and control due toflooding by liquid water. The build up of water produced atthe membrane/cathode interface is known to limit the currentoutput from PEM fuel cells. To describe the effects of flood-ing, several models have been proposed.1–6 Most of thesehypothesize that liquid water condenses in the pores of thegas diffusion layer (GDL) creating a mass transfer resistancefor oxygen to get to the membrane/electrode interface asillustrated in Figure 1.
Our group recently examined water permeation through theGDL and obtained results that contradicted the previoushypotheses about liquid flooding.7 The GDL is a woven clothor paper of carbon fibers that is usually treated with Teflon1
to increase its hydrophobicity. We showed that water does not
enter the GDL until a sufficient hydraulic pressure is applied
to overcome the repulsive surface energy. The largest pores in
the GDL are the first to permit water penetration, and once
water penetrates the pores it can freely drain. Our results sug-
gested a two-highway system for liquid and gas transport
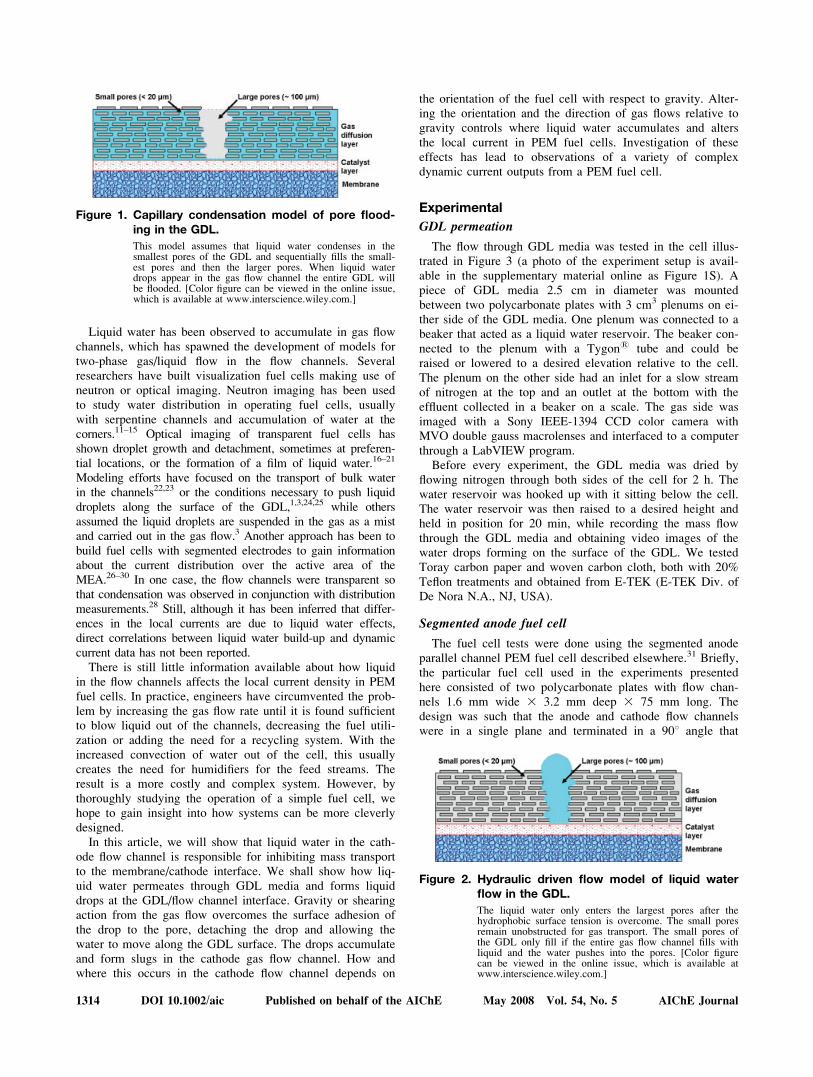
through the GDL, as illustrated in Figure 2. Liquid is driven
by a hydraulic pressure from the membrane/cathode interface
through the largest pores while gas moves from the gas flow
channel to the membrane/cathode interface through smaller,
but more plentiful, pores. Results that support these conclu-
sions have also been reported using florescence microscopy to
view the ex-situ transport of water through carbon paper.8
Recently, water intrusion has been used to determine thecapillary pressure vs. liquid saturation curves for differentGDL materials9,10, providing pore volume distributions inthese materials that are useful for design of new materials.The liquid breakthrough measurements are more useful to elu-cidate the rate of liquid water flow through the GDL. Only afew models have been published recently that account forpreferential water flow through certain pores, even though thisdrastically changes the physics of how water is transportedbetween the cathode catalyst layer and flow channel.1–3,8
This article contains supplementary material available via the Internet at http://www.interscience.wiley.com/jpages/0001-1541/suppmatCorrespondence concerning this article should be addressed to J. B. Benziger at
� 2008 American Institute of Chemical Engineers
AIChE Journal May 2008 Vol. 54, No. 5 1313
Liquid water has been observed to accumulate in gas flowchannels, which has spawned the development of models fortwo-phase gas/liquid flow in the flow channels. Severalresearchers have built visualization fuel cells making use ofneutron or optical imaging. Neutron imaging has been usedto study water distribution in operating fuel cells, usuallywith serpentine channels and accumulation of water at thecorners.11–15 Optical imaging of transparent fuel cells hasshown droplet growth and detachment, sometimes at preferen-tial locations, or the formation of a film of liquid water.16–21
Modeling efforts have focused on the transport of bulk waterin the channels22,23 or the conditions necessary to push liquiddroplets along the surface of the GDL,1,3,24,25 while othersassumed the liquid droplets are suspended in the gas as a mistand carried out in the gas flow.3 Another approach has been tobuild fuel cells with segmented electrodes to gain informationabout the current distribution over the active area of theMEA.26–30 In one case, the flow channels were transparent sothat condensation was observed in conjunction with distributionmeasurements.28 Still, although it has been inferred that differ-ences in the local currents are due to liquid water effects,direct correlations between liquid water build-up and dynamiccurrent data has not been reported.
There is still little information available about how liquidin the flow channels affects the local current density in PEMfuel cells. In practice, engineers have circumvented the prob-lem by increasing the gas flow rate until it is found sufficientto blow liquid out of the channels, decreasing the fuel utili-zation or adding the need for a recycling system. With theincreased convection of water out of the cell, this usuallycreates the need for humidifiers for the feed streams. Theresult is a more costly and complex system. However, bythoroughly studying the operation of a simple fuel cell, wehope to gain insight into how systems can be more cleverlydesigned.
In this article, we will show that liquid water in the cath-ode flow channel is responsible for inhibiting mass transportto the membrane/cathode interface. We shall show how liq-uid water permeates through GDL media and forms liquiddrops at the GDL/flow channel interface. Gravity or shearingaction from the gas flow overcomes the surface adhesion ofthe drop to the pore, detaching the drop and allowing thewater to move along the GDL surface. The drops accumulateand form slugs in the cathode gas flow channel. How andwhere this occurs in the cathode flow channel depends on
the orientation of the fuel cell with respect to gravity. Alter-ing the orientation and the direction of gas flows relative togravity controls where liquid water accumulates and altersthe local current in PEM fuel cells. Investigation of theseeffects has lead to observations of a variety of complexdynamic current outputs from a PEM fuel cell.
Experimental
GDL permeation
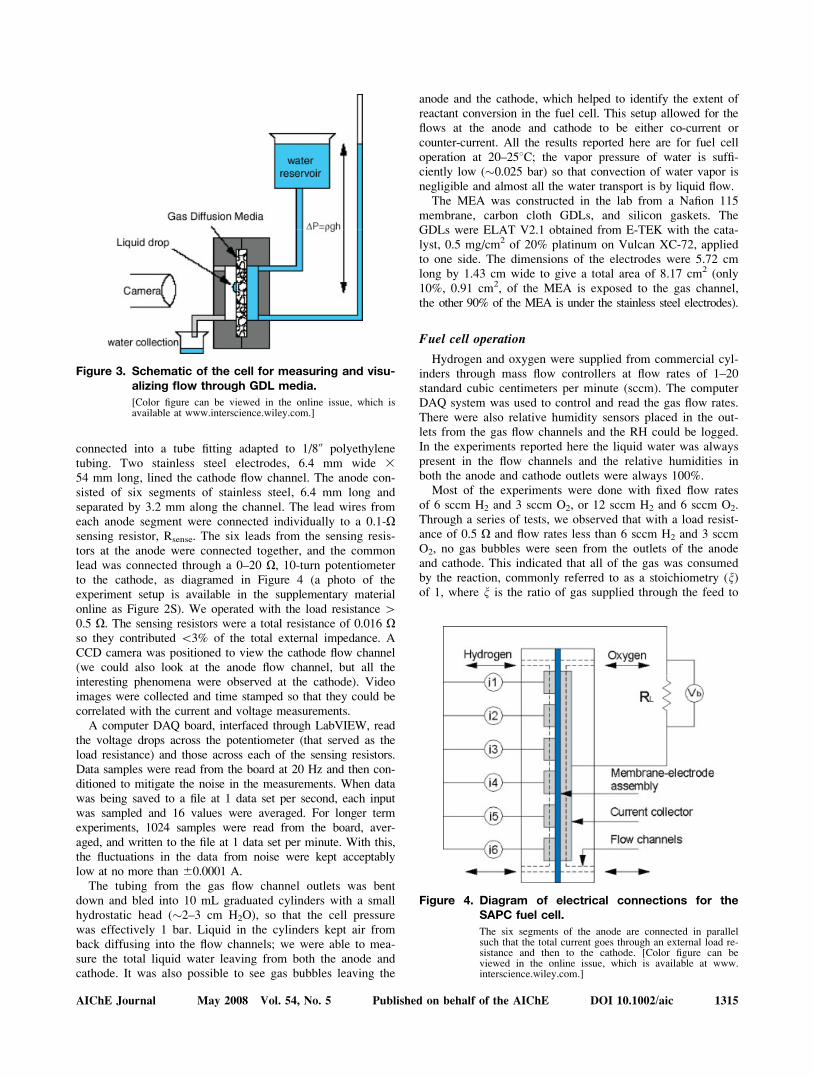
The flow through GDL media was tested in the cell illus-trated in Figure 3 (a photo of the experiment setup is avail-able in the supplementary material online as Figure 1S). Apiece of GDL media 2.5 cm in diameter was mountedbetween two polycarbonate plates with 3 cm3 plenums on ei-ther side of the GDL media. One plenum was connected to abeaker that acted as a liquid water reservoir. The beaker con-nected to the plenum with a Tygon1 tube and could beraised or lowered to a desired elevation relative to the cell.The plenum on the other side had an inlet for a slow streamof nitrogen at the top and an outlet at the bottom with theeffluent collected in a beaker on a scale. The gas side wasimaged with a Sony IEEE-1394 CCD color camera withMVO double gauss macrolenses and interfaced to a computerthrough a LabVIEW program.
Before every experiment, the GDL media was dried byflowing nitrogen through both sides of the cell for 2 h. Thewater reservoir was hooked up with it sitting below the cell.The water reservoir was then raised to a desired height andheld in position for 20 min, while recording the mass flowthrough the GDL media and obtaining video images of thewater drops forming on the surface of the GDL. We testedToray carbon paper and woven carbon cloth, both with 20%Teflon treatments and obtained from E-TEK (E-TEK Div. ofDe Nora N.A., NJ, USA).
Segmented anode fuel cell
The fuel cell tests were done using the segmented anodeparallel channel PEM fuel cell described elsewhere.31 Briefly,the particular fuel cell used in the experiments presentedhere consisted of two polycarbonate plates with flow chan-nels 1.6 mm wide 3 3.2 mm deep 3 75 mm long. Thedesign was such that the anode and cathode flow channelswere in a single plane and terminated in a 908 angle that
Figure 2. Hydraulic driven flow model of liquid waterflow in the GDL.
The liquid water only enters the largest pores after thehydrophobic surface tension is overcome. The small poresremain unobstructed for gas transport. The small pores ofthe GDL only fill if the entire gas flow channel fills withliquid and the water pushes into the pores. [Color figurecan be viewed in the online issue, which is available atwww.interscience.wiley.com.]
Figure 1. Capillary condensation model of pore flood-ing in the GDL.
This model assumes that liquid water condenses in thesmallest pores of the GDL and sequentially fills the small-est pores and then the larger pores. When liquid waterdrops appear in the gas flow channel the entire GDL willbe flooded. [Color figure can be viewed in the online issue,which is available at www.interscience.wiley.com.]
1314 DOI 10.1002/aic Published on behalf of the AIChE May 2008 Vol. 54, No. 5 AIChE Journal
connected into a tube fitting adapted to 1/8@ polyethylenetubing. Two stainless steel electrodes, 6.4 mm wide 354 mm long, lined the cathode flow channel. The anode con-sisted of six segments of stainless steel, 6.4 mm long andseparated by 3.2 mm along the channel. The lead wires fromeach anode segment were connected individually to a 0.1-Xsensing resistor, Rsense. The six leads from the sensing resis-tors at the anode were connected together, and the commonlead was connected through a 0–20 X, 10-turn potentiometerto the cathode, as diagramed in Figure 4 (a photo of theexperiment setup is available in the supplementary materialonline as Figure 2S). We operated with the load resistance [0.5 X. The sensing resistors were a total resistance of 0.016 Xso they contributed \3% of the total external impedance. ACCD camera was positioned to view the cathode flow channel(we could also look at the anode flow channel, but all theinteresting phenomena were observed at the cathode). Videoimages were collected and time stamped so that they could becorrelated with the current and voltage measurements.
A computer DAQ board, interfaced through LabVIEW, readthe voltage drops across the potentiometer (that served as theload resistance) and those across each of the sensing resistors.Data samples were read from the board at 20 Hz and then con-ditioned to mitigate the noise in the measurements. When datawas being saved to a file at 1 data set per second, each inputwas sampled and 16 values were averaged. For longer termexperiments, 1024 samples were read from the board, aver-aged, and written to the file at 1 data set per minute. With this,the fluctuations in the data from noise were kept acceptablylow at no more than 60.0001 A.
The tubing from the gas flow channel outlets was bentdown and bled into 10 mL graduated cylinders with a smallhydrostatic head (�2–3 cm H2O), so that the cell pressurewas effectively 1 bar. Liquid in the cylinders kept air fromback diffusing into the flow channels; we were able to mea-sure the total liquid water leaving from both the anode andcathode. It was also possible to see gas bubbles leaving the
anode and the cathode, which helped to identify the extent ofreactant conversion in the fuel cell. This setup allowed for theflows at the anode and cathode to be either co-current orcounter-current. All the results reported here are for fuel celloperation at 20–258C; the vapor pressure of water is suffi-ciently low (�0.025 bar) so that convection of water vapor isnegligible and almost all the water transport is by liquid flow.
The MEA was constructed in the lab from a Nafion 115membrane, carbon cloth GDLs, and silicon gaskets. TheGDLs were ELAT V2.1 obtained from E-TEK with the cata-lyst, 0.5 mg/cm2 of 20% platinum on Vulcan XC-72, appliedto one side. The dimensions of the electrodes were 5.72 cmlong by 1.43 cm wide to give a total area of 8.17 cm2 (only10%, 0.91 cm2, of the MEA is exposed to the gas channel,the other 90% of the MEA is under the stainless steel electrodes).
Fuel cell operation
Hydrogen and oxygen were supplied from commercial cyl-inders through mass flow controllers at flow rates of 1–20standard cubic centimeters per minute (sccm). The computerDAQ system was used to control and read the gas flow rates.There were also relative humidity sensors placed in the out-lets from the gas flow channels and the RH could be logged.In the experiments reported here the liquid water was alwayspresent in the flow channels and the relative humidities inboth the anode and cathode outlets were always 100%.
Most of the experiments were done with fixed flow ratesof 6 sccm H2 and 3 sccm O2, or 12 sccm H2 and 6 sccm O2.Through a series of tests, we observed that with a load resist-ance of 0.5 X and flow rates less than 6 sccm H2 and 3 sccmO2, no gas bubbles were seen from the outlets of the anodeand cathode. This indicated that all of the gas was consumedby the reaction, commonly referred to as a stoichiometry (n)of 1, where n is the ratio of gas supplied through the feed to
Figure 3. Schematic of the cell for measuring and visu-alizing flow through GDL media.
[Color figure can be viewed in the online issue, which isavailable at www.interscience.wiley.com.]
Figure 4. Diagram of electrical connections for theSAPC fuel cell.
The six segments of the anode are connected in parallelsuch that the total current goes through an external load re-sistance and then to the cathode. [Color figure can beviewed in the online issue, which is available at www.interscience.wiley.com.]
AIChE Journal May 2008 Vol. 54, No. 5 Published on behalf of the AIChE DOI 10.1002/aic 1315
that consumed by the fuel cell with the given current. Whenwe increased the flow rates to 7 sccm H2 and 3.5 sccm O2 orgreater, gas bubbles were seen from the outlets of the anodeand cathode. We will refer to the inlet flow rates of 6 sccmH2 and 3 sccm O2 as n1, and 12 sccm H2 and 6 sccm O2 asn2. The maximum total current from the SAPC fuel cell driv-ing a 0.5 X load impedance at 258C and 1 bar total pressurewas �0.8–0.9 A. We found a variability in the internal resist-ance of about 10% from MEA to MEA, corresponding to avariability in the total current. The flow rates corresponding ton1 limit the maximum current to 0.8 A with complete conver-sion of the reactants. Increasing the reactant feed rate beyondn1 did not result in any substantial increase in the maximumtotal current from the SAPC fuel cell. Although it has beenreported that severe degradation of the catalyst can occurunder starved conditions,32–34 we did not observe any effectsthrough consecutive experiments with the same MEA. Wehave also run an autohumidified self-draining fuel cell underanode starved conditions for [1000 h with negligible changein the MEA performance.35 This is perhaps due to the choiceto let the fuel cell run autonomously under a constant load re-sistance without the addition of potentiostatic or galvanostaticcontrollers. Future work will investigate this further.
The experiments summarized here consist of a vast arrayof data. A typical data set consists of the six current meas-urements for the six anode segments, the voltage drop acrossthe load, anode and cathode flow rates, and the relative hu-midity in the anode and cathode effluent. This data isrecorded with a time stamp at a frequency of between 0.1and 1 Hz and stored as a data array. A typical experimentruns from 15,000 to 172,800 s. It is impossible to summarizeall the information contained in experiments in a few simplegraphs. We have chosen to highlight certain features of thedata. A database of excel files containing the data from allour vetted data (currently consisting of �100 files with aver-age size 20 MB) are available at our web site (http://pemfc.princeton.edu/data.html). Video images were selectivelyrecorded at various times during operation. The video imagesare time stamped and can be correlated with the Excel datafiles. The video images are also available.
Results
Flow through GDL media
No liquid water flows through the GDL media until a criti-cal hydrostatic pressure head is applied by raising the water
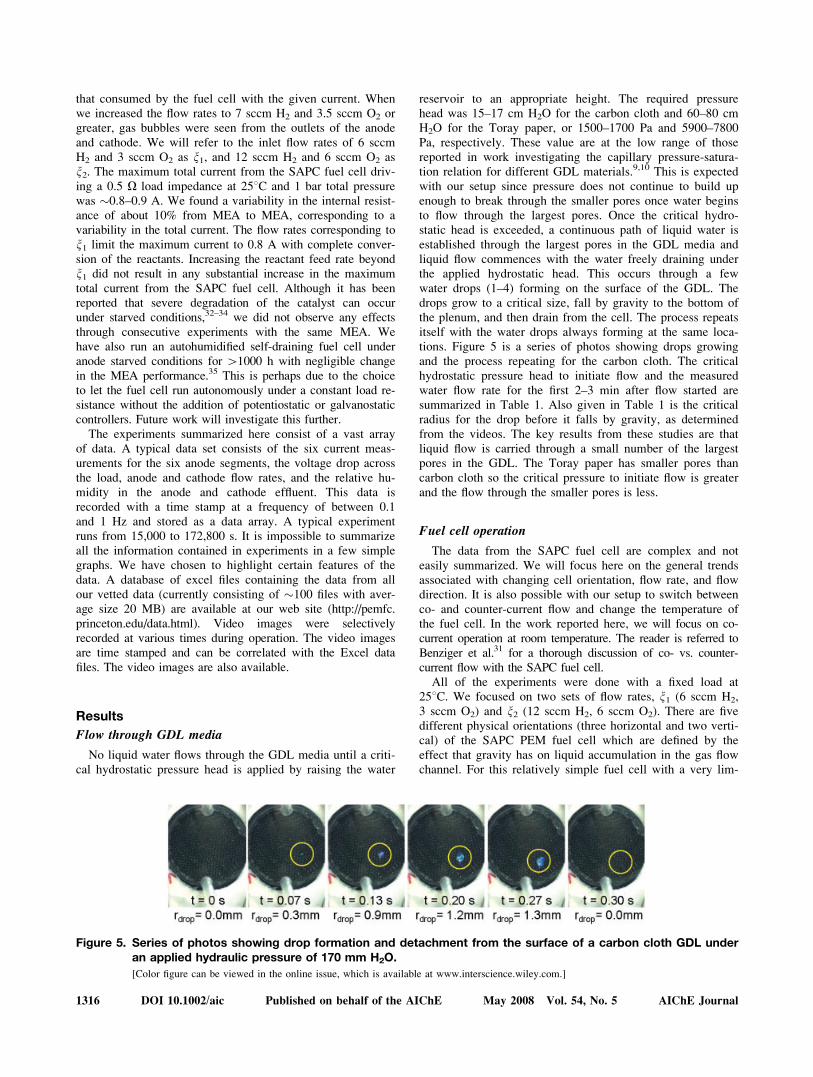
reservoir to an appropriate height. The required pressurehead was 15–17 cm H2O for the carbon cloth and 60–80 cmH2O for the Toray paper, or 1500–1700 Pa and 5900–7800Pa, respectively. These value are at the low range of thosereported in work investigating the capillary pressure-satura-tion relation for different GDL materials.9,10 This is expectedwith our setup since pressure does not continue to build upenough to break through the smaller pores once water beginsto flow through the largest pores. Once the critical hydro-static head is exceeded, a continuous path of liquid water isestablished through the largest pores in the GDL media andliquid flow commences with the water freely draining underthe applied hydrostatic head. This occurs through a fewwater drops (1–4) forming on the surface of the GDL. Thedrops grow to a critical size, fall by gravity to the bottom ofthe plenum, and then drain from the cell. The process repeatsitself with the water drops always forming at the same loca-tions. Figure 5 is a series of photos showing drops growingand the process repeating for the carbon cloth. The criticalhydrostatic pressure head to initiate flow and the measuredwater flow rate for the first 2–3 min after flow started aresummarized in Table 1. Also given in Table 1 is the criticalradius for the drop before it falls by gravity, as determinedfrom the videos. The key results from these studies are thatliquid flow is carried through a small number of the largestpores in the GDL. The Toray paper has smaller pores thancarbon cloth so the critical pressure to initiate flow is greaterand the flow through the smaller pores is less.
Fuel cell operation
The data from the SAPC fuel cell are complex and noteasily summarized. We will focus here on the general trendsassociated with changing cell orientation, flow rate, and flowdirection. It is also possible with our setup to switch betweenco- and counter-current flow and change the temperature ofthe fuel cell. In the work reported here, we will focus on co-current operation at room temperature. The reader is referred toBenziger et al.31 for a thorough discussion of co- vs. counter-current flow with the SAPC fuel cell.
All of the experiments were done with a fixed load at258C. We focused on two sets of flow rates, n1 (6 sccm H2,3 sccm O2) and n2 (12 sccm H2, 6 sccm O2). There are fivedifferent physical orientations (three horizontal and two verti-cal) of the SAPC PEM fuel cell which are defined by theeffect that gravity has on liquid accumulation in the gas flowchannel. For this relatively simple fuel cell with a very lim-
Figure 5. Series of photos showing drop formation and detachment from the surface of a carbon cloth GDL underan applied hydraulic pressure of 170 mm H2O.
[Color figure can be viewed in the online issue, which is available at www.interscience.wiley.com.]
1316 DOI 10.1002/aic Published on behalf of the AIChE May 2008 Vol. 54, No. 5 AIChE Journal
ited set of operating parameters (only one load, only onetemperature and two sets of flow rates) there are 20 differentexperimental systems under investigation. Of these 20, onlytwo can be characterized as having stable (time invariant)steady states. The other 18 configurations give rise to com-plex spatio-temporal patterns of current density. All the ex-perimental systems have been examined multiple times. Theresults presented in this article are representative, but thereader is referred to the data files available on our website tosee the full extent of spatio-temporal current density patterns.
The total area of each of the fuel cell flow channels is1.2 cm2 with a volume of 0.38 cm3. The maximum currentobtained with our membrane-electrode-assemblies was 0.85–0.9 A (current density of 0.94–0.99 A/cm2, based on theexposed MEA surface in the flow channels) with an externalload of 0.5 X. At a current of 0.9 A, the time for liquid waterto fill the cathode flow channel is 4000 s. All tests have beenrun for periods that last more than 10,000 s to make sure theliquid content in the flow channel has had time to equilibrate.
We will present the data in three formats. The most gen-eral presentation will be the currents in each electrode seg-ment as a function of time. This consists of a set of linegraphs, often truncated to represent a limited time period.Many of the experiments ran for over 100,000 s and the localcurrent variations occur on time scales from 1 to 104 s; timeslices are chosen to highlight specific characteristics of thecurrent density patterns. These figures also show the inletflow rates to the anode and cathode so it is possible to asso-ciate changes in the spatio-temporal current patterns withchanges in flow. A second presentation of the data is the cur-rent profiles along the length of the flow channel. Because ofthe time-varying nature of the current density, these wouldtypically be snap shots at a fixed moment in time. We haverepresented the current profiles as steady-state with error barsto denote the time-varying component. The third type of datapresentation is a correlation of current density as a functionof time along with a photographic sequence of water withinthe flow channel. The data collected from the SAPC fuel cellare much different than conventional I–V data reported forfuel cells, and the massive amount of information must bestudied to fully understand its presentation. The reader isalways welcome to view the raw data.
Horizontal configuration
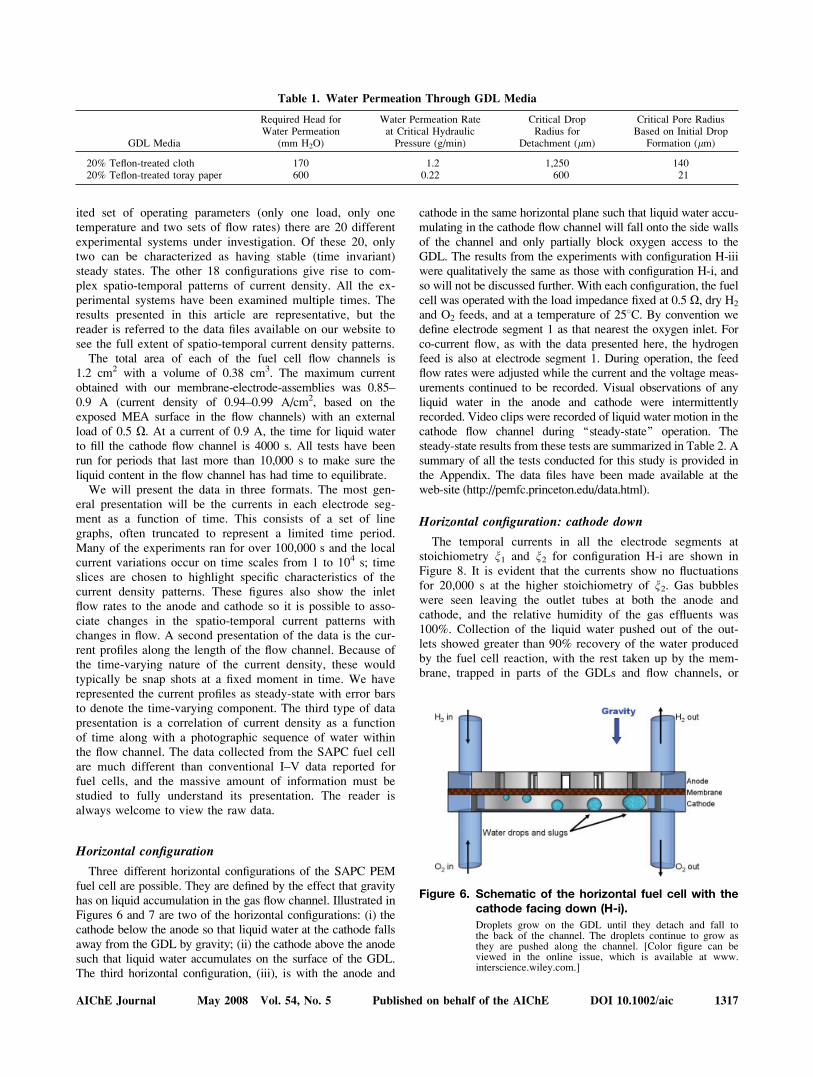
Three different horizontal configurations of the SAPC PEMfuel cell are possible. They are defined by the effect that gravityhas on liquid accumulation in the gas flow channel. Illustrated inFigures 6 and 7 are two of the horizontal configurations: (i) thecathode below the anode so that liquid water at the cathode fallsaway from the GDL by gravity; (ii) the cathode above the anodesuch that liquid water accumulates on the surface of the GDL.The third horizontal configuration, (iii), is with the anode and
cathode in the same horizontal plane such that liquid water accu-mulating in the cathode flow channel will fall onto the side wallsof the channel and only partially block oxygen access to theGDL. The results from the experiments with configuration H-iiiwere qualitatively the same as those with configuration H-i, andso will not be discussed further. With each configuration, the fuelcell was operated with the load impedance fixed at 0.5 X, dry H2
and O2 feeds, and at a temperature of 258C. By convention wedefine electrode segment 1 as that nearest the oxygen inlet. Forco-current flow, as with the data presented here, the hydrogenfeed is also at electrode segment 1. During operation, the feedflow rates were adjusted while the current and the voltage meas-urements continued to be recorded. Visual observations of anyliquid water in the anode and cathode were intermittentlyrecorded. Video clips were recorded of liquid water motion in thecathode flow channel during ‘‘steady-state’’ operation. Thesteady-state results from these tests are summarized in Table 2. Asummary of all the tests conducted for this study is provided inthe Appendix. The data files have been made available at theweb-site (http://pemfc.princeton.edu/data.html).
Horizontal configuration: cathode down
The temporal currents in all the electrode segments atstoichiometry n1 and n2 for configuration H-i are shown inFigure 8. It is evident that the currents show no fluctuationsfor 20,000 s at the higher stoichiometry of n2. Gas bubbleswere seen leaving the outlet tubes at both the anode andcathode, and the relative humidity of the gas effluents was100%. Collection of the liquid water pushed out of the out-lets showed greater than 90% recovery of the water producedby the fuel cell reaction, with the rest taken up by the mem-brane, trapped in parts of the GDLs and flow channels, or
Table 1. Water Permeation Through GDL Media
GDL Media
Required Head forWater Permeation
(mm H2O)
Water Permeation Rateat Critical HydraulicPressure (g/min)
Critical DropRadius for
Detachment (lm)
Critical Pore RadiusBased on Initial Drop
Formation (lm)
20% Teflon-treated cloth 170 1.2 1,250 14020% Teflon-treated toray paper 600 0.22 600 21
Figure 6. Schematic of the horizontal fuel cell with thecathode facing down (H-i).
Droplets grow on the GDL until they detach and fall tothe back of the channel. The droplets continue to grow asthey are pushed along the channel. [Color figure can beviewed in the online issue, which is available at www.interscience.wiley.com.]
AIChE Journal May 2008 Vol. 54, No. 5 Published on behalf of the AIChE DOI 10.1002/aic 1317
carried off as water vapor in the anode and cathode effluents.Furthermore, it was possible to routinely run the SAPC fuelcell in this configuration indefinitely with stable operation.
When the flow rates are reduced to n1, the electrode cur-rents immediately begin to show significant local current fluc-tuations, with the largest fluctuations seen at the electrode seg-ments furthest downstream. These erratic fluctuations persistedindefinitely. Observations of the cathode flow channel showedthat a liquid water slug was blocking the end of the channelwhen the current in segment 6 was low. When the slug waspushed into the effluent tube, the current increased. No gasbubbles were observed from the outlet tubes of the anode andthe cathode, indicating that all the feeds were consumed. Thedistribution of the current along the flow channel also shows asignificant change with the flow reduction. The currentsdecrease in electrode segments 5 and 6, as expected, becauseof depletion of the reactants downstream in the flow channel.The surprising result is that the currents increase in segments1 and 2 near the inlet to the flow channel. The response to thechange in the inlet flow rate occurred almost immediately andwas reversible. This suggests that these changes in current dis-tribution were produced from local variations in concentrationsof hydrogen and oxygen and were not directly related to localwater content in the GDL or membrane. In-plane currentsresulting from local variations in a fuel cell system have beenobserved in the bipolar plates of fuel cells stacks36,37 and in acell with segmented electrodes that were connected through abipolar plate.38 The large redistribution we observed was notexpected in our cell, though, because the segments are electri-cally isolated except through the GDL.
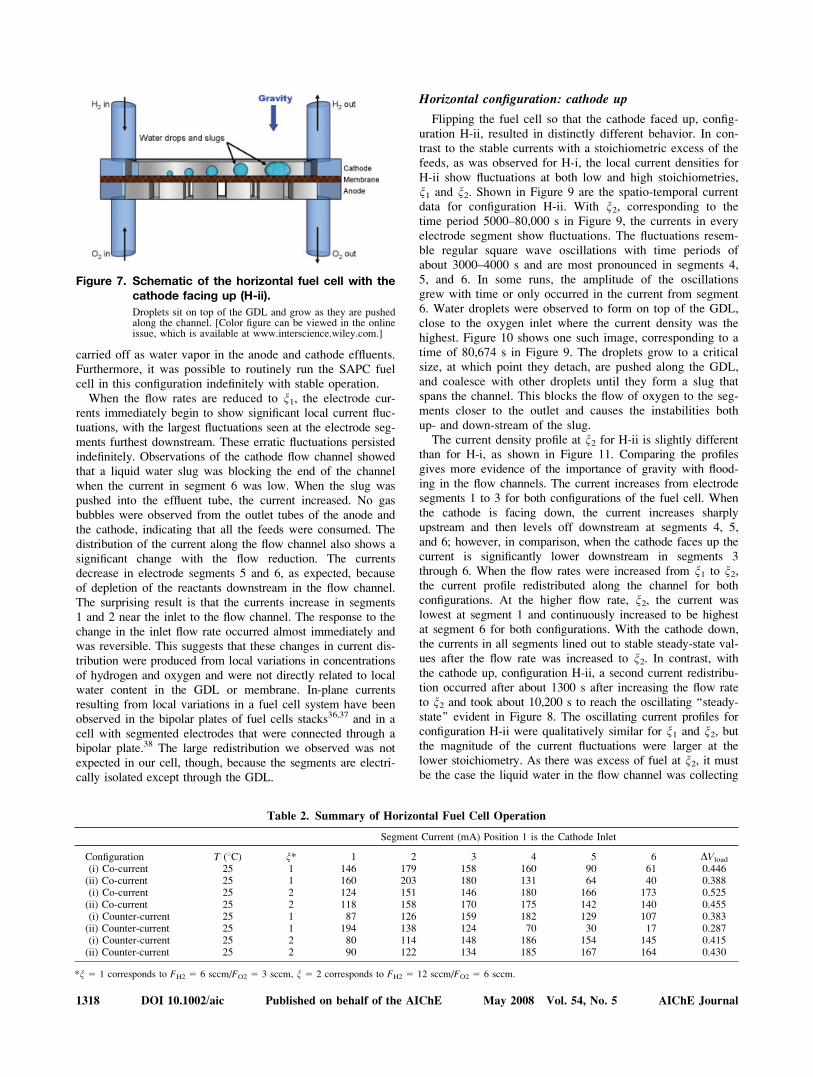
Horizontal configuration: cathode up
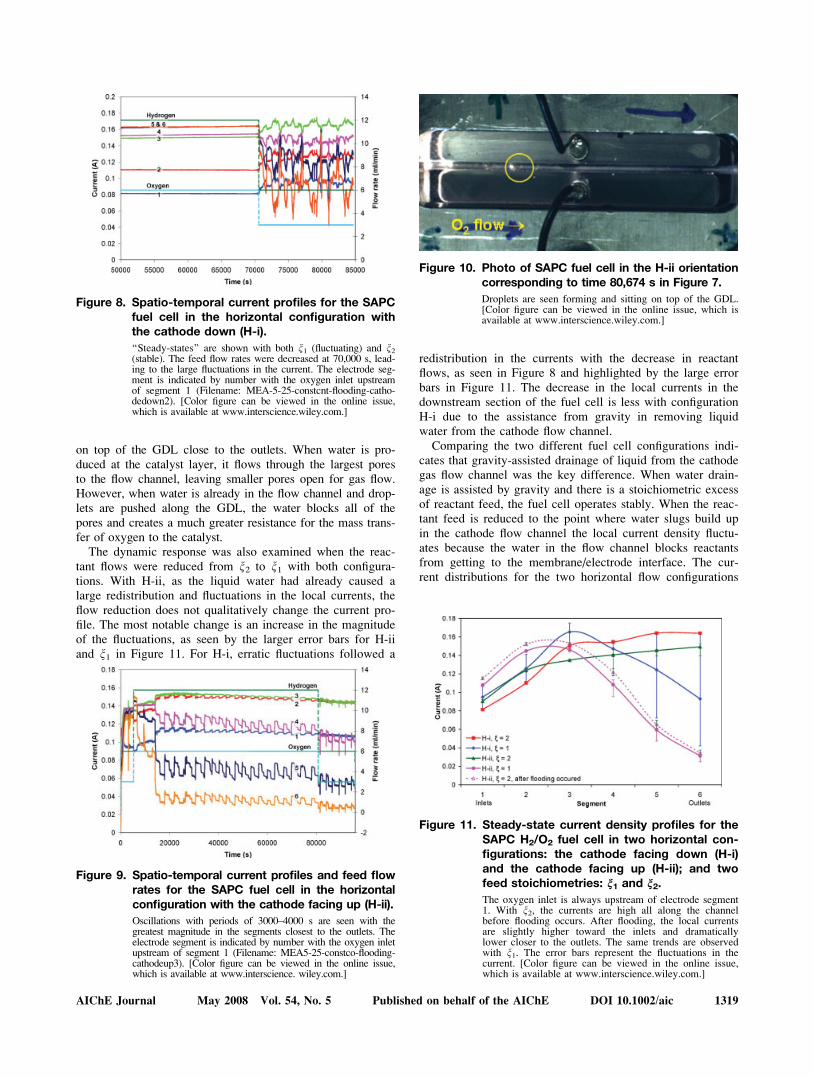
Flipping the fuel cell so that the cathode faced up, config-uration H-ii, resulted in distinctly different behavior. In con-trast to the stable currents with a stoichiometric excess of thefeeds, as was observed for H-i, the local current densities forH-ii show fluctuations at both low and high stoichiometries,n1 and n2. Shown in Figure 9 are the spatio-temporal currentdata for configuration H-ii. With n2, corresponding to thetime period 5000–80,000 s in Figure 9, the currents in everyelectrode segment show fluctuations. The fluctuations resem-ble regular square wave oscillations with time periods ofabout 3000–4000 s and are most pronounced in segments 4,5, and 6. In some runs, the amplitude of the oscillationsgrew with time or only occurred in the current from segment6. Water droplets were observed to form on top of the GDL,close to the oxygen inlet where the current density was thehighest. Figure 10 shows one such image, corresponding to atime of 80,674 s in Figure 9. The droplets grow to a criticalsize, at which point they detach, are pushed along the GDL,and coalesce with other droplets until they form a slug thatspans the channel. This blocks the flow of oxygen to the seg-ments closer to the outlet and causes the instabilities bothup- and down-stream of the slug.
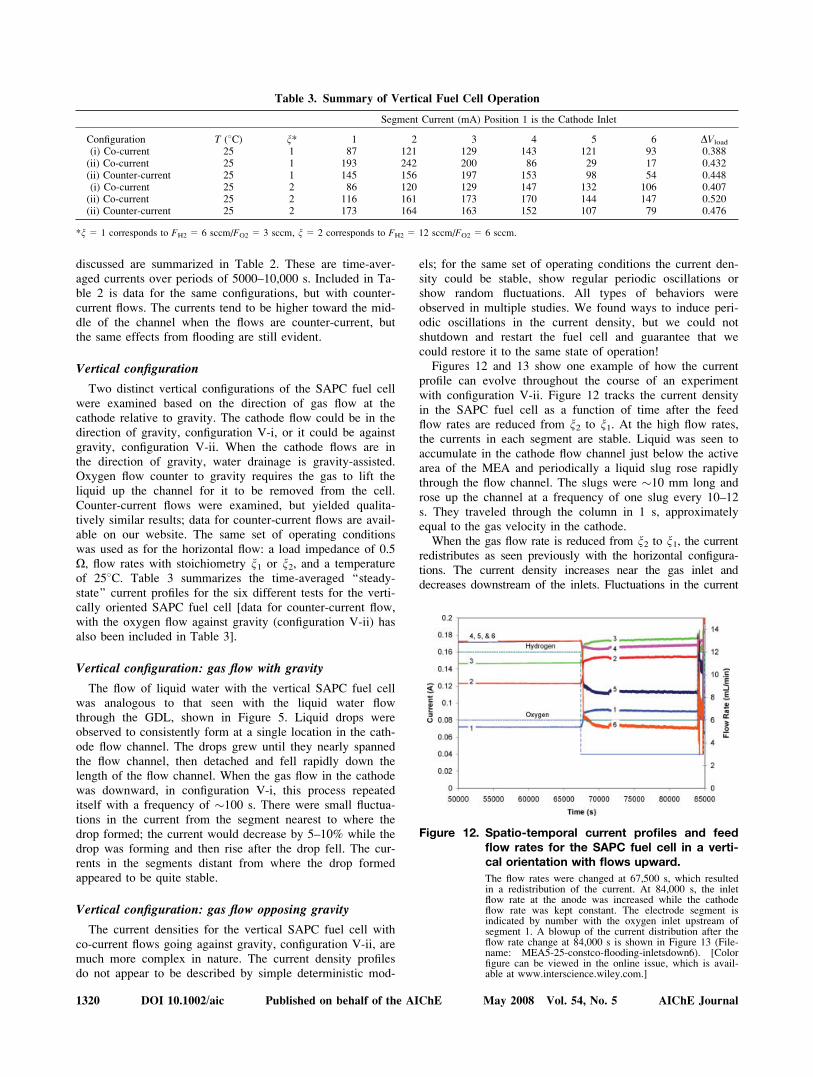
The current density profile at n2 for H-ii is slightly differentthan for H-i, as shown in Figure 11. Comparing the profilesgives more evidence of the importance of gravity with flood-ing in the flow channels. The current increases from electrodesegments 1 to 3 for both configurations of the fuel cell. Whenthe cathode is facing down, the current increases sharplyupstream and then levels off downstream at segments 4, 5,and 6; however, in comparison, when the cathode faces up thecurrent is significantly lower downstream in segments 3through 6. When the flow rates were increased from n1 to n2,the current profile redistributed along the channel for bothconfigurations. At the higher flow rate, n2, the current waslowest at segment 1 and continuously increased to be highestat segment 6 for both configurations. With the cathode down,the currents in all segments lined out to stable steady-state val-ues after the flow rate was increased to n2. In contrast, withthe cathode up, configuration H-ii, a second current redistribu-tion occurred after about 1300 s after increasing the flow rateto n2 and took about 10,200 s to reach the oscillating ‘‘steady-state’’ evident in Figure 8. The oscillating current profiles forconfiguration H-ii were qualitatively similar for n1 and n2, butthe magnitude of the current fluctuations were larger at thelower stoichiometry. As there was excess of fuel at n2, it mustbe the case the liquid water in the flow channel was collecting
Figure 7. Schematic of the horizontal fuel cell with thecathode facing up (H-ii).
Droplets sit on top of the GDL and grow as they are pushedalong the channel. [Color figure can be viewed in the onlineissue, which is available at www.interscience.wiley.com.]
Table 2. Summary of Horizontal Fuel Cell Operation
Segment Current (mA) Position 1 is the Cathode Inlet
Configuration T (8C) n* 1 2 3 4 5 6 DVload
(i) Co-current 25 1 146 179 158 160 90 61 0.446(ii) Co-current 25 1 160 203 180 131 64 40 0.388(i) Co-current 25 2 124 151 146 180 166 173 0.525(ii) Co-current 25 2 118 158 170 175 142 140 0.455(i) Counter-current 25 1 87 126 159 182 129 107 0.383(ii) Counter-current 25 1 194 138 124 70 30 17 0.287(i) Counter-current 25 2 80 114 148 186 154 145 0.415(ii) Counter-current 25 2 90 122 134 185 167 164 0.430
*n 5 1 corresponds to FH2 5 6 sccm/FO2 5 3 sccm, n 5 2 corresponds to FH2 5 12 sccm/FO2 5 6 sccm.
1318 DOI 10.1002/aic Published on behalf of the AIChE May 2008 Vol. 54, No. 5 AIChE Journal
on top of the GDL close to the outlets. When water is pro-duced at the catalyst layer, it flows through the largest poresto the flow channel, leaving smaller pores open for gas flow.However, when water is already in the flow channel and drop-lets are pushed along the GDL, the water blocks all of thepores and creates a much greater resistance for the mass trans-fer of oxygen to the catalyst.
The dynamic response was also examined when the reac-tant flows were reduced from n2 to n1 with both configura-tions. With H-ii, as the liquid water had already caused alarge redistribution and fluctuations in the local currents, theflow reduction does not qualitatively change the current pro-file. The most notable change is an increase in the magnitudeof the fluctuations, as seen by the larger error bars for H-iiand n1 in Figure 11. For H-i, erratic fluctuations followed a
redistribution in the currents with the decrease in reactantflows, as seen in Figure 8 and highlighted by the large errorbars in Figure 11. The decrease in the local currents in thedownstream section of the fuel cell is less with configurationH-i due to the assistance from gravity in removing liquidwater from the cathode flow channel.
Comparing the two different fuel cell configurations indi-cates that gravity-assisted drainage of liquid from the cathodegas flow channel was the key difference. When water drain-age is assisted by gravity and there is a stoichiometric excessof reactant feed, the fuel cell operates stably. When the reac-tant feed is reduced to the point where water slugs build upin the cathode flow channel the local current density fluctu-ates because the water in the flow channel blocks reactantsfrom getting to the membrane/electrode interface. The cur-rent distributions for the two horizontal flow configurations
Figure 8. Spatio-temporal current profiles for the SAPCfuel cell in the horizontal configuration withthe cathode down (H-i).
‘‘Steady-states’’ are shown with both n1 (fluctuating) and n2(stable). The feed flow rates were decreased at 70,000 s, lead-ing to the large fluctuations in the current. The electrode seg-ment is indicated by number with the oxygen inlet upstreamof segment 1 (Filename: MEA-5-25-constcnt-flooding-catho-dedown2). [Color figure can be viewed in the online issue,which is available at www.interscience.wiley.com.]
Figure 9. Spatio-temporal current profiles and feed flowrates for the SAPC fuel cell in the horizontalconfiguration with the cathode facing up (H-ii).
Oscillations with periods of 3000–4000 s are seen with thegreatest magnitude in the segments closest to the outlets. Theelectrode segment is indicated by number with the oxygen inletupstream of segment 1 (Filename: MEA5-25-constco-flooding-cathodeup3). [Color figure can be viewed in the online issue,which is available at www.interscience. wiley.com.]
Figure 10. Photo of SAPC fuel cell in the H-ii orientationcorresponding to time 80,674 s in Figure 7.
Droplets are seen forming and sitting on top of the GDL.[Color figure can be viewed in the online issue, which isavailable at www.interscience.wiley.com.]
Figure 11. Steady-state current density profiles for theSAPC H2/O2 fuel cell in two horizontal con-figurations: the cathode facing down (H-i)and the cathode facing up (H-ii); and twofeed stoichiometries: n1 and n2.
The oxygen inlet is always upstream of electrode segment1. With n2, the currents are high all along the channelbefore flooding occurs. After flooding, the local currentsare slightly higher toward the inlets and dramaticallylower closer to the outlets. The same trends are observedwith n1. The error bars represent the fluctuations in thecurrent. [Color figure can be viewed in the online issue,which is available at www.interscience.wiley.com.]
AIChE Journal May 2008 Vol. 54, No. 5 Published on behalf of the AIChE DOI 10.1002/aic 1319
discussed are summarized in Table 2. These are time-aver-aged currents over periods of 5000–10,000 s. Included in Ta-ble 2 is data for the same configurations, but with counter-current flows. The currents tend to be higher toward the mid-dle of the channel when the flows are counter-current, butthe same effects from flooding are still evident.
Vertical configuration
Two distinct vertical configurations of the SAPC fuel cellwere examined based on the direction of gas flow at thecathode relative to gravity. The cathode flow could be in thedirection of gravity, configuration V-i, or it could be againstgravity, configuration V-ii. When the cathode flows are inthe direction of gravity, water drainage is gravity-assisted.Oxygen flow counter to gravity requires the gas to lift theliquid up the channel for it to be removed from the cell.Counter-current flows were examined, but yielded qualita-tively similar results; data for counter-current flows are avail-able on our website. The same set of operating conditionswas used as for the horizontal flow: a load impedance of 0.5X, flow rates with stoichiometry n1 or n2, and a temperatureof 258C. Table 3 summarizes the time-averaged ‘‘steady-state’’ current profiles for the six different tests for the verti-cally oriented SAPC fuel cell [data for counter-current flow,with the oxygen flow against gravity (configuration V-ii) hasalso been included in Table 3].
Vertical configuration: gas flow with gravity
The flow of liquid water with the vertical SAPC fuel cellwas analogous to that seen with the liquid water flowthrough the GDL, shown in Figure 5. Liquid drops wereobserved to consistently form at a single location in the cath-ode flow channel. The drops grew until they nearly spannedthe flow channel, then detached and fell rapidly down thelength of the flow channel. When the gas flow in the cathodewas downward, in configuration V-i, this process repeateditself with a frequency of �100 s. There were small fluctua-tions in the current from the segment nearest to where thedrop formed; the current would decrease by 5–10% while thedrop was forming and then rise after the drop fell. The cur-rents in the segments distant from where the drop formedappeared to be quite stable.
Vertical configuration: gas flow opposing gravity
The current densities for the vertical SAPC fuel cell withco-current flows going against gravity, configuration V-ii, aremuch more complex in nature. The current density profilesdo not appear to be described by simple deterministic mod-
els; for the same set of operating conditions the current den-sity could be stable, show regular periodic oscillations orshow random fluctuations. All types of behaviors wereobserved in multiple studies. We found ways to induce peri-odic oscillations in the current density, but we could notshutdown and restart the fuel cell and guarantee that wecould restore it to the same state of operation!
Figures 12 and 13 show one example of how the currentprofile can evolve throughout the course of an experimentwith configuration V-ii. Figure 12 tracks the current densityin the SAPC fuel cell as a function of time after the feedflow rates are reduced from n2 to n1. At the high flow rates,the currents in each segment are stable. Liquid was seen toaccumulate in the cathode flow channel just below the activearea of the MEA and periodically a liquid slug rose rapidlythrough the flow channel. The slugs were �10 mm long androse up the channel at a frequency of one slug every 10–12s. They traveled through the column in 1 s, approximatelyequal to the gas velocity in the cathode.
When the gas flow rate is reduced from n2 to n1, the currentredistributes as seen previously with the horizontal configura-tions. The current density increases near the gas inlet anddecreases downstream of the inlets. Fluctuations in the current
Table 3. Summary of Vertical Fuel Cell Operation
Segment Current (mA) Position 1 is the Cathode Inlet
Configuration T (8C) n* 1 2 3 4 5 6 DVload
(i) Co-current 25 1 87 121 129 143 121 93 0.388(ii) Co-current 25 1 193 242 200 86 29 17 0.432(ii) Counter-current 25 1 145 156 197 153 98 54 0.448(i) Co-current 25 2 86 120 129 147 132 106 0.407(ii) Co-current 25 2 116 161 173 170 144 147 0.520(ii) Counter-current 25 2 173 164 163 152 107 79 0.476
*n 5 1 corresponds to FH2 5 6 sccm/FO2 5 3 sccm, n 5 2 corresponds to FH2 5 12 sccm/FO2 5 6 sccm.
Figure 12. Spatio-temporal current profiles and feedflow rates for the SAPC fuel cell in a verti-cal orientation with flows upward.
The flow rates were changed at 67,500 s, which resultedin a redistribution of the current. At 84,000 s, the inletflow rate at the anode was increased while the cathodeflow rate was kept constant. The electrode segment isindicated by number with the oxygen inlet upstream ofsegment 1. A blowup of the current distribution after theflow rate change at 84,000 s is shown in Figure 13 (File-name: MEA5-25-constco-flooding-inletsdown6). [Colorfigure can be viewed in the online issue, which is avail-able at www.interscience.wiley.com.]
1320 DOI 10.1002/aic Published on behalf of the AIChE May 2008 Vol. 54, No. 5 AIChE Journal
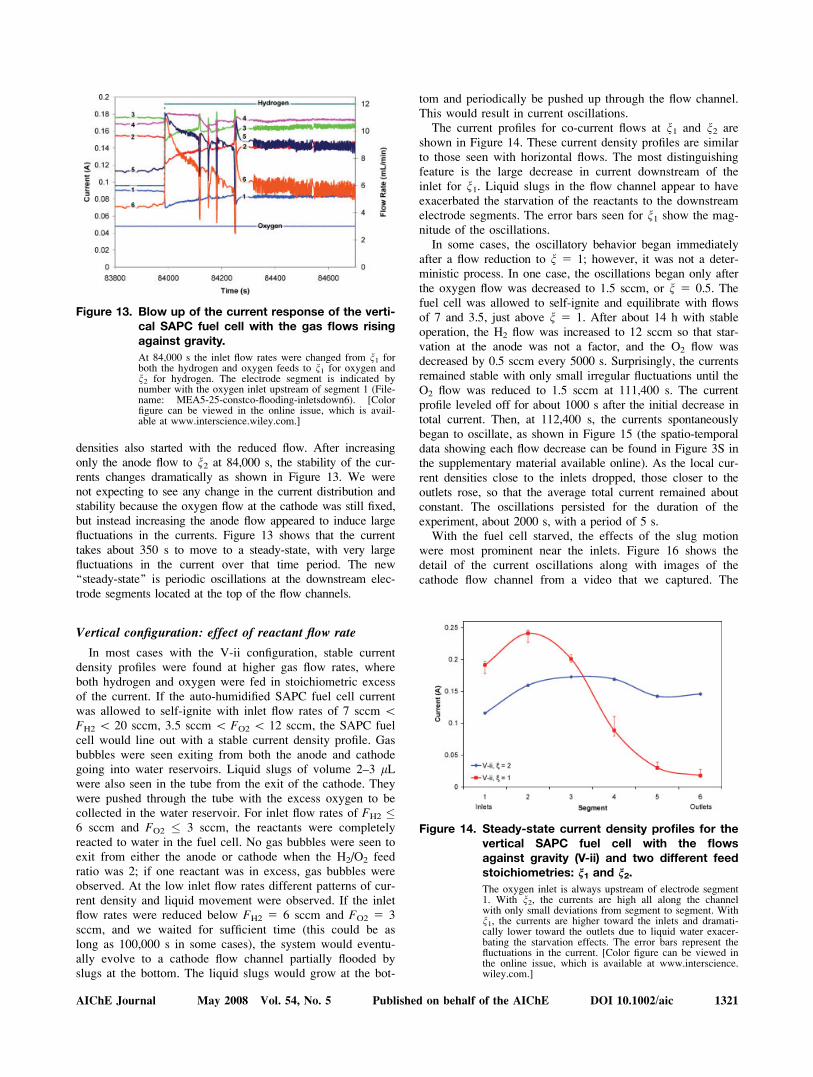
densities also started with the reduced flow. After increasingonly the anode flow to n2 at 84,000 s, the stability of the cur-rents changes dramatically as shown in Figure 13. We werenot expecting to see any change in the current distribution andstability because the oxygen flow at the cathode was still fixed,but instead increasing the anode flow appeared to induce largefluctuations in the currents. Figure 13 shows that the currenttakes about 350 s to move to a steady-state, with very largefluctuations in the current over that time period. The new‘‘steady-state’’ is periodic oscillations at the downstream elec-trode segments located at the top of the flow channels.
Vertical configuration: effect of reactant flow rate
In most cases with the V-ii configuration, stable currentdensity profiles were found at higher gas flow rates, whereboth hydrogen and oxygen were fed in stoichiometric excessof the current. If the auto-humidified SAPC fuel cell currentwas allowed to self-ignite with inlet flow rates of 7 sccm \FH2 \ 20 sccm, 3.5 sccm \ FO2 \ 12 sccm, the SAPC fuelcell would line out with a stable current density profile. Gasbubbles were seen exiting from both the anode and cathodegoing into water reservoirs. Liquid slugs of volume 2–3 lLwere also seen in the tube from the exit of the cathode. Theywere pushed through the tube with the excess oxygen to becollected in the water reservoir. For inlet flow rates of FH2 �6 sccm and FO2 � 3 sccm, the reactants were completelyreacted to water in the fuel cell. No gas bubbles were seen toexit from either the anode or cathode when the H2/O2 feedratio was 2; if one reactant was in excess, gas bubbles wereobserved. At the low inlet flow rates different patterns of cur-rent density and liquid movement were observed. If the inletflow rates were reduced below FH2 5 6 sccm and FO2 5 3sccm, and we waited for sufficient time (this could be aslong as 100,000 s in some cases), the system would eventu-ally evolve to a cathode flow channel partially flooded byslugs at the bottom. The liquid slugs would grow at the bot-
tom and periodically be pushed up through the flow channel.This would result in current oscillations.
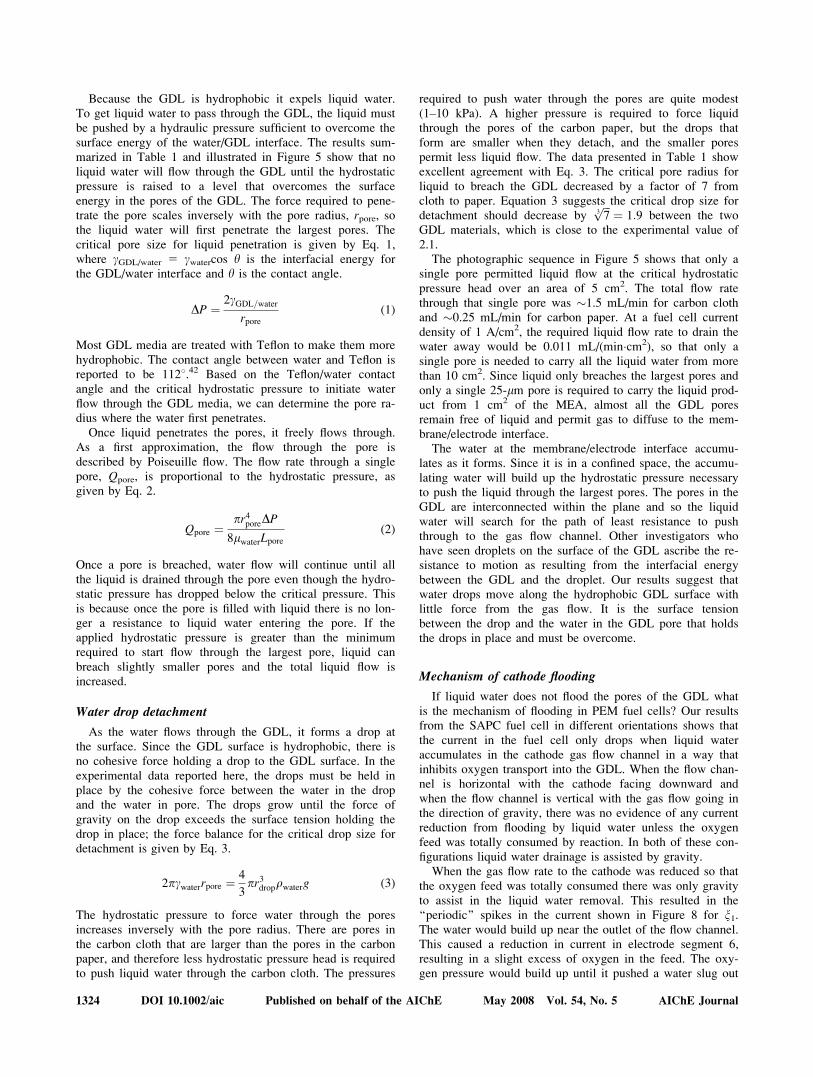
The current profiles for co-current flows at n1 and n2 areshown in Figure 14. These current density profiles are similarto those seen with horizontal flows. The most distinguishingfeature is the large decrease in current downstream of theinlet for n1. Liquid slugs in the flow channel appear to haveexacerbated the starvation of the reactants to the downstreamelectrode segments. The error bars seen for n1 show the mag-nitude of the oscillations.
In some cases, the oscillatory behavior began immediatelyafter a flow reduction to n 5 1; however, it was not a deter-ministic process. In one case, the oscillations began only afterthe oxygen flow was decreased to 1.5 sccm, or n 5 0.5. Thefuel cell was allowed to self-ignite and equilibrate with flowsof 7 and 3.5, just above n 5 1. After about 14 h with stableoperation, the H2 flow was increased to 12 sccm so that star-vation at the anode was not a factor, and the O2 flow wasdecreased by 0.5 sccm every 5000 s. Surprisingly, the currentsremained stable with only small irregular fluctuations until theO2 flow was reduced to 1.5 sccm at 111,400 s. The currentprofile leveled off for about 1000 s after the initial decrease intotal current. Then, at 112,400 s, the currents spontaneouslybegan to oscillate, as shown in Figure 15 (the spatio-temporaldata showing each flow decrease can be found in Figure 3S inthe supplementary material available online). As the local cur-rent densities close to the inlets dropped, those closer to theoutlets rose, so that the average total current remained aboutconstant. The oscillations persisted for the duration of theexperiment, about 2000 s, with a period of 5 s.
With the fuel cell starved, the effects of the slug motionwere most prominent near the inlets. Figure 16 shows thedetail of the current oscillations along with images of thecathode flow channel from a video that we captured. The
Figure 13. Blow up of the current response of the verti-cal SAPC fuel cell with the gas flows risingagainst gravity.
At 84,000 s the inlet flow rates were changed from n1 forboth the hydrogen and oxygen feeds to n1 for oxygen andn2 for hydrogen. The electrode segment is indicated bynumber with the oxygen inlet upstream of segment 1 (File-name: MEA5-25-constco-flooding-inletsdown6). [Colorfigure can be viewed in the online issue, which is avail-able at www.interscience.wiley.com.]
Figure 14. Steady-state current density profiles for thevertical SAPC fuel cell with the flowsagainst gravity (V-ii) and two different feedstoichiometries: n1 and n2.
The oxygen inlet is always upstream of electrode segment1. With n2, the currents are high all along the channelwith only small deviations from segment to segment. Withn1, the currents are higher toward the inlets and dramati-cally lower toward the outlets due to liquid water exacer-bating the starvation effects. The error bars represent thefluctuations in the current. [Color figure can be viewed inthe online issue, which is available at www.interscience.wiley.com.]
AIChE Journal May 2008 Vol. 54, No. 5 Published on behalf of the AIChE DOI 10.1002/aic 1321
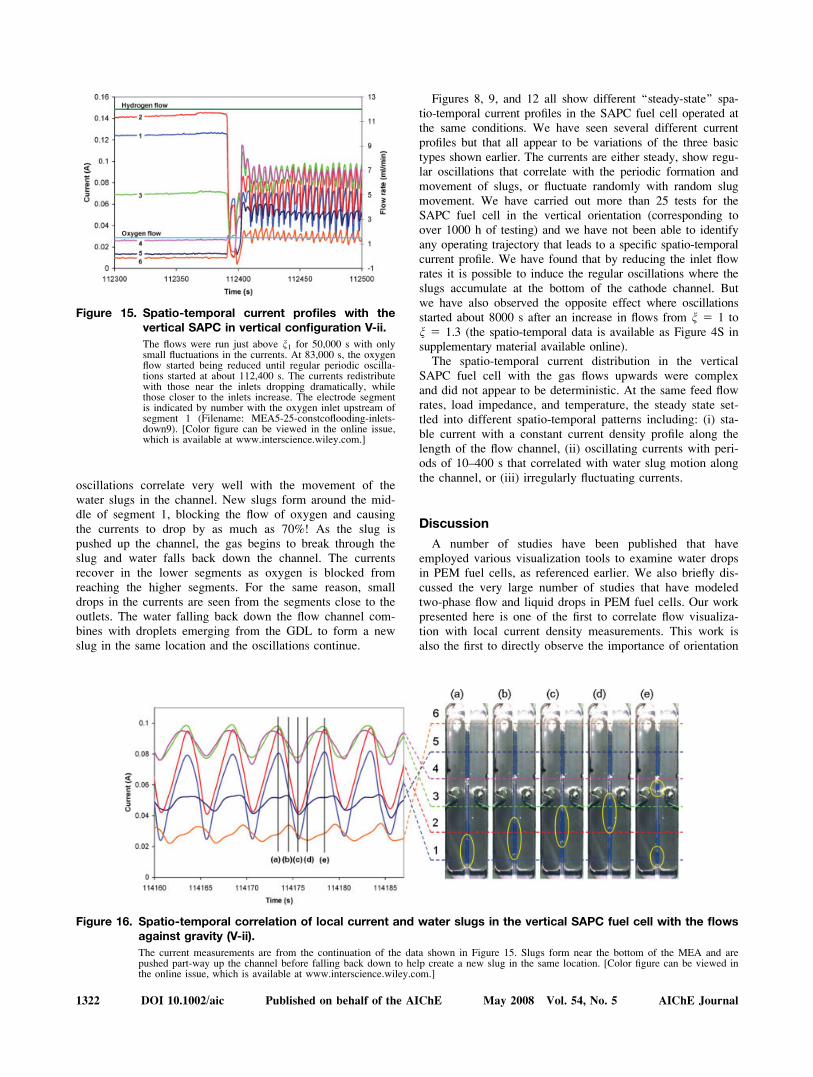
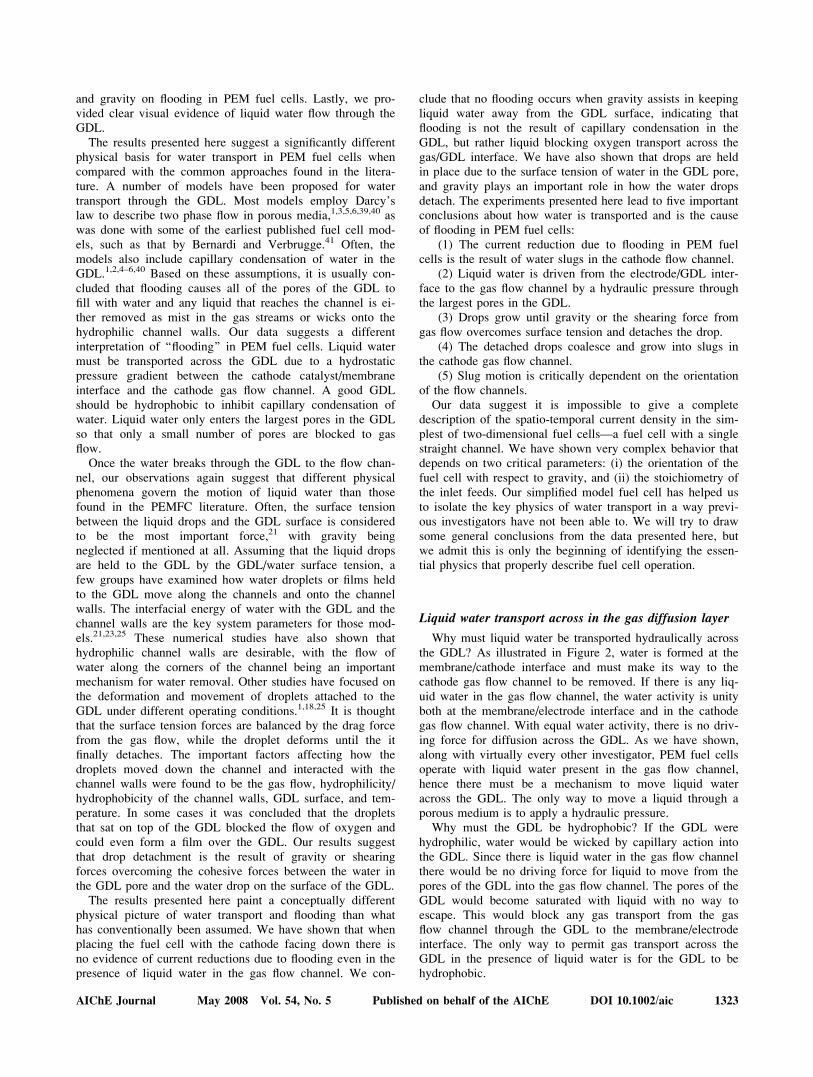
oscillations correlate very well with the movement of thewater slugs in the channel. New slugs form around the mid-dle of segment 1, blocking the flow of oxygen and causingthe currents to drop by as much as 70%! As the slug ispushed up the channel, the gas begins to break through theslug and water falls back down the channel. The currentsrecover in the lower segments as oxygen is blocked fromreaching the higher segments. For the same reason, smalldrops in the currents are seen from the segments close to theoutlets. The water falling back down the flow channel com-bines with droplets emerging from the GDL to form a newslug in the same location and the oscillations continue.
Figures 8, 9, and 12 all show different ‘‘steady-state’’ spa-tio-temporal current profiles in the SAPC fuel cell operated atthe same conditions. We have seen several different currentprofiles but that all appear to be variations of the three basictypes shown earlier. The currents are either steady, show regu-lar oscillations that correlate with the periodic formation andmovement of slugs, or fluctuate randomly with random slugmovement. We have carried out more than 25 tests for theSAPC fuel cell in the vertical orientation (corresponding toover 1000 h of testing) and we have not been able to identifyany operating trajectory that leads to a specific spatio-temporalcurrent profile. We have found that by reducing the inlet flowrates it is possible to induce the regular oscillations where theslugs accumulate at the bottom of the cathode channel. Butwe have also observed the opposite effect where oscillationsstarted about 8000 s after an increase in flows from n 5 1 ton 5 1.3 (the spatio-temporal data is available as Figure 4S insupplementary material available online).
The spatio-temporal current distribution in the verticalSAPC fuel cell with the gas flows upwards were complexand did not appear to be deterministic. At the same feed flowrates, load impedance, and temperature, the steady state set-tled into different spatio-temporal patterns including: (i) sta-ble current with a constant current density profile along thelength of the flow channel, (ii) oscillating currents with peri-ods of 10–400 s that correlated with water slug motion alongthe channel, or (iii) irregularly fluctuating currents.
Discussion
A number of studies have been published that haveemployed various visualization tools to examine water dropsin PEM fuel cells, as referenced earlier. We also briefly dis-cussed the very large number of studies that have modeledtwo-phase flow and liquid drops in PEM fuel cells. Our workpresented here is one of the first to correlate flow visualiza-tion with local current density measurements. This work isalso the first to directly observe the importance of orientation
Figure 15. Spatio-temporal current profiles with thevertical SAPC in vertical configuration V-ii.
The flows were run just above n1 for 50,000 s with onlysmall fluctuations in the currents. At 83,000 s, the oxygenflow started being reduced until regular periodic oscilla-tions started at about 112,400 s. The currents redistributewith those near the inlets dropping dramatically, whilethose closer to the inlets increase. The electrode segmentis indicated by number with the oxygen inlet upstream ofsegment 1 (Filename: MEA5-25-constcoflooding-inlets-down9). [Color figure can be viewed in the online issue,which is available at www.interscience.wiley.com.]
Figure 16. Spatio-temporal correlation of local current and water slugs in the vertical SAPC fuel cell with the flowsagainst gravity (V-ii).
The current measurements are from the continuation of the data shown in Figure 15. Slugs form near the bottom of the MEA and arepushed part-way up the channel before falling back down to help create a new slug in the same location. [Color figure can be viewed inthe online issue, which is available at www.interscience.wiley.com.]
1322 DOI 10.1002/aic Published on behalf of the AIChE May 2008 Vol. 54, No. 5 AIChE Journal
and gravity on flooding in PEM fuel cells. Lastly, we pro-vided clear visual evidence of liquid water flow through theGDL.
The results presented here suggest a significantly differentphysical basis for water transport in PEM fuel cells whencompared with the common approaches found in the litera-ture. A number of models have been proposed for watertransport through the GDL. Most models employ Darcy’slaw to describe two phase flow in porous media,1,3,5,6,39,40 aswas done with some of the earliest published fuel cell mod-els, such as that by Bernardi and Verbrugge.41 Often, themodels also include capillary condensation of water in theGDL.1,2,4–6,40 Based on these assumptions, it is usually con-cluded that flooding causes all of the pores of the GDL tofill with water and any liquid that reaches the channel is ei-ther removed as mist in the gas streams or wicks onto thehydrophilic channel walls. Our data suggests a differentinterpretation of ‘‘flooding’’ in PEM fuel cells. Liquid watermust be transported across the GDL due to a hydrostaticpressure gradient between the cathode catalyst/membraneinterface and the cathode gas flow channel. A good GDLshould be hydrophobic to inhibit capillary condensation ofwater. Liquid water only enters the largest pores in the GDLso that only a small number of pores are blocked to gasflow.
Once the water breaks through the GDL to the flow chan-nel, our observations again suggest that different physicalphenomena govern the motion of liquid water than thosefound in the PEMFC literature. Often, the surface tensionbetween the liquid drops and the GDL surface is consideredto be the most important force,21 with gravity beingneglected if mentioned at all. Assuming that the liquid dropsare held to the GDL by the GDL/water surface tension, afew groups have examined how water droplets or films heldto the GDL move along the channels and onto the channelwalls. The interfacial energy of water with the GDL and thechannel walls are the key system parameters for those mod-els.21,23,25 These numerical studies have also shown thathydrophilic channel walls are desirable, with the flow ofwater along the corners of the channel being an importantmechanism for water removal. Other studies have focused onthe deformation and movement of droplets attached to theGDL under different operating conditions.1,18,25 It is thoughtthat the surface tension forces are balanced by the drag forcefrom the gas flow, while the droplet deforms until the itfinally detaches. The important factors affecting how thedroplets moved down the channel and interacted with thechannel walls were found to be the gas flow, hydrophilicity/hydrophobicity of the channel walls, GDL surface, and tem-perature. In some cases it was concluded that the dropletsthat sat on top of the GDL blocked the flow of oxygen andcould even form a film over the GDL. Our results suggestthat drop detachment is the result of gravity or shearingforces overcoming the cohesive forces between the water inthe GDL pore and the water drop on the surface of the GDL.
The results presented here paint a conceptually differentphysical picture of water transport and flooding than whathas conventionally been assumed. We have shown that whenplacing the fuel cell with the cathode facing down there isno evidence of current reductions due to flooding even in thepresence of liquid water in the gas flow channel. We con-
clude that no flooding occurs when gravity assists in keepingliquid water away from the GDL surface, indicating thatflooding is not the result of capillary condensation in theGDL, but rather liquid blocking oxygen transport across thegas/GDL interface. We have also shown that drops are heldin place due to the surface tension of water in the GDL pore,and gravity plays an important role in how the water dropsdetach. The experiments presented here lead to five importantconclusions about how water is transported and is the causeof flooding in PEM fuel cells:
(1) The current reduction due to flooding in PEM fuelcells is the result of water slugs in the cathode flow channel.
(2) Liquid water is driven from the electrode/GDL inter-face to the gas flow channel by a hydraulic pressure throughthe largest pores in the GDL.
(3) Drops grow until gravity or the shearing force fromgas flow overcomes surface tension and detaches the drop.
(4) The detached drops coalesce and grow into slugs inthe cathode gas flow channel.
(5) Slug motion is critically dependent on the orientationof the flow channels.
Our data suggest it is impossible to give a completedescription of the spatio-temporal current density in the sim-plest of two-dimensional fuel cells—a fuel cell with a singlestraight channel. We have shown very complex behavior thatdepends on two critical parameters: (i) the orientation of thefuel cell with respect to gravity, and (ii) the stoichiometry ofthe inlet feeds. Our simplified model fuel cell has helped usto isolate the key physics of water transport in a way previ-ous investigators have not been able to. We will try to drawsome general conclusions from the data presented here, butwe admit this is only the beginning of identifying the essen-tial physics that properly describe fuel cell operation.
Liquid water transport across in the gas diffusion layer
Why must liquid water be transported hydraulically acrossthe GDL? As illustrated in Figure 2, water is formed at themembrane/cathode interface and must make its way to thecathode gas flow channel to be removed. If there is any liq-uid water in the gas flow channel, the water activity is unityboth at the membrane/electrode interface and in the cathodegas flow channel. With equal water activity, there is no driv-ing force for diffusion across the GDL. As we have shown,along with virtually every other investigator, PEM fuel cellsoperate with liquid water present in the gas flow channel,hence there must be a mechanism to move liquid wateracross the GDL. The only way to move a liquid through aporous medium is to apply a hydraulic pressure.
Why must the GDL be hydrophobic? If the GDL werehydrophilic, water would be wicked by capillary action intothe GDL. Since there is liquid water in the gas flow channelthere would be no driving force for liquid to move from thepores of the GDL into the gas flow channel. The pores of theGDL would become saturated with liquid with no way toescape. This would block any gas transport from the gasflow channel through the GDL to the membrane/electrodeinterface. The only way to permit gas transport across theGDL in the presence of liquid water is for the GDL to behydrophobic.
AIChE Journal May 2008 Vol. 54, No. 5 Published on behalf of the AIChE DOI 10.1002/aic 1323
Because the GDL is hydrophobic it expels liquid water.To get liquid water to pass through the GDL, the liquid mustbe pushed by a hydraulic pressure sufficient to overcome thesurface energy of the water/GDL interface. The results sum-marized in Table 1 and illustrated in Figure 5 show that noliquid water will flow through the GDL until the hydrostaticpressure is raised to a level that overcomes the surfaceenergy in the pores of the GDL. The force required to pene-trate the pore scales inversely with the pore radius, rpore, sothe liquid water will first penetrate the largest pores. Thecritical pore size for liquid penetration is given by Eq. 1,where cGDL/water 5 cwatercos h is the interfacial energy forthe GDL/water interface and h is the contact angle.
DP ¼ 2cGDL=waterrpore
(1)
Most GDL media are treated with Teflon to make them morehydrophobic. The contact angle between water and Teflon isreported to be 1128.42 Based on the Teflon/water contactangle and the critical hydrostatic pressure to initiate waterflow through the GDL media, we can determine the pore ra-dius where the water first penetrates.
Once liquid penetrates the pores, it freely flows through.As a first approximation, the flow through the pore isdescribed by Poiseuille flow. The flow rate through a singlepore, Qpore, is proportional to the hydrostatic pressure, asgiven by Eq. 2.
Qpore ¼pr4poreDP
8lwaterLpore(2)
Once a pore is breached, water flow will continue until allthe liquid is drained through the pore even though the hydro-static pressure has dropped below the critical pressure. Thisis because once the pore is filled with liquid there is no lon-ger a resistance to liquid water entering the pore. If theapplied hydrostatic pressure is greater than the minimumrequired to start flow through the largest pore, liquid canbreach slightly smaller pores and the total liquid flow isincreased.
Water drop detachment
As the water flows through the GDL, it forms a drop atthe surface. Since the GDL surface is hydrophobic, there isno cohesive force holding a drop to the GDL surface. In theexperimental data reported here, the drops must be held inplace by the cohesive force between the water in the dropand the water in pore. The drops grow until the force ofgravity on the drop exceeds the surface tension holding thedrop in place; the force balance for the critical drop size fordetachment is given by Eq. 3.
2pcwaterrpore ¼4
3pr3dropqwaterg (3)
The hydrostatic pressure to force water through the poresincreases inversely with the pore radius. There are pores inthe carbon cloth that are larger than the pores in the carbonpaper, and therefore less hydrostatic pressure head is requiredto push liquid water through the carbon cloth. The pressures
required to push water through the pores are quite modest(1–10 kPa). A higher pressure is required to force liquidthrough the pores of the carbon paper, but the drops thatform are smaller when they detach, and the smaller porespermit less liquid flow. The data presented in Table 1 showexcellent agreement with Eq. 3. The critical pore radius forliquid to breach the GDL decreased by a factor of 7 fromcloth to paper. Equation 3 suggests the critical drop size fordetachment should decrease by
ffiffiffi73
p ¼ 1:9 between the twoGDL materials, which is close to the experimental value of2.1.
The photographic sequence in Figure 5 shows that only asingle pore permitted liquid flow at the critical hydrostaticpressure head over an area of 5 cm2. The total flow ratethrough that single pore was �1.5 mL/min for carbon clothand �0.25 mL/min for carbon paper. At a fuel cell currentdensity of 1 A/cm2, the required liquid flow rate to drain thewater away would be 0.011 mL/(min�cm2), so that only asingle pore is needed to carry all the liquid water from morethan 10 cm2. Since liquid only breaches the largest pores andonly a single 25-lm pore is required to carry the liquid prod-uct from 1 cm2 of the MEA, almost all the GDL poresremain free of liquid and permit gas to diffuse to the mem-brane/electrode interface.
The water at the membrane/electrode interface accumu-lates as it forms. Since it is in a confined space, the accumu-lating water will build up the hydrostatic pressure necessaryto push the liquid through the largest pores. The pores in theGDL are interconnected within the plane and so the liquidwater will search for the path of least resistance to pushthrough to the gas flow channel. Other investigators whohave seen droplets on the surface of the GDL ascribe the re-sistance to motion as resulting from the interfacial energybetween the GDL and the droplet. Our results suggest thatwater drops move along the hydrophobic GDL surface withlittle force from the gas flow. It is the surface tensionbetween the drop and the water in the GDL pore that holdsthe drops in place and must be overcome.
Mechanism of cathode flooding
If liquid water does not flood the pores of the GDL whatis the mechanism of flooding in PEM fuel cells? Our resultsfrom the SAPC fuel cell in different orientations shows thatthe current in the fuel cell only drops when liquid wateraccumulates in the cathode gas flow channel in a way thatinhibits oxygen transport into the GDL. When the flow chan-nel is horizontal with the cathode facing downward andwhen the flow channel is vertical with the gas flow going inthe direction of gravity, there was no evidence of any currentreduction from flooding by liquid water unless the oxygenfeed was totally consumed by reaction. In both of these con-figurations liquid water drainage is assisted by gravity.
When the gas flow rate to the cathode was reduced so thatthe oxygen feed was totally consumed there was only gravityto assist in the liquid water removal. This resulted in the‘‘periodic’’ spikes in the current shown in Figure 8 for n1.The water would build up near the outlet of the flow channel.This caused a reduction in current in electrode segment 6,resulting in a slight excess of oxygen in the feed. The oxy-gen pressure would build up until it pushed a water slug out
1324 DOI 10.1002/aic Published on behalf of the AIChE May 2008 Vol. 54, No. 5 AIChE Journal
of the gas outlet of the fuel cell. The same phenomenon wasobserved with the fuel cell oriented vertically with the gasflows going downward. It might have been expected that thewater would drain from the fuel cell just by gravity. How-ever, the stainless steel electrodes along the sides of the flowchannel are slightly hydrophilic and hold drops in place nearthe bottom of the flow channel in the absence of any gasflow. This gives rise to similar behavior as that seen inFigure 8.
Placing the SAPC fuel cell horizontal with the cathodefacing up or placing the fuel cell vertical with the cathodeflow going upwards, counter to gravity, both create situationswhere gravity plays a much greater role in the flooding. Withthe horizontal orientation, the water drops form on the GDLbut it is only the shearing force from the gas flow that candetach the drops and force them to move. If the drops aresufficiently small so they do not significantly disrupt the gasflow field, the critical drop size can be found by balancingthe shear force from the gas multiplied by the area of thedrop with the surface energy holding the drop to the pore inthe GDL.
4lgasQgas
pr3channel
� ��pr2drop
�> 2prporecwater (4)
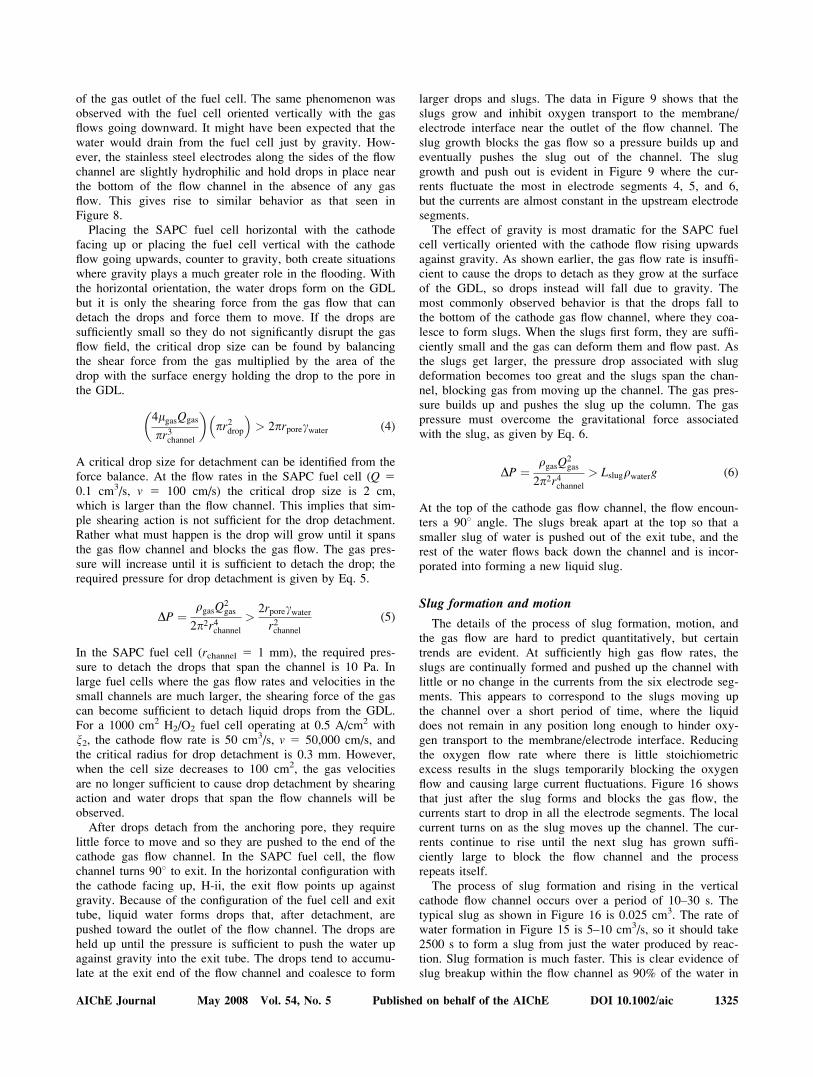
A critical drop size for detachment can be identified from theforce balance. At the flow rates in the SAPC fuel cell (Q 50.1 cm3/s, v 5 100 cm/s) the critical drop size is 2 cm,which is larger than the flow channel. This implies that sim-ple shearing action is not sufficient for the drop detachment.Rather what must happen is the drop will grow until it spansthe gas flow channel and blocks the gas flow. The gas pres-sure will increase until it is sufficient to detach the drop; therequired pressure for drop detachment is given by Eq. 5.
DP ¼ qgasQ2gas
2p2r4channel>
2rporecwaterr2channel
(5)
In the SAPC fuel cell (rchannel 5 1 mm), the required pres-sure to detach the drops that span the channel is 10 Pa. Inlarge fuel cells where the gas flow rates and velocities in thesmall channels are much larger, the shearing force of the gascan become sufficient to detach liquid drops from the GDL.For a 1000 cm2 H2/O2 fuel cell operating at 0.5 A/cm2 withn2, the cathode flow rate is 50 cm3/s, v 5 50,000 cm/s, andthe critical radius for drop detachment is 0.3 mm. However,when the cell size decreases to 100 cm2, the gas velocitiesare no longer sufficient to cause drop detachment by shearingaction and water drops that span the flow channels will beobserved.
After drops detach from the anchoring pore, they requirelittle force to move and so they are pushed to the end of thecathode gas flow channel. In the SAPC fuel cell, the flowchannel turns 908 to exit. In the horizontal configuration withthe cathode facing up, H-ii, the exit flow points up againstgravity. Because of the configuration of the fuel cell and exittube, liquid water forms drops that, after detachment, arepushed toward the outlet of the flow channel. The drops areheld up until the pressure is sufficient to push the water upagainst gravity into the exit tube. The drops tend to accumu-late at the exit end of the flow channel and coalesce to form
larger drops and slugs. The data in Figure 9 shows that theslugs grow and inhibit oxygen transport to the membrane/electrode interface near the outlet of the flow channel. Theslug growth blocks the gas flow so a pressure builds up andeventually pushes the slug out of the channel. The sluggrowth and push out is evident in Figure 9 where the cur-rents fluctuate the most in electrode segments 4, 5, and 6,but the currents are almost constant in the upstream electrodesegments.
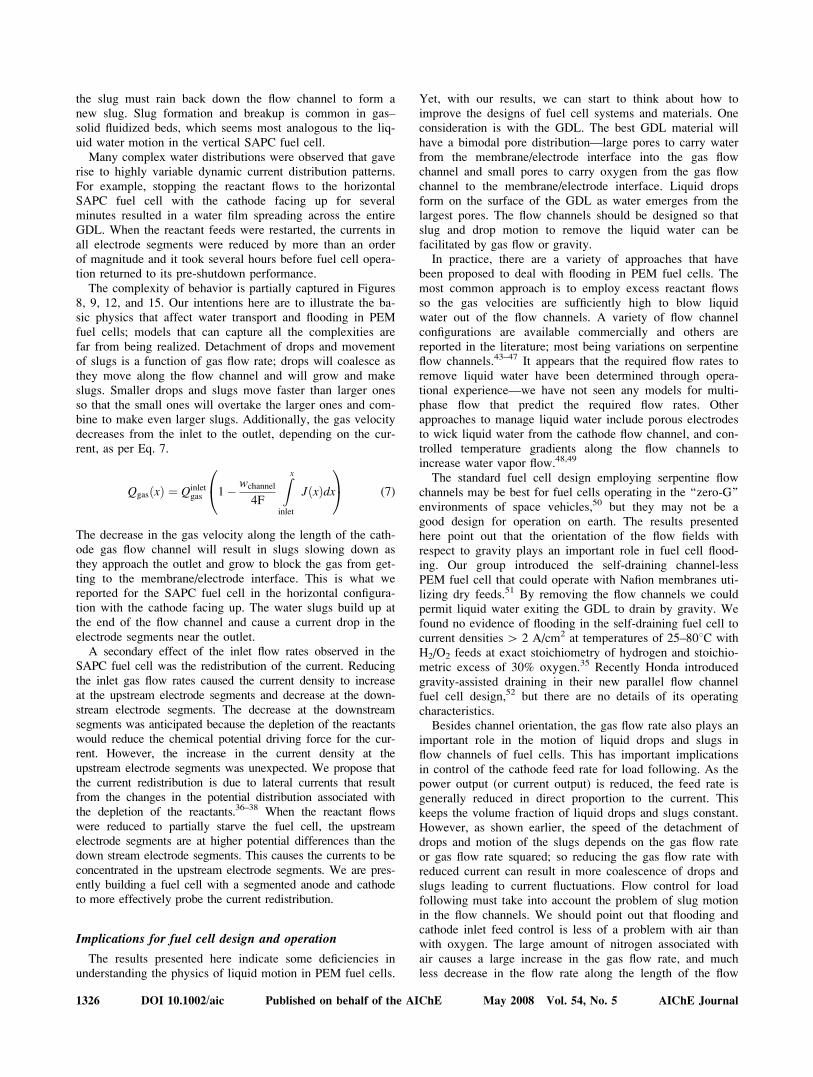
The effect of gravity is most dramatic for the SAPC fuelcell vertically oriented with the cathode flow rising upwardsagainst gravity. As shown earlier, the gas flow rate is insuffi-cient to cause the drops to detach as they grow at the surfaceof the GDL, so drops instead will fall due to gravity. Themost commonly observed behavior is that the drops fall tothe bottom of the cathode gas flow channel, where they coa-lesce to form slugs. When the slugs first form, they are suffi-ciently small and the gas can deform them and flow past. Asthe slugs get larger, the pressure drop associated with slugdeformation becomes too great and the slugs span the chan-nel, blocking gas from moving up the channel. The gas pres-sure builds up and pushes the slug up the column. The gaspressure must overcome the gravitational force associatedwith the slug, as given by Eq. 6.
DP ¼ qgasQ2gas
2p2r4channel> Lslugqwaterg (6)
At the top of the cathode gas flow channel, the flow encoun-ters a 908 angle. The slugs break apart at the top so that asmaller slug of water is pushed out of the exit tube, and therest of the water flows back down the channel and is incor-porated into forming a new liquid slug.
Slug formation and motion
The details of the process of slug formation, motion, andthe gas flow are hard to predict quantitatively, but certaintrends are evident. At sufficiently high gas flow rates, theslugs are continually formed and pushed up the channel withlittle or no change in the currents from the six electrode seg-ments. This appears to correspond to the slugs moving upthe channel over a short period of time, where the liquiddoes not remain in any position long enough to hinder oxy-gen transport to the membrane/electrode interface. Reducingthe oxygen flow rate where there is little stoichiometricexcess results in the slugs temporarily blocking the oxygenflow and causing large current fluctuations. Figure 16 showsthat just after the slug forms and blocks the gas flow, thecurrents start to drop in all the electrode segments. The localcurrent turns on as the slug moves up the channel. The cur-rents continue to rise until the next slug has grown suffi-ciently large to block the flow channel and the processrepeats itself.
The process of slug formation and rising in the verticalcathode flow channel occurs over a period of 10–30 s. Thetypical slug as shown in Figure 16 is 0.025 cm3. The rate ofwater formation in Figure 15 is 5–10 cm3/s, so it should take2500 s to form a slug from just the water produced by reac-tion. Slug formation is much faster. This is clear evidence ofslug breakup within the flow channel as 90% of the water in
AIChE Journal May 2008 Vol. 54, No. 5 Published on behalf of the AIChE DOI 10.1002/aic 1325
the slug must rain back down the flow channel to form anew slug. Slug formation and breakup is common in gas–solid fluidized beds, which seems most analogous to the liq-uid water motion in the vertical SAPC fuel cell.
Many complex water distributions were observed that gaverise to highly variable dynamic current distribution patterns.For example, stopping the reactant flows to the horizontalSAPC fuel cell with the cathode facing up for severalminutes resulted in a water film spreading across the entireGDL. When the reactant feeds were restarted, the currents inall electrode segments were reduced by more than an orderof magnitude and it took several hours before fuel cell opera-tion returned to its pre-shutdown performance.
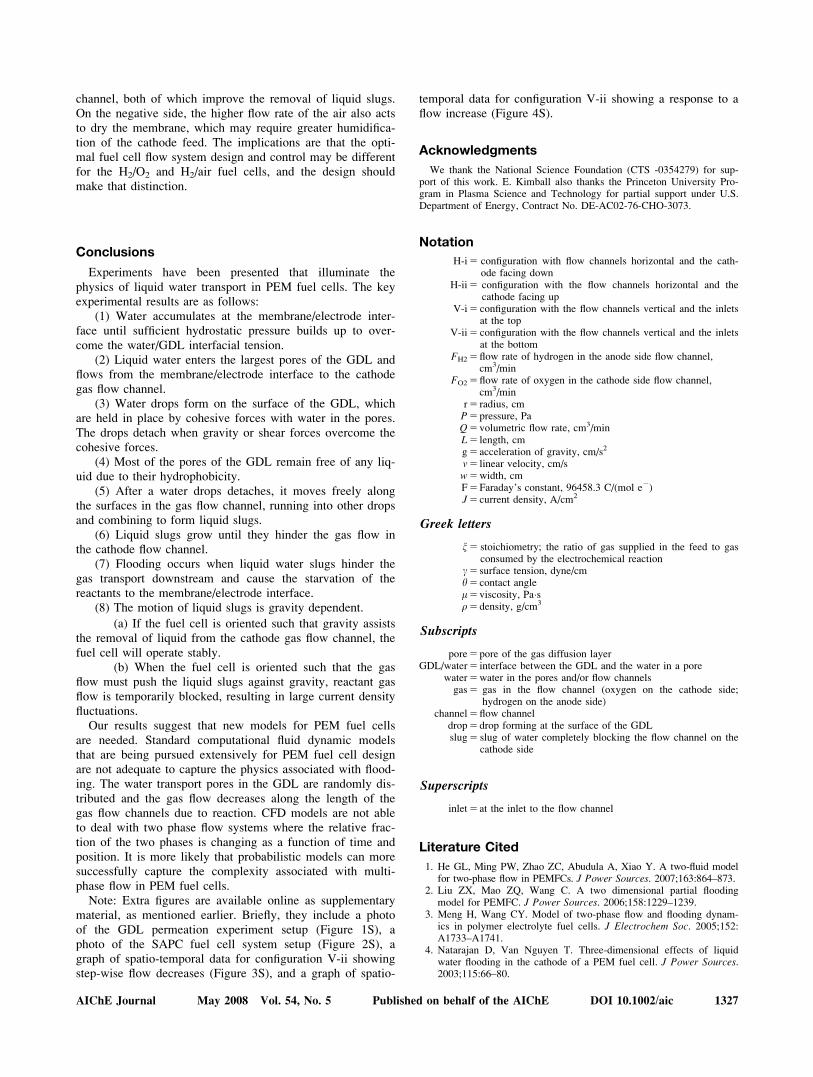
The complexity of behavior is partially captured in Figures8, 9, 12, and 15. Our intentions here are to illustrate the ba-sic physics that affect water transport and flooding in PEMfuel cells; models that can capture all the complexities arefar from being realized. Detachment of drops and movementof slugs is a function of gas flow rate; drops will coalesce asthey move along the flow channel and will grow and makeslugs. Smaller drops and slugs move faster than larger onesso that the small ones will overtake the larger ones and com-bine to make even larger slugs. Additionally, the gas velocitydecreases from the inlet to the outlet, depending on the cur-rent, as per Eq. 7.
QgasðxÞ ¼ Qinletgas 1� wchannel
4F
Zx
inlet
JðxÞdx0@
1A (7)
The decrease in the gas velocity along the length of the cath-ode gas flow channel will result in slugs slowing down asthey approach the outlet and grow to block the gas from get-ting to the membrane/electrode interface. This is what wereported for the SAPC fuel cell in the horizontal configura-tion with the cathode facing up. The water slugs build up atthe end of the flow channel and cause a current drop in theelectrode segments near the outlet.
A secondary effect of the inlet flow rates observed in theSAPC fuel cell was the redistribution of the current. Reducingthe inlet gas flow rates caused the current density to increaseat the upstream electrode segments and decrease at the down-stream electrode segments. The decrease at the downstreamsegments was anticipated because the depletion of the reactantswould reduce the chemical potential driving force for the cur-rent. However, the increase in the current density at theupstream electrode segments was unexpected. We propose thatthe current redistribution is due to lateral currents that resultfrom the changes in the potential distribution associated withthe depletion of the reactants.36–38 When the reactant flowswere reduced to partially starve the fuel cell, the upstreamelectrode segments are at higher potential differences than thedown stream electrode segments. This causes the currents to beconcentrated in the upstream electrode segments. We are pres-ently building a fuel cell with a segmented anode and cathodeto more effectively probe the current redistribution.
Implications for fuel cell design and operation
The results presented here indicate some deficiencies inunderstanding the physics of liquid motion in PEM fuel cells.
Yet, with our results, we can start to think about how toimprove the designs of fuel cell systems and materials. Oneconsideration is with the GDL. The best GDL material willhave a bimodal pore distribution—large pores to carry waterfrom the membrane/electrode interface into the gas flowchannel and small pores to carry oxygen from the gas flowchannel to the membrane/electrode interface. Liquid dropsform on the surface of the GDL as water emerges from thelargest pores. The flow channels should be designed so thatslug and drop motion to remove the liquid water can befacilitated by gas flow or gravity.
In practice, there are a variety of approaches that havebeen proposed to deal with flooding in PEM fuel cells. Themost common approach is to employ excess reactant flowsso the gas velocities are sufficiently high to blow liquidwater out of the flow channels. A variety of flow channelconfigurations are available commercially and others arereported in the literature; most being variations on serpentineflow channels.43–47 It appears that the required flow rates toremove liquid water have been determined through opera-tional experience—we have not seen any models for multi-phase flow that predict the required flow rates. Otherapproaches to manage liquid water include porous electrodesto wick liquid water from the cathode flow channel, and con-trolled temperature gradients along the flow channels toincrease water vapor flow.48,49
The standard fuel cell design employing serpentine flowchannels may be best for fuel cells operating in the ‘‘zero-G’’environments of space vehicles,50 but they may not be agood design for operation on earth. The results presentedhere point out that the orientation of the flow fields withrespect to gravity plays an important role in fuel cell flood-ing. Our group introduced the self-draining channel-lessPEM fuel cell that could operate with Nafion membranes uti-lizing dry feeds.51 By removing the flow channels we couldpermit liquid water exiting the GDL to drain by gravity. Wefound no evidence of flooding in the self-draining fuel cell tocurrent densities[ 2 A/cm2 at temperatures of 25–808C withH2/O2 feeds at exact stoichiometry of hydrogen and stoichio-metric excess of 30% oxygen.35 Recently Honda introducedgravity-assisted draining in their new parallel flow channelfuel cell design,52 but there are no details of its operatingcharacteristics.
Besides channel orientation, the gas flow rate also plays animportant role in the motion of liquid drops and slugs inflow channels of fuel cells. This has important implicationsin control of the cathode feed rate for load following. As thepower output (or current output) is reduced, the feed rate isgenerally reduced in direct proportion to the current. Thiskeeps the volume fraction of liquid drops and slugs constant.However, as shown earlier, the speed of the detachment ofdrops and motion of the slugs depends on the gas flow rateor gas flow rate squared; so reducing the gas flow rate withreduced current can result in more coalescence of drops andslugs leading to current fluctuations. Flow control for loadfollowing must take into account the problem of slug motionin the flow channels. We should point out that flooding andcathode inlet feed control is less of a problem with air thanwith oxygen. The large amount of nitrogen associated withair causes a large increase in the gas flow rate, and muchless decrease in the flow rate along the length of the flow
1326 DOI 10.1002/aic Published on behalf of the AIChE May 2008 Vol. 54, No. 5 AIChE Journal
channel, both of which improve the removal of liquid slugs.On the negative side, the higher flow rate of the air also actsto dry the membrane, which may require greater humidifica-tion of the cathode feed. The implications are that the opti-mal fuel cell flow system design and control may be differentfor the H2/O2 and H2/air fuel cells, and the design shouldmake that distinction.
Conclusions
Experiments have been presented that illuminate thephysics of liquid water transport in PEM fuel cells. The keyexperimental results are as follows:
(1) Water accumulates at the membrane/electrode inter-face until sufficient hydrostatic pressure builds up to over-come the water/GDL interfacial tension.
(2) Liquid water enters the largest pores of the GDL andflows from the membrane/electrode interface to the cathodegas flow channel.
(3) Water drops form on the surface of the GDL, whichare held in place by cohesive forces with water in the pores.The drops detach when gravity or shear forces overcome thecohesive forces.
(4) Most of the pores of the GDL remain free of any liq-uid due to their hydrophobicity.
(5) After a water drops detaches, it moves freely alongthe surfaces in the gas flow channel, running into other dropsand combining to form liquid slugs.
(6) Liquid slugs grow until they hinder the gas flow inthe cathode flow channel.
(7) Flooding occurs when liquid water slugs hinder thegas transport downstream and cause the starvation of thereactants to the membrane/electrode interface.
(8) The motion of liquid slugs is gravity dependent.
(a) If the fuel cell is oriented such that gravity assiststhe removal of liquid from the cathode gas flow channel, thefuel cell will operate stably.
(b) When the fuel cell is oriented such that the gasflow must push the liquid slugs against gravity, reactant gasflow is temporarily blocked, resulting in large current densityfluctuations.
Our results suggest that new models for PEM fuel cellsare needed. Standard computational fluid dynamic modelsthat are being pursued extensively for PEM fuel cell designare not adequate to capture the physics associated with flood-ing. The water transport pores in the GDL are randomly dis-tributed and the gas flow decreases along the length of thegas flow channels due to reaction. CFD models are not ableto deal with two phase flow systems where the relative frac-tion of the two phases is changing as a function of time andposition. It is more likely that probabilistic models can moresuccessfully capture the complexity associated with multi-phase flow in PEM fuel cells.
Note: Extra figures are available online as supplementarymaterial, as mentioned earlier. Briefly, they include a photoof the GDL permeation experiment setup (Figure 1S), aphoto of the SAPC fuel cell system setup (Figure 2S), agraph of spatio-temporal data for configuration V-ii showingstep-wise flow decreases (Figure 3S), and a graph of spatio-
temporal data for configuration V-ii showing a response to aflow increase (Figure 4S).
Acknowledgments
We thank the National Science Foundation (CTS -0354279) for sup-port of this work. E. Kimball also thanks the Princeton University Pro-gram in Plasma Science and Technology for partial support under U.S.Department of Energy, Contract No. DE-AC02-76-CHO-3073.
Notation
H-i5 configuration with flow channels horizontal and the cath-ode facing down
H-ii5 configuration with the flow channels horizontal and thecathode facing up
V-i5 configuration with the flow channels vertical and the inletsat the top
V-ii5 configuration with the flow channels vertical and the inletsat the bottom
FH25flow rate of hydrogen in the anode side flow channel,cm3/min
FO25flow rate of oxygen in the cathode side flow channel,cm3/min
r5 radius, cmP5pressure, PaQ5volumetric flow rate, cm3/minL5 length, cmg5 acceleration of gravity, cm/s2
v5 linear velocity, cm/sw5width, cmF5Faraday’s constant, 96458.3 C/(mol e2)J5 current density, A/cm2
Greek letters
n5 stoichiometry; the ratio of gas supplied in the feed to gasconsumed by the electrochemical reaction
c5 surface tension, dyne/cmh5 contact anglel5viscosity, Pa�sq5density, g/cm3
Subscripts
pore5pore of the gas diffusion layerGDL/water5 interface between the GDL and the water in a pore
water5water in the pores and/or flow channelsgas5 gas in the flow channel (oxygen on the cathode side;
hydrogen on the anode side)channel5flow channel
drop5drop forming at the surface of the GDLslug5 slug of water completely blocking the flow channel on the
cathode side
Superscripts
inlet5 at the inlet to the flow channel
Literature Cited
1. He GL, Ming PW, Zhao ZC, Abudula A, Xiao Y. A two-fluid modelfor two-phase flow in PEMFCs. J Power Sources. 2007;163:864–873.
2. Liu ZX, Mao ZQ, Wang C. A two dimensional partial floodingmodel for PEMFC. J Power Sources. 2006;158:1229–1239.
3. Meng H, Wang CY. Model of two-phase flow and flooding dynam-ics in polymer electrolyte fuel cells. J Electrochem Soc. 2005;152:A1733–A1741.
4. Natarajan D, Van Nguyen T. Three-dimensional effects of liquidwater flooding in the cathode of a PEM fuel cell. J Power Sources.2003;115:66–80.
AIChE Journal May 2008 Vol. 54, No. 5 Published on behalf of the AIChE DOI 10.1002/aic 1327
5. Wang ZH, Wang CY, Chen KS. Two-phase flow and transport inthe air cathode of proton exchange membrane fuel cells. J PowerSources. 2001;94:40–50.
6. Weber AZ, Darling RM, Newman J. Modeling two-phase behaviorin PEFCs. J Electrochem Soc. 2004;151:A1715–A1727.
7. Benziger J, Nehlsen J, Blackwell D, Brennan T, Itescu J. Water flow in thegas diffusion layer of PEM fuel cells. JMembr Sci. 2005;261:98–106.
8. Litster S, Sinton D, Djilali N. Ex situ visualization of liquid watertransport in PEM fuel cell gas diffusion layers. J Power Sources.2006;154:95–105.
9. Fairweather JD, Cheung P, St-Pierre J, Schwartz DT. A microfluidicapproach for measuring capillary pressure in PEMFC gas diffusionlayers. Electrochem Comm. 2007;9:2340–2345.
10. Gostick JT, Fowler MW, Ioannidis MA, Pritzker MD, Volfkovich YM,SakarsA. Capillary pressure and hydrophilic porosity in gas diffusion layersfor polymer electrolyte fuel cells. J Power Sources. 2006;156:375–387.
11. Hickner MA, Siegel NP, Chen KS, McBrayer DN, Hussey DS,Jacobson DL, Arif M. Real-time imaging of liquid water in an oper-ating proton exchange membrane fuel cell. J Electrochem Soc.2006;153:A902–A908.
12. Owejan JP, Trabold TA, Jacobson DL, Baker DR, Hussey DS, ArifM. In situ investigation of water transport in an operating PEM fuelcell using neutron radiography, Part 2: Transient water accumulationin an interdigitated cathode flow field. Int J Heat Mass Transfer.2006;49:4721–4731.
13. Pekula N, Heller K, Chuang PA, Turhan A, Mench MM, BrenizerJS, Unlu K. Study of water distribution and transport in a polymerelectrolyte fuel cell using neutron imaging. Nucl Instrum MethodsPhys Res Section A: Accelerators Spectrometers Detectors Associ-ated Equipment. 2005;542:134–141.
14. Trabold TA, Owejan JP, Jacobson DL, Arif M, Huffman PR. In situinvestigation of water transport in an operating PEM fuel cell usingneutron radiography, Part 1: Experimental method and serpentineflow field results. Int J Heat Mass Transfer. 2006;49:4712–4720.
15. Turhan A, Heller K, Brenizer JS, Mench MM. Quantification of liq-uid water accumulation and distribution in a polymer electrolyte fuelcell using neutron imaging. J Power Sources. 2006;160:1195–1203.
16. Liu X, Guo H, Ma CF. Water flooding and two-phase flow in cath-ode channels of proton exchange membrane fuel cells. J PowerSources. 2006;156:267–280.
17. Ma HP, Zhang HM, Hu J, Cai YH, Yi BL. Diagnostic tool to detectliquid water removal in the cathode channels of proton exchangemembrane fuel cells. J Power Sources. 2006;162:469–473.
18. Theodorakakos A, Ous T, Gavaises A, Nouri JM, Nikolopoulos N,Yanagihara H. Dynamics of water droplets detached from poroussurfaces of relevance to PEM fuel cells. J Colloid Interface Sci.2006;300:673–687.
19. Tuber K, Pocza D, Hebling C. Visualization of water buildup in the cath-ode of a transparent PEM fuel cell. J Power Sources. 2003;124:403–414.
20. Yang XG, Zhang FY, Lubawy AL, Wang CY. Visualization of liq-uid water transport in a PEFC. Electrochem Solid State Lett. 2004;7:A408–A411.
21. Zhang FY, Yang XG, Wang CY. Liquid water removal from a poly-mer electrolyte fuel cell. J Electrochem Soc. 2006;153:A225–A232.
22. Jiao K, Zhou B, Quan P. Liquid water transport in straight micro-parallel-channels with manifolds for PEM fuel cell cathode. J PowerSources. 2006;157:226–243.
23. Quan P, Lai MC. Numerical study of water management in the air flowchannel of a PEM fuel cell cathode. J Power Sources. 2007;164: 222–237.
24. Cai YH, Hu J, Ma HP, Yi BL, Zhang HM. Effects of hydrophilic/hydrophobic properties on the water behavior in the micro-channelsof a proton exchange membrane fuel cell. J Power Sources. 2006;161:843–848.
25. Zhan ZG, Xiao JS, Pan M, Yuan RZ. Characteristics of droplet andfilm water motion in the flow channels of polymer electrolyte mem-brane fuel cells. J Power Sources. 2006;160:1–9.
26. Araki T, Koori H, Taniuchi T, Onda K. Simulation of the current densitydistribution for a PEMFC by using measured electrochemical and physi-cal properties of the membrane. J Power Sources. 2005; 152:60–66.
27. Buchi FN, Geiger AB, Neto RP. Dependence of current distributionon water management in PEFC of technical size. J Power Sources.2005;145:62–67.
28. Hakenjos A, Hebling C. Spatially resolved measurement of PEMfuel cells. J Power Sources. 2005;145:307–311.
29. Natarajan D, Van Nguyen T. Current distribution in PEM fuel cells,Part 1: Oxygen and fuel flow rate effects. AIChE J. 2005;51:2587–2598.
30. Nishikawa H, Kurihara R, Sukemori S, Sugawara T, Kobayashi H,Abe S, Aoki T, Ogami Y, Mutsunaga A. Measurements of humidityand current distribution in a PEFC. J Power Sources. 2006;155:213–218.
31. Benziger JB, Chia ES, De Decker Y, Kevrekidis IG. Ignition andfront propagation in polymer electrolyte membrane fuel cells. J PhysChem C. 2007;111:2330–2334.
32. Patterson TW, Darling RM. Damage to the cathode catalyst of aPEM fuel cell caused by localized fuel starvation. Electrochem SolidState Lett. 2006;9:A183–A185.
33. Reiser CA, Bregoli L, Patterson TW, Yi JS, Yang JDL, Perry ML,Jarvi TD. A reverse-current decay mechanism for fuel cells. Electro-chem Solid State Lett. 2005;8: A273–A276.
34. Taniguchi A, Akita T, Yasuda K, Miyazaki Y. Analysis of electroca-talyst degradation in PEMFC caused by cell reversal during fuelstarvation. J Power Sources. 2004;130:42–49.
35. Woo CH, Benziger JB. PEM fuel cell current regulation by fuelfeed control. Chem Eng Sci. 2007;62:957–968.
36. Kulikovsky AA. Voltage loss in bipolar plates in a fuel cell stack.J Power Sources. 2006;160:431–435.
37. Santis M, Freunberger SA, Papra M, Wokaun A, Buchi FN. Experi-mental investigation of coupling phenomena in polymer electrolytefuel cell stacks. J Power Sources. 2006;161:1076–1083.
38. Berg P, Promislow K, Stumper J, Wetton B. Discharge of a seg-mented polymer electrolyte membrane fuel cell. J Fuel Cell SciTech. 2005;2:111–120.
39. Lin GY, He WS, Van Nguyen T. Modeling liquid water effects inthe gas diffusion and catalyst layers of the cathode of a PEM fuelcell. J Electrochem Soc. 2004;151:A1999–A2006.
40. Pasaogullari U, Wang CY. Liquid water transport in gas diffusionlayer of polymer electrolyte fuel cells. J Electrochem Soc. 2004;151:A399–A406.
41. Bernardi DM, Verbrugge MW. A mathematical-model of the solid-poly-mer-electrolyte fuel-cell. J Electrochem Soc. 1992;139:2477–2491.
42. Adamson AW. Physical Chemistry of Surfaces, 5th ed. NY: Wiley,1990.
43. Xu C, Zhao TS. A new flow field design for polymer electrolyte-based fuel cells. Electrochem Commun. 2007;9:497–503.
44. Kitta S, Okumoto T, Uchida H, Watanabe M. New metal separatorscoated with carbon/resin composite layers for PEFCs. Electrochemis-try. 2007;75:213–216.
45. Kumar A, Reddy RG. Effect of gas flow-field design in the bipolar/end plates on the steady and transient state performance of polymerelectrolyte membrane fuel cells. J Power Sources. 2006;155:264–271.
46. Nikam VV, Reddy RG. Corrugated bipolar sheets as fuel distributorsin PEMFC. Int J Hydrogen Energy. 2006;31:1863–1873.
47. Yan WM, Yang CH, Soong CY, Chen FL, Mei SC. Experimentalstudies on optimal operating conditions for different flow fielddesigns of PEM fuel cells. J Power Sources. 2006;160:284–292.
48. Dufner BF, Perry ML, Trocciola JC, Yang D, Yi JS; UTC FuelCells, LLC, assignee. Bi-zone water transport plate for a fuel cell.US Patent 6,617,068, September 9 (2003).
49. Voss HH, Wilkinson DP, Watkins DS; Ballard Power Systems Inc.,assignee. Method and apparatus for removing water from electro-chemical fuel cells by controlling the temperature and pressure ofthe reactant streams. US Patent 5,441,819, August 15 (1995).
50. Sone Y, Ueno M, Naito H, Kuwajima S. One kilowatt-class fuel cellsystem for the aerospace applications in a micro-gravitational andclosed environment. J Power Sources. 2006;157:886–892.
51. Hogarth WHJ, Benziger JB. Operation of polymer electrolyte mem-brane fuel cells with dry feeds: design and operating strategies.J Power Sources. 2006;159:968–978.
52. Komura T, Moriya T, Isobe S, Ushiro T; Honda Giken KogyoKabushiki Kaisha, assignee. Fuel cell system and draining methodfor the same. US Patent 6,242,119, June 5, 2001.
Manuscript received July 20, 2007, and revision received Jan. 8, 2008.
1328 DOI 10.1002/aic Published on behalf of the AIChE May 2008 Vol. 54, No. 5 AIChE Journal
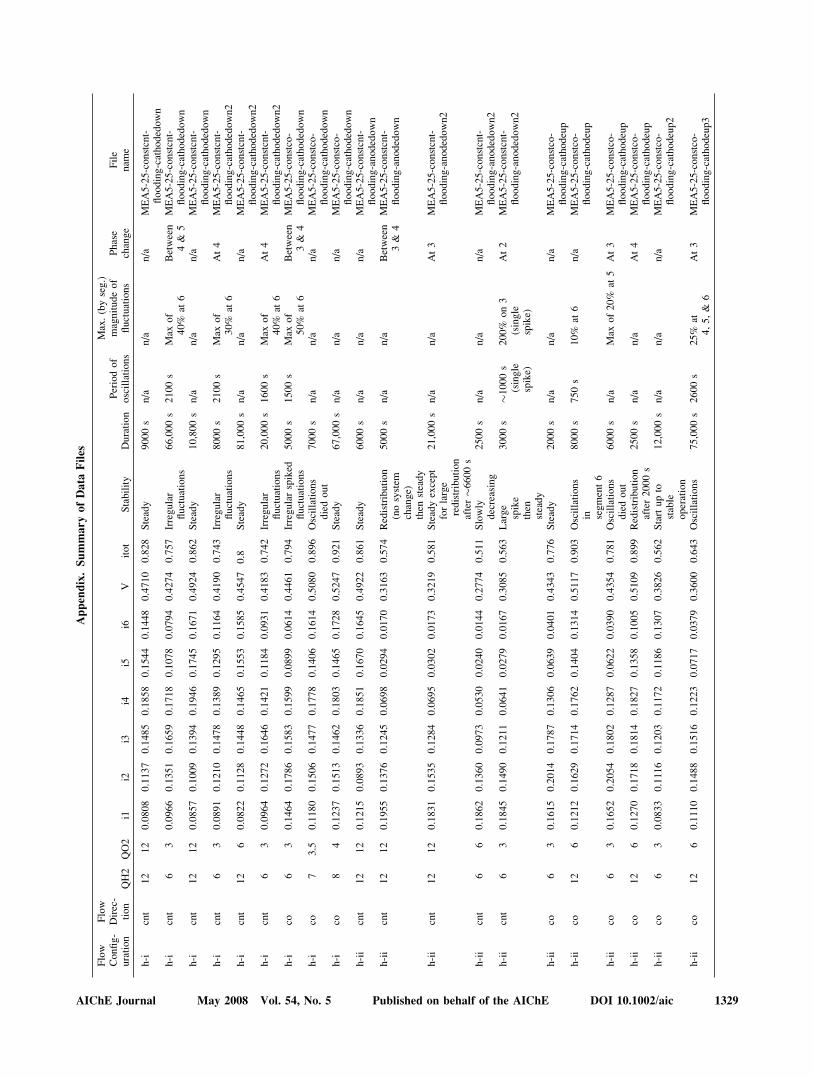
Appendix.SummaryofData
Files
Flow
Config-
uration
Flow
Direc-
tion
QH2
QO2
i1i2
i3i4
i5i6
Vitot
Stability
Duration
Periodof
oscillations
Max.(byseg.)
magnitudeof
fluctuations
Phase
change
File
nam
e
h-i
cnt
12
12
0.0808
0.1137
0.1485
0.1858
0.1544
0.1448
0.4710
0.828
Steady
9000s
n/a
n/a
n/a
MEA5-25-constcnt-
flooding-cathodedown
h-i
cnt
63
0.0966
0.1351
0.1659
0.1718
0.1078
0.0794
0.4274
0.757
Irregular
fluctuations
66,000s
2100s
Max
of
40%
at6
Between
4&
5MEA5-25-constcnt-
flooding-cathodedown
h-i
cnt
12
12
0.0857
0.1009
0.1394
0.1946
0.1745
0.1671
0.4924
0.862
Steady
10,800s
n/a
n/a
n/a
MEA5-25-constcnt-
flooding-cathodedown
h-i
cnt
63
0.0891
0.1210
0.1478
0.1389
0.1295
0.1164
0.4190
0.743
Irregular
fluctuations
8000s
2100s
Max
of
30%
at6
At4
MEA5-25-constcnt-
flooding-cathodedown2
h-i
cnt
12
60.0822
0.1128
0.1448
0.1465
0.1553
0.1585
0.4547
0.8
Steady
81,000s
n/a
n/a
n/a
MEA5-25-constcnt-
flooding-cathodedown2
h-i
cnt
63
0.0964
0.1272
0.1646
0.1421
0.1184
0.0931
0.4183
0.742
Irregular
fluctuations
20,000s
1600s
Max
of
40%
at6
At4
MEA5-25-constcnt-
flooding-cathodedown2
h-i
co6
30.1464
0.1786
0.1583
0.1599
0.0899
0.0614
0.4461
0.794
Irregularspiked
fluctuations
5000s
1500s
Max
of
50%
at6
Between
3&
4MEA5-25-constco-
flooding-cathodedown
h-i
co7
3.5
0.1180
0.1506
0.1477
0.1778
0.1406
0.1614
0.5080
0.896
Oscillations
diedout
7000s
n/a
n/a
n/a
MEA5-25-constco-
flooding-cathodedown
h-i
co8
40.1237
0.1513
0.1462
0.1803
0.1465
0.1728
0.5247
0.921
Steady
67,000s
n/a
n/a
n/a
MEA5-25-constco-
flooding-cathodedown
h-ii
cnt
12
12
0.1215
0.0893
0.1336
0.1851
0.1670
0.1645
0.4922
0.861
Steady
6000s
n/a
n/a
n/a
MEA5-25-constcnt-
flooding-anodedown
h-ii
cnt
12
12
0.1955
0.1376
0.1245
0.0698
0.0294
0.0170
0.3163
0.574
Redistribution
(nosystem
change)
then
steady
5000s
n/a
n/a
Between
3&
4MEA5-25-constcnt-
flooding-anodedown
h-ii
cnt
12
12
0.1831
0.1535
0.1284
0.0695
0.0302
0.0173
0.3219
0.581
Steadyexcept
forlarge
redistribution
after�6
600s
21,000s
n/a
n/a
At3
MEA5-25-constcnt-
flooding-anodedown2
h-ii
cnt
66
0.1862
0.1360
0.0973
0.0530
0.0240
0.0144
0.2774
0.511
Slowly
decreasing
2500s
n/a
n/a
n/a
MEA5-25-constcnt-
flooding-anodedown2
h-ii
cnt
63
0.1845
0.1490
0.1211
0.0641
0.0279
0.0167
0.3085
0.563
Large
spike
then
steady
3000s
�1000s
(single
spike)
200%
on3
(single
spike)
At2
MEA5-25-constcnt-
flooding-anodedown2
h-ii
co6
30.1615
0.2014
0.1787
0.1306
0.0639
0.0401
0.4343
0.776
Steady
2000s
n/a
n/a
n/a
MEA5-25-constco-
flooding-cathodeup
h-ii
co12
60.1212
0.1629
0.1714
0.1762
0.1404
0.1314
0.5117
0.903
Oscillations
in segment6
8000s
750s
10%
at6
n/a
MEA5-25-constco-
flooding-cathodeup
h-ii
co6
30.1652
0.2054
0.1802
0.1287
0.0622
0.0390
0.4354
0.781
Oscillations
diedout
6000s
n/a
Max
of20%
at5
At3
MEA5-25-constco-
flooding-cathodeup
h-ii
co12
60.1270
0.1718
0.1814
0.1827
0.1358
0.1005
0.5109
0.899
Redistribution
after2000s
2500s
n/a
n/a
At4
MEA5-25-constco-
flooding-cathodeup
h-ii
co6
30.0833
0.1116
0.1203
0.1172
0.1186
0.1307
0.3826
0.562
Startupto
stable
operation
12,000s
n/a
n/a
n/a
MEA5-25-constco-
flooding-cathodeup2
h-ii
co12
60.1110
0.1488
0.1516
0.1223
0.0717
0.0379
0.3600
0.643
Oscillations
75,000s
2600s
25%
at4,5,&
6At3
MEA5-25-constco-
flooding-cathodeup3
AIChE Journal May 2008 Vol. 54, No. 5 Published on behalf of the AIChE DOI 10.1002/aic 1329
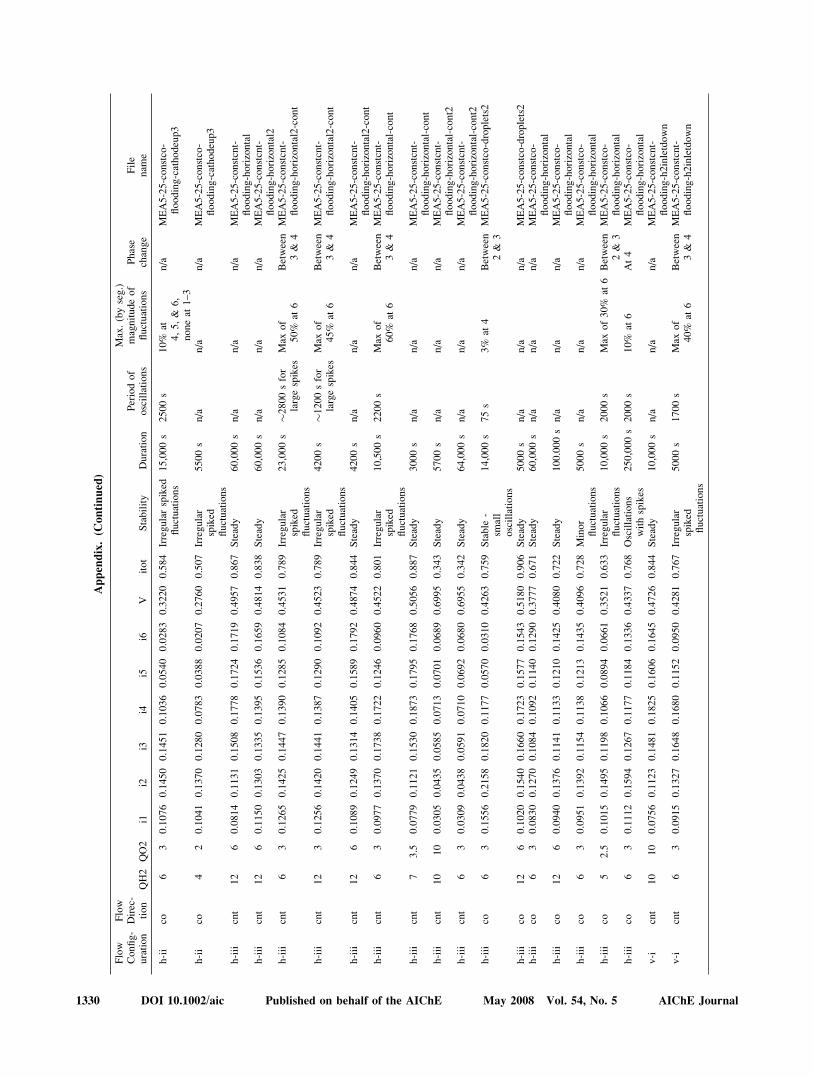
Appendix.(C
ontinued)
Flow
Config-
uration
Flow
Direc-
tion
QH2
QO2
i1i2
i3i4
i5i6
Vitot
Stability
Duration
Periodof
oscillations
Max.(byseg.)
magnitudeof
fluctuations
Phase
change
File
nam
e
h-ii
co6
30.1076
0.1450
0.1451
0.1036
0.0540
0.0283
0.3220
0.584
Irregularspiked
fluctuations
15,000s
2500s
10%
at4,5,&
6,
noneat
1–3
n/a
MEA5-25-constco-
flooding-cathodeup3
h-ii
co4
20.1041
0.1370
0.1280
0.0783
0.0388
0.0207
0.2760
0.507
Irregular
spiked
fluctuations
5500s
n/a
n/a
n/a
MEA5-25-constco-
flooding-cathodeup3
h-iii
cnt
12
60.0814
0.1131
0.1508
0.1778
0.1724
0.1719
0.4957
0.867
Steady
60,000s
n/a
n/a
n/a
MEA5-25-constcnt-
flooding-horizontal
h-iii
cnt
12
60.1150
0.1303
0.1335
0.1395
0.1536
0.1659
0.4814
0.838
Steady
60,000s
n/a
n/a
n/a
MEA5-25-constcnt-
flooding-horizontal2
h-iii
cnt
63
0.1265
0.1425
0.1447
0.1390
0.1285
0.1084
0.4531
0.789
Irregular
spiked
fluctuations
23,000s
�2800sfor
largespikes
Max
of
50%
at6
Between
3&
4MEA5-25-constcnt-
flooding-horizontal2-cont
h-iii
cnt
12
30.1256
0.1420
0.1441
0.1387
0.1290
0.1092
0.4523
0.789
Irregular
spiked
fluctuations
4200s
�1200sfor
largespikes
Max
of
45%
at6
Between
3&
4MEA5-25-constcnt-
flooding-horizontal2-cont
h-iii
cnt
12
60.1089
0.1249
0.1314
0.1405
0.1589
0.1792
0.4874
0.844
Steady
4200s
n/a
n/a
n/a
MEA5-25-constcnt-
flooding-horizontal2-cont
h-iii
cnt
63
0.0977
0.1370
0.1738
0.1722
0.1246
0.0960
0.4522
0.801
Irregular
spiked
fluctuations
10,500s
2200s
Max
of
60%
at6
Between
3&
4MEA5-25-constcnt-
flooding-horizontal-cont
h-iii
cnt
73.5
0.0779
0.1121
0.1530
0.1873
0.1795
0.1768
0.5056
0.887
Steady
3000s
n/a
n/a
n/a
MEA5-25-constcnt-
flooding-horizontal-cont
h-iii
cnt
10
10
0.0305
0.0435
0.0585
0.0713
0.0701
0.0689
0.6995
0.343
Steady
5700s
n/a
n/a
n/a
MEA5-25-constcnt-
flooding-horizontal-cont2
h-iii
cnt
63
0.0309
0.0438
0.0591
0.0710
0.0692
0.0680
0.6955
0.342
Steady
64,000s
n/a
n/a
n/a
MEA5-25-constcnt-
flooding-horizontal-cont2
h-iii
co6
30.1556
0.2158
0.1820
0.1177
0.0570
0.0310
0.4263
0.759
Stable
-sm
all
oscillations
14,000s
75s
3%
at4
Between
2&
3MEA5-25-constco-droplets2
h-iii
co12
60.1020
0.1540
0.1660
0.1723
0.1577
0.1543
0.5180
0.906
Steady
5000s
n/a
n/a
n/a
MEA5-25-constco-droplets2
h-iii
co6
30.0830
0.1270
0.1084
0.1092
0.1140
0.1290
0.3777
0.671
Steady
60,000s
n/a
n/a
n/a
MEA5-25-constco-
flooding-horizontal
h-iii
co12
60.0940
0.1376
0.1141
0.1133
0.1210
0.1425
0.4080
0.722
Steady
100.000s
n/a
n/a
n/a
MEA5-25-constco-
flooding-horizontal
h-iii
co6
30.0951
0.1392
0.1154
0.1138
0.1213
0.1435
0.4096
0.728
Minor
fluctuations
5000s
n/a
n/a
n/a
MEA5-25-constco-
flooding-horizontal
h-iii
co5
2.5
0.1015
0.1495
0.1198
0.1066
0.0894
0.0661
0.3521
0.633
Irregular
fluctuations
10,000s
2000s
Max
of30%
at6
Between
2&
3MEA5-25-constco-
flooding-horizontal
h-iii
co6
30.1112
0.1594
0.1267
0.1177
0.1184
0.1336
0.4337
0.768
Oscillations
withspikes
250,000s
2000s
10%
at6
At4
MEA5-25-constco-
flooding-horizontal
v-i
cnt
10
10
0.0756
0.1123
0.1481
0.1825
0.1606
0.1645
0.4726
0.844
Steady
10,000s
n/a
n/a
n/a
MEA5-25-constcnt-
flooding-h2inletdown
v-i
cnt
63
0.0915
0.1327
0.1648
0.1680
0.1152
0.0950
0.4281
0.767
Irregular
spiked
fluctuations
5000s
1700s
Max
of
40%
at6
Between
3&
4MEA5-25-constcnt-
flooding-h2inletdown
1330 DOI 10.1002/aic Published on behalf of the AIChE May 2008 Vol. 54, No. 5 AIChE Journal
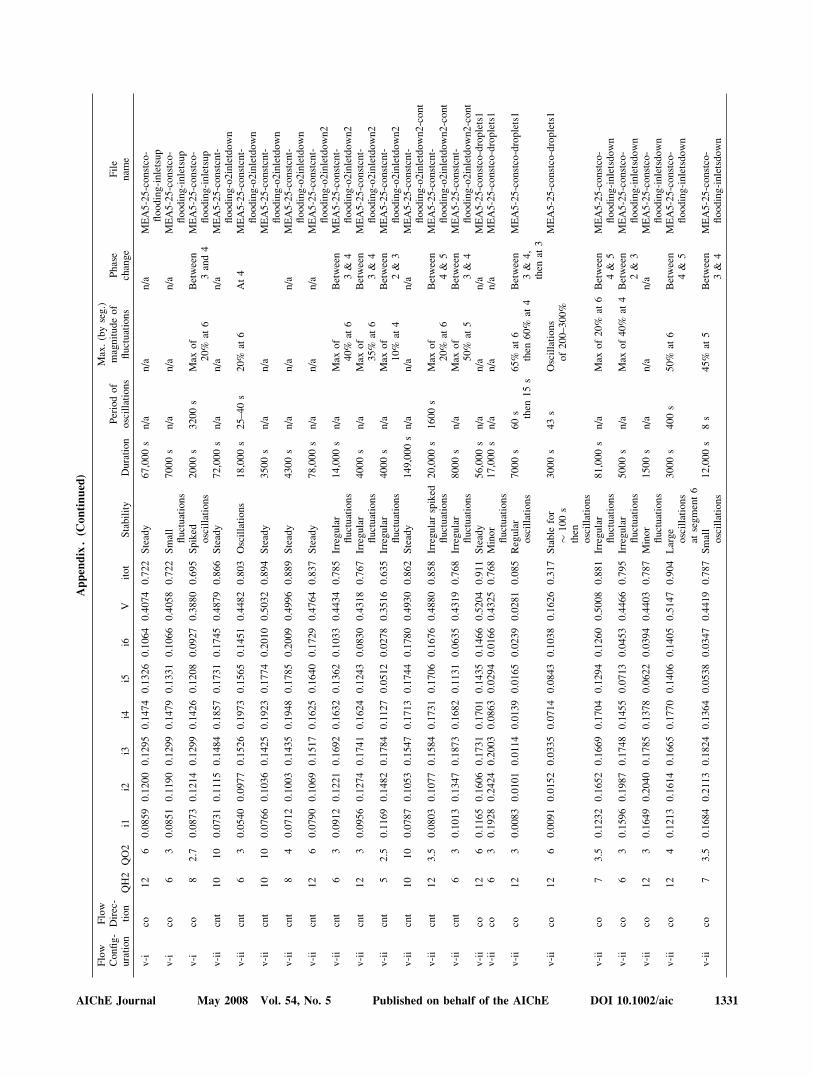
Appendix.(C
ontinued)
Flow
Config-
uration
Flow
Direc-
tion
QH2
QO2
i1i2
i3i4
i5i6
Vitot
Stability
Duration
Periodof
oscillations
Max.(byseg.)
magnitudeof
fluctuations
Phase
change
File
nam
e
v-i
co12
60.0859
0.1200
0.1295
0.1474
0.1326
0.1064
0.4074
0.722
Steady
67,000s
n/a
n/a
n/a
MEA5-25-constco-
flooding-inletsup
v-i
co6
30.0851
0.1190
0.1299
0.1479
0.1331
0.1066
0.4058
0.722
Small
fluctuations
7000s
n/a
n/a
n/a
MEA5-25-constco-
flooding-inletsup
v-i
co8
2.7
0.0873
0.1214
0.1299
0.1426
0.1208
0.0927
0.3880
0.695
Spiked
oscillations
2000s
3200s
Max
of
20%
at6
Between
3and4
MEA5-25-constco-
flooding-inletsup
v-ii
cnt
10
10
0.0731
0.1115
0.1484
0.1857
0.1731
0.1745
0.4879
0.866
Steady
72,000s
n/a
n/a
n/a
MEA5-25-constcnt-
flooding-o2inletdown
v-ii
cnt
63
0.0540
0.0977
0.1526
0.1973
0.1565
0.1451
0.4482
0.803
Oscillations
18,000s
25–40s
20%
at6
At4
MEA5-25-constcnt-
flooding-o2inletdown
v-ii
cnt
10
10
0.0766
0.1036
0.1425
0.1923
0.1774
0.2010
0.5032
0.894
Steady
3500s
n/a
n/a
MEA5-25-constcnt-
flooding-o2inletdown
v-ii
cnt
84
0.0712
0.1003
0.1435
0.1948
0.1785
0.2009
0.4996
0.889
Steady
4300s
n/a
n/a
n/a
MEA5-25-constcnt-
flooding-o2inletdown
v-ii
cnt
12
60.0790
0.1069
0.1517
0.1625
0.1640
0.1729
0.4764
0.837
Steady
78,000s
n/a
n/a
n/a
MEA5-25-constcnt-
flooding-o2inletdown2
v-ii
cnt
63
0.0912
0.1221
0.1692
0.1632
0.1362
0.1033
0.4434
0.785
Irregular
fluctuations
14,000s
n/a
Max
of
40%
at6
Between
3&
4MEA5-25-constcnt-
flooding-o2inletdown2
v-ii
cnt
12
30.0956
0.1274
0.1741
0.1624
0.1243
0.0830
0.4318
0.767
Irregular
fluctuations
4000s
n/a
Max
of
35%
at6
Between
3&
4MEA5-25-constcnt-
flooding-o2inletdown2
v-ii
cnt
52.5
0.1169
0.1482
0.1784
0.1127
0.0512
0.0278
0.3516
0.635
Irregular
fluctuations
4000s
n/a
Max
of
10%
at4
Between
2&
3MEA5-25-constcnt-
flooding-o2inletdown2
v-ii
cnt
10
10
0.0787
0.1053
0.1547
0.1713
0.1744
0.1780
0.4930
0.862
Steady
149,000s
n/a
n/a
n/a
MEA5-25-constcnt-
flooding-o2inletdown2-cont
v-ii
cnt
12
3.5
0.0803
0.1077
0.1584
0.1731
0.1706
0.1676
0.4880
0.858
Irregularspiked
fluctuations
20,000s
1600s
Max
of
20%
at6
Between
4&
5MEA5-25-constcnt-
flooding-o2inletdown2-cont
v-ii
cnt
63
0.1013
0.1347
0.1873
0.1682
0.1131
0.0635
0.4319
0.768
Irregular
fluctuations
8000s
n/a
Max
of
50%
at5
Between
3&
4MEA5-25-constcnt-
flooding-o2inletdown2-cont
v-ii
co12
60.1165
0.1606
0.1731
0.1701
0.1435
0.1466
0.5204
0.911
Steady
56,000s
n/a
n/a
n/a
MEA5-25-constco-droplets1
v-ii
co6
30.1928
0.2424
0.2003
0.0863
0.0294
0.0166
0.4325
0.768
Minor
fluctuations
17,000s
n/a
n/a
n/a
MEA5-25-constco-droplets1
v-ii
co12
30.0083
0.0101
0.0114
0.0139
0.0165
0.0239
0.0281
0.085
Regular
oscillations
7000s
60s then
15s
65%
at6
then
60%
at4
Between
3&
4,
then
at3
MEA5-25-constco-droplets1
v-ii
co12
60.0091
0.0152
0.0335
0.0714
0.0843
0.1038
0.1626
0.317
Stable
for
�100s
then
oscillations
3000s
43s
Oscillations
of200–300%
MEA5-25-constco-droplets1
v-ii
co7
3.5
0.1232
0.1652
0.1669
0.1704
0.1294
0.1260
0.5008
0.881
Irregular
fluctuations
81,000s
n/a
Max
of20%
at6
Between
4&
5MEA5-25-constco-
flooding-inletsdown
v-ii
co6
30.1596
0.1987
0.1748
0.1455
0.0713
0.0453
0.4466
0.795
Irregular
fluctuations
5000s
n/a
Max
of40%
at4
Between
2&
3MEA5-25-constco-
flooding-inletsdown
v-ii
co12
30.1649
0.2040
0.1785
0.1378
0.0622
0.0394
0.4403
0.787
Minor
fluctuations
1500s
n/a
n/a
n/a
MEA5-25-constco-
flooding-inletsdown
v-ii
co12
40.1213
0.1614
0.1665
0.1770
0.1406
0.1405
0.5147
0.904
Large
oscillations
atsegment6
3000s
400s
50%
at6
Between
4&
5MEA5-25-constco-
flooding-inletsdown
v-ii
co7
3.5
0.1684
0.2113
0.1824
0.1364
0.0538
0.0347
0.4419
0.787
Small
oscillations
12,000s
8s
45%
at5
Between
3&
4MEA5-25-constco-
flooding-inletsdown
AIChE Journal May 2008 Vol. 54, No. 5 Published on behalf of the AIChE DOI 10.1002/aic 1331
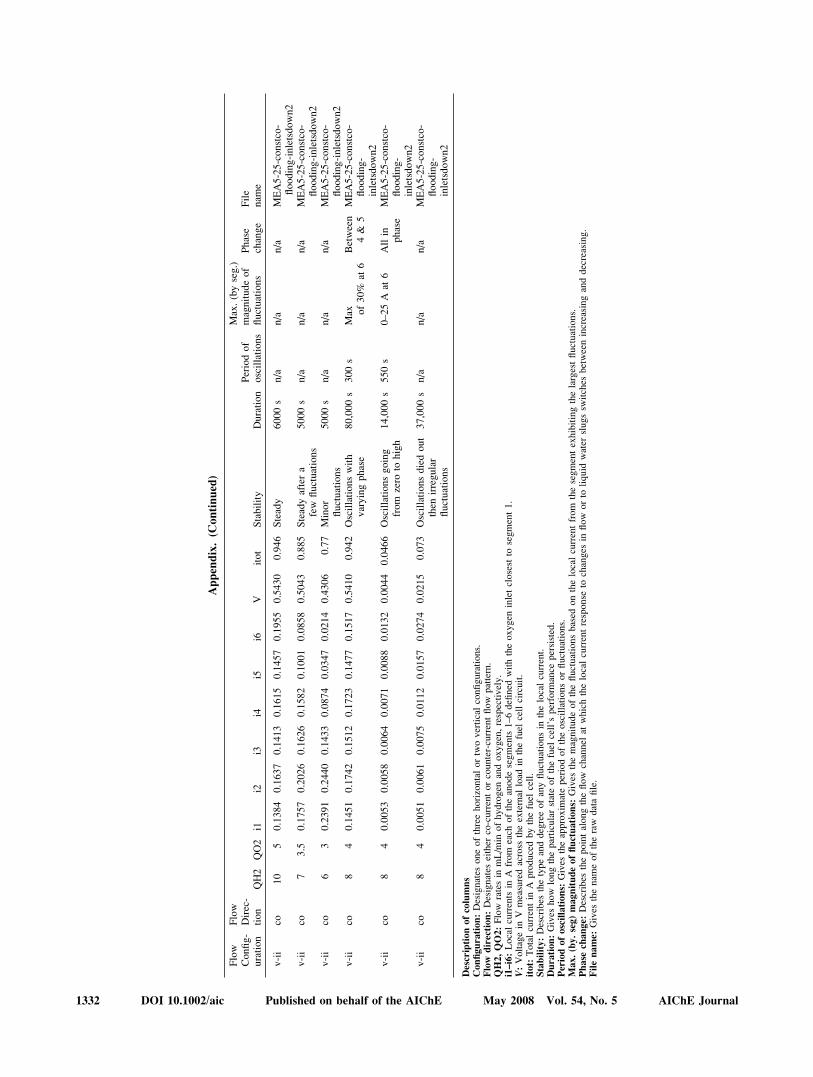
Appendix.(C
ontinued)
Flow
Config-
uration
Flow
Direc-
tion
QH2
QO2
i1i2
i3i4
i5i6
Vitot
Stability
Duration
Periodof
oscillations
Max.(byseg.)
magnitudeof
fluctuations
Phase
change
File
nam
e
v-ii
co10
50.1384
0.1637
0.1413
0.1615
0.1457
0.1955
0.5430
0.946
Steady
6000s
n/a
n/a
n/a
MEA5-25-constco-
flooding-inletsdown2
v-ii
co7
3.5
0.1757
0.2026
0.1626
0.1582
0.1001
0.0858
0.5043
0.885
Steadyaftera
few
fluctuations
5000s
n/a
n/a
n/a
MEA5-25-constco-
flooding-inletsdown2
v-ii
co6
30.2391
0.2440
0.1433
0.0874
0.0347
0.0214
0.4306
0.77
Minor
fluctuations
5000s
n/a
n/a
n/a
MEA5-25-constco-
flooding-inletsdown2
v-ii
co8
40.1451
0.1742
0.1512
0.1723
0.1477
0.1517
0.5410
0.942
Oscillationswith
varyingphase
80,000s
300s
Max of30%
at6
Between
4&
5MEA5-25-constco-
flooding-
inletsdown2
v-ii
co8
40.0053
0.0058
0.0064
0.0071
0.0088
0.0132
0.0044
0.0466
Oscillationsgoing
from
zero
tohigh
14,000s
550s
0–25A
at6
Allin
phase
MEA5-25-constco-
flooding-
inletsdown2
v-ii
co8
40.0051
0.0061
0.0075
0.0112
0.0157
0.0274
0.0215
0.073
Oscillationsdiedout
then
irregular
fluctuations
37,000s
n/a
n/a
n/a
MEA5-25-constco-
flooding-
inletsdown2
Descriptionofcolumns
Configuration:Designates
oneofthreehorizontalortwoverticalconfigurations.
Flow
direction:Designates
either
co-currentorcounter-currentflow
pattern.
QH2,QO2:Flow
ratesin
mL/m
inofhydrogen
andoxygen,respectively.
i1–i6:Localcurrents
inA
from
each
oftheanodesegments1–6defined
withtheoxygen
inletclosest
tosegment1.
V:Voltagein
Vmeasuredacross
theexternal
load
inthefuel
cellcircuit.
itot:Totalcurrentin
Aproducedbythefuel
cell.
Stability:Describes
thetypeanddegreeofanyfluctuationsin
thelocalcurrent.
Duration:Gives
how
longtheparticularstateofthefuel
cell’s
perform
ance
persisted.
Periodofoscillations:
Gives
theapproxim
ateperiodoftheoscillationsorfluctuations.
Max.(by.seg)magnitudeoffluctuations:
Gives
themagnitudeofthefluctuationsbased
onthelocalcurrentfrom
thesegmentexhibitingthelargestfluctuations.
Phase
change:Describes
thepointalongtheflow
channel
atwhichthelocalcurrentresponse
tochanges
inflow
orto
liquid
water
slugssw
itches
betweenincreasinganddecreasing.
Filename:Gives
thenam
eoftheraw
datafile.
1332 DOI 10.1002/aic Published on behalf of the AIChE May 2008 Vol. 54, No. 5 AIChE Journal