Embed Size (px)
Citation preview
Dropouts, Diplomas, and DollarsU.S. High Schools and the Nation’s Economy
From No Child Left Behind toEvery Child a Graduate

Dropouts, Diplomas, and DollarsU.S. High Schools and the Nation’s Economy
August 2008Jason Amos
AlliAnce for excellent educAtion
ii
dropouts, diplomAs, And dollArs
About the Alliance for Excellent EducationThe Alliance for Excellent Education is a national policy, advocacy, and research organization created to help all middle and high school students receive an excellent education.
The Alliance focuses on America’s six million most at-risk secondary school students (those in the lowest achievement quartile), who are likely to leave school without a diploma or graduate unprepared for a productive future. Based in Washington, DC, the Alliance works to make it possible for these students to achieve at high academic levels and graduate prepared for college, the modern workplace, and citizenship.
The Alliance’s audience includes parents, teachers, and students, as well as the federal, state, and local policy communities, education organizations, the media, and a concerned public.
To inform the national debate about education policies and options, the Alliance produces reports and other materials, presents at meetings and conferences, briefs policymakers and the press, and provides timely information to a wide audience through its biweekly newsletter Straight A’s and its regularly updated website (www.all4ed.org).
AcknowledgmentsThe Alliance for Excellent Education is grateful to the experts whose work provided much of the research that informed this report, as well as briefs published earlier by the Alliance: Bob Balfanz, Johns Hopkins University; Clive Belfield, Queens College, City University of New York; Anthony Carnevale, Global Institute on Education and the Workforce at Georgetown University; Duncan Chaplin, Mathematica Policy Research; Aurora D’Amico, National Center for Education Statistics; Elena Gouskova, University of Michigan Institute for Social Research; Jay Greene, Manhattan Institute for Policy Research; Jane Hannaway, Urban Institute; Eric Hanushek, Hoover Institution of Stanford University; Harry Holzer, Georgetown Public Policy Institute; Patrick Kelly, National Center for Higher Education Management Systems; John Kraman, Achieve, Inc.; Nettie Legters, Johns Hopkins University; Henry M. Levin, Teachers College of Columbia University; Lance Lochner, University of Western Ontario; Daniel Losen, Civil Rights Project at UCLA; Enrico Moretti, University of California, Berkeley; Peter Muennig, Mailman School of Public Health at Columbia University; Cecilia Rouse, Princeton University; Frank Stafford, University of Michigan Institute for Social Research; Christopher Swanson, Editorial Projects in Education Research Center; and Nancy White, U.S. Census Bureau.
This report was authored by Jason Amos, director of communications at the Alliance for Excellent Education. Valuable assistance was provided by many members of the Alliance’s staff, former and current. Particular thanks go to Jeremy Ayers, Daniel Luzer, Jamecca Marshall, and Michelle Klink, as well as to Sofia Bahena and Eric Richmond.
The Alliance is grateful to the Bill & Melinda Gates Foundation for the support that allowed this report to be developed and published. It also wishes to thank the MetLife Foundation for the funding that made possible much of the research that is presented here on the economic impact of improving educational outcomes for America’s secondary school students.
The findings and conclusions presented in this report are those of the Alliance and do not necessarily represent the views of the funders or the original researchers.
AlliAnce for excellent educAtion dropouts, diplomAs, And dollArs
iii
Table of ContentsExecutive Summary ...........................................................................................................................1
Introduction ......................................................................................................................................5
The Dropout Crisis in the United States ...........................................................................................6
The Cost of the Crisis .....................................................................................................................11
Globalization Increases the Challenge ..............................................................................................23
Demography as Destiny? .................................................................................................................29
The Key to the Future: A Meaningful High School Diploma ..........................................................33
Appendices
Appendix 1. Estimated Additional Lifetime Income if High School Dropouts Graduated with Their Class in 2007–2008 ................................................................37
Appendix 2. The Impact of a 5 Percent Increase in Male High School Graduation Rates on Crime Reduction and Earnings .....................................................38
Appendix 3. Lifetime Savings for Medicaid and Uninsured Medical Coverage Costs if All Students in the Class of 2005–2006 Graduated from High School ......................................................................................................................39
Appendix 4. Increase in Wealth if All Heads of Households Were High School Graduates ..............................................................................................................40
Appendix 5. Annual Savings and Earnings Benefits from a Reduced Need for Community College Remediation ..............................................................................41
Appendix 6. Additional Personal Income if the Educational Attainment of African Americans, Hispanics, and Native Americans Increases to That of White Students by 2020 .............................................................................42
Appendices Methodology ..........................................................................................................43
Endnotes ...................................................................................................................................44
AlliAnce for excellent educAtion
iv
dropouts, diplomAs, And dollArs
Publishing InformationDropouts, Diplomas, and Dollars: U.S. High Schools and the Nation’s Economy was published by the Alliance for Excellent Education in August 2008.
Suggested Citation:Amos, Jason. Dropouts, Diplomas, and Dollars: U.S. High Schools and the Nation’s Economy (Washington, DC: Alliance for Excellent Education, 2008).
Ordering InformationCopies of Dropouts, Diplomas, and Dollars: U.S. High Schools and the Nation’s Economy can be downloaded from the Alliance’s website at www.all4ed.org. To request print copies of the report, please visit http://www.all4ed.org/publication_material/order_form. The first copy of the report is complimentary. Additional copies are available at a charge of $1 per copy to cover shipping and handling costs.
AlliAnce for excellent educAtion dropouts, diplomAs, And dollArs
1
Executive SummaryFor decades, Americans have been warned that U.S. dominance in the world’s economy is fading because of the country’s poor educational performance. Yet during these years, the Dow Jones Industrial Average has climbed to record highs, the U.S. gross domestic product has continued to grow, and the nation has enjoyed the longest economic expansion in its history.
At the same time, however, shifts have been taking place in society that portend—unless Americans begin to pay attention and make some significant changes—a major alteration in this positive economic status. Among the largest shifts is that the educational requirements of the jobs that have supported a strong economy are changing. The U.S. Department of Labor estimates that 90 percent of new high-growth, high-wage jobs will require some postsecondary education, in comparison to decades past, when even a high school dropout could find a position in the manufacturing or agricultural sectors that would support a family in a middle-class lifestyle.1 Today, many jobs once held by high school dropouts or by individuals who had attained only a high school diploma are being automated or going overseas, leaving minimally educated Americans with increasingly diminished options to support themselves and their families.
No longer is the United States the world leader in graduating students from high school and college. This fall, more than four million students across the country will enter the ninth grade. Over the next four years, a third of these students will drop out before attaining a diploma; another third will graduate without having gained the skills and knowledge necessary to succeed in work or postsecondary education. In fact, for every one hundred ninth-grade students, only forty enroll in college immediately after high school, only twenty-seven are still enrolled in their sophomore year, and only eighteen graduate from two-year colleges within three years or four-year colleges within six.2
Individuals who fail to earn a high school diploma are at a great disadvantage, and not only when it comes to finding good-paying jobs. They are also generally less healthy and die earlier, are more likely to become parents when very young, are more at risk of tangling with the criminal justice system, and are more likely to need social welfare assistance. Even more tragic, their children are more likely to become high school dropouts themselves, as are their children’s children, and so on, in a possibly endless cycle of poverty.
Over the next twenty-five years the challenges are unlikely to diminish. The world will continue to change, and good jobs will require even higher levels of education. And the retirement of the baby boom generation will create even more demand for new well-educated candidates to replace them in the workforce.
Another factor influencing the future of the nation’s economy is the country’s increasing racial and ethnic diversity. In the coming decades, the labor force is expected to become even more diverse than it is now, as minorities, with higher population growth through immigration, higher fertility rates, and higher labor force participation rates, are projected to expand their proportion of the workforce considerably.
AlliAnce for excellent educAtion
2
dropouts, diplomAs, And dollArs
But currently, America’s high schools are failing to educate large percentages of the minority population. While about 70 percent of all American high school students graduate in the expected four years, the figures are much lower for minority populations. Only 57.8 percent of Hispanic, 55.3 percent of African American, and 50.6 percent of Native American students graduate on time, compared to 77.6 percent of white students.
If minority populations continue to grow larger as a percentage of the population, as predicted, and if their low graduation rates remain the same, the national graduation rate will begin to fall as a growing number of minority students are left behind. Already, minority students account for more than half of the nation’s dropouts, even though they make up less than half of the nation’s total public school population.
The United States can no longer absorb the costs and losses associated with an education system that already produces more than 1.2 million dropouts every year. Clearly, the dropouts themselves suffer the most direct impact. But the economy, social fabric, and security of the nation, states, and local communities are also affected. The opportunities these young people will miss throughout their lives will have cumulative costs for them as individuals and also represent a significant lost opportunity for the country. Consider the following:*
• Overthecourseofhisorherlifetime,asinglehighschooldropoutcoststhenationapproximately$260,000 in lost earnings, taxes, and productivity. So, if the nation’s secondary schools improved to the point at which they were able to graduate all of their students, the payoff would be significant. If the students who dropped out of the Class of 2008 had graduated, for example, the nation’s economy would have benefited from an additional $319 billion in income over their lifetimes.
• Highschooldropoutsarefarmorelikelythanhighschoolgraduatestobearrestedorincarcer-ated. Increasing the high school graduation rate and college matriculation for male students by only 5 percent would lead to combined savings and revenue of almost $8 billion each year.
• Eachstudentwhograduatesfromhighschoolwillsavestatesanaverageof$13,706inMedicaid and expenditures for uninsured care over the course of his or her lifetime. States could save more than $17 billion if those young people earned their high school diplomas.
• Forevery$500ofwealththathouseholdsheadedbyahighschooldropoutaccumulate,house-holds headed by high school graduates possess approximately $5,000. This means that there would be an additional $74 billion in collective wealth in the United States if every household were headed by an individual with at least a high school diploma.
• Becausetoomanystudentsarenotlearningtheskillstheyneedtosucceedincollegeorworkwhile they are in high school, the nation loses more than $3.7 billion a year in costs associated with college remediation.
• IfhighschoolsandcollegeswereabletoraisethegraduationratesofHispanic,AfricanAmerican,and Native American students to the levels of white students by 2020, the potential increase in personal income across the nation would add, conservatively, more than $310 billion to the U.S. economy.
* These costs should not be aggregated.
AlliAnce for excellent educAtion dropouts, diplomAs, And dollArs
3
The stunning potential economic benefit to the nation and the states of improving outcomes for academically underserved youth through improved schooling should be a wake-up call. The importance of reforming America’s high schools cannot be understated; the nation truly needs the economic and social contributions these young people can make. The realities of global competitiveness, the rapidly diminishing prospects of those students whose high schools fail to prepare them for college and work, and the resulting widening opportunity gap all make high school reform an imperative from an economic, national security, and civil rights perspective.
Reforming the nation’s high schools will not be an easy process, and the kind of comprehensive school reform needed to ensure that all students have the opportunity to succeed and graduate prepared for the future is not simple. But knowledge is growing, and research and proven practice are providing the lessons that educators, policymakers, and others need to move forward toward effective reforms that will benefit all students and have a lasting and positive impact on America’s economy and global competitive position.
The time to act is now. In an increasingly global economy, American secondary schools and their students must achieve at increasingly higher levels to allow the country to maintain its competitive advantage. Ensuring that all secondary students are prepared to succeed in college and work is a giant step in the right direction and will benefit individuals and society for decades to come.
Without systemic reform, prospects for the nation’s economic prosperity will be severely damaged; today’s dropouts and undereducated graduates will become tomorrow’s poorly educated workers, struggling to find jobs and support their families. Instead of an education system that ensures that every child is a high school graduate prepared for college and success in life, the nation will be left with middle and high schools that typify the old adage, “You get what you pay for.”

AlliAnce for excellent educAtion
4
dropouts, diplomAs, And dollArs
AlliAnce for excellent educAtion dropouts, diplomAs, And dollArs
5
IntroductionBill Gates has called them “obsolete.”3 Oprah Winfrey has said that the nation is in a “state of emergency” because of them.4 Former U.S. Secretary of Education Rod Paige has called them an “unrecognized educational crisis.”5
They are America’s high schools. Designed for an era long since passed, many of the country’s high schools no longer serve the needs of a nation powered by innovation and fueled by knowledge and skills. Instead of cultivating young minds and preparing the nation’s next generation of leaders, America’s high schools are hemorrhaging talent at the rate of seven thousand students every school day—a steady drip that grows into a tidal wave of more than 1.2 million dropouts each year, a number equal to the entire population of Dallas or San Diego.6
Fifty years ago, the nation could afford to lose large numbers of students before graduation because high school dropouts could still land well-paying jobs and support their families. But times have changed. Today, jobs that require relatively little education are increasingly done by machines or shipped overseas, and individuals who fail to earn a high school diploma are at a great disadvantage when it comes to finding a good-paying job. They are also generally less healthy and die earlier, are more likely to become parents when very young, are more at risk of tangling with the criminal justice system, and are more likely to need social welfare assistance. Even more tragic, their children are more likely to become high school dropouts themselves, as are their children’s children, and so on, in an endless cycle of poverty.7
There is not only a moral imperative to provide every student with an equal opportunity to pursue the American dream; there is also an economic argument for helping more students graduate from high school. Most people understand the heavy yoke that high school students place around their own necks when they drop out of school, but few understand that the drag goes far beyond the impact on the individuals. High school dropouts influence a community’s economic, social, and civic health. Having a large number of high school dropouts makes it more difficult for cities and states to attract new business. At the same time, additional spending on social programs and the criminal justice system drains state and federal coffers. Increasing numbers of dropouts translate not only into lost human potential and lower tax revenues, but also a vitiated democracy and a weakened ability to compete in the global economy.
The nation can no longer afford to lose more than a million students every school year. The situation is nothing short of a crisis, but it is largely ignored by the media and the public. This report seeks to help all Americans—whether they have a direct connection with schools or not—understand their own personal stake in ensuring that every child becomes a high school graduate, prepared for success in college, the modern workplace, and life.
AlliAnce for excellent educAtion
6
dropouts, diplomAs, And dollArs
The Dropout Crisis in the United States“When I grow up, I want to be a high school dropout.” That’s certainly not a response that anyone would expect to hear from young children about their career plans. But right now in the United States, six million children in grades seven through twelve alone are at risk of dropping out of high school.8
Meet “Jake.”* Jake is a fourteen-year-old white male from Virginia Beach, Virginia. He loves football and is a huge fan of the Washington Redskins. Jake is looking forward to starting high school in the fall because he’ll get the chance to try out for the junior varsity football team. As a student in Virginia Beach, Jake has a 68.5 percent chance of graduating from high school, which is pretty close to the national average of 70.6 percent.9
Meet “Marcus.” Marcus is a fifteen-year-old African American male from Detroit. He’s not a huge football fan, but he loves basketball and the Detroit Pistons. Like Jake, Marcus will start high school this fall, but his prospects for making it to graduation day are dimmer than Jake’s. It is much more likely that Marcus will drop out of school rather than earn his diploma; students enrolled in Detroit public schools have only a 37.5 percent chance of graduating.10
Meet “Christina.” Christina is a fourteen-year-old Hispanic female from Cypress, Texas. Located about twenty miles from Houston, Cypress is one of the most affluent urban areas in the United States. Christina loves shopping and American Idol. She too will start high school in the fall, but she has a much better chance of receiving her diploma than Jake and Marcus do; the Cypress-Fairbanks school district has an 89.6 percent graduation rate.11
Jake, Marcus, and Christina represent three of the millions of high school students who will start high school in the fall. Unfortunately, four years from now they may be among the more than one million students who dropped out of school prior to graduation day.12
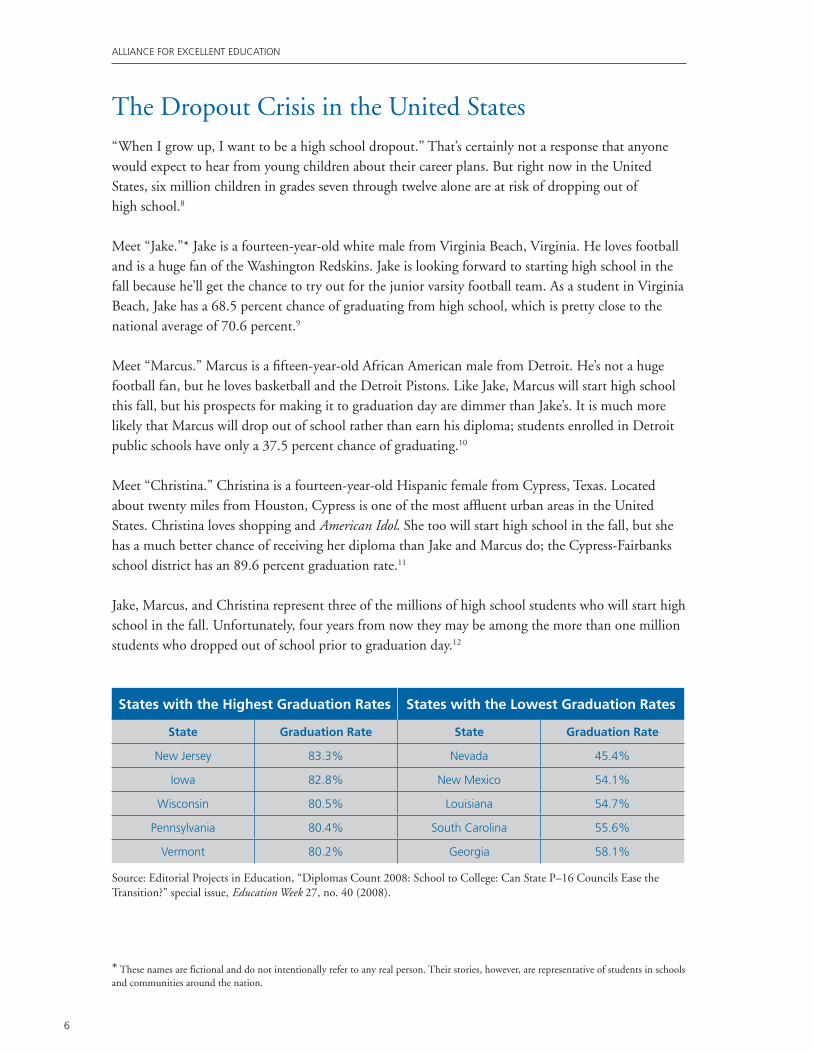
States with the Highest Graduation Rates States with the Lowest Graduation Rates
State Graduation Rate State Graduation Rate
new Jersey 83.3% nevada 45.4%
iowa 82.8% new mexico 54.1%
Wisconsin 80.5% louisiana 54.7%
pennsylvania 80.4% south carolina 55.6%
Vermont 80.2% Georgia 58.1%
Source: Editorial Projects in Education, “Diplomas Count 2008: School to College: Can State P–16 Councils Ease the Transition?” special issue, Education Week 27, no. 40 (2008).
* These names are fictional and do not intentionally refer to any real person. Their stories, however, are representative of students in schools and communities around the nation.
AlliAnce for excellent educAtion dropouts, diplomAs, And dollArs
7
According to independent estimates, only about 70 percent of high school students in the United States receive their high school diploma in the standard four years.13 That number varies widely depending on where students go to school, their gender, and their racial and ethnic background. At the state level, for example, students in New Jersey, Iowa, Wisconsin, Pennsylvania, and Vermont graduate at a rate of at least 80 percent, while students in Nevada, New Mexico, Louisiana, South Carolina, the District of Columbia, and Georgia graduate at a rate of less than 60 percent.
Even within these states, there’s a wide variation in graduation rates for African American, Latino, and American Indian students, who tend to have much lower rates than their white or Asian peers. In Iowa, for example, white students graduate at a rate of 84.8 percent, while African American (58.6 percent) and Hispanic (54 percent) students trail by more than 25 percentage points. In Wisconsin, the graduation rate gap is even more staggering, with white students, at 85.5 percent, graduating at rates more than 40 percentage points higher than African American students, whose average gradu-ation rate is only 43.9 percent. Hispanic students, who graduate at a rate of 48 percent, do not fare much better.14
Iowa and Wisconsin are certainly not alone. In fact, sixteen of the thirty-nine states for which there is available data have a white-Hispanic graduation rate gap of more than 25 percentage points, while eleven of thirty-nine states have a white–African American graduation rate gap of more than 25 percentage points.15
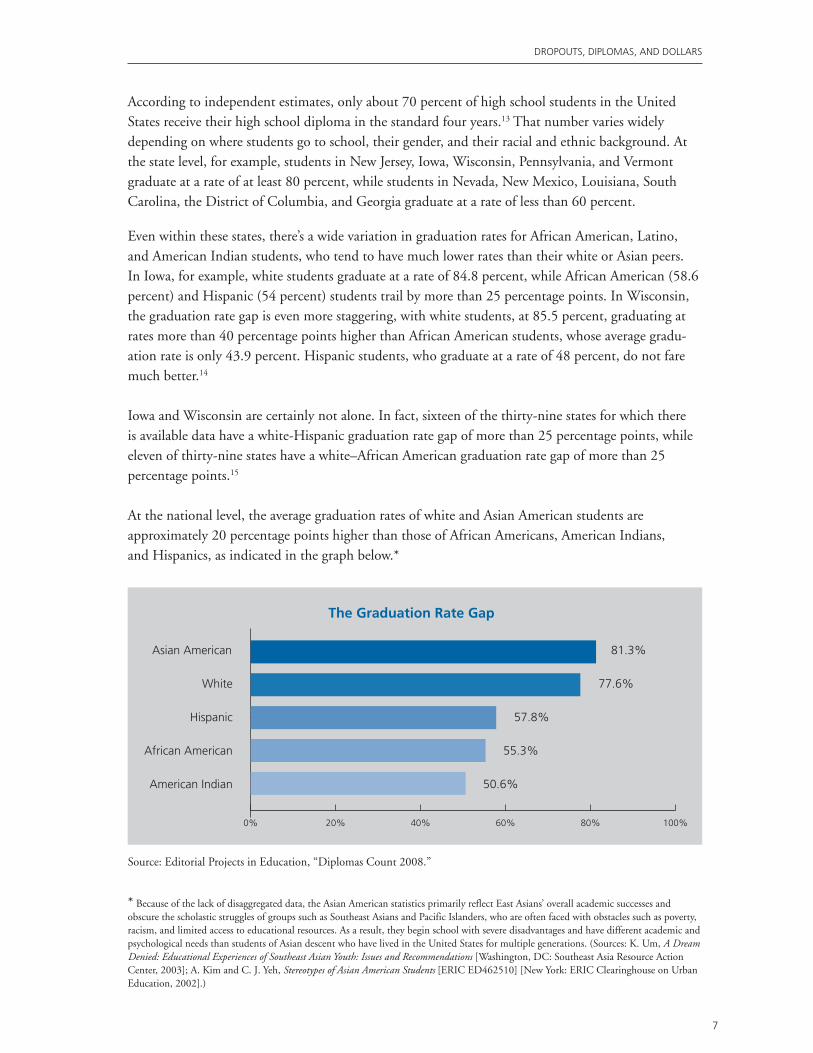
At the national level, the average graduation rates of white and Asian American students are approximately 20 percentage points higher than those of African Americans, American Indians, and Hispanics, as indicated in the graph below.*
White
Asian American
Hispanic
African American
American Indian
77.6%
81.3%
57.8%
55.3%
50.6%
0% 20% 40% 60% 80% 100%
The Graduation Rate Gap
Source: Editorial Projects in Education, “Diplomas Count 2008.”
* Because of the lack of disaggregated data, the Asian American statistics primarily reflect East Asians’ overall academic successes and obscure the scholastic struggles of groups such as Southeast Asians and Pacific Islanders, who are often faced with obstacles such as poverty, racism, and limited access to educational resources. As a result, they begin school with severe disadvantages and have different academic and psychological needs than students of Asian descent who have lived in the United States for multiple generations. (Sources: K. Um, A Dream Denied: Educational Experiences of Southeast Asian Youth: Issues and Recommendations [Washington, DC: Southeast Asia Resource Action Center, 2003]; A. Kim and C. J. Yeh, Stereotypes of Asian American Students [ERIC ED462510] [New York: ERIC Clearinghouse on Urban Education, 2002].)
AlliAnce for excellent educAtion
8
dropouts, diplomAs, And dollArs
But economic situation, not race or ethnic background, is the demographic indicator most closely correlated with student performance. In fact, high school students from the wealthiest family backgrounds are about seven times more likely to complete high school as their classmates from the poorest backgrounds.16
Robert Balfanz and Nettie Legters, a research team at Johns Hopkins University, have found a “near perfect linear relationship” between a high school’s poverty level and its tendency to lose large numbers of students between ninth and twelfth grade. In the states Balfanz and Legters have examined in more depth, minorities are promoted to twelfth grade at the same or greater rates as white students when they attend middle-class or affluent high schools in which few students live in poverty. Unfortunately, the researchers have also found that relatively few minority students attend these high schools; minorities are more likely to be concentrated in high schools with high poverty and low graduation rates.17
Thanks to research from Balfanz and Legters, as well as Christopher B. Swanson of the Editorial Projects in Education Research Center, data exists that allows one to zoom in and see how students are performing at the district and school levels. Even in this micro view, disparities are apparent across counties and within school districts.
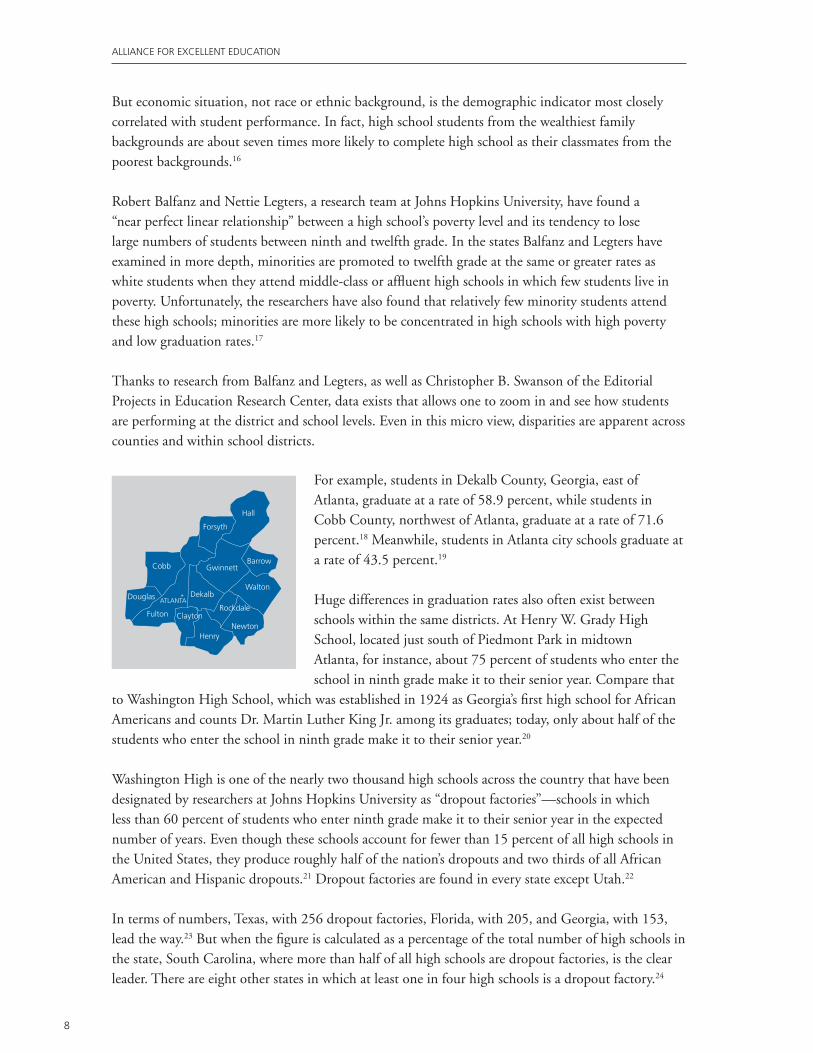
For example, students in Dekalb County, Georgia, east of Atlanta, graduate at a rate of 58.9 percent, while students in Cobb County, northwest of Atlanta, graduate at a rate of 71.6 percent.18 Meanwhile, students in Atlanta city schools graduate at a rate of 43.5 percent.19
Huge differences in graduation rates also often exist between schools within the same districts. At Henry W. Grady High School, located just south of Piedmont Park in midtown Atlanta, for instance, about 75 percent of students who enter the school in ninth grade make it to their senior year. Compare that
to Washington High School, which was established in 1924 as Georgia’s first high school for African Americans and counts Dr. Martin Luther King Jr. among its graduates; today, only about half of the students who enter the school in ninth grade make it to their senior year.20
Washington High is one of the nearly two thousand high schools across the country that have been designated by researchers at Johns Hopkins University as “dropout factories”—schools in which less than 60 percent of students who enter ninth grade make it to their senior year in the expected number of years. Even though these schools account for fewer than 15 percent of all high schools in the United States, they produce roughly half of the nation’s dropouts and two thirds of all African American and Hispanic dropouts.21 Dropout factories are found in every state except Utah.22
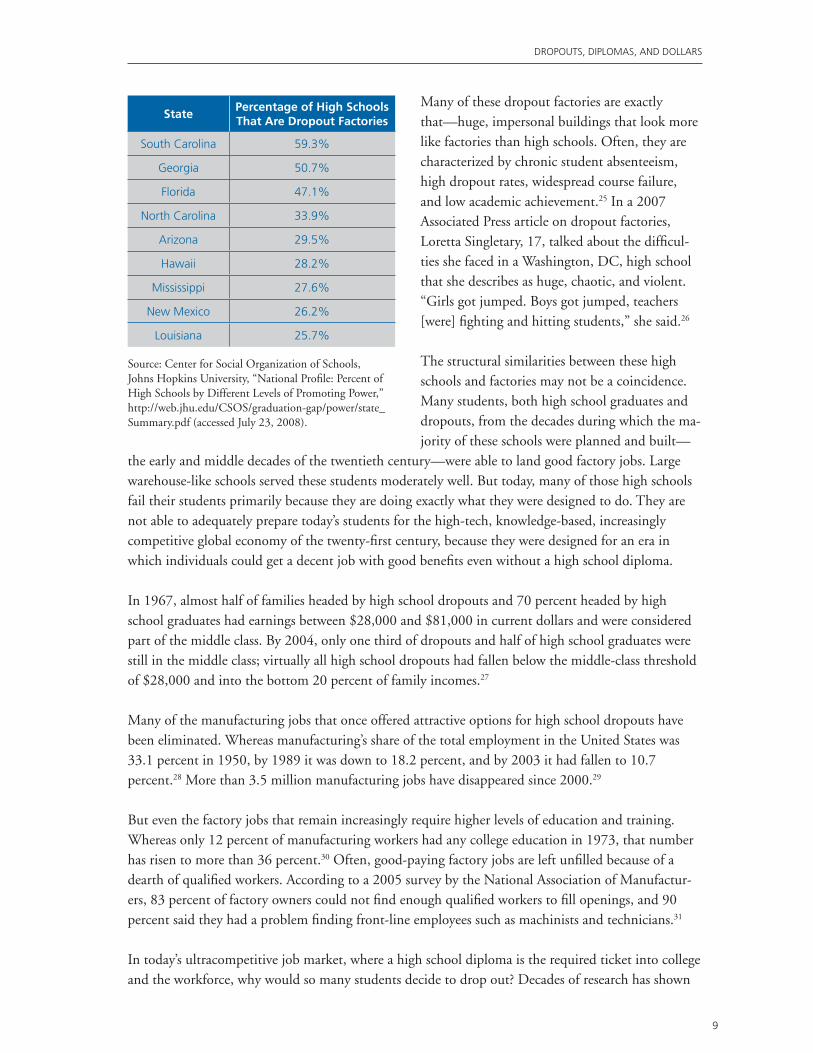
In terms of numbers, Texas, with 256 dropout factories, Florida, with 205, and Georgia, with 153, lead the way.23 But when the figure is calculated as a percentage of the total number of high schools in the state, South Carolina, where more than half of all high schools are dropout factories, is the clear leader. There are eight other states in which at least one in four high schools is a dropout factory.24
Hall
Forsyth
Barrow
Walton
NewtonHenry
ClaytonFulton
Douglas
Cobb
Dekalb
Gwinnett
* ATLANTA
Rockdale
AlliAnce for excellent educAtion dropouts, diplomAs, And dollArs
9
Many of these dropout factories are exactly that—huge, impersonal buildings that look more like factories than high schools. Often, they are characterized by chronic student absenteeism, high dropout rates, widespread course failure, and low academic achievement.25 In a 2007 Associated Press article on dropout factories, Loretta Singletary, 17, talked about the difficul-ties she faced in a Washington, DC, high school that she describes as huge, chaotic, and violent. “Girls got jumped. Boys got jumped, teachers [were] fighting and hitting students,” she said.26
The structural similarities between these high schools and factories may not be a coincidence. Many students, both high school graduates and dropouts, from the decades during which the ma-jority of these schools were planned and built—
the early and middle decades of the twentieth century—were able to land good factory jobs. Large warehouse-like schools served these students moderately well. But today, many of those high schools fail their students primarily because they are doing exactly what they were designed to do. They are not able to adequately prepare today’s students for the high-tech, knowledge-based, increasingly competitive global economy of the twenty-first century, because they were designed for an era in which individuals could get a decent job with good benefits even without a high school diploma.
In 1967, almost half of families headed by high school dropouts and 70 percent headed by high school graduates had earnings between $28,000 and $81,000 in current dollars and were considered part of the middle class. By 2004, only one third of dropouts and half of high school graduates were still in the middle class; virtually all high school dropouts had fallen below the middle-class threshold of $28,000 and into the bottom 20 percent of family incomes.27
Many of the manufacturing jobs that once offered attractive options for high school dropouts have been eliminated. Whereas manufacturing’s share of the total employment in the United States was 33.1 percent in 1950, by 1989 it was down to 18.2 percent, and by 2003 it had fallen to 10.7 percent.28 More than 3.5 million manufacturing jobs have disappeared since 2000.29
But even the factory jobs that remain increasingly require higher levels of education and training. Whereas only 12 percent of manufacturing workers had any college education in 1973, that number has risen to more than 36 percent.30 Often, good-paying factory jobs are left unfilled because of a dearth of qualified workers. According to a 2005 survey by the National Association of Manufactur-ers, 83 percent of factory owners could not find enough qualified workers to fill openings, and 90 percent said they had a problem finding front-line employees such as machinists and technicians.31
In today’s ultracompetitive job market, where a high school diploma is the required ticket into college and the workforce, why would so many students decide to drop out? Decades of research has shown
StatePercentage of High Schools That Are Dropout Factories
south carolina 59.3%
Georgia 50.7%
florida 47.1%
north carolina 33.9%
Arizona 29.5%
Hawaii 28.2%
mississippi 27.6%
new mexico 26.2%
louisiana 25.7%
Source: Center for Social Organization of Schools, Johns Hopkins University, “National Profile: Percent of High Schools by Different Levels of Promoting Power,” http://web.jhu.edu/CSOS/graduation-gap/power/state_Summary.pdf (accessed July 23, 2008).
AlliAnce for excellent educAtion
10
dropouts, diplomAs, And dollArs
that “[dropping out of ] high school represents a confluence of individual, social, family, cultural, socioeconomic, and institutional factors…. Dropping out is best understood as the ultimate end to a gradual process that often begins as early as school entry and through which students lose interest and significance for what schooling offers them.”32
The decision to drop out is rarely the result of a single life event; many students exhibit academic warning signs years before they leave high school. Using longitudinal data—information about individual students’ progress over time—respected researchers from Johns Hopkins University, the Consortium on Chicago School Research (CCSR), and the Parthenon Group, among others, have examined the academic history of dropouts to identify their shared academic characteristics. Students who dropped out usually had received a failing grade in core courses (especially in math or English), earned a low grade point average, or scored low on achievement tests. They were often retained in grade because they had not earned enough credits to be promoted; as a result, many were older than the other students in their class. Fur-thermore, as demonstrated by low attendance rates and disciplinary problems, these students were frequently not engaged in their education or aware of its importance to future opportunities.33
Whatever the causes, a decision to drop out of high school is a disastrous one. Among other variables, it makes no long-term financial sense—for either the stu-dents or the society in which they live.
our real problem is the bottom 30
percent of u.s. schools, those in urban
and rural communities full of low-
income children.
We have seen enough successful
schools in such areas to know that
many of those children are just as
capable of being great scientists,
doctors, and executives as suburban
children are.
But most low-income schools in the
united states are simply bad. not
only are we denying the children who
attend them the equal education that
is their right, but we are squandering
almost a third of our intellectual
capital. We are beating the world
economically, but with one hand tied
behind our back.
—Jay matthews, Washington Post
education reporter, writing in the
spring 2008 issue of the Wilson
Quarterly
AlliAnce for excellent educAtion dropouts, diplomAs, And dollArs
11
The Cost of the CrisisThe costs and losses associated with a secondary school system that allows one third of its students to drop out and another third to graduate without the knowledge and skills they need goes beyond the students themselves.34 Clearly, the dropouts suffer the most direct impact. But the economy, social fabric, and security of the nation, states, and local communities are also adversely affected.
The Million-Dollar Mistake
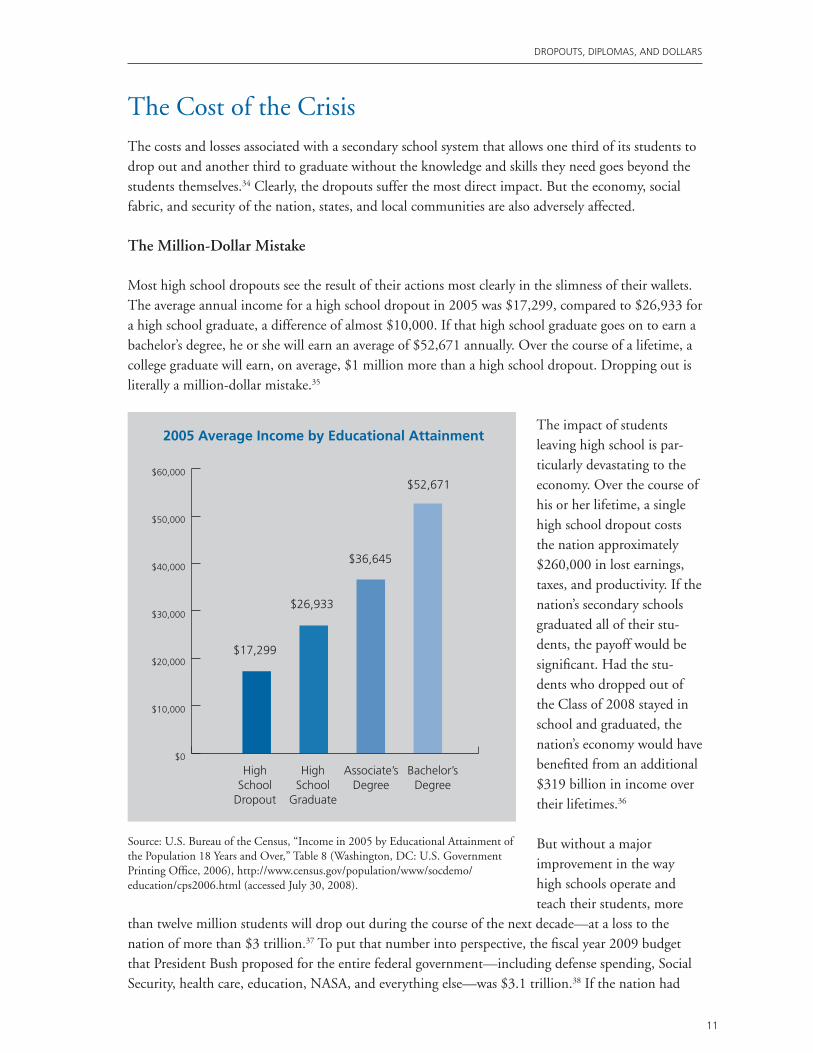
Most high school dropouts see the result of their actions most clearly in the slimness of their wallets. The average annual income for a high school dropout in 2005 was $17,299, compared to $26,933 for a high school graduate, a difference of almost $10,000. If that high school graduate goes on to earn a bachelor’s degree, he or she will earn an average of $52,671 annually. Over the course of a lifetime, a college graduate will earn, on average, $1 million more than a high school dropout. Dropping out is literally a million-dollar mistake.35
The impact of students leaving high school is par-ticularly devastating to the economy. Over the course of his or her lifetime, a single high school dropout costs the nation approximately $260,000 in lost earnings, taxes, and productivity. If the nation’s secondary schools graduated all of their stu-dents, the payoff would be significant. Had the stu-dents who dropped out of the Class of 2008 stayed in school and graduated, the nation’s economy would have benefited from an additional $319 billion in income over their lifetimes.36
But without a major improvement in the way high schools operate and teach their students, more
than twelve million students will drop out during the course of the next decade—at a loss to the nation of more than $3 trillion.37 To put that number into perspective, the fiscal year 2009 budget that President Bush proposed for the entire federal government—including defense spending, Social Security, health care, education, NASA, and everything else—was $3.1 trillion.38 If the nation had
$0
$10,000
$20,000
$30,000
$40,000
$50,000
$60,000
High School
Dropout
High School
Graduate
Associate’sDegree
Bachelor’sDegree
$17,299
$26,933
$36,645
$52,671
2005 Average Income by Educational Attainment
Source: U.S. Bureau of the Census, “Income in 2005 by Educational Attainment of the Population 18 Years and Over,” Table 8 (Washington, DC: U.S. Government Printing Office, 2006), http://www.census.gov/population/www/socdemo/education/cps2006.html (accessed July 30, 2008).
AlliAnce for excellent educAtion
12
dropouts, diplomAs, And dollArs
graduated 100 percent of its high school students ten years ago, the money the additional graduates would have put back into the economy would have covered the entire cost of running the federal government in 2009.
Appendix 1 shows the economic benefits each state could accrue over the lifetimes of just one year’s dropouts if those students could be converted to graduates. The numbers vary from state to state. Vermont (at the low end) would see its economy increase by $439 million; Mississippi (near the middle) would add $3.98 billion; and California’s economy (at the high end) would accrue an additional $42 billion over the lifetime of the students of each graduating class. These figures are conservative, and do not take into account the added economic growth generated from each new dollar put into the economy.
A high school dropout might gain a temporary earnings advantage over someone who is still in high school but not working, or working only part-time. But after graduation day, high school dropouts will lag behind their better-educated peers for the rest of their lives.
The Dropout to Prison Pipeline
According to “One in 100: Behind Bars in America 2008,” a study by the PEW Center on the States, the United States has the largest per-capita prison population in the world (followed by Russia). As a result of the rapid growth in the number of individuals incarcerated in the United States, total state spending on corrections topped $49 billion in 2007, up from $12 billion in 1987. By 2011, continued prison growth is expected to cost states an additional $25 billion.39
Dropping out of school does not automatically result in a life of crime, of course. Indeed, the vast majority of individuals who leave high school without diplomas are, and remain, law-abiding citizens. High school dropouts are, however, more likely than others to be arrested or incarcerated. Far too many will spend their lives in a state of uncertainty—financial and otherwise—which unfor-tunately means there is an increased likelihood that they will cycle in and out of prison. A 2003 report from the Bureau of Justice Statistics found that nearly 75 percent of America’s state prison inmates, almost 60 percent of federal inmates, and almost 70 percent of jail inmates had not completed high school.40
Judging by these numbers, it should not come as a surprise that lower educational attainment levels increase the likelihood that individuals, particularly males, will be arrested and/or incarcerated. A study that looked at state prisoners’ education levels in 1997 showed that male inmates were about twice as likely as their counterparts in the general population to have not completed high school or its equivalent. It also found that four times as many males in the general population had attended some college or other postsecondary classes than those in prison.41
on my BlackBerry, i get the major
crimes that happen in this city as they
happen on a real-time basis. i always
say … when you find the suspect,
you can be certain it will almost
always be a high school dropout
and/or somebody who can’t read or
write. there is a connection, make no
mistake about it, with the dropout
rate.
—los Angeles mayor Antonio
Villaraigosa, writing in the Los Angeles
Times, August 4, 2006
AlliAnce for excellent educAtion dropouts, diplomAs, And dollArs
13
Theories abound as to why people with more education commit less crime. To list a few:
• Someonewithahighschooldiplomaorbetterearnshigherwagesthroughlegitimatework,thus reducing the individual’s perceived need to commit a crime or raising the potential cost of crime —getting caught and being incarcerated—to unacceptable levels.
• Thestigmaofacriminalconvictionmaybegreaterforprofessionalworkers,whotendtohavehigher levels of education, than for those in lower-paying, lower-skilled jobs.
• Moretimespentintheclassroommayplayaroleininstillingvaluesthatareopposedtocriminal actions.
• Criminalbehaviorthatbeginsduringyouthcancontinueintoadulthood.Bykeepingadolescents in the classroom and off the streets, later criminal activity may be avoided.
Whatever the underlying causes, education is clearly related to crime prevention and the personal safety of the population.
Estimates on how likely a dropout is to be arrested vary. The Coalition for Juvenile Justice has found that “dropouts are three and a half times more likely than high school graduates to be arrested,”42 while a more recent survey of dropouts concludes that they are “more than eight times as likely to be in jail or prison.”43 However the numbers are calculated, the larger message remains the same: individuals with lower levels of education are more likely to commit crimes and be jailed than their better-educated peers.44
The financial cost of crime to communities, states, and the nation cannot be overstated. It includes expenses related to medical care for victims, loss of victims’ income, reduced tax revenue as a result of lost wages, and rising police payrolls and court operating budgets. Most expensive of all is the cost of incarcerating convicted criminals.
Were America to increase the number of high school graduates, it could significantly reduce the na-tion’s crime-related costs and add billions of dollars to the economy through the additional wages those graduates would earn. Methods outlined by economists Lance Lochner of the University of Western Ontario and Enrico Moretti of the University of California at Berkeley produce a conserva-tive estimate of the benefit: increasing the high school graduation rate and college matriculation for male students by only 5 percent would lead to combined savings and revenue of almost $8 billion each year. The benefits would vary from state to state: South Dakota would save $1.6 million, Okla-homa would save $63 million, and California would save almost $753 million.45
In addition to the savings directly related to crime reduction, almost $2.8 billion in additional annual earnings would enter the economy if more students graduated from high school. If an additional 5 percent of male students not only graduated but also went on to college in the same percentages as current male high school graduates, their average earnings would increase significantly.46 The benefits, again, would vary from state to state: Wyoming would see an increase of $5 million, Massachusetts would gain $55 million, and California’s economy would accrue an additional $352 million. These numbers reflect only additional wages earned, and do not include the added economic growth
AlliAnce for excellent educAtion
14
dropouts, diplomAs, And dollArs
produced by each new dollar in the economy or the additional tax revenues that would be produced. (State-by-state estimates of the annual economic benefits generated from crime-related savings and additional annual earnings can be seen in Appendix 2.)
Not only will an investment in education provide a better return than money spent on incarceration, it is also much cheaper. In the 2003–04 school year, the nation spent an average of $9,116 a year to educate a student in its K–12 system.47 At the postsecondary level, one year of tuition at a four-year public college in 2003–04 cost an average of $5,231.48 Meanwhile, the federal government estimates that it spent an average of $24,564 per inmate in 200349—which means that it’s cheaper to pay for four years of tuition at a public college than it is to house someone in prison for one year.
Decreasing Health Care Costs by Increasing Educational Attainment
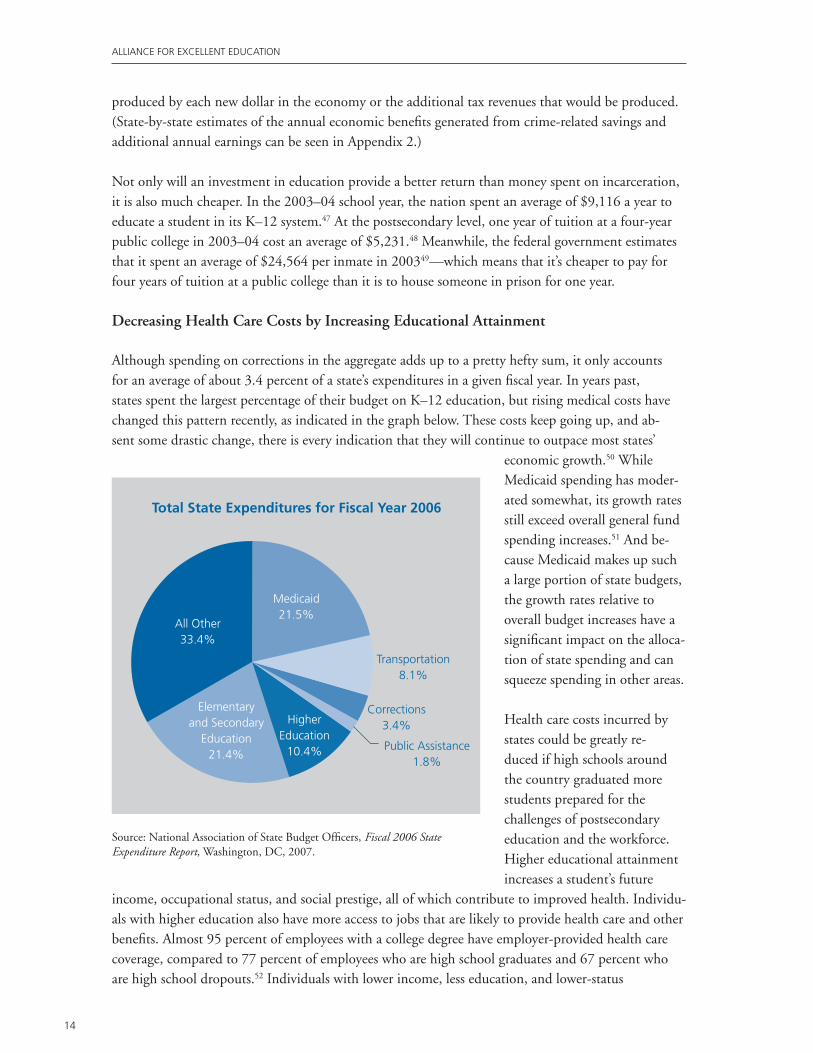
Although spending on corrections in the aggregate adds up to a pretty hefty sum, it only accounts for an average of about 3.4 percent of a state’s expenditures in a given fiscal year. In years past, states spent the largest percentage of their budget on K–12 education, but rising medical costs have changed this pattern recently, as indicated in the graph below. These costs keep going up, and ab-sent some drastic change, there is every indication that they will continue to outpace most states’
economic growth.50 While Medicaid spending has moder-ated somewhat, its growth rates still exceed overall general fund spending increases.51 And be-cause Medicaid makes up such a large portion of state budgets, the growth rates relative to overall budget increases have a significant impact on the alloca-tion of state spending and can squeeze spending in other areas.
Health care costs incurred by states could be greatly re-duced if high schools around the country graduated more students prepared for the challenges of postsecondary education and the workforce. Higher educational attainment increases a student’s future
income, occupational status, and social prestige, all of which contribute to improved health. Individu-als with higher education also have more access to jobs that are likely to provide health care and other benefits. Almost 95 percent of employees with a college degree have employer-provided health care coverage, compared to 77 percent of employees who are high school graduates and 67 percent who are high school dropouts.52 Individuals with lower income, less education, and lower-status
Total State Expenditures for Fiscal Year 2006
All Other33.4%
Medicaid21.5%
Elementaryand Secondary
Education 21.4%
Higher Education
10.4%
Transportation8.1%
Corrections3.4%
Public Assistance1.8%
Source: National Association of State Budget Officers, Fiscal 2006 State Expenditure Report, Washington, DC, 2007.
AlliAnce for excellent educAtion dropouts, diplomAs, And dollArs
15
occupations and employment tend to have poorer health; raising educational levels might very well reduce health-related expenditures for the public sector, as well as for individuals.
Research has shown that each student who graduates from high school instead of dropping out will save states an average of $13,706 in Medicaid and expenditures for uninsured care over the course of his or her lifetime.53 Savings like that add up quickly; if the approximately 1.2 million high school dropouts from the Class of 2006 had earned their diplomas, states could have saved more than $17 billion over the course of those young people’s lifetimes. Furthermore, similar savings could accrue for every additional class of high school students who graduate rather than drop out. These savings would also translate into better health and improved life prospects for the nation’s citizens.
Access to Health Care Correlates to Educational Attainment
Currently, the United States spends more than any other country on health care, and many Americans have access to the finest physicians and facilities in the world. However, Americans do not benefit equally from the care that is available. The disparities reflect socioeconomic patterns, but they are most closely correlated with educational attainment.54 A variety of interrelated factors explain this relationship.
• Peoplewithlowereducationalattainmenthavelessinsurancecoverage.Nationwide,45.8millionpeople, or 15.7 percent of the population, have no health insurance at all.55 Individuals with low levels of education are considerably less likely to have health insurance; they are also more likely to have only limited or erratic coverage, or to be uninsured for long periods of time.56 In many states, few adults (ages eighteen to sixty-four) are eligible for Medicaid coverage, leaving millions to rely on emergency rooms and other poor (and often more expensive) health care options.
• Individualswholackhealthinsurancereceivelessmedicalcareandhavepoorerhealthoutcomes. Uninsured adults with chronic illnesses are far less likely to receive care and necessary prescriptions than insured adults.57 These individuals are generally in worse health when they are first diagnosed with an illness, and the combination of late diagnosis and less consistent care often leads to poorer outcomes.58 Poor health means that those without health insurance often have more difficulty finding employment, particularly higher-paying jobs with good health benefits. Because they either lack employment or earn less due to poor health, they have a harder time affording health care. As a result, their illnesses often go untreated and become severe, and they tend to die younger than do insured people.59
• Educationleadstohealthierlives.It’snotjustaccesstohealthinsurancethatyieldsbetteroutcomes for better-educated people. Education also improves earning power and social status, and affects cognitive ability.60
Education also influences lifestyle choices, knowledge and understanding of health issues, and the health-related decisions that people make. Better-educated patients are more able to follow doctors’ instructions successfully and to navigate the medical bureaucracy. They are also less likely to make bad health decisions; smoking and obesity prevalence rates are both higher in individuals with lower income and education levels. According to the 2006 National Health Interview Survey (NHIS), 30.6 percent of adults living below the poverty level are smokers, compared to 20.4 percent of individuals living at or above the poverty level. The NHIS also found that individuals with a General Educational Development (GED) diploma are nearly five times as likely to be smokers as individuals
AlliAnce for excellent educAtion
16
dropouts, diplomAs, And dollArs
with a college degree.61 In prevalence of obesity, 29.4 percent of high school dropouts are considered obese, compared to 20 percent of college graduates.62 Occupations of people with lower educational attainment are also generally more dangerous and expose workers to greater health hazards, from han-dling heavy machinery and chemicals to being required to work shifts that disrupt sleep cycles.63
The health disparities between adults with better education and those with low educational attain-ment are striking: less-educated individuals are more likely to die precipitately from cardiovascular disease, cancer, infection, lung disease, and diabetes, for example.64 On average, a high school gradu-ate lives six to nine years longer than a dropout.65
In an analysis commissioned previously by the Alliance for Excellent Education, Dr. Peter Muennig, assistant professor at Columbia University’s Mailman School of Public Health, estimated how much states could save on health care by improving educational attainment. Specifically, Muennig examined the ways in which costs for Medicaid and uninsured care vary depending on the education of individuals.
Because educated individuals are less likely to receive Medicaid assistance and more likely to be insured, Muennig found that costs decrease with each level of educational attainment—that is, college graduates have better health and lower medical costs than high school graduates, while high school graduates have better health and lower medical costs than high school dropouts. Similarly, college graduates are far less likely to be enrolled in Medicaid or to be uninsured than are high school dropouts.66
While Medicaid enrollment requirements and the federal contribution differ in each state, the annual cost to states of Medicaid per enrollee is, on average, $8,045. To calculate how much could be saved by each state in Medicaid costs if high school dropouts became high school graduates, several elements must be considered, including the diminishing chance that an individual will enroll as he advances in educational attainment, as well as variations such as the level of each state’s contribution to Medicaid.67 Using this state-specific data, it is possible to estimate the amount that would be saved for each additional young person who graduates from high school. Differences in each state’s contribution to Medicaid cause the lifetime savings per graduate to vary considerably by state—from a low of $7,026 in Mississippi to a high of $15,143 in Colorado, Connecticut, Delaware, Illinois, Maryland, Massachusetts, Nevada, New Hampshire, New Jersey, and New York.*
Estimating the potential savings in costs for uninsured care is a more complex process, because adult individuals may be uninsured for varying lengths of time and may have more than one period of being uninsured over their lifetimes. In addition, the care they receive while uninsured may be paid for in a variety of ways, including through federal, state, and local programs, charities, or by the uninsured individual or his or her family. A variety of options for calculating these costs is available, and Muennig used a state-by-state analysis of annual uninsured costs conducted by Kenneth Thorpe in 2005. He estimated a per-graduate cost savings over a lifetime for uninsured care, matching the
* This analysis accounts for state-by-state variation in the proportion of Medicaid paid for by the state government and the proportion paid for by the federal government. However, it does not account for state-by-state differences in eligibility for Medicaid enrollment, which can result in some variations in these calculations.
AlliAnce for excellent educAtion dropouts, diplomAs, And dollArs
17
criteria used above for Medicaid cost estimates. Again, the results vary from state to state, from a low of $724 in California to a high of $1,179 in West Virginia.
Potential state savings across the lifetime of a single individual are significant; California, for example, could save $14,637 in Medicaid, and $724 in uninsured costs, for a total of $15,361 per additional graduate. According to this analysis, California’s total lifetime health savings, if all students in the Class of 2005–06 had graduated from high school—as opposed to the state’s 71 percent graduation rate that year—would have been more than $2.3 billion. (Savings for each state and the nation are available in Appendix 3.)
Nationally, a conservative estimate finds that the states could save more than $17 billion in Medicaid and expenditures for uninsured care nationally, a savings that could be earned for each class of students who graduate from high school rather than drop out.
Graduates: Healthy, Wealthy, and Wise
A citizenry that is not only healthier but also wealthier and wiser would benefit every state and the country as a whole. The earnings gap between high school graduates and dropouts is only part of the story. Families rely on income from salary for regular expenses, but real economic security requires accumulated wealth.68 Household wealth, also known as assets, is broadly defined as the accumulation of investments that appreciate over time. This wealth may take various forms, including cash investments (savings, equities, 401[k] accounts, individual retirement accounts), material possessions that hold monetary value (homes, cars, small businesses), and investments in nontangible property such as degrees.
Education can be the key to higher earnings, but it is also linked to the accumulation of assets. Research by Elena Gouskova and Frank Stafford of the University of Michigan Institute for Social Research shows that, on average, households headed by a high school graduate accumulate ten times more wealth than households headed by a high school dropout.69 Based on this finding, there would be an additional $74 billion in collective wealth in the United States if every household were headed by an individual holding at least a high school diploma. (A breakdown of exactly how much additional wealth could be accumulated in each state is contained in Appendix 4.)
Although homeownership may offer the greatest asset-accumulation opportunity for most Americans, this calculation does not include the value of housing, and therefore should be considered an extremely conservative estimate. The value of homes was excluded because mortgage holders may also have considerable debt associated with the home, and the market value of homes often fluctuates in unpredictable ways. That said, since a home is the most valuable asset most families have—and graduates are more likely to be able to afford that investment—the $74 billion figure may significantly understate the potential loss to nongraduates.
Even the conservative estimate of $74 billion, however, represents much more than just extra money in the pockets of low-income individuals. It also represents the additional financial security and op-portunities that are lost—by individuals, families, communities, and states—because of an education system that is failing the students who drop out of high school each year.
AlliAnce for excellent educAtion
18
dropouts, diplomAs, And dollArs
Wealth is critical to the economic well-being of individuals and families for several reasons, and is the best gauge of a household’s financial security and prospects.70 While fewer than 13 percent of American households live below the official poverty line, more than a quarter live paycheck to paycheck, with negligible or nonexistent net worth.71 Perhaps the most important benefit of wealth is the cushion that accumulated assets provide for families that face sudden unemployment, disabling medical situations, or other financial emergencies.72 Regular income helps families pay for day-to-day living expenses; assets allow them to survive financial hardships. But 25.5 percent of all American households have insufficient net worth to sustain living at the federal poverty level for three months if their income were disrupted.73
The ownership of assets that can be converted to cash can make the difference between a family’s continuing economic viability and bankruptcy, homelessness, or other lasting financial calamity. Families can convert assets to cash to cover living expenses, and they can borrow against assets (for example, a retirement account) at better commercial loan rates and with greater ease than those without similar assets.
Accumulated wealth has other long-term benefits. Assets can be invested in higher education, which leads to ever-increasing levels of income and wealth.74 Families with greater wealth are also more likely to have the resources, time, and educational background to support their children’s education, such as fostering the development of reading skills, participating in school activities, and encouraging their children to make ambitious academic choices.75
Wealth also confers other advantages that make further wealth generation more likely. Buying a house in a desirable neighborhood, starting a business, paying for higher education, or funding a comfortable retirement are all ways that families increase their long-term financial security and improve financial prospects for themselves and their children.76
The capacity to improve future financial status for one’s children and grandchildren is the most enduring benefit that wealth offers. Young people who have resources for college costs, professional training, housing, or starting businesses have significant advantages over their peers. They are better able to absorb the opportunity costs of education or internships that strain personal finances in the short term but have powerful impacts on long-term earning power, and they have less debt as they begin their careers and start their own families. Indeed, it is in large part because wealth can be inherited that it has a greater effect on individual prosperity than income.77
Most economists view wealth as a much more important determinant of economic status than earnings because of the long-range advantage it provides in almost every aspect of life.78 Both wealth and poverty tend to perpetuate themselves: the effects of wealth are so significant that it can take as long as five generations for them to disappear.79
As individuals and families benefit from greater wealth, so do the communities in which they live. Research indicates that communities benefit from the increased homeownership, greater levels of entrepreneurship, and higher levels of educational attainment that come with asset accumulation. Communities also enjoy greater neighborhood stability, increased civic involvement and voting par-ticipation, and reduced need for public assistance.
AlliAnce for excellent educAtion dropouts, diplomAs, And dollArs
19
College Remediation: A Limiting and Expensive Factor
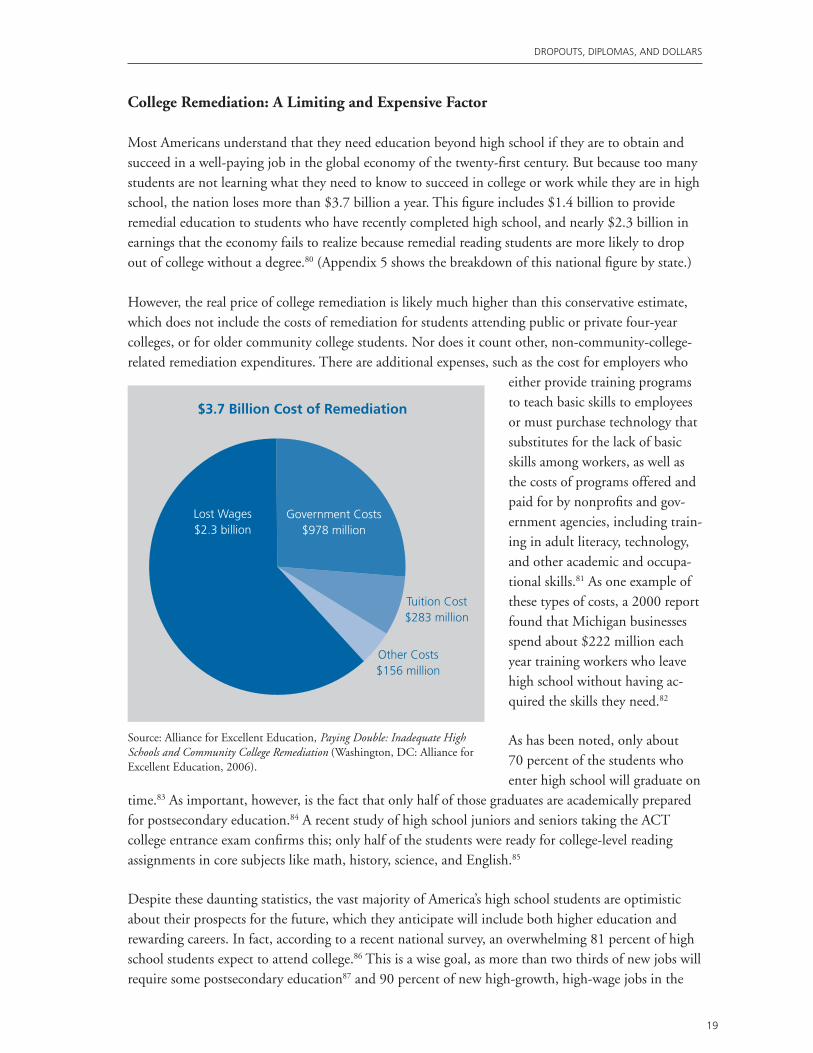
Most Americans understand that they need education beyond high school if they are to obtain and succeed in a well-paying job in the global economy of the twenty-first century. But because too many students are not learning what they need to know to succeed in college or work while they are in high school, the nation loses more than $3.7 billion a year. This figure includes $1.4 billion to provide remedial education to students who have recently completed high school, and nearly $2.3 billion in earnings that the economy fails to realize because remedial reading students are more likely to drop out of college without a degree.80 (Appendix 5 shows the breakdown of this national figure by state.) However, the real price of college remediation is likely much higher than this conservative estimate, which does not include the costs of remediation for students attending public or private four-year colleges, or for older community college students. Nor does it count other, non-community-college-related remediation expenditures. There are additional expenses, such as the cost for employers who
either provide training programs to teach basic skills to employees or must purchase technology that substitutes for the lack of basic skills among workers, as well as the costs of programs offered and paid for by nonprofits and gov-ernment agencies, including train-ing in adult literacy, technology, and other academic and occupa-tional skills.81 As one example of these types of costs, a 2000 report found that Michigan businesses spend about $222 million each year training workers who leave high school without having ac-quired the skills they need.82
As has been noted, only about 70 percent of the students who enter high school will graduate on
time.83 As important, however, is the fact that only half of those graduates are academically prepared for postsecondary education.84 A recent study of high school juniors and seniors taking the ACT college entrance exam confirms this; only half of the students were ready for college-level reading assignments in core subjects like math, history, science, and English.85
Despite these daunting statistics, the vast majority of America’s high school students are optimistic about their prospects for the future, which they anticipate will include both higher education and rewarding careers. In fact, according to a recent national survey, an overwhelming 81 percent of high school students expect to attend college.86 This is a wise goal, as more than two thirds of new jobs will require some postsecondary education87 and 90 percent of new high-growth, high-wage jobs in the
$3.7 Billion Cost of Remediation
Lost Wages$2.3 billion
Government Costs$978 million
Tuition Cost$283 million
Other Costs$156 million
Source: Alliance for Excellent Education, Paying Double: Inadequate High Schools and Community College Remediation (Washington, DC: Alliance for Excellent Education, 2006).
AlliAnce for excellent educAtion
20
dropouts, diplomAs, And dollArs
United States require at least some postsecondary education or training.88 Unfortunately, for every hundred ninth-grade students, only forty enroll in college immediately after high school, and only twenty-seven are still enrolled in their sophomore year. Only eighteen graduate from two-year colleges within three years, or from four-year colleges within six. 89
When the increased demand for postsecondary education is coupled with the poor preparation many students receive in high school, colleges and universities are being forced to offer, and often require, remedial courses to large numbers of students. These classes have the sole objective of teaching precollegiate subject matter that should have been learned in high school. Across the nation, 42 percent of community college freshmen and 20 percent of freshmen in public four-year institutions enroll in at least one remedial course.90 Community colleges already bear the greatest share of the remediation burden, and trends indicate that their responsibilities in this arena are likely to grow. Eleven states have passed laws preventing or discouraging public four-year institutions from offering remedial courses to their students, thus concentrating unprepared students in community colleges.91
Analyses of students’ preparation for college-level work show the weakness of core skills, such as basic study habits and the ability to understand and manage complicated material. The lack of preparation is also apparent in multiple subject areas: 35 percent of college freshmen were enrolled in remedial math, 23 percent in remedial writing, and 20 percent in remedial reading.92
It is important to note that many students take remedial coursework for reasons having little to do with the failings of the nation’s high schools. Community colleges have become a significant resource that offers opportunities to retrain laid-off workers, reeducate older students, and teach English to recent immigrants. Some of these enrollees are likely classified as “freshmen” and may be taking courses that are considered “remedial.” However, about half of all community college students are under the age of twenty-five,93 and almost one third of freshmen who take remedial courses are nineteen years old or younger.94 Recent high school graduates are more likely to take remedial courses because higher percentages of them are pursuing bachelor’s degrees, which require specified levels of preparation, than are older students. Additionally, younger students are more likely than older students to be enrolled in school full-time, and many community colleges do not require part-time students to enroll in remedial courses.95
Thus, the vast majority of students who take remedial courses in college do so to gain the skills and knowledge they should have gotten in high school. Most view the time, effort, and resources dedicat-ed to remedial classes to be an additional investment in their academic futures. Sadly, this is often not the reality, since students who need remediation are more likely to leave college without a degree.
A number of components comprise the high price that colleges, students and their families, and taxpayers pay to get students ready for postsecondary education. Colleges must pay faculty to teach the remedial courses; provide the classroom space; and supply a variety of support services, including counseling, administrative support, parking, facilities maintenance, and so on. Often, because of trade-offs required by limited space and resources, schools must reduce the numbers of nonremedial courses offered to students—courses that would provide greater benefits to the community and its economy.
AlliAnce for excellent educAtion dropouts, diplomAs, And dollArs
21
Through tuition, students and their families directly pay only about one fifth of the overall cost of remediation. That relatively small portion totals approximately $283 million in community college tuition alone, but it is not the only cost. Another factor is students’ time, which could be more pro-ductively spent taking college-level courses that would advance their goals and increase their earning potential. And because many colleges offer no credit for remedial courses, students are expending energy on study that, while necessary, delays the quest for a degree.
Taxpayers provide about a billion dollars a year to cover the direct and indirect instructional costs of remedial courses, through the subsidies that community colleges receive from state and local govern-ments. These tax dollars are in addition to the taxes allocated to support communities’ secondary schools; taxpayers are essentially paying twice for the coursework and skill development students are expected to receive in high school.
Remediation Is a Poor Substitution for Preparation
Individual states, and the nation as a whole, are not only paying to academically remediate thousands of young adults; they are also facing future financial loss. Students who need remediation are more likely to leave college without a degree, and thus more likely to earn less than if they had gotten a college diploma. Research shows that the need for remedial reading is the leading predictor that a student will drop out of college. While 58 percent of students who take no remedial education courses earn a bachelor’s degree within eight years, only 17 percent of students who enroll in a remedial reading course receive a BA or BS within the same time period.96
The wages of individuals who have taken some college courses average about $20,171 less per year than those of college graduates.97 Therefore, when students enter but do not complete college, they lose future income, government takes in less tax revenue, and state and national economies are de-prived of the additional earnings that would make them stronger.
The Benefits of Diplomas Over Dropping Out
Dropping out is a decision that affects not only the student, but also the economies of each state and the nation. Lower tax revenue is perhaps the most obvious consequence of higher dropout rates, but state and local economies suffer further when they have less-educated populaces, as they find it more difficult to attract new business investment. Simultaneously, these entities must spend more on social programs, incarceration costs, and health care when their populations have lower educational levels.
High school graduates, on the other hand, provide both economic and social benefits to their com-munities. In addition to earning higher wages, resulting in attendant benefits to local, state, and national economic conditions, high school graduates live longer, are less likely to be teen parents, and are more likely to raise healthier, better-educated children. In fact, children of parents who graduate from high school are themselves far more likely to graduate from high school than are dropouts. High school graduates are also less likely to commit crimes, rely on government health care, or use other public services such as food stamps or housing assistance. Additionally, high school graduates engage in civic activity, including voting and volunteering in their communities, at higher levels.
AlliAnce for excellent educAtion
22
dropouts, diplomAs, And dollArs
Researchers Henry Levin, Clive Belfield, Peter Muennig, and Cecilia Rouse estimate that a dropout converted to a graduate would yield a public benefit of $209,000 in higher government revenues and lower government spending. (“These are gross benefits and do not account for what it costs for the necessary educational interventions to raise the graduation rate or fund college programs contingent on graduation,” they write.)98 They note that while it would take an overall investment of $82,000 per student for educational interventions and additional years of school attendance leading to gradu-ation, that amount could easily be offset by the public benefit. In total, they identify a net economic advantage of $127,000 for each additional high school graduate, a benefit two and a half times greater than the initial investment.99
Reforming the nation’s high schools will not be an easy process, and the kind of comprehensive school reform needed to ensure that all students have the opportunity to succeed and graduate pre-pared for the future is not simple. But in an increasingly global economy, American secondary schools and their students must achieve at increasingly higher levels. Ensuring that all secondary students are prepared to succeed in college and work is a giant step in the right direction, and will benefit indi-viduals and society for decades to come.
AlliAnce for excellent educAtion dropouts, diplomAs, And dollArs
23
Globalization Increases the ChallengeAmericans have been hearing warnings for the last twenty-five years about how the United States’ dominance in the world’s economy is coming to an end because of the country’s poor educational performance. But as the warnings have been issued, the Dow Jones Industrial Average has climbed to record highs, U.S. gross domestic product has continued to grow, and the nation has enjoyed the lon-gest economic expansion in its history. So why should Americans listen? Why should they care? Why should they urge policymakers and civic leaders to act to improve schools and educational outcomes for students? To truly understand this debate, it is helpful to look backward before looking forward.
A Brief History
On August 26, 1981, U.S. Secretary of Education T. H. Bell created the National Commission on Excellence in Education and charged it with examining the quality of education in the United States. The commission was told to pay particular attention to teenage youth, and it did so by focusing on American high schools. In April 1983, it issued A Nation at Risk: The Imperative for Educational Reform, which began with these lines:
Our Nation is at risk. Our once unchallenged preeminence in commerce, industry, science, and technological innovation is being overtaken by competitors throughout the world. This report is concerned with only one of the many causes and dimensions of the problem, but it is the one that undergirds American prosperity, security, and civility. We report to the American people that while we can take justifiable pride in what our schools and colleges have historically accomplished and contributed to the United States and the well-being of its people, the educational foundations of our society are presently being eroded by a rising tide of mediocrity that threatens our very future as a Nation and a people. What was unimagi-nable a generation ago has begun to occur—others are matching and surpassing our educa-tional attainments.100
In September 1989, President George Herbert Walker Bush became only the third president to convene the nation’s governors. (Theodore Roosevelt called the governors together in 1908 to discuss conservation and the ravaging of forests, and Franklin Delano Roosevelt convened them in 1933 to deal with the Great Depression.) President Bush called the meeting to focus on education, because, in his words, inadequate education threatened to undermine “the very leadership position of America in the next century.”101 The group agreed on a set of six objectives that the nation should meet by the year 2000:
• Everychildwouldstartschool“readytolearn.”
• Thehighschoolgraduationratewouldreach90percent.
• Theperformanceofstudentsin“criticalsubjects”wouldbeassessedingradesfour,eight, and twelve.
• Americanstudentswouldrankfirstintheworldinscienceandmathematics.
AlliAnce for excellent educAtion
24
dropouts, diplomAs, And dollArs
• Everyadultwouldbea“skilled,literateworkerandcitizen.”
• Everyschoolwouldbedrug-freeandoffer“thekindofdisciplinedenvironmentthatmakesitpos-sible to learn.”102
“Ambitious aims?” Bush asked in his 1990 State of the Union Address. “Of course. Easy to do? Far from it. But the future’s at stake.”103
In June 1990, the first Commission on the Skills of the American Workforce warned that economic globalization would send low-skilled jobs to countries where the price of low-skill labor was the cheapest. It advised the nation to abandon this kind of work and focus on educating students and workers to achieve at high levels, because only countries with highly skilled workforces could successfully compete in the global economy.104
The goal of improving educational outcomes for all of America’s students was reenergized in 2001 with the bipartisan renewal of the Elementary and Secondary Education Act of 1965—in this in-carnation called the No Child Left Behind Act. Urging its passage, President George W. Bush said: “Today, good jobs demand math skills, technical knowledge, and fluent reading. The progress of our economy and the future of our children starts in the classroom. And that’s why education must be our nation’s highest priority.”105
In 2006, the New Commission on the Skills of the American Workforce published a report acknowledging that the first commission had not anticipated the trend of outsourcing or automating of higher-paying jobs that demand high-level skills. The second report warned that if the nation continues on its current course, and the “number of nations outpacing us in the education race continues to grow at its current rate, the American standard of living will steadily fall relative to those nations, rich and poor, that are doing a better job. If the gap gets to a certain—but unknowable—point, the world’s investors will conclude that they can get a greater return on their funds elsewhere, and it will be almost impossible to reverse course.”106
But the nation’s policymakers and educators have been trying to reverse course for twenty-five years, to no avail. Instead of approaching the 90 percent goal set by the 1989 education summit, the nation’s graduation rate has remained flat, going from 72 percent in 1991 to 71 percent in 2002.107 Even more problematic is the fact that nations in the rest of the world are getting better at educating their students to high standards, are improving faster, and are passing the United States in a variety of measurements of educational achievement and attainment.
Changes in the International Educational Landscape
Forty years ago, when an individual did not necessarily need a high school diploma to get a good job, the United States led the world in producing high school graduates. A full 86 percent of fifty-five- to sixty-four-year-olds in the United States have a high school diploma, well above the 54 percent aver-age of the twenty-nine member countries that make up the Organisation for Economic Co-operation and Development (OECD), and 3 percentage points higher than the next closest country, the Czech Republic.108
AlliAnce for excellent educAtion dropouts, diplomAs, And dollArs
25
But much has changed. Today, when a high school diploma is the minimum needed to qualify for most good-paying jobs, the U.S. advantage—which the OECD credits to what it calls the “first- mover advantage,” which the nation gained because of massively increasing enrollments after World War II—has started to slip, as other countries have improved at a faster rate. For example, 87 percent of Americans aged twenty-five to thirty-four have at least a high school diploma, but that percent-age is only good enough to rank the United States tenth in the world. In 2005, the U.S. high school graduation rate ranked eighteenth of twenty-three OECD member countries.109
Imagine that these high school graduation rate rankings were America’s results at the Olympics. Would the nation tolerate such a dismal performance? In the 2004 Summer Olympics, the U.S. men’s basketball team boasted world-class stars such as LeBron James, Tim Duncan, and Allen Iverson, and was thought to be a shoo-in for the gold medal. When it left with only the bronze, newspaper articles called the team’s performance a “humbling two weeks in Athens” and an “Olympic low point for U.S. men’s basketball.” 110 What would the commentators have had to say if the basketball team had come in eighteenth?
Stu Jackson, the chairman of the U.S. Senior Men’s National Committee at the time, wasn’t as critical, noting that the team’s performance was not “an indictment on the U.S. team” but rather proof that the “rest of the world is getting better.”111 The same is true in education. In the race to produce a workforce prepared for the demands of a global economy, the United States has struggled to keep up with its international counterparts. This slippage has occurred not because the United States is necessarily doing worse, but because other countries have improved at faster rates. In Korea, for example, approximately 97 percent of individuals aged twenty-five to thirty-four possess a high school diploma—compared to only 35 percent in the 1950s.112
It’s not just in high school graduation rates that the United States is falling behind. The nation is also losing ground in college graduates—again, not because U.S. college graduation rates are falling, but because rates have risen so much faster in other countries. In 2005, 37 percent of individuals in the United States aged fifty-five to sixty-four had graduated with a college degree, ranking the nation first in the world. Only Canada, at 36 percent, was close behind. But among more recent college graduates, those individuals aged twenty-five to thirty-four, the United States, at 39 percent, is only marginally higher. Meanwhile, several other countries have caught up and surpassed the United States, including Canada, Japan, and Korea. As a result, the United States has fallen from first place for higher education attainment levels among fifty-five- to sixty-four-year-olds, to fourth place among thirty-five- to forty-four-year-olds, and to tenth place among twenty-five- to thirty-four-year-olds.113
And, rather than meeting the goal set by the first President Bush and the nation’s governors to be first in the world in science and mathematics, the United States has fallen further behind. In 2000, American fifteen-year-olds ranked fourteenth in science literacy on the Programme for International Student Assessment (PISA). In 2003, American students had fallen to a tie for nineteenth; in 2006, they ranked twenty-first. A similar free fall occurred in mathematics. In 2000, American fifteen-year-olds ranked eighteenth; by 2006, they had fallen to twenty-fifth.114
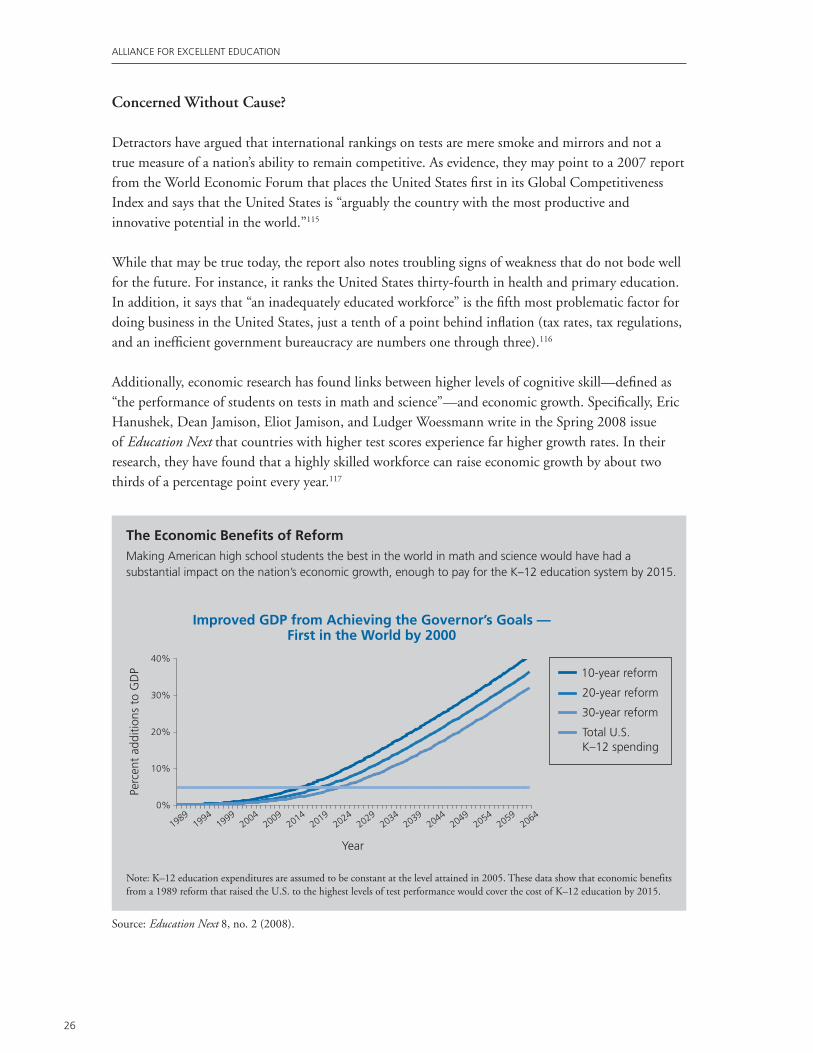
AlliAnce for excellent educAtion
26
dropouts, diplomAs, And dollArs
Concerned Without Cause?
Detractors have argued that international rankings on tests are mere smoke and mirrors and not a true measure of a nation’s ability to remain competitive. As evidence, they may point to a 2007 report from the World Economic Forum that places the United States first in its Global Competitiveness Index and says that the United States is “arguably the country with the most productive and innovative potential in the world.”115
While that may be true today, the report also notes troubling signs of weakness that do not bode well for the future. For instance, it ranks the United States thirty-fourth in health and primary education. In addition, it says that “an inadequately educated workforce” is the fifth most problematic factor for doing business in the United States, just a tenth of a point behind inflation (tax rates, tax regulations, and an inefficient government bureaucracy are numbers one through three).116
Additionally, economic research has found links between higher levels of cognitive skill—defined as “the performance of students on tests in math and science”—and economic growth. Specifically, Eric Hanushek, Dean Jamison, Eliot Jamison, and Ludger Woessmann write in the Spring 2008 issue of Education Next that countries with higher test scores experience far higher growth rates. In their research, they have found that a highly skilled workforce can raise economic growth by about two thirds of a percentage point every year.117
0%
10%
20%
30%
40%
19891994
19992004
20092014
20192024
20292034
20392044
20492054
20592064
percent additions to GDP
10-year reform
20-year reform
30-year reform
Total U.S.K–12 spending
Improved GDP from Achieving the Governor’s Goals — First in the World by 2000
Perc
ent
addi
tions
to
GD
P
Year
Source: Education Next 8, no. 2 (2008).
The Economic Benefits of Reformmaking American high school students the best in the world in math and science would have had a substantial impact on the nation’s economic growth, enough to pay for the K–12 education system by 2015.
Note: K–12 education expenditures are assumed to be constant at the level attained in 2005. These data show that economic benefits from a 1989 reform that raised the U.S. to the highest levels of test performance would cover the cost of K–12 education by 2015.
AlliAnce for excellent educAtion dropouts, diplomAs, And dollArs
27
Hanushek and his colleagues also analyzed what it would mean for the nation’s economic growth if the United States had met the goal that President Bush and the nation’s governors set in 1989 for the global ranking in math and science. They found that if this goal had been met by 2000, the nation’s gross domestic product would have been 4.5 percent greater by 2015. Such an increase would equal the total amount the United States currently spends on K–12 education.
“In other words,” they write, “had that money effectively raised cognitive skills by the 50 test points that would have brought the United States close to world leadership, the economic returns to the country would probably have been enough to cover the entire cost of education in 2015 and after.”118
They also note that even a reform that takes effect in twenty years (instead of the governors’ ten-year goal) produces a real GDP that is 36 percent higher than it would be if there were no change in the level of cognitive skills.
Remaining Economically Strong and Competitive in a Changing World
But the questions remain: If America was in danger of losing its competitive edge twenty-five years ago when A Nation at Risk was published, how is it still a world leader today? And why should its citizens be concerned about the future?
Some believe that the United States’ freer labor and product markets, limited government regulation, and lower levels of government involvement in the operation of the economy tends to “encourage investment, permit the rapid development of new products and activities by firms, and allow U.S. workers to adjust to new opportunities.”119 Others believe that the United States has benefited from its past investments and status as the world’s leader in educational attainment. As Hanushek and his colleagues point out, over the course of the twentieth century the “U.S. pushed to open secondary schools to all citizens. Higher education expanded with the development of land grant universities, the GI Bill, and direct grants and loans to students.”120 They add that the nation’s higher education system is a “powerful engine of technological progress and economic growth in the U.S.” and, by most measurements, U.S. colleges and universities rank at the very top in the world.121
Hanushek and his colleagues argue that it is the strength of the nation’s higher education system, as well as its economy, that offers hope for the future. But they also point out that the nation’s K–12 ranking should “spark concerns about the long-term outlook for the U.S. economy, which could eventually have an impact on the higher-education system as well.”122
The United States continues to enroll more international students in its colleges than any other coun-try; at 22 percent, it is almost twice as popular as the second-place country, the United Kingdom, which has 12 percent.123 However, the United States has begun to lose some of that market share: since 2000, the U.S. share of international students has declined by 4 percentage points, from 26 percent to 22 percent.124
As Hanushek and his colleagues point out, the United States could be challenged in several areas where it has held an advantage in the past. “Other countries are doing more to secure property rights and open their economies, which will enable them to make better use of their human capital. Most
AlliAnce for excellent educAtion
28
dropouts, diplomAs, And dollArs
obviously, the historic advantage of the U.S. in school attainment has come to an end, as half of the OECD countries now exceed the U.S. in the average number of years of education their citizens receive. Those trends could easily accelerate in the coming decades.”
Another challenge for the United States is the pending retirement of the baby boom generation. Between 1950 and 2000, the civilian labor force grew by nearly 79 million (from 62.2 million to 140.9 million), an increase of 1.6 percent per year.125 However, the Bureau of Labor Statistics projects that between 2000 and 2010 the labor force will slow to an increase of 1.1 percent per year, and after the retirement of the baby boomers between 2010 and 2020, labor force growth will slow to 0.4 percent per year.126 As boomers retire, the nation will lose much-needed skills and significant amounts of institutional knowledge.127
As the size of the labor force increases at slower rates, the nation’s gross domestic product is also expected to grow more slowly. The Bureau of Labor Statistics projects that GDP will grow at an average annual rate of 2.8 percent between 2006 and 2016, slower than the 3.1 percent increase that was achieved over the previous ten-year period.128
Over the next twenty-five years, the world will continue to change, and jobs will require even more levels of education. Indeed, according to America’s Perfect Storm, a 2007 report from the Educational Testing Service, nearly half of all of the projected job growth over the next twenty-five years will be concentrated in occupations associated with higher education and skill levels. “This means that tens of millions more of our students and adults will be less able to qualify for higher-paying jobs,” the report reads. “Instead, they will be competing not only with each other and millions of newly arrived immigrants but also with equally (or better) skilled workers in lower-wage economies around the world.”129 And the pending retirement of the baby boom generation will create even more challenges, as decreases in the rate of growth in the workforce and GDP will accompany these mass retirements.
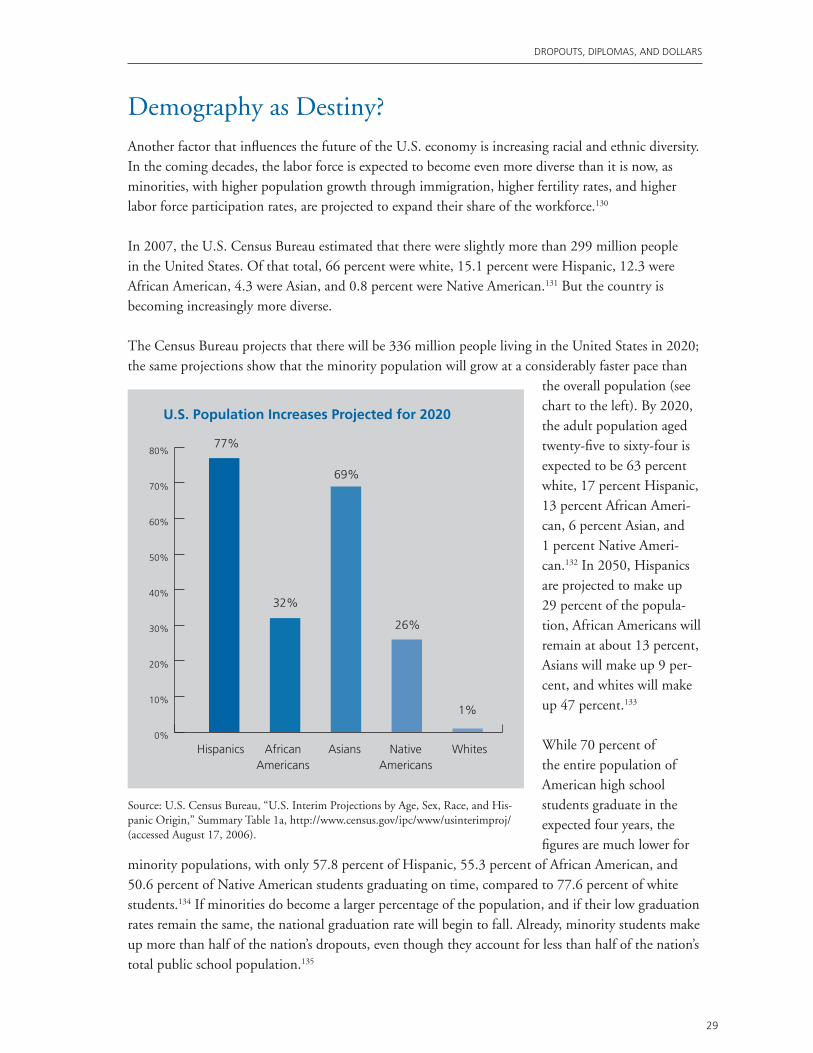
AlliAnce for excellent educAtion dropouts, diplomAs, And dollArs
29
Demography as Destiny?Another factor that influences the future of the U.S. economy is increasing racial and ethnic diversity. In the coming decades, the labor force is expected to become even more diverse than it is now, as minorities, with higher population growth through immigration, higher fertility rates, and higher labor force participation rates, are projected to expand their share of the workforce.130
In 2007, the U.S. Census Bureau estimated that there were slightly more than 299 million people in the United States. Of that total, 66 percent were white, 15.1 percent were Hispanic, 12.3 were African American, 4.3 were Asian, and 0.8 percent were Native American.131 But the country is becoming increasingly more diverse.
The Census Bureau projects that there will be 336 million people living in the United States in 2020; the same projections show that the minority population will grow at a considerably faster pace than
the overall population (see chart to the left). By 2020, the adult population aged twenty-five to sixty-four is expected to be 63 percent white, 17 percent Hispanic, 13 percent African Ameri-can, 6 percent Asian, and 1 percent Native Ameri-can.132 In 2050, Hispanics are projected to make up 29 percent of the popula-tion, African Americans will remain at about 13 percent, Asians will make up 9 per-cent, and whites will make up 47 percent.133
While 70 percent of the entire population of American high school students graduate in the expected four years, the figures are much lower for
minority populations, with only 57.8 percent of Hispanic, 55.3 percent of African American, and 50.6 percent of Native American students graduating on time, compared to 77.6 percent of white students.134 If minorities do become a larger percentage of the population, and if their low graduation rates remain the same, the national graduation rate will begin to fall. Already, minority students make up more than half of the nation’s dropouts, even though they account for less than half of the nation’s total public school population.135
0%
10%
20%
30%
40%
50%
60%
70%
80%
Hispanics AfricanAmericans
Asians NativeAmericans
Whites
77%
32%
69%
26%
1%
U.S. Population Increases Projected for 2020
Source: U.S. Census Bureau, “U.S. Interim Projections by Age, Sex, Race, and His-panic Origin,” Summary Table 1a, http://www.census.gov/ipc/www/usinterimproj/ (accessed August 17, 2006).

AlliAnce for excellent educAtion
30
dropouts, diplomAs, And dollArs
The average graduation rate isn’t the only measurement likely to decline. Over time, as more-educat-ed workers cycle out of the workforce and are replaced by less-educated workers, the nation will see a 5 percent decline in the average levels of literacy and numeracy in the working-age population.136
Additionally, a 2005 report from the National Center for Public Policy and Higher Education argues that the United States could lose billions of dollars in personal income during this transition. “If the educational gaps remain as they are, then personal income per capita in the United States is projected to decline from $21,591 in 2000 to $21,196 in 2020—a drop of $395 or 2 percent. In contrast, according to the Bureau of Economic Analysis, personal income per capita had grown 41 percent nationally during the two decades prior to 2000.”137
If the status quo persists, nearly all states are likely to see an increase in the percentage of their resi-dents without a high school diploma. According to the National Center for Public Policy and Higher Education, states that are projected to have the highest growth in minority populations can expect to see even more residents without a diploma, which translates into lower earnings for the individual worker and less tax revenue for the state. For example, the projected decline in personal income per capita from 2000 to 2020 is $662 in Colorado, $1,182 in New York, and $2,475 in California.138
Because the country’s economic strength is inextricably tied to the education level of its citizens, American high schools will need to significantly increase the percentage of minority students who receive a high school diploma, or risk weakening the nation’s economic condition further and with increasing rapidity.
Minority Students Poorly Served by Schools
African American, Hispanic, and Native American students are less well served by the current American public education system than are their nonminority peers. For example:
• Nearlyhalfofthenation’sAfricanAmericanstudentsandnearly40percentofLatinostudentsattend dropout factories, compared to only 11 percent of white students.139
• Schoolsthatservehighconcentrationsoflow-incomestudents(whoareoftendisproportionatelyminority) have three times as many uncertified or out-of-field teachers teaching English and science as do higher-income schools.140
• Inthethirty-onestatesthatcurrentlyeducate60percentofallminoritychildrenintheUnitedStates, school districts with the highest minority enrollments receive fewer resources than those with lower minority enrollments.141
The U.S. Department of Labor reports that nearly 90 percent of new high-growth, high-wage occupations will require at least some postsecondary education,142 a figure that will hurt minorities disproportionately. Just 11 percent of all college freshmen are African American, and 7 percent are Hispanic, even though those populations make up 14 percent and 17 percent, respectively, of the eighteen-year-old population.143 Furthermore, while the minority population enrolled in four-year colleges is low, its completion rate is even lower. In 2005, just 40.5 percent of African American students and 47 percent of Latino students who were enrolled in college graduated within six years, compared to 59.5 percent of white students.144
AlliAnce for excellent educAtion dropouts, diplomAs, And dollArs
31
Minority Population Growth: The Need for Increased Educational Attainment
Individuals’ potential contributions to the economy increase in accordance with their educational attainment; for each student who does not graduate from high school, does not enter college, or does not complete college with a degree, the economy suffers. If the current graduation rate gap between white and minority students were eliminated, state and national economies would benefit significantly.
Patrick Kelly, a researcher at the National Center for Higher Education Management Systems, has found that because minority students graduate at such low rates from high school and therefore go on to each successive level of education in lower proportions, educational attainment rates for the U.S. population can be expected to decrease as the minority population grows. Looking at the decade from 1990 to 2000, Kelly found that gaps in educational attainment between white students and their Hispanic, African American, and Native American peers widened, especially among males. The percentage of male Hispanic adults ages twenty-five to thirty-four with an associate’s degree or higher, for example, declined by 1.8 percentage points during the 1990s.145
If past trends are accurate predictors of the future, Kelly estimates that the percentage of adults ages twenty-five to sixty-four with a high school diploma or higher will decrease by 2.5 percentage points from its current level by 2020. But if minority graduation rates can be brought in line with those of white students by that time, the educational attainment of the overall population will increase.
Higher Educational Attainment Equals Greater Earnings
Educational attainment can influence economic growth in a variety of ways; the most obvious is its direct correlation to earnings potential, as discussed earlier. If the U.S. education system is able to raise minority high school graduation rates to the current level of white students, and if these new graduates go on to postsecondary education at similar rates, these young adults will not only be better educated, they will also be earning at higher levels. As a result, the states in which they live, as well as the nation as a whole, will be the economic beneficiaries.
Additional analysis conducted by Patrick Kelly paints a dramatic picture of these potential benefits. Using Census projections of the demographic composition (i.e., age, race, and ethnicity) for each state in 2020, Kelly and the Alliance for Excellent Education calculated the potential earnings in each state if minority groups were graduating from high school and completing postsecondary education at the same rates as whites are now.
Results vary significantly by state because the Census Bureau anticipates dramatically different de-mographic patterns across the nation. For example, if high school graduation and college completion rates in California—a large state with an increasing Hispanic population—remain stagnant, 479,806 of the state’s Hispanic residents between the ages of twenty-five and sixty-four will hold a bachelor’s degree in 2020; however, if rates can be brought to parity with those of whites, 2,034,047 Hispanic adults in the state will possess this credential in 2020.
AlliAnce for excellent educAtion
32
dropouts, diplomAs, And dollArs
Thus, if California can significantly improve graduation rates, and if its population profile in 2020 matches Census projections, the state stands to gain a staggering additional $101,596,190,713 in earnings and productivity.
Nationwide, if high schools and colleges are able to raise the graduation rates of Hispanic, African American, and Native American students to the levels of white students by 2020, the potential increase in personal income across the nation would add, conservatively, more than $310 billion to the U.S. economy. (The national and state-specific findings are presented in Appendix 6.)
Conservative Projections
In some states the projections by the U.S. Census Bureau significantly underestimate the growth of some populations, especially Hispanics. North Carolina, for example, currently has nearly 196,000 more Hispanic adult residents than the 1990 Census data predicted. California already has 320,000 more Hispanic adults.146 If this level of growth among minority groups continues, the implications of current achievement gaps—and the potential benefits of closing them—will be far greater than the projections presented in this report. Even without this projected growth, totals for each state add up to big gains for the nation as a whole.
Additionally, minority workers in the United States typically earn less than their nonminority peers even when their educational levels are the same. Projected income levels in this analysis are based on the assumption that these income disparities will be unchanged by 2020, but if minority earnings were equal to those of whites at the same education levels, the projected gains would be higher. Therefore, the estimated gains in income that would be recognized by states and the nation are very conservative.
AlliAnce for excellent educAtion dropouts, diplomAs, And dollArs
33
The Key to the Future: A Meaningful High School DiplomaThe educational attainment levels of a country provide a way to gauge the value of its human capital, an important economic resource the United States cannot afford to squander in this age of increasing globalization. The United States currently ranks eighteenth among developed nations in high school graduation rates. If attainment levels for minority students decline as projected, the country’s economic standing will likely fall as well. Increasing graduation rates for all young people is the key to reversing this trend.
Every year, more than four million students enter the ninth grade in America.147 Over the next four years, a third of these students will drop out before attaining a diploma; another third will graduate without having gained the skills and knowledge necessary to succeed in work or postsecondary education. The nation cannot afford to allow this trend to continue. The opportunities these young people will miss throughout their lives will have cumulative costs for them as individuals, and also represent a significant lost opportunity for the country.
There is a general understanding of the importance of closing the nation’s educational achievement gap, but less recognized is the fact that the segment of the population that is the least well educated is also the fastest growing. Unaddressed, this circumstance alone will mean significant reductions in the knowledge and skill levels of the U.S. workforce. It will also result in dramatically lower levels of personal income, leading to a reduced tax base for the nation and the states. The stunning poten-tial economic benefit of turning life around for academically underserved youth through improved schooling should be a wake-up call about the importance of reforming America’s high schools now; the nation truly needs the economic and social contributions these young people can make.
For example, retired individuals who receive Social Security checks are supported by individuals who are employed. In 1950, the worker-to-beneficiary ratio was 16.5 to 1. Today it is 3.3 to 1, and it will fall to 2 to 1 within the next forty years. At this ratio, the Social Security Administration says that there will not be enough workers to pay scheduled benefits at current tax rates, meaning that the payroll tax would have to be increased if no other action is taken prior to that time.148
Solutions to the Crisis Do Exist
This report has focused primarily on the dropout crisis and the impact it has on both individuals and the economies of the nation, states, and local communities. It has also noted that a large number of the nation’s dropouts come from a relatively small number of high schools. But while there are many high schools across the country that are serving their students well, even schools with relatively high graduation rates sometimes fail to adequately educate specific subgroups of their students.
The good news is that there are also high schools throughout the country that are raising achievement levels and increasing the options available to students who would otherwise drop out or just get by. But there are still too few of these successful schools. And although the public has become increasing-ly aware of the sorry state of the American secondary educational system in general and the dropout
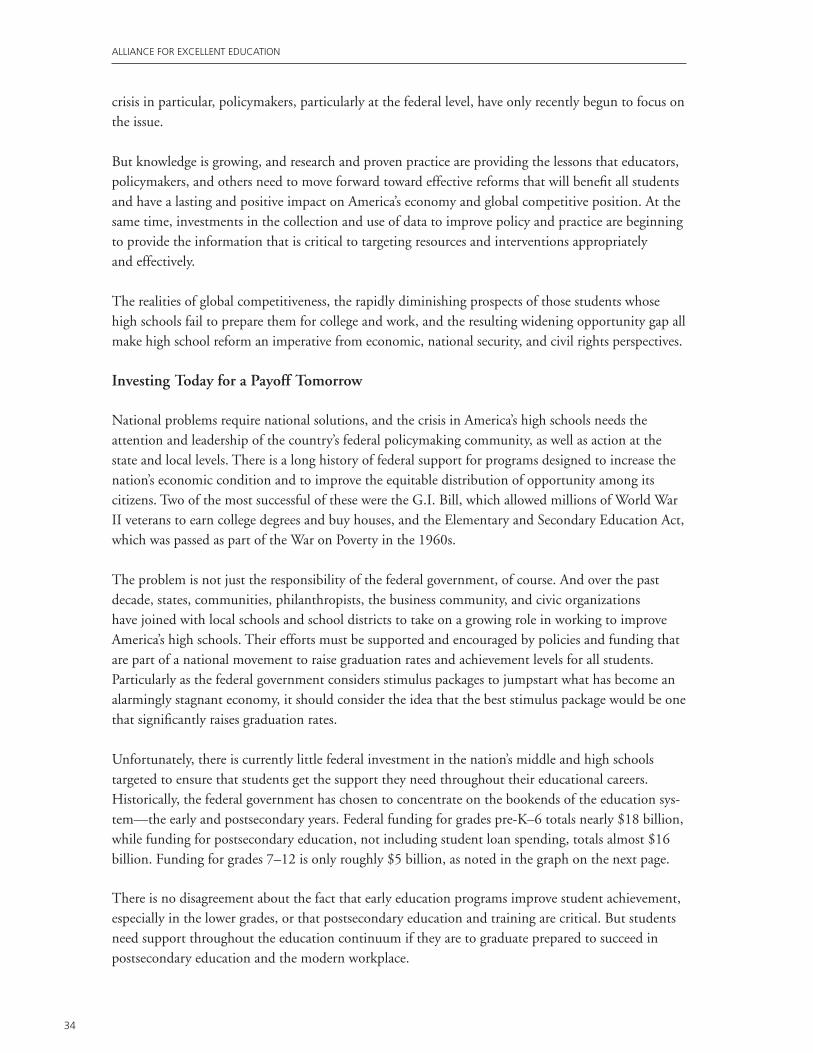
AlliAnce for excellent educAtion
34
dropouts, diplomAs, And dollArs
crisis in particular, policymakers, particularly at the federal level, have only recently begun to focus on the issue.
But knowledge is growing, and research and proven practice are providing the lessons that educators, policymakers, and others need to move forward toward effective reforms that will benefit all students and have a lasting and positive impact on America’s economy and global competitive position. At the same time, investments in the collection and use of data to improve policy and practice are beginning to provide the information that is critical to targeting resources and interventions appropriately and effectively.
The realities of global competitiveness, the rapidly diminishing prospects of those students whose high schools fail to prepare them for college and work, and the resulting widening opportunity gap all make high school reform an imperative from economic, national security, and civil rights perspectives.
Investing Today for a Payoff Tomorrow
National problems require national solutions, and the crisis in America’s high schools needs the attention and leadership of the country’s federal policymaking community, as well as action at the state and local levels. There is a long history of federal support for programs designed to increase the nation’s economic condition and to improve the equitable distribution of opportunity among its citizens. Two of the most successful of these were the G.I. Bill, which allowed millions of World War II veterans to earn college degrees and buy houses, and the Elementary and Secondary Education Act, which was passed as part of the War on Poverty in the 1960s.
The problem is not just the responsibility of the federal government, of course. And over the past decade, states, communities, philanthropists, the business community, and civic organizations have joined with local schools and school districts to take on a growing role in working to improve America’s high schools. Their efforts must be supported and encouraged by policies and funding that are part of a national movement to raise graduation rates and achievement levels for all students. Particularly as the federal government considers stimulus packages to jumpstart what has become an alarmingly stagnant economy, it should consider the idea that the best stimulus package would be one that significantly raises graduation rates.
Unfortunately, there is currently little federal investment in the nation’s middle and high schools targeted to ensure that students get the support they need throughout their educational careers. Historically, the federal government has chosen to concentrate on the bookends of the education sys-tem—the early and postsecondary years. Federal funding for grades pre-K–6 totals nearly $18 billion, while funding for postsecondary education, not including student loan spending, totals almost $16 billion. Funding for grades 7–12 is only roughly $5 billion, as noted in the graph on the next page.
There is no disagreement about the fact that early education programs improve student achievement, especially in the lower grades, or that postsecondary education and training are critical. But students need support throughout the education continuum if they are to graduate prepared to succeed in postsecondary education and the modern workplace.
AlliAnce for excellent educAtion dropouts, diplomAs, And dollArs
35
Money alone cannot fix the nation’s high schools. Indeed, more federal dollars without systemic reform will just make a dysfunctional system more expensive. But targeted new investments and changes in the way that funds are used are needed to effectively reform and improve schools and student achievement.
The critical first step is for the nation to set the right goal for America’s high schools: to graduate all students prepared for success in the twenty-first-century global economy. Meeting this goal requires a common set of rigorous, internationally benchmarked standards anchored in the skills and knowledge that students need to succeed in postsecondary education and work, and which are aligned with as-sessments, curricula, and other tools that help get students achieve to those standards. It also requires a uniform graduation rate that ensures that schools know which students are graduating, and an accountability system that counts graduation and achievement as equally important measures of high school success. Such a system can help to identify which high schools are not succeeding, and leverage data and resources through states and districts to turn around or shut down the lowest-performing high schools.
In order to improve low-performing high schools, it is critical to provide students with the academic and other supports they need to succeed, including a significant focus on literacy throughout the K–12 years, since reading is the cornerstone upon which all other academic success is built. Currently about two thirds of eighth graders read below grade level, making it virtually certain that they will struggle in high school. Adolescent literacy and other research-based and data-driven approaches must be used to make all high schools perform well.
Sources: U.S. Department of Education, Fiscal Year 2008 Congressional Action table, http://www.ed.gov/about/overview/budget/budget08/08action.pdf (accessed on July 28, 2008); U.S. Department of Health and Human Services, “Budget in Brief: Fiscal Year 2009,” http://www.hhs.gov/budget/09budget/2009BudgetInBrief.pdf (accessed July 28, 2008).
$0
$5
$10
$15
$20Small Learning Communities
Pell
SEOG
LEAP
Federal Work Study
Striving Readers
TRIO
GEAR-UP
Perkins
Head Start
Reading First
Title 1
PreK–6 Grades 7–9 Grades 10 –12 Postsecondary
The Missing MiddleFY2008 Federal Education Appropriations
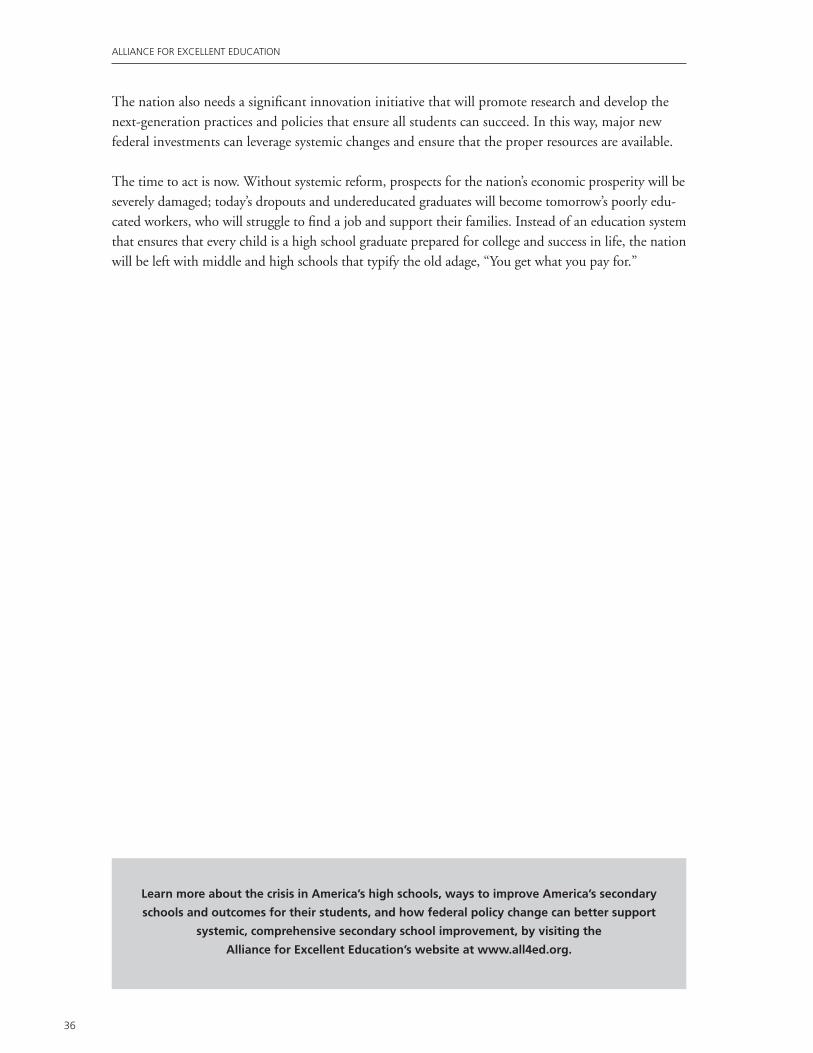
AlliAnce for excellent educAtion
36
dropouts, diplomAs, And dollArs
The nation also needs a significant innovation initiative that will promote research and develop the next-generation practices and policies that ensure all students can succeed. In this way, major new federal investments can leverage systemic changes and ensure that the proper resources are available.
The time to act is now. Without systemic reform, prospects for the nation’s economic prosperity will be severely damaged; today’s dropouts and undereducated graduates will become tomorrow’s poorly edu-cated workers, who will struggle to find a job and support their families. Instead of an education system that ensures that every child is a high school graduate prepared for college and success in life, the nation will be left with middle and high schools that typify the old adage, “You get what you pay for.”
Learn more about the crisis in America’s high schools, ways to improve America’s secondary
schools and outcomes for their students, and how federal policy change can better support
systemic, comprehensive secondary school improvement, by visiting the
Alliance for Excellent Education’s website at www.all4ed.org.
AlliAnce for excellent educAtion dropouts, diplomAs, And dollArs
37
Appendix 1
Estimated Additional Lifetime Income if High School Dropouts Graduated with Their Class in 2007–2008*
StateEstimated Graduation Rate
(2004–2005)Projected Number of Nongraduates
for the Class of 2008Total Lifetime Additional Income
if Dropouts Graduated
Alabama 61.3% 24,985 $6,496,220,352
Alaska 67.6% 3,865 $1,004,974,141
Arizona 73.3% 19,852 $5,161,504,766
Arkansas 73.2% 10,260 $2,667,523,066
California 70.1% 161,918 $42,098,598,750
Colorado 74.2% 16,640 $4,326,288,281
Connecticut 78.1% 9,764 $2,538,616,133
Delaware 60.1% 4,271 $1,110,566,133
District of Columbia 57.6% 1,937 $503,556,809
Florida 60.8% 97,499 $25,349,857,813
Georgia 58.1% 59,510 $15,472,691,406
Hawaii 67.4% 5,536 $1,439,394,404
Idaho 76.6% 4,954 $1,288,128,105
Illinois 76.7% 41,068 $10,677,615,000
Indiana 73.6% 22,920 $5,959,132,969
Iowa 82.8% 7,033 $1,828,505,479
Kansas 74.3% 10,043 $2,611,071,328
Kentucky 71.5% 16,160 $4,201,578,164
Louisiana 54.7% 26,520 $6,895,070,508
Maine 77.2% 3,814 $991,749,688
Maryland 73.6% 21,490 $5,587,513,750
Massachusetts 74.7% 16,298 $4,237,514,023
Michigan 70.5% 45,305 $11,779,231,953
Minnesota 78.1% 15,105 $3,927,296,445
Mississippi 61.8% 15,322 $3,983,658,301
Missouri 76.5% 18,337 $4,767,669,258
Montana 75.7% 3,191 $829,555,073
Nebraska 79.6% 5,131 $1,334,017,090
Nevada 45.4% 19,687 $5,118,578,867
New Hampshire 77.1% 4,244 $1,103,382,363
New Jersey 83.3% 18,474 $4,803,197,852
New Mexico 54.1% 13,837 $3,597,594,863
New York 68.0% 83,905 $21,815,389,375
North Carolina 67.0% 41,362 $10,754,181,953
North Dakota 79.2% 1,771 $460,427,595
Ohio 75.9% 37,857 $9,842,903,281
Oklahoma 70.8% 14,611 $3,798,885,391
Oregon 70.4% 13,486 $3,506,271,133
Pennsylvania 80.4% 30,578 $7,950,162,188
Rhode Island 71.1% 3,675 $955,476,958
South Carolina 55.6% 28,478 $7,404,274,414
South Dakota 75.6% 2,511 $652,894,849
Tennessee 65.4% 27,982 $7,275,246,367
Texas 68.5% 118,091 $30,703,733,125
Utah 78.6% 7,985 $2,076,173,760
Vermont 80.2% 1,689 $439,057,671
Virginia 72.9% 29,195 $7,590,623,828
Washington 68.8% 28,001 $7,280,254,414
West Virginia 72.8% 6,530 $1,697,729,668
Wisconsin 80.5% 14,864 $3,864,550,625
Wyoming 74.2% 1,861 $483,876,885
United States 70.6% 1,229,277 $319,611,922,500
* Methodology is described following the Appendices.
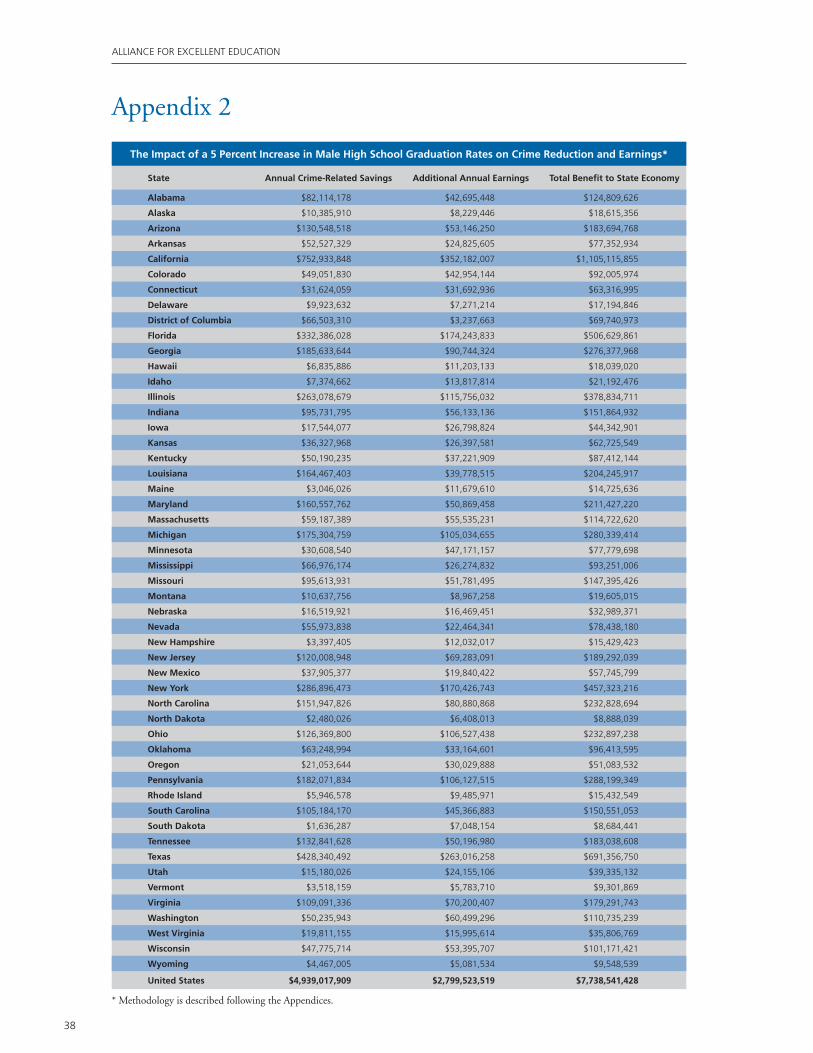
AlliAnce for excellent educAtion
38
dropouts, diplomAs, And dollArs
Appendix 2
The Impact of a 5 Percent Increase in Male High School Graduation Rates on Crime Reduction and Earnings*
State Annual Crime-Related Savings Additional Annual Earnings Total Benefit to State Economy
Alabama $82,114,178 $42,695,448 $124,809,626
Alaska $10,385,910 $8,229,446 $18,615,356
Arizona $130,548,518 $53,146,250 $183,694,768
Arkansas $52,527,329 $24,825,605 $77,352,934
California $752,933,848 $352,182,007 $1,105,115,855
Colorado $49,051,830 $42,954,144 $92,005,974
Connecticut $31,624,059 $31,692,936 $63,316,995
Delaware $9,923,632 $7,271,214 $17,194,846
District of Columbia $66,503,310 $3,237,663 $69,740,973
Florida $332,386,028 $174,243,833 $506,629,861
Georgia $185,633,644 $90,744,324 $276,377,968
Hawaii $6,835,886 $11,203,133 $18,039,020
Idaho $7,374,662 $13,817,814 $21,192,476
Illinois $263,078,679 $115,756,032 $378,834,711
Indiana $95,731,795 $56,133,136 $151,864,932
Iowa $17,544,077 $26,798,824 $44,342,901
Kansas $36,327,968 $26,397,581 $62,725,549
Kentucky $50,190,235 $37,221,909 $87,412,144
Louisiana $164,467,403 $39,778,515 $204,245,917
Maine $3,046,026 $11,679,610 $14,725,636
Maryland $160,557,762 $50,869,458 $211,427,220
Massachusetts $59,187,389 $55,535,231 $114,722,620
Michigan $175,304,759 $105,034,655 $280,339,414
Minnesota $30,608,540 $47,171,157 $77,779,698
Mississippi $66,976,174 $26,274,832 $93,251,006
Missouri $95,613,931 $51,781,495 $147,395,426
Montana $10,637,756 $8,967,258 $19,605,015
Nebraska $16,519,921 $16,469,451 $32,989,371
Nevada $55,973,838 $22,464,341 $78,438,180
New Hampshire $3,397,405 $12,032,017 $15,429,423
New Jersey $120,008,948 $69,283,091 $189,292,039
New Mexico $37,905,377 $19,840,422 $57,745,799
New York $286,896,473 $170,426,743 $457,323,216
North Carolina $151,947,826 $80,880,868 $232,828,694
North Dakota $2,480,026 $6,408,013 $8,888,039
Ohio $126,369,800 $106,527,438 $232,897,238
Oklahoma $63,248,994 $33,164,601 $96,413,595
Oregon $21,053,644 $30,029,888 $51,083,532
Pennsylvania $182,071,834 $106,127,515 $288,199,349
Rhode Island $5,946,578 $9,485,971 $15,432,549
South Carolina $105,184,170 $45,366,883 $150,551,053
South Dakota $1,636,287 $7,048,154 $8,684,441
Tennessee $132,841,628 $50,196,980 $183,038,608
Texas $428,340,492 $263,016,258 $691,356,750
Utah $15,180,026 $24,155,106 $39,335,132
Vermont $3,518,159 $5,783,710 $9,301,869
Virginia $109,091,336 $70,200,407 $179,291,743
Washington $50,235,943 $60,499,296 $110,735,239
West Virginia $19,811,155 $15,995,614 $35,806,769
Wisconsin $47,775,714 $53,395,707 $101,171,421
Wyoming $4,467,005 $5,081,534 $9,548,539
United States $4,939,017,909 $2,799,523,519 $7,738,541,428
* Methodology is described following the Appendices.
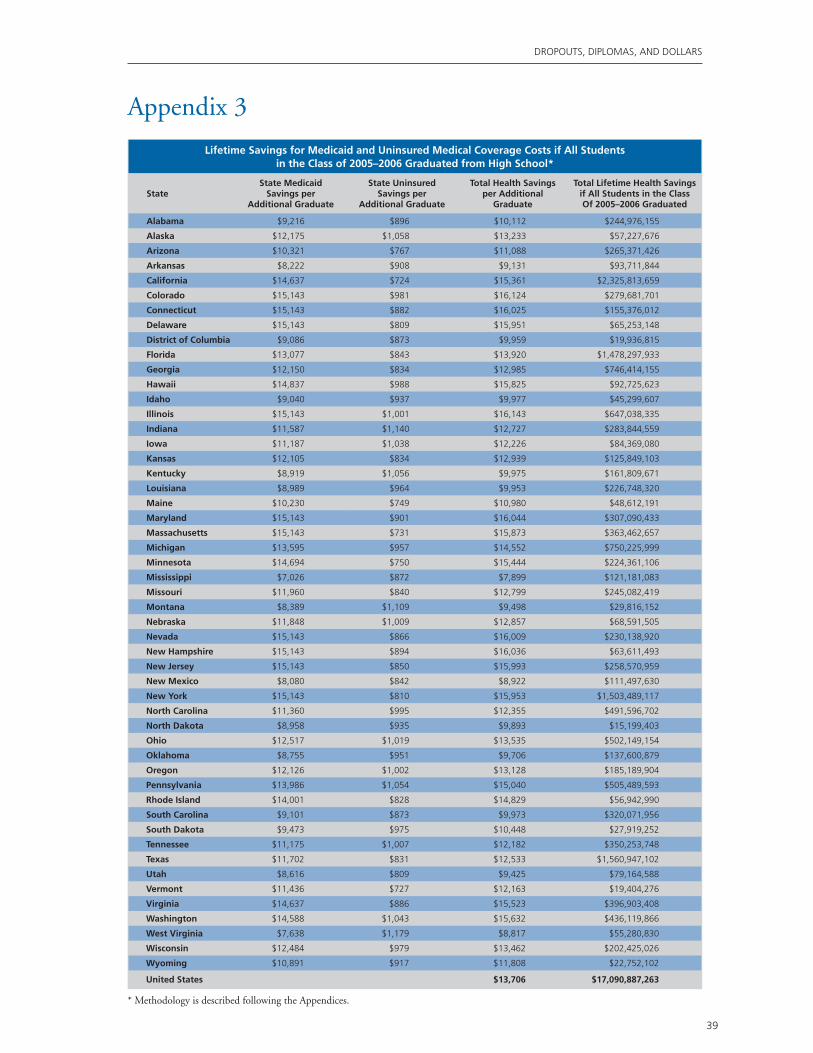
AlliAnce for excellent educAtion dropouts, diplomAs, And dollArs
39
Appendix 3
Lifetime Savings for Medicaid and Uninsured Medical Coverage Costs if All Students in the Class of 2005–2006 Graduated from High School*
State State Medicaid
Savings per Additional Graduate
State Uninsured Savings per
Additional Graduate
Total Health Savings per Additional
Graduate
Total Lifetime Health Savings if All Students in the Class Of 2005–2006 Graduated
Alabama $9,216 $896 $10,112 $244,976,155
Alaska $12,175 $1,058 $13,233 $57,227,676
Arizona $10,321 $767 $11,088 $265,371,426
Arkansas $8,222 $908 $9,131 $93,711,844
California $14,637 $724 $15,361 $2,325,813,659
Colorado $15,143 $981 $16,124 $279,681,701
Connecticut $15,143 $882 $16,025 $155,376,012
Delaware $15,143 $809 $15,951 $65,253,148
District of Columbia $9,086 $873 $9,959 $19,936,815
Florida $13,077 $843 $13,920 $1,478,297,933
Georgia $12,150 $834 $12,985 $746,414,155
Hawaii $14,837 $988 $15,825 $92,725,623
Idaho $9,040 $937 $9,977 $45,299,607
Illinois $15,143 $1,001 $16,143 $647,038,335
Indiana $11,587 $1,140 $12,727 $283,844,559
Iowa $11,187 $1,038 $12,226 $84,369,080
Kansas $12,105 $834 $12,939 $125,849,103
Kentucky $8,919 $1,056 $9,975 $161,809,671
Louisiana $8,989 $964 $9,953 $226,748,320
Maine $10,230 $749 $10,980 $48,612,191
Maryland $15,143 $901 $16,044 $307,090,433
Massachusetts $15,143 $731 $15,873 $363,462,657
Michigan $13,595 $957 $14,552 $750,225,999
Minnesota $14,694 $750 $15,444 $224,361,106
Mississippi $7,026 $872 $7,899 $121,181,083
Missouri $11,960 $840 $12,799 $245,082,419
Montana $8,389 $1,109 $9,498 $29,816,152
Nebraska $11,848 $1,009 $12,857 $68,591,505
Nevada $15,143 $866 $16,009 $230,138,920
New Hampshire $15,143 $894 $16,036 $63,611,493
New Jersey $15,143 $850 $15,993 $258,570,959
New Mexico $8,080 $842 $8,922 $111,497,630
New York $15,143 $810 $15,953 $1,503,489,117
North Carolina $11,360 $995 $12,355 $491,596,702
North Dakota $8,958 $935 $9,893 $15,199,403
Ohio $12,517 $1,019 $13,535 $502,149,154
Oklahoma $8,755 $951 $9,706 $137,600,879
Oregon $12,126 $1,002 $13,128 $185,189,904
Pennsylvania $13,986 $1,054 $15,040 $505,489,593
Rhode Island $14,001 $828 $14,829 $56,942,990
South Carolina $9,101 $873 $9,973 $320,071,956
South Dakota $9,473 $975 $10,448 $27,919,252
Tennessee $11,175 $1,007 $12,182 $350,253,748
Texas $11,702 $831 $12,533 $1,560,947,102
Utah $8,616 $809 $9,425 $79,164,588
Vermont $11,436 $727 $12,163 $19,404,276
Virginia $14,637 $886 $15,523 $396,903,408
Washington $14,588 $1,043 $15,632 $436,119,866
West Virginia $7,638 $1,179 $8,817 $55,280,830
Wisconsin $12,484 $979 $13,462 $202,425,026
Wyoming $10,891 $917 $11,808 $22,752,102
United States $13,706 $17,090,887,263
* Methodology is described following the Appendices.
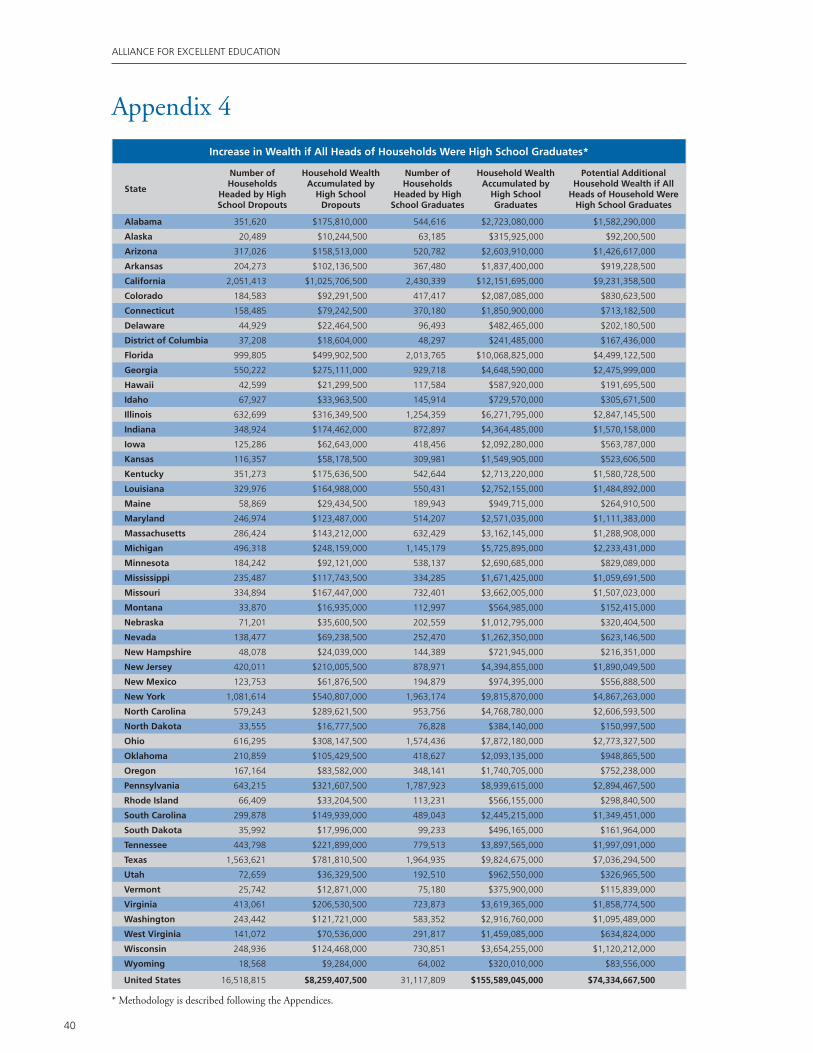
AlliAnce for excellent educAtion
40
dropouts, diplomAs, And dollArs
Appendix 4
Increase in Wealth if All Heads of Households Were High School Graduates*
State
Number of Households
Headed by High School Dropouts
Household Wealth Accumulated by
High School Dropouts
Number of Households
Headed by High School Graduates
Household Wealth Accumulated by
High School Graduates
Potential Additional Household Wealth if All
Heads of Household Were High School Graduates
Alabama 351,620 $175,810,000 544,616 $2,723,080,000 $1,582,290,000
Alaska 20,489 $10,244,500 63,185 $315,925,000 $92,200,500
Arizona 317,026 $158,513,000 520,782 $2,603,910,000 $1,426,617,000
Arkansas 204,273 $102,136,500 367,480 $1,837,400,000 $919,228,500
California 2,051,413 $1,025,706,500 2,430,339 $12,151,695,000 $9,231,358,500
Colorado 184,583 $92,291,500 417,417 $2,087,085,000 $830,623,500
Connecticut 158,485 $79,242,500 370,180 $1,850,900,000 $713,182,500
Delaware 44,929 $22,464,500 96,493 $482,465,000 $202,180,500
District of Columbia 37,208 $18,604,000 48,297 $241,485,000 $167,436,000
Florida 999,805 $499,902,500 2,013,765 $10,068,825,000 $4,499,122,500
Georgia 550,222 $275,111,000 929,718 $4,648,590,000 $2,475,999,000
Hawaii 42,599 $21,299,500 117,584 $587,920,000 $191,695,500
Idaho 67,927 $33,963,500 145,914 $729,570,000 $305,671,500
Illinois 632,699 $316,349,500 1,254,359 $6,271,795,000 $2,847,145,500
Indiana 348,924 $174,462,000 872,897 $4,364,485,000 $1,570,158,000
Iowa 125,286 $62,643,000 418,456 $2,092,280,000 $563,787,000
Kansas 116,357 $58,178,500 309,981 $1,549,905,000 $523,606,500
Kentucky 351,273 $175,636,500 542,644 $2,713,220,000 $1,580,728,500
Louisiana 329,976 $164,988,000 550,431 $2,752,155,000 $1,484,892,000
Maine 58,869 $29,434,500 189,943 $949,715,000 $264,910,500
Maryland 246,974 $123,487,000 514,207 $2,571,035,000 $1,111,383,000
Massachusetts 286,424 $143,212,000 632,429 $3,162,145,000 $1,288,908,000
Michigan 496,318 $248,159,000 1,145,179 $5,725,895,000 $2,233,431,000
Minnesota 184,242 $92,121,000 538,137 $2,690,685,000 $829,089,000
Mississippi 235,487 $117,743,500 334,285 $1,671,425,000 $1,059,691,500
Missouri 334,894 $167,447,000 732,401 $3,662,005,000 $1,507,023,000
Montana 33,870 $16,935,000 112,997 $564,985,000 $152,415,000
Nebraska 71,201 $35,600,500 202,559 $1,012,795,000 $320,404,500
Nevada 138,477 $69,238,500 252,470 $1,262,350,000 $623,146,500
New Hampshire 48,078 $24,039,000 144,389 $721,945,000 $216,351,000
New Jersey 420,011 $210,005,500 878,971 $4,394,855,000 $1,890,049,500
New Mexico 123,753 $61,876,500 194,879 $974,395,000 $556,888,500
New York 1,081,614 $540,807,000 1,963,174 $9,815,870,000 $4,867,263,000
North Carolina 579,243 $289,621,500 953,756 $4,768,780,000 $2,606,593,500
North Dakota 33,555 $16,777,500 76,828 $384,140,000 $150,997,500
Ohio 616,295 $308,147,500 1,574,436 $7,872,180,000 $2,773,327,500
Oklahoma 210,859 $105,429,500 418,627 $2,093,135,000 $948,865,500
Oregon 167,164 $83,582,000 348,141 $1,740,705,000 $752,238,000
Pennsylvania 643,215 $321,607,500 1,787,923 $8,939,615,000 $2,894,467,500
Rhode Island 66,409 $33,204,500 113,231 $566,155,000 $298,840,500
South Carolina 299,878 $149,939,000 489,043 $2,445,215,000 $1,349,451,000
South Dakota 35,992 $17,996,000 99,233 $496,165,000 $161,964,000
Tennessee 443,798 $221,899,000 779,513 $3,897,565,000 $1,997,091,000
Texas 1,563,621 $781,810,500 1,964,935 $9,824,675,000 $7,036,294,500
Utah 72,659 $36,329,500 192,510 $962,550,000 $326,965,500
Vermont 25,742 $12,871,000 75,180 $375,900,000 $115,839,000
Virginia 413,061 $206,530,500 723,873 $3,619,365,000 $1,858,774,500
Washington 243,442 $121,721,000 583,352 $2,916,760,000 $1,095,489,000
West Virginia 141,072 $70,536,000 291,817 $1,459,085,000 $634,824,000
Wisconsin 248,936 $124,468,000 730,851 $3,654,255,000 $1,120,212,000
Wyoming 18,568 $9,284,000 64,002 $320,010,000 $83,556,000
United States 16,518,815 $8,259,407,500 31,117,809 $155,589,045,000 $74,334,667,500
* Methodology is described following the Appendices.
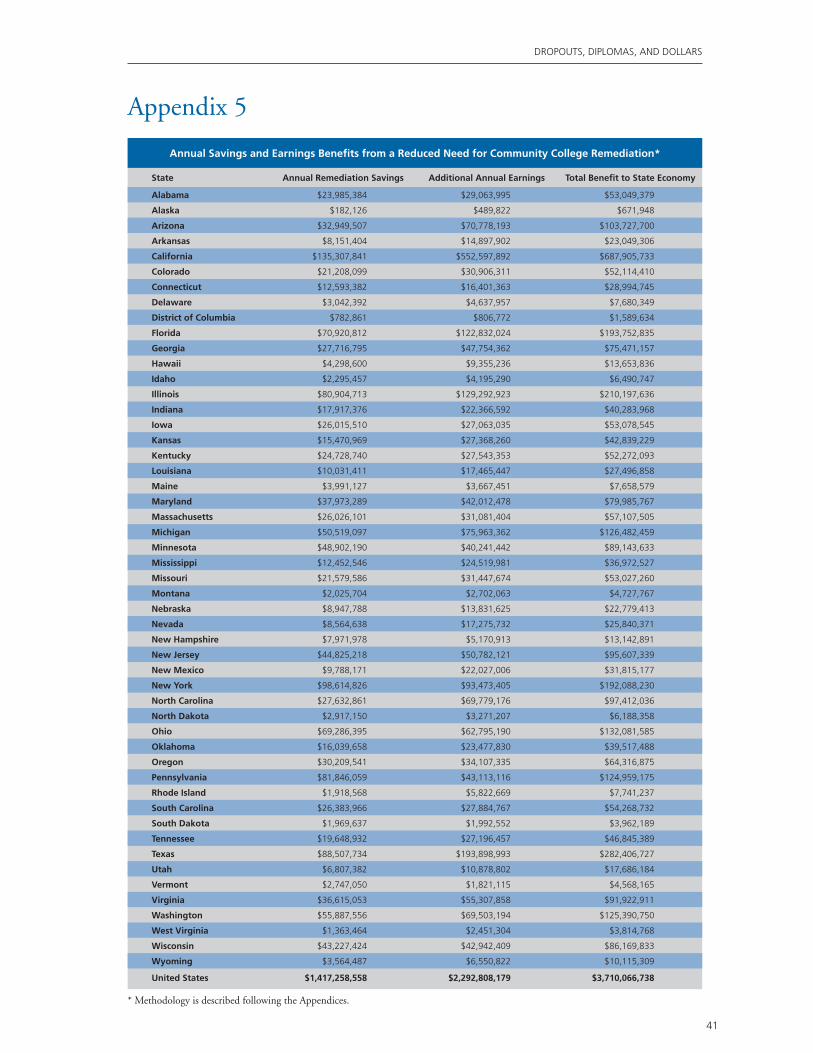
AlliAnce for excellent educAtion dropouts, diplomAs, And dollArs
41
Appendix 5
Annual Savings and Earnings Benefits from a Reduced Need for Community College Remediation*
State Annual Remediation Savings Additional Annual Earnings Total Benefit to State Economy
Alabama $23,985,384 $29,063,995 $53,049,379
Alaska $182,126 $489,822 $671,948
Arizona $32,949,507 $70,778,193 $103,727,700
Arkansas $8,151,404 $14,897,902 $23,049,306
California $135,307,841 $552,597,892 $687,905,733
Colorado $21,208,099 $30,906,311 $52,114,410
Connecticut $12,593,382 $16,401,363 $28,994,745
Delaware $3,042,392 $4,637,957 $7,680,349
District of Columbia $782,861 $806,772 $1,589,634
Florida $70,920,812 $122,832,024 $193,752,835
Georgia $27,716,795 $47,754,362 $75,471,157
Hawaii $4,298,600 $9,355,236 $13,653,836
Idaho $2,295,457 $4,195,290 $6,490,747
Illinois $80,904,713 $129,292,923 $210,197,636
Indiana $17,917,376 $22,366,592 $40,283,968
Iowa $26,015,510 $27,063,035 $53,078,545
Kansas $15,470,969 $27,368,260 $42,839,229
Kentucky $24,728,740 $27,543,353 $52,272,093
Louisiana $10,031,411 $17,465,447 $27,496,858
Maine $3,991,127 $3,667,451 $7,658,579
Maryland $37,973,289 $42,012,478 $79,985,767
Massachusetts $26,026,101 $31,081,404 $57,107,505
Michigan $50,519,097 $75,963,362 $126,482,459
Minnesota $48,902,190 $40,241,442 $89,143,633
Mississippi $12,452,546 $24,519,981 $36,972,527
Missouri $21,579,586 $31,447,674 $53,027,260
Montana $2,025,704 $2,702,063 $4,727,767
Nebraska $8,947,788 $13,831,625 $22,779,413
Nevada $8,564,638 $17,275,732 $25,840,371
New Hampshire $7,971,978 $5,170,913 $13,142,891
New Jersey $44,825,218 $50,782,121 $95,607,339
New Mexico $9,788,171 $22,027,006 $31,815,177
New York $98,614,826 $93,473,405 $192,088,230
North Carolina $27,632,861 $69,779,176 $97,412,036
North Dakota $2,917,150 $3,271,207 $6,188,358
Ohio $69,286,395 $62,795,190 $132,081,585
Oklahoma $16,039,658 $23,477,830 $39,517,488
Oregon $30,209,541 $34,107,335 $64,316,875
Pennsylvania $81,846,059 $43,113,116 $124,959,175
Rhode Island $1,918,568 $5,822,669 $7,741,237
South Carolina $26,383,966 $27,884,767 $54,268,732
South Dakota $1,969,637 $1,992,552 $3,962,189
Tennessee $19,648,932 $27,196,457 $46,845,389
Texas $88,507,734 $193,898,993 $282,406,727
Utah $6,807,382 $10,878,802 $17,686,184
Vermont $2,747,050 $1,821,115 $4,568,165
Virginia $36,615,053 $55,307,858 $91,922,911
Washington $55,887,556 $69,503,194 $125,390,750
West Virginia $1,363,464 $2,451,304 $3,814,768
Wisconsin $43,227,424 $42,942,409 $86,169,833
Wyoming $3,564,487 $6,550,822 $10,115,309
United States $1,417,258,558 $2,292,808,179 $3,710,066,738
* Methodology is described following the Appendices.

AlliAnce for excellent educAtion
42
dropouts, diplomAs, And dollArs
Appendix 6Additional Personal Income if the Educational Attainment of African Americans, Hispanics, and
Native Americans Increases to That of White Students by 2020*
State Additional Personal Income per Capita Additional Total Personal Income
Alabama $3,889 $2,134,381,638
Alaska $1,484 $423,110,051
Arizona $3,344 $8,644,461,855
Arkansas $3,998 $785,327,918
California $1,170 $101,596,190,713
Colorado $3,551 $5,188,606,198
Connecticut $3,950 $4,315,606,958
Delaware $4,837 $634,377,557
District of Columbia $3,764 $5,317,490,364
Florida $3,965 $14,663,755,737
Georgia $3,900 $7,930,898,877
Hawaii $2,547 $352,192,818
Idaho $3,846 $408,174,768
Illinois $3,516 $13,510,622,460
Indiana $4,077 $1,131,689,298
Iowa $3,821 $336,225,259
Kansas $3,786 $1,172,833,406
Kentucky $3,996 $291,008,831
Louisiana $2,873 $3,124,440,244
Maine $4,316 $40,637,361
Maryland $4,144 $5,970,754,071
Massachusetts $3,337 $3,504,068,718
Michigan $4,186 $3,772,426,427
Minnesota $4,238 $1,307,836,248
Mississippi $3,575 $1,548,876,962
Missouri $4,067 $1,263,941,997
Montana $3,486 $102,579,907
Nebraska $3,689 $521,398,644
Nevada $4,205 $2,187,182,198
New Hampshire $5,094 $51,425,275
New Jersey $3,607 $11,287,048,818
New Mexico $2,924 $4,928,408,709
New York $2,818 $24,325,608,943
North Carolina $4,222 $5,031,639,236
North Dakota $3,237 $62,014,474
Ohio $4,000 $2,610,266,730
Oklahoma $3,242 $1,007,735,288
Oregon $3,732 $1,559,595,961
Pennsylvania $3,765 $4,033,303,789
Rhode Island $2,925 $494,298,457
South Carolina $4,039 $2,671,651,061
South Dakota $3,669 $125,990,765
Tennessee $4,044 $1,493,793,808
Texas $2,412 $46,517,384,141
Utah $4,277 $780,727,335
Vermont $4,640 not Applicable
Virginia $4,395 $6,517,547,903
Washington $4,069 $3,110,256,023
West Virginia $3,737 $12,419,546
Wisconsin $4,054 $1,569,711,086
Wyoming $3,467 $105,591,901
United States $310,477,516,732
* Methodology is described following the Appendices.
AlliAnce for excellent educAtion dropouts, diplomAs, And dollArs
43
Appendices Methodology*
Appendix 1: The Alliance for Excellent Education (the Alliance) determined the average additional lifetime income if one class of dropouts were to graduate by multiplying the projected number of students who failed to graduate with their class in 2008149 by the $260,000 estimated lifetime earnings difference between a high school dropout and a high school graduate.150 National totals are not the sum of the state totals for methodological reasons.
Appendix 2: Crime-related savings were calculated using methods outlined by economists Lance Lochner and Enrico Moretti,151 which estimate the costs (e.g., incarceration, property loss, and costs to victims) of crimes such as murder, rape, robbery, assault, burglary, larceny, and motor vehicle theft and the percent change in those crimes based on a 1 percent increase in the male graduation rate. For this Alliance analysis, 2003 Uniform Crime Report data on the number of crimes in each state were multiplied by the percent change in each crime that would result from a 5 percent increase in the male graduation rate. Increased earnings were calculated using 2004 U.S. Census Current Population Survey data, which finds that, on average, male, year-round, full-time workers of all races who are high school dropouts earn $11,173 less than high school graduates, $19,174 less than those who attend some college, and $53,850 less than those with a bachelor’s degree or higher. According to the National Center for Education Statistics’ (NCES) 2003 Condition of Education report, of male students finishing high school, 26.3 percent earn only a high school diploma, 46.8 percent attend some college, and 26.9 percent earn a bachelor’s degree or higher. These educational attainment percentages were then multiplied by the number of additional male high school graduates, assuming a 5 percent increase in the male graduation rate. Finally, the number of additional students attaining these levels of education was multiplied by the earnings difference between a high school dropout and each respective level of educational attainment.
Appendix 3: Health-related savings were calculated by Peter Muennig, who estimated the difference in the percentage of people receiving Medicaid and the percentage of people who are uninsured by educational attainment. Muennig also estimated the average cost of a Medicaid recipient and the average cost of an uninsured person to state governments and determined lifetime costs for high school dropouts, high school graduates, those who attended some college, and college graduates. State Medicaid savings and uninsured savings over the lifetime of an additional high school graduate combine to the total lifetime health savings per additional graduate. The total savings per additional graduate was multiplied by the estimated number of additional students who would earn a diploma if high school graduation rates were increased from the current state rate to 100 percent in the 2005–2006 school year152 to calculate the total health savings if all students in the Class of 2005–2006 graduated on time.
Appendix 4: The Alliance used the U.S. Census Bureau’s 2005 numbers for households by educational attainment and multiplied them by their median financial wealth153 to derive the total household wealth accumulated by education level by state. The difference in the median financial wealth between nongraduates and those with a high school diploma ($4,500) was multiplied by the number of heads of house-holds who did not graduate high school to determine the potential additional wealth if all heads of households were high school graduates.
Appendix 5: Annual remediation savings were estimated by multiplying the cost of one course by the number of students under twenty-five years of age who take at least one remedial course. The College Board estimates that student tuition covers one fifth of the cost of educa-tion. Therefore, to calculate the full cost of a community college course, annual tuition was multiplied by five. The resulting number was then divided by ten, which is the average number of courses a student takes over two semesters. To estimate the number of students under twenty-five years of age who enroll in at least one remedial course, the percent of students under twenty-five years of age (52 percent) was multiplied by the percent of public, two-year-college students who report enrolling in at least one remedial course (42.5 percent).154 District of Columbia data is based on the University of the District of Columbia, which has open enrollment.
To calculate additional annual earnings, the salary difference between students who attend “some college” and students who earn a bach-elor’s degree was multiplied by the number of students who would have graduated if they did not need remedial reading (potential new graduates). Using 2004 NCES data, the number of potential new college graduates was calculated by multiplying the remedial student count (above) by the percentage (20 percent) of community college freshmen enrolled in remedial reading and by 41 percent, the difference in bachelor’s degree attainment between those who enroll in remedial reading (17 percent) and those who do not (58 percent). This new graduate count was then multiplied by the average earnings difference between “some college” and “bachelor’s degree,” as listed in 2005 Census data.
Appendix 6: The Alliance’s calculation used figures from Patrick Kelly155 showing the net percentage increase in the proportion of the population reaching each level of educational attainment by 2020, based on if minority graduation rates were equal with those for white students compared to if educational attainment rates by ethnicity remain at current levels. Using Census population projections and earn-ings estimates based on levels of education attainment, the Alliance determined the difference in potential gains in earnings. Increased earn-ings were calculated using 2004 Census figures, which find that a dropout will earn $9,114 less than a diploma/GED recipient, $14,062 less than an individual with some college, $15,953 less than individual with an Associate’s degree, $23,238 less than an individual with a bachelor’s degree, and $55,953 less than an individual with a graduate or professional degree.
*Costs in Appendices should not be aggregated.
AlliAnce for excellent educAtion
44
dropouts, diplomAs, And dollArs
Endnotes1 u.s. department of labor, America’s Dynamic Workforce, 2007 (Washington, dc: u.s. department of labor, 2007), http://www.dol.gov/asp/media/reports/workforce2007/AdW2007_full_text.pdf (accessed July 22, 2008).
2 Achieve, inc., Preparing Today’s High School Students for Tomorrow’s Opportunities (Washington, dc: Achieve, inc., 2006), http://www.achieve.org/files/Adpnetworkbrochure.pdf (accessed July 30, 2008).
3 “summit told u.s. High schools obsolete,” Associated press, february 26, 2005, http://www.msnbc.msn.com/id/7033821/ (accessed July 30, 2008).
4 oprah Winfrey, press release, http://www.oprah.com/about/press/releases/200604/press_releases_20060407.jhtml (accessed July 28, 2008).
5 rod paige, remarks at high school leadership summit, october 8, 2003, http://www.ed.gov/news/speeches/2003/10/10082003.html (accessed July 30, 2008).
6 Alliance for excellent education, High School Dropouts in America (Washington, dc: Alliance for excellent education, 2007).
7 B. l. Wolfe and r. H. Haveman, “social and non-market Benefits from education in an Advanced economy,” paper prepared for conference series 47, “education in the 21st century: meeting the challenges of a changing World,” federal reserve Bank of Boston, June 2002.
8 Alliance for excellent education, High School Dropouts.
9 editorial projects in education, “diplomas count 2008: school to college: can state p–16 councils ease the transition?” special issue, Education Week 27, no. 40 (2008).
10 ibid.
11 ibid.
12 ibid.
13 ibid.
14 ibid.
15 ibid.
16 u.s. department of education, national center for education statistics, Digest of Education Statistics 2006 (nces 2007-017) (Washington, dc: Government printing office, 2007).
17 r. Balfanz and n. legters, “the Graduation rate crisis We Know and What can be done About it,” Education Week 25, no. 42 (2006), http://web.jhu.edu/csos/graduation-gap/edweek/crisis_commentary.pdf (accessed July 17, 2008).
18 editorial projects in education, “diplomas count 2008.”
19 editorial projects in education, “Graduation rates map,” http://apps.arcwebservices.com/edweekv3/default.jsp (accessed July 18, 2008).
20 Alliance for excellent education, “dropout factories database,” http://www.all4ed.org/promotingpower (accessed July 18, 2008).
21 Balfanz and legters, “the Graduation rate crisis.”
22 n. Zuckerbrod, “no ‘dropout factories’ in utah,” Deseret News, october 30, 2007.
23 Balfanz and legters, “the Graduation rate crisis.”
24 center for social organization of schools, Johns Hopkins university, “national profile: percent of High schools by different levels of promoting power,” http://web.jhu.edu/csos/graduation-gap/power/state_summary.pdf (accessed July 23, 2008).
25 r. neild and r. Balfanz, “An extreme degree of difficulty: the educational demographics of urban neighborhood High schools,” Journal of Education for Students Placed at Risk 11, no. 2 (2006), http://web.jhu.edu/csos/graduation-gap/edweek/neild_Balfanz.pdf (accessed July 30, 2008).
26 n. Zuckerbrod, “1 in 10 schools Are ‘dropout factories’,” USA Today, october 30, 2007, http://www.usatoday.com/news/education/2007-10-30-dropout-factories_n.htm (accessed July 28, 2008).
27 A. carnevale, “confessions of an education fundamentalist: Why Grade 12 is not the right end point for Anyone,” in Minding the Gap: Why Integrating High School with College Makes Sense and How to Do It, ed. n. Hoffman, A. Venezia, and m. s. miller (cambridge, mA: Harvard education press, 2007).
28 i. Kirsch, H. Braun, K. Yamamoto, and A. sum, America’s Perfect Storm: Three Forces Changing Our Nation’s Future (Washington, dc: educational testing service, 2007).
29 c. Benson, “closing the training loop,” CQ Weekly, march 31, 2008.
30 A. carnevale, “college for All?” Change Magazine (January-february 2008), http://www.changemag.org/Archives/Back%20issues/January-february%202008/abstract-college-for-all.html (accessed July 30, 2008).
31 ibid.
32 m. Janosz, i. Archambault, J. morizot, and l. s. pagani, “school engagement trajectories and their differential predictive relations to dropout,” Journal of Social Issues 64, no. 1 (2008): 21–40, http://www.blackwell-synergy.com/doi/pdf/10.1111/j.1540-4560.2008.00546.x (accessed march 3, 2008).
33 Alliance for excellent education, Using Early-Warning Data to Improve Graduation Rates: Closing Cracks in the Education System (Washington, dc: Alliance for excellent education, 2008).
34 J. Greene and m. Winters, Public High School Graduation and College-Readiness Rates: 1991–2002 (new York: manhattan institute for policy research, 2005).
AlliAnce for excellent educAtion dropouts, diplomAs, And dollArs
45
35 s. Joftus, Every Child a Graduate: A Framework for an Excellent Education for All Middle and High School Students (Washington, dc: Alliance for excellent education, 2002).
36 Alliance for excellent education, The High Cost of High School Dropouts: What the Nation Pays for Inadequate High Schools (Washington, dc: Alliance for excellent education, 2008).
37 ibid.
38 d. stout and r. pear, “Bush seeks Budget of $3.1 trillion,” New York Times, february 4, 2008, http://www.nytimes.com/2008/02/04/washington/04cnd-budget.html?adxnnl=1&adxnnlx=1216382504-1nymWxu7nex7stvasvd3fQ (accessed July 30, 2008).
39 pew center on the states, One in 100: Behind Bars in America 2008 (Washington, dc: pew charitable trusts, 2008).
40 c. Harlow, Education and Correctional Populations, Bureau of Justice statistics special report (Washington, dc: u.s. department of Justice, 2003).
41 ibid.
42 coalition for Juvenile Justice, Abandoned in the Back Row: New Lessons in Education and Delinquency Prevention (Washington, dc: coalition for Juvenile Justice, 2001).
43 J. Bridgeland, J. diiulio, and K. morison, The Silent Epidemic: Perspectives of High School Dropouts (Washington, dc: civic enterprises, 2006).
44 Alliance for excellent education, Saving Futures, Saving Dollars: The Impact of Education on Crime Reduction and Earnings (Washington, dc: Alliance for excellent education, 2006).
45 ibid.
46 ibid.
47 u.s. department of education, national center for education statistics, Digest of Education Statistics, 2007 (nces 2008-022) (Washington, dc: Government printing office, 2008).
48 college Board, Trends in College Pricing (new York: college Board, 2007).
49 u.s. department of Justice, Budget Trend Data: 1975 Through the President’s 2003 Request to the Congress, http://www.justice.gov/jmd/budgetsummary/btd/1975_2002/btd02tocpg.htm (accessed July 28, 2008).
50 pew research center, State of the States, a Stateline.org Report: State Policy Developments and Trends 2006 (Washington, dc: pew research center, 2006).
51 national Governors Association and national Association of state Budget officers, The Fiscal Survey of States, Spring 2008 (Washington, dc: national Governors Association and national Association of state Budget officers, 2008).
52 carnevale, ”confessions of an education fundamentalist.”
53 p. muennig, State-Level Health Cost-Savings Associated with Improvements in High School Graduation Rates (Washington, dc: Alliance for excellent education, 2006).
54 G. Anderson, p. Hussey, B. frogner, and H. Waters, “Health spending in the united states and the rest of the industrialized World,” Health Affairs 24, no. 4 (2005): 903–14.
55 u.s. census Bureau, Income, Poverty, and Health Insurance Coverage in the United States: 2005 (Washington, dc: u.s. Government printing office, 2006).
56 Kaiser commission on medicaid and the uninsured, Who Are the Uninsured? A Consistent Profile Across National Surveys (Washington, dc: Henry J. Kaiser family foundation, 2006).
57 A. davidoff and G. Kenney, Uninsured Americans with Chronic Health Conditions: Key Findings from the National Health Interview Survey (Washington, dc: urban institute, 2005).
58 J. Hadley, Sicker and Poorer: The Consequences of Being Uninsured (Washington, dc: urban institute, 2003).
59 m. Gladwell, “the moral Hazard myth: the Bad idea Behind our failed Health care system,” New Yorker, August 29, 2005: 81, 44–49.
60 B. Goesling, “the rising significance of education for Health,” report prepared for the annual meeting of the population Association of America, philadelphia, pA, April 2005.
61 centers for disease control and prevention, National Health Interview Survey 2006 (Atlanta, GA: centers for disease control and prevention, 2007).
62 centers for disease control and prevention, National Health Interview Survey 2007 (Atlanta, GA: centers for disease control and prevention, 2008).
63 p. muennig, “Health returns to education interventions,” paper prepared for the symposium on the social costs of an inadequate education at columbia university, new York, nY, october 24–25, 2005; m. Winkleby, d. Jatulis, e. frank, and s. fortmann, “socioeconomic status and Health: How education, income, and occupation contribute to risk factors for cardiovascular disease,” American Journal of Public Health 82, no. 6 (1992): 816–20.
64 muennig, ”Health returns to education interventions.”
65 m. Wong, m. shapiro, W. Boscardin, and s. ettner, “contribution of major diseases to disparities in mortality,” New England Journal of Medicine 347, no. 20 (2002): 1585–92.
66 Agency for Healthcare research and Quality, Medical Expenditure Panel Survey 2003, http://www.meps.ahrq.gov/ (accessed september, 27, 2006).
67 centers for medicare and medicaid services, A Profile of Medicaid, Chartbook 2004 (Washington, dc: centers for medicare and medicaid services, 2004).
AlliAnce for excellent educAtion
46
dropouts, diplomAs, And dollArs
68 d. conley, Being Black, Living in the Red: Race, Wealth, and Social Policy in America (Berkeley: university of california press, 1999); t. shapiro, The Hidden Cost of Being African American: How Wealth Perpetuates Inequality (new York: oxford university press, 2004); t. Hertz, Understanding Mobility in America (Washington, dc: center for American progress, 2006).
69 e. Gouskova and f. stafford, Trends in Household Wealth Dynamics, 2001–2003 (Ann Arbor, mi: institute for social research, university of michigan, 2005).
70 conley, Being Black.
71 ford foundation, Saving’s Grace: The Power of Building Financial Assets (new York: ford foundation, 2007).
72 r. Kochhar, The Wealth of Hispanic Households: 1996–2002 (Washington, dc: pew Hispanic center, 2006); s. doron and e. fisher, Black Wealth/White Wealth: An Issue for the South (research triangle park, nc: southern Growth policies Board, 2002).
73 corporation for enterprise development, State Asset Development Report Card: Benchmarking Asset Development in Fighting Poverty (Washington, dc: corporation for enterprise development, 2002).
74 Kochhar, Wealth of Hispanic Households; doron and fisher, Black Wealth/White Wealth.
75 i. sawhill, Opportunity in America: The Role of Education (Washington, dc: Brookings institution, 2006); A. orr, “Black-White differences in Achievement: the importance of Wealth,” Sociology of Education 76 (2003): 281–304; Hertz, Understanding Mobility.
76 l. mishel, J. Bernstein, and s. Allegretto, The State of Working America 2006/2007 (Washington, dc: economic policy institute, 2006).
77 conley, Being Black.
78 doron and fisher, Black Wealth/White Wealth; m. oliver and t. shapiro, Black Wealth, White Wealth: A New Perspective on Racial Inequality (new York: routledge, 1995).
79 sawhill, Opportunity in America.
80 Alliance for excellent education, Paying Double: Inadequate High Schools and Community College Remediation (Washington, dc: Alliance for excellent education, 2006).
81 ibid.
82 J. Greene, The Cost of Remedial Education: How Much Michigan Pays When Students Fail to Learn Basic Skills (midland, mi: mackinac center for public policy, 2000).
83 editorial projects in education, “diplomas count 2008.”
84 J. Greene and m. Winters, Leaving Boys Behind: Public High School Graduation Rates (new York: manhattan institute for policy research, 2006).
85 Act, Reading Between the Lines: What the ACT Reveals About College Readiness in Reading (iowa city, iA: Act, 2006).
86 High school survey of student engagement, HSSSE 2004 Overview (Bloomington, in: indiana university, Hssse, 2005).
87 A. p. carnevale and d. m. desrochers, Standards for What? The Economic Roots of K–12 Reform (Washington, dc: educational testing service, 2003).
88 u.s. department of labor, America’s Dynamic Workforce, 2007.
89 Achieve, inc., Preparing Today’s High School Students for Tomorrow’s Opportunities.
90 u.s. department of education, national center for education statistics, The Condition of Education 2004, Indicator 31: Remedial Coursetaking (Washington, dc: u.s. department of education, 2004).
91 d. Jenkins and K. Boswell, State Policies on Community College Remedial Education: Findings from a National Survey (denver, co: education commission of the states, 2002).
92 u.s. department of education, Condition of Education 2004, Indicator 31.
93 u.s. department of education, national center for education statistics, National Postsecondary Student Aid Study (2004), data Analysis systems (dAs-t) online computation, run on April 10, 2006, analysis by the Alliance for excellent education.
94 r. phipps, College Remediation: What It Is, What It Costs, What’s At Stake (Washington, dc: institute for Higher education policy, 1998).
95 Jenkins and Boswell, State Policies.
96 u.s. department of education, national center for education statistics, The Condition of Education 2004, Indicator 18: Remediation and Degree Completion (Washington, dc: u.s. department of education, 2004).
97 Alliance for excellent education, Paying Double.
98 H. levin, c. Belfield, p. muennig, and c. rouse, The Costs and Benefits of an Excellent Education for All of America’s Children (new York: teacher’s college, columbia university, 2007).
99 ibid.
100 national commission on excellence in education, A Nation at Risk (Washington, dc: national commission on excellence in education, 1983), http://www.ed.gov/pubs/natAtrisk/index.html (accessed July 18, 2008).
101 e. fiske, “education-lessons,” New York Times, september 13, 1989.
102 e. fiske, “Governors panel Asks Broader u.s. role in preschool for the poor,” New York Times, february 25, 1990.
103 G. H. W. Bush, address before a joint session of the congress on the state of the union, January 31, 1990, http://www.c-span.org/executive/transcript.asp?cat=current_event&code=bush_admin&year=1990 (accessed July 18, 2008).
104 national center on education and the economy, America’s Choice: High Skills or Low Wages: The Report of the Commission on the Skills of the American Workforce (Washington, dc: national center on education and the economy, 1990).
AlliAnce for excellent educAtion dropouts, diplomAs, And dollArs
47
105 G. W. Bush, radio address, september 1, 2001, http://www.whitehouse.gov/news/releases/2001/09/20010901.html (accessed July 18, 2008).
106 national center on education and the economy, Tough Choices or Tough Times: The Report of the New Commission on the Skills of the American Workforce (Washington, dc: national center on education and the economy, 2006).
107 Greene and Winters, Public High School Graduation.
108 organisation for economic co-operation and development, Education at a Glance 2007, table A1.2a (Washington, dc: organisation for economic co-operation and development, 2007).
109 organisation for economic co-operation and development, Education at a Glance 2007: OECD Briefing Note for the United States (Washington, dc: organisation for economic co-operation and development, 2007).
110 m. Wise, “u.s. Beaten at own Game: poor fundamentals cost it shot at Gold,” Washington Post, August 29, 2004.
111 ibid.
112 organisation for economic co-operation and development, Education at a Glance 2007, table A1.2a.
113 organisation for economic co-operation and development, Education at a Glance 2007: OECD Briefing Note.
114 organisation for economic co-operation and development, PISA 2006: Science Competencies for Tomorrow’s World: OECD Briefing Note for the United States (Washington, dc: organisation for economic co-operation and development, 2007).
115 World economic forum, The Global Competitiveness Report 2007–2008, http://www.weforum.org/pdf/Gcr/profiles08/unitedstates.pdf (accessed July 18, 2008).
116 ibid.
117 e. Hanushek, d. Jamison, e. Jamison, and l. Woessmann, “education and economic Growth: it’s not Just Going to school, but learning something While there that matters,” Education Next 8, no. 2 (2008), http://www.hoover.org/publications/ednext/16110377.html (accessed July 30, 2008).
118 ibid.
119 ibid.
120 ibid.
121 ibid.
122 ibid.
123 organisation for economic co-operation and development, Education at a Glance 2007: OECD Briefing Note.
124 ibid.
125 m. Horrigan, “employment projections to 2012: concepts and context,” Monthly Labor Review (february 2004).
126 ibid.
127 m. toossi, “A new look at long-term labor force projections to 2050,” Monthly Labor Review (november 2006).
128 B. su, “the u.s. economy to 2016: slower Growth as Boomers Begin to retire,” Monthly Labor Review (november 2007).
129 Kirsch, Braun, Yamamoto, and sum, America’s Perfect Storm.
130 toossi, ”A new look.”
131 u.s. census Bureau, “Annual estimates of the population by sex, race, and Hispanic origin for the united states: April 1, 2000, to July 1, 2007,” http://www.census.gov/popest/national/asrh/nc-est2007-srh.html (accessed July 23, 2007).
132 u.s. census Bureau, “u.s. interim projections by Age, sex, race, and Hispanic origin,” summary table 1a, http://www.census.gov/ipc/www/usinterimproj/ (accessed August 17, 2006).
133 J. passel and d. cohn, U.S. Population Projections: 2005–2050 (Washington, dc: pew research center, 2008).
134 editorial projects in education, “diplomas count 2008.”
135 editorial projects in education, “diplomas count 2007: ready for What? preparing students for college, careers, and life After High school,” Education Week 26, no. 40 (2007).
136 Kirsch, Braun, Yamamoto, and sum, America’s Perfect Storm.
137 national center for public policy and Higher education, “income of u.s. Workforce projected to decline if education doesn’t improve,” policy alert (Washington, dc: national center for public policy and Higher education, 2005).
138 ibid.
139 r. Balfanz and n. legters, Locating the Dropout Crisis: Which High Schools Produce the Nation’s Dropouts? Where Are They Located? Who Attends Them? (Baltimore: center for research on the education of students placed At risk, Johns Hopkins university, 2004).
140 u.s. department of education, national center for education statistics, The Condition of Education 2004 (Washington, dc: u.s. Government printing office, 2004).
141 K. carey, The Funding Gap 2004: Many States Still Shortchange Low-Income and Minority Students (Washington, dc: education trust).
142 u.s. department of labor, America’s Dynamic Workforce, 2007.
143 J. Greene and G. forster, Public High School Graduation and College Readiness Rates in the United States (new York: manhattan institute for policy research, 2003).
144 K. carey, One Step from the Finish Line: Higher College Graduation Rates Are Within Our Reach (Washington, dc: education trust, 2005).
AlliAnce for excellent educAtion
48
145 p. Kelly, As America Becomes More Diverse: The Impact of State Higher Education Inequality (Boulder, co: national center for Higher education management systems, 2005).
146 u.s. census Bureau, U.S. Interim Detailed State Projections by Single Year of Age, Sex, Race, and Hispanic Origin: 1995 to 2025 (Washington, dc: u.s. census Bureau, 2000), http://www.census.gov/population/www/projections/stproj.html (accessed september 19, 2006); u.s. census Bureau, U.S. Interim Projections.
147 editorial projects in education, “diplomas count 2007.”
148 social security Administration, “frequently Asked Questions About social security’s future,” http://www.ssa.gov/qa.htm (accessed July 17, 2008).
149 editorial projects in education, “diplomas count 2008.”
150 c. rouse, “labor market consequences of an inadequate education,” paper prepared for the symposium “social costs of inadequate education at teachers college,” columbia university, new York, nY, october 2005.
151 l. lochner and e. moretti, “the effect of education on crime: evidence from prison inmates, Arrests and self-reports,” American Economic Review 94, no. 1 (2004): 155–189.
152 editorial projects in education, “diplomas count: An essential Guide to Graduation policy and rates,” special issue, Education Week 25, no. 41s (2006); u.s. department of education, national center for education statistics, Common Core of Data (Washington, dc: u.s. department of education, 2003), http://nces.ed.gov/ccd/ (accessed september 27, 2006).
153 e. Gouskova and f. stafford, Trends in Household Wealth Dynamics, 2001–2003.
154 u.s. department of education, national center for education statistics, National Postsecondary Student Aid Study (2004), data Analysis systems (dAs-t) online computation, run on April 10, 2006, analysis by the Alliance for excellent education.
155 p. Kelly, As America Becomes More Diverse: The Impact of State Higher Education Inequality.
cov
er im
age:
Geo
rge
schi
ll/c
orbi
s

AlliAnce for excellent educAtion