Embed Size (px)
Citation preview

1 Droplet Interfaced Parallel and Quantitative Microfluidic-Based2 Separations3 Sammer-ul Hassan,† Hywel Morgan,‡,§ Xunli Zhang,†,§ and Xize Niu*,†,§
4†Faculty of Engineering and the Environment, University of Southampton, Southampton, U.K. SO17 1BJ
5‡Faculty of Physical Sciences and Engineering, University of Southampton, Southampton, U.K. SO17 1BJ
6§Institute for Life Sciences, University of Southampton, Southampton, U.K. SO17 1BJ
7 *S Supporting Information
8 ABSTRACT: High-throughput, quantitative, and rapid microfluidic-9 based separations has been a long-sought goal for applications in10 proteomics, genomics, biomarker discovery, and clinical diagnostics.11 Using droplet-interfaced microchip electrophoresis (MCE) techni-12 ques, we have developed a novel parallel MCE platform, based on13 the concept of combining the Slipchip principle with a newly14 developed “Gelchip”. The platform consists of two plastic plates,15 with droplet wells on one plate and separation channels with16 preloaded/cured gel in the other. A single relative movement of one17 plate enables generation and then loading of multiple sample18 droplets in parallel into the separation channels, allowing electro-19 phoretic separation of biomolecules in the droplets in parallel and20 with high-throughput. As proof of concept, we demonstrated the21 separation of 30 sub-nL sample droplets containing fluorescent dyes or DNA fragments.
22 Electrophoresis in all its embodiments is a powerful23 analytical technique which has been applied to resolve24 complex mixtures containing DNA, proteins, and other25 chemical or biological species.1−4 The development of26 microfabrication techniques has led to further miniaturization27 of electrophoresis known as microchip electrophoresis (MCE),28 which offers particular advantages including ultrasmall volume29 sample consumption, integration with other “lab-chip”30 processes or functions such as extraction, purification, washing,31 mixing, and sample concentration.5,6 As a result, MCE has been32 used in a variety of applications, e.g., to analyze biomolecules in33 blood,7 saliva,8 tear,9 dialysate,10 and islets.11
34 The majority of MCE and capillary electrophoresis (CE)35 technologies have used one of the two common sample36 injection methods, i.e., electrokinetic or hydrostatic injection. In37 the former, the sample injection may introduce bias as different38 analytes have different electrophoretic mobilities;12,13 therefore,39 the injected sample may not reflect the concentration and40 composition of the original sample.4 Hydrostatic sample41 injection technique has many difficulties, e.g., in controlling42 the flow in the small microchannels, and has limited43 throughput.14 To analyze samples in parallel, microfluidic44 chips have been fabricated that consist of arrays of micro-45 channels.12,15−19 However, these devices use the same sample46 injection methods listed above. Pan et al. has recently shown an47 elegant method of parallel separation in free-standing gel strips48 with 96 wells, and this could lead to high throughput and49 quantitative analysis with a low running cost.20
50Droplet-based microfluidics has immerged as a powerful tool,51and the technique can encapsulate biological samples in52discrete droplets, enabling manipulation and analysis in a53high throughput format.21−24 Subnanoliter sample droplets can54be generated in a microfluidic chip or collected from a55bioreactor, an upstream separation column, or even from a56tissue environment.25−27 These discrete sample droplets can be57further analyzed by electrophoresis by injecting them into a58separation channel.28,29 Such droplet-interfaced systems have59been shown to be effective for sample injection and offer many60other advantages including ultrasmall volume consumption, no61sample waste, quantitative analysis without bias, simple device62setup, and no electric field switching. Interestingly such systems63also reintroduce CE as a powerful analytical tool to resolve64complex mixtures within microdroplets.10,29 However, in these65droplet-interfaced separations, sample droplets are mostly66analyzed in serial that limits throughput. Jian30 has addressed67this shortcoming by expanding an original single separation68channel to three, but further multiplexing requires complicated69droplet manipulation, which may not be feasible.70The Slipchip, first developed by Ismagilov’s group,31 is an71effective new method for parallel droplet operations. It is a72simple device consisting of two plates with small wells73fabricated in each. The wells can be filled with different74reagents and upon sliding one layer relative to the other,
Received: December 17, 2014Accepted: March 16, 2015
Article
pubs.acs.org/ac
© XXXX American Chemical Society A DOI: 10.1021/ac504695wAnal. Chem. XXXX, XXX, XXX−XXX
sac00 | ACSJCA | JCA10.0.1465/W Unicode | research.3f (R3.6.i7:4236 | 2.0 alpha 39) 2014/12/19 13:33:00 | PROD-JCA1 | rq_3394253 | 3/19/2015 15:24:41 | 7 | JCA-DEFAULT
75 various operations can be implemented such as generation of76 sample droplets or fusion of droplets to initiate chemical77 reactions. We32 and later Shujun et al.33 demonstrated that this78 Slipchip format has the potential to be used for separation79 science, e.g., for segmenting separated samples after isoelectric80 focusing (IEF) into microdroplets to avoid any sample remixing81 during postseparation sample collection.82 Herein, we combine the concepts of the Slipchip and MCE83 and develop a novel device that can achieve parallel droplet84 interfaced separations, by loading droplets into separation gel/85 medium with the “slipping” function. With this sample loading86 method, the entire volume of the sample droplets can be87 separated. Therefore, it offers the ability to quantify88 biomolecules in sample droplets.
89 ■ EXPERIMENTAL SECTION
90 Materials. Fluorescein 5(6)-isothiocyanate (FITC), fluo-91 rescein, 5-carboxyfluorescein, eosin Y, tris borate buffer (TBE),92 and agarose powder were obtained from Sigma-Aldrich93 (Dorset, U.K). Poly(ethylene oxide) (PEO, 500 kDa) was94 purchased from Avocado Research Chemicals Ltd. (Lancashire,95 U.K.). Solutions of 30% (w/v) acrylamide/bis(acrylamide),96 cross-linker (TEMED), initiator (ammonium persulfate), and97 sodium dodecyl sulfate (SDS) were also purchased from Sigma-98 Aldrich (Dorset, U.K). DNA ladder (Mapmarker FAM labeled)99 was purchased from BioVentures Inc. (Murfreesboro).100 Sample Preparation. Commercially available reagents101 were bought and used without further purification. Fluorescein102 5(6)-isothiocyanate (FITC), fluorescein, 5-carboxyfluorescein,103 and eosin Y were dissolved in 0.1× TBE at a stock104 concentrations of 300 μM. DNA samples were prepared by
105mixing standard Mapmarker ladder with formamide at equal106volumes and diluted with 1× TBE to achieve 10× diluted107standard sample. The sample mixture was predenatured at 95108°C for 2 min and snap-cooled on ice prior to loading to the109sample channels.110Microchip Fabrication and Preparation. The micro-111fluidic chips used for all experiments were fabricated by a112precise micromilling in poly(methyl methacrylate) (PMMA)113sheets using an LPKF micromilling machine (ProtoMat-S100).114The separation channels (150 μm × 200 μm width × depth, 7115cm long), via holes (300 μm diameter), cathode and anode116reservoirs were milled on the top plate, while microwells for117sample droplets (150 μm × 200 μm × 200 μm width × length118× depth) were milled on the bottom plate. The chip surface119was rendered smooth using chemical reflow.34 Briefly, a small120container was filled with chloroform and the microchip was121placed on top of the container with all the channels exposed to122chloroform vapor. The distance between the microchip and the123chloroform layer was kept at 5 mm and an exposure time of 3−1244 min was found to be suitable for reflow of the PMMA surface.125A longer exposure time of more than 4 min was found to126damage the channels and cracks appeared on the surface.127Chloroform is a hazardous material and the vapors can cause128acute toxicity, irritation, or carcinogenicity. Therefore, the129reflow process was performed in a fumehood and personal130protective equipment were used. Both of the MCE chips were131treated with Duxback (Duxback Ltd.) and heated at 65 °C for13210 min in an oven to evaporate the solvent making the PMMA133surface hydrophobic. Before use, 30−50 μL of fluorinated oil134(FC-40) was spread over the chip to wet the surface thus135preventing leakage of sample from the wells during slipping.
Figure 1. 3D Schematic showing the working principle of the device (dimensions are not drawn to scale). (a) Schematic view of droplet generation,injection, and sample separation. The arrow indicates the movement direction of the droplet plate. (b) Schematic of the separation plate and dropletplate. (c) Initial position of chips after assembly and loading samples. (d) Slipping bottom layer to generate droplets (arrows show the movementdirection of the droplet plate). (e) Injection of droplets into the separation channels.
Analytical Chemistry Article
DOI: 10.1021/ac504695wAnal. Chem. XXXX, XXX, XXX−XXX
B
136 The sample and buffer were loaded into the microchip by a137 pipet.
f1 138 Microchip Design and Operation. Figure 1a shows the139 schematic diagram of the chip design and operation. The chip140 consists of separation channels, sample loading channels, buffer141 reservoirs together with holes on the top plate and droplet wells142 on the bottom plate. Henceforth, the top plate is referred to as143 the separation plate and the bottom plate as the droplet plate.144 After fabrication with PMMA material, the plate surfaces145 were smoothed by reflowing with chloroform and coating with146 Duxback. This produced surfaces with excellent optical clarity147 and hydrophobicity (see Figure S1 in the Supporting148 Information). To facilitate “nonmicrofluidic users”, we have149 also developed protocols that precure separation gels (e.g.,150 agarose, polyacrylamide) in open channels forming a “Gelchip”151 that can be prepared in batch and used off-the-shelf. The152 separation plate was joined to the droplet plate in such a way153 that the sample loading channels were connected with droplet154 wells forming zigzag channels as shown in Figure 1a.155 To seal the microchannels and minimize sample sticking on156 the surface or any leakage, fluorinated oil (FC-40) was added at157 the interface, especially covering the areas between the droplet158 generation and the sample loading channels. The oil also159 lubricates the two plates and minimizes surface friction during160 movement of the plates. The two chip halves were clamped161 together using magnets on opposite sides to ensure a tight162 contact of the two plates.32 After assembly, the sample mixture163 was loaded into the sample loading channels via inlet holes (0.8164 mm diameter) that were fitted with the end of a pipet tip. The165 separation buffer (TBE/Tris-Ches) was then loaded to the two166 buffer reservoirs connecting to both ends of the separation167 channels. The 0.5 mm diameter platinum wire electrodes were168 placed in each reservoir to provide a uniform electric field to all169 of the parallel channels. Noted in certain separation modes170 when liquid sieving matrixes are required, such as poly(ethylene171 oxide) (PEO) solution for capillary gel electrophoresis (CGE)172 or other capillary zone electrophoresis (CZE) buffers, the173 separation channels were left empty during chip assembly.174 Separation matrixes were then added to the channels before
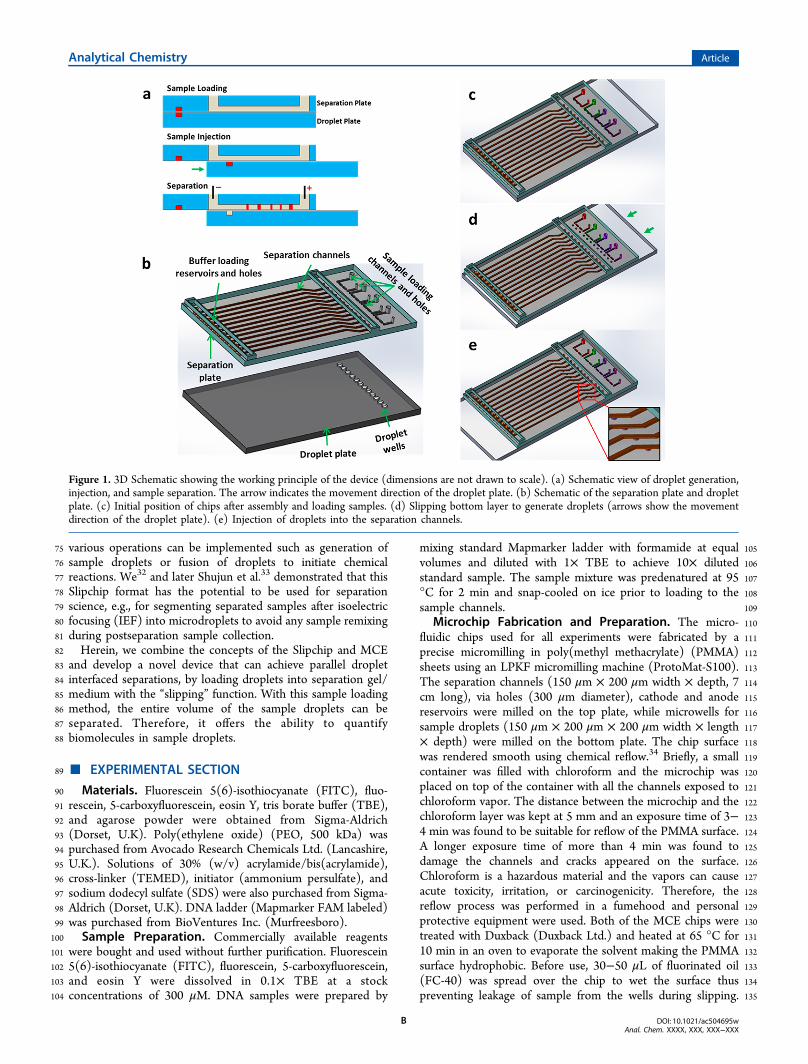
175sample loading, by gentle liquid pumping to the inlet holes with176a peristaltic pump at a flow rate of 3 μL/min. The droplet plate177was then moved by a micrometer connected to the droplet178plate from its initial position; thereby generating droplets in179each of the wells (Figure 1d,e). During this process, sample180droplets were first generated from the sample channels and181further moved to overlap with the separation channels. Finally a182dc electric field was applied across the reservoirs and migrating183the sample molecule toward the opposite charge end184performing electrophoresis separations.185Droplet Generation and Injection. Droplet generation186and injection were initially calibrated by loading fluorescein dye187solution into the sample loading (zigzag) channels connected188 f2to the droplet wells (Figure 2a). After slipping the chip, each189sample produced 3 repeat droplets, as shown in Figure 2b.190Fluorescence intensity profiles of the generated droplets gives191information on the reproducibility of the droplet area (Figure1922c). The percent relative standard deviation (% RSD) for all of193the 30 droplets in more than 3 runs was <3%. In Figure 2d,194droplets were moved to be in contact with the separation195channels. There was no surfactant added into the oil; therefore,196the aqueous droplet immediately merged with the gel and197sample molecule started to diffuse into the separation channels.198Confocal imaging taken 30 s after droplet merging showed that199the fluorescent molecules had already diffused into the200separation gel (Figure S6 in the Supporting Information).201Droplet interfacing is a new approach to sample loading, relying202on segmentation, and loading of sample droplets; therefore,203appropriate oil is needed to prevent unwanted droplet breakup,204sample leakage, or surface contamination. The FC-40 oil205membrane trapped in between the two plates kept the aqueous206sample droplets inside the droplet wells while it was moved207toward the separation channels. However, the detergent SDS208was found to destabilize the oil−water interface (FC-40 oil and209TBE buffer combination) causing severe sample loss into the210interface of the two plates; therefore, we do not recommend211adding SDS into the sample for this method.
Figure 2. Droplet generation and injection. (a) Fluorescein filled in the sample loading channels. (b) Droplets generated after slipping the chip. (c)Fluorescence intensity profile of the droplets. (d) Droplets injected into separation channels.
Analytical Chemistry Article
DOI: 10.1021/ac504695wAnal. Chem. XXXX, XXX, XXX−XXX
C

212 ■ RESULTS AND DISCUSSION
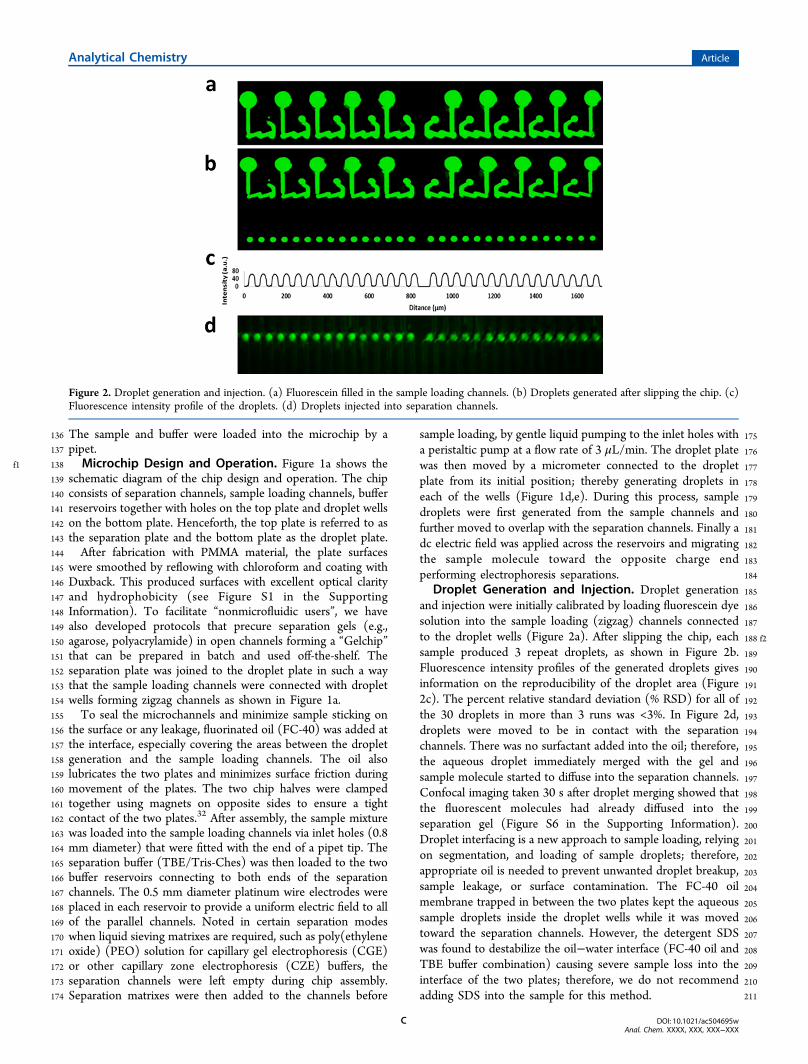
213 Separation reproducibility was determined by separating214 fluorescent dyes in the microchannels. In this experiment, all215 the sample droplets contained the same sample mixture. FITC,216 fluorescein, eosin Y, and 5-carboxyfluorescein at concentrations217 of 25, 10, 144, and 13.5 μM, respectively, were prepared in 0.1×218 TBE buffer and separated using 1.5% PEO gel (500 kDa). The219 dyes were negatively charged at pH 8.4 and migrated toward220 the anode when an electric field (90 V/cm) was applied. The221 bands of separated dyes were detected at a distance of 3.5 cm222 from the sample injection point. The pseudo gel plot and
f3 223 representative electropherograms were drawn in Figure 3a,b,224 from the fluorescent intensity data collected from recorded225 videos. The electropherogram was realigned according to the226 peaks from 5-carboxyfluorescein as an internal standard. It is227 clearly seen that baseline separation was achieved and the228 separation was completed in 60 s. The apparent number of229 theoretical plates, an indicator of maximum separation230 efficiency of a separation column/channel is given by N =
231 5.54[tr/Wt1/2]2, where Wt1/2 is the width of the peak at half of the
232height (expressed in terms of time) and tr is the retention time233of the separated molecule, both were measured from recorded234videos using a homemade Matlab (Mathworks) program.235Theoretical plates were calculated to be 7560 at a distance of2363.5 cm. This value is 1 order of magnitude less than for glass237chip-based separations.35 This lower number of theoretical238plates can be attributed to three main factors. First, there was239molecular diffusion at the injection point and in the separation240channels. The diffusion was more obvious for small fluorescent241molecules than larger biomolecules (as shown in the later DNA242separation with higher plate numbers); second, separation243conditions such as buffer/gel concentrations, surface coating,244and electric field strength have not been optimized in this245study; and third, the droplet volume (800 pL) used here was246larger compared to the 10 ms injection time in a cross-piece247injections.35 The separation reproducibility was also calibrated248in the precasted agarose gel (2% agarose), as shown in Figure2493c,d. The theoretical plates were calculated to be 1890 at a250distance of 6 mm. Supplementary Movie 3 in the Supporting
Figure 3. Separation of fluorescent dyes in PEO gel (a, b) and agarose gel (c, d, e). (a) Pseudo gel plot from a PEO gel separation for sample mixture(Eosin Y, FITC 1, FITC 2, fluorescein, and 5-carboxyFL). (b) Corresponding electropherograms. Field strength, 90 V/cm; detection point, 3.5 cm;separation medium, 1.5% PEO gel. (c) Pseudo gel plot from an agarose gel separation for sample mixture (FITC, fluorescein, and 5-carboxyFL). (d)Corresponding electropherograms. (e) Microscope snapshot of the separated bands. Field strength, 80 V/cm; detection point, 6 mm; separationmedium, 2% agarose gel.
Analytical Chemistry Article
DOI: 10.1021/ac504695wAnal. Chem. XXXX, XXX, XXX−XXX
D

251 Information provides a short recording for the separation of252 these dyes in 15 channels filled with agarose gel.253 We further determined the effect of droplet sizes on the254 separation efficiency. Four different droplet wells were255 fabricated with different well depths to generate droplets with256 volumes of 320, 800, 1280, and 1750 pL as shown in Figure257 S4a,b in the Supporting Information. FITC and fluorescein258 were separated within these four different droplet sizes (Figure259 S4c,d in the Supporting Information) and separation resolution260 (SR) was determined. It was found that the SR decreases with261 the increasing droplet volume. The bands were highly resolved262 for the smallest droplet volume (Figure S5e in the Supporting263 Information). However, there are slight deviations from a linear264 fit which could be due to the differences in droplet size,265 variations in electric field strength in different channels, and266 wettability of the channels which affects aqueous droplet267 merging. The theoretical plates achieved by this separation are268 2220 (corresponding to the smallest droplet) to 1480 (the269 largest droplet) at a distance of 8 mm.270 This method of droplet-interfaced separation allows for271 whole sample injection from the droplets to the separation272 channels without any sample waste. Therefore, quantitative273 analysis of analytes within the sample mixture can be achieved.274 For each sample mixture, the chip produces multiple sample275 droplets (three in this setup). The separation results can be276 compared to provide a standard derivation, as is generally277 required in a biochemical analysis. Since these sample repeats278 are analyzed in parallel, no extra separation time is required in279 our system. To validate this method, mixtures of samples were280 prepared with fixed concentrations of 5-carboxyluorescein (9281 μM) and fluorescein (50 μM) and varying the FITC282 concentration from 0 to 50, 100, 150, 200, and 250 μM.283 Each sample was injected into one sample channel to produce284 three droplet copies, which were then separated in correspond-
f4 285 ing channels and the results are shown in Figure 4. A program286 written in Matlab was used to extract the peak areas, which287 were further normalized using the peak area of 5-carboxy-288 fluorescein as an internal standard. The change in peak areas289 has a linear correspondence (3.6% RSD) to the original sample290 concentrations as illustrated in Figure 4c.291 DNA sizing and protein separation are important applica-292 tions of gel electrophoresis in biochemistry, forensics, and293 immunoassays. Here DNA ladders from 50, 100, 150, 200, 300,294 400, 500, and 600 bp were separated to assess the performance295 of the device with PEO gel, which is a well-studied sieving296 matrix for separating DNA fragments ranging from 25bp to297 over 2000bp.3,36 With the gel loading methods described in the298 Experimental Section, different PEO (500 kDa) concentrations299 ranging from 0.5 to 3% were successfully loaded to separation300 channels and the DNA ladder was best separated in 2.5% PEO
f5 301 gel in the device. Figure 5 shows the detection at a distance of302 13 mm from the point of injection, and the separation was303 completed within 120 s. The number of theoretical plates were304 calculated to be 79 800, comparable with the other microchip305 based DNA separations using microchips,37 which is 1 order of306 magnitude higher than previously achieved theoretical plates307 using our droplet interfaced microfluidic chips.29
308 ■ CONCLUSION AND DISCUSSION309 In this paper, we have developed a novel droplet-interfaced310 microchip electrophoresis device that provides parallel and311 quantitative separations of analytes from subnano liter droplets.312 The chip contains precured agarose or polyacrylamide gel,
313hence the name “Gelchip”, and can be used off-the-shelf. A314liquid separation medium (e.g., PEO) can also be loaded into315the channels in situ; therefore, the device supports a wide range316of separation methods. Although in our initial study, each317channel was loaded with a homogeneous gel, advanced318separation abilities could be added using gels with gradients38
319or forming preconcentration zones within the channels39 or320online labeling by curing derivatization dyes into the gel.40
321In the prototype, sample droplets were generated by one slip322of the chip and the sample breaks up in the zigzag channels to323form droplets. Droplets could also be pregenerated by the other324droplet generation or collection methods or devices and325trapped in these zigzag channels/wells for CE analysis. While326on-chip PCR and immunoassay functions have been demon-327strated for Slipchips, multiple step assays could be integrated328leading to a self-contained complex diagnostic device. After329separation, the Slipchip plates can be detached and the gel can330be used for other analytical methods or exposed to other331chemicals. This could facilitate postseparation staining and332destaining or MALDI MS that are under study. The device is333user-friendly and has the potential to be applied for DNA334sizing, peptide and protein separation, or immunoassays in a335high-throughput format using minute amounts of sample. With336future improvement in the detection capacity and sensitivity of337the system, the device has the potential to be applied for high-338resolution analysis of complex mixtures with hundreds of339droplets or for 2D separations of serum proteins, quantitative340immunoassays, or Western blot analyses.
Figure 4. Quantitative analysis of sample droplets. (a) Pseudo gel plot.(b) Electropherograms. (c) Standard curve for peak area vsconcentrations of FITC. FITC concentrations from left to right are0, 50, 100, 150, 200, 250 μM. Field strength, 80 V/cm; detectionpoint, 8 mm; separation medium, 2% agarose gel.
Analytical Chemistry Article
DOI: 10.1021/ac504695wAnal. Chem. XXXX, XXX, XXX−XXX
E

341 ■ ASSOCIATED CONTENT342 *S Supporting Information343 Fabricated chip plates, gel curing protocol, microchip344 separation and data analysis, calibration of the relationship345 between droplet volume and separation resolution, and346 supplementary movies (3D movie of droplet injection,347 fluorescein movie of droplet injection, and separation video).348 This material is available free of charge via the Internet at349 http://pubs.acs.org.
350 ■ AUTHOR INFORMATION351 Corresponding Author352 *E-mail: [email protected].
353 Notes354 The authors declare no competing financial interest.
355 ■ ACKNOWLEDGMENTS356 This work was partially supported by the Engineering and357 Physical Sciences Research Council UK (Grant EP/M012425/358 1), and we thank Mr. Junjun Lei for help on COMSOL359 Simulation. H.M. would like to acknowledge the Royal Society360 for funding.
361 ■ REFERENCES(1)362 Ostergaard, J.; Jensen, H. Anal. Chem. 2009, 81, 8644−8648.(2)363 Mosca, A.; Paleari, R.; Mosca, L.; Marcello, A.; Vercellati, C.;
364 Zanella, A. Clin. Biochem. 2009, 42, 1859.(3)365 Pereira, F.; Hassard, S.; Hassard, J.; deMello, A. Electrophoresis
366 2009, 30, 2100−2109.(4)367 Huang, X. H. C.; Quesada, M. A.; Mathies, R. A. Anal. Chem.
368 1992, 64, 2149−2154.(5)369 Haeberle, S.; Zengerleab, R. Lab Chip 2007, 7, 1094−1110.(6)370 Roddy, E. S.; Xu, H.; Ewing, A. G. Electrophoresis 2004, 229−42,
371 229.(7)372 Koutny, L. B.; Schmalzing, D.; Taylor, T. A.; Fuchs, M. Anal.
373 Chem. 1996, 68, 18−22.(8)374 Herr, A. E.; Hatch, A. V.; Throckmorton, D. J.; Tran, H. M.;
375 Brennan, J. S.; Giannobile, W. V.; Singh, A. K. Proc. Natl. Acad. Sci.376 U.S.A. 2007, 104, 5268−5273.
(9)377 Karns, K.; Herr, A. E. Anal. Chem. 2011, 83, 8115−8122.(10)378 Wang, M.; Roman, G. T.; Perry, M. L.; Kennedy, R. T. Anal.
379 Chem. 2009, 81, 9072−9078.
(11) 380Dishinger, J. F.; Reid, K. R.; Kennedy, R. T. Anal. Chem. 2009,38181, 3119−3127.
(12) 382Harrison, D. J.; Manz, A.; Fan, Z. H.; Ludi, H.; Widmer, H. M.383Anal. Chem. 1992, 64, 1926−1932.
(13) 384Ermakov, S. V.; Jacobson, S. C.; Ramsey, J. M. Anal. Chem.3852000, 72, 3512−3517.
(14) 386Tabuchi, M.; Kuramitsu, Y.; Nakamura, K.; Baba, Y. Anal. Chem.3872003, 75, 3799−3805.
(15) 388Yang, S.; Liu, J.; Lee, C. S.; DeVoe, D. L. Lab Chip 2009, 9,389592−599.
(16) 390Emrich, C. A.; Medintz, I. L.; Chu, W. K.; Mathies, R. A. Anal.391Chem. 2007, 79, 7360−7366.
(17) 392Gaunt, T. R.; Hinks, L. J.; Rassoulian, H.; Day, I. N. M. Nucleic393Acids Res. 2003, 31 (9), e48−e48.
(18) 394Paegel, B. M.; Emrich, C. A.; Wedemayer, G. J.; Scherer, J. R.;395Mathies, R. A. Proc. Natl. Acad. Sci. U.S.A. 2002, 99, 574−579.
(19) 396Bousse, L.; Mouradian, S.; Minalla, A.; Yee, H.; Williams, K.;397Dubrow, R. Anal. Chem. 2001, 73, 1207−1212.
(20) 398Pan, Y.; Duncombe, T. A.; Kellenberger, C. A.; Hammond, M.399C.; Herr, A. E. Anal. Chem. 2014, 86, 10357−10364.
(21) 400Chiu, D. T. TrAC, Trends Anal. Chem. 2003, 22, 528−536.(22) 401Niu, X.; de Mello, A. J. Biochem. Soc. Trans. 2012, 40, 615−623.(23) 402Utada, A. S.; Lorenceau, E.; Link, D. R.; Kaplan, P. D.; Stone, H.
403A.; Weitz, D. A. Science 2005, 308, 537−541.(24) 404Song, H.; Chen, D. L.; Ismagilov, R. F. Angew. Chem., Int. Ed
4052006, 45, 7336−7356.(25) 406Niu, X. Z.; Zhang, B.; Marszalek, R. T.; Ces, O.; Edel, J. B.;
407Kluga, D. R.; deMello, A. J. Chem. Commun. 2009, 41, 6159−6161.(26) 408Draper, M. C.; Niu, X. Z.; Cho, S.; Jarnes, D. I.; Edel, J. B. Anal.
409Chem. 2012, 84, 5801−5808.(27) 410Edgar, J. S.; Milne, G.; Zhao, Y. Q.; Pabbati, C. P.; Lim, D. S.
411W.; Chiu, D. T. Angew. Chem., Int. Ed 2009, 48, 2719−2722.(28) 412Edgar, J. S.; Pabbati, C. P.; Lorenz, R. M.; He, M. Y.; Fiorini, G.
413S.; Chiu, D. T. Anal. Chem. 2006, 78, 6948−6954.(29) 414Niu, X.; Pereira, F.; Edel, J. B.; de Mello, A. J. Anal. Chem. 2013,
41585, 8654−8660.(30) 416Pei, J.; Nie, J.; Kennedy, R. T. Anal. Chem. 2010, 82, 9261−
4179267.(31) 418Du, W.; Li, L.; Nichols, K. P.; Ismagilov, R. F. Lab Chip 2009, 9,
4192286−2292.(32) 420Zhao, Y.; Pereira, F.; de Mello, A. J.; Morgan, H.; Niu, X. Lab
421Chip 2014, 14, 555−561.(33) 422Wang, S.; Chen, S.; Wang, J.; Xu, P.; Luo, Y.; Nie, Z.; Du, W.
423Electrophoresis 2014, 35, 2528−2533.(34) 424Ogilvie, I. R. G.; Sieben, V. J.; Floquet, C. F. A.; Zmijan, R.;
425Mowlem, M. C.; Morgan, H. J. Micromech. Microeng. 2010, 20, 065016.
Figure 5. Separation of 50, 100, 150, 200, 300, 400, 500, and 600 bp DNA ladder (BioVentures Mapmarker FAM labeled), (a) pseudo gel plot ofDNA fragments. (b) Electropherograms. Field strength, 100 V/cm; detection point, 1.3 cm; separation medium, 2.5% PEO.
Analytical Chemistry Article
DOI: 10.1021/ac504695wAnal. Chem. XXXX, XXX, XXX−XXX
F

(35)426 Roman, G. T.; Wang, M.; Shultz, K. N.; Jennings, C.; Kennedy,427 R. T. Anal. Chem. 2008, 80, 8231−8238.
(36)428 Tseng, W. L.; Chang, H. T. Electrophoresis 2001, 22, 763.(37)429 Kang, C.; Back, S. K.; Song, I.; Choi, B.; Chang, J.; Cho, K.;
430 Kim, Y. Bull. Korean Chem. Soc. 2006, 27, 519−523.(38)431 Hou, C.; Herr, A. E. Anal. Chem. 2010, 82, 3343−3351.(39)432 Huang, H.; Xu, F.; Dai, Z. Electrophoresis 2005, 26, 2254−2260.(40)433 Jin, L. J.; Giordano, B. C.; Landers, J. P. Anal. Chem. 2001, 73,
434 4994−4999.
Analytical Chemistry Article
DOI: 10.1021/ac504695wAnal. Chem. XXXX, XXX, XXX−XXX
G