Embed Size (px)
Citation preview
DRIVING STRESSES IN PRESTRESSED CONCRETE PILES
By Teddy J. Hirsch/ M. ASCE, Charles H. Samson, Jr. ,2
M. ASCE,
3 and Lee L. Lowery, Jr., A.M. ASCE
ABSTRACT
Field tests were conducted to measure the dynamic stresses produced in prestressed concrete piles during driving. Strain gages were embedded in five 18-in. square piles 92 ft and 95ft long, and two 15-in. square piles 26 ft long. The piles were tested at two sites on the Texas Gulf Coast, one near Corpus Christi and one near Houston, Texas. The field measurements are compared with the theoretical results obtained from a digital-computer solution of the wave equation. General conclusions as to the nature and magnitude of these stresses are drawn.
1 Assoc. Professor of Structural Engineering and Structural Mechanics,
Dept. of Civil Engineering, and Assoc. Research Engineer, Texas Transportation Institute, Texas A&M University, College Station, Texas.
2Professor of Structural Engineering and Structural Mechanics, Depts.
of Civil and Aerospace Engineering, and Head of Structural Research Dept., Texas Transportation Institute, Texas A&M University, College Station, Texas.
3 Asst. Research Engineer, Structural Research Dept., Texas Trans-
portation Institute, Texas A&M University, College Station, Texas.
i
ABSTRACT
SYNOPSIS
INTRODUCTION
FIELD TESTS
Test Piles Instrumentation Soil Properties
TABLE OF CONTENTS
Pile Driver Cushioning Material Pile Driving and Test Procedures Test Data and Discussion
COMPUTER CORRELATION
General Computer Results Compared with Field Data
PARAMETER STUDY
CONCLUSIONS
ACKNOWLEDGMENTS
REFERENCES
i
1
2
4
4 5 6 7 8 9
10
15
15 15
16
19
21
21
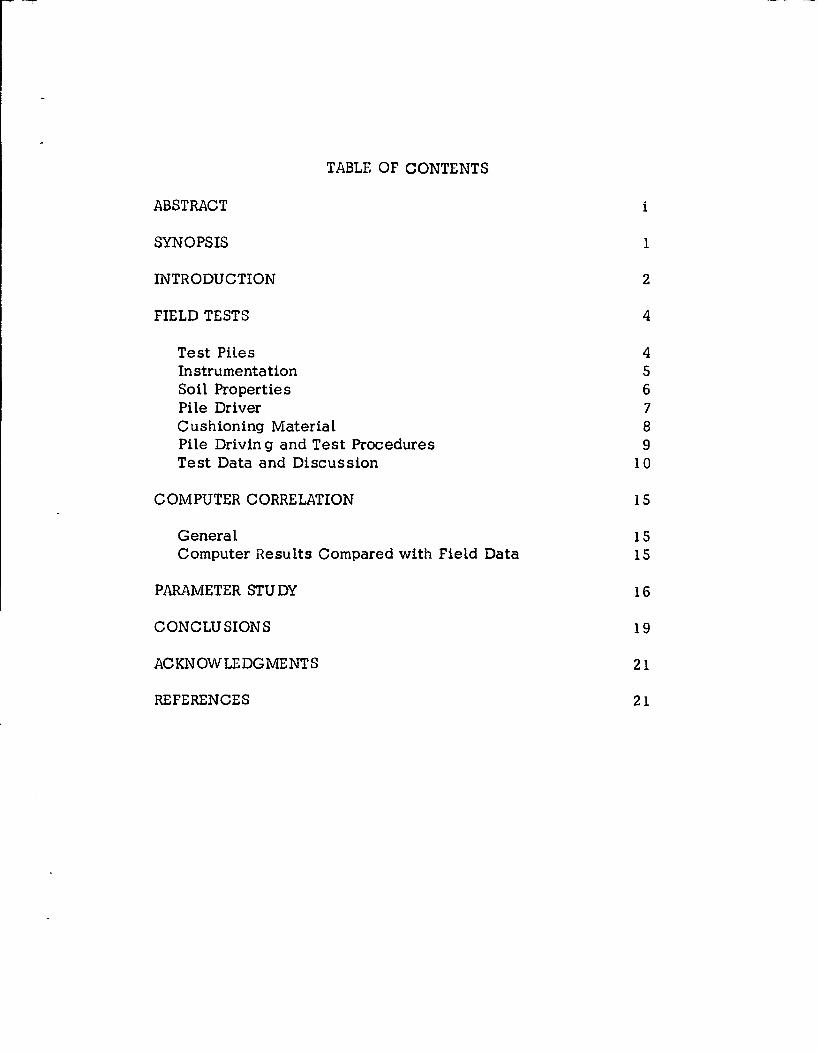
Specimens of concrete from the test piles were tested in order to determine their static and dynamic moduli of elasticity, compressive and tensile strengths, and unit weights. Specimens of the wood cushioning materials were also tested in order to determine their moduli of elasticity. Soil borings were made at the pile test sites in order to identify and determine the shear strength of the various soil strata. These materi-al properties were used in setting up the pile problems for digital computer solution and in interpreting the significance of the measured dynamic stresses.
The effects of the soil conditions, pile properties, cushion material, and pile driving equipment on the driving stresses are discussed. Conclusions are drawn concerning driving conditions which are likely to produce large tensile and compressive stresses in prestressed concrete piles.
INTRODUCTION
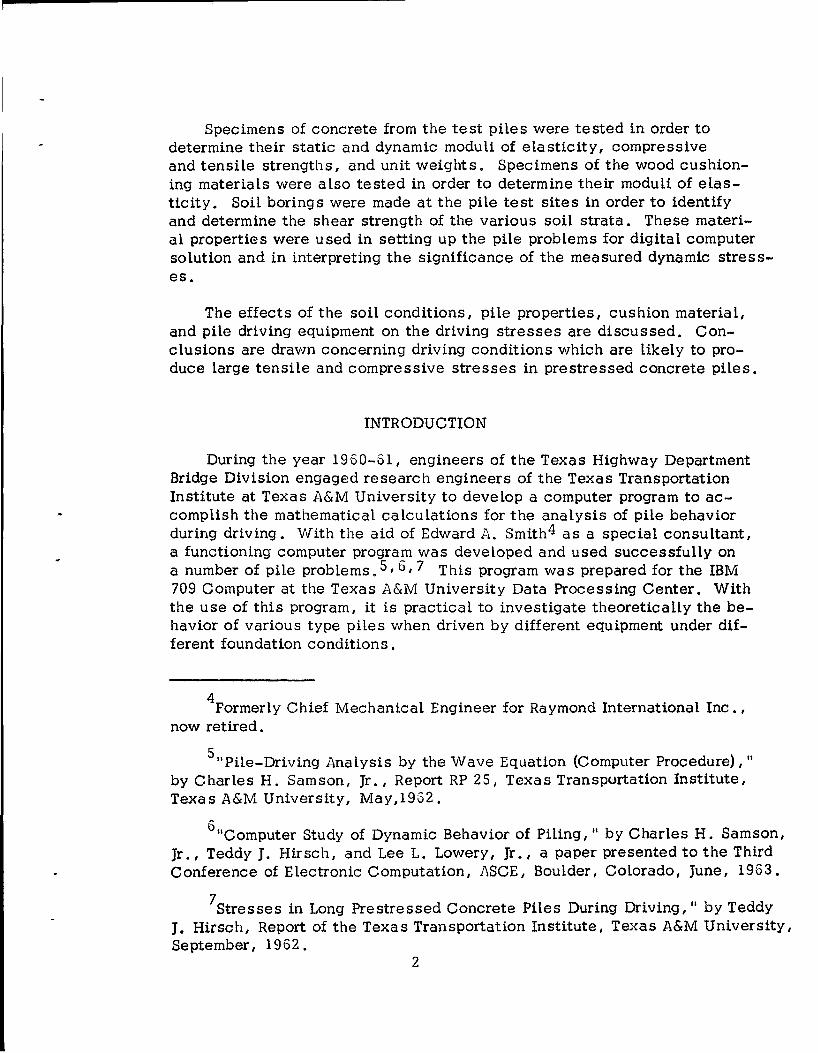
During the year 1960-61, engineers of the Texas Highway Department Bridge Division engaged research engineers of the Texas Transportation Institute at Texas A&M University to develop a computer program to accomplish the mathematical calculations for the analysis of pile behavior during driving. Vfith the aid of Edward A. Smith4 as a special consultant, a functioning computer program was developed and used successfully on a number of pile problems. 5, 6, 7 This program was prepared for the IBM 709 Computer at the Texas A&M University Data Processing Center. With the use of this program, it is practical to investigate theoretically the behavior of various type piles when driven by different equipment under different foundation conditions.
4Formerly Chief Mechanical Engineer for Raymond International Inc.,
now retired .
511 Pile-Driving Analysis by the Wave Equation (Computer Procedure) I II
by Charles H. Samson, Jr., Report RP 25, Texas Transportation Institute, Texas A&M University, May,19G2.
6 ~~computer Study of Dynamic Behavior of Piling, 11 by Charles H. Samson, Jr., Teddy J. Hirsch, and Lee L. Lowery, Jr., a paper presented to the Third Conference of Electronic Computation, ASCE, Boulder, Colorado, June, 1963.
7 Stresses in Long Prestressed Concrete Piles During Driving, 11 by Teddy J. Hirsch, Report of the Texas Transportation Institute, Texas A&M University, September, 1962.
2
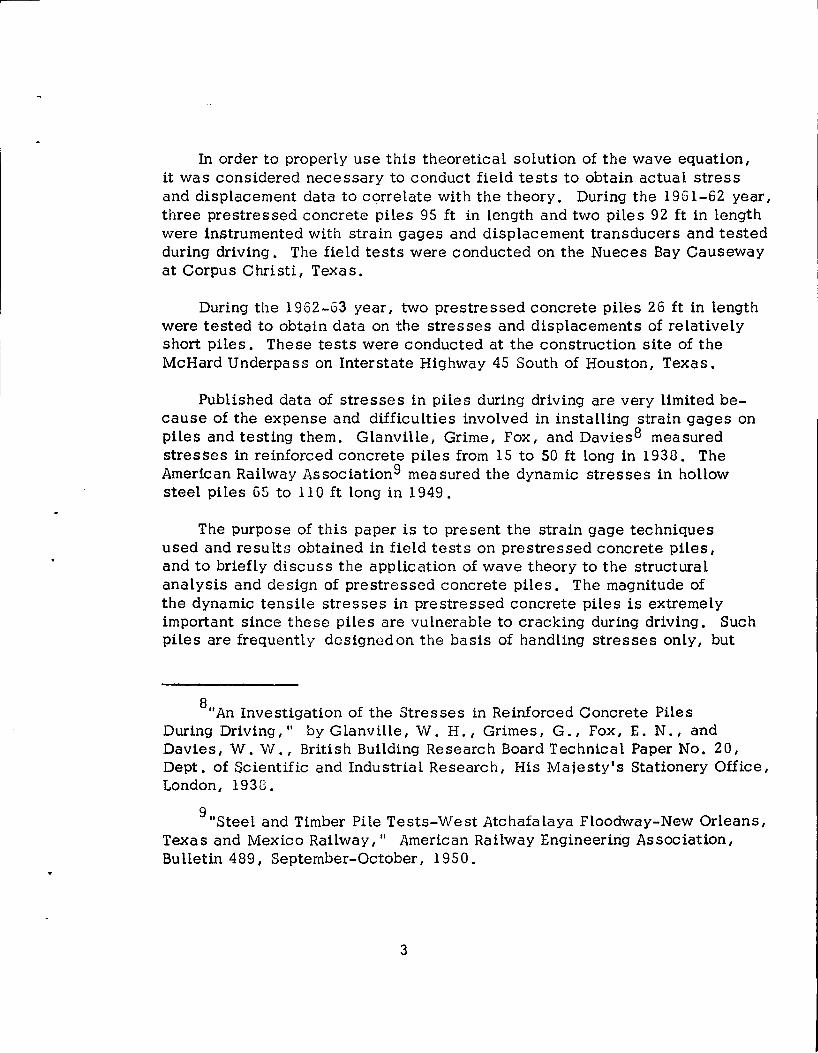
In order to properly use this theoretical solution of the wave equation, it was considered necessary to conduct field tests to obtain actual stress and displacement data to correlate with the theory. During the 1961-62 year, three prestressed concrete piles 95 ft in length and two piles 92 ft in length were instrumented with strain gages and displacement transducers and tested during driving. The field tests were conducted on the Nueces Bay Causeway at Corpus Christi, Texas.
During the 1962-63 year, two prestressed concrete piles 26 ft in length were tested to obtain data on the stresses and displacements of relatively short piles. These tests were conducted at the construction site of the McHard Underpass on Interstate Highway 45 South of Houston, Texas.
Published data of stresses in piles during driving are very limited because of the expense and difficulties involved in installing strain gages on piles and testing them. Glanville, Grime, Fox, and Davies8 measured stresses in reinforced concrete piles from 15 to 50 ft long in 1938. The American Railway Association9 measured the dynamic stresses in hollow steel piles 65 to 110 ft long in 1949.
The purpose of this paper is to present the strain gage techniques used and results obtained in field tests on prestressed concrete piles, and to briefly discuss the application of wave theory to the structural analysis and design of prestressed concrete piles. The magnitude of the dynamic tensile stresses in prestressed concrete piles is extremely important since these piles are vulnerable to cracking during driving. Such piles are frequently dosignodon the basis of handling stresses only, but
8"An Investigation of the Stresses in Reinforced Concrete Piles
During Driving, 11 by Glanville, W. H. , Grimes, G., Fox, E. N., and Davies, W. V.f., British Building Research Board Technical Paper No. 20, Dept. of Scientific and Industrial Research, His Majesty's Stationery Office, London, 1933.
911 Steel and Timber Pile Tests-West Atchafalaya Floodway-New Orleans, Texas and Mexico Railway, 11 American Railway Engineering Association, Bulletin 489, September-October, 1950.
3
t
the occurrence of breakage during driving has caused designers to increase the amount of prestress. The magnitude of the prestress force that should be used under various driving conditions is very controversial.
FIELD TESTS
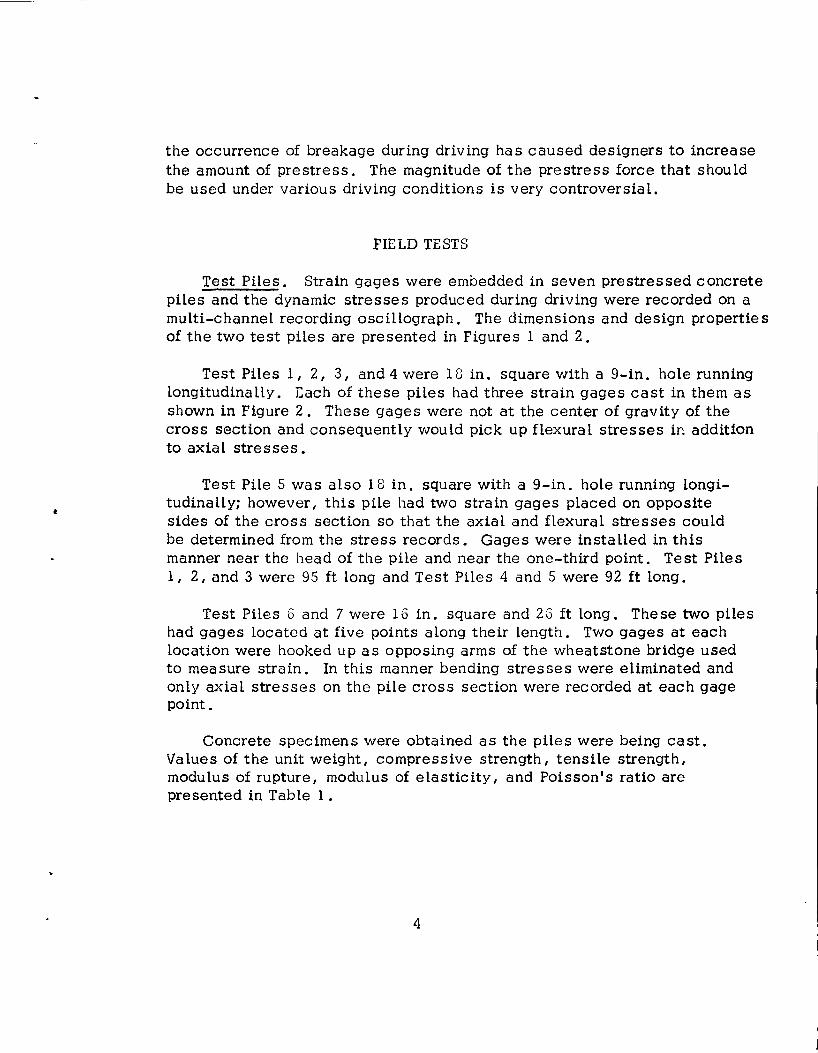
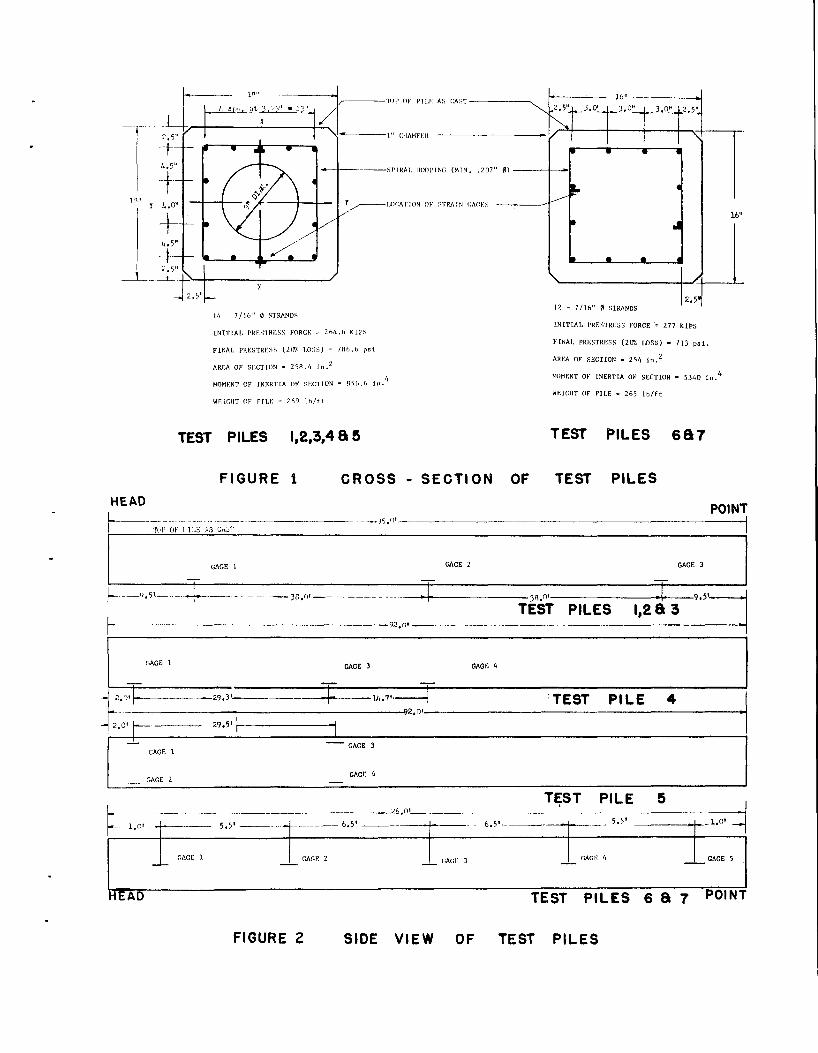
Test Piles. Strain gages were embedded in seven prestressed concrete piles and the dynamic stresses produced during driving were recorded on a multi-channel recording oscillograph. The dimensions and design properties of the two test piles are presented in Figures 1 and 2.
Test Piles 1, 2, 3, and 4 were U3 in. square with a 9-in. hole running longitudinally. Each of these piles had three strain gages cast in them as shown in Figure 2. These gages were not at the center of gravity of the cross section and consequently would pick up flexural stresses in addition to axial stresses.
Test Pile 5 was also 18 in. square with a 9-in. hole running longitudinally; however, this pile had two strain gages placed on opposite sides of the cross section so that the axial and flexural stresses could be determined from the stress records. Gages were installed in this manner near the head of the pile and near the one-third point. Test Piles 1, 2, and 3 were 95 ft long and Test Piles 4 and 5 were 92 ft long.
Test Piles 6 and 7 were 16 in. square and 2G ft long. These two piles had gages located at five points along their length. Two gages at each location were hooked up as opposing arms of the wheatstone bridge used to measure strain. In this manner bending stresses were eliminated and only axial stresses on the pile cross section were recorded at each gage point.
Concrete specimens were obtained as the piles were being cast. Values of the unit weight, compressive strength, tensile strength, modulus of rupture, modulus of elasticity, and Poisson's ratio are presented in Table 1.
4

TABLE 1. Properties of Concrete in Test Piles
Test Pile
Property 1,2 & 3 4 & 5 6 & 7
Unit Vifeight, pcf 158 154 154
Compressive Strength, psi 8490 8060 6570
Tensile Strength, psi (Direct Tension Test) 455 465 520
Modulus of Rupture, psi (Center-point Test) 925 790 1120
Modulus of Elasticity, psi 10~ 6,95 X 10~ 7.67x10~ Static Test 8,13 X
\) Dynamic Test 8.32 X 10° 7.71x10 7.84x10
u
Poisson • s Ratio (Dynamic) .15 .16 .21
Note: Values for Test Piles 1, 2, 3, 4, and 5 were 42-day tests. Values for Test Piles 6 and 7 were 28-day tests.
The modulus of elasticity of the concrete was required to transform the strain gage readings into stress. Both the modulus of elasticity and unit weight values were used in setting up these pile problems for the theoretical solutions by use of the digital computer. The strength properties are useful in interpreting the significance of the measured dynamic stresses.
Test Piles 1, 2, 3, 4, and 5 were cast by Ross Anglin and Son, General Contractors at Corpus Christi, Texas. Test Piles 0 and 7 were cast by Baass Brothers Concrete Company at Victoria, Texas
Instrumentation. Baldwin AS-9 constantan wire gird, Va lore type brass foil envelope, strain gages were embedded parallel to the longitudinal axis of the precast prestressed concrete piles during the placing of the concrete. This was done about four weeks prior to the driving of
5
the piles. Two different types of lead wire wcr e used for the tests. The one which proved most satisfactory was Belden No. 0404, AV.fG No. 20, four conductor, shielded, vinyl plastic covered cable. These lead wires were run the length of the piles embedded in the concrete and were brought out near the pile head. Since the length of the lead wires, gage locations, and manner of hookup had been determined prior to the installation of the gages, strain gage connections and connectors were prepared and waterproofed in the laboratory. The lead wire and strain gage connections were soldered and then embedded in Armstrong A-2 epoxy adhesive for insulation and waterproofing. These connections were then covered with microcrystalline wax for addit(onal moisture proofing. Connectors were soldered to the other end of tho lead wires and these were sealed in plastic bags to protect them from the weather prior to testing.
No gluing., soldering, or wuterproofing was done in the field. This was necessary since all instrumenting and testing had to be performed under field construction conditions such that the contractor would not be unduly delayed. About 15 minutes was required for two men to install the strain gage assemblies on each of the piles.
A Consolidated Electrodynamic Corporation Type 5-116 Recording Oscillograph and two CEC Type 1-118 Carrier Amplifier systems were used to record the dynamic strains in Test Piles 1. 2, 3, 4, and 5. The oscillograph was equipped with CEC Type 7-323 Galvanometers having a flat frequency response to 600 cycles per sec. A Honeywell Type 1508 Visicorder oscillograph and a Honeywell Type 119 Carrier Amplifier system were used to amplify and record the dynamic strains and displacements of Test Piles 6 and 7. This oscillograph was equipped with Honeywell Type M1650 Galvanometers having a flat frequency response to 1000 cycles per sec. The required 110 volts, 60 cycle, electrical power was supplied by a portable generator.
A Bourns Model 108 linear motion potentiometer with a 6 in. travel was used to record the dynamic displacements in Test Piles 0 und 7. These data were recorded on the oscillograph with the strain gage dutu.
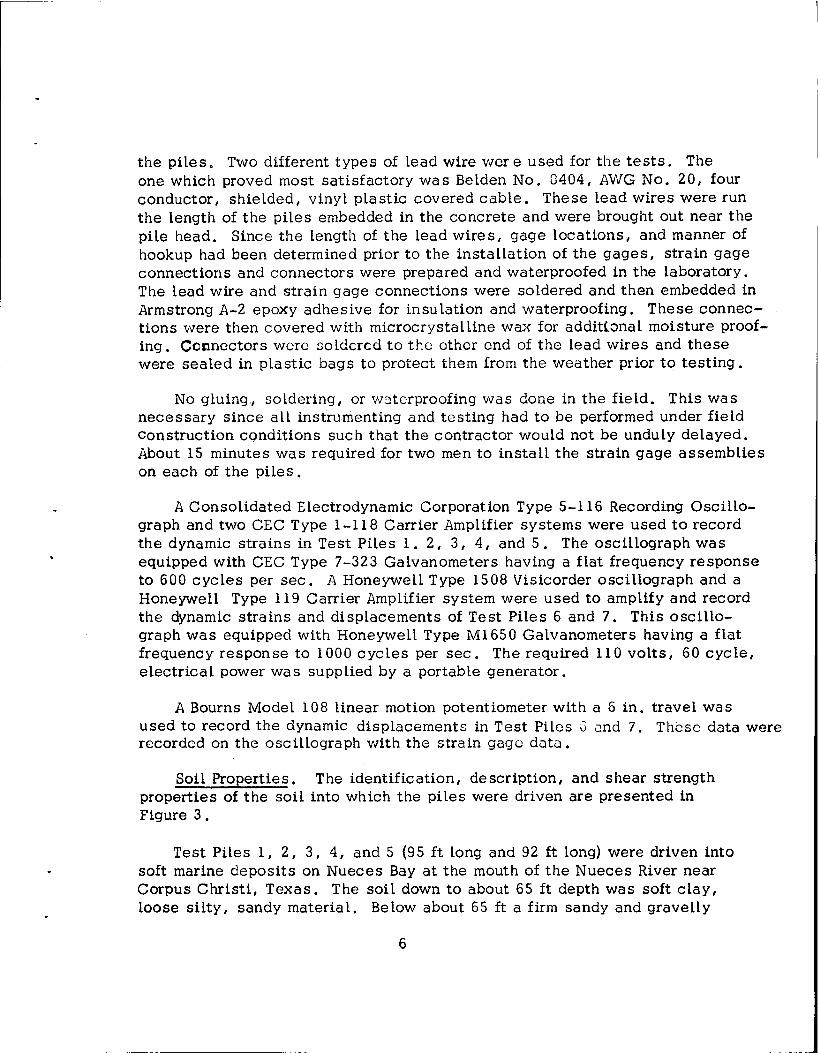
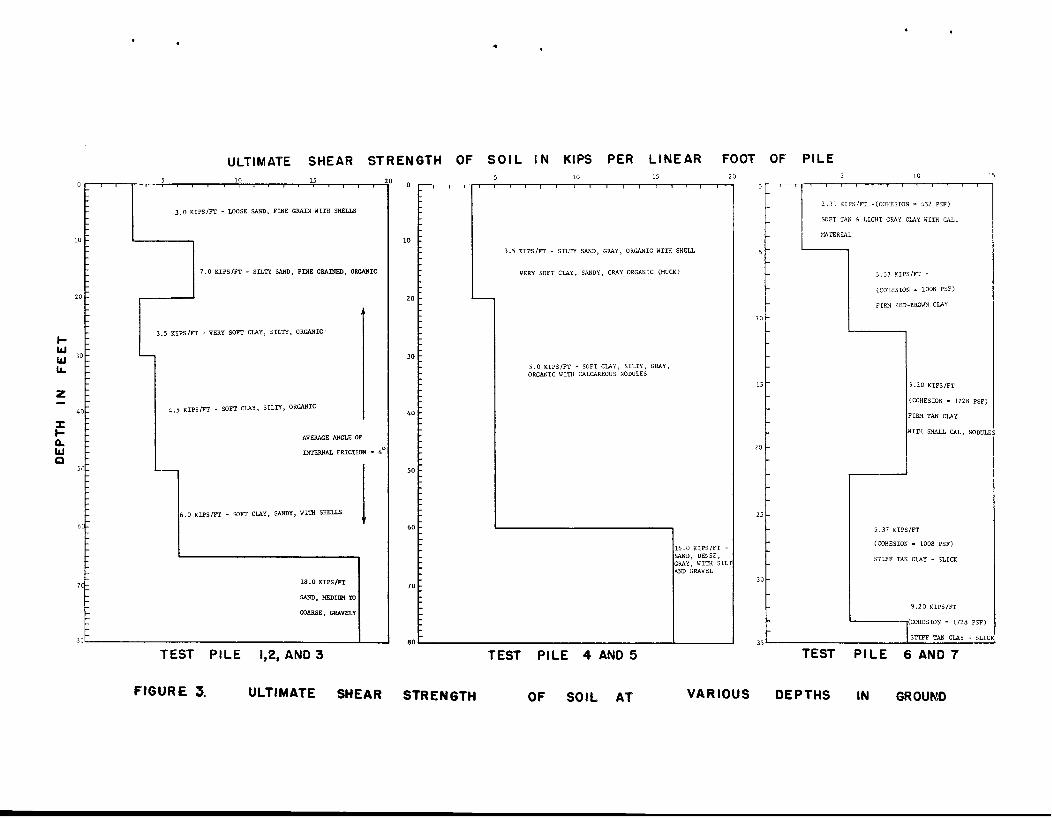
Soil Properties. The identification, description, and shear strength properties of the soil into which the piles were driven are presented in Figure 3.
Test Piles 1, 2, 3, 4, and 5 (95 ft long and 92 ft long) were driven into soft marine deposits on Nueces Bay at the mouth of the Nueces River near Corpus Christi, Texas. The soil down to about 65 ft depth was soft clay, loose silty, sandy material. Be low about 65 ft a firm sandy and gravelly
6
material was encountered. The foundation exploration crews of the Texas Highway Department drilled the soil test holes. In general, the Texas Highway Department "in place" vane shear and the THD standard penetrometer test were found to be most practical for the Nueces Bay area. Very frequently the undistrubed sample required for a triaxial or "miniature vane" test could not be recovered from the sampling tube. These various methods of tests appeared to yield values in reasonable agreement with each other. The average unit weight of this materia 1 was about 115 pcf and the submerged effective weight was about 52.6 pcf. A summary of the test results is presented in Figure 3.
Test Piles 6 and 7 (26 ft in length) were driven in a firm clay deposit,. south of Houston, Texas. The ultimate shear strength and description of the soil at various depths in the ground are also given in Figure 3.
Pile Driver. The manner in which a pile driver de Livers its driving energy to a pile has a significant effect on the stresses produced. The driving energy of simple drop hammers and single acting steam hammers results from the impact of the ram on the pile:. In the field tests, a Delmag diesel pile driver Type D-22 was used. This hammer has a manufacturer's rated energy output per blow of 39, 700 ft-lb. The technicaL data concerning this hammer are given in Table 2.
. 10 TABLE 2. Technical Data for Delmag D-22 Diesel Hammer ·
Piston weight Weight of hammer Weight of anvil Number of blows per minute Energy output per blow Maximum explosion pressure on pile
4, 850 lb 9, 768 lb l,l47lb 42-60 39, 700 ft-lb
15 8, 700 lb
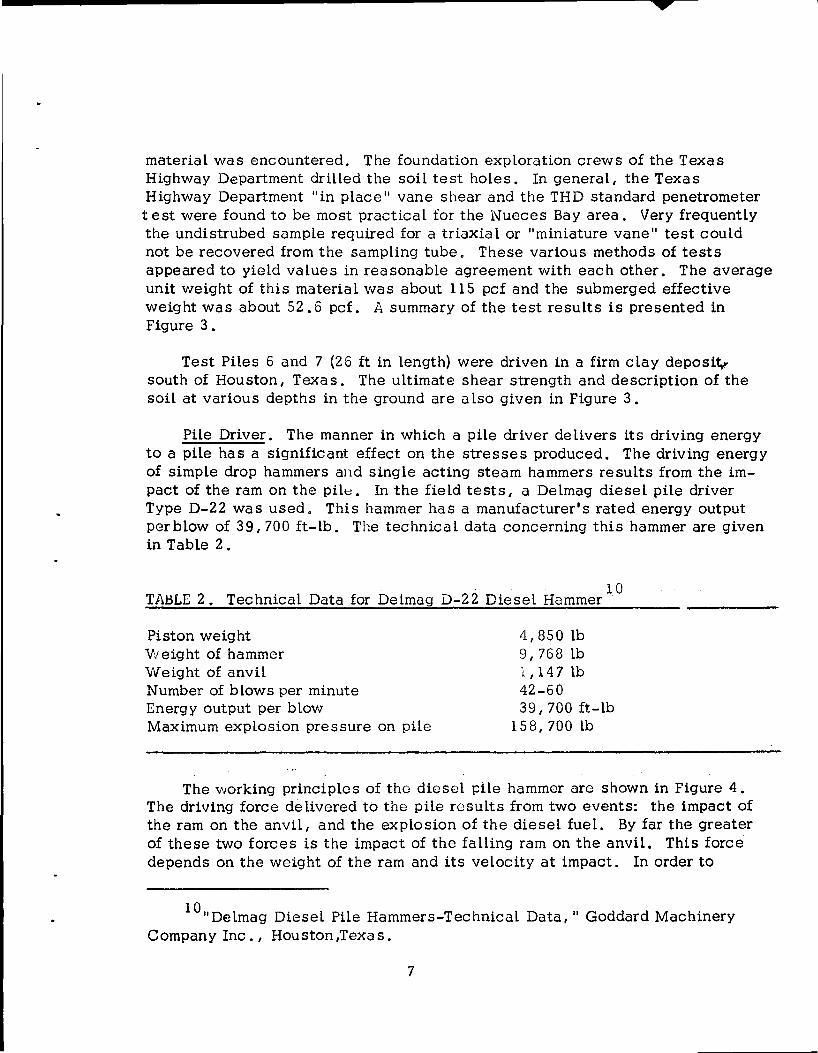
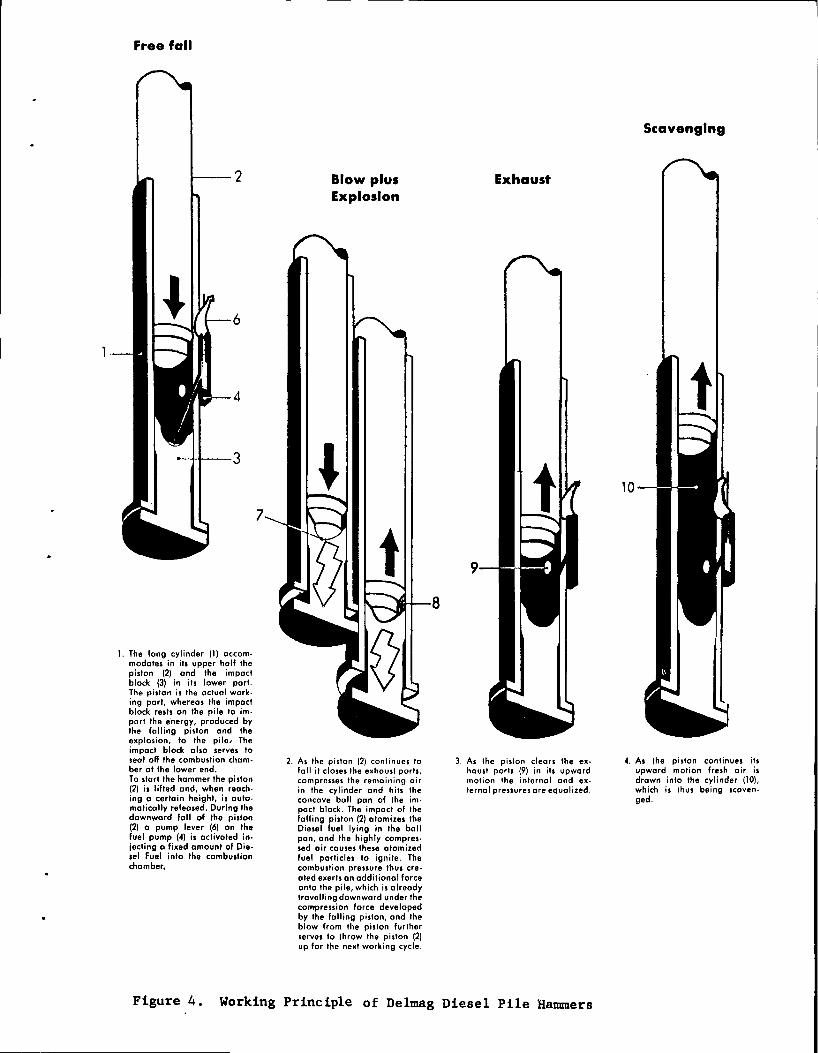
The working principles of the diesel pile hammer are shown in Figure 4. The driving force de livered to the pile results from two events: the impact of the ram on the anvil, and the explosion of the diesel fuel. By far the greater of these two forces is the impact of the falling ram on the anvil. This force depends on the weight of the ram and its velocity at impact. In order to
10 "Delmag Diesel Pile Hammers-Technical Data," Goddard Machinery Company Inc., Houston,Texas.
7
determine this velocity, it is necessary to know the height of fall of the ram. Referring to Figure 4, one sees that the ram is free falling until it passes the exhaust ports on the side of the diesel cylinder. After mathematically investigating the effect of the compressed diesel fuel on the ram velocity, the investigators cone luded that the velocity of the ram at impact is essentially the same as the free-fall velocity at the instant it passes the exhaust ports. Therefore the ram velocity at impact can be approximated by
V =I Zg (h - 1. 25)
in which
V = ram velocity in ft/ sec, 2 g = acceleration due to gravity (32. 2 ft/ sec ) , h =total fall of ram in ft, and
1.25 =distance from center of exhaust port to anvil striker face in ft.
This equation is used to determine the ram velocity for the theoretical solution of driving stresses. In addition to the energy transmitted to the pile by the falling ram, the energy created by the explosion pressure of the diesel fuel is included in the theoretical computations. This is approximated by holding the maximum explosion pressure of 158, 700 lb on top of the anvil for a period of 0. 01 sec after the initial ram impact. The duration of the explosion was investigated by M. Rands .11
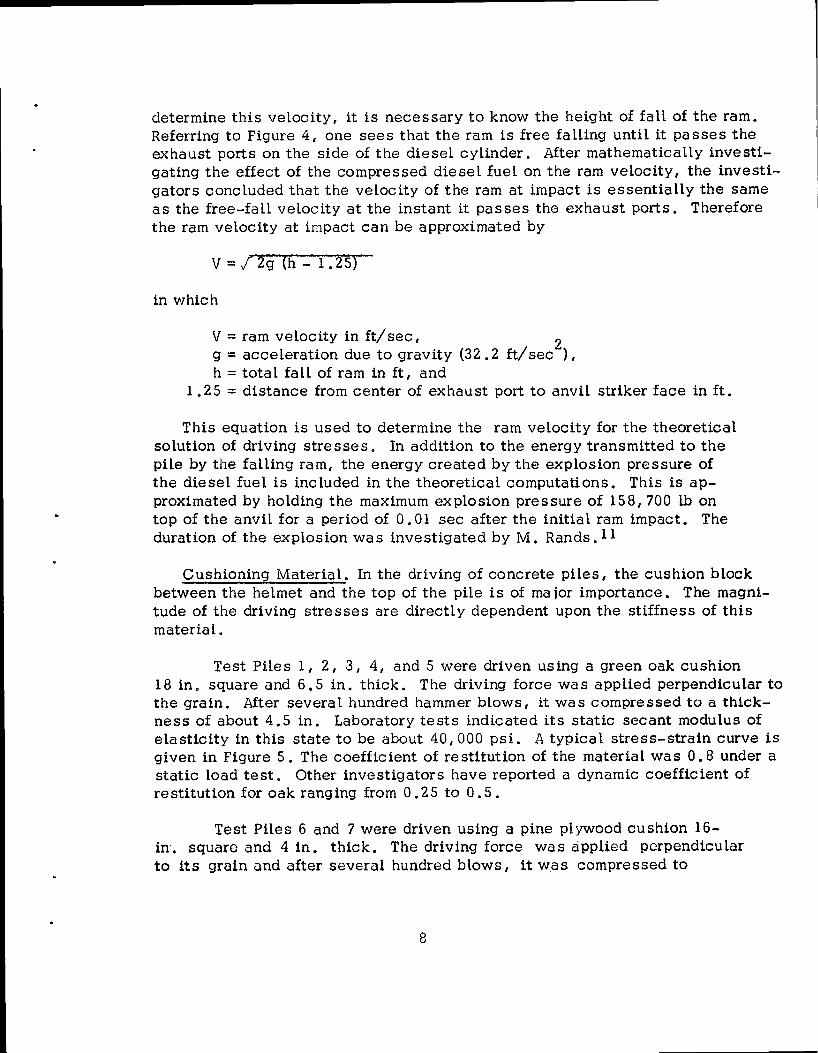
Cushioning Material. In the driving of concrete piles, the cushion block between the helmet and the top of the pile is of rna jor importance. The magnitude of the driving stresses are directly dependent upon the stiffness of this material.
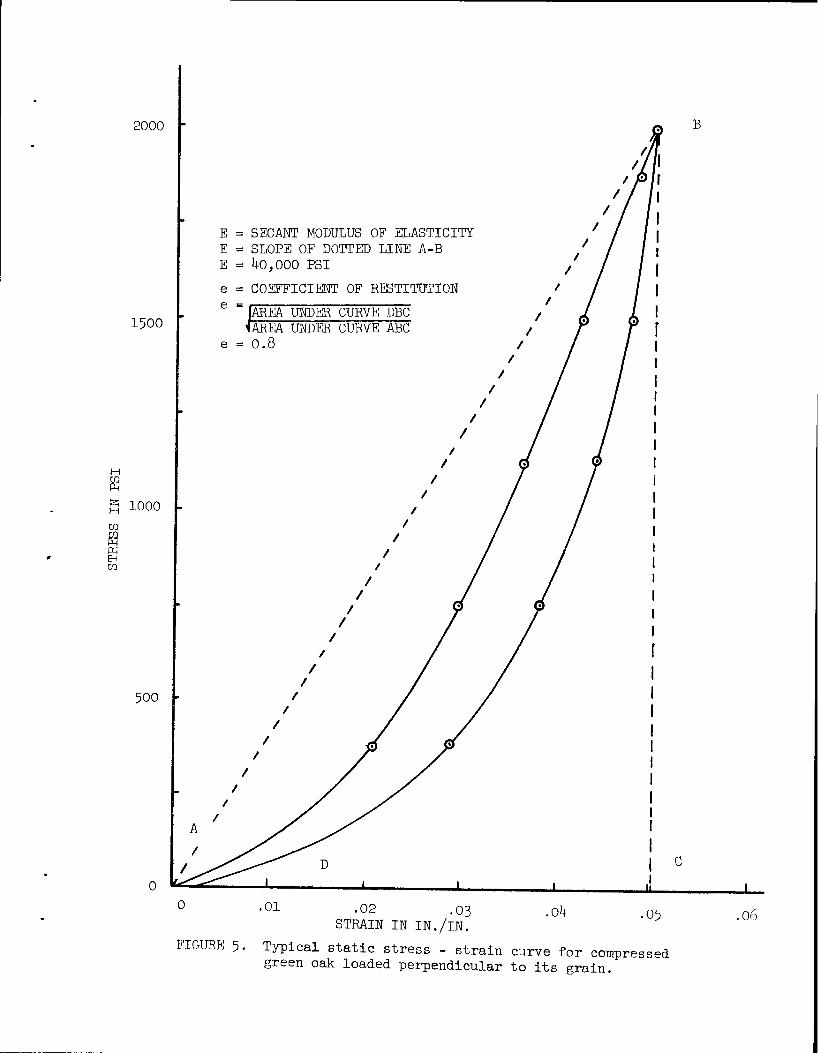
Test Piles 1, 2, 3, 4, and 5 were driven using a green oak cushion 18 in. square and 6.5 in. thick. The driving force was applied perpendicular to the grain. After several hundred hammer blows, it was compressed to a thickness of about 4. 5 in. Laboratory tests indicated its static secant modulus of elasticity in this state to be about 40, 000 psi. A typical stress-strain curve is given in Figure 5. The coefficient of restitution of the material was 0. 8 under a static load test. Other investigators have reported a dynamic coefficient of restitution for oak ranging from 0 . 2 5 to 0. 5 .
Test Piles 6 and 7 were driven using a pine plywood cushion 16-in •. square and 4 in. thick. The driving force was applied perpendicular to its grain and after several hundred blows, it was compressed to
8
about 3 in. Laboratory tests on this type material indicated that its static secant modulus of elasticity was also about 40,000 psi.
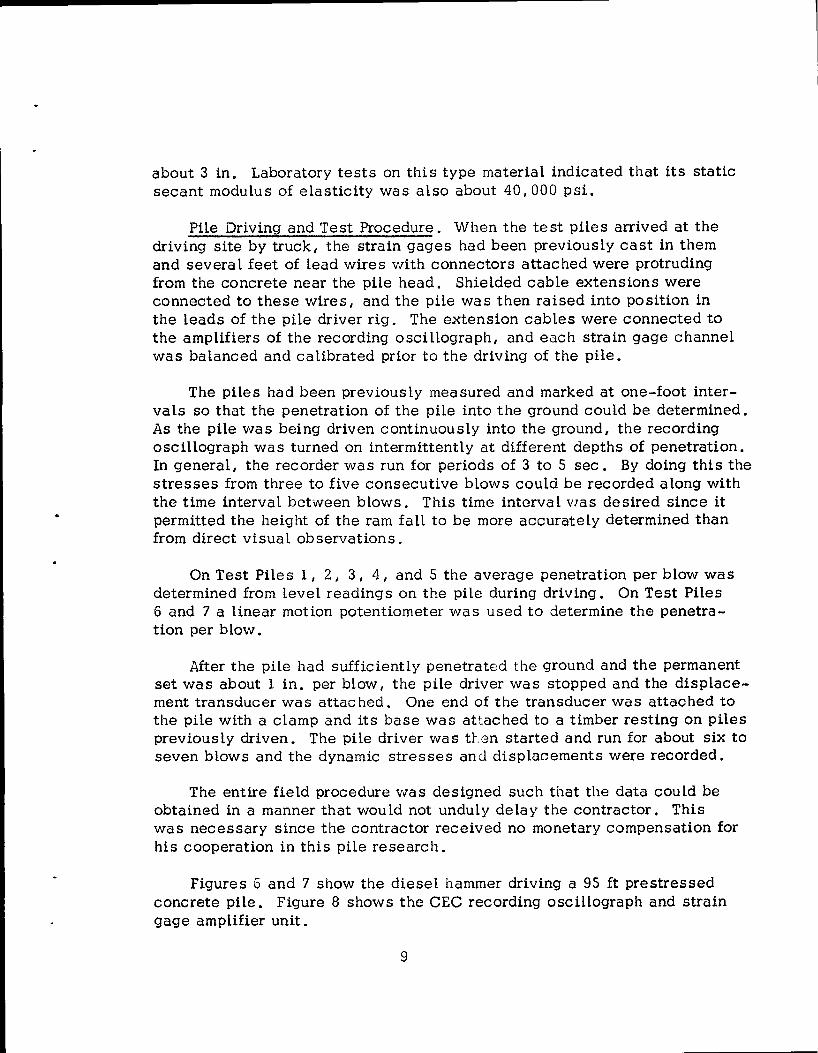
Pile Driving and Test Procedure. When the test piles arrived at the driving site by truck, the strain gages had been previously cast in them and several feet of lead wires with connectors attached were protruding from the concrete near the pile head. Shielded cable extensions were connected to these wires, and the pile was then raised into position in the leads of the pile driver rig. The extension cables were connected to the amplifiers of the recording oscillograph, and each strain gage channel was balanced and calibrated prior to the driving of the pile.
The piles had been previously measured and marked at one-foot intervals so that the penetration of the pile into the ground could be determined. As the pile was being driven continuously into the ground, the recording oscillograph was turned on intermittently at different depths of penetration. In general, the recorder was run for periods of 3 to 5 sec. By doing this the stresses from three to five consecutive blows could be recorded a long with the time interval between blows. This time interval v1as desired since it permitted the height of the ram fall to be more accurately determined than from direct visual observations.
On Test Piles 1, 2, 3, 4, and 5 the average penetration per blow was determined from level readings on the pile during driving. On Test Piles 6 and 7 a linear motion potentiometer was used to determine the penetration per blow.
After the pile had sufficiently penetrated the ground and the permanent set was about 1 in. per blow, the pile driver was stopped and the displacement transducer was attached. One end of the transducer was attached to the pile with a clamp and its base was attached to a timber resting on piles previously driven. The pile driver was tLen started and run for about six to seven blows and the dynamic stresses and displacements were recorded.
The entire field procedure was designed such that the data could be obtained in a manner that would not unduly delay the contractor. This was necessary since the contractor received no monetary compensation for his cooperation in this pile research.
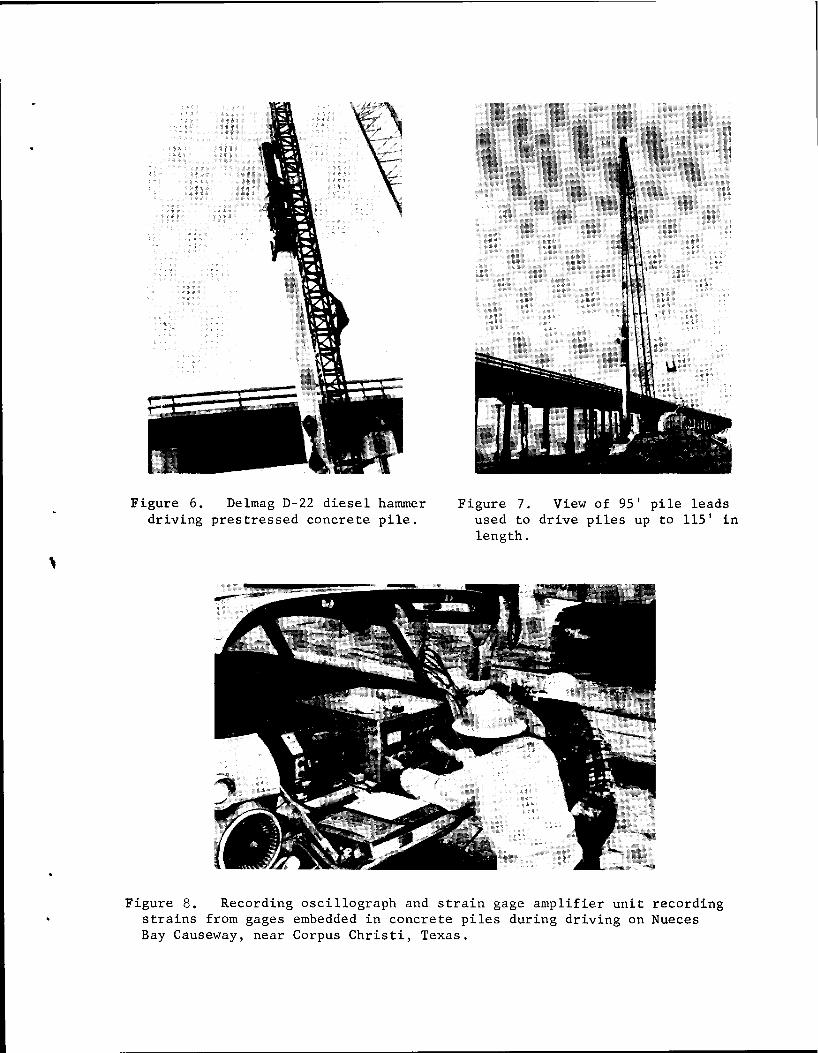
Figures 6 and 7 show the diesel hammer driving a 95 ft prestressed concrete pile. Figure 8 shows the CEC recording oscillograph and strain gage amplifier unit.
9
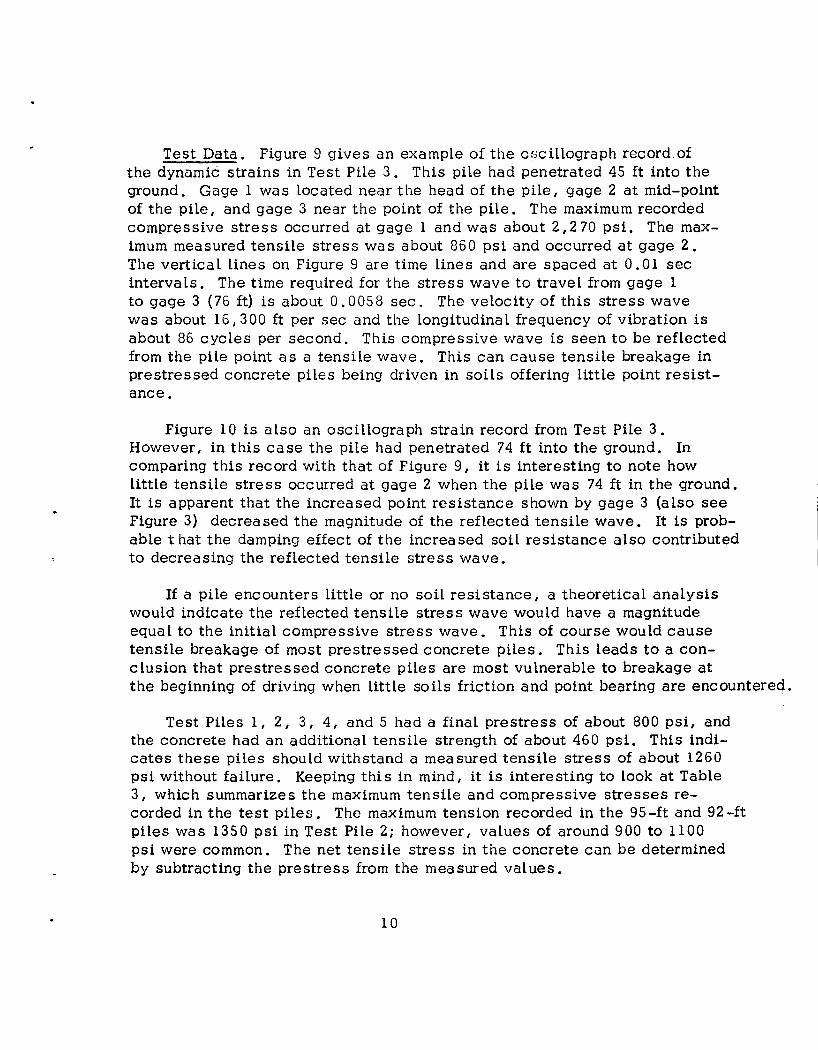
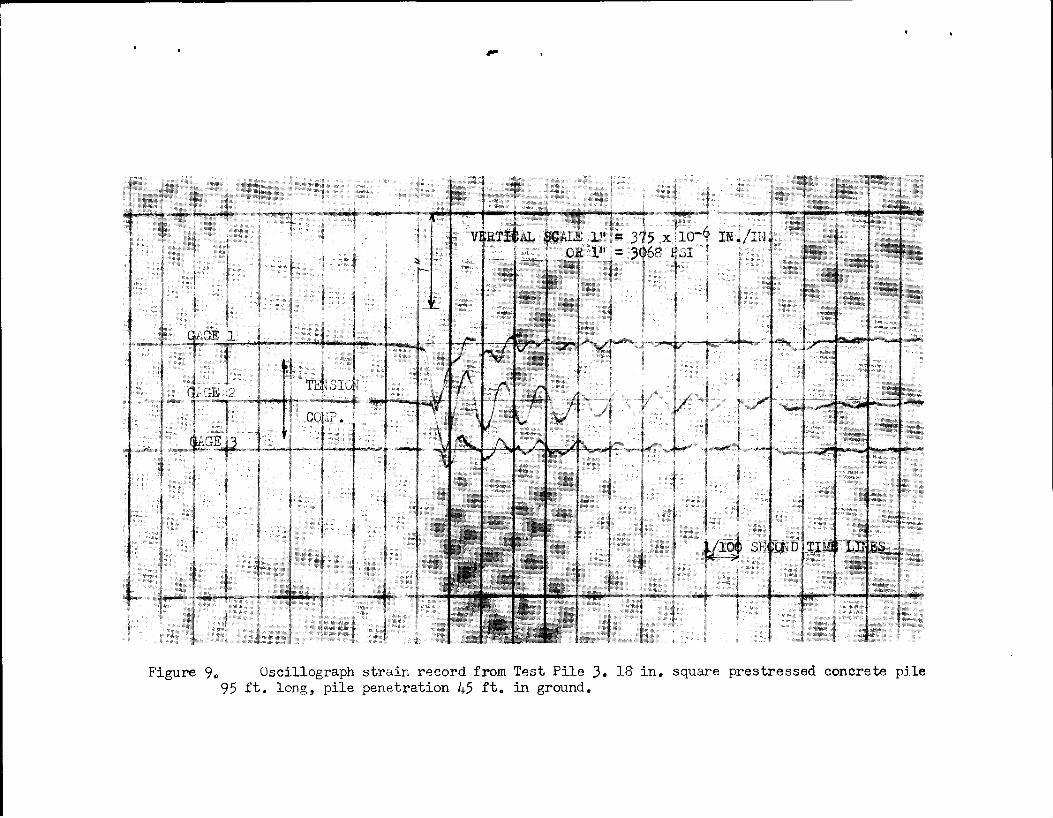
Test Data. Figure 9 gives an example of the oscillograph record. of the dynamic strains in Test Pile 3. This pile had penetrated 45 ft into the ground. Gage 1 was located near the head of the pile, gage 2 at mid-point of the pile, and gage 3 near the point of the pile. The maximum recorded compressive stress occurred at gage 1 and was about 2, 2 70 psi. The maximum measured tensile stress was about 860 psi and occurred at gage 2. The vertical lines on Figure 9 are time Lines and are spaced at 0. 01 sec intervals. The time required for the stress wave to travel from gage 1 to gage 3 (76 ft) is about 0. 005 8 sec. The velocity of this stress wave was about 16,300 ft per sec and the Longitudinal frequency of vibration is about 86 cycles per second. This compressive wave is seen to be reflected from the pile point as a tensile wave. This can cause tensile breakage in prestressed concrete piles being driven in soils offering little point resistance.
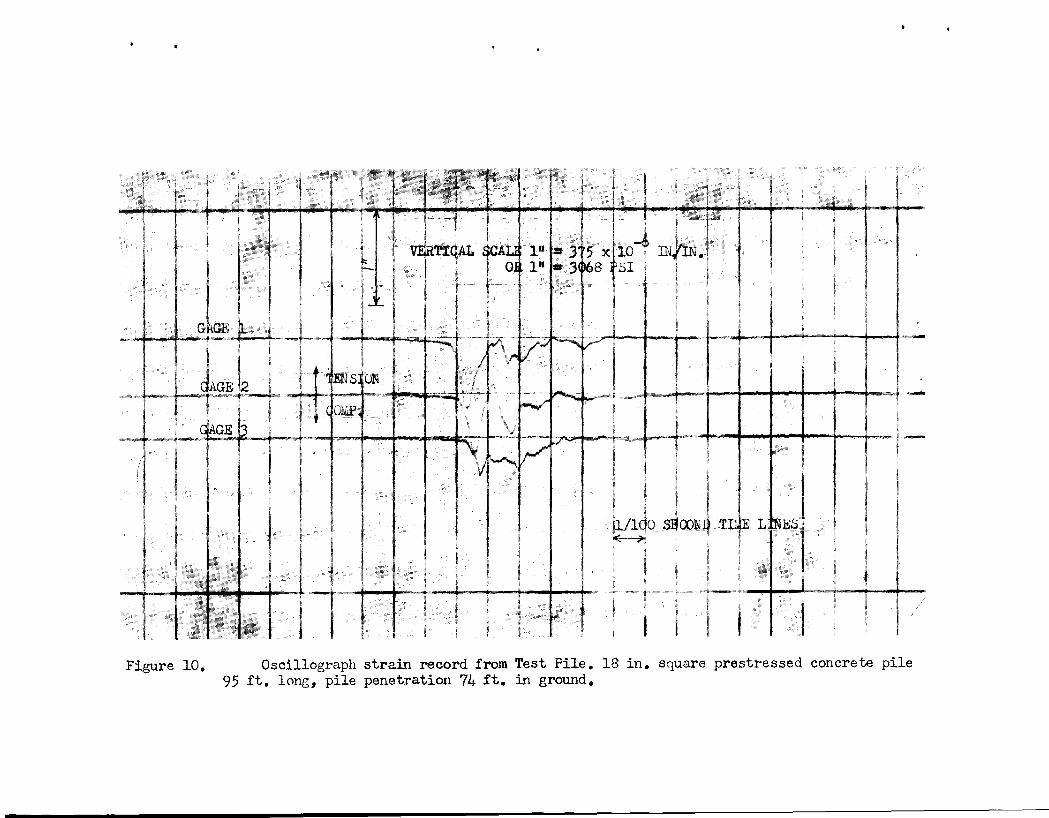
Figure 10 is also an oscillograph strain record from Test Pile 3. However, in this case the pile had penetrated 7 4 ft into the ground. In comparing this record with that of Figure 9, it is interesting to note how little tensile stress occurred at gage 2 when the pile was 74 ft in the ground. It is apparent that the increased point resistance shown by gage 3 (also see Figure 3) dec rea sed the magnitude of the reflected tensile wave. It is probable that the damping effect of the increased soil resistance also contributed to dec rea sing the reflected tensile stress wave.
If a pile encounters little or no soil resistance, a theoretical analysis would indicate the reflected tensile stress wave would have a magnitude equal to the initial compressive stress wave. This of course would cause tensile breakage of most prestressed concrete piles. This leads to a conclusion that prestressed concrete piles are most vulnerable to breakage at the beginning of driving when little soils friction and point bearing are encountered.
Test Piles 1, 2, 3, 4, and 5 had a final prestress of about 800 psi, and the concrete had an additional tensile strength of about 460 psi. This indicates these piles should withstand a measured tensile stress of about 1260 psi without failure. Keeping this in mind, it is interesting to look at Table 3, which summarizes the maximum tensile and compressive stresses recorded in the test piles. The maximum tension recorded in the 95-ft and 92-ft piles was 1350 psi in Test Pile 2; however, values of around 900 to 1100 psi were common. The net tensile stress in the concrete can be determined by subtracting the prestress from the measured values.
10
..----------------- -- -
These measurements are interesting in view of the fact that two piles broke in tension while being driven within 2 00 ft of Test Piles 1, 2, and 3. Figures 13 and 14 show these broken piles. All the tensile cracks were located in the lower half of the piles. Some cracks were also at the mid-point of these piles" These observations will be further discussed later.
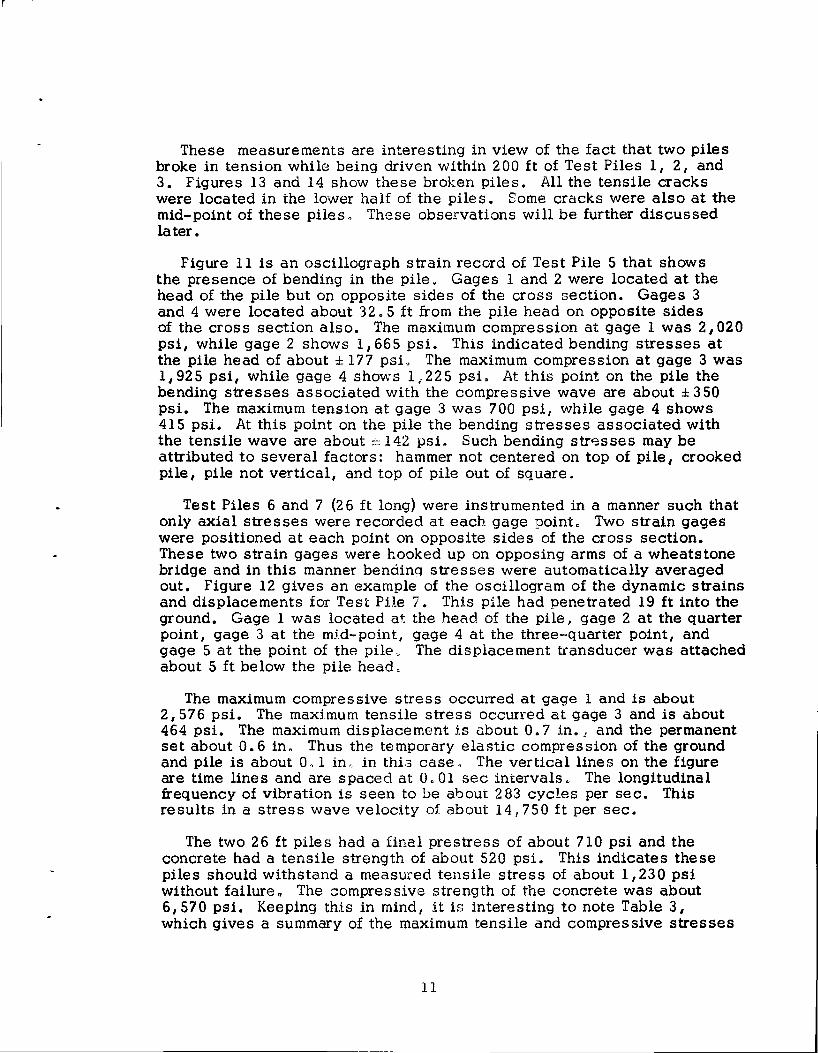
Figure 11 is an oscillograph strain record of Test Pile 5 that shows the presence of bending in the pile. Gages 1 and 2 were located at the head of the pile but on opposite sides of the cross section. Gages 3 and 4 were located about 32.5 ft from the pile head on opposite sides of the cross section also. The maximum compression at gage 1 was 2, 020 psi, while gage 2 shows 1, 665 psi. This indicated bending stresses at the pile head of about ± 177 psL The maximum compression at gage 3 was 1,925 psi, while gage 4 shows 1,225 psi. At this point on the pile the bending stresses associated with the compressive wave are about± 350 psi. The maximum tension at gage 3 was 700 psi, while gage 4 shows 415 psi. At this point on the pile the bending stresses associated with the tensile wave are about ± 142 psi. Such bending str"=lsses may be attributed to several factors: hammer not centered on top of pile, crooked pile, pile not vertical, and top of pile out of square.
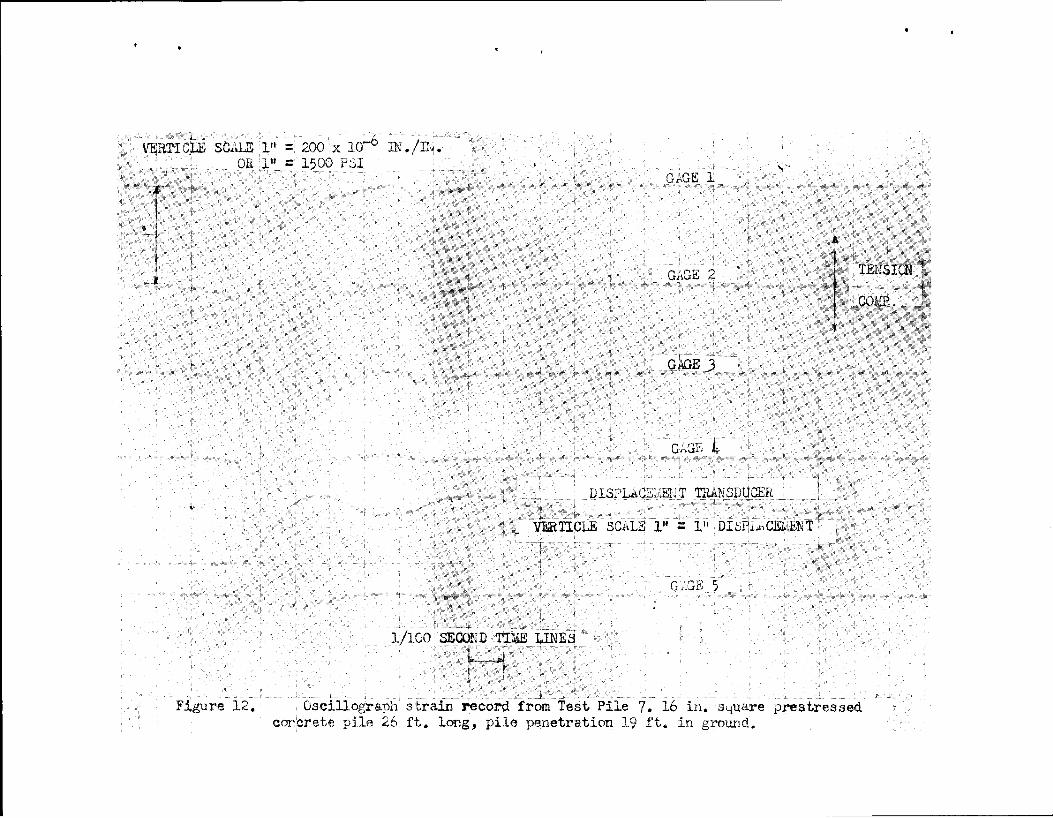
Test Piles 6 and 7 (2 6 ft long) were instrumented in a manner such that only axial stresses were recorded at each gage point" Two strain gages were positioned at each point on opposite sides of the cross section. These two strain gages were hooked up on opposing arms of a wheatstone bridge and in this manner bendinq stresses were automatically averaged out. Figure 12 gives an example of the oscillogram of the dynamic strains and displacements for Test Pile 7. This pile had penetrated 19 ft into the ground. Gage 1 was located at the heRd of the pile, gage 2 at the quarter point, gage 3 at the mid-point, gage 4 at the three-quarter point, and gage 5 at the point of the pile" The displacement transducer was attached about 5 ft below the pile head Q
The maximum compressive stress occurred at gage 1 and is about 2, 576 psi. The maxlmum tensile stress occurred at gage 3 and is about 464 psi. The maximum displacement is ubout 0. 7 in.! and the permanent set about 0. 6 in. Thus the temporary elastic compression of the ground and pile is about 0. 1 in o in this case , The vertical lines on the figure are time lines and are spaced at 0. 01 sec intervals. The longitudinal frequency of vibration is seen to be about 2 83 cycles per sec. This results in a stress wave velocity of about 14 1 750 ft per sec.
The two 26ft piles had a final prestress of about 710 psi and the concrete had a tensile strength of about 520 psi. This indicates these piles should withstand a measured tensile stress of about 1,23 0 psi without failure o The compressive strength of the concrete was about 6, 570 psi. Keeping this in mind, it is interesting to note Table 3, which gives a summary of the maximum tensile and compressive stresses
11
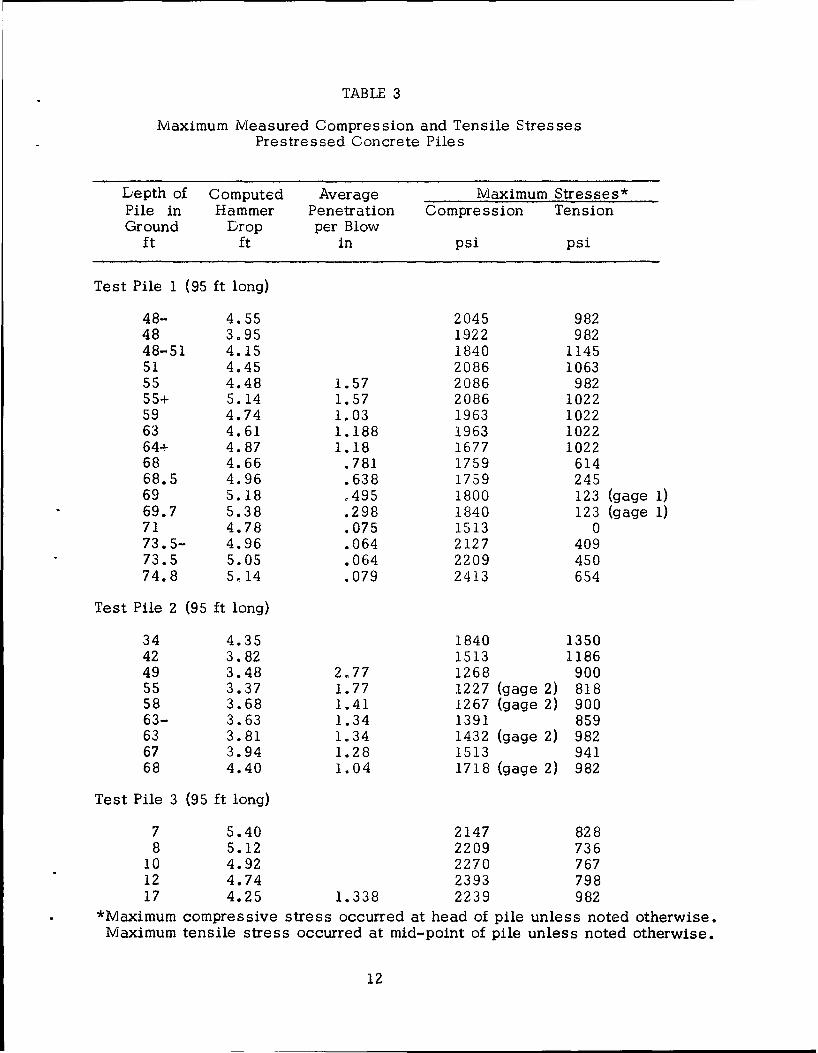
TABLE 3
Maximum Measured Compression and Tensile Stresses Prestressed Concrete Piles
Depth of Computed Average lVJaximum Stresses* Pile in Hammer Penetration Compression Tension Ground Drop per Blow
ft ft in psi psi
Test Pile 1 (95 ft long)
48- 4.55 2045 982 48 3.95 1922 982 48-51 4.15 1840 1145 51 4.45 2086 1063 55 4.48 1.57 2086 982 55+ 5.14 1. 57 2086 1022 59 4.74 1.03 1963 1022 63 4.61 1.188 1963 1022 64+ 4. 87 1.18 1677 1022 68 4.66 .781 1759 614 68.5 4.96 .638 1759 245 69 5.18 .495 1800 123 (gage 1) 69.7 5.38 .298 1840 123 (gage 1) 71 4.78 .075 1513 0 73.5- 4.96 .064 2127 409 73.5 5.05 .064 2209 450 74.8 5.14 .079 2413 654
Test Pile 2 (95 ft long)
34 4.35 1840 1350 42 3. 82 1513 1186 49 3.48 2.77 1268 900 55 3.37 1. 77 1227 (gage 2) 818 58 3.68 1.41 1267 (gage 2) 900 63- 3.63 1.34 1391 859 63 3.81 1.34 1432 (gage 2) 982 67 3.94 1. 28 1513 941 68 4.40 l. 04 1718 (gage 2) 982
Test Pile 3 (95 ft long)
7 5.40 2147 828 8 5.12 2209 736
10 4.92 2270 767 12 4.74 2393 798 17 4.25 1. 338 2239 982
*Maximum compressive stress occurred at head of pile unless noted otherwise. Maximum tensile stress occurred at mid-point of pile unless noted otherwise.
12
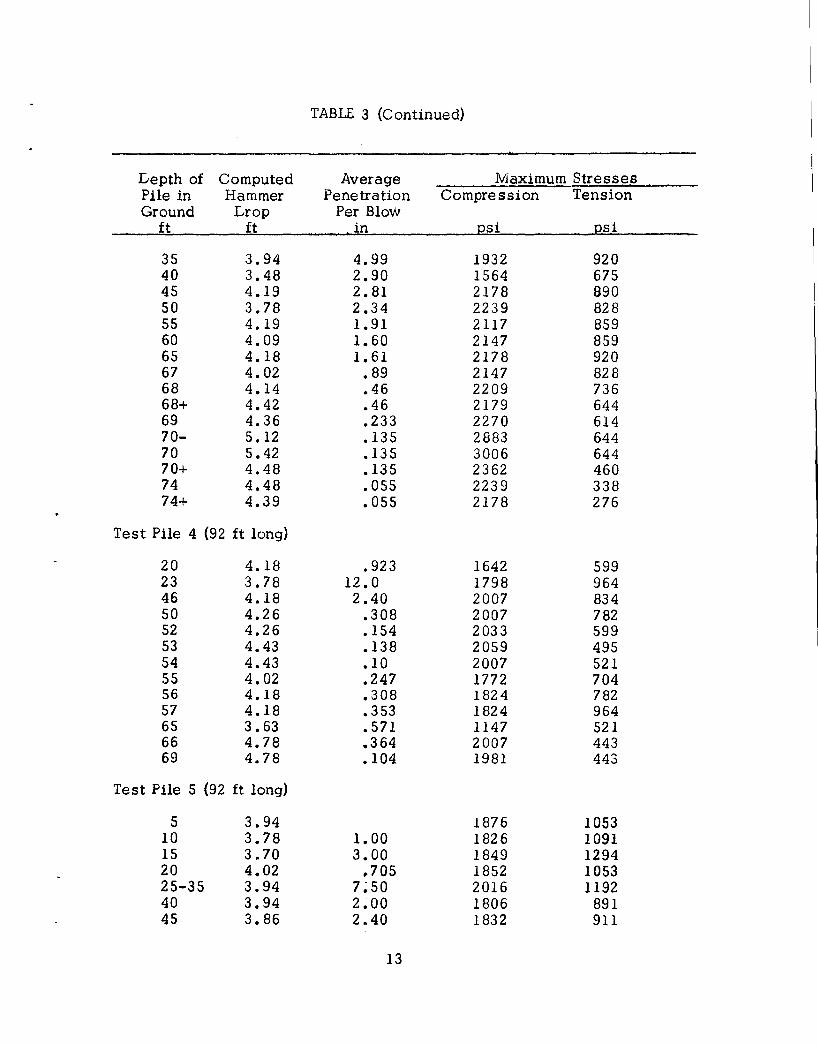
TABLE 3 (Continued)
Lepth of Computed Average Maximum Stresses Pile in Hammer Penetration Compression Tension Ground Lrop Per Blow
ft ft in psi psi
35 3.94 4.99 1932 920 40 3.48 2.90 1564 675 45 4.19 2.81 2178 890 50 3.78 2.34 2239 828 55 4.19 1.91 2117 859 60 4.09 1.60 2147 859 65 4.18 l. 61 2178 920 67 4. 02 • 89 2147 828 68 4.14 .46 2209 736 68+ 4.42 .46 2179 644 69 4.36 .233 2270 614 70- 5.12 .135 2883 644 70 5.42 .135 3006 644 70+ 4.48 .135 2362 460 74 4.48 .055 2239 338 74+ 4.39 .055 2178 276
Test Pile 4 (92 ft long)
20 4.18 .923 1642 599 23 3.78 12.0 1798 964 46 4.18 2.40 2007 834 50 4.26 .308 2007 782 52 4.26 .154 2033 599 53 4.43 .138 2059 495 54 4.43 .10 2007 521 55 4. 02 .247 1772 704 56 4.18 .308 1824 782 57 4.18 • 353 1824 964 65 3. 63 .571 1147 521 66 4.78 .364 2007 443 69 4.78 .104 1981 443
Test Pile 5 (92 ft long)
5 3.94 1876 1053 10 3.78 1.00 1826 1091 15 3.70 3.00 1849 1294 20 4.02 .705 1852 1053 25-35 3.94 7;50 2016 1192 40 3.94 2.00 1806 891 45 3.86 2.40 1832 911
13
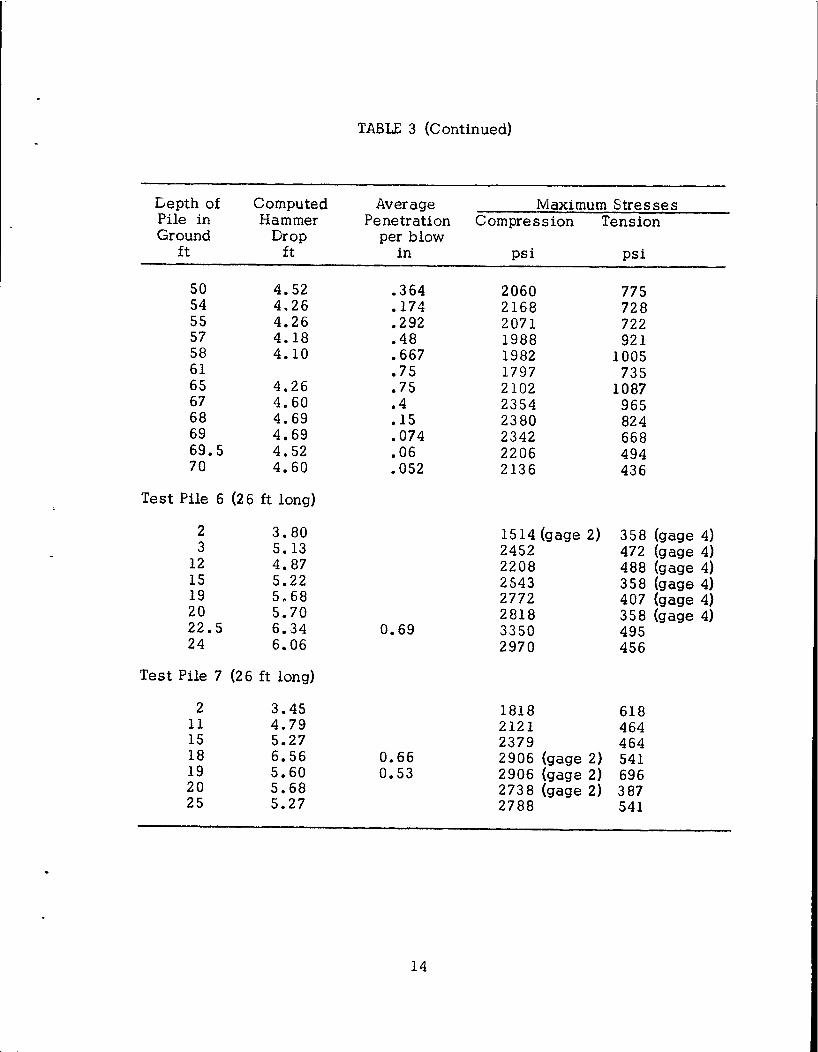
TABLE 3 (Continued)
Lepth of Computed Average Maximum Stresses Pile in Hammer Penetration Compression Tension Ground Drop per blow
ft ft in psi psi
50 4.52 .364 2060 775 54 4.26 .174 2168 728 55 4.26 .292 2071 722 57 4.18 .48 1988 921 58 4.10 • 667 1982 1005 61 .75 1797 735 65 4.26 .75 2102 1087 67 4.60 .4 2354 965 68 4.69 .15 2380 824 69 4.69 .074 2342 668 69.5 4.52 .06 2206 494 70 4.60 .052 2136 436
Test Pile 6 (2 6 ft long)
2 3.80 1514 (gage 2) 358 (gage 4) 3 5.13 2452 472 (gage 4)
12 4.87 2208 488 (gage 4) 15 5.22 2543 358 (gage 4} 19 5.68 2772 407 (gage 4) 20 5.70 2818 358 (gage 4) 22.5 6.34 0.69 3350 495 24 6.06 2970 456
Test Pile 7 (2 6 ft long}
2 3.45 1818 618 11 4.79 2121 464 15 5.27 2379 464 18 6.56 0.66 2906 (gage 2) 541 19 5.60 0.53 2906 (gage 2) 696 20 5.68 2738 (gage 2) 387 25 5.27 2788 541
14
recorded in these two pilerJ o The mc.;.'~imum tensile stress recorded was 696 psi in Test Pile 7; howover, valueL o:t around 400 to 600 psi were more common" The maxin:.um cornp:: ;"~S2.V\2 stress recorded was 3,350 psi in Test Pile 6; ho·vvever valu8F> of around 2" 500 to 2 t 900 psi were more common.
The net tensile stress in tho concrete can be determined by subtracting the prestress from the me;asur,:;d stres:L If this is done, it becomes apparent that thase short ~)iles e:::perienc::3d no net tensile stress.
In general 1 the magnitude of the tensile stresses in the 26 ft piles was only about one-half of those measured ~.n the 92 ft and 95 ft piles. The compressive stresses in the short piler:; vlGre slightly greater than those in the long pile~,. but this wc:.s probabl~ because of the different cushions used"
COMPUTER CORRELATION
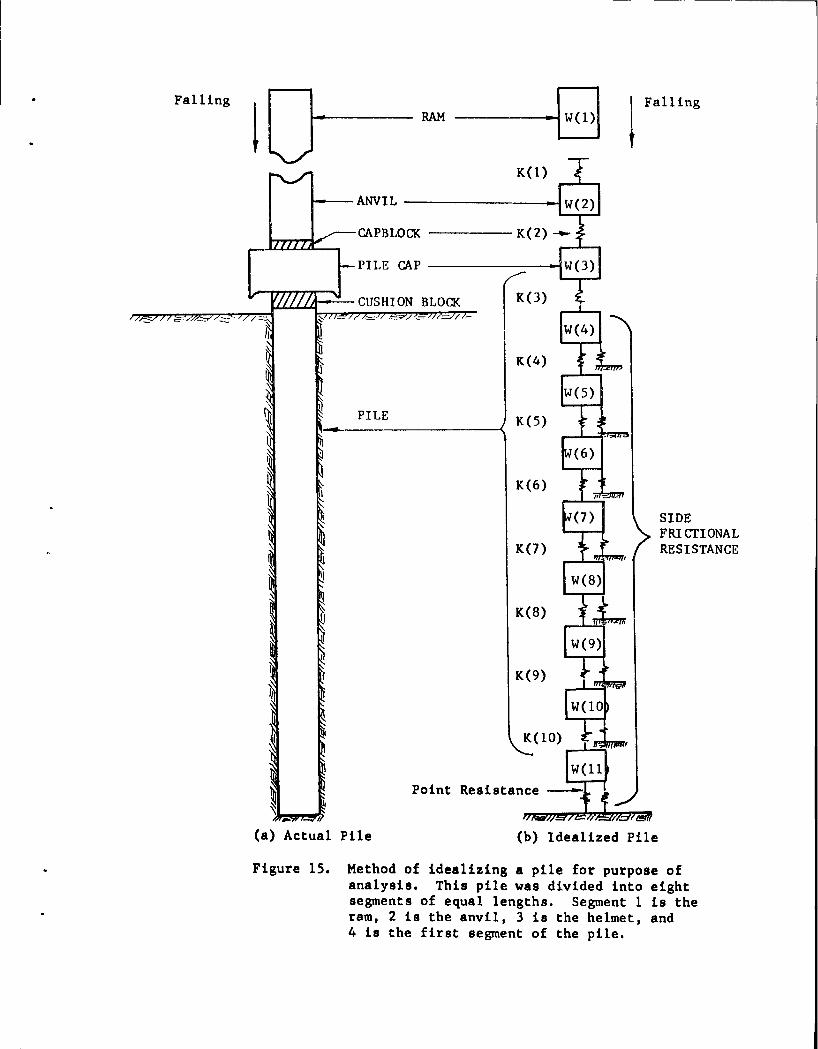
General. In order to cor:n~late t~'.e :i:iGJ.d do.tu. with theoretical results, these pile problems we-:e :..u~1 o:,, a:-1 ~.2-i\;J 709 Ligital Computer. For the computer solution, a 'JJ.le :i.n :Jj:·Hu1.a,,::;,~ . .:.:~; s~wwn J.:r. Figure 15" Test Piles 6 and 7 were divided 7.nto -a.i.ght e~erriGI)ts us shown .i.n Figure 15. However, Test Piles l 1 2, 3, 4l and 5 we::e cc?.vided into ~ 0 discrete elements because of their greater length. 'lh~ p:::-'Jgr<m:. ,Issd was essentially the same as that described by E.A.L. Smitl! 1 2 a.nc~ .i.n previcas work by the writers,6 except that it has been modifjed to incL~~~· the effec: of gravity o.nd separate frictional point forces on tl:o Ja0r: pl~e segme~"Jt, To accomplish the problem simulation, various physic:;). datr:'. concerning the ram., anvil, capblock 1
helmet, cushion 1 pile: and soU. ·,·.rer: :c"c·~;;:;,:;ary Much of the data was obtained from the pile dci.vc~ manvfc=wturr::r,. field observations, and laboratory tests and is reported in t~1is lX':\per" Bowever,. data concerning the dynamic stress-straj.11 charc:~cte:ristic::: o::: the ·Nood.: concrete t and soil are practically nonexistent" o.nd enqineering estimates were necessary.
E A L c:: 'thl2 ~ -,-,~t rl .., .. - · .•. ~. .. , · ··-- '"' .;,..,'·o·· ~1- .J mp' 'n the p1'le • • ..... n11 ,:>U9~Jv::> e .. l..\•.·tt ~\!',, LL.·c' ::J.1. ... · .• t.~:.na ua lng 1
material might be desir<l:JL:e !:o acco~lnL icr r~n,::;rgy losses due to a stressstrain hysteresis. Although no data. ·i:v~rc ~~vailab.le that .suggested a value for such a damping property of co:Jc;:eteJ veJues ~.vere assumed in these problems. 6, 7! 11 Soil quake and de>mpinq (;_O!'_;stunts that si.mulato dynamic stress-strain behavior were alsu ::\,,:sumed. Or'' 11,12 Future research work is planned which should :nore ,-,.: ' . .sady Je~L!"~ a:•ld evaluate these now elusive parameters.
Computer Results Cqmp_0reQ_~~.}:}1 fi_<dd Lata. A comparison of the computed stresses and displaccmenl:E> with those measured in the field is
12Smithr E .A.!.. 1 "PHe· ·dri:ri_n'J .l\.naly1;is by the 'A ave Equation," Journal of the Soil lVlecl!ani.cs ar.~d Foundat:~ons L:.vision, Proceedings of the American Society of Civil Ex1Jine3ts, VoJ.ume 86, Number SM 4, pp. 35-61 1
August, 1960.
15
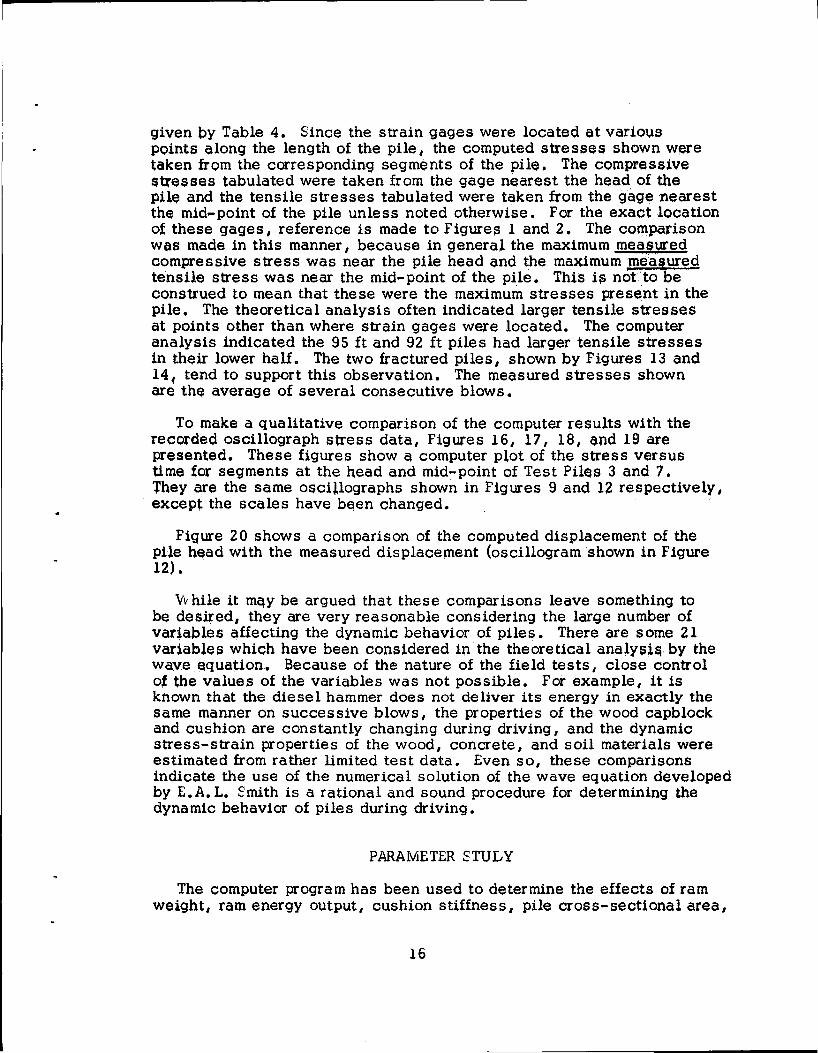
given py Table 4. Since the strain gages were located at various points along the length of the pile, the computed stresses shown were taken from the corresponding segments of the pile. The compressive Stl'esses tabulated were taken from the gage nearest the head of the Pile and the tensile stresses tabulated were taken from the gage nearest the mid-point of the pile unless noted otherwise. For the exact location of these gages, reference is made to Figures 1 and 2. The comparison was made in this manner, because in general the maximum meafwed compressive stress was near the pile head and the maximum mea§ured tensile stress was near the mid-point of the pile. This is not 'to be construed to mean that these were the maximum stresses present in the pile. The theoretical analysis often indicated larger tensile stresses at points other than where strain gages were located. The computer analysis indicated the 95 ft and 92 ft piles had larger tensile stresses in their lower half. The two fractured piles, shown by Figures 13 and 14( tend to support this observation. The measured stresses shown are the average of several consecutive blows.
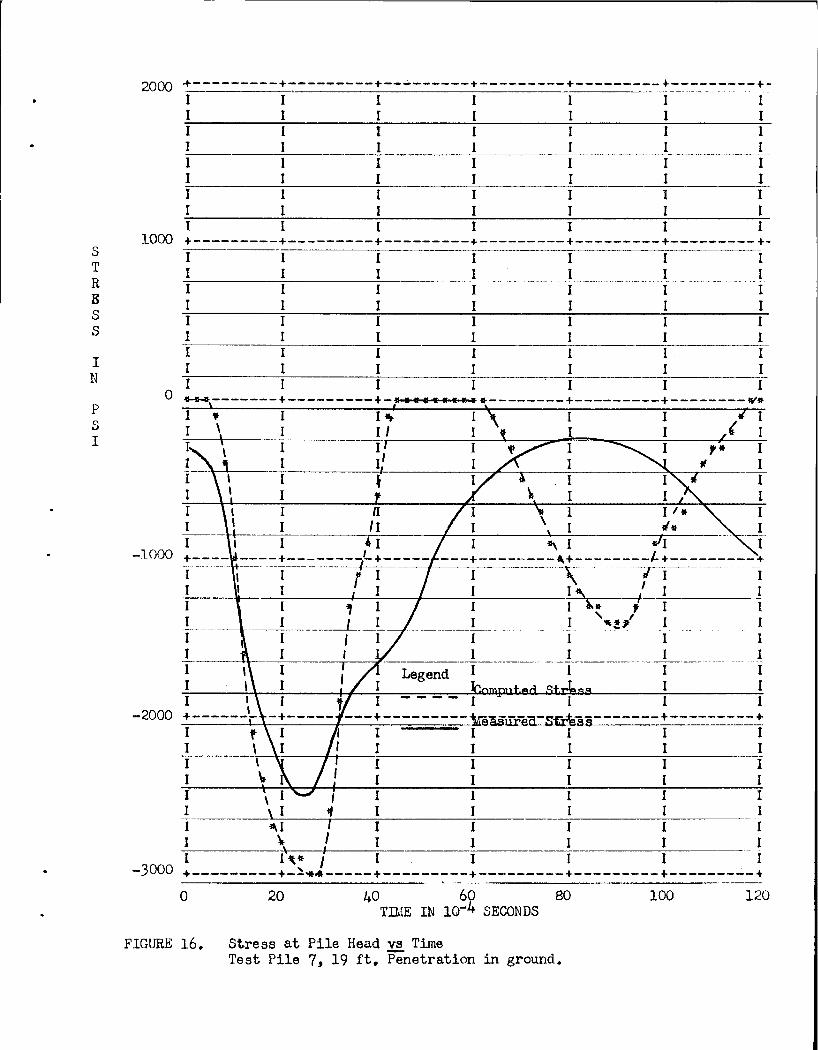
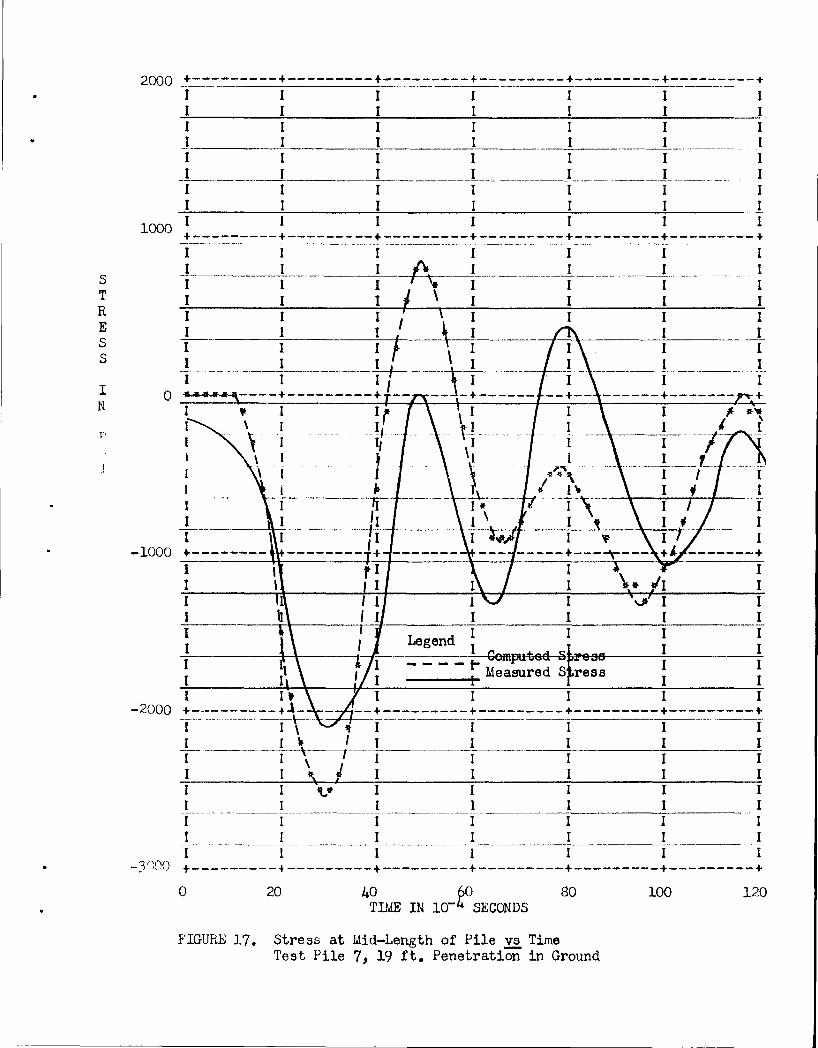
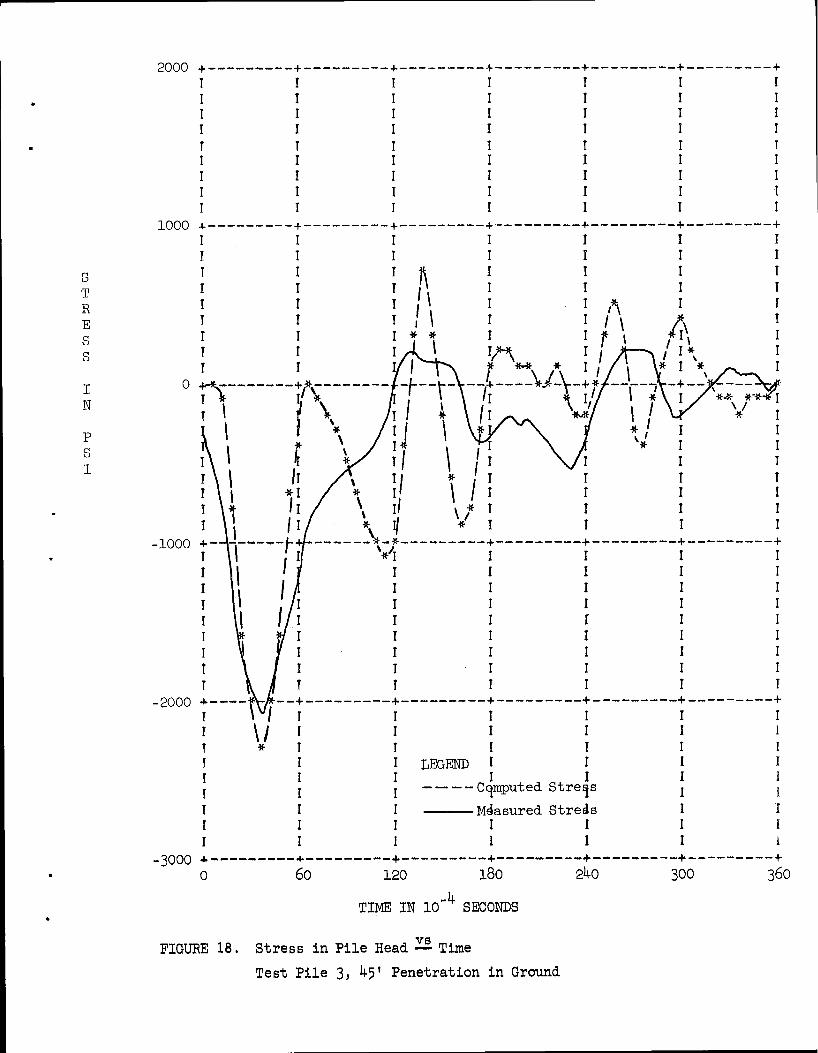
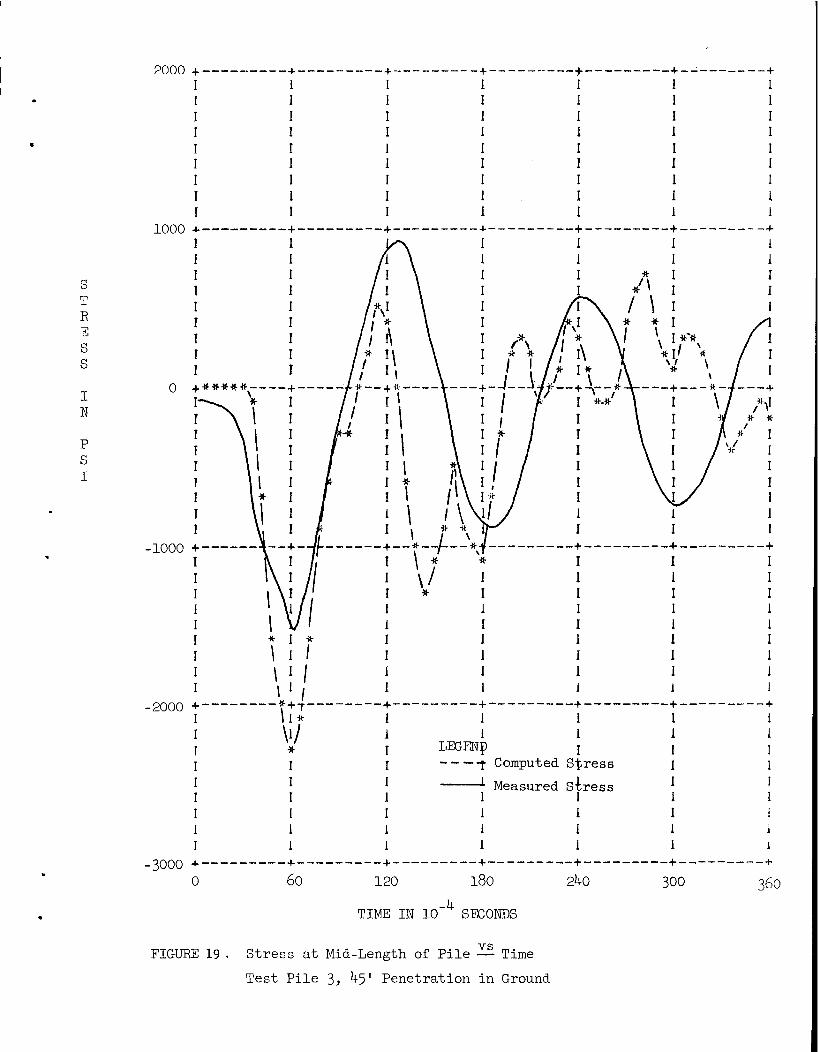
To make a qualitative comparison of the computer results with the recorded oscillograph stress data, Figures 16, 17 1 18 1 and 19 are presented. These figures show a computer plot of the stress versus time for segments at the head and mid-point of Test Piles 3 and 7. They are the same oscillographs shown in Figures 9 and 12 respectively 1
excep~ the scales have been changed.
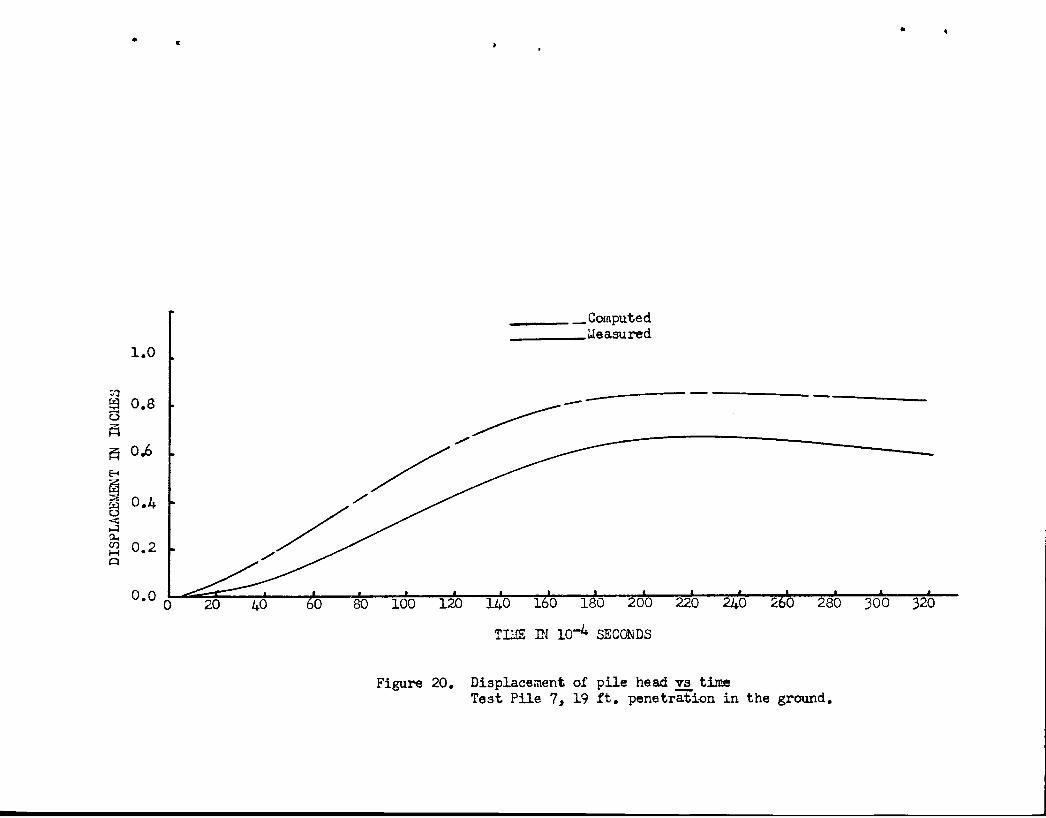
Figure 20 shows a comparison of the computed displacement of the pile head with the measured displacement (oscillogram shown in Figure 12). .
Vv hile it mqy be argued that these comparisons leave something to be desired, they are very reasonable considering the large number of variables affecting the dynamic behavior of piles. There are some 21 variables which have been considered i:p. the theoretical analy~hj by the wave. equation.. Because of the nature of the field tests 1 close control ot the values of the variables was not possible. For example, it is known that the diesel hammer does not deliver its energy in exactly the same manner on successive blows 1 the properties of the wood capblock and cushion are constantly changing during driving 1 and the dynamic stress-strain properties of the wood, concrete, and soil materials were estimated from rather limited test data. Even so, these comparisons indicate the use of the numerical solution of the wave equation developed by E. A. L. Smith is a rational and sound procedure for determining the dynamic behavior of piles during driving.
PARAMETER STULY
The computer program has been used to determine the effects of ram weight, ram energy output, cushion stiffness, pile cross-sectional area,
16
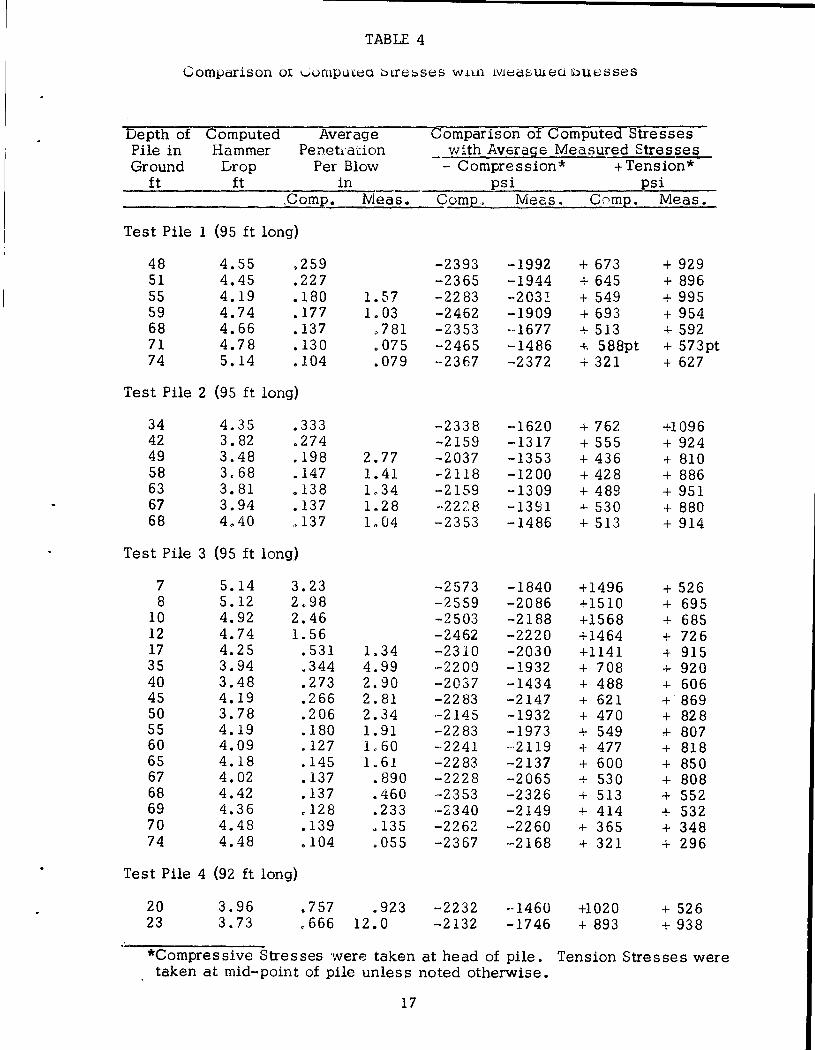
--- ----------------------------TABLE 4
Comparison oi 0umpu.:ea bae::.ses w.nn lVJt:df;;US.euti.:IUt;;Sses
Depth of Computed Average Comparison of Computed Stresses Pile in Hammer Penet1·ation with Averag:e Measured Stresses Ground Drop Per Blow - Compression* +Tension*
ft ft in psi psi . Comp. Meas • Comp, Meas. Comp. Meas.
Test Pile 1 (95 ft long)
48 4.55 ,259 -2393 -1992 + 673 + 929 51 4.45 .227 -2365 -1944 + 645 + 896 55 4.19 .180 1.57 -2283 -2031 + 549 + 995 59 4.74 .177 1. 03 -2462 -1909 + 693 + 954 68 4.66 .137 o781 -2353 ···1677 + 513 + 592 71 4.78 .130 .075 -2465 -1486 +. 588pt + 573pt 74 5.14 .104 .079 -2367 -2372 + 321 + 627
Test Pile 2 (95 ft long)
34 4.35 .333 -2338 -1620 + 762 +1096 42 3. 82 .274 -2159 -1317 + 555 + 924 49 3.48 .198 2.77 -2037 -1353 + 436 + 810 58 3.68 .147 1.41 -2118 -1200 + 428 + 886 63 3.81 .138 L34 -2159 -1309 + 489 + 951 67 3.94 .137 1.28 -2228 -1391 + 530 + 880 68 4.40 n137 1.04 -2353 -1486 + 513 + 914
Test Pile 3 (95 ft long)
7 5.14 3.23 -2573 -1840 +1496 + 526 8 5.12 2.98 -2559 -2086 +1510 + 695
10 4.92 2.46 -2503 -2188 +1568 + 685 12 4.74 l. 56 -2462 -2220 +1464 + 726 17 4.25 .531 1.34 -2310 -2030 +1141 + 915 35 3.94 .344 4.99 -2200 -1932 + 708 + 920 40 3.48 .273 2.90 -2037 -1434 + 488 + 606 45 4.19 .266 2.81 -2283 -2147 + 621 + 869 50 3.78 .206 2.34 ·-2145 -1932 + 470 + 828 55 4.19 .180 1. 91 -2283 -1973 + 549 + 807 60 4.09 .127 L60 -2241 ···2ll9 + 477 + 818 65 4.18 .145 l. 61 -2283 -2137 + 600 + 850 67 4. 02 .137 • 890 -2228 -2065 + 530 + 808 68 4.42 .137 .460 ·-2353 -2326 + 513 + 552 69 4. 36 .128 .233 ·-2340 -2149 + 414 + 532 70 4.48 .139 .135 -2262 -2260 + 365 + 348 74 4.48 .104 .055 -2367 -2168 + 321 + 296
Test Pile 4 (92 ft long)
20 3.96 .757 .923 -2232 -·1460 +1020 + 526 23 3.73 c666 12.0 -2132 -1746 + 893 + 938
*Compressive Stresses were taken at head of pile. Tension Stresses were taken at mid-point of pile unless noted otherwise.
17
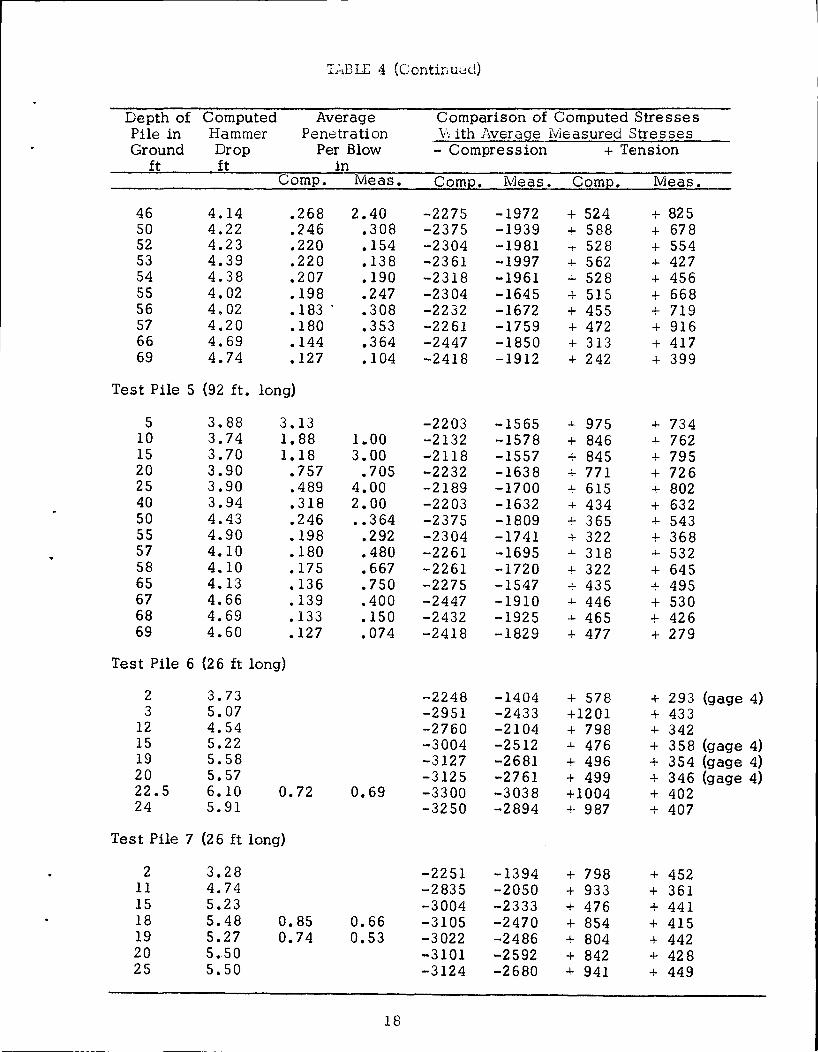
TriDIL 4 (Contir;ued)
Depth of Computed Average Comparison of Computed Stresses Pile in Hammer Penetration v\ ith Average Measured Stresses Ground Drop Per Blow - Compression + Tension
ft ft in Comp. Meas. Comp. Meas. Comp. Meas.
46 4.14 .268 2.40 -2275 -1972 + 524 + 825 so 4.22 .246 .308 -2375 -1939 + 588 + 678 52 4.23 .220 .154 -2304 -1981 + 528 + 554 53 4.39 .220 .138 -2361 -1997 + 562 + 427 54 4.38 .207 .190 -2318 -1961 + 528 + 456 55 4.02 .198 .247 -2304 -1645 + 515 + 668 56 4.02 .183 . .308 -2232 -1672 + 455 + 719 57 4.20 .180 .353 -2261 -1759 + 472 + 916 66 4.69 .144 .364 -2447 -1850 + 313 + 417 69 4.74 .127 .104 -2418 -1912 + 242 + 399
Test Pile 5 (92 ft. long)
5 3.88 3.13 -2203 -1565 + 975 + 734 10 3.74 1.88 1.00 -2132 -1578 + 846 + 762 15 3.70 1.18 3.00 -2118 -1557 + 845 + 795 20 3.90 .757 .705 -2232 -1638 + 771 + 726 25 3.90 .489 4.00 -2189 -1700 + 615 + 802 40 3.94 .318 2.00 -2203 -1632 + 434 + 632 50 4.43 .246 •• 3 64 -2375 -1809 + 365 + 543 55 4.90 .198 • 292 -2304 -1741 + 322 + 368 57 4.10 .180 .480 -2261 -1695 -'- 318 + 532 58 4.10 .175 .667 -2261 -1720 + 322 + 645 65 4.13 .136 .750 -2275 -1547 + 435 + 495 67 4.66 .139 .400 -2447 -1910 + 446 + 530 68 4.69 .133 .150 -2432 -1925 + 465 + 426 69 4.60 .127 .074 -2418 -1829 + 477 + 279
Test Pile 6 {26 ft long)
2 3.73 -2248 -1404 + 578 + 293 (gage 4) 3 5.07 -2951 -2433 +1201 + 433
12 4.54 -2760 -2104 + 798 + 342 15 5.22 -3004 -2512 + 476 + 358 {gage 4) 19 5.58 -3127 -2681 + 496 + 354 (gage 4) 20 5.57 -3125 -2761 + 499 + 346 (gage 4) 22.5 6.10 0.72 0.69 -3300 -3038 +1004 + 402 24 5.91 -3250 -2894 + 987 + 407
Test Pile 7 (26 ft long)
2 3.28 -2251 -1394 + 798 + 452 ll 4.74 -2835 -2050 + 933 + 361 15 5.23 -3004 -2333 + 476 + 441 18 5.48 0.85 0.66 -3105 -2470 + 854 + 415 19 5.27 0.74 0.53 -3022 -2486 + 804 + 442 20 5 •. 50 -3101 -2592 + 842 + 428 25 5.50 -3124 -2680 + 941 + 449
18
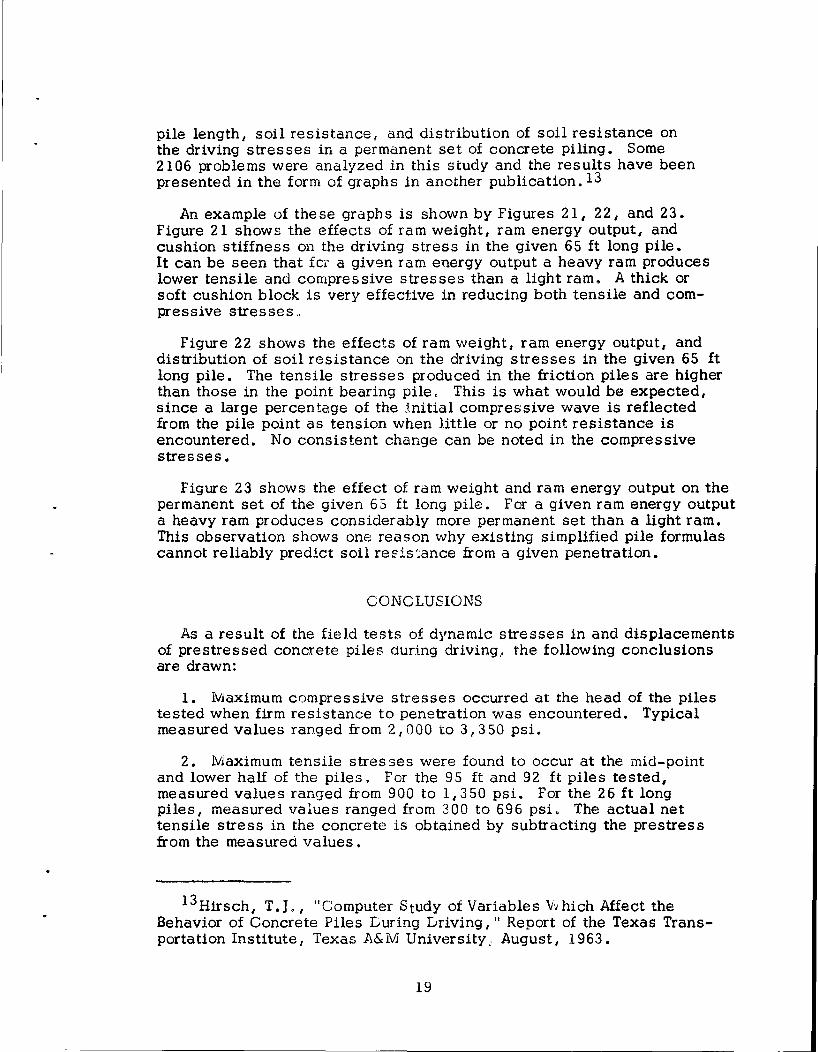
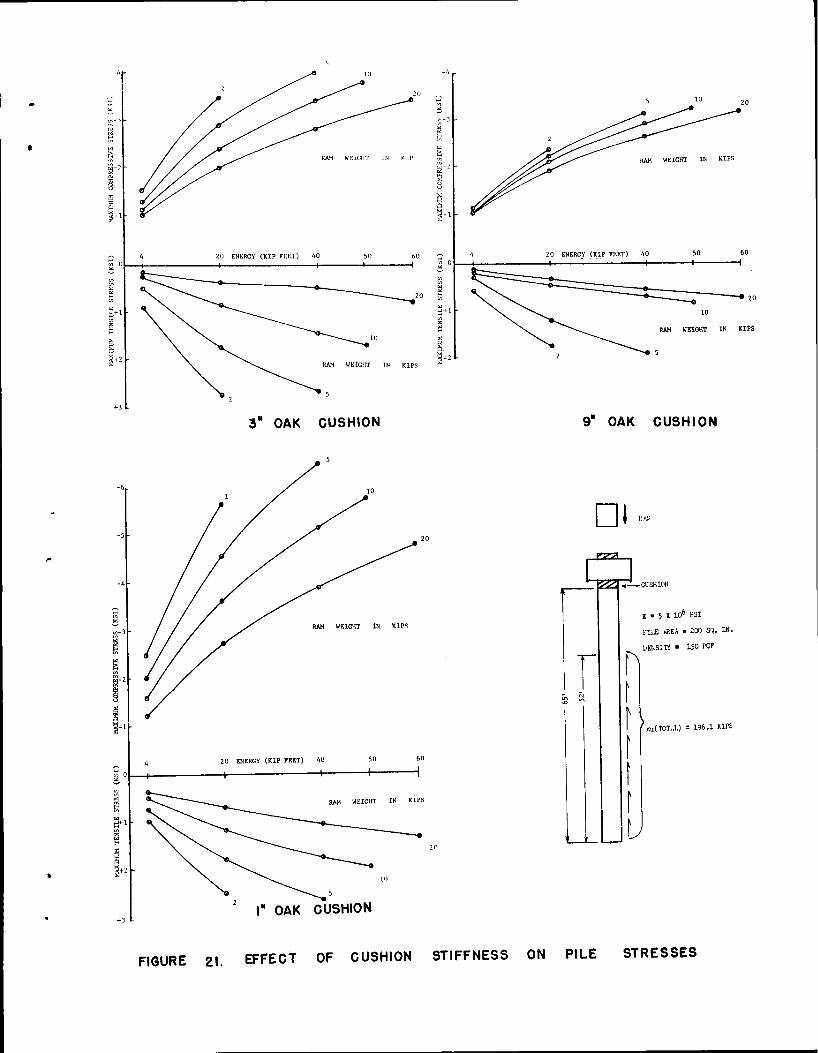
pile length, soil resistance, and distribution of soil resistance on the driving stresses in a permanent set of concrete piling. Some 2106 problems were analyzed in this study and the results have been presented in the form of graphs in another publication.13
An example of these graphs is shown by Figures 21, 22, and 23. Figure 21 shows the effects of ram weight, ram energy output, and cushion stiffness on the driving stress in the given 65 ft long pile. It can be seen that for a given ram energy output a heavy ram produces lower tensile and compressive stresses than a light ram. A thick or soft cushion block is very effective in reducing both tensile and compressive stresses v
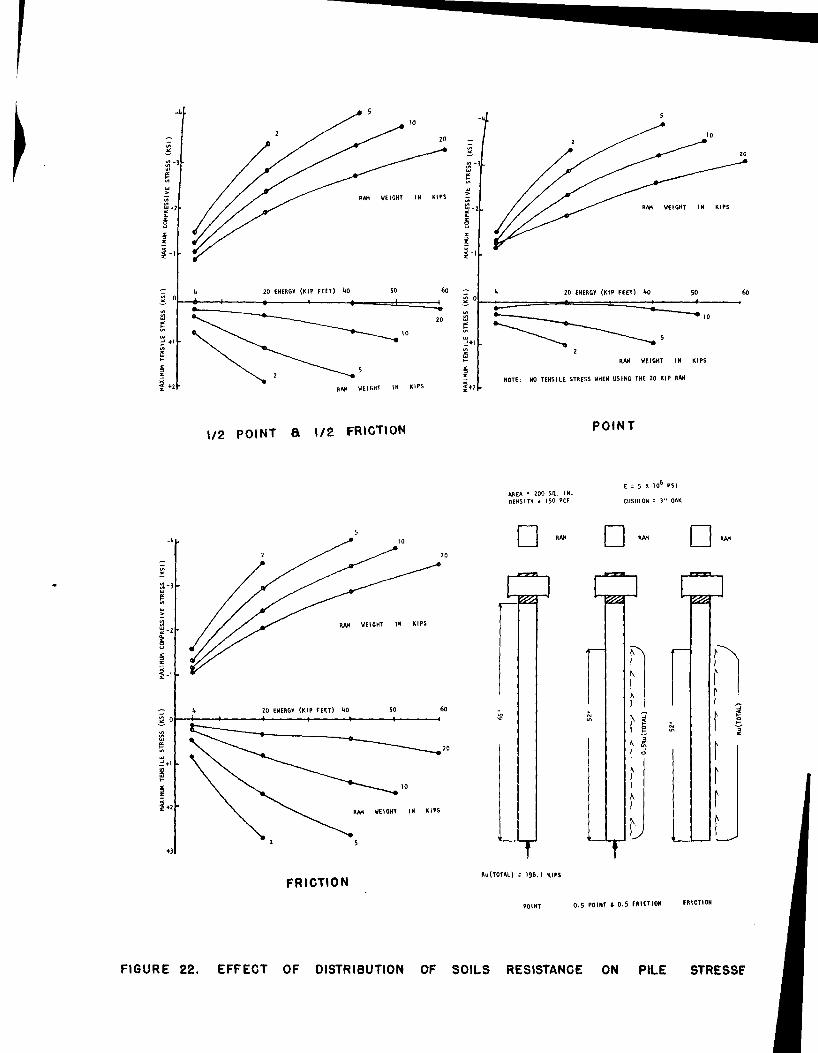
Figure 22 shows the effects of ram weight, ram energy output, and distribution of soil resistance on the driving stresses in the given 65 ft long pile. The tensile stresses produced in the friction piles are higher than those in the point bearing pile, This is what would be expected, since a large percentage of the initial compressive wave is reflected from the pile point as tension when little or no point resistance is encountered. No consistent change can be noted in the compressive stresses.
Figure 23 shows the effect of ram weight and ram energy output on the permanent set of the given 65 ft long pile. For a given ram energy output a heavy ram produces considerably more permanent set than a light ram. This observation shows one reason why existing simplified pile formulas cannot reliably predict soil re8is::ance from a given penetration.
CONCLUSIONS
As a result of the field tests of dynamic stresses in and displacements of prestressed concrete piles during driving, the following conclusions are drawn:
1. Maximum compressive stresses occurred at the head of the piles tested when firm resistance to penetration was encountered. Typical measured values ranged from 2, 000 to 3, 3 50 psi.
2. Maximum tensile stresses were found to occur at the mid-point and lower half of the piles. For the 95 ft and 92 ft piles tested, measured values ranqed from 900 to 1,350 psi. For the 26ft long piles, measured values ranged from 300 to 696 psi. The actual net tensile stress in the concrete is obtained by subtracting the prestress from the measured values.
13 Hirsch, T.J,, "Computer Study of Variables vvhich Affect the Behavior of Concrete Piles Luring Lriving," Report of the Texas Transportation Institute, Texas A&M University .. August, 1963.
19
3. Bending stresses may occur in long piles because the hammer is not centered on top of the pile, the pile is crooked, the pile is not vertical, and the top of the pile is out of square. Bending stresses associated with the compressive wave were measured at about ± 350 psi and those associated with the tensile wave were measured at about ± 150 psi.
4. The stresses and displacements computed by use of wave theory agreed fairly well with the measured data. It was indicated, however, that more research needs to be directed toward determining the dynamic properties of the wood, concrete, and soils involved.
As a result of the theoretical studies of dynamic stresses and displacements in prestressed concrete piles, the following additional conclusions are presented concerning driving conditons which are likely to produce very large stresses:
5. For a given ram energy output, a heavy ram produces lower tensile and compressive stresses than a light ram.
6. For a given ram energy output, a heavy ram produces more permanent set than a light ram.
7. A soft cushion is very effective in reducing both tensile and compressive stresses in a pile.
8. A light or weak soil resistance produces larger tensile stresses in a pile than a hard or strong soil resistance.
9. In general, the tensile stresses produced in friction piles are higher than those in point-bearing piles. No consistent change can be noted in the compressive s tresses •
10. In general, long piles have higher tensile stresses than short piles. The length of the pile has no significant effect on the compressive stresses.
11. Increasing the cross-sectional area of a pile produces a slight decrease in the axial compressive stress, but no consistent change is noted in the axial tensile stress. Because of the higher slenderness ratio, the bending stresses due to imperfect driving conditions may be increased, however.
Any variables not mentioned in the specific conclusion above are assumed to be constant.
20
ACKNOV~ LEDGMENTS
The field tests described in this paper were conducted as a part of Research Projects RP-27 and HPE 1 (27) L. The first project was sponsored by the Bridge Division of the Texas Highway Department and the latter was sponsored jointly by the Bridge Division of the Texas Highway Department and the Bureau of Public Roads. The wavetheory computer program was obtained as a part of Research Project RP-2 5 sponsored by the Bridge Livision of the Texas Highway Lepartment. All three projects were conducted by the Texas Transportation Institute, Texas A&M University. The authors gratefully acknowledge the assistance of Farland C. Bundy, Supervising Design Engineer, Bridge Livision of the Texas Highway Department, who worked closely with the authors in accomplishing the projects.
Appreciation is also extended toE .A. L. Smith who maintained a continuing interest and contributed much effort throughout this work.
Acknowledgement is also due Ross Anglin and Son (General Contractors), Brown and Root Company, and Baass Brothers Concrete Company, all of Texa:;, for their cooperation in the field tests. Thanks are also due the California Company of New Orleans, La., for use of their recording oscillograph and amplifiers.
REFERENCES
l. Samson, Charles H., Jr., "Pile-Driving Analysis by the Vvave E-1uation (Computer Procedure), 11 Report of the Texas Transportation Institute, Texas A&M University, May, 1962.
2. Samson, C. H., Hirsch, T. J., and Lowery, L. L., "Computer Study of Dynamic Behavior of Piling 1 " a paper presented to Third Conference on Electronic Computation, ASCE 1 Boulder 1
Colorado, June, 1963.
3. Hirsch, T. J. 1 "Stresses in Long Prestressed Concrete Piles During Driving, 11 Report of the Texas Transportation Institute, Texas A&M University, September, 1962.
4. Glanville, VV. H., Grime, G., Fox, E. N., and Davies, Vv. ¥.., "An Investigation of the Stresses in Reinforced Concrete Piles During Driving, 11 British Building Research Board Technical Paper No. 20, Dept. of Scientific and Industrial Research, His Majesty's Stationery Office, London, 1938 •
. 21
5. "Steel and Timber Pile Tests-'vvest il.tachafalaya Floodway- New Orleans, Texas anci Iviexico Railway," .P.merican Railway Engineering J\ssociation, Bulletin 489, September-October, 1950.
6. "Lelmag Liesel Pile Hammers-Technical Data," Goddard lviachinery Company, Inc. , Houston, Texas.
7. Rands, lvJorgens 1 "Test Performed with the Delmag Diesel Hammer, Type :G-12," Depto of Mechanical Engineering, University of Toronto 1 December 1 1955.
8. Smith, E. A. L., "Pilc-L'rivinr; ..':l..nulysis by the \·.'ave Equation," Journal of the Soil Iv,echanics .ar.6 i.'ouncaticns :Givision, i·roceedings of the Arr;er.ican Society of Civil Engineers, Volume 86, Number Slv1 4, pp. 35-61, August, 1960.
9. Hirsch, T. J., "Computer Study of Variables VVhich .ilffcct the Behavior of Concrete Piles During Driving," Report of the Texas Transportation Institute, Texas A&Ivj University, August, 1963.
10. Hirsch, T. J. 1 "Field Tests of Prestressed Concrete Piles During Driving," Report of the Texas Transportation Institute 1 Texas A&M University, August 1 1963.
11. Rand, Ivwrgens, "How the Diesel Pile Hammer \/:ork.s, " Roads and Streets, Iv.lay, 1961.
22
1:111
HEAD
~ ln" ~lr----·mp OF PlU: AS CAS'!
w~"·dt ."'-~1 :-,5 11 ----1 11 CHAMFER ---------
T
11-~. - 7/ 16'' 0 STRANDS
INITIAL PR~:STRESS FORCE "" 261.-,6 KLPS
FINAL PRESTRESS (2tY7, LOSS) = lBh .6 psi
AREA OF SECTION= 25R.4 ln. 2
'• MOMENT OF INERTIA OF SECTION • R<"d1.!l in.
WF:fCI\'1 OF rru: = 269 lh/ft
TEST PILES 1,2,3,4 a 5
FIGURE 1 CROSS -SECTION OF
12 - 7 /lh 11 ~ STRANDS
INITIAL PRESTRESS FORCE = 277 KIPS
FINAL PRESTRESS (21!'/, LOSS) • 713 psi.
ARf:A OF S~CTION = 254 ln, 2
1611
MOMENT OF lNf:RTlA OF SECTION • 5340 ln, 4
Wt:IC:IIT OF PILE = 265 lb/ft
TEST PILES 6a7
TEST PILES
POINT "--'15,fl'--,--------------------------l
GAGE 2
f-----" ""-Jc,n•------, ____ ,_n.-o-•-_.~+~-, -,-_,_-__ -__ -, __ -_-TE!~---_ P_I_L_E=S===I,=2~a-~-1_-3_~
I _ ,~.. _ .. , , _ ~.. I
~2.n• ~------·-,,-29,3'------::::J=-u,,7•·:::::J TEST PILE 4 ·I -· 2,0''---------------------------1-·
2.0· r 29.5' f-. 1
T~ST _____ -----26,n'-----
l,o• --+---·--- 5.5' --- -· " --·---- 6,5' ----·---4--- 6,5'·-·-----1--- 5.J'
GAGE l GAGE 2 r.ACE 3 GAC:E 4 GAGE 5
HEAD TEST PILES 6 a 7 POINT
FIGURE 2 SIDE VIEW OF TEST PILES
1-IAJ IAJ ~
z
% 1-Q. IAJ Q
10
I
J
;
..
ULTIMATE SHEAR STRENGTH OF SOl L IN KIPS PER LINEAR FOOT OF PILE
10 15 20
3.0 KIPS/FT - LOOSE SAND, FWE GRAIN WITH SHELLS
7.0 KIPS/FT - SILTY SAND, FINE GRAINED, ORGANIC
3.5 KIPS/FT -VERY SOFT CLAY, SILTY, ORGANIC·
1..-
4.5 KIPS/FT- SOFT CLAY, SILTY, ORGANIC
AVERAGE ANGLE OF
INTERNAL FRICTION :: 4 ° L..._
j 6.0 KIPS/FT- SOFT CLAY, SANDY, Wl'ni SHELLS
18.0 KIPS/FT
SAND, MEDIUM TO
COARSE, GRAVELY
TEST PILE 1,2, AND 3
FIGURE 3. ULTIMATE SHEAR
0 ,...-,
10
20 ..._____,
30
40
50
60
70
10 15 20
3.5 KIPS/FT- SILTY SAND, GRAY, ORGANIC WITH SHELL
VERY SOFT ClAY, SANDY, GRAY ORGANIC (MUCK)
5.0 KIPS/FT- SOFT CLAY, SILTY, GRAY, ORGANIC WITH CALCAREOUS NODULES
16.0 KIPS/FT -SAND, DENSE, GRAY, WITH SILT AND GRAVEL
80L-------------------------------------------~--------~ TEST PILE 4 AND 5
STRENGTH OF SOIL AT VARIOUS
10
15
20
25
30
10
2.31 KIPS/FT -(COHESION = 432 PSF)
SOFT IA.\l & LIGHT GRAY CL\Y WITH CAL.
:1ArERIAL
5.37 KIPS/FT -
(COHESION "' 1008 PSF)
FIRN RED-BROWN CLAY
9.20 KIPS/FT
(COHESION = 1728 PSF)
FIRN TAN CLAY
15
IWI'lli SMALL CAL. NODULES
5. 37 KIPS/FT
(COHESION = 1008 PSF)
STIFF TA.."' CLAY - SLICK
9.20 KIPS/FT t 1
rCOHESION = 1728 PSF)
JS STIFF TAN ClAY - SLIC3
TEST PILE 6 AND 7
DEPTHS IN GROUND
Free fall
1--2
1. The long cylinder (1) accommodates in its upper half the piston (2) and the impact block (3) in its lower part. The piston is the actual work. ing part, whereas the impact block rests on the pile to impart the energy, produced by the falling piston and the explosion, to the pile, The impact block also serves to seal off the combustion chamber at the lower end. To start the hammer the piston (2) is lilted and, when reach· ing a certain height, is auto· matically released. During the downward fall of the piston (2) a pump lever (6) on the fuel pump (4) is activated injecting a fixed amount of Diesel Fuel into the combustion chamber,
7
Blow plus Explosion
2. As the piston 12) continues Ia fall it closes the exhaust ports, compresses the remaining air in the cylinder and hils the concave ball pan of the im· pact block. The impact of the falling piston (2) atomizes the Diesel fuel lying in the ball pan, and the highly compres· sed air causes these atomized fuel particles Ia ignite. The combustion pressure thus created exerts an additional force onto the pile, which is already travelling downward under the compression force developed by the falling piston, and the blow from the piston further serves to throw the piston (2) up for the next working cycle.
Exhaust
3. As the piston clears the exhaust ports (9) in its upward motion the internal and ex· lerna I pressures are equalized.
Figure 4. Working Principle of Delmag Diesel Pile Hammers
Scavenging
10
4. As the piston continues its upward motion fresh air is drawn into the cylinder (10). which is thus being scaven· ged.
2000 B
E = SECANT MODULUS OF ELASTICITY I I E = SLOPE OF DOTTED LINE A-B
I E = 4o,ooo PSI I
e = COEFFICIENT OF RESTITUTION I I
e = JAREA UNDER CURVE DBC I I 1500 AREA UNDER CURVE ABC I r
e = 0.8 I I
I I
I I
I I
I H
I ~ I
~ 1000 I H
w I
f2 I p::; I , 8 w I
I I
I I I
I I I r
I I I
I 500 I I I
I I I I
I I I I
I I I I I I A
I D I c
0 I
0 .01 .02 .03 .Ol+ .05 .06 STRAIN IN IN./IN.
FIGURE 5. Typical static stress - strain curve for compressed green oak loaded perpendicular to its grain.
'
Figure 6. Delmag D-22 diesel hammer driving prestressed concrete pile.
Figure 7. used to length.
View of 95' pile leads drive piles up to 115' in
Figure 8. Recording oscillograph and strain gage amplifier unit recording strains from gages embedded in concrete piles during driving on Nueces Bay Causeway, near Corpus Christi, Texas.
,..
Figure 9o Oscillograph strc.in record from Test Pile 3. 18 in. square prestressed concrete pile 95 ft. long, pile penetration 45 fto in ground.
_, i 5 xllO ' IN/IN.
8 FSI
.J~--4 • i '" ' I " • f ~ -·* ---;...,-4-~~ I · >1 • t ... , .. J I sl k . I "I - [~~.,.,,.,#" ... , .. ., ""+" '"I I • "+ i- ·+ '"' t-
I . (
I . I p_;1cjo SJ!OON~ T~ L ~ ' ! I .
I
l ,
Figure 10. Oscillograph strain record from Test Pile. 18 in. square prestressed concrete pile 95 ft. long, pile penetration 74 ft. in ground.
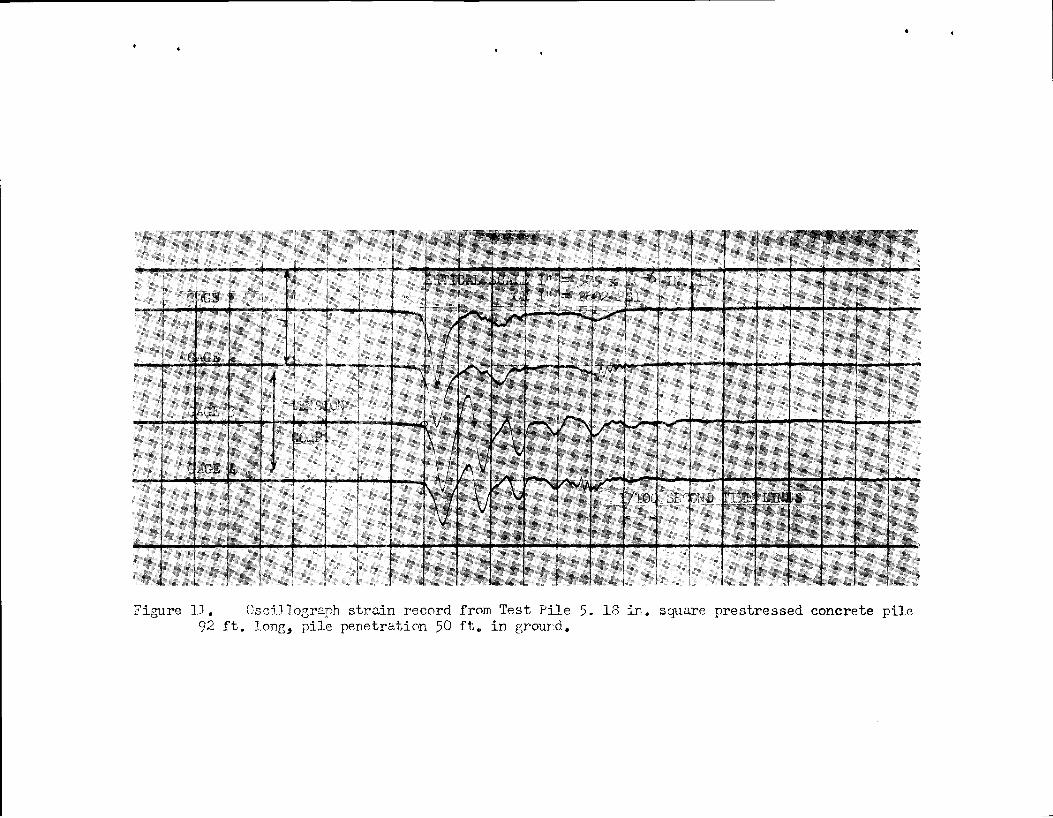
Figure ll. Cscillograph strain :r·ecord from Test Pile 5. 18 in. square prestressed concrete pile 92 ft. long, pile penetration 50 ft. in grourd.
VERTICLE scALE 1" = 200 x 10:...6 m. • 111 = 1500 "'
~-=~~''::~""f,~ :.. VERTICLE
G"GE; 5
,.~,- '~" _ , 1 _,_~ ,~., ~, •• L-.-·~~· ~~ Figure 12. Oscillograph strain record from Test Pile 7. 16 in. square prestressed
concrete pile 26 ft. long, pile penetration 19 ft. in ground.
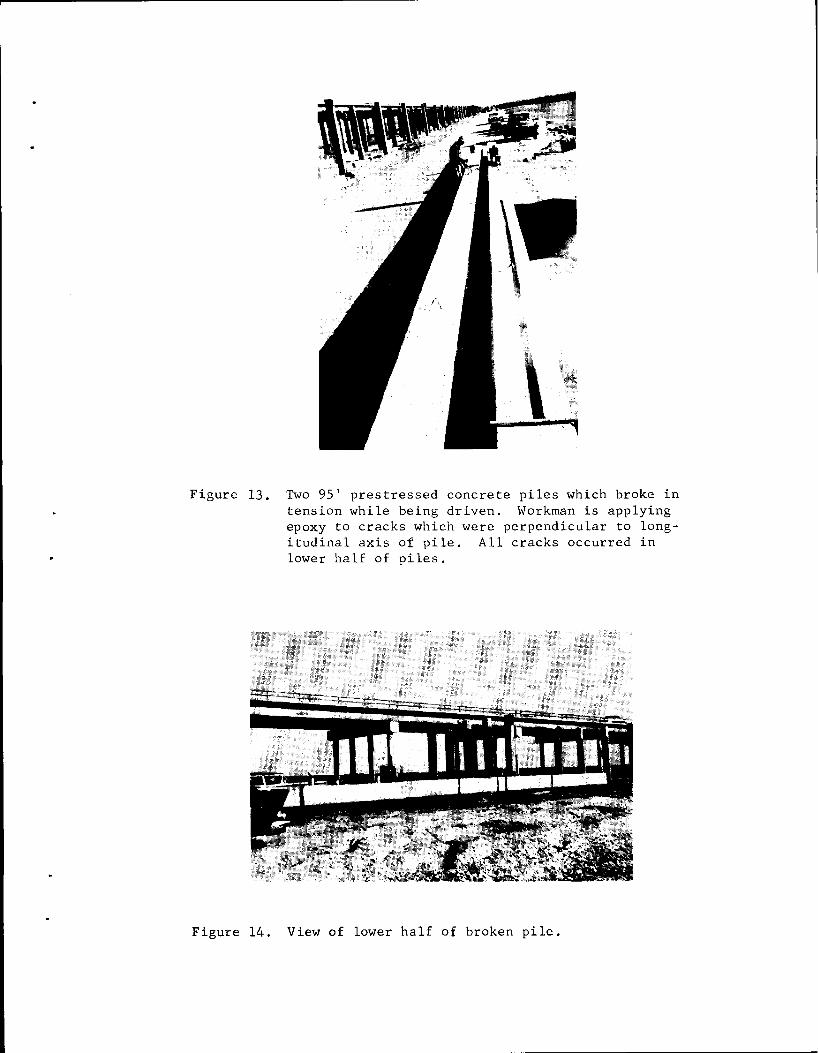
Figure 13. Two 95' prestressed concrete piles which broke in tension while being driven. Workman is applying epoxy to cracks which were perpendicular to longitudinal axis of pile. All cracks occurred in lower half of piles.
Figure 14. View of lower half of broken pile.
Falling Falling
l RAM
K(l)
J--- ANVIL ----------1
CAPBLOCK -----
K(4)
K(S)
K(6)
SIDE FRICTIONAL
'\ K(7) RESISTANCE I
'\
K(8)
K(9) ,,
~
~ Point
~
(a) Actual Pile (b) Idealized Pile
Figure 15. Method of idealizing a pile for purpose of analysis. This pile was divided into eight segments of equal lengths. Segment 1 is the ram, 2 is the anvil, 3 is the helmet, and 4 is the first segment of the pile.
2000 +---------+---------+---------+---------+---------+---------+-. ---- ----------~-- ---I I I I I I I I I I [ I I I I I I I I I I I I I I I 1 I I l I I I I I I I I I I I I l I I I I I I I I I I I I I I I I I I I I
1000 +---------+---------+---------+---------+---------+---------+-I I I I I I I I I I I I I I I I I I I I I I I I I I I I I I I I I I I I I I I I I I
s T R 8 s s
I I I I I I I I I I I I I I I I I I I I I *+4-------+---------+-••••···~·--------+---------+--------~· ' I ~
I N
0 p s I
I 1t I I~ I\ I I I I I \ I II I I I ( I J. I I I I I I 1 I I1 I I I C- -I l I I I I I I I I I a 1 I I I II I I
-1000 -I-- I I ! I I *\ I *'I -f +---- ----+--------L+----- ---+--------,+--------~+---------+ I - - . ,----- __ I_____ 1 I ---~------- \ -n·---- ----· -~
I I I f I I I i\ _ _,1 I J I I I I I ~. 1 I I I I I I I '-...!,' I I ~-. ---- ----T- I __________ I ___ - -- I . ... .. I 1
I I I I I I - ---- ----------------------·----·-·· --------1 I I 1 I I I I I I
-2000 I \ I I I +------- ~ea-s~ss-------+---------+ I I I I I I I I I I I I I I I I I \ I I I I I \I I I I I -.I I I I I 4 I I I I
-3000 I 1-tl* 1 I I I I I +---------+-~~4-----+---------+---------+---------+---------+ 0 20 40 60 80
Tllv!E IN l0-4 SECONDS 120 100
FIGURE 16. Stress at Pile Head vs Time Test Pile 7, 19 ft. Penetration in ground.
s T R E s s
I N
0 40 60 TIME IN 10-4 SECONDS
80 20
F'IGURE 17. Stress at Mid-Length of Pile .Y]. Time Test Pile 7, 19 ft. Penetration in Ground
100 120
•
s T R E s s
I N
p
s I
2000 +---------+---------+---------+---------+---------+---------+ T I I I I I I I I I I I I I I I I I I I I I I I I I I I T I T I I I T I I I I I I I I I I I I I I I I I I I I I I I I I I I I
1000 +---------+---------+---------+---------+---------+---------+ I I I I I I I I I I I I I I I I I 1i I I I I I I I /' I I I I I I I I \ I I ,, I I J I I 1 \ I If\ I I I I** I If\ I I I I \ 1/"\ I / I I I I I * *"* * I I I
o ~-------+r,------- -r--r- --~----\1-\-+r. I \ rl *\ I I II \ I, T , I * /t -!M!-\ *, rf \
' r ~ :i \ \ /r IJ *\ 11 I 1 *I I I 1 II , r/ \/ I I I I
-1000 r- 1-----f: ------~~------:--r---------f---------r---------f I\ I I I I I I\ I I I I I I I I I I I I I\ I I I r I I I I I I I I I I I I I I t I I I I I T I I I I I
-2000 +---T I T I I I I I I
--+---------+---------+---------+---------+---------+ I I I I I I I \ I I I I I I 1 * I I I I I
I I LEGEND I 1 I I I I I I I I ---- Cqm:puted StrelJS I
I I MEiasured Stress I I I I I I I I I I I
-3000 +---------+---------+---------+---------+---------+---------+ 0 60 120 180 240 300 360
FIGURE 18.
TIME IN 10-4 SECONDS
VS Stress in Pile Head -- Time
Test Pile 3, 45' Penetration in Ground
•
s T R E s s
I N
p
s I
2000 +---------+---------+---------+---------+---------+-~-------+
0
I l I I I I l I I I I I l 1 I I I I 1 I I I I I I 1 I I I I 1 I I I I I I I I I I I I I I I I I I I I I I I I I I l
* .,/\ I \
* \ I *"'* \ I ' *I * 'J \
-1000 + -----I I I I I I I I I
I I T
I I I I I I
* I * \ I I \ 1 I \ I
\ I * \r/ *
I 1 I I I I I
I I
LEGEN:p I --- "t Computed Stress _ ___. Measured Stress
I I 1 l
-3000 +---------+---------+---------+---------+---------+---------+ o 6o 120 180 24o 300 360
TIME IN 10-4 SECONDS
FIGURE 19 . Stress at Mid-Length of Pile ~ Time
Test Pile 3, 45' Penetration in Ground
•
1.0
:::) ~ o.s 0
~
~ 0.6 E-<
~ ~ 0.4 u ~ ....:l 0... ~ 0.2 0
•
----_Computed -----Measured
0 • 0 J <2cf= 40 6'o 8o 1do 1do 14o 16'o 1do 2do tio 240 26b 2so 3o'o 320
TDE IN lo-4 SECONDS
Figure 20. Displacement of pile head vs time Test Pile 7, 19 ft. penetration in the ground.
_,, _,,
20 ,, ~ 10
c '0 20 c
~-l
~ !ll-3
~ ~ ~
• "' ~ "' ~-)
~ g., ~ ~
8 5 ~ i'i l1
>'> ~-1
a a 20 ENERGY (KIP FE>:T) 40 50 60 20 ENERGY _(K_IP FEET) 40 50 60
~
c ~ 0 c
~
~ ~
~ ~ 20 ~
~ ~+1 ~+1 20
10
~ " ... ~
~ 10
RAM WEIGHT IN KIPS
~ ~+2 ~+2
IN KIPS
+l
3. OAK CUSHION g• OAK CUSHION
-6 10
Dl HI.M
-5 20
-4
ti E = 5 X 10⁶ PSI .::: o>-3
IN KIFS PILE !\REA • 200 S1. IN.
~ !;; DEl'S I TY • 150 PCF
"' ~ r ~-2
~ ;;, C;, "'
~ ~-1 rtu( TOT,!,) : 196,1 KIPS
20 ENERGY (KIP FEET) 40 50 60
go "' ~ ~
~1 z "' ....
~ 21l
>'> ~+2
10
,. OAK CUSHION .. +3
FIGURE 21. EFFECT OF CUSHION STIFFNESS ON PILE STRESSES
-4
;;:-3 g
20 ENERGY (KIP FEET) 40 50 6o
~ or-~---+------+-----~------~---===~:===~
~ w = +1
ffi 1-
;!; ~
~ +2
_,
20
\0
RAM WEIGHT IN KIPS
112 POINT 8 1/2 FRICTION
20 ENERGY (KIP FEET) 40 50 60
§ 0~~---+------~------~----~------~----~ ~
~ 20
10
IN KIPS
+l
FRICTION
-4
20 ENERGY (KIP FEET) 40 50 6o
~ of-~:======:=-~====~~==~~=====-~-----1 ~ ~ 5 10
RAM WEIGHT IN KIPS
_J+l ~~ ~ 2 i:i 1-
~ ~+2
NOTE: NO TENSilE STRESS WHEN USING THE 20 KIP RAM
AP.EA & 200 SQ. IN. DENSITY • 150 PCF.
D RAM
Ru(TOTAL) : 196.1 KIPS
POINl
POINT
E : 5 X 10⁶ PSI
CUSitl ON :: 3" OAK
0.5 POINT ~ 0.5 FRICTION FRICTION
FIGURE 22. EFFECT OF DISTRIBUTION OF SOILS RESISTANCE ON PILE STRESS!: