Embed Size (px)
Citation preview
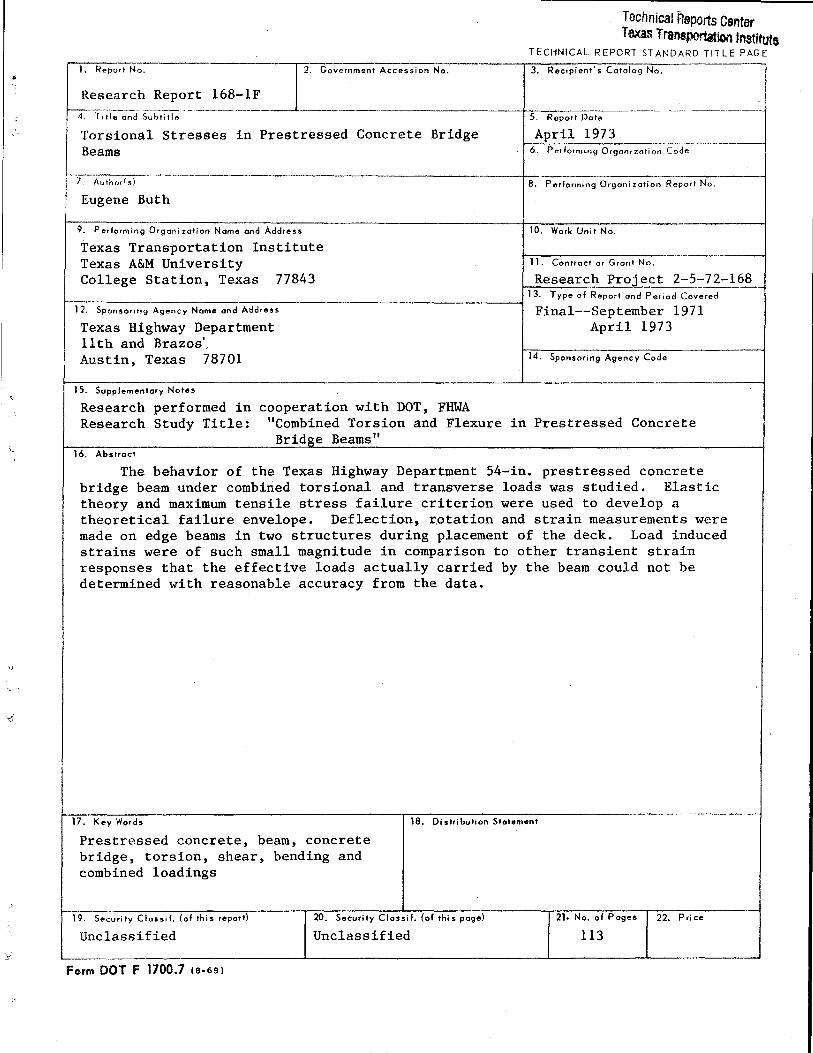
1. Report No. 2. Government Accession No.
Research Report 168-1F
Technical Reports Center Texas Transportation Institute
TECHNICAL REPORT STANDARD TITLE PAGE
3. Recipient's Catalog No.
~-Ti!t;-.;;:;d S~h~it~ .. ---·------ ----------------------+-5,..._---R-e-po_r_t .,.D-ot-e ------ --------·-
Torsional Stresses in Prestressed Concrete Bridge Beams
April 1973 ~- . ---------~
6. Performing Organization Code
- 7 · Auth~-rt:;j"' .. --- ·-·---·--------------------------------1-8-. P erformin~ Organization R_e_p_o-rt..,-N.,..o-. ----t
Eugene Buth
9. Performing Organization Nome and Address
Texas Transportation Institute Texas A&M University College Station, Texas 77843
10. Work Unit No.
11. Contract or Grant No.
Research Proiect 2-5-72-168 !-:-:--::-------------------------------~ 13. Type of Report and Period Covered
12. Sponsoring Agency Name and Address Final--September 1971 Texas Highway Department April 1973 11th and Brazos'. Austin, Texas 78701
15. Supplementary Notes
Research performed in Research Study Title:
16. Abstract
cooperation with DOT, FHWA "Combined Torsion and Flexure Bridge Beams"
14. Sponsoring Agency Code
in Prestressed Concrete
The behavior of the Texas Highway Department 54-in. prestressed concrete bridge beam under combined torsional and transverse loads was studied. Elastic theory and maximum tensile stress failure criterion were used to develop a theoretical failure envelope. Deflection, r.otation and strain measurements were made on edge beams in two structures during placement of the deck. Load induced strains were of such small magnitude in comparison to other transient strain responses that the effective loads actually carried by the beam could not be determined with reasonable accuracy from the data.
f-:-::----...,--------------------r--::----------------------·-·-----17. Key Words 18. Distribution Statement
Prestressed concrete, beam, concrete bridge, torsion, shear, bending and combined loadings
19. Security Classil. (of this report)
Unclassified 20. Security Classif. (of this page)
Unclassified 21. No. of Pages 22. Price
113 ... .___ ________________ _._ _______________ --.J ______ _._ ______ ___J
Form DOT F 1700.7 ts·691

TORSIONAL STRESSES IN PRESTRESSED CONCRETE BRIDGE BEAMS ' '
Eugene Buth Assistant Research Engineer
Research Report 168-lF
Combined Torsion and Flexure in Prestressed Concrete Bridge Beams
Research Project 2-5-72-168
Sponsored by
The Texas Highway Department in Cooperation with I
The u.s. Department of Transportation Federal,Highway Administration
April 1973
Texas Transportation Institute Texas A&M University
College Station, Texas
•
l
TABLE OF CONTENTS
ACKNOWLEDGMENTS
ABSTRACT
SUMMARY
IMPLEMENTATION STATEMENT
INTRODUCTION
BACKGROUND AND REVIEW OF LITERATURE
The Problem Failure Criteria Torque-stress Relationship Behavior of Sections Subjected to Pure Torque
Plain Rectangular Cross Section Reinforced Rectangular Cross Section Concentrically Prestressed Rectangular Cross Section Eccentrically Prestressed Rectangular Cross Section Eccentrically Prestressed I Cross Section
Combined Loadings
THEORY FOR TEXAS HIGHWAY DEPARTMENT 54-in. BEAM
EXPERIMENTAL PROGRAM
General Test Beams Deflection and Rotation Gages Strain Gages Results and Discussion
SUMMARY AND CONCLUSIONS
RECOMMENDATIONS
NOTATION
REFERENCES
APPENDIX
page
i
ii
iii
iv
1
2 2 5
6 8
11 13 15 16
19
30 30 31 31 37
45
47
48
50
51
;_.
J ,,
·'-.-'
v
\..

ACKNOWLEDGMENTS
The information contained in this report was developed on a
cooperative research study sponsored jointly by the Texas Highway
Department and the Federal Highway Administration. Liaison was
maintained through Mr. Charles Covill, contact representative for
the Texas Highway Department.
The contents of this report reflect the views of the author
who is responsible for the facts and the accuracy of the data presented
herein. The contents do not necessarily reflect the official views
or policies of the Federal Highway Administration. This report
does not constitt1te a standard, si>ecification or regulation.
i

ABSTRACT
The behavior of the Texas Highway Department 54-in. prestressed
concrete bridge beam under combined torsional and transverse loads was
studied. Elastic theory and maximum tensile stress failure criterion
were used to develop a theoretical failure 'envelope. Deflection, rotation
and strain measurements were made on edge beams in two structures during
placement of the deck. Load induced strains were of such small magnitude
in comparison to other transient strain responses that the effective loads
actually carried by the beam could not be determined with reasonable
accuracy from the data.
Key words: Prestressed concrete, beam, concrete bridge, torsion, shear,
bending and combined loadings.
ii
SUMMARY
The behavior of the Texas Highway Department 54-in. prestressed
bridge beam under combined torsional and bending loads was studied.
Reported research on concrete members of various cross sections
was used-to develop theoretical predictions of the behavior of the
THD 54-in. beam. An interaction surface diagram for this beam was
developed. The diagram describes the three-way interactiOn between
bending moment, shear and torque. The occurrence of initial cracking
in the concrete was considered to constitute failure and the interaction
diagram was developed by determining the various_ combined loadings
required to produce a principal tensile stress equal to the tensile
strength of the concrete.
Edge beams in two structures under construction were instrumented
to determine deflections, rotations, and strains occurring during
forming operations and deck placement. Load induced strains were
comparable in magnitude to those produced by environmental effects
and difficulty was experienced in obtaining meaningful data.
iii
IMPLEMENTATION STATEMENT
A theoretical study of combined torsional and flexural stresses
in THD 54-in. beams and an attempt to provide experimental data on
this subject are reported. The theoretical interaction surface that
is reported includes the effects of torsion, shear, and bending. It
can be used to predict the combinations of these three types of loading
that will cause cracking in the concrete.
Two 54-in. beams in a bridge under const:tuction were instrumented
with strain, deflection, and rotation gages to determine values of
these parameters that occur during construction under actual·coriditions
in the field. Although the strain readings did not indicate any
excessively large values, they were not such that they could be used
to accurately validate the theory. The strains measured do not indicate
that any changes in the present design and construction practices are
warranted.
The behavior of prestressed beams subjected to combined loadings
should be more thoroughly verified before significant design considerations
are based on the theory that is presented.
iv
INTRODUCTION
In an earlier study (l), two 5Q-ft lorig, Type B beams were tested
to failure in the torsional mode to determine the torsional stresses
produced under conditions of a torque applied at each end and to
determine the torque which would produce cracking in the concrete.
The results of these two tests were presented and compared with elastic
theory in an attempt to establish a procedure for analytically
determining the value of a torque to produce cracking (!)· This report presents the results of a study of the behavior of
the Texas Highway Department 54-in. prestressed concrete bridge
beam when subjected to combined torsional and transverse loads. In
the present study, literature is reviewed and examined with the objective
of selecting the most appropriate method of analysis and failure
criterion for THD 54-in. prestressed beams. Elastic theory and the
maximum tensile stress failure criterion are used to develop a theoretical
failure envelope for this beam.
Field measurements were made to determine the magnitude of torsional
stresses that are actually developed in edge beams·under conventional
construction procedures and to obtain an estimate of the margin of
safety against cracking. Edge beams in two structures were instrumented
to determine deflections, rotations, and strains that occurred during
construction.
1

BACKGROUND AND REVIEW OF LITERATURE
The Problem
In recent years, a significant amount of research has been
devoted to the subject of torsion in concrete members. Most of
this work has been devoted to plain and reinforced concrete subjected
to either pure torsion or combined torsion and bending with little
effort being devoted to prestressed concrete members.
The problem of analysis and/or design of a concrete member
under a generalized loading including bending and torsion can be
grouped into the following major divisions.
(1) The selection or establishment of design loads which
represent the expected service loads,
(2) The computation of internal stresses resulting from the
design loads, and
(3) A reliable failure criterion with which to compare the
values of internal stresses.
These three items cannot be approached independently, because
of the influence of one upon the other. The particular failure
criterion that is employed dictates the kinds of internal stresses
that are computed and the manner in which they are computed.
Failure Criteria
The first step in the development or establishment of a failure
criterion is to define failure. In concrete members, two general
concepts of failure are of interest. The first concept involves
initial cracking of the concrete and the second involves the ultimate
load that the member may carry. In this study of THD 54-in. pre
stressed concrete bridge beams, the occurrence of cracking in the
concrete is of greatest interest and the subject is approached with
the intent of searching for a failure criterion to reliably predict
the occurrence of cracking in the concrete.
2
,,
A number of failure cr.Lteri.a have been proposed for concrete
members subjected to combined loadings (~_) but there is no general
acceptance among engineers of any one of them, excluding all others.
Various criteria appear to be more reliable than others for a given
type of member and again certain criteria appean to be more suitable
for certain combinations of loadings than they are for other combinations.
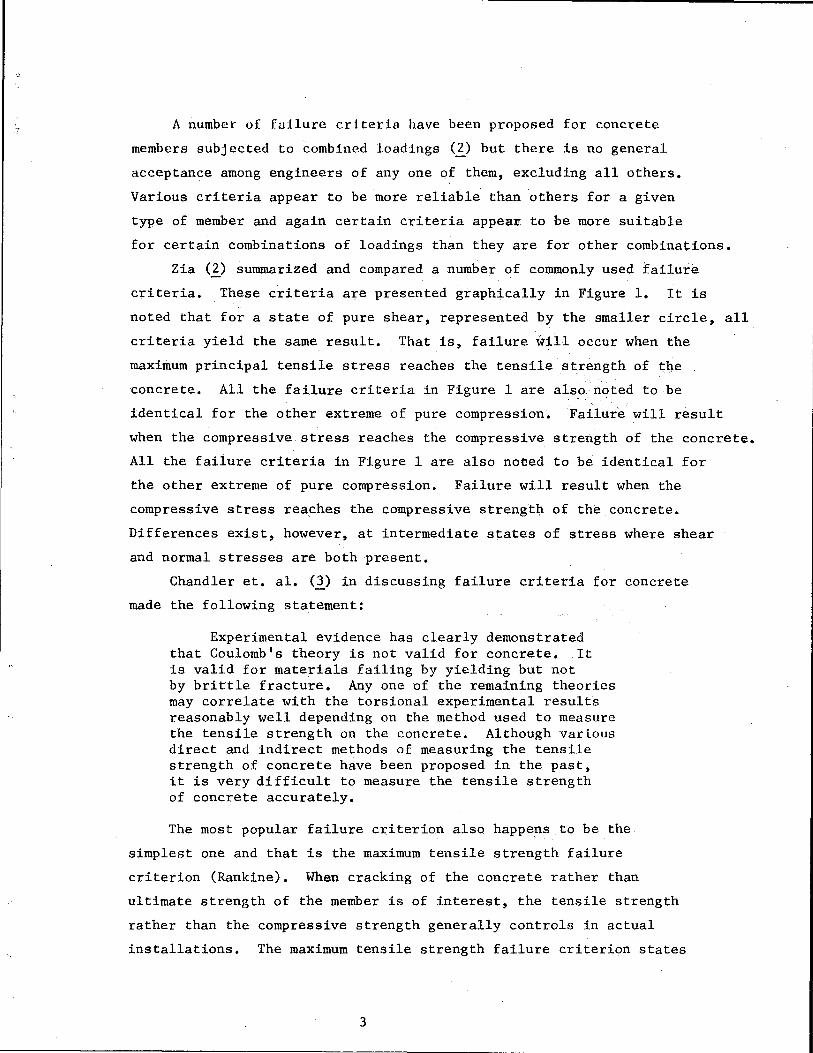
Zia (~_) summarized and compared a number of commonly used failure
criteria. These criteria are presented graphically in Figure 1. It is
noted that for a state of pure shear, represented by the smaller circle, all
criteria yield the same result. That is, failure will occur when the
maximum principal tensile stress reaches the tensile strength of the
concrete. All the failure criteria in Figure 1 are als_o noted to be
identical for the other extreme of pure compression. Failure will result
when the compressive stress reaches the compressive strength of the concrete.
All the faiiure criteria in Figure 1 are also nobed to be identical for
the other extreme of pure compression. Failure will result when the
compressive stress reaches the compressive strength of the concrete.
Differences exist, however, at intermediate states of stress where shear
and normal stresses are both present.
Chandler et. al. (l) in discussing failure criteria for concrete
made the following statement:
Experimental evidence has clearly demonstrated that Coulomb's theory is not valid for concrete. It is valid for materials failing by yielding but not by brittle fracture. Any one of the remaining theories may correlate with the torsional experimental results reasonably well depending on the method used to measure the tensile strength on the concrete. Although various direct and indirect methods of measuring the tensile strength of concrete have been proposed in the past, it is very difficult to measure the tensile strength of concrete accurately.
The most popular failure criterion also happens to be the
simplest one and that is the maximum tensile strength failure
criterion (Rankine). When cracking of the concrete rather than
ultimate strength of the member is of interest, the tensile strength
rather than the compressive strength generally controls in actual
installations. The maximum tensile strength failure criterion states
3
RANKINE a COWAN
MODIFIED COWAN
f' t
T COULOMB
/RANKINE
Figure 1. Failure theories for concrete under combined stress. After Zia (l).
4
-----------------------------------------------------------------------
that failure will occur when the principal tensile stress at any
point reaches the tensile strength of the concrete. The effects
of other normal and shear stresses at the point are included only
through their influence on the principal tensile stress. A reasonable
amount of success in comparisons between this theory and experimental
results has been demonstrated by researchers.
If one accepts the maximum tensile stress failure criterion,
the only problems .that reniain are to predict the tensile strength
of the concrete and to determine the appropriate relationship
between externally applied torque and internal stress. Once the
latter problem is solved and the appropriate torque-stress relationship
determined, prediction of the tensile strength of the concrete is
relatively simple. An appropriate measure of the tensile strength
that will bring the theory in line with experimental results,
perhaps with some degree of conservatism, can be chosen.
Torque-Stress Relationships
The fact that concrete is neither perfectly elastic or perfectly
plastic but somewhere in between has resulted in difficulty in
establishing appropiate torque-stress relationships for various
shapes of members. The problem is further complicated by the influence
of concrete strength on the degree of plasticity that is exhibited.
Proposed torque-stress relationships have been based on elastic
theory, plastic theory, and on combinations of the two theories.
However, it is generally agreed that elastic theory is more reliable
for higher strength concrete such as is used in prestressed beams
and plastic theory is more reliable for lower strength concrete.
Hsu (~) in his study of plain concrete rectangular sections
subjected to pure torsion deviated from the classical theoretical
approach and developed a theory based on skew-bending behavior.
The expression for ultimate torque from skew-bending theory does
not contain a shape factor and is identical to that for classical
theory when y/x-oo, that is:
T b 2h = -3-ft u
5
(1)
Where:
T ultimate torque for the section. u
b,h length of shorter and longer sides of the cross section, respectively.
ft tensile strength of the concrete.
However, in Saint-Venant's equation, Hsu uses values obtained
from direct tensile strength tests as the ultimate tensile strength
of the concrete. In the skew-bending equation, he uses an adjusted
value of modulus of rupture as the ultimate tensile strength. Hsu
discounts the application of Saint-Venant's theory to concrete members
in favor of the skew-bending theory on the basis of these comparisons.
The author does not agree with this conclusion. The two theories are
fundamentally the same. The real question is not a comparison of
theories, but the appropriate choice of the value of ultimate tensile
strength of the concrete.
It is appropriate at this point to review and develop information
describing the behavior of concrete members with less complex cross
sections before discussing the behavior of the THD 54-in. prestressed
beam. The following sections are included for that purpose.
Behavior of Sections Subjected to Pure Torque
Plain rectangular cross section: For a rectangul~r cross section,
the torque-stress relationship from Saint-Venant's elastic theory is
(_~):
T
Where:
2 =a:bhT
T the torque, in-lbs.
b length of shorter side of cross section, in.
h length of longer side of cross section, in.
T the maximum torsional shear stress (occurs on outer surface at the mid point of the longer side), psi.
~ a constant whose value depends on the ratio of b/h.
6
(2)
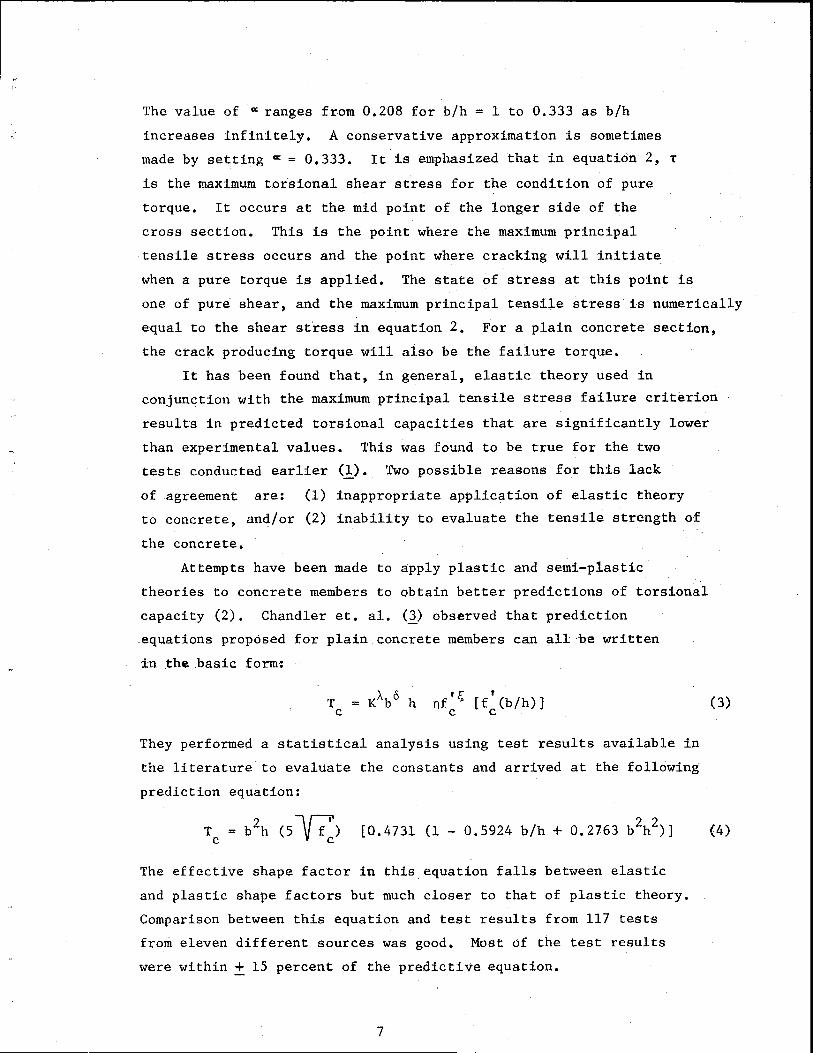
The value of «ranges from 0.208 for b/h = 1 to 0.333 as b/h
increases infinitely. A conservative approximation is sometimes
made by setting ~ = 0.333. It is emphasized that in equation 2, T
is the maximum torsional shear stress for the condition of pure
torque. It occurs at the mid point of the longer side of the
cross section. This is the point where the maximum principal
tensile stress occurs and the point where cracking will initiate
when a pure torque is applied. The state of stress at this point is
one of pure· shear, and the maximum principal tensile stress is numerically
equal to the shear st'ress in equation 2. For a plain concrete section,
the crack producing torque will also be the failure torque.
It has been found that, in general, elastic theory used in
conjunction with the maximum principal tensile stress failure criterion
results in predicted torsional capacities that are significantly lower
than experimental values. This was found to be true for the two
tests conducted earlier (1). Two possible reasons for this lack
of agreement are: (1) inappropriate application of elastic theory
to concrete, and/or (2) inability to evaluate the tensile strength of
the concrete.
Attempts have been made to apply plastic and semi-plastic
theories to concrete members to obtain better predictions of torsional
capacity (2). Chandler et. al. (1) observed that prediction
.equations proposed for plain concrete members can all be written
in the basic form!
t t,; ' nf [f (b/h)] c c
They performed a statistical analysis using test results available in
the literature to evaluate the constants and arrived at the following
prediction equation:
(3)
T = b2h (5 \r;r) [0.4731 (1 - 0.5924 b/h + 0.2763 b2
h2)] (4) c V tc
The effective shape factor in this equation falls between elastic
and plastic shape factors but much closer to that of plastic theory.
Comparison between this equation and test results from 117 tests
from eleven different sources was good. Most of the test results
were within + 15 percent of the predictive equation.
7
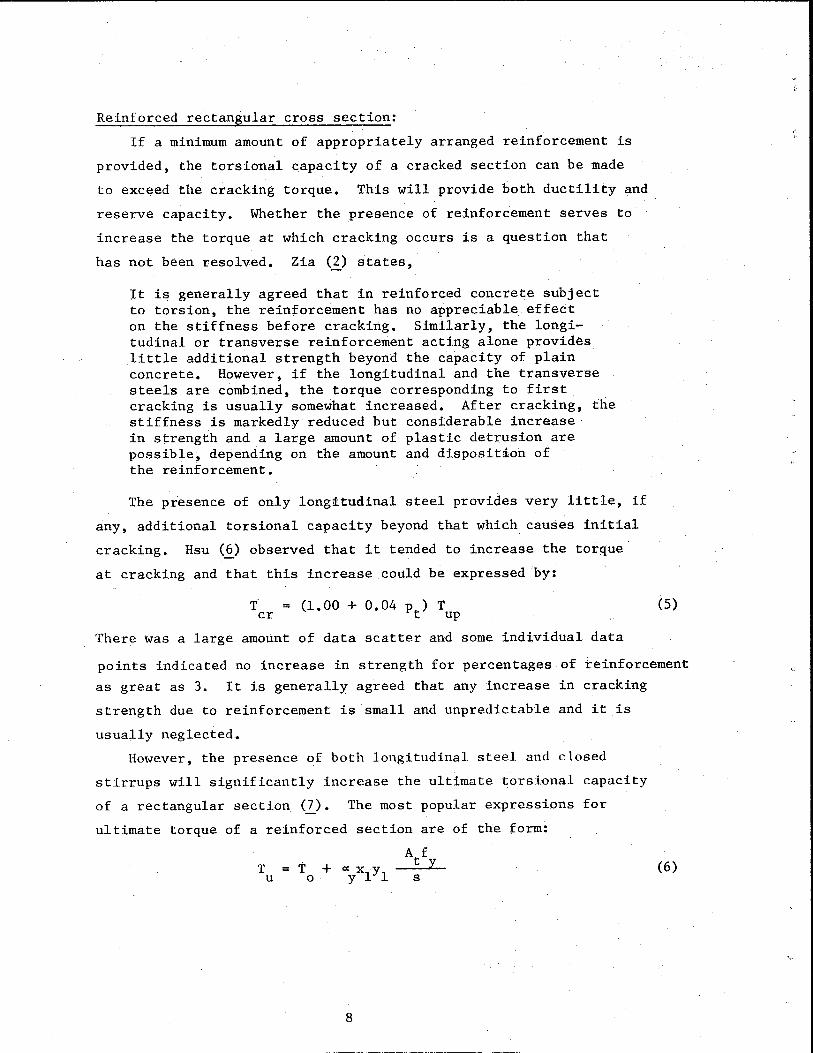
Reinforced rectangular cross section:
If a minimum amount of appropriately arranged reinforcement is
provided, the torsional capacity of a cracked section can be made
to exceed the cracking torque. This will provide both ductility and
reserve capacity. Whether the presence of reinforcement serves to
increase the torque at which cracking occurs is a question that
has not been resolved. Zia (~) states,
lt is generally agreed that in reinforced concrete subject to torsion, the reinforcement has no appreciable effect on the stiffness before cracking. Similarly, the longitudinal or transverse reinforcement acting alone provides little additional strength beyond the capacity of plain concrete. However, if the longitudinal and the transverse steels are combined, the torque corresponding to first cracking is usually somewhat increased. After cracking, the stiffness is markedly reduced but considerable increase in strength and a large amount of plastic detrusion are possible, depending on the amount and disposition of the reinforcement.
The presence of only longitudinal steel provides very little, if
any, additional torsional capacity beyond that which_ causes initial
cracking. Hsu (~) observed that it tended to increase the torque
at cracking and that this increase .could be expressed by:
i = (1.00 + 0.04 p ) T cr t up
There was a large amount of data scatter and some individual data
(5)
points indicated no increase in strength for percentages of reinforcement
as great as 3. It is generally agreed that any increase in cracking
strength due to reinforcement is small and unpredictable and it is
usually neglected.
However, the presence of both longitudinal steel and closed
stirrups will significantly increase the ultimate torsional capacity
of a rectangular section CI). The most popular expressions for
ultimate torque of a reinforced section are of the form:
8
A f t y s
---------------------------------------
(6)

Where:
T ultimate torque of the reinforced section. u
T 0
0:
t
= in general, the contribution of the concrete to the torsional strength. Its value depends on the theory used. This parameter is discussed below.
= a factor or constant expressing the influence of reinforcement on the strength. Its value depends on the theory used. This parameter is discussed below.
=
smaller center-to-center dimension of the closed rectangular stirrup.
latger center-to-center dimension of the closed rectangular stirrup.
A cross sectional area of one leg of the stirrup. t
f yield strength of stirrups. y
s spacing of stirrups.
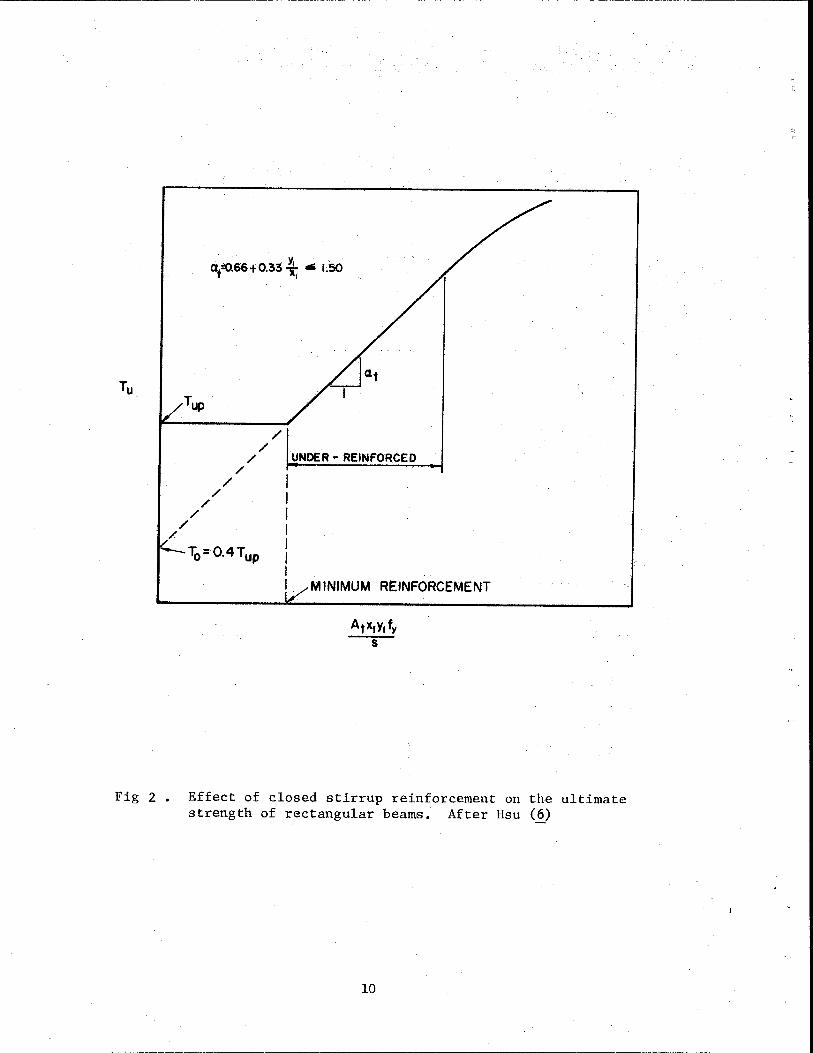
The qualitative influence of reinforcement in the form of
closed stirrups accompanied by the required amount of longitudinal
steel is shown in Figure 2 • The horizontal portion of the curve
represents the ultimate torque (same as cracking torque) of an
unreinforced section. A certain amount of reinforcement is required
before any increase in torsional strength can be realized, although
reinforcement in lesser amounts will provide some ductility. The
straight line sloping portion of the relationship gives the influence
pf reinforcement in the. range where under-rein~orced failures occur.
The intercept of this line extended back to the torque axis gives
T in Equation 6. In ACI 318-71, Vtc is limited to 2.4~ and 0
according to Hsu (l), T0 = 0.4 Tup• This implies that the accepted
tensile strength of the concrete is 5:i ~or 6 ~ • The slope of the line is expressed by:
0.66 + 0.33 Yl ~ 1.50 xl
9
(7)
Tup
/ /
/ /
/
/ /
/ /
/ UNDER- REINFORCED
MINIMUM REINFORCEMENT
Fig 2 • Effect of closed stirrup reinforcement on the ultimate strength of rectangular beams. After Hsu (_~)
10
-~---------------------------------------
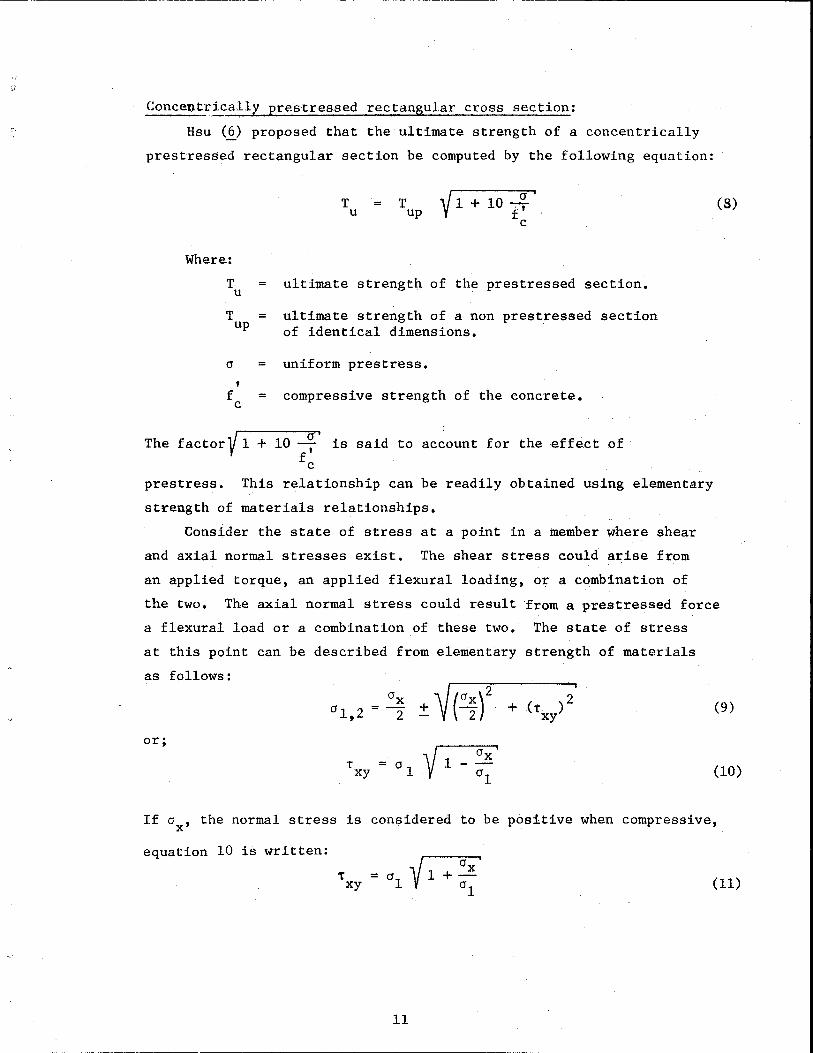
Concen.t_:cj-cally prestressed rectangular cross section:
Hsu (~) proposed that the ultimate strength of a concentrically
prestressed rectangular section be computed by the following equation:
V a' T = T 1 + 10 -.-,
u up f · c
Where:
T ultimate strength of the prestressed section. u
T = up ultimate strength of a non prestressed section of identical dimensions.
a uniform prestress.
' f compressive strength of the concrete. c
The factor,/ 1 + 10 a' is said to account for the effect of v f' c
prestress. This relationship can be readily obtained using elementary
st~ength of materials relationships.
Consider the state. of stress at a point in a member where shear
and axial normal stresses exist. The shear stress could arise from
an applied torque, an applied flexural loading, or a combination of
(8)
the two. The axial normal stress could result from a prestressed force
a flexural load or a combination of these two. The state of stress
at this point can be
as follows:
or;
described from elementary
CJX + ~ r~)2 + CJ 1 2 =
' 2
T xy = 01
strength of materials
( 't ) 2 xy
(9)
(10)
If a , the normal stress is considered to be positive when compressive, X
equation 10 is written:
t = al i /1 + CJX' xy V a1
(11)
11

The maximum principal tensile stress, a 1 , was approximated by Hsu
(_§) as f~/10 and in this case equation 11 becomes:
T = fc' /10 xy y 1 + 10 ~· c
If Txy is considered to be produced by a torque only, then for a
rectangular section (or one made up of a number of rectangles)
the expression for the ultimate torsional capacity may be written:
2 '/ a ' T = ~ f~_ 1 + 10 -:cf u 3 10 fc
This equation governs as long as the failure is tensile. There
exists a limiting value of prestress, ax, above which the mode
of failure changes from tensile to compressive in nature. Equation
13 is not valid for members having a prestress above this limiting
value. This value can be determined theoretically by determining
(12)
(13)
the value of ax in Equation 9 that ·will caus.e the principal compressive
stress to reach the compressive strength of the concrete before
th~ principal tensile stress reaches the tensile strength bf th~ concrete.
This operation requires the use of a relationship between the tensile
and compressive strength of the concrete. Many such relationships
of the form f~ · C 1.{ff with various values of C have been proposed.
If f~ is chosen to be 5 ~ as has been suggested by some authors,
the limiting value of prestress that will cause the mode of failure
to change from tensile to compressive will .depend on the stren·gth
of the concrete but is about 0. 9"Vf!;. Zia (_~) states that the
limiting value is between 0. 46~ and 0. 9Y£';. Many authors discount
the possibility of a compressive failure by noting that prestress is
normally less than the limiting values. While this is generally true
for a prestressed beam subjected to a pure torque, an applied bending
moment produces normal stresses that wiil add to the prestress in
certain portions of the cross section and thereby create the conditions
necessary for a compressive mode of failure. This condition is very
probable when a relatively large bending moment exists in combined
bending and torsional loads and should not be overlooked.
12
·~ ...

Eccentrically Prestressed Rectangular Cross Section:
A total of 71 rectangular beams were tested and evaluated
by Chandler, Kemp and Wilhelm(!). The experiment included post
tensioned beams both with and without conventional reinforcement
and pretensioned reinforced beams with and without eccentricity of
prestressing. The observed behavior of these tests verified a number
of phenomena predicted by classical theory as indicated by the
following statements (1):
The cracking initiated in all the test specimens at the center of the longer side. Plain prestressed beams failed suddenly at the formation of this first crack and the failure was explosive in nature due to compressive action of the prestressing force. The crack was inclined to the longitudinal axis of the beam at an angle which was always less than 45° to the horizontal. The angle of inclination of the crack was a function of degree of prestress and- became flatter with increasing degree of prestress. This inclined crack developed in the shape of a helix on the two short sides and one of the longer sides but the helix was unable to develop on the second longer side. The direction of the crack on the second longer side was dictated by the extremities of the helical crack on the other three sides.
Prestressed specimens that were reinforced in the longitudinal
direction only failed in a brittle manner in;mediately after initial
cracking. Longitudinal reinforcement did not appear to influence
the torque at which initial cracking occurred.
They found that prestressing did not affect the torsional
stiffness of the beams. Results of the two tests conducted in Study
150 also indicated this to be true (l).
The concentrically and eccentrically prestressed beams tested
by Chandler et al: behaved alike (1). No difference was found in
the cracking strength and the ultimate strength of these specimens.
No significant difference in torsional stiffness and strength
between pretensioned and post-tensioned beams was indicated. It
should be noted that all specimens were of rectangular cross
section and that initial cracking occurred at the middle of the
longer side. It is further noted that eccentricity was less than the
kern limit in all eases.
13

Classical elastic theory predicts that cracking should initiate
at the middle of the longer side of a plain rectangular section. As
an increasing amount of concentric prestressing is added up to
a certain limit, the location of initial cracking will remain at
the middle of the longer side, but an increasing amount of torque
will be required to cause cracking. As the eccentricity of prestress
(along the longer axis of the cross section) is increased, no effect
on torsional behavior is predicted until a certain value of eccentricity
is reached. This value is. that which will cause the location of
the critically stressed point to change from the middle of the longer
side to the middle of_the shorter side with the lesser prestress.
The magnitude of the torsional shearing stress at. the middle
of the shorter side may be related to that at the middle of the longer
side by the approximate relationship (a).
Where:
=
'A =
b
h =
torsional shear stress at the middle of the shorter side, psi
torsional shear stress at the middle of the longer side, psi
length of the shorter side, in.
length of the longer side, in.
For Chandler's 4 x 12 in. and 4 x 9 in. cross sections, this equation
becomes 'B = 1/3 'A and 'B = 4/9 'A respectively. Equation 13 is
applicable to both points on the cross section if the appropriate
value of prestress, op, is used. This equation written for the two
points A and B under the limiting conditions necessary to cause
location of the critically stressed point to change from A to B
becomes:
14
(14)
:::~ ,
For A:
b2b
TA ft 11 +~ = -3-ft
For B:
TB b
2h (h/b) ft "1 + crpB
3 ft
The critically stressed point will occur at B, the
shorter side if (h/b) y 1 + -o/ is less than V 1
t
middle of the
+ qpA • Almost ft
all of Chandler's beams were such that theory predicts the critically
stressed point to be at the middle of the longer side. For those
few beams inwhich the critically stressed point is predicted to be
on the shorter side, it is only by a very small margin.
Chandler et al. extended the equation for plain rectangtalar
sections to account for prestressing using the principal ~ensile
stress failure criteria. Their equation in this case becomes:
Where:
-r = < y 1 + cr /ft
and f; is again taken to be 5~. A number of test results
from seven different sources were compared with this predictive
equation and the comparison was very good. Almost ail of the ~ata
Yere within + 20 percent of the predictive equation and only a few
data were outside of + 15 percent.
Eccentrically Prestressed I-beams: Only a relatively small amount of
effort has been devoted to the study of torsion in this type of
beam. Most researchers have logically devoted their efforts to
developing an understanding of torsion in less comple~ shapes before
attempting to study eccentrically prestressed I-beams.
15
(15)
(16)
(17)
Zia (9), in 1961, reported on a study of torsion in prestressed
members. The members tested in his study were of rectangular,
T, and !-sections. The T and !-sections were such that they would
be composed of a number of rectangular sections and in this respect
they differ somewhat from the THD standard cross sections.
More recently, this subject was studied at the University
of Washington (10, 11). Prestressed I-beams cif standard cross
section used by the State of·. Washington were studied in this program.
The cross section of these beams more closely resembled those of
the THD standard beams than did those studied by Zia. In the tests
conducted by the University of Washington, the beams contained web
reinforcement and were eccentrically prestressed with bonded strand.
In pure torsion tests· (10), elastic theory in connection with the
maximum principal tensile stress failure criterion very accurately
predicted the location on the cross section where initial cracking
occurred. However, the measured cracking torque was 25 to 75 percerit
greater than that predicted by elastic theory using the splitting
tensile strength from cylinders as the tensile strength of the concrete.
Measured and predicted values of torsional stiffness compared very well.
These results are in agreement with those obtained in tests on THD
Type B beams conducted in Study 150 (l).
Combined Loadings
The effect of combined loadings depends upon the location
of the critically stressed point on the cross section. If, in a
member subjected to a torque in combination with bending and shear,
the critically stressed point occurs near the neutral surface of
the member, there will be a minimum amount of interaction between
torsional and bending stresses. In this case there will be a maximum
of interaction between torsional stresses and shear stresses. If
the critically stressed point occurs on either the top or bottom
flange, the maximum interaction between torsional and bending
stresses would occur, and minimum interaction between torsional
and shear stresses would occur. The problem is further complicated
in concrete members because of the two different types of shear
16
(diagonal tension) cracking that occur in concrete beams. Wyss
and Mattock (11) in their study of interaction of torsion, shear
and bending in !-section girders, tested two series of girders.
One series had a moment-to-shear ratio of 4 ft and the other 9 1/2 ft.
These two values resulted in diagonal tension cracking without
flexural cracking and diagonal tension cracking in the presence
of flexural cracking respectively.
For those girders which exhibited flexural cracking prior
to diagonal tension cracking in the web, the occurrence of diagonal
tension cracking (rather than flexural cracking) was chosen to be
the condition which constituted cracking failure. The effects
of torsional stresses on the cracking moment were considered in the
theoretical calculations. The ratio of torsion to shear ranged from
pure torsion to pure transverse load. In a pure torsion test,
cracking first occurred in the top flange of the girder; but under
combined loading conditions, cracking first occurred in the web.
The actual tensile strength of the concrete was calculated
from test results using: (1) elastic stress distribution for both
transverse shear and torsional stresses, and (2) elastic stress
distribution for transverse shear and plastic stress distribution fior
torsional stresses. In the first case, the actual tensile strength
was found to range from 5.93~ to 13.99\/f~. In the latter case,
it was found to range from 5.54~ to 8.62~ This suggests
that plastic theory for the distribution of torsional stresses
may.be more appropriate in the general case of combined loadings.
However, the use of plastic theory for torsional stress distribution
and elastic theory for transverse shear stress distribution leaves
something to be desired.
Very little experimental data are available for members having
relatively deep, narrow cross sections and the extent to which
existing theory can be applied is not known. Wyss et. al. (10)
tested some deep narrow rectangular sections (5 in. by 24 in.) and
the experimentally obtained cracking torques were found to be
17
consistently less than the calculated cracking torques. They did
not explain the reason for this. The THD 54-in beam is relatively
deep and narrow, and its behavior under torsional loads has not been
determined experimentally.
18
Theory for Texas Highway Department 54-in. Beam
Torque-stress and torque-rotation relationships were developed
for the 54-in. beam using elastic theory for noncircular sections
(!). The relationship between applied torque and angle of twist
per unit length is given by:
where:
T
K
G
0
= =
=
=
T =KG 0
applied torque, in-lb., 4
torsional stiffness constant, in. ,
shearing modulus of elasticity, psi, and
angle of twist, radians/in.
The value of the torsional stiffness, K, was computed by a
(18)
relationship developed from the membrane analogy (1). The relationship
is:
where:
Area
K = 2 r <j>da J Area
G
ordinate to membrane
cross sectional area of beam
(19)
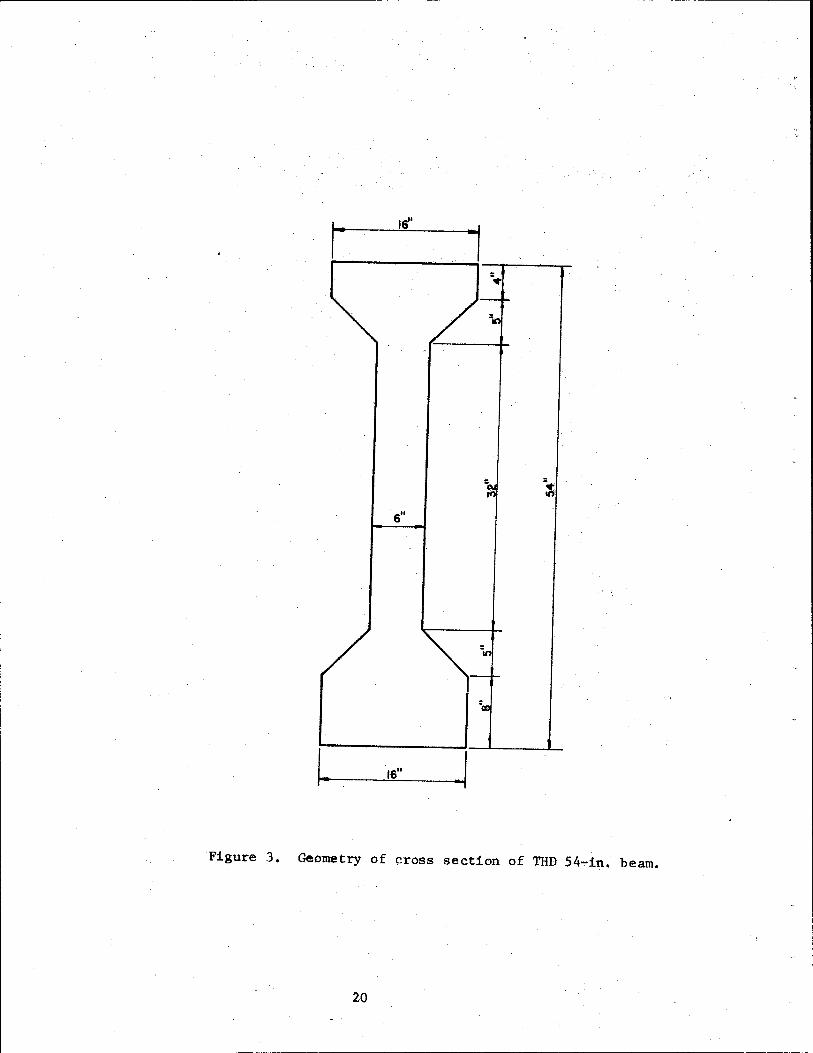
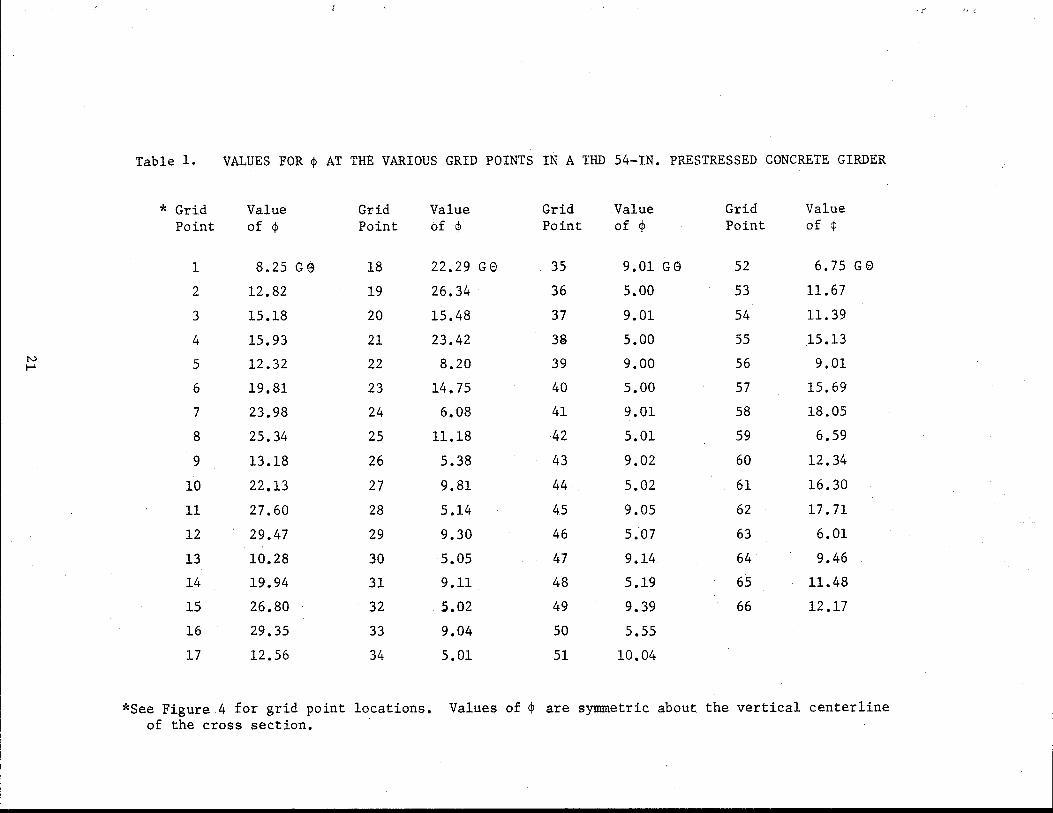
This procedure requires the computation of values of the ordinate, <j>, to the
membrane. Those valves for the 54-in. beam, in terms of G0, are given in
Table 1. Cross sectional dimensions of the 54-in. beam are given in Figure
3 and the locations of grid·points are given in Table 4. The value of the
torsional stiffness constant, K, was computed to be 10,110 in4
• The torque
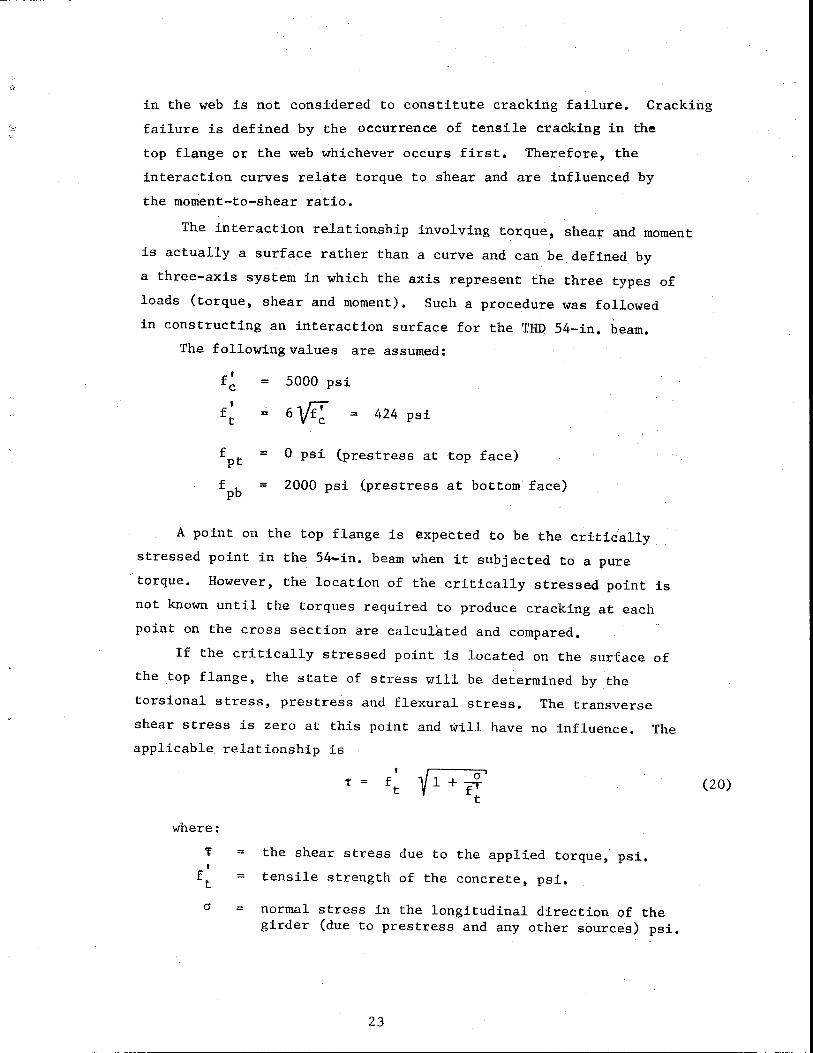
stress relationship is a function of the position on the cross section, and
values for selected points are given in Figure 4.
Wyss and Mattock (11) presented a procedure by which families
of interaction curves could be constructed for prestressed I-beams
subjected to COI!lbined loadings. Their procedure defines·the inter
action between torque and shear for various ratios of moment to
shear. Flexural cracking prior to diagonal tension cracking
19
16"
=
6"
16"
Figure 3. Geometry of cross section of THD 54..,.in. beam.
20
.~·1 .
Table 1. VALUES FOR ~ AT THE VARIOUS GRID POINTS IN A THD 54-IN. PRESTRESSED CONCRETE GIRDER
* Grid Value Grid Value Grid Value Grid Value Point of ~ Point of ¢ Point of ~ Point of ¢
1 s. 25 G e 18 22.29 Ge 35 9.01 G e 52 6. 75 G 8
2 12.82 19 26.34 36 5.00 53 11.67
3 15.18 20 15.48 37 9.01 54 11.39
4 15.93 21 23.42 38 5.00 55 15.13 N 5 12.32 22 8.20 39 9.00 56 9.01 t-'
6 19.81 23 14.75 40 5.00 57 15.69
7 23.98 24 6.08 41 9.01 58 18.05
8 25.34 25 11.18 42 5.01 59 6.59
9 13.18 26 5.38 43 9.02 60 12.34
10 22.13 27 9.81 44 5.02 61 16.30
11 27.60 28 5.14 45 9.05 62 17.71
12 29.47 29 9.30 46 5.07 63 6.01
13 10.28 30 5.05 47 9.14 64 9.46
14 19.94 31 9.11 48 5.19 65 11.48
15 26.80 32 5.02 49 9.39 66 12.17
16 29.35 33 9.04 50 5.55
17 12.56 34 5.01 51 10.04
*See Figure 4 for grid point locations. Values of <jJ are symmetric about the. vertical centerline of the cross section.

T 000597 T \ :. . T::.000654 T \ T: .000769 T
~ T: .00()799 T
163 164 165 ~ T=.00077 r/ 159 M 1st. ~
" 156 157 158 l/
' 154 Iss / •.00177 T~ T
T
T
T
"'.00135 T '..
•.00128 T'o
•.00126 T'.
152 53 150 151
I ..a 149 ~ 147
T
T
T
T
T
T
•.00125T...,. 44 145 •.00i23T....,
=.00123T,
•.00123T,
=.00t23T-...
•00123 T-..
·~123T,
•.0012!4T...,.
.T
T
T
T
T
T
=.oot27 T-,
•00127T--
•DOI54T.
•.00237r.:
/
/ k7
/ h3 14 1-..... T•.00t83T
T•OOt72 T
T=.00116 T.
19 ho ........ Is Is 1 ....... II 12
-142 l43 140141
138 139 136 ''Ji'!
134 135 ~ 133
.. 130:31
128 6 lzs 27
24 125 22 23 120 121
he ~9
!ts 16 II 112
7 18 13 14
/
' f'\. ['...
L L LP,0009(l6T T =.000873T
T=.000775T T=.000519T
Figure 4. Relationships between torsional shear stresses and applied torque for THD 54-in. beam.
22
in the web is not considered to constitute cracking failure. Cracking
failure is defined by the occurrence of tensile cracking in the
top flange or the web whichever occurs first. Therefore, the
interaction curves relate torque to shear and are influenced by
the moment-to-shear ratio.
The interaction relationship involving torque, shear and moment
is actually a surface rather than a curve and can be defined by
a three-axis system in which the axis represent the three types of
loads (torque, shear and moment). Such a procedure was followed
in constructing an interaction surface for the THD 54-in. beam.
The following values are assumed:
f' c 5000 psi
' 6\fi': ft = = 424 psi
fpt = 0 psi (prestress at top face)
fpb = 2000 psi (prestress at bottom face)
A point on the top flange is expected to be the critically
stressed point in the 54-in. beam when it subjected to a pure
·torque. However, the location of the critically stressed point is
not known until the torques required to produce cracking at each
point on the cross section are calculated and compared.
If the critically stressed point is located on the surface of
the top flange, the state o.f stress will be determined by the
torsional stress, prestress and flexural stress. The transverse
shear stress is zero at this point and will have no influence. The
applicable relationship is
t
where:
a' +p
t
T the shear stress due to the applied torque, psi. ' ft tensile strength of the concrete, psi.
a = normal stress in the longitudinal direction of the girder (due to prestress and any other sources) psi.
23
(20)
The relationship between applied torque and torsional shear stress
at this point, as shown in Figure 4 , is:
1" = .000799T
Using a = 0 psi and 1" = 424 psi, the cracking torque, T, is
found to be 530 in.-kips.
If the critically stressed point is located at the neutral
axis, the bending stresses have no influence. Actually, the torsional
stress distribution on the boundary of the cross section varies
(21)
very little over the vertical dimension of the web and is reasonably
constant near the neutral surface (Figure 4 ). Also, bending stresses
are small in the vicinity of the neutral surface. Therefore,
if the critically stressed point is not exactly on the neutral surface
but in close proximity, little error will be involved in applying the
relationships at the neutral surface to determine the cracking torque.
Torsional and transverse shear stress will be in the same direction on
one side of the web and of opposite directions on the other side.
The point on the side of the web where they are additive will control
and the relationship is:
1" + v
l.Jhere:
a ' +-f'
t
v = shear stress due to transverse load, psi.
and all other terms are as defined before.
The prestress at the neutral surface is 1054 psi. This gives
(Equation 22) a total shear stress, -r+ v, of 793 psi. Any
combination of torque and transverse load that will produce this
total shear stress will cause cracking at this point. Assume,
for the moment, that the shear stress due to transverse load is
zero, then the cracking torque is given by:
(22)
-r = .00123T (23)
For the given value of -r, this expression gives a cracking torque
of 644 in-kips.
24
.-;
For transverse shear stresses other than zero, the two shear
stresses must be combined as in Equation 23. The corresponding
relationship between torque and transverse load is a linear relationship.
If the critically stressed point is located on the outer surface
of the bottom flange, the state of stress includes the combined
effects of torque, prestress, and flexural stress at that point. The
transverse shear stress is zero at this point and therefore, has
no effect. In this case Equation 21 is applicable if cr is. taken to
be the sum of the prestress and flexural stress at that point.
Another possible location of the critically stressed point
is one of the re.-entrant corners at the web flange juncture. However,
Wyss and Mattock found in their tests on prestressed 1-beams that
significant cracking did not occur until the tensile stress over
most of the depth of the web had reached the tensile strength of the
concrete. Therefore, any effects of stress concentrations at .these
corners were not included in constructing the 'interaction surface
for the 54-in. beam.
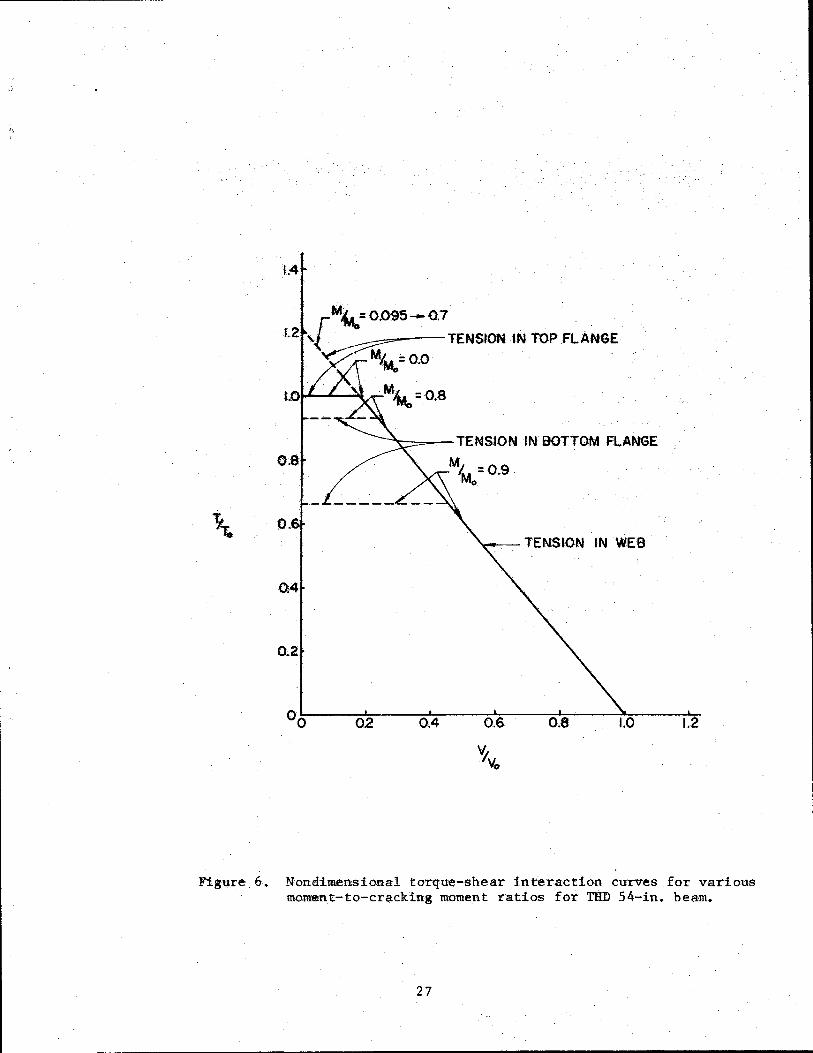
The resulting interaction surface is shown in Figure 5 and
the same relationships are presented in two-dimensional curves for
various values of M/Mo in Figure 6. It is noted that, in the
construction of this interaction surface, failure was defined to
be the initial occurence of cracking. Portions of the surface which
represent tensile cracking in the top flange, in the web, and in
the bottom flange are indicated on the figure. Construction of this
sur;face differs in concept. from that proposed by 'Wyss and Mattock
in that they did not consider tensile cracking in the bottom flange to
constitute failure. They considered the effects of combined loads
on flexural cracking in the bottom flange and then considered the effect
of this cracking on the shear capacity of the web. The construction
of the interaction surface for the 54-in. beam is more conservative than
the method proposed by Wyss and Mattock.
The theoretical interaction surface for the THD 54-in. beam presented
herein has not been verified by experimental results. The surface was
developed from theoretical considerations and reported experimental data
from tests on prestressed !-beams that were somewhat similar in cross
25

M Mo
l To
TENSION IN TOP FLANGE
TENSION IN WEB
1.0 v Vo
Figure 5. Interaction surface for THD 54-in. beam.
26
I ' <
L4.
M4Ao= OD95- 0.7 ·
t.2 ,[ . TENStON tN TOP FLAN,GE
MJMo=o.o
0.6
Q4
02
~::::=--TENSION IN BOTTOM FLANGE
0.4
M -~-0.9
0.6
~'Yo
1.2
Figure. 6. Non dimensional torque-shear interaction curves for various moment-to-cracking moment ratios for THD 54-in. beam.
27
section. Some of the values used were selected as those thought
to be most appropriate for this situation and they have not been
verified by experimental data. The unconditional use of this theory
before it is experimentally verified is not recommended.
The torque-stress relationship was also developed for the 54-in.
beam assuming completely plastic behavior. Under this assumption,
all points of the cross section are stressed to their ultimate strength.
This theory is not fundamentally applicable to a concrete member because
deformation of the outer fibers of sufficient magnitude to create a
completely plastic section do not occur. However, favorable comparisons
with experimental results have been obtained (_1_). The sand heap
analogy was employed to accomplish the calculations. This analogy is
the counterpart to the membrane analogy for elastic theory. The
torsional shear stress at any point on the cross section is related
to the slope of the surface of the sand heap and the torque is proportional
to the volume of the sand heap. Photographs of the sand heap for the
54-in. beam are shown in Figure 7. The·relationship between torque
and stress is:
T = 1870 -r p
This relationship is applicable to any point on the cross section
and is the counterpart to those for elastic theory given in Figure 4.
28
(24)
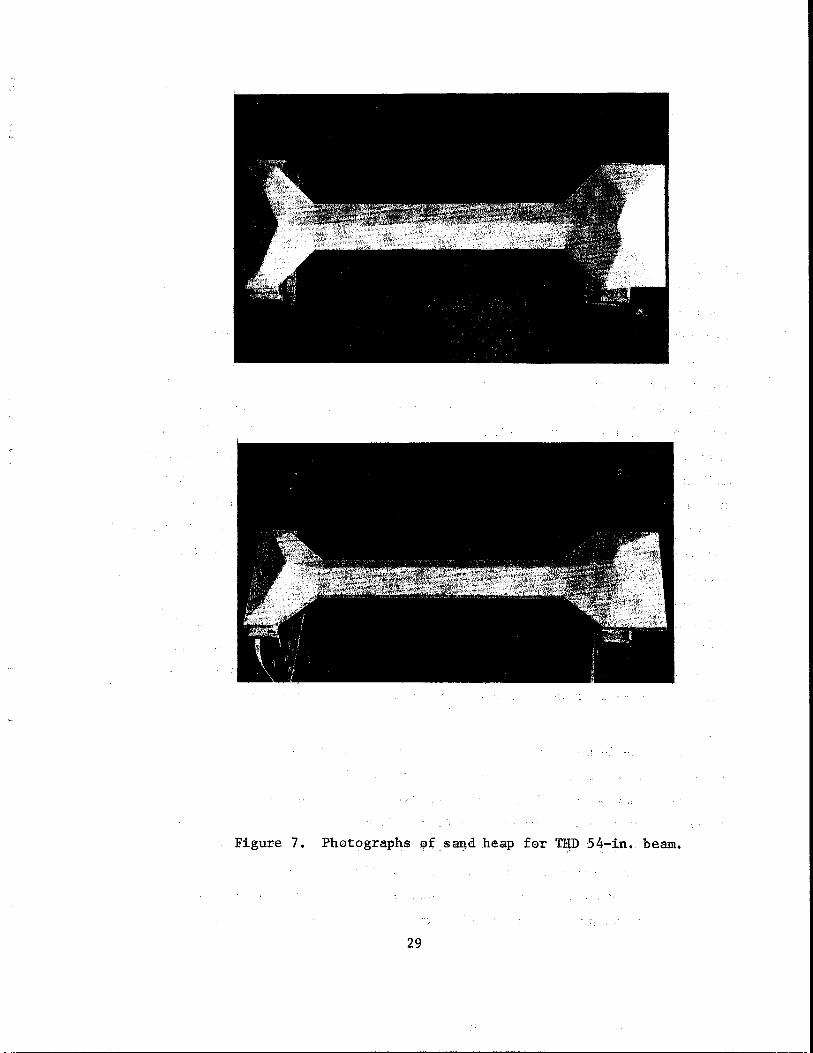
Figure 7. Photographs ~f sand heap for THD 54-in. beam.
29

EXPERIMENTAL PROGRAM
General
The experimental program was planned to provide information
about magnitudes and directions of stresses that occur in THD 54-in.
beams during construction under given conditions. Instrumentation
was planned that wauld give a measure of the effects of diaphragms
on the stress patterns in the beams. It was intended that the derived
data would be used to describe typical behavior of these beams and
would be valuable in developing methods of analysis and design of such
beams. Reliable data would provide insight into the amount of torsional
and other loads that an edge beam actually experiences and the relative
amount of restraint offered by the diaphragms. This then, would allow one
to more readily assign design loads to such beams. However, the experimental
program was not successful in this respect. It is documented hereia and
the results are used to the~extent of their reliability.
Measurements of deflection, rotation, and strain were made
prior to starting the deck placement operation, at specified intervals
during placement, and after completion of deck placement. At both sites,
placement of the deck began on one end and proceeded to the other. No
delays were experienced and placement proceeded at a regualr pace.
Test beams
Two edge beams in structures with overhanging slabs were
selected for study in this program. Both were THD 54-in. beams.
One was in the Airport Boulevard overpass on IH 35 and the other was
in the Columbus Drive overpass in Austin, Texas.
The spacing between the edge beam and the adjacent interior beam
in the Airport Boulevard structure varies. The edge beam is skewed
slightly less than 3 degrees. The span length is nominally 87.5 ft.
The overhanging portion of the slab is 7.5 in. thick and the interior
30

portion is 7.75 in. thick. The overhanging span varies from 2.32 ft
on the north end to 2.1 ft on the south end. Center-to-center spacing
to the adjacent interior beam on the north end is 6.1 ft and on the
south end is 7.0 ft.
The span in the Columbus Drive structure is skewed 10° and
the span length is nominally 92ft. The slab is 7.25 in. thick
and overhangs 3 ft 5.5 in. Center-to-center spacing of the beams
is 7 ft.
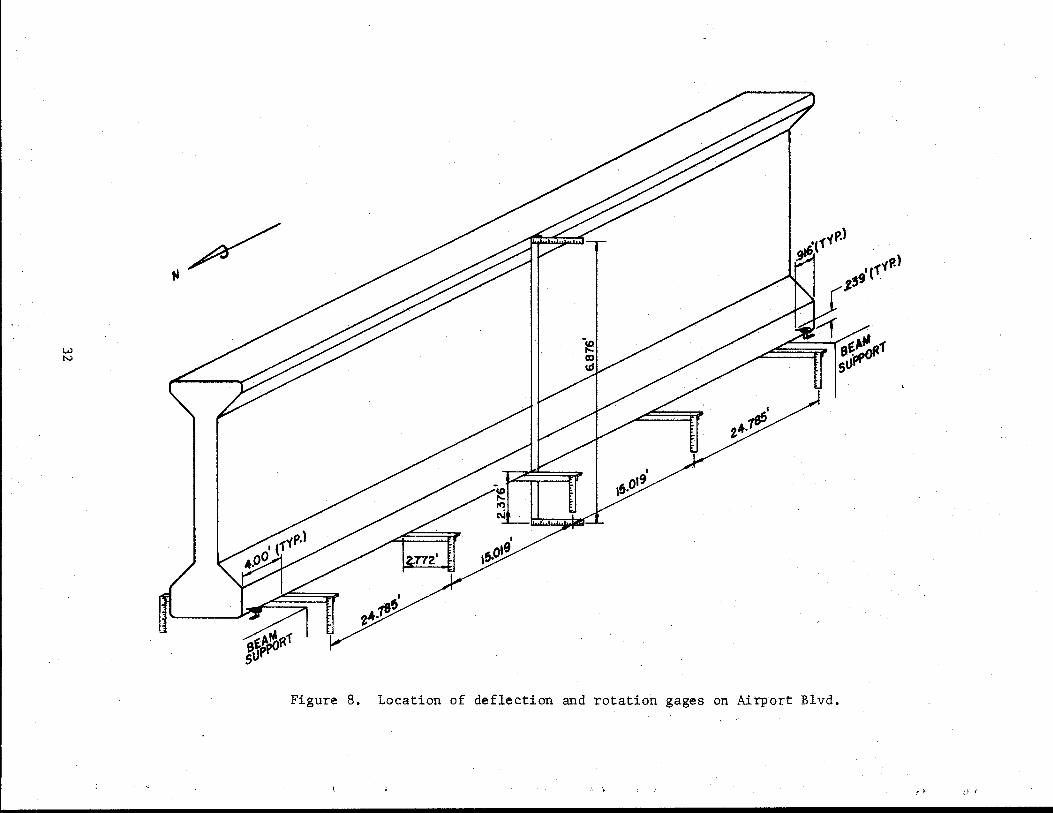
Deflection and Rotation Gages
Measurements of deflections and rotations were made with scales
hanging from cross bars attached to the lower flange of the prestressed
beams. The cross bars were attached at the positions indicated
in Figures 8 and 9. The center-to-center distance between ~cales on
each cross bar was 6.877 ft. Vertical displacements of the scales
were determined with a precision surveyor's level. This arrangement
allowed determination of vertical deflections as well as rotational
displacements of the beam.
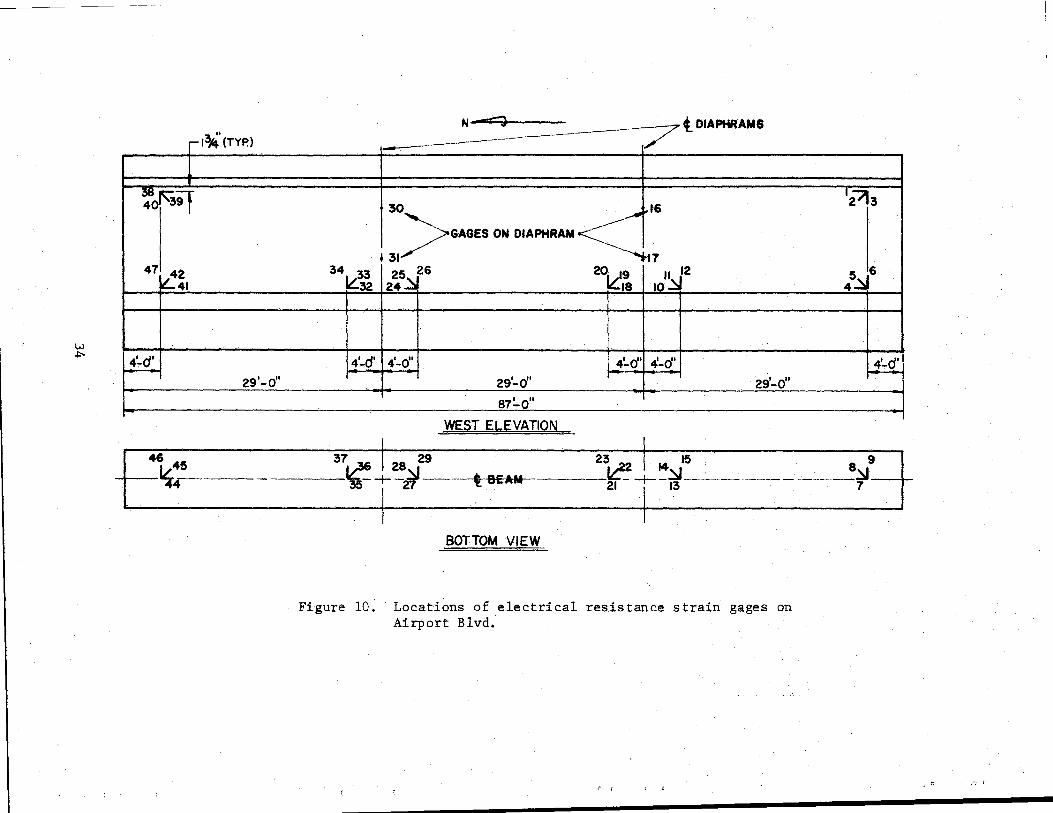
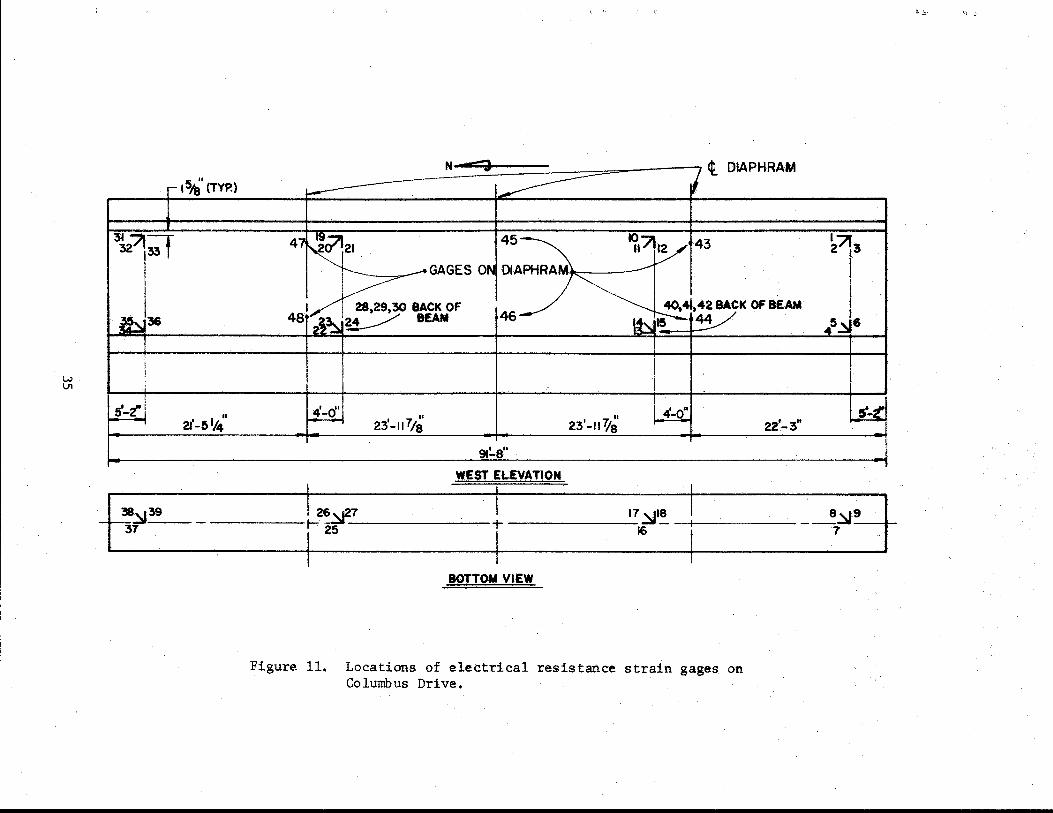
Strain Gages
Electrical resistance strain gages were installed on the surface
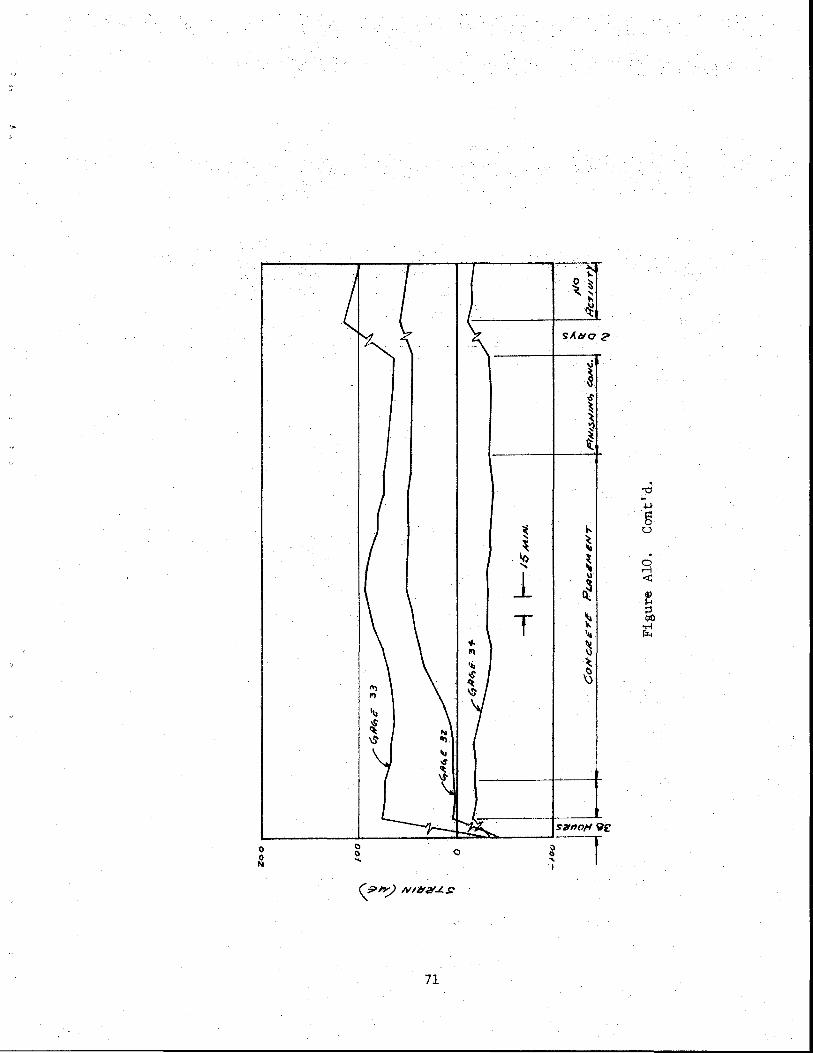
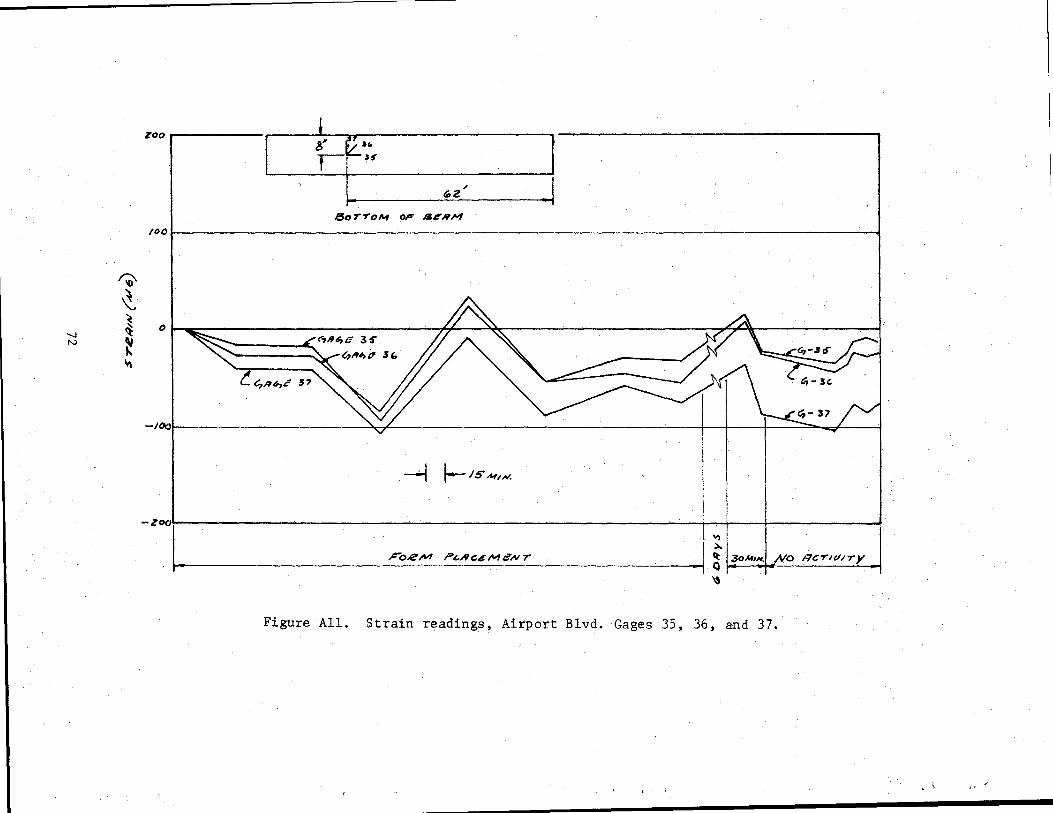
of the two beams at the locations indicated in Figures 10 and 11.
The gages were the same type as those used in Study 150 (l) and in
other applications where their use has been reasonably successful.
Temperature compensation gages were mounted on a slab that was placed
on a scaffold adjacent to the bridge beam •.
The beam in the Airport Boulevard structure was the first to be
instrumented. This beam was adjacent to an existing structure
which continued to carry traffic. The traffic was only a few feet
from the instrumented beam and caused significant disturbance,
possibly contributing to some of the problems experienced. Strain
readings were not made during a long period of time when there was
no activity on and around the structure. Therefore, nhere is no
assurance that the entire instrumentation system was stable.
31
w N
~/
Figure 8. Location of deflection and rotation gages on Airport Blvd.
r ~- d' f'

w w
_/
BEAM SUPPORT
Figure 9. Location of deflection and rotation gages on Columbus Drive.
BEAM SUPPORT
w +:-
t3_4' (TYP.) r-1
~ol'39f
47 42 iL41
4'-d' ~
29'-o"
' 46'C----
N -=CJ __ t_ DIAPHRAMS ----------- ,
i
30, 16 '2'13
/GAGES ON DIAPHRAM
' 31 17 34 33 25 26 201Cg II 12
45:::l 1.!:32 24~ 18 10-~
4'-d' 4'-o" 4'-o" 4-o" 4'-d' ~
29'-d' 29'-o"
87~0" ------------------'--
WEST ELEVATION I I
37 -I ~~ ---29 - - ------23~ 14
15 . 8
9
·--~ 1-~ t BEAll ~ r-it-'--- -------~ I
-..----------- --~ ----- ---------------"""T
BOTTOM VIEW
Figure 10: Locations of electrical resistance strain gages on Airport Blvd.
't-. 1'-'
w V1
---N~d t 15/~· (TYP.)
31 ;71;-f 32 33
GAGES 0
46
I I
'ff-t' 2J'-5 '14' I 7 II 23'-117i~' 23-11 Ia
91~8" - -------------------------- - --------- ----------- ---- -------
I~~,. -
WEST ELEVATION
t26zt' t : 17~!_
16
BOTTOM VIEW
Figure 11. Locations of electrical resistance strain gages on Columbus Drive.
~- .:;,; '-:1 ~
~713
22'-3"
I
8~9 -- __ ·
7

The second beam to be instrumented was in the Columbus Drive
overpass. This structure was in a secluded area with a minimum
amount of possible disturbances. Strain readings made, both before
and after placement of the deck concrete during periods of td;me
when there was no activity on the structure, show that the instrumentation
system was stable (Figures A-15 through A-31 in the Appendix).
36
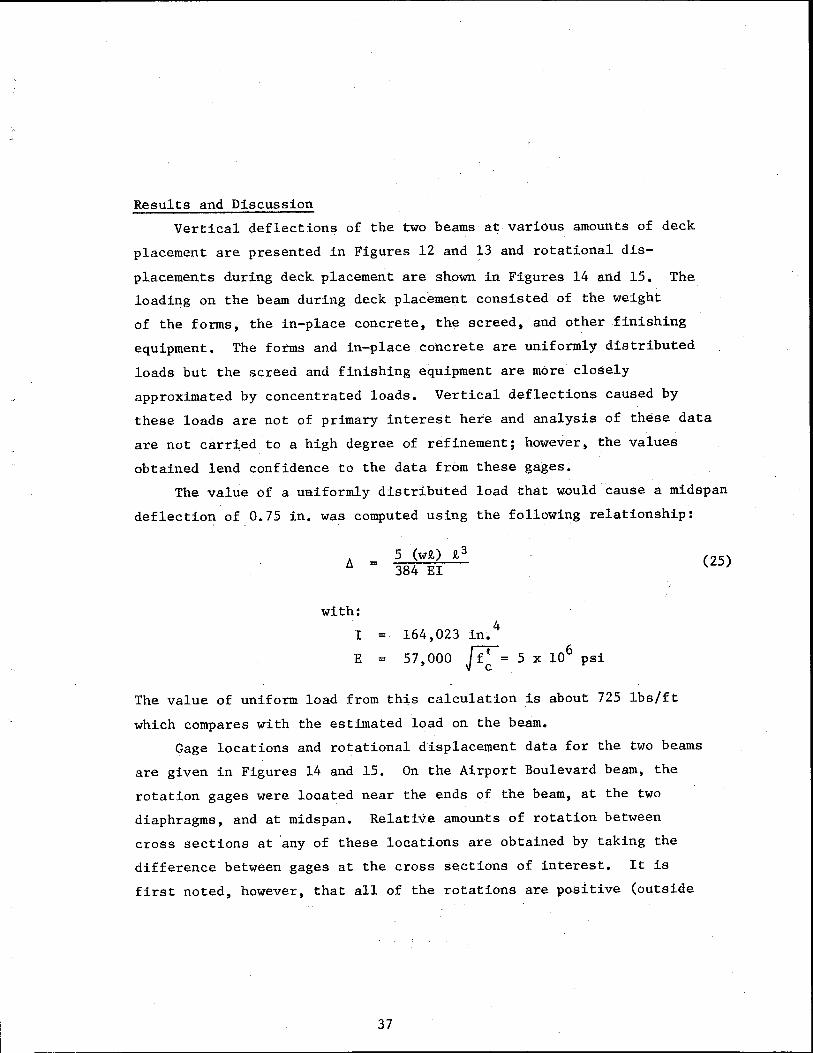
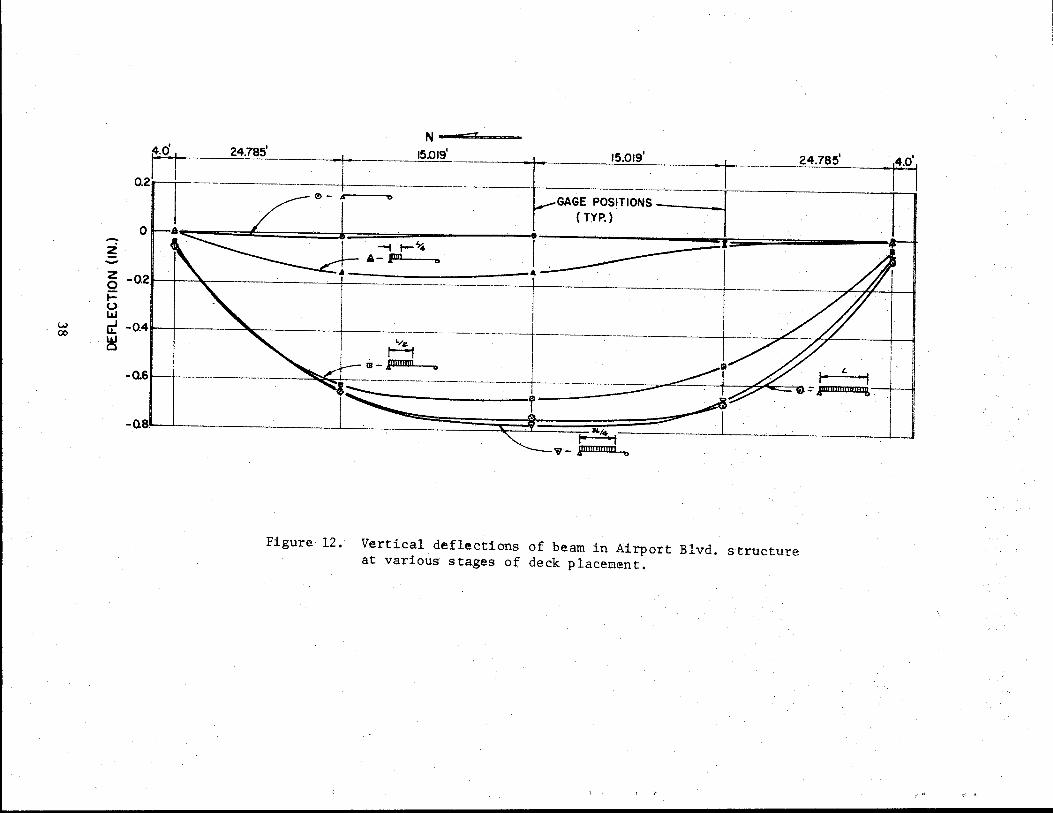
Results and Discussion
Vertical deflections of the two beams at various amounts of deck
placement are presented in Figures 12 and 13 and rotational dis
placements during deck placement are sh.own in Figures 14 and 15. The
loading on the beam during deck placement consisted of the weight
of the forms, the in-place concrete, the screed, and other finishing
equipment. The forms and in-place concrete are uniformly distributed
loads but the screed and finishing equipment are more closely
approximated by concentrated loads. Vertical deflections caused by
these loads are not of primary interest here and analysis of these data
are not carried to a high degree o£ refinement; however, the values
obtained lend confidence to the data from these gages.
The value of a uaiformly distributed load that would cause a midspan
deflection of 0.75 in. was computed using the following relationship:
A =
with:
I
E =
5 (wR.) R. 3
384 EI
164,023 in.4
57,ooo R = 6 5 x 10 psi
The value of uniform load from this calculation is about 725 lbs/ft
which compares with the estimated load on the beam.
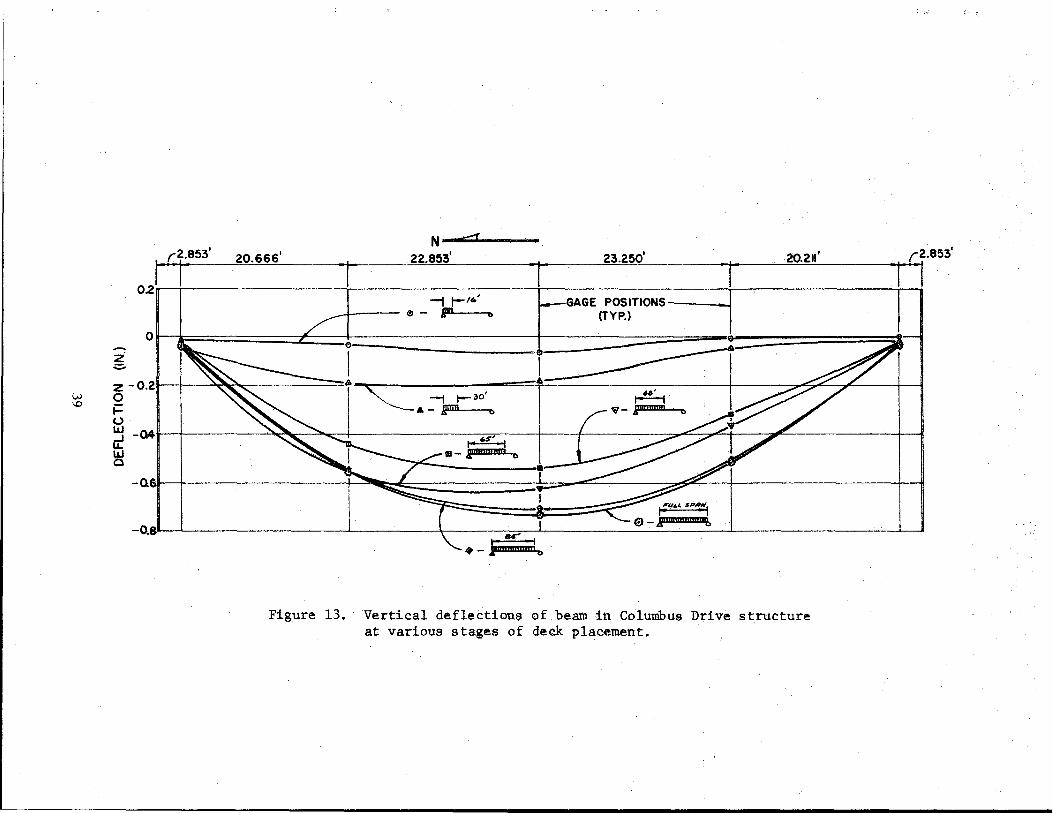
Gage locations and rotational displacement data for the two beams
are given in Figures 14 and 15. On the Airport Boulevard beam, the
rotation gages were located near the ends of the beam, at the two
diaphragms, and at midspan. Relative amounts of rotation between
cross sections at 'any of these locations are obtained by taking the
difference between gages at the cross sections of interest. It is
first noted, however, that all of the rotations are positive (outside
37
(25)
w co
N .......-;;;(. (!,0_, 15.019' 15.019' ·--·----
24.785' _I
0.2rT ----------- -r ------------- -----11---
0 -z ~ -0.2f \0: l_J,~,~----~-~-~--- ---------
t; -- ---~-Q4H-- ' I H ---------·----·
~ I I m-prnm b
-0.6 ... -- --· .. -·-·----- ~ ~
I ~ ~ ~ I I i K~ -QS. . ~
. " - prnmnm h
Figure 12. Vertical deflections of beam in Airport Blvd. structure at various stages of deck placement.
(.o·,
:. I" :::: 1l
w
""
-z· ~
N ....,.;:;;;;:r: 20.666' ., 22.853'
--1 t-16.' 1!1- JID b
.I 23.250' .1
20.2•' r•·••,· I ·1
GAGE POSITIONS ----J (TYP.)
01 ~ ,., I I ' ·~ ~ r ~ 111 _____;- :::;;a. I
I -z -0.2H I "~'"" - • 0 i=
~-Q41 I ~ ~ ~ ~m-~b I !~"17 II -Q&I I I ~ p------= ~ I I I -0.8 __ ,
Figure 13. Vertical deflections of beam in Columbus Drive structure at various stages of deck placement.

.j:--0
Interior diaphragms
N/
Values for a (Degrees) at Gage Locations on Beam
-9; ~ ~ " -&r J Lq/:fD 0 0 0 I " ~
+.0 16 7 +.0 500 +.u 750 +.041 7 +.0667
+.0 58 3 +.02 50 +.0833 -+:116 7 +.0 5 30
+.0 917 -+:1083 +.1167 +.0 8 3 3 +.0 917
+.116 7 +.13 3 3 +.1250 +.116 7 +.0 8 3 3
Figure 14. Rotational displacements of beams in Airport Blvd. structure.
-N-
r :t. "C· ·,.
..,_. 1-'
Interior diaphragms
c lf !I-
N
Values for 8 (Degrees) at Gage Locations on Beam
-&& POSIT/Of'(
+.0 16 6 ~
0
30'
0 +.0250 -.0666 +.0 50 0 0 I ~
xrrrrm I ~
+.00 83 +.0916 +.0166 +.1083 +.0 166
+.0 3 3 3 +.0 750 -.0 166 +.116 7 +.0 58 3
+.0 3 3 3 +.0 8 3 3 +.0 0 8 3 +.116 7 +.o 411 I ' 0
+.0 583 I +.0 750 --,.016 6 +.1000 +.04171 Jlli!ID !lli!!lllj!!illl!
Figure 15. Rotational displacements of beam in Columbus Drive structu~e.

-- --- ---- ------------.
of beam down) and somewhat comparable in magnitude. Differences
between 01 and 0 2 , Oz and 0t1 , and Ot1 and Os will give the relative
twist in the beam between adjacent diaphragms. Comparisons between
03 and the average value of 6z and 84 gives the amount of relative rotation
that occurred at midspan of the free spanning portion between interior
diaphragms.
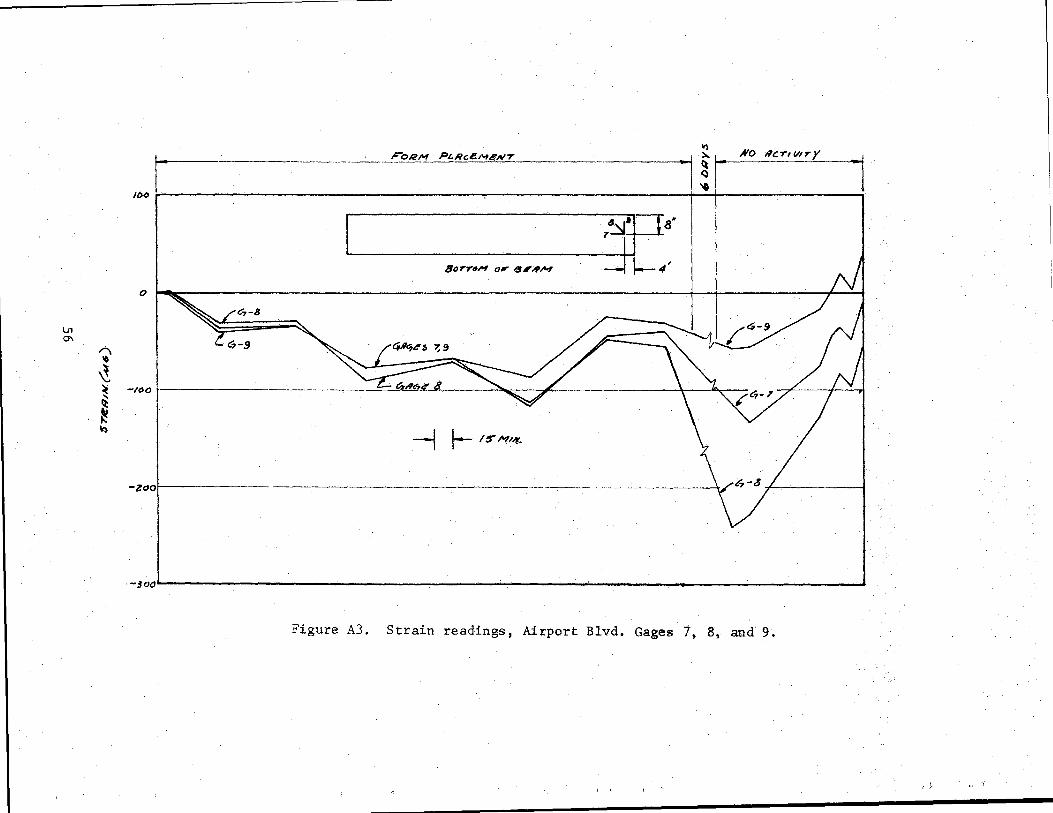
Plots of strain readings from each of the strain gages on both
beams are given in the Appendix. An indication of the validity of
these strains can be obtained by examining strains from longitudinal
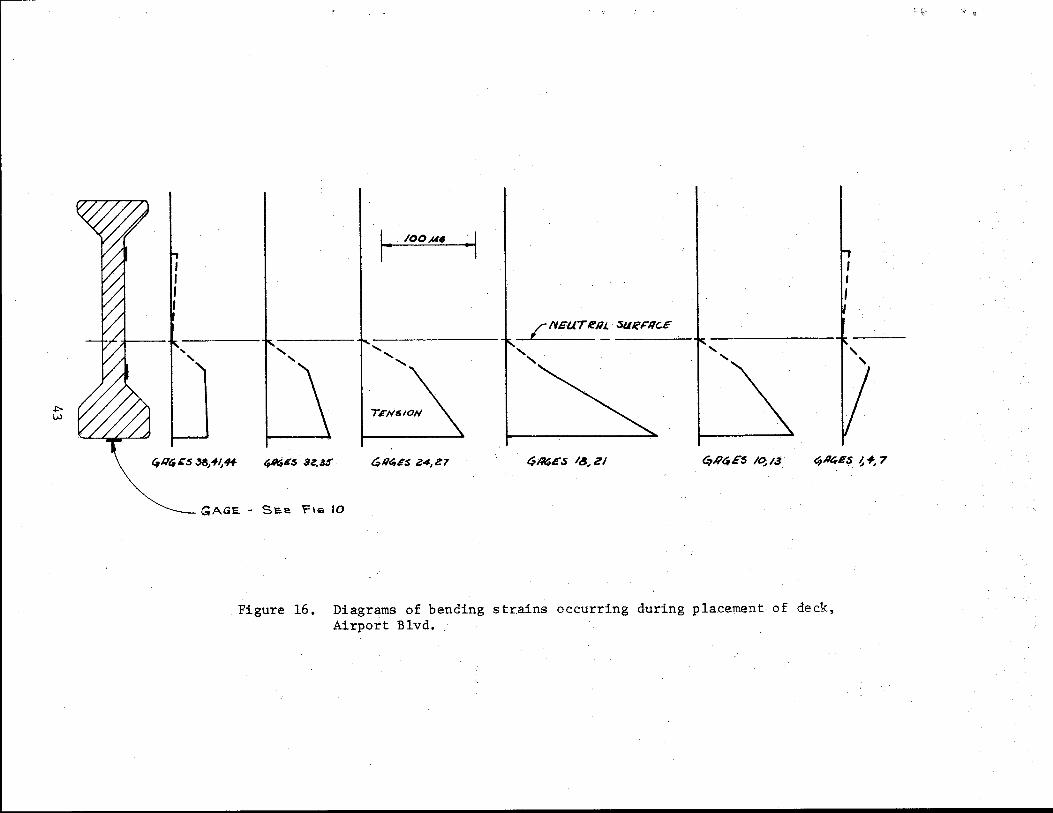
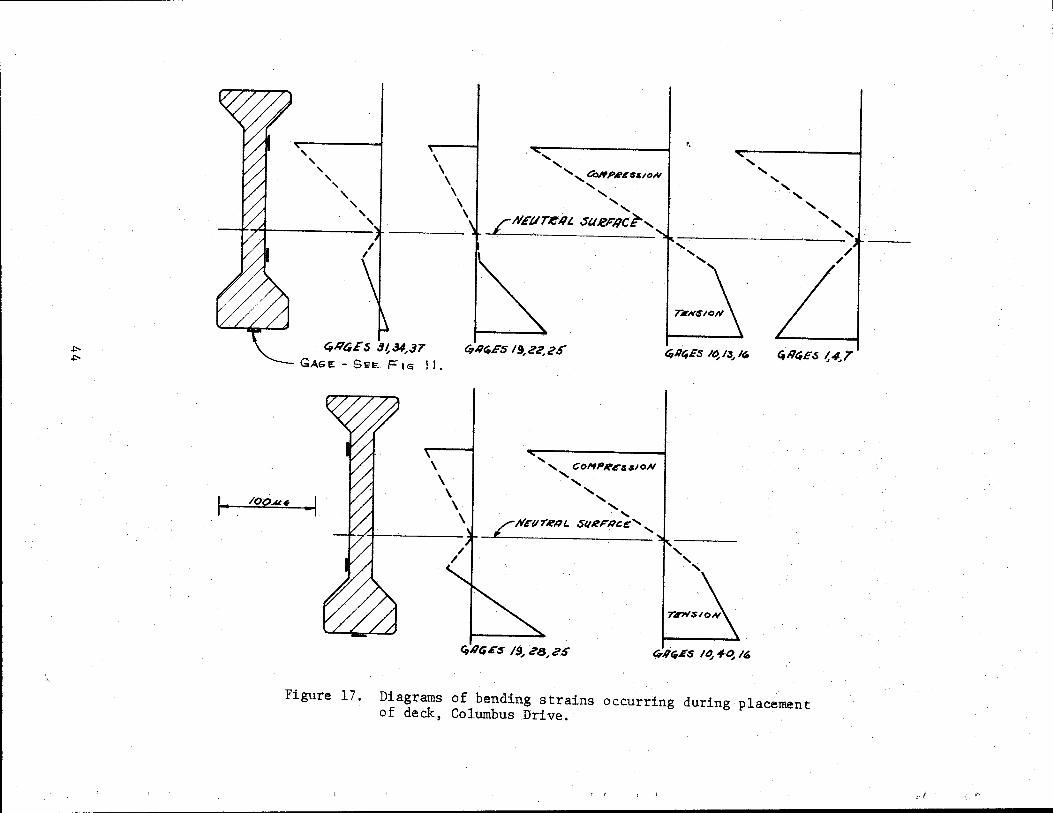
gages at various cross sections. Figure 16 shows longitudinal strain
diagrams for the Airport Boulevard beam obtained by taking the difference
between readings made immediately before and immediately after placement
of the deck concrete. Similar diagrams for the Columbus Drive structure
are given in Figure 17. The inconsistent strain results in the simple
bending mode leads one to conclude that these strain readings reflect
variations due to causes other than externally applied loads and
therefore, should not be used in an analysis of load induced strains.
The planned program to provide experimental data on the effective
amount of torque that such a beam must carry under actual construction
conditions cannot be accomplished with the data obtained.
Most of the problems ~~perienced with the strain gage data were
probably caused by temperature changes that were not compensated for
by the arrangement used. Temperature changes were not uniform over the
entire beam and were probably different in the beam than they were in
the compensating gages. This was further complicated by the small
magnitudes of the load induced strains that were experienced. Data
scatter due to transient temperature changes and other effects tended
to overshadow the load induced strains.
42
.p. w
I I I II
... ' ' '
, .. IOOM6 ~
............ .......
TENt> tON
L IVEUT ~/l::.. SU~F'/lCE
' ' ' ......
I I
I I
' '
411~£5 38;<1"4+ ~~.s az,as ti,/l4~S Z4, Z7 t$./lf;£.S ItS, Zl 6,/lC,£5 ~ 13 C,/14E.S ~ +_ 7
GAGE. - S'Ce 'f1e 10
Figure 16. Diagrams of bending strains occurring during placement of deck, Airport Blvd.
~ ~7' ·'·
+"+"-
' ' ' ' ' ' ' ' '
\ \ \ \
' \
...... , '-, Co.I'IPi£'i!ti6/0N
...... , ...... ,
£NEUTeiiL. SURFIIC£-,
...... ......
...... ......
' ' ' ' ----------------~----' ......
' ...... / ~
4114£$ ~~34,37 6}11(9/i'S 19,22,25" ti,ll(qES I~ 13, /" C,R~ES '-4-T GAGE - SEE FIG ll.
r- . 100.-ut: _,
Figure 17 ~
\ \
\ \ \
', COI'fP~~~HsJON ......
' .............
' ...... LH£'VT/e11L S(flerllce'-,
' ' '
C,llt;ES 19, .?8, t?S CT/1(9.E'S I~ 4~ I~
Diagrams of bending strains occurring during placement of deck, Columbus Drive.
t· t- ';- !1~
• .,.!-··
SUMMARY AND CONCLUSIONS
Research reported in the literature on the behavior of concrete
members subjected to torsional, and combined torsional and transverse
loads has resulted in a number of phenomena that are reasonably well
understood and verified by experimental data. Some of the more
significant findings that have been reported are summarized below:
1. The torsional stiffness of a concrete member can be predicted
by elastic theony with reasonable accuracy. Torsional stiffness
of an uncracked concrete member is not significantly affected
by the presence of reinforcement, either prestressed or
nonprestressed.
2. Experimentally obtained torque-stress relationships are
usually somewhere between those predicted by elastic theory
and those predicted by plastic theory. Elastic theory in
connection with measured tensile strength predicts values
of torsional strength that are lower than experimental values.
Plastic theory tends t~ overpredict torsional strength.
3. Neither longitudinal nor transverse reinforcement alone
will increase the torsional capacity of a concrete member;
however, appropriately arranged, equal proportions of the two
will increase the torsional strength and ductility over that
of plain concrete members.
4. Compressive prestressing will increase the cracking torque
of a concrete member. This increase can be accounted in
theory by considering the two-dimensional state of stress at
the critically stressed point. For concentrically prestressed
rectangular sections subjected to a pure torque, this can be
accomplished by multiplying the cracking torque for a plain
section by the factor ;/_1 + E:.E.' This factor results from y f' • t
consideration of the state of stress at the critically stressed
point on the cross section of the member.
45
The following conclusions are drawn from the research reported herein:
(1) A nondimensional interaction diagram relating torque, shear
and bending moment has been constructed for the THD 54-in.
beam. The diagram is based on elastic theory in connection
with the maximum tensile stress failure criterion and assumes
that the beam has failed when cracking occurs in the concrete.
Although sufficient experimental data on beams similar to the
THD 54-in. beam are not available, the theory presented
represents the state-of-the-art on prestressed concrete·
members subjected to combined loads.
(2) An attempt was made to experimentally determine the magnitudes
and directions of concrete strains that occur in two typical
54-in. edge beams during deck placement operations. Extraneous
variations in the strain gage data due to transient temperature
changes and other effects were of such magnitude that they
overshadowed load induced strains. In order to obtain
meaningful and reliable experimental data, it will be necessary
to employ a more sophisticated instrumentation system and/or
more closely controlled conditions.
46
RECOMMENDATIONS
The following recommendations are made on the basis of reported
research on concrete members subjected to torsional and to combined
loadings:
(1) It is recommended that elastic theory for torsional
stress distribution and the maximum tensile stress•
failure criterion be used.
(2) The ultimate tensile strength of the concrete should be
5 ~ or less if a more conservative analysis is desired. c
(3) In cases where previously developed relationships between
applied loads and the critical internal stress are not
available, the problem should be approached by considering
the states of stress (due to all loads) at all points in
the member and seeking the most critically stressed point
to arrive at a load stress relationship. The effects of
prestressing can be handled in this manner. However,
for some members such as a concentrically prestressed
rectangular section, prestressing can be accounted for
factor,
multi 1 ing the cracking torque by the prestressing
1 + CJp •
ft (4) It is recommended that laboratory tests be conducted on
full-scale 54-in. beams· to determine the validity of the
theory presented for these beams. It would be necessary
to conduct these tests under laboratory conditions so that
reliable experimental data might be obtained.
47
NOTATION
= cross sectional area of one leg of a stirrup (in. 2)
b shorter dimension of a rectangular cross section (in.)
E
ft
f y
f sy
=
=
=
modulus or elasticity of concrete (psi:)
tensile strength of concrete (psi)
yield strength of stirrups (psi)
yield strength of steel (psi)
f' compressive strength of concrete (psi) c
f~ tensile strength of concrete (psi)
G shear modulus of elasticity for concrete (psi)
h = longer dimension of a rectangular cross section (in.)
I moment of inertia for selected cross section (in. 4)
K
M
M 0
s
T
T c
=
=
=
=
torsional stiffness constant (in. 4)
bending moment (iri. ":"lbs)
pure moment which will produce cracking in beam in the absence of other loads (in. - lbs)
total percentage of steel (%)
spacing of stirrups (in.)
torque (in. - lbs)
torsional capacity (in. - lbs)
T cracking torque (in. - lbs) cr
T contribution of concrete to torsional strength (in.· ·-lbs) 0
T = plastic torsional capacity of the member (in. - lbs) p
T ultimate torque (in. - lbs) u
T ultimate torsional strength of a noh":"prestressed section (in. - lbs) up
48
v
v 0
= transverse shear stress (psi)
= transverse shear stress which will produce cracking in the web of the beam in the absence of other loads (psi)
V torsional shear stress of concrete (psi) tc
=
=
shorter center-to-center dimension of closed rectangular stirrup (in.)
longer center-to-center dimension of closed rectangular stirrup (in.)
"' a constant determined by the b/h ratio
"'t constant reflecting the effect of reinforcement of stirrups
A deflection of beam (in.)
e = angle of twist (radians/in.)
~ = ordinate to membrane (in.)
a normal stress (psi)
a = normal stress in x-direction (psi) X
a = amount of prestressing (psi) p
"[ torsional shear stress (psi)
"[ = torsional shear stress at the mid point of the longer leg (psi) a
'b torsional shear stress at the mid point of the shorter leg (psi)
"[ torsional shear stress on the K, y plane (psi) xy
49
REFERENCES
1. Buth, Eugene and Furr, H. L., "Torsional Strength of Prestressed Concrete Bridge Girders," Research Report 150-lF, Texas Transportation Institute, Texas A&M University, College Station, Texas, August 1971.
2. Zia, Paul, "Torsion Theories for Concrete Members," Torsion of Structural Concrete, Special Publications no. 18, American Concrete Institute, 1966.
3. Chandler, H., Kemp, E. L., and Wilhelm, W. J., "Behavior vf Prestressed Concrete Rectangular Members Subjected to Pure Torsion," Report no. 2007, Department of Civil Engr., West Virginia University, 1970.
4. Hsu, Thomas T. C., "Torsion of Structural Concrete- Plain Concrete Rectangular Sections," Torsion of Structural Concrete Special Publication no. 18, American Concrete Institute, 1966.
5. Timoshenko, S. and Goodier, J. M., Theory of Elasticity, Second Edition, McGraw Hill, New York, 1951.
6. Hsu, Thomas, T. C., "Torsion of Structural Concrete.- A Summary on Pure Torsion," Torsion of Structural Concrete, Special Publication no. 18, American Concrete Institute, 1966.
7. Hsu, Thomas, T. c., "Torsion of Structural Concrete- Behavior of Reinforced Concrete Rectangular Members," Torsion of Structural Concrete, Special Publication no. 18, American Concrete Institute, 1966.
8. Seeley, F. B., and Smith, J. 0., Advanced Mechanics of Materials, Second Edition, John Wiley and Sons Inc., 1967.
9. Zia, Paul, "Torsional Strength of Prestressed Concrete Members," Journal of the American Concrete Institute, vol. 32, no. 10, April. 1961.
10. Wyss, A. N., Garland, J. B., and Mattock, A. H., "A Study of the Behavior of I-Section Prestressed Concrete Girders Subject to Torsion," Structures and Mechanics Report SM 69-1, University of Washington, Seattle, Washington, March 1969.
11. Wyss, A. N., and Mattock, A. H., "A Study of I-Section Prestressed Concrete Girders Subject to Torsion, Shear and Bending," Final Report Research Project No. Y-1180, University of Washington, Dept. of Civil Engr., Seattle, Washington, June 1971.
12. Hsu, Thomas T. C., and Kemp, E. L., "Background and Practical Application of Tentative Design Criteria for Torsion," ACI Journal, Proceedings v. 66, no. 1, January 1969. ---
13. Swamy, N., "The Behavior and Ultimate Strength of Prestressed Concrete Hollow Beams Under Combined Bending and Torsion," Hagazine of Concrete Research (London), vol. 14, no. 40, March 1962.
50

APPENDIX
STRAIN GAGE READINGS
51
\..n N
'"'\ .. ~ ~·
~ " ~
---------- --------- -·-···--------------------
3oor-------------
Zoo~----------------- 11'\~
+'
1001----------
W~$T 4".t.i1VHT/ON
0 ~ 7~ 70~ ~-y......___, 7// 1'<11
- 100 t---------
---i 1-- / o MNV.
-?oo!
1- r-oteM .PLHC~"'16NT j 40 -DI'Iy,'r-
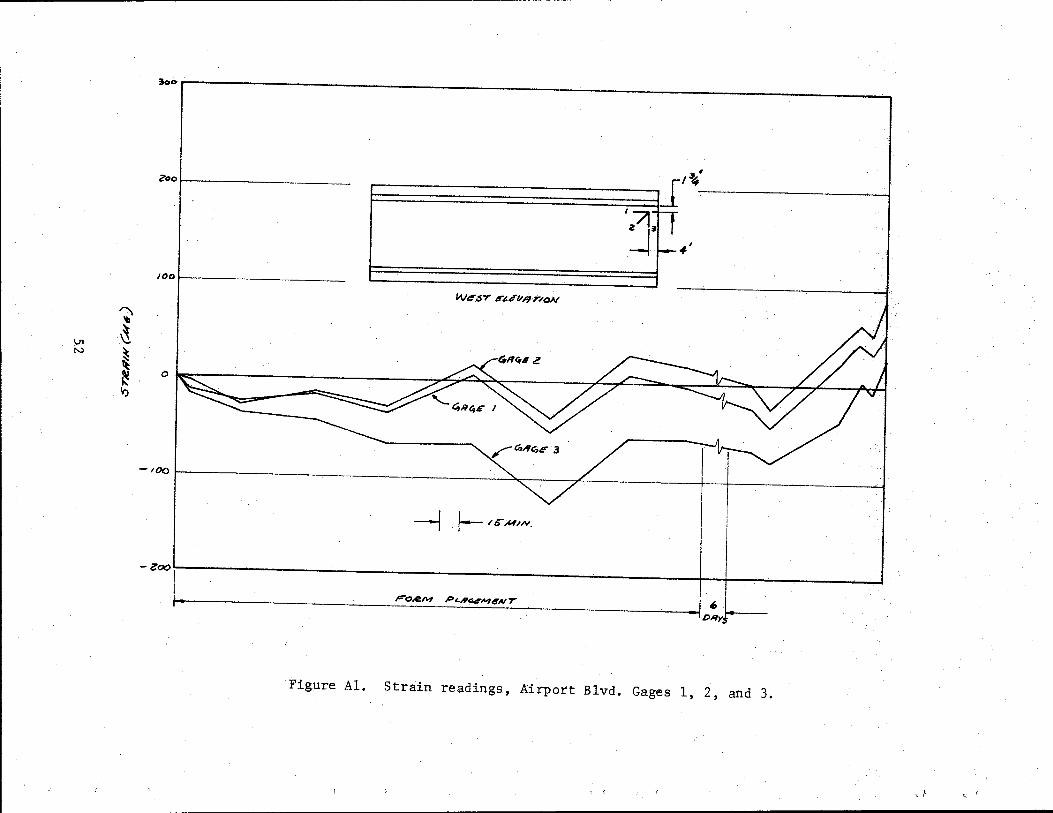
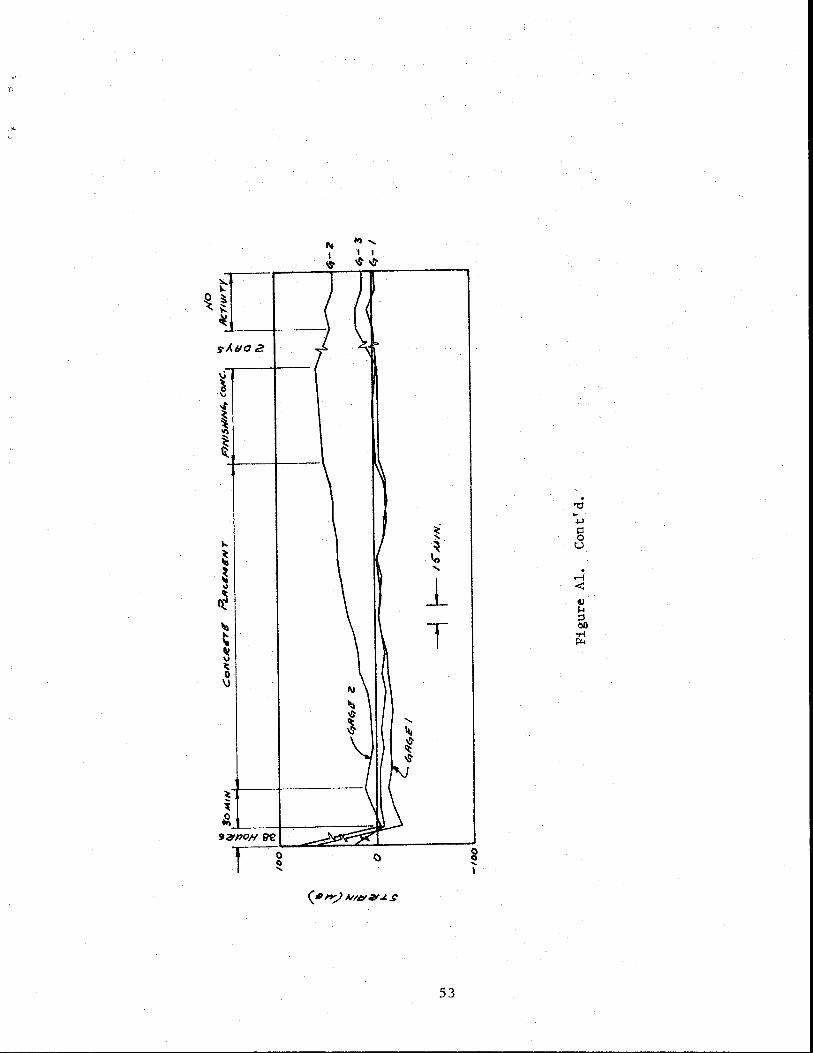
Figure Al. Strain readings, Airport Blvd. Gages 1, 2, and 3.
~ ~"
j.lf(j 2
'Q
~ "'
... ~ ~ " ~
" " ,. ~ v ~ 0 \)
~
~ () 10)
9 C/1101( E?e
Ill I
" ) j
i
~
,.,, I 1
"'\t ) ( ( .);~
)
I'll
""' ~ It
\ (
--_ __.....,... .?'
. '0
~
~ !., '
1 T
... ,., ~
"' "' ~
g .... I
53
0 0 ....
54
I I I I
I
I
~·
~ ' l T
" ~ ~ ~·
~~
~I ~I
I I
I 1 I
i
I I ! I
t' ~~ . ~
~
~~ :s \)
~ -c ~
~ ' .
"d ~
~
~ 0 u
.. ~
. ~
:i 4) ....
~ \1 ~
~ ::I \S bO ..... ..-1 iQ j_ """ ~ ~ " ~ T "' ~
~
....
"' { ~
! 1:
' S'¥fl0/( 9£'
() 0 gf 0 .... ..... I
(•"':) ,,.,_.J.S:
55
VI 0'\
I""\
" ~
r-----·-------·--···---·-··-f3?. . .@_1.'i ... PLRc.I!MeNT -----·- ·---1
/0() I -
I 80'T''T't1M 0,. P.JI;IpM
0
c.,-8
II) :.. <t C)
"
KO Rcmnry ~
~ -100 ~ ---·
' It ~ \') -t 1-- I 5" Mt;r_
-zoo ·-------------- ·------------ ...... ........ J
-soo~----------------------------------------------~------------------------~------------------------~-
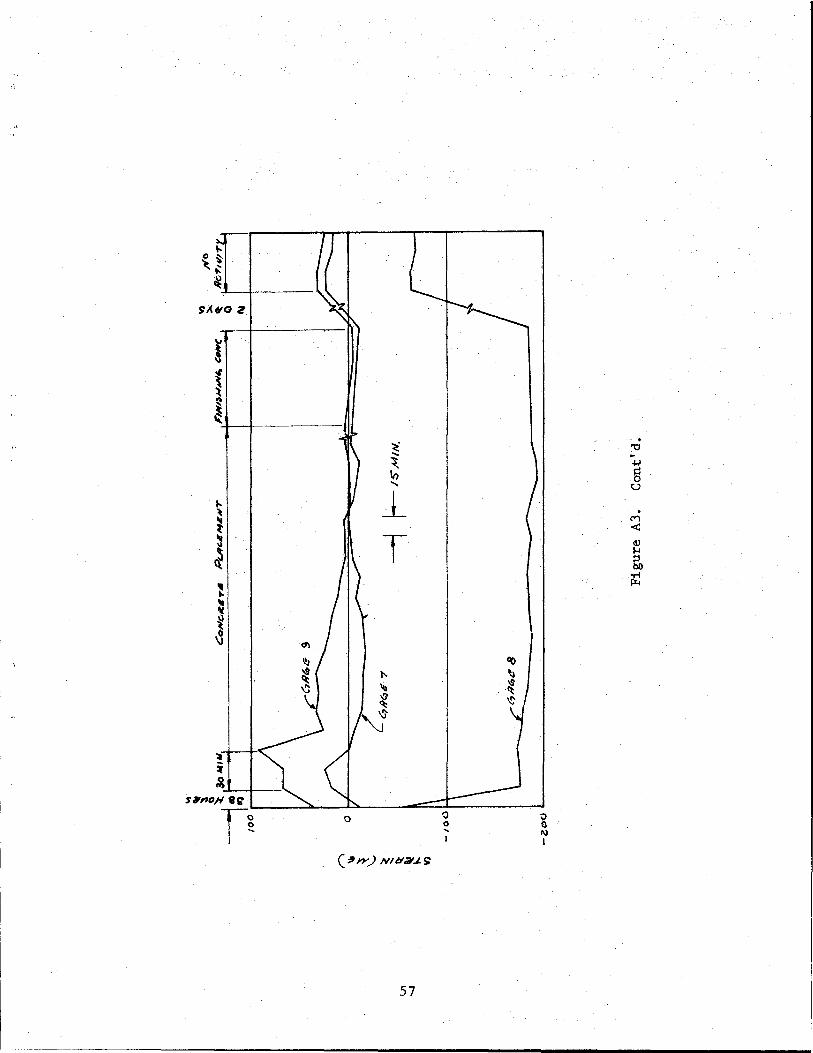
Figure A3. Strain readings, Airport Blvd. Gages 7, 8, and 9.
I I ,, f
j_
T
57
\J1 co
";;' ~ ~ ~ ~ ~
zoor--~===========--~---
/OOr-------------------------
\ov£$T £L.4V/ITION
0
-1 1-ISMIN
-ea,oL------------------------------~------------------------~-----------------+--r----t--------------~ Y) :0..
f- I""Oii?t'-" ,=>~Rc.aMEN7 _J ~~MINI NO 11CTIIIITY
"
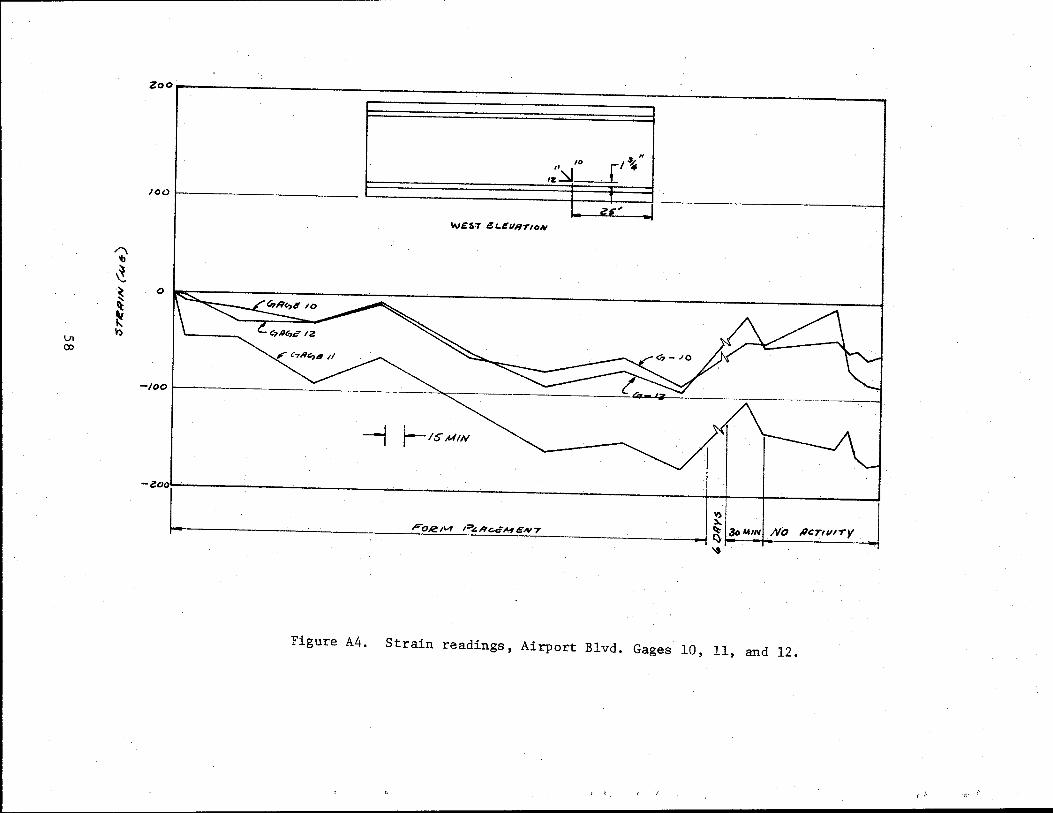
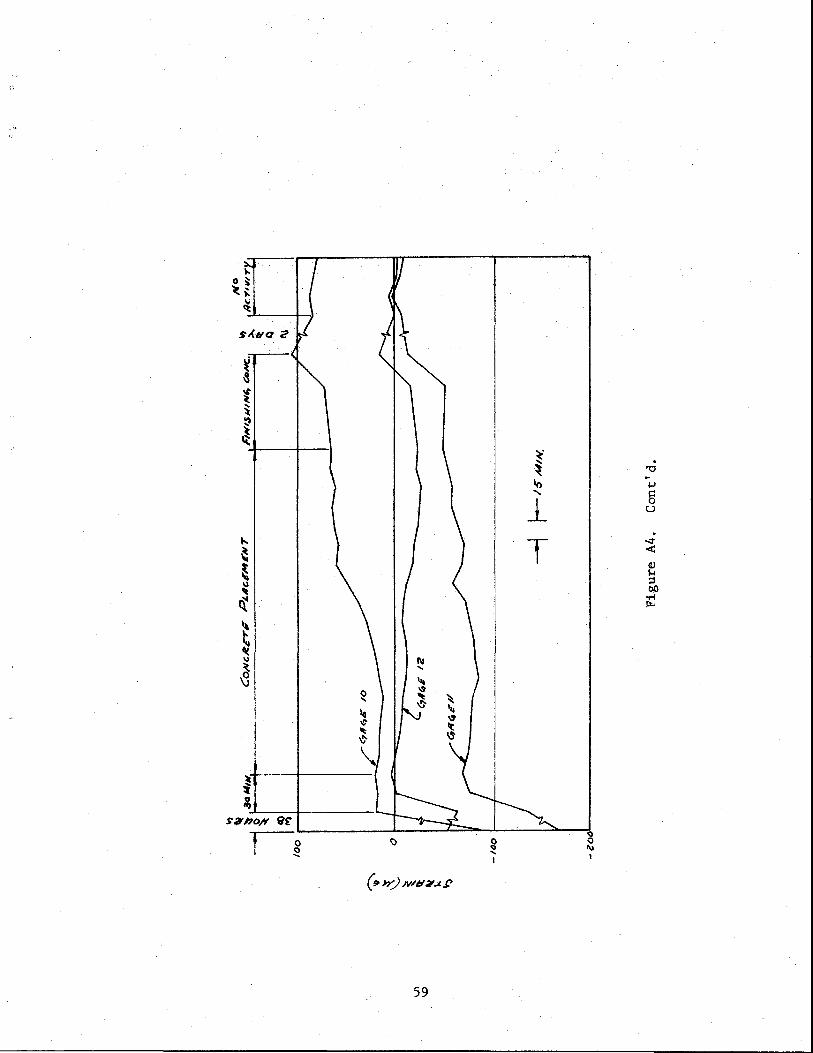
Figure A4. Strain readings, Airport Blvd. Gages 10, 11, and 12.
" 1 r::: ~-
~ t ~ ~
~ ~
~ .
"0
lo -+J ..... §
_L u
. ... T
-4'
~ <
.~ Q)
"" 1,) :1 ~ bO
~ 'r"l ~
,, ~ \) 1\1 ~ .... \j ~
0 ~ ~ ' ~
" 'II ~ ¢ It "-:
t- ~
\
59
~ -t
0'\ ~ 0 ~
~ II)
aoo
IDO !------~----
0
-/()0
-Zt:Jo
/llt:J.erH FNO
{Jo rrol"' oP" l!llrHM
"' .... rs 'a· ,,~__t
l l ~s-·
--i 1---IS"MIIIf
FCeH. r'.t.,qc£M£N 7'
;I~ ~ .I"'"'NI No llcr•wry (j - ••
'8
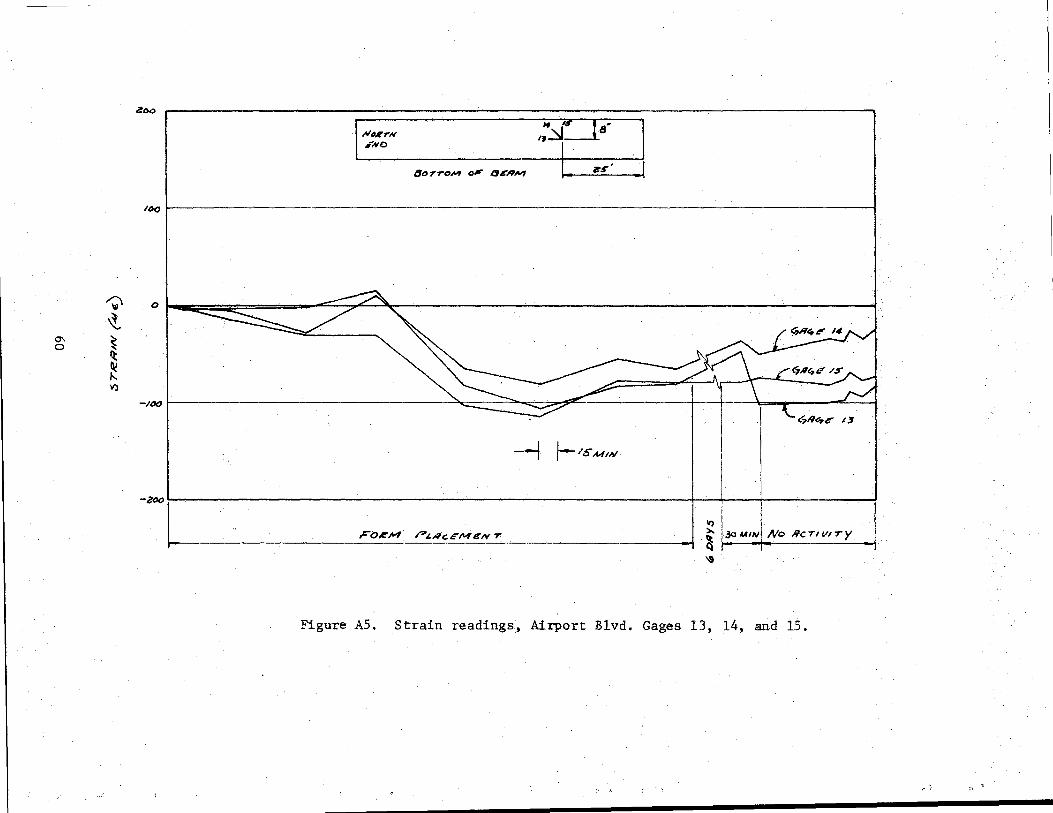
Figure A5. Strain readings, Airport Blvd. Gages 13, 14, and 15.
!"' )' ~. 1' )'

tAiila 2
~ { 1 ~ ~ .
'0 -.t-1
g c.)
.. " ·~· ~
~ GJ ~ i ~ &,· ~ .,.;t ~ j_ lXI
~ T ..
~
j
61
"' I'V
~ ~ ~ it ~ II)
zoo r--------------------------------------------------------------------------------------------------------------,
IOo 1-------Lt'~, T
I '4
WiFST E.Li!IIRTION
;u'
orq ~==- ::::::::~ -1'-.AI'AAU-.. - --&-zo I
-loor----------------------------------------------
--l f- IS MIN.
-z . \')
I ro.li!M P~RGt'Mt:'FIVT I ~l.io ,_ __ M_IN_.j_M_o_H_G_T_J_t/_I_T_;_Y ... .. . ~ ~ -·· "
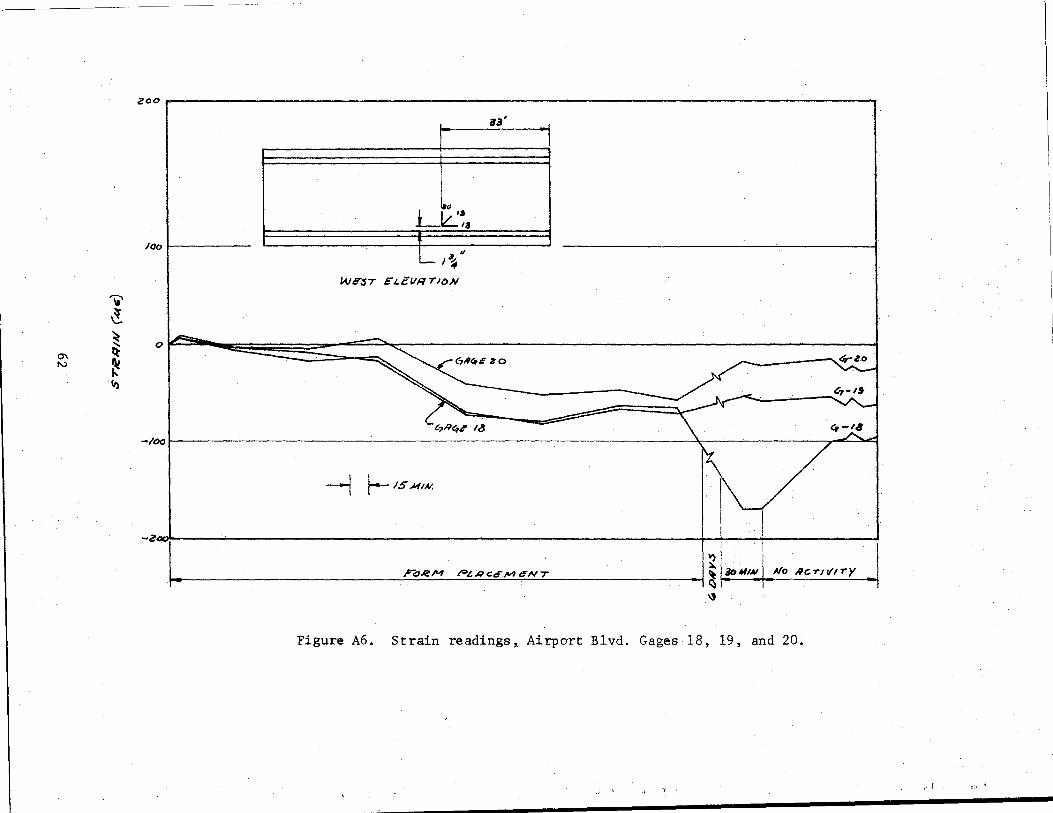
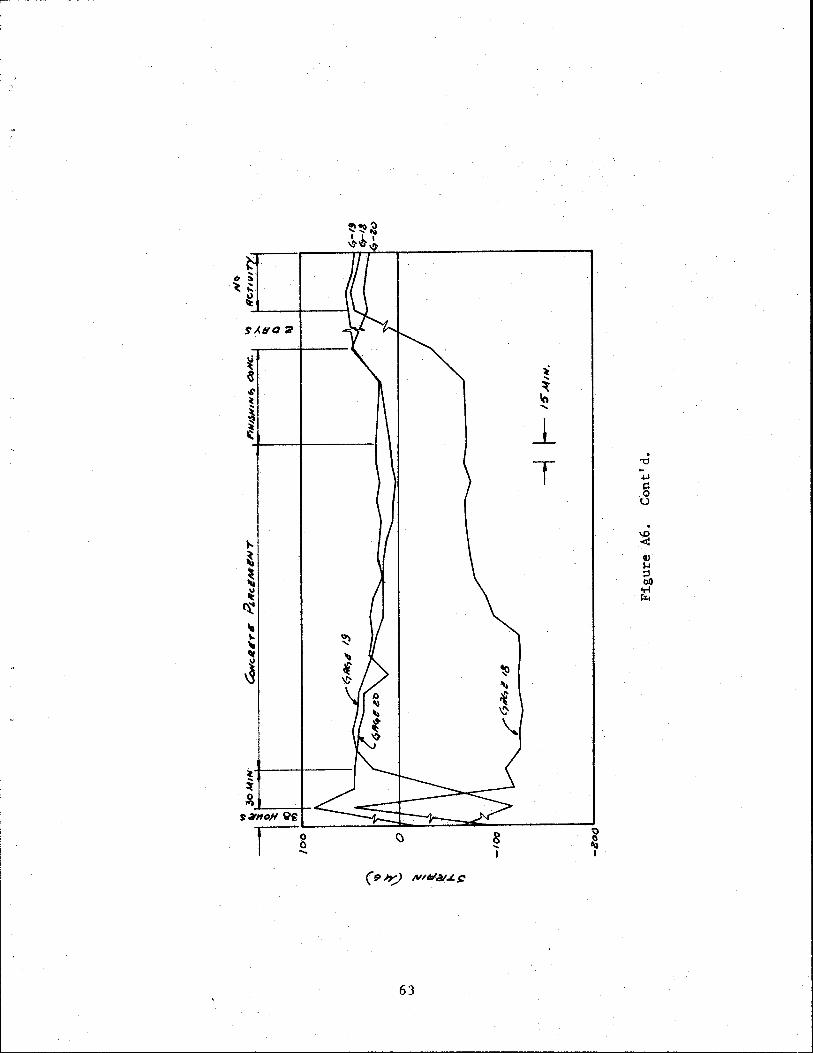
Figure A6. Strain readings, Airport Blvd. Gages 18, 19, and 20.
, r :>
~ .... ~ ln ......
j_ .
T '"CI -.j..l
1=1 0 u
. \,()
< G) 1-1 ::3 00
'rl ·r:..
63

loo
ill
Sorro.M "' 84"~M
tooL---------------------------------------~------------------------------~--------------------------------~~l
~ ~ ~
()
~ 0\ ~ ~
-/00
-1 ~ /S~IN, -coo
J:'o.eM P~Hce-'1611/.,. ~· ~ 1 ~ A#INI /1/o Rc'TtwT y ~ cs • • • ~
Figure A7. Strain readings, Airport Blvd. Gages 21, 22, and 23.
r-i r·' r
0 0
IW)
~
65
~ ~ It, '
1 T
"" 0 " ~ ~
"" ~ ~IC61o 2
~ .r ~ ~ ~ ~
" ~ ~ ~ ~
. ._
" ~ ~
. "Cl ~
.j.J
5 0
. ........ < «< ,.... ;j till
..-l rx.
0\ 0\
n 1Jl
~ ~ ~ ~ 1-J
Zoo 1------------ 4-z.:r +-··-+---·
I• J FOA!M P~..,ciMIFIVT \ / \ LJ ~~.UIN I ;Vo Rcnwry -~
" or~// \ \ I \ I j / \ I 1 I
-1 L WB~"T
r- 1$",.,,"'
S"~
_.,tWvl'f"ri'DIII
(ip- ~-~-
c:'7-Z'
I
•$(1',---~----~----~--_J
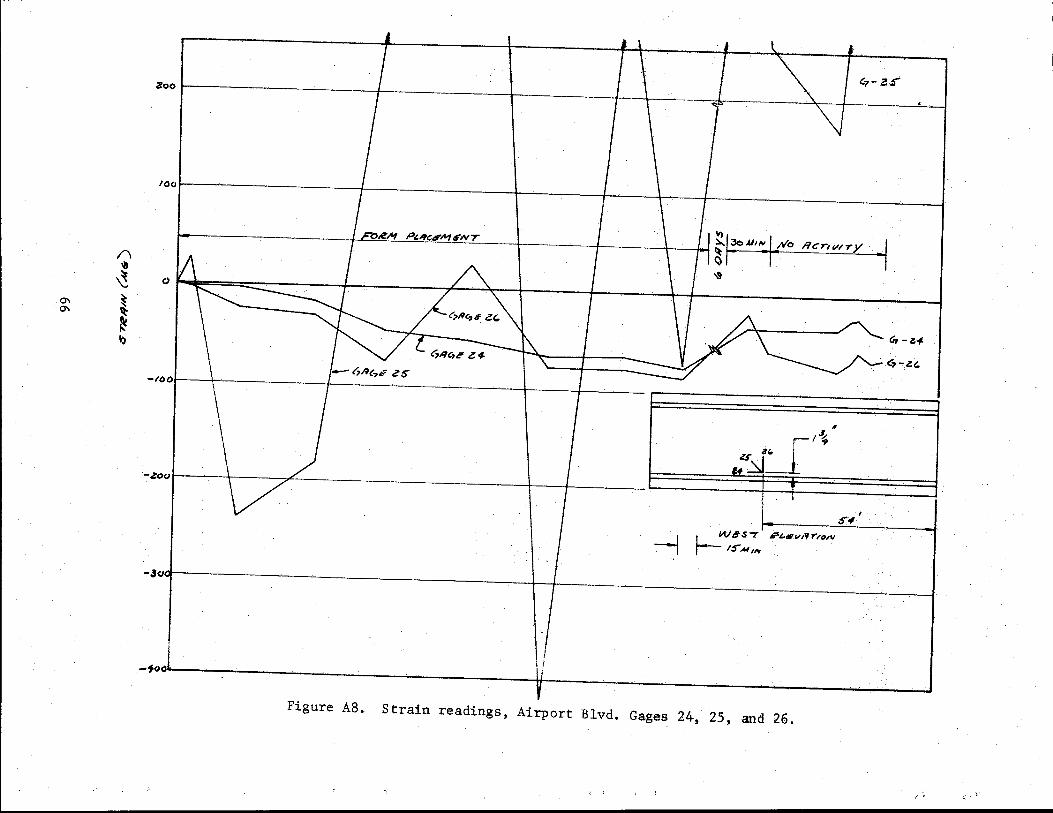
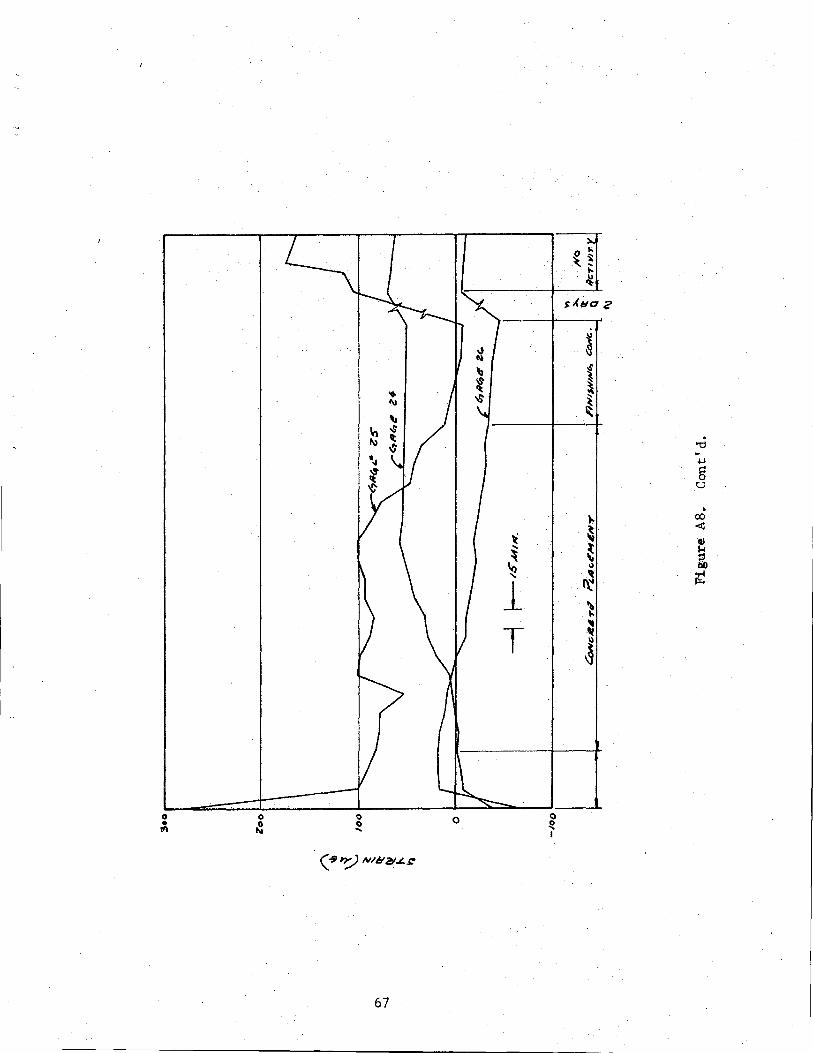
-foo--· -:-------------t-----------~----J Figure AS. Strain readings, Airport Blvd. Gages 24, 25, and 26.
;. . ' ·~' I t:.·
0 • Ill 0
~ ~ 0 ...
... "'
In fl.)
67
~· .... ~ ~
1 T
0
" ~~ "" ~
s AI:ICI 2
~ f ~ "' i ~
. "t:l -+J
§ u
• ""
co ~· < lQ G)
~ ~ •:;j
\) bO It ..-4
It' ro:.
~ .~
j
t I z3 8" 16~ Zoo' I n •-----r I
s.,.' 100 I 6oTTDM 01'1" 61#114
~ ~ ~
0
"' ~ CX> " ~
-.1oo
~ l--1-s- MtN.
-zoo. v
V}
1-. ,t:o;eM .P.t./1C,MIFNT j~p!.O.Ut-rjJ"o HCTif/tTY
"
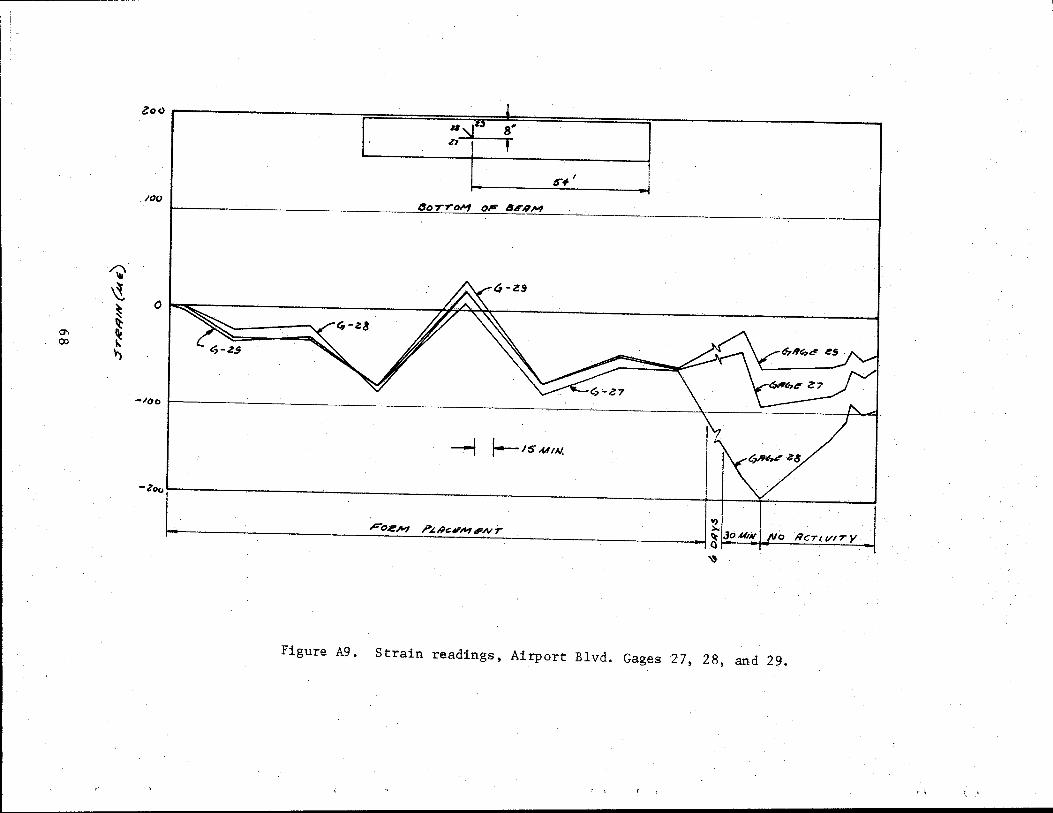
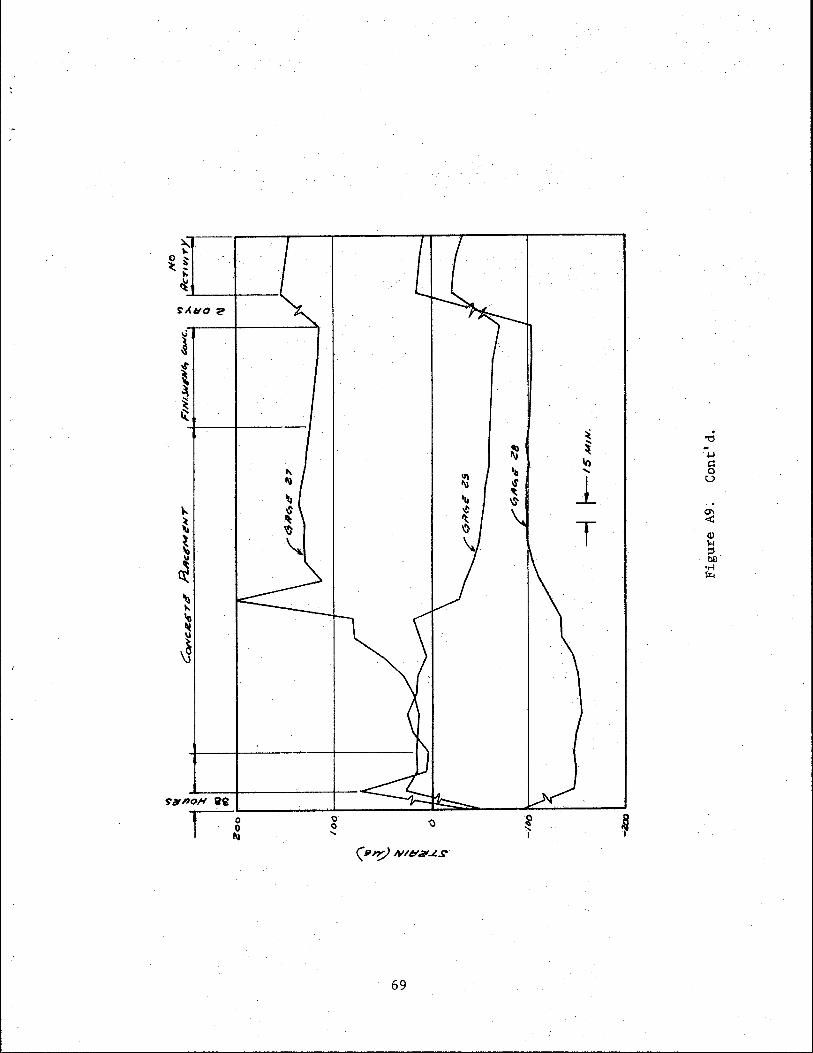
Figure A9. Strain readings, Airport Blvd. Gages 27, 28, and 29.
~ 'i \.
:.... ,.. 0 ~ ~ ..
"" ~
~l.uo 2-
~ t ~ ~ ~
~ . "'Cl
~ ~ +J ., §
" ·~ ..... ~ ~ ..r l u
~ ~ .
}.. ~
~ T ~ Q) 1-1 :::3
~ bll 'r-1
~ J:q
'll " ~ \1
~
69

/\ Ill
~ ~ ~ ~ ">
-...J 0
Zoo-------
/00
0
3.
r'~ H 61
.k:. :.a
~z'
liVEST 4"4-EVRTION
---1 ~ IS".wtN.
-/~,. ----------~----------------~----------4-~-+------__j ..,
I· F'OJeM Pt.RCIM~/VT J ~ ~ Ml~f_:Vo RCTt wry
\S
Figure Alo.· Strain readings, Airport Blvd. Gages 32, 33, and 34.
G,- :u c,-,.,. 4-.JZ.
...
"' 0 ~ ~ .... ... ~
SI.Ha 2
~ .t \ ~ ~
l .
'"d -.j.J·
s ~ .. 0 ...
~ ~ ~ ~ 0
.--l
1 \r <t::
~ ~
~ ::l
T QO ..... ·~ ""' 'II! \)
~
~
71
-..J N
~
~ ~ ~
~ "'
zoor-----------~----~--~r-------------------------,-------------------------------------------, :u. J~
"z ,
/30 T.,.OM OF 44"RM
fOOr-----~------------------------------------------------~----------------------------------------------_j
o I ~ // ~ . 77'1\ I
-100,~------------------------~~------------------------------------------+-~----~--~~~~--~
-zoo
. ---1 l--IS MIN.
I. ro.eM P"H<IM<'-"T
"'I ;),.
~ t_:oM'!~./Vo RC.,.tVIry .I 'S
Figure All. Strain readings, Airport Blvd. Gages 35, 36, and 37.
" .

'"
$'AHO 2
<:
~ ..... ~
-~ .....
! l " ~ T ..,
" II) II) .
~ "0
~ " .'II +J II) ~ .>$ . s:::
\$' ct 0 \a ~ (.;) )...
~ ~ ~ . t r-1
r-1
It < It (!)
1-1 ;:1
~ 00 ..-!
5 ~
~ \)
73
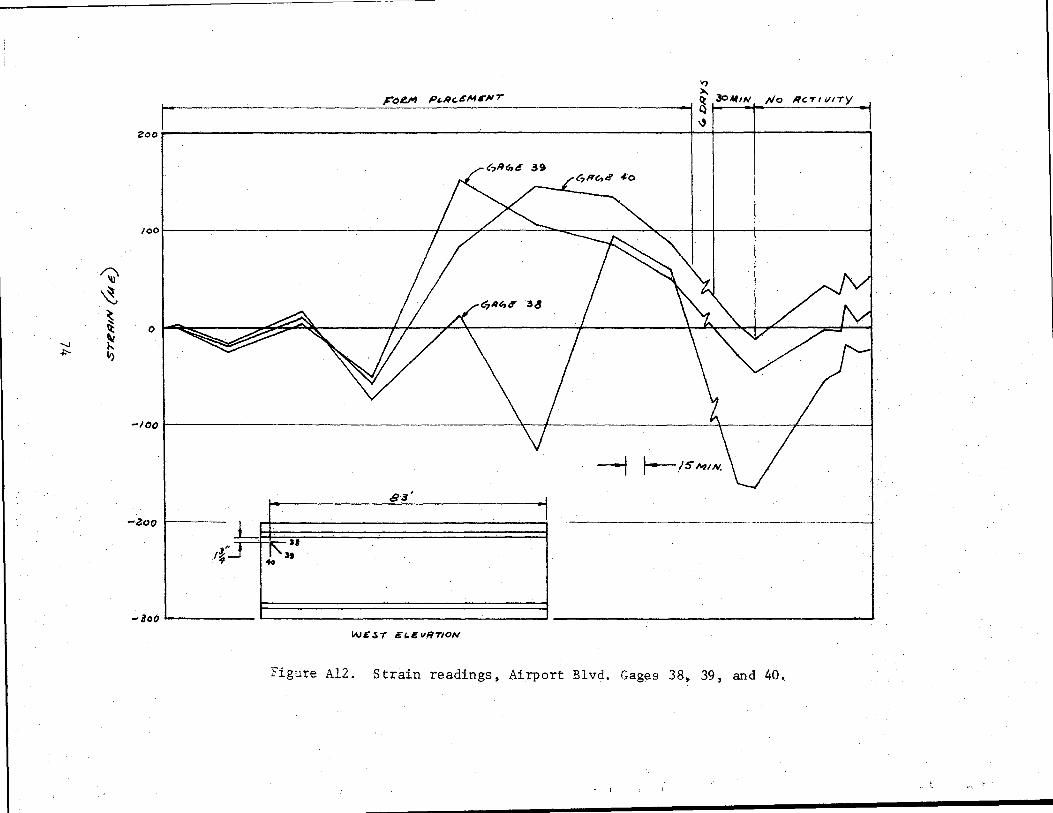
~ ~ ~ q:
-...J ~ -1::-- II)
"' >..
ooo ! - F"oUf p...,,4H"" r -~ ~ f"'~l No "" '""Y ~
100
0
-1ool-----------------------------~
-I as'
-·zoot---
/~
-loo '-----W£.S'T' EL.£VFITION
Figure Al2. Strain readings, Airport Blvd. Gages 38, 39, and 40 ..
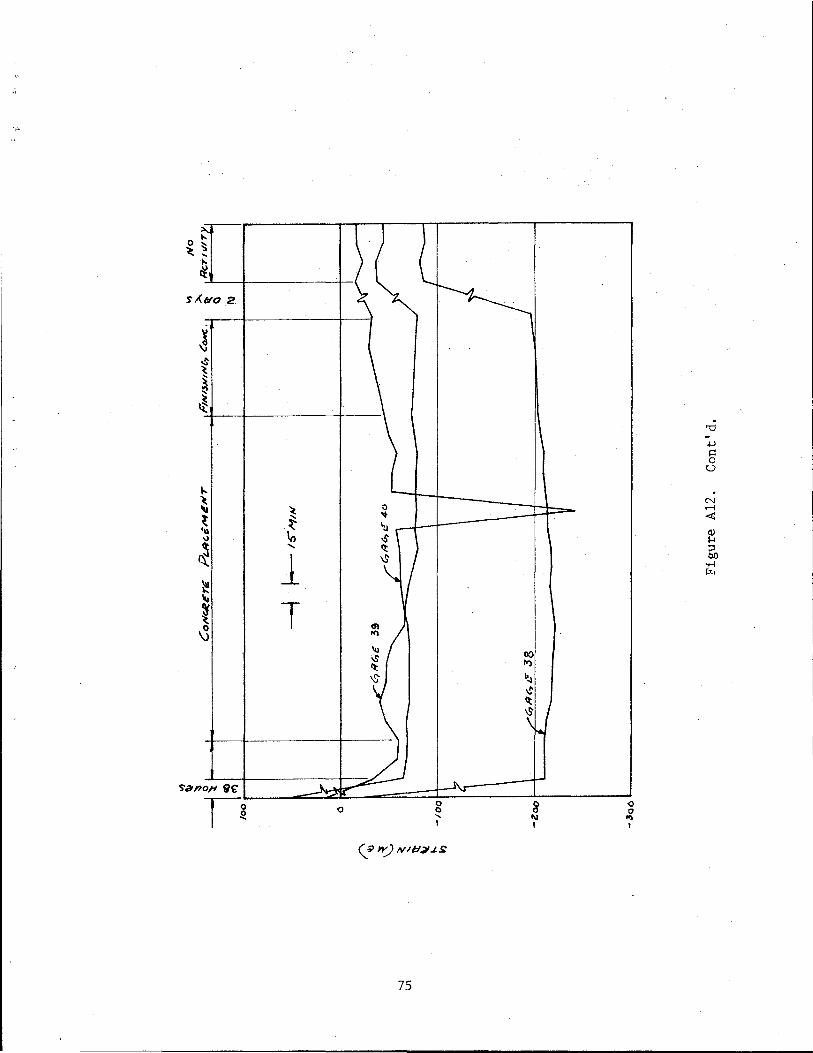
0 ~
~ :;; ... ... ~
l:fO 2
~ ~ ~ \ ~ ~
"" ~ ~ 'll \)
ct
" ~
"' ~ 0
0# 8£'
~ .... t ~ .....
l T
)
}
{ 0 ... ~\ ct \S
\.
"' It)
lu -s 't '$'
---
~ ~ 0
75
l ~
0 0 .... I
J\..
I
00 lr)
~~
'>! ct
~ ....
8 1\1 I
=-
<) 0
II)
I
-+J I:! 0 u
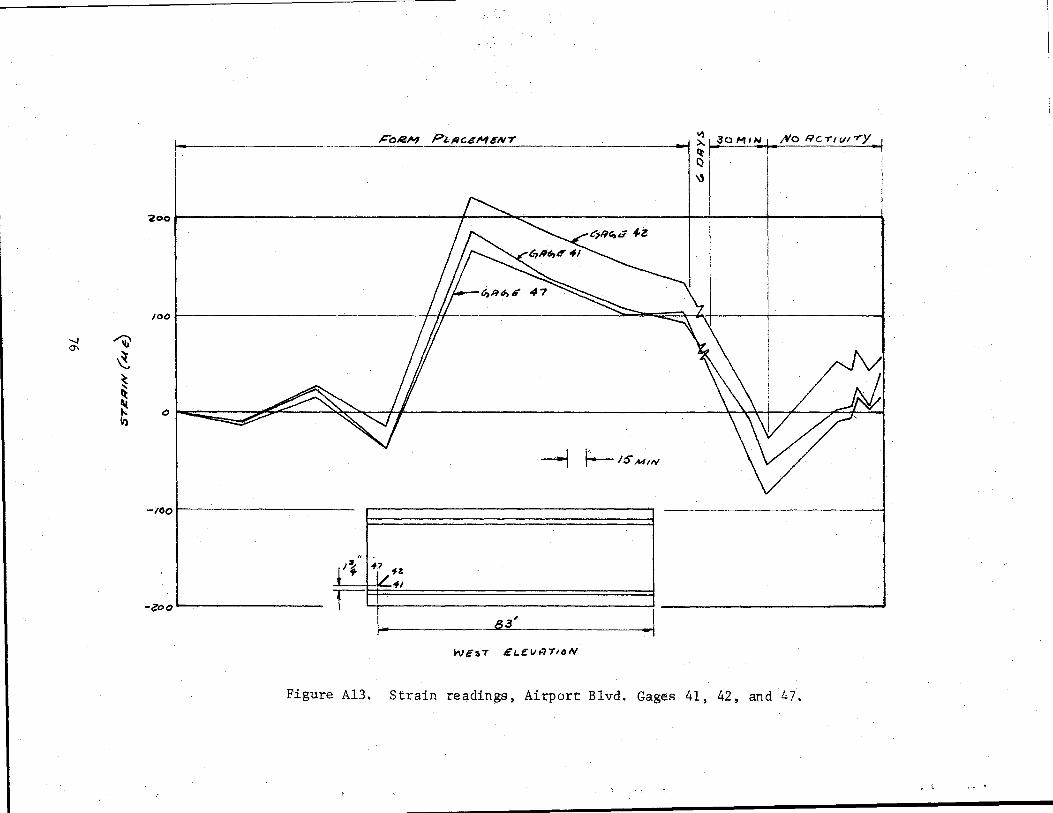
...., ~ 0\
~ ~ ~
~ V)
.&"oli!-M PLRG4M6N-r ----··--· ------·
I
.., ;>.. L-30 Mllw It -Q \)
;Vo Rc rt vt r-y -1
200~-------------------------------------------+----~~~------------------------~~~------~----------------~
JOO
0
--1 f:.;-- IS MIN
-100
,, ~~ 1"7 fZ
IL"' -~oo .__ ________ _
r 63' --l YVEt>T EL.ev.:ITIDN
Figure Al3. Strain readings, Airport Blvd. Gages 41, 42, and 47.
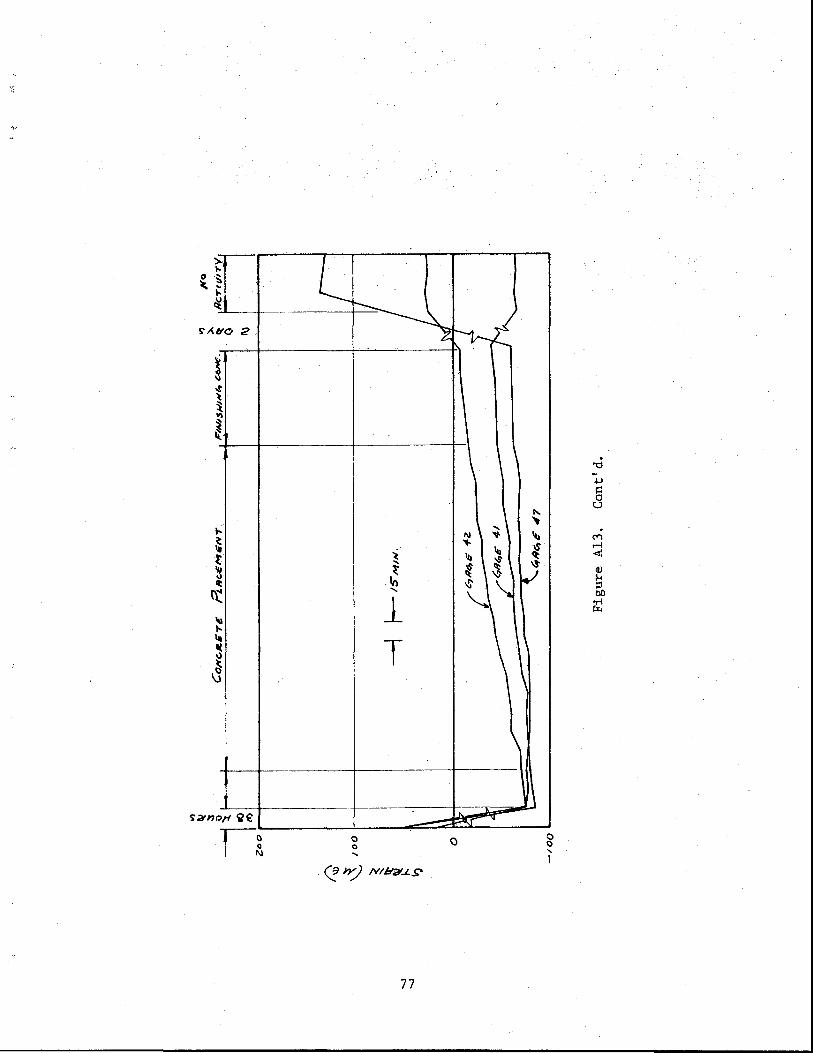
... I s. L__ ~ v r---\ 11'0 2
~ -t ~
~ V)
i ll·
---I
I I I
.... ~
~ t 'II ~ ..,
In It ..... lt 1 lq
"' " T Ill \)
~ \3
rJ0/1 g~
77
lit
I--I
\
1\1 \ ' ...,. ....
"' 11.1 >$
~ ~ -s \. "J
~
"' .... '~ ~
J
\ 0 0
' I
. "0

~~~~ s•' J OOTTOM 01"" lji!'~M
zoo ----------·--···--·--·-·---- -----------------------------------i
~ --l I-- JS AtttN
~ -....J ~ /00
00 ~ ............ """'" "-·--·--·--
~ ~
( I J'\1?' r 1 <: I K . , "'\J' 77< I
-~ . ~ l ,!:"oll!M P~RCI!!'MIFNT _J ~ - - ~ j No Rcrtvt-ry _,.
\S
?igure A14. Strain readings, Airport Blvd. Gages 44, 45, and 46.
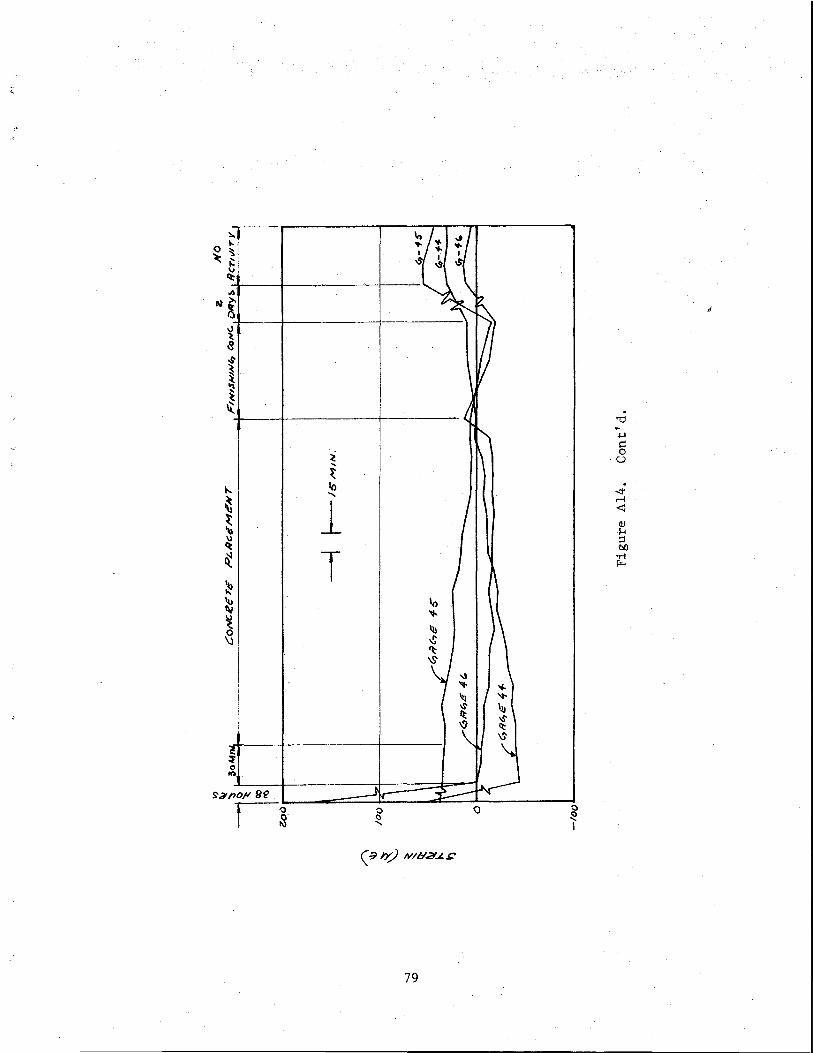
.., .,. ~7 .,. ... I I I
' ~ ~,
\ K
I ~ ...
~ ~
"' I i ~ ... ~ lQ ....
1 T )
IQ .... I Ill
~ )
'l::
~I~ "" 'II ~
( \$' '.u It \$"
\ <1: \S
':1 \. i 0 ,.,,
~ no.f/ Be --'tor -~ ~ ()
79
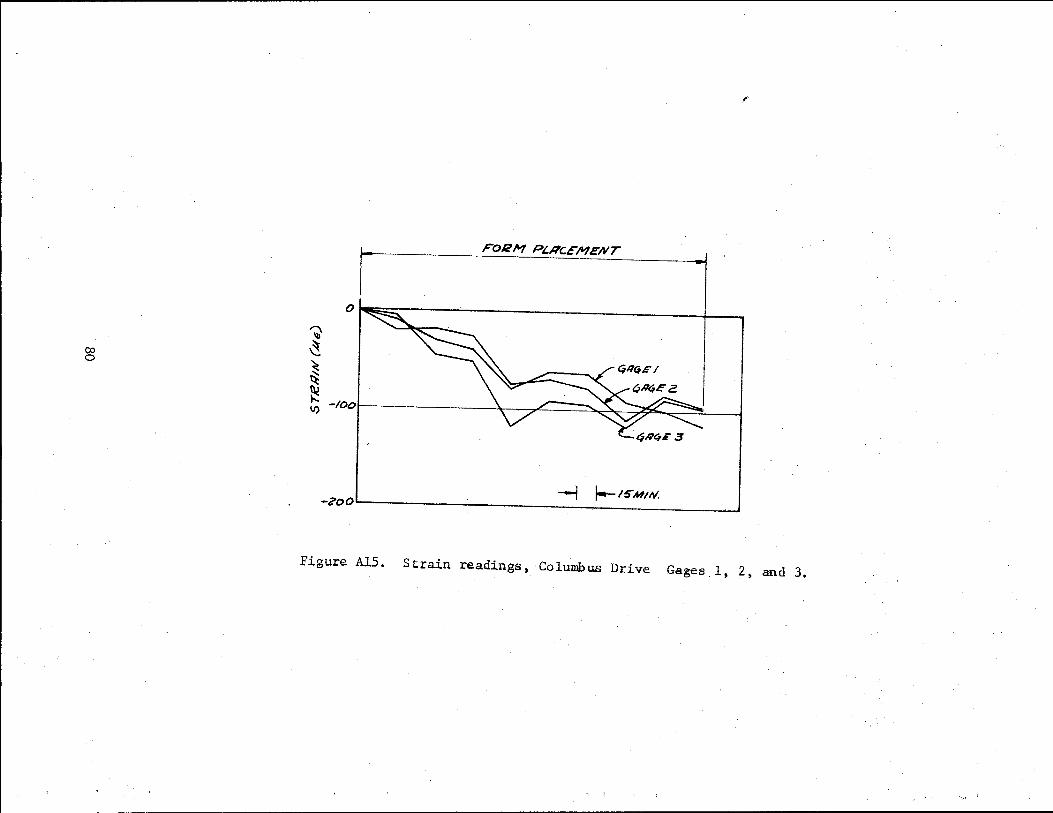
co 0
~ ~ ~ ~
~ V)
,.
r F0/21'1 Pi.Ac£1'1EN7
01~ I ,
--1 1---ISM/1\1. -200~------------------~~~~:_ ____ __j
Figure Al5. Strain readings, Columbus Drive Gages 1, 2, and 3.
} '
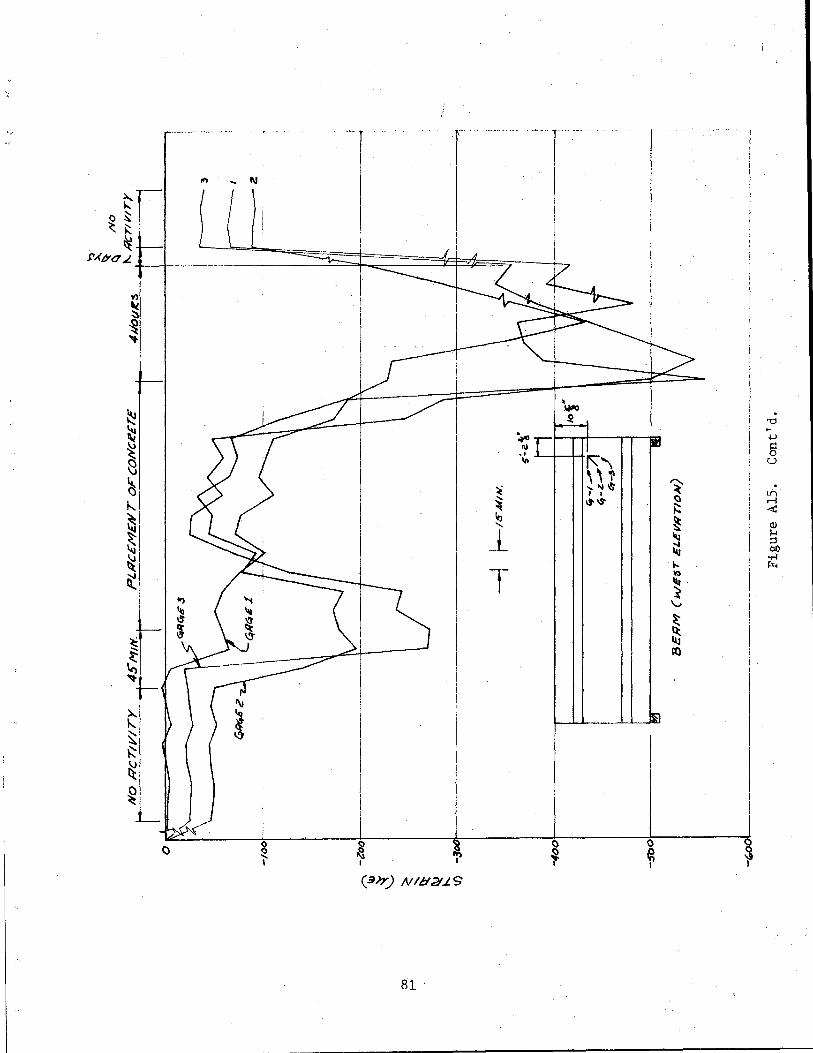
~ 'U
~ -.j.J
~ g 8 u
~ ~ ~ . Li)
~--.1 ~ () .-l ~ <t:
~~ ~ ~ a.l ' ~I _l ~ H
;:I ~ b.O
~I ..-! ... F-1
T \';1
~! "' I ~ \.;
~ ~ ro
(3Jr) Nlb'2/.LS
81 .
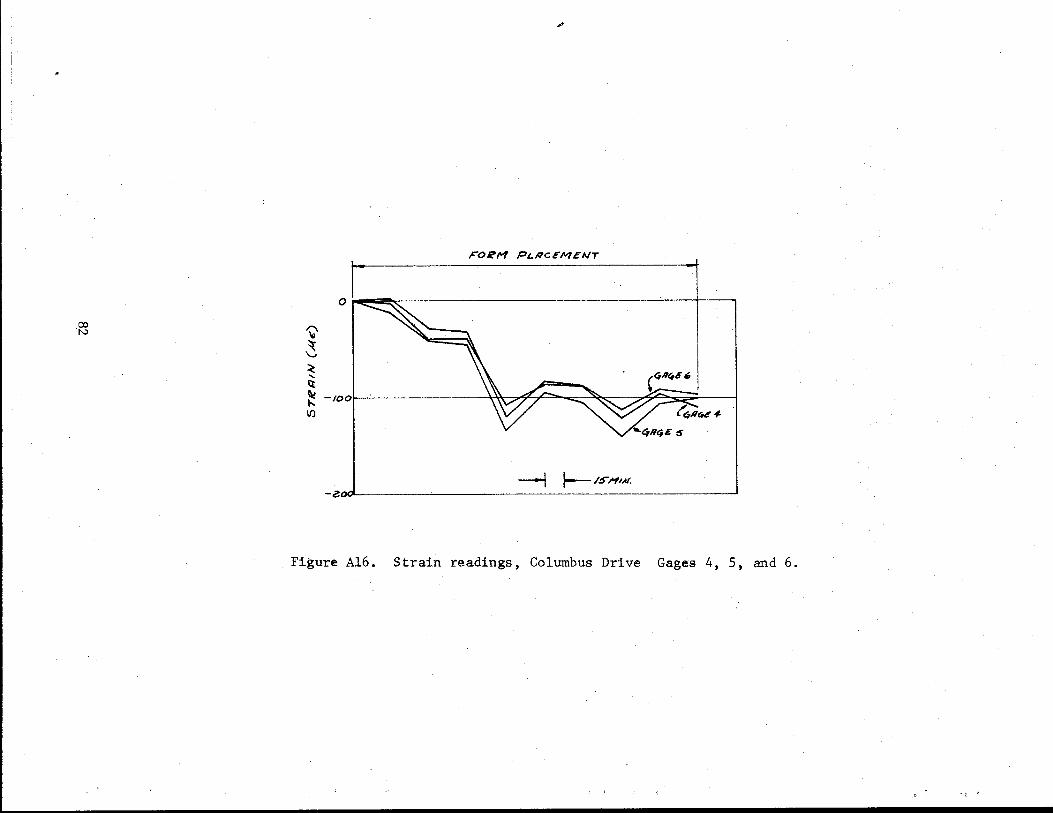
·~ ~ ~ ~ .... tt
...
FOef"/ PLI1C£M£AIT
o r'~-=~~-----------------------------------~----t----,
1\! -100
" II)
__, 1---/:S"H/AI.
-2~~----------------------------
Figure Al6. Strain readings, Columbus Drive Gages 4, 5, and 6.
-,,~ II-
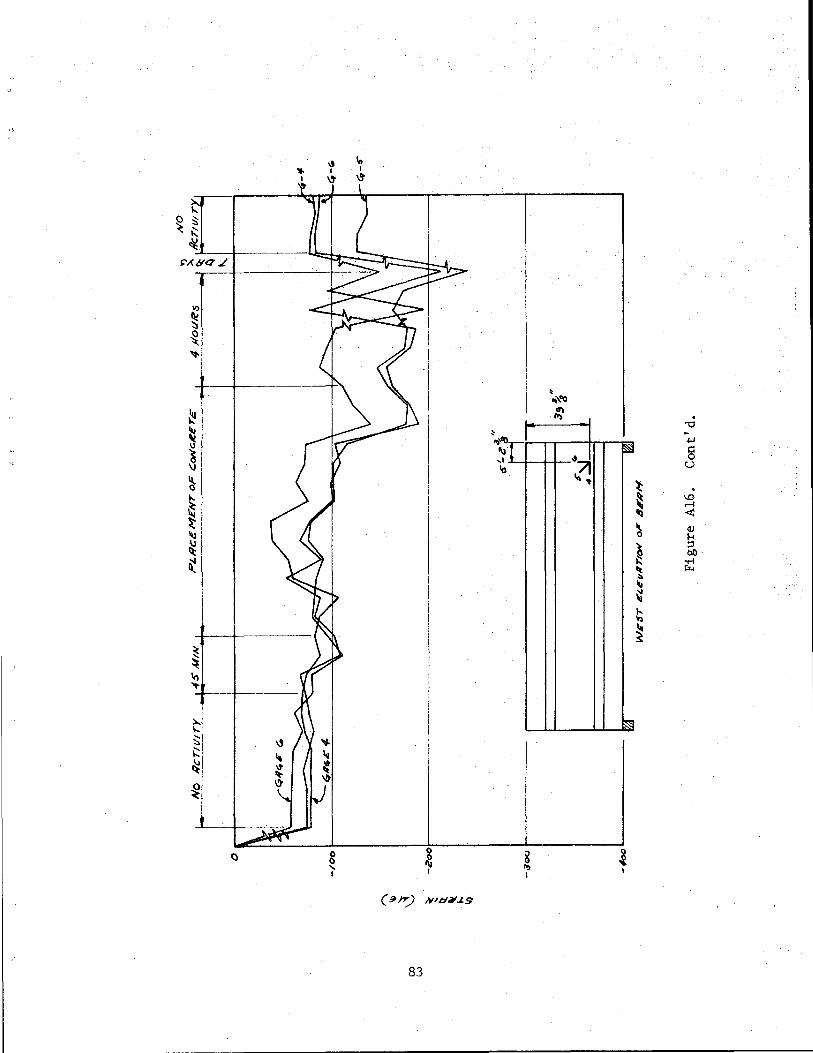
~ ~ \)
~ ~I "'I ~ ~ Ill \.)
~
~
~I \..., ~,
~I
t
... I
g ' I
83
~ .,-.ao
"' ... I
In
~
.. \."0
~ "0 --i'-1
§ "71 u ~. 't .
~ ...0 ...-!
~ <I!
~ Q) 1-<
~ ;:l bO
);: ..... ~ !X..
" ~ ..... .., ~
8 .., I
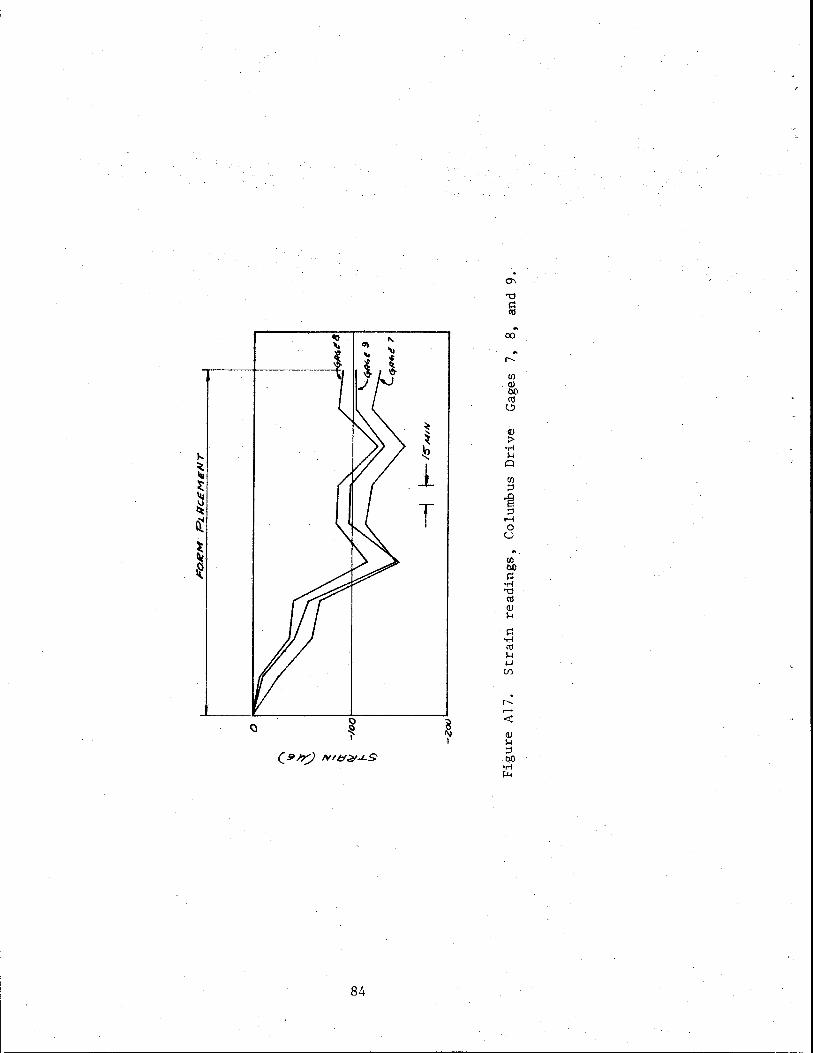
0\
"0
~ .. co
.. r--
Ill QJ bO II!
0
~ Q)
~ :> ~ ·ri
!-1
1 0
Ill ;:::l
T "@
;:::l ,....; 0
u ...
Ill bO p
•ri "0 II! QJ 1-<
·p -rl II! !-1 .j...J
C/)
r--,....;
~ <r: QJ
I !-1 ;:::l bO
•ri r:<..
84
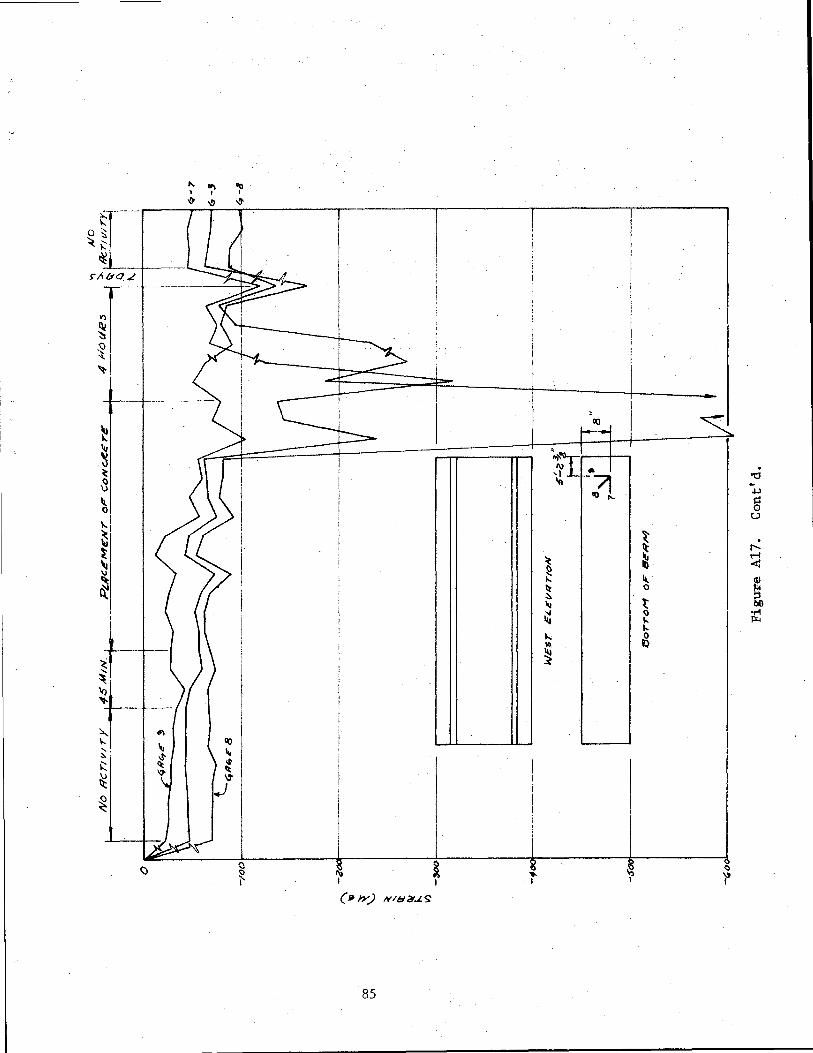
.... "' I I
-& " tr--0 'I ~~ ~
>Avo .t
'1
~ ,0 I ~I
~I
~
~ ~
~ II. 0
~
~ t
~I ~, I i
~ ' ~· '<> "J-
~I -'\
" GO
;:: -s- "' i::: ~ -.t
"' l:t
~ "" .J ~
'I) I
"
1\1 l
2 l
85
, GO
~ ~ "' It :)
"' ~ ... \0
~
. 'tJ ~
oi-l
§ u
~ ~ t--
.-f 16 <
"' ~ 0 ::s t bll
0 ..-4
" f;t.< ... g
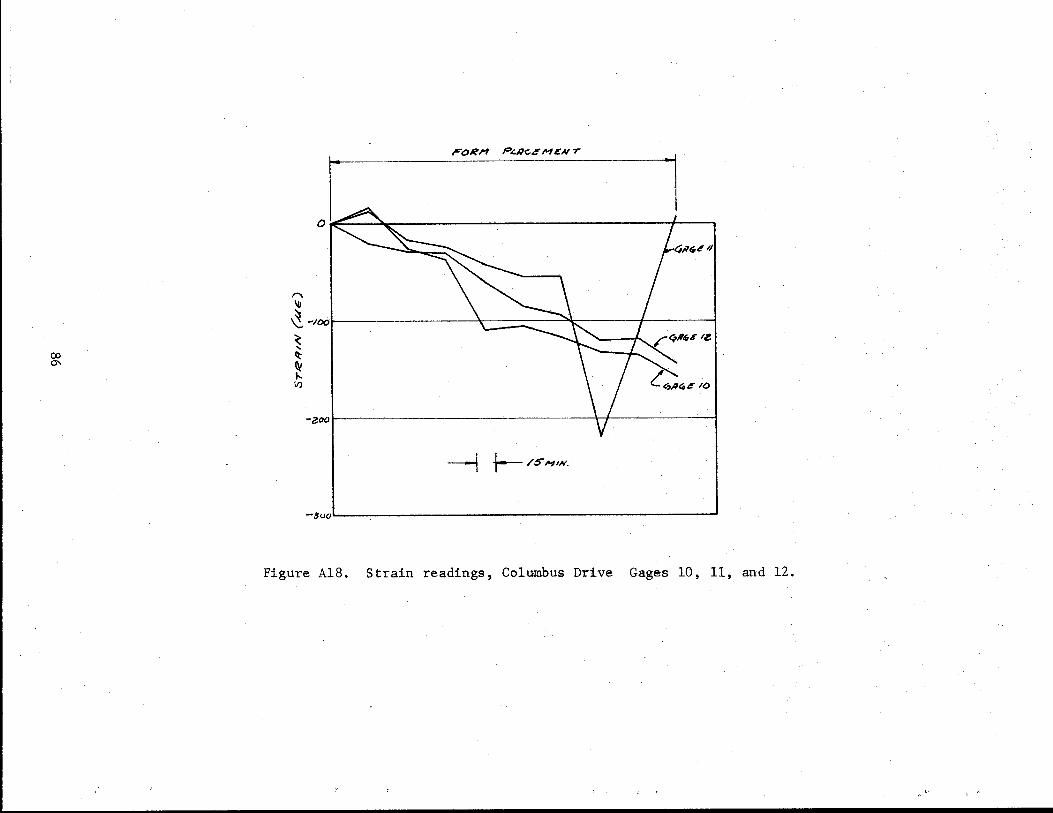
r-------------------------------------------- --
(X) 0'\
_..0 ,.,., P<N<<FM<Nr ~
I"\
Ill I I ~ -1ool I ~ .... It
~ II)
-zoo~------~----------------------------
--i +-- /S'"11N.
-3ooL---------------------------------------------------------~
Figure AlB. Strain readings, Columbus Drive Gages 10, 11, and 12.
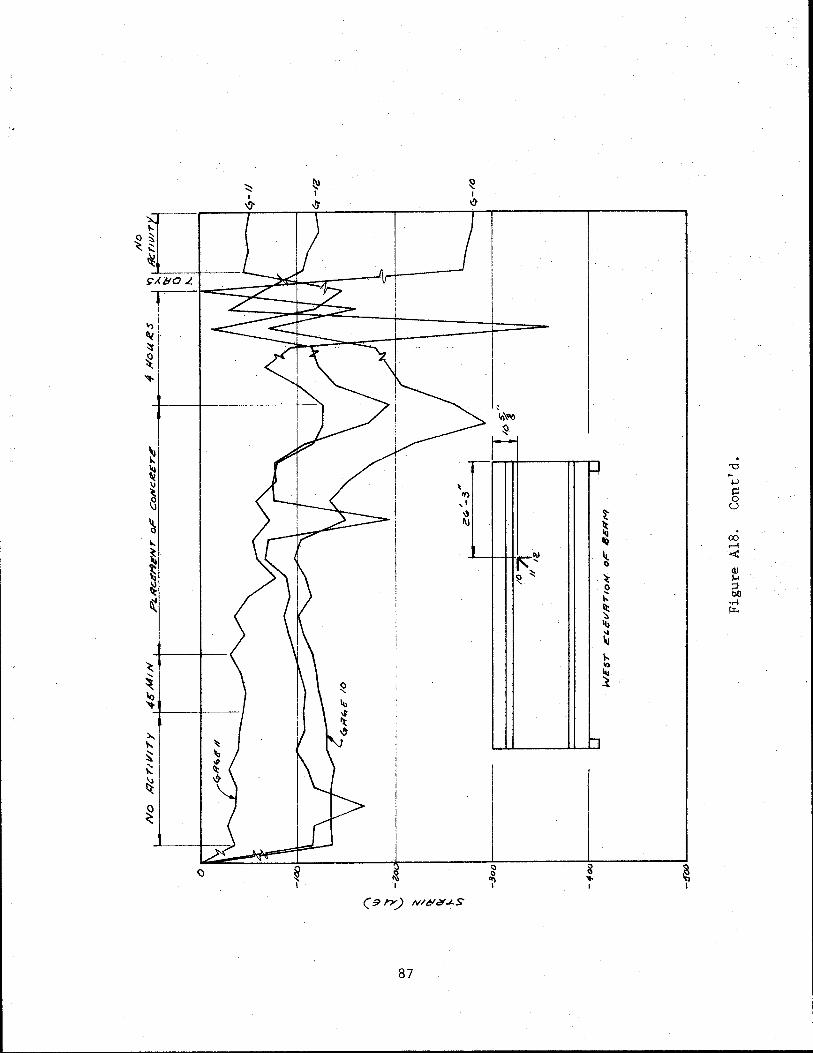
I--
r- H I
I':~ ~ ~
h
87
I
~ I
. "0 -.j..,) l=l 0 u

co co
1\ lb
~
, .. r-·-·- ,-OJIE>M_ __ PLRce:_~
°K \ I I
~ -/OO ........... ~ ~ ~
" V)
---1 ~ IS""Mnv.
-3oa-----------------------------------------------__J
Figure Al9. Strain readings, Columbus Drive Gages 13, 14, and 15.
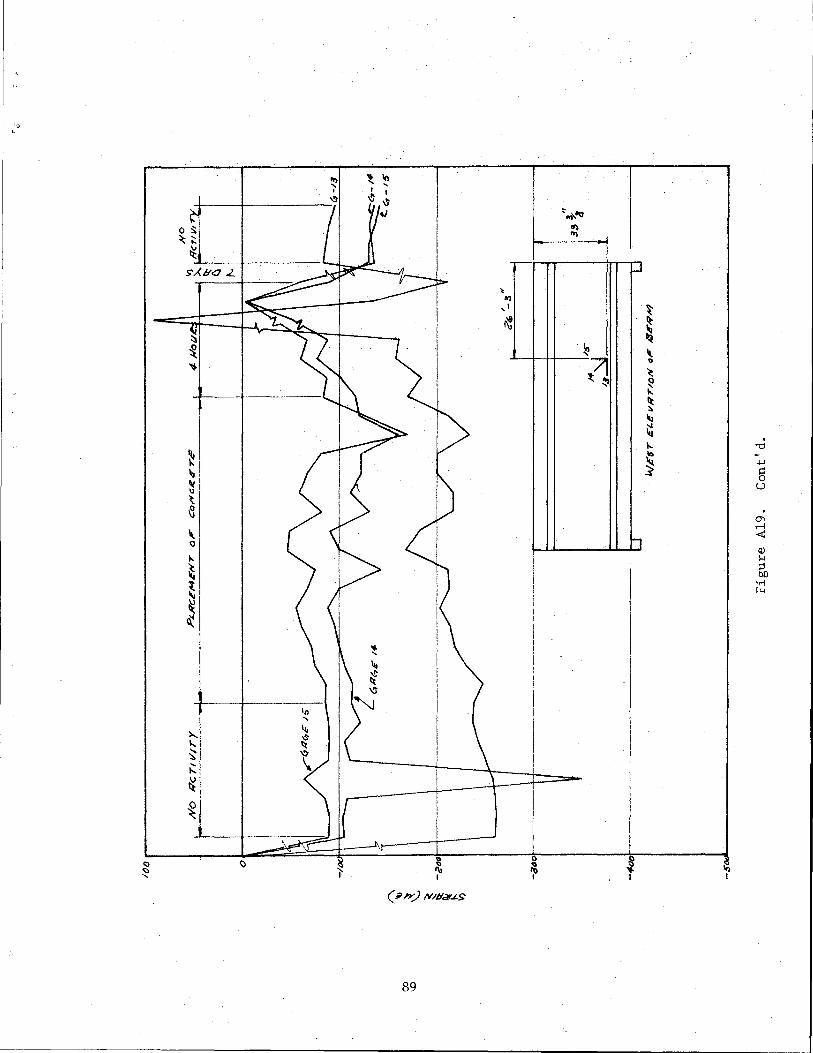
~ I
4-----+-----------~
~ ..,I
~I ~ ~
\ 0
1-
~ ~ ~ ~
'n '
"' ....
89
" ,., I
0'\
"'
~
?1 ~ ~
p
~
~ ~ \ 0
~ ~ ... ~ :. ~
~ "" ... ~
h
t I
Iii I
. '0 -+-1
§ u
. 0\ .--1 <C QJ H :;:l b()
•..-!
'"'
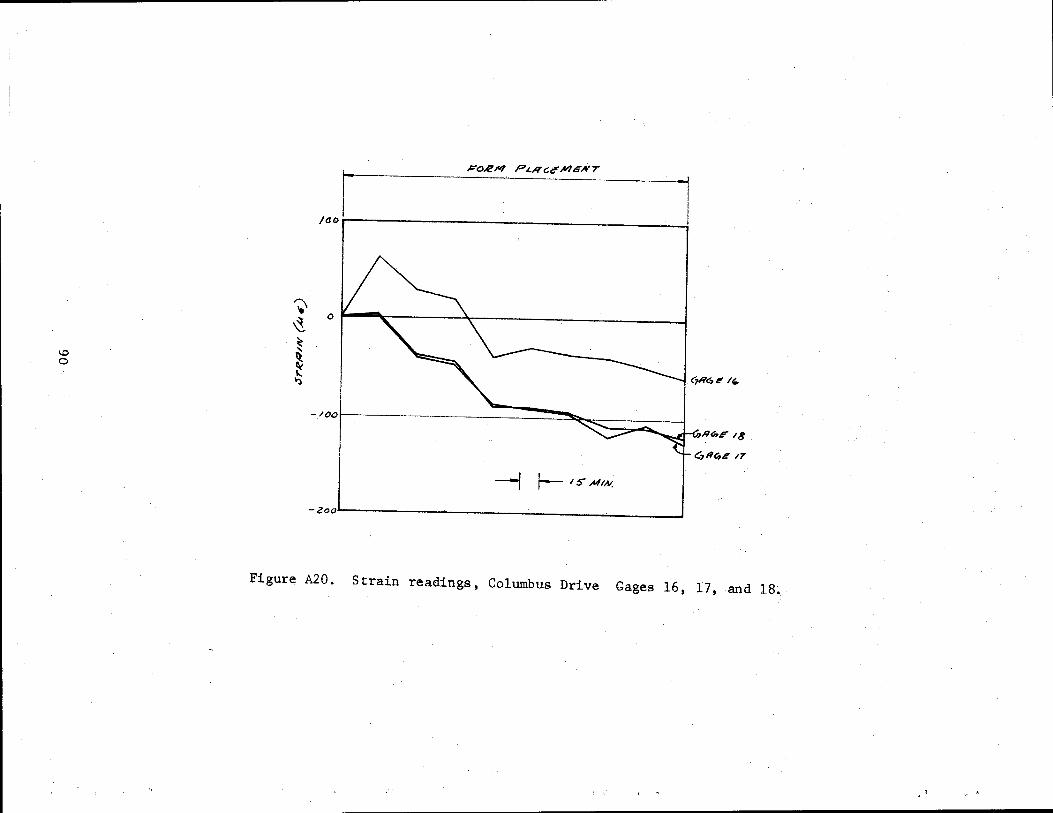
1.0 0
~ ~ ~ ~ ~
I" """'" P'-AG~"'GNT /00 -~
0~~~----~r-------~--------~
---1 I-- I S' ,All 1/V.
-zoo----------------------------------------------J
,:u,,. 18
Figure A20. Strain readings, Columbus Drive Gages 16, 17, and 18~
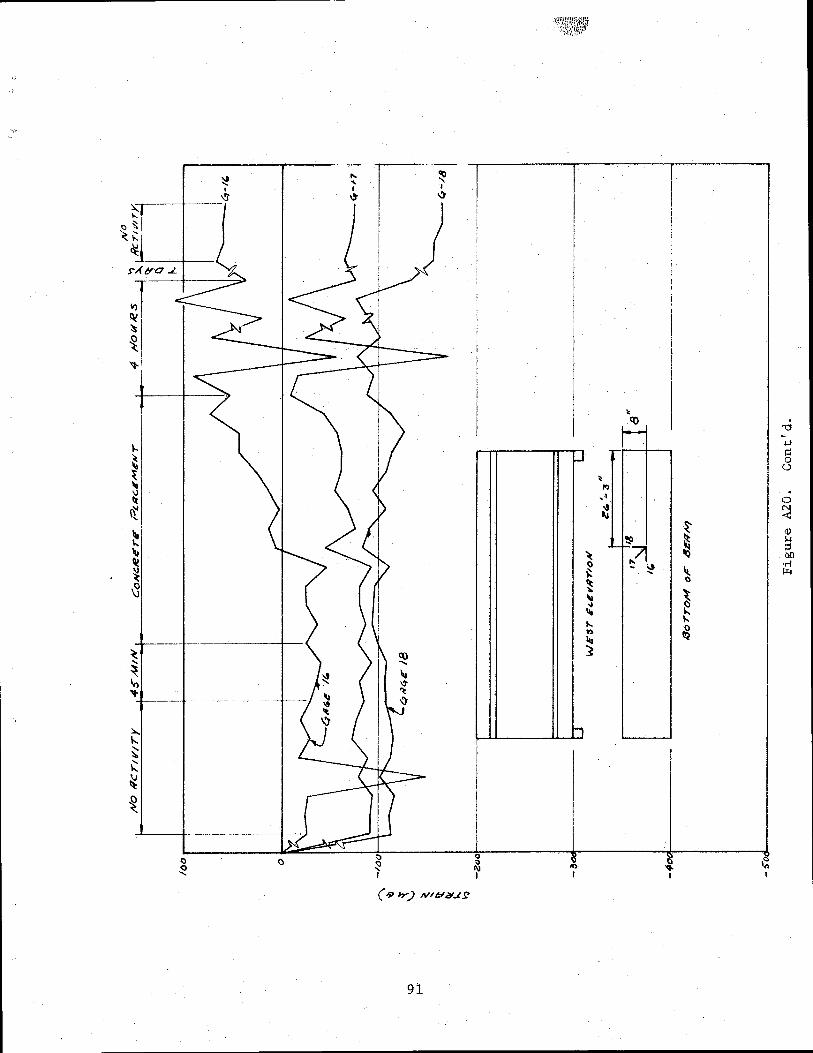
~ I
---~
.... ' I 'I)
I
.,·----· ~ I
"' ;
91
l
I p
~ ()
~
~
" .... Ill .... v.o .., )
.., I
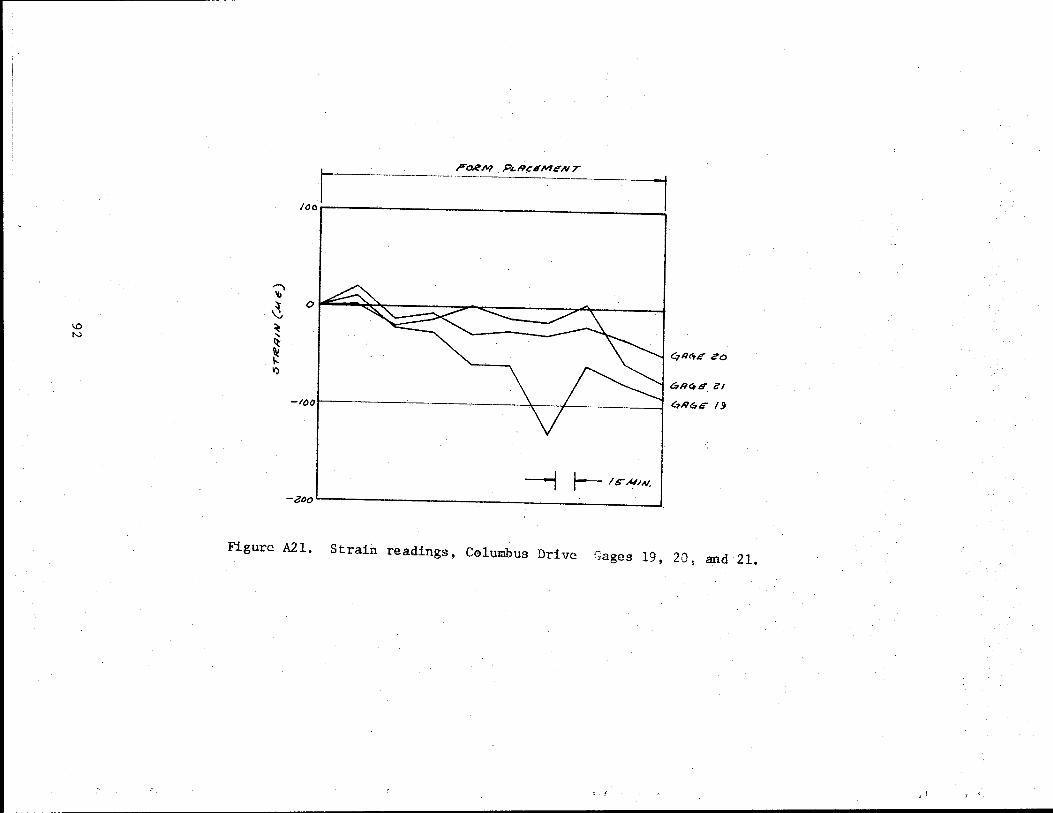
~~-----···---!:~M PLRCirJVI£111 T
/00 . .,
,...._, ~
~ 0
\0 ~ N ' ~
~ I " \ ~ C7llt?£ Zo
I')
-1ooL \ I ~4R41Fi!l C?R4E /j
--i r-- / t> ;f-1/,v_
-~oo
Figure A21. Strain readings, Celumbus Drive !";ages 19, 20, and· 21.

~ 0 ~ Ill tr o-,.
~~
~ S"A/:10 2
V)
~ ~I ~:
~I i
l~'ft<"' ~
1--- .. "0
f ~
I
I
...., g u
. r-l N <
~ (l) ~
~ 1-1 :::!
~ bC ·rl
"' f"-1
I . I .... t 1'.1\1 .. ~
~
....
h 't-1
~l~ ~
0 ~ I
93
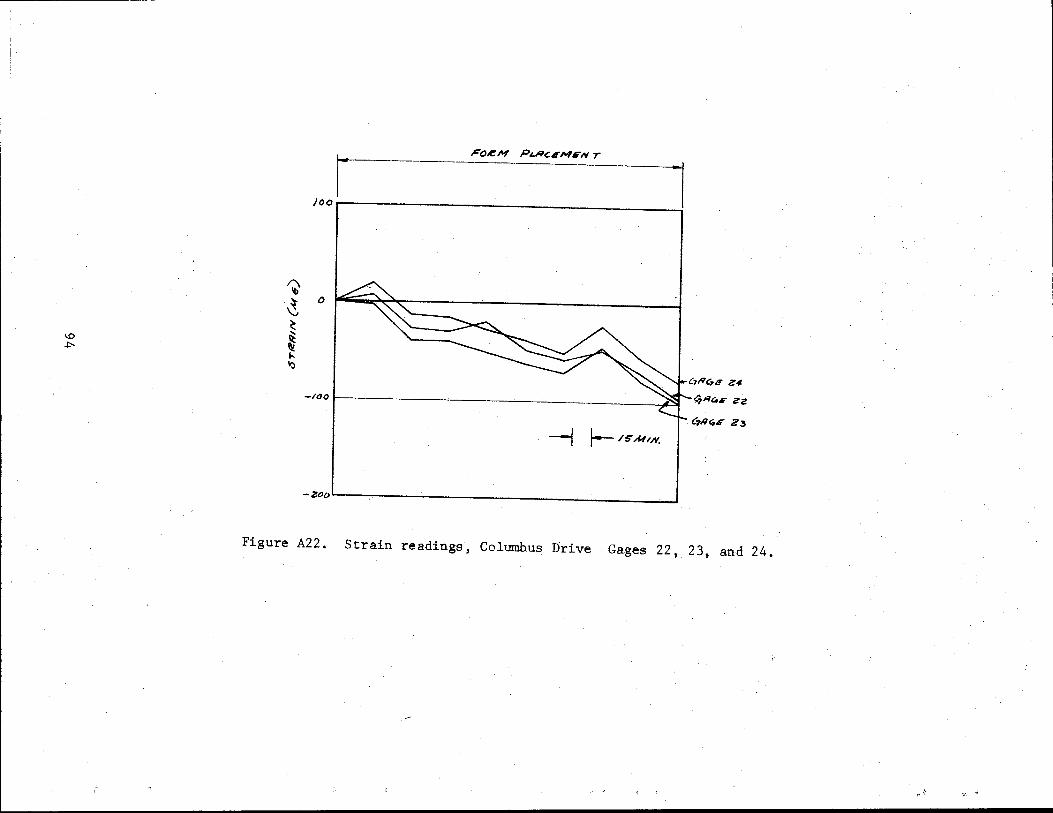
~OA!M PLI'ICif'MI"IV T r 1 /00
1"\ lb
·~ 0 ~
~ 1.0 -1:-- ~
II! ... ~
-100 4""4F i?Z
C7I1~11F Z3
--1 1-- /S".MI'N,
-zool_----~--------------------------------------------~-------
Figure A22. Strain readings, Columbus Drive Gages 22, 23, and 24.
·~ -~
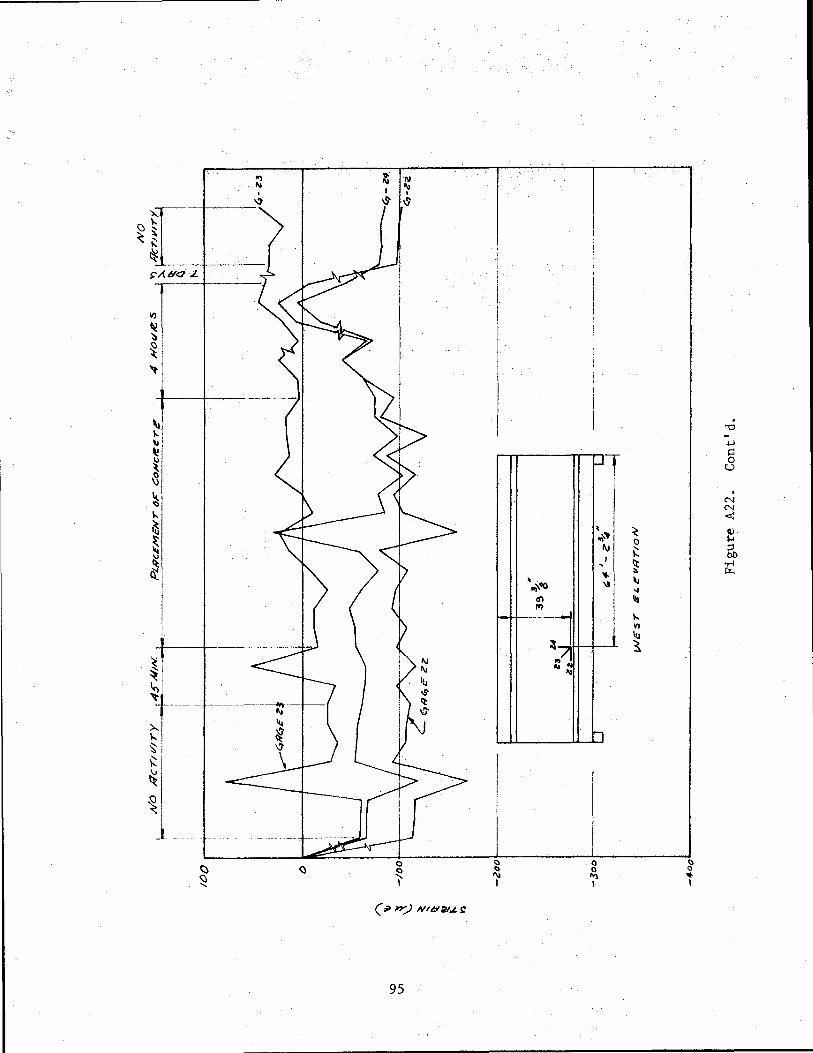
-:i
-.j.J
g u
95
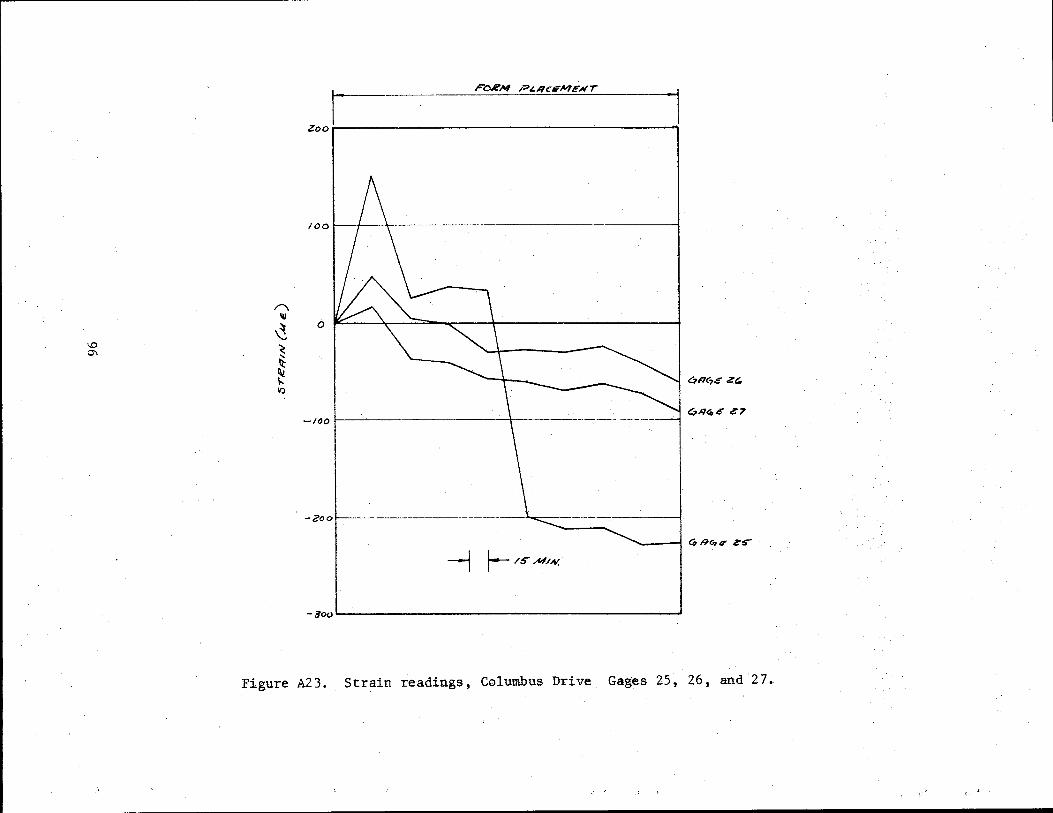
r---- re>.eM 1-::>~RCGMENT
Zcc -~
1oo I I \ --
/""'\ Ill
~ 0
\.0 0\ ~
~ ~
I IQ
t::,FI~£ z" c,n<;,.: z7
-100
4 RG,IT Zt>
---1 r- /S" /W/N,.
-~00~--------------------------------------------~
Figure A23. Strain readings, Columbus Drive Gages 25, 26, and 27.
't
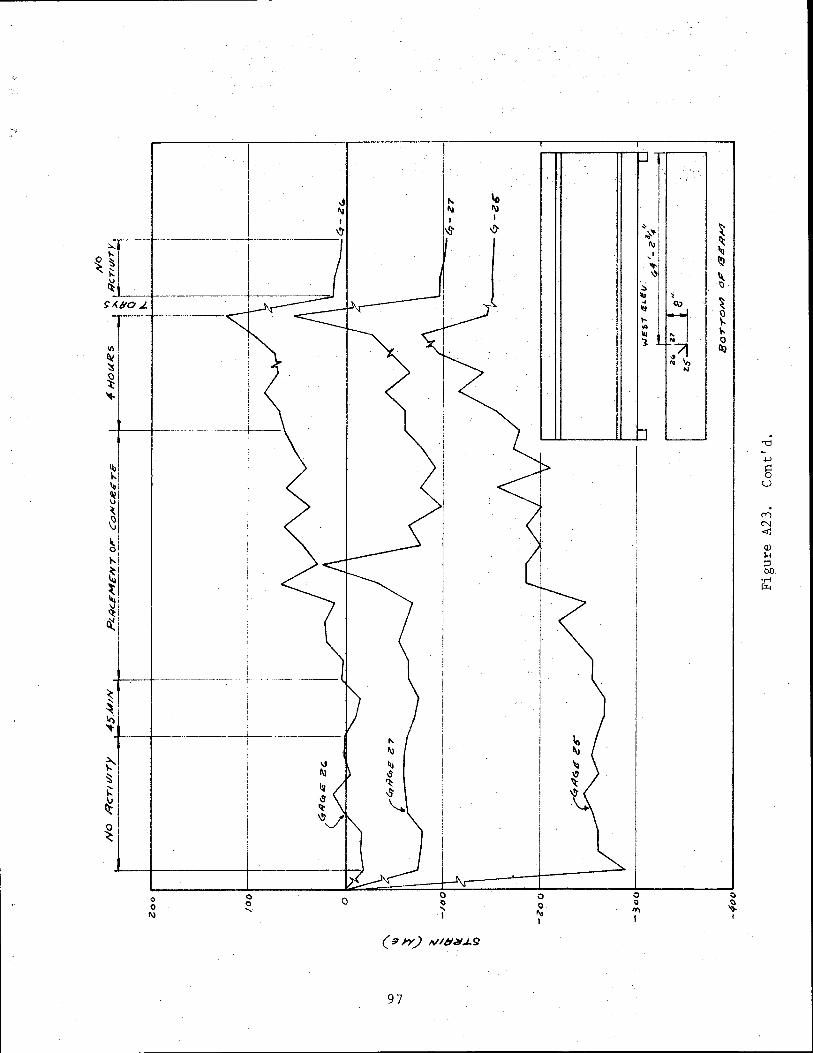
-t 'II I
" ·---------------· --+---------------
-.---+-------
i --------------- - +
0 0 II)
0 0 .....
0
97
0 0
"' I
1-l
..
~
"' ... I!! .... ... lu J
h
0 0
"" I
T I
0
~ I
. '"Cl
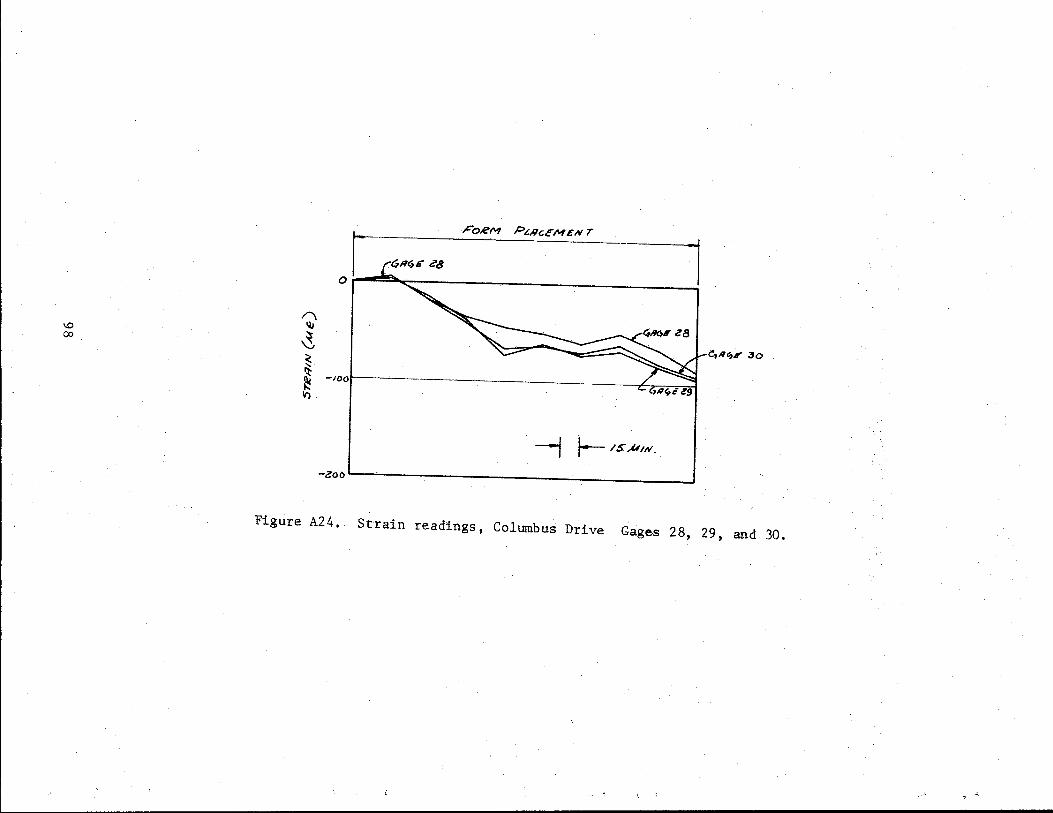
r "'""" -'8 ~ 0
1 """" 1
Fo~M P~RcEMEN T
"' 1,0 lb
~ 00
~ ~-.......... j.-C,R~I' 30 ~ I
~ -100 1.:: ~
--I ~ /S"A'tN.
-zoo--~~--~------------------~----------_J
Figure A24 •. Strain readings, Columbus Drive Gages 28, 29, and 30,
r··'r
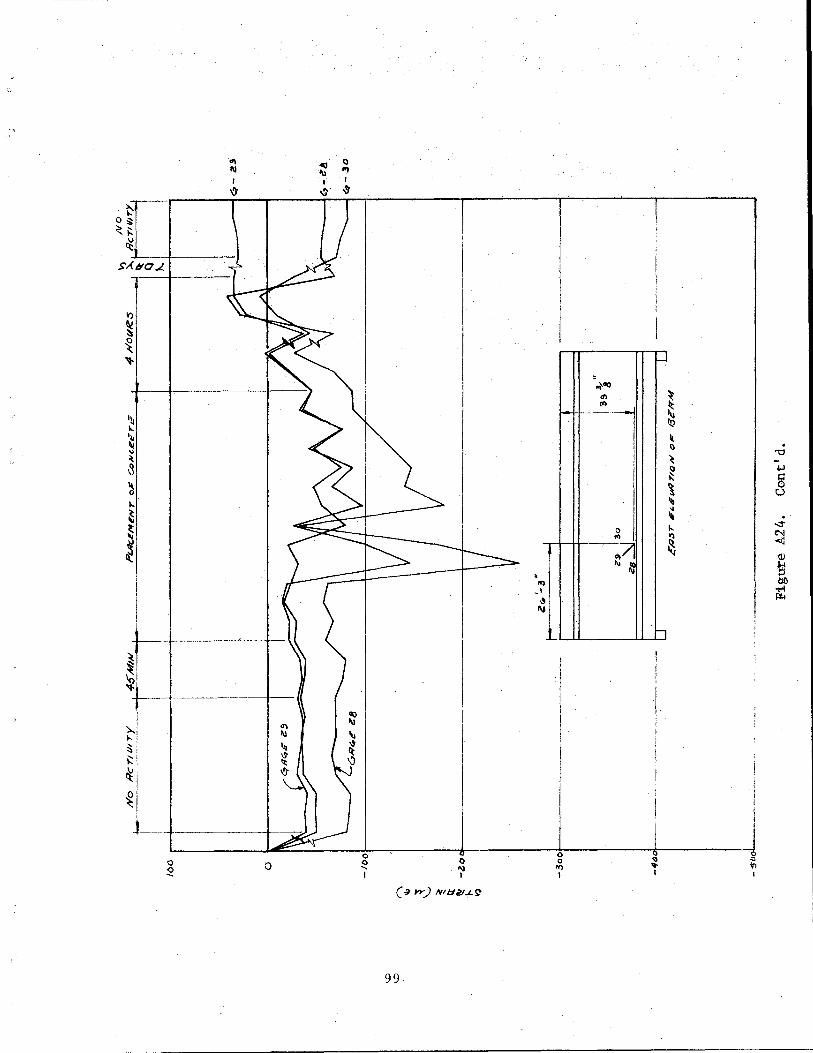
II. a ~ -~
" .j.J
~ 5 u
~ .. ' . .... "\
..::1"
~ ~ QJ
·~
I tlO
..-1 ~
99
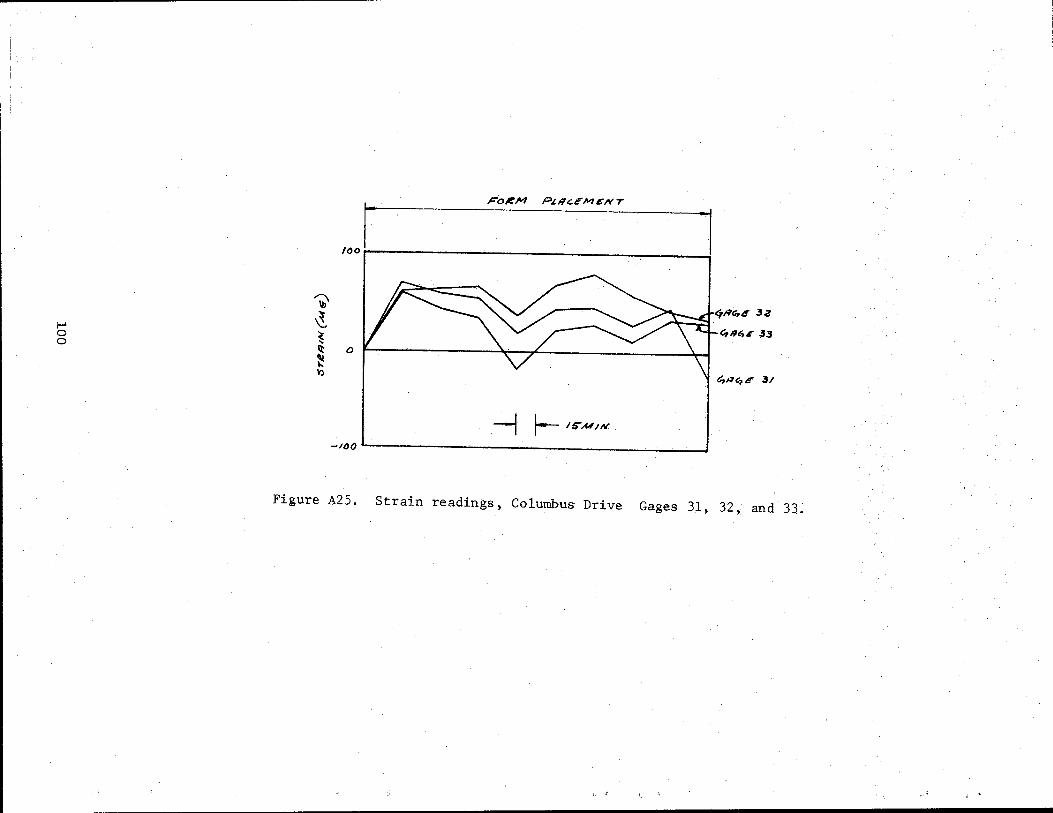
I-" 0 0
~ ~ ~
F0/1:1"'1 Pi.IU .. e'MEIVT .. r · l
11:: 0
~ \')
--1 1-- /!>MIN
-1~0~--------------------------------~------_J
4116,6" 33
l:,R~i!" ~/
Figure A25. Strain readings, Columbus Drive Gages 31, 32, and 33;

0 () ....
' "' "'.., I I
'-'\S
0
"' ... I
-s
101
I
"' ~;
D: <:>
I-I
h
() 1:1 ... I
,, '
~ I

rOIZM P,t,IIC/!!MG'/117
/00
I"\ a 'II
1-' 0 ~ N ~
~
~ 1/,)
-/00
--1 r-- /S' All/h.
-zooL---------------------------------------------~--~
Figure A26. Strain readings, Columbus Drive Gages 34, 35, and 36.
~
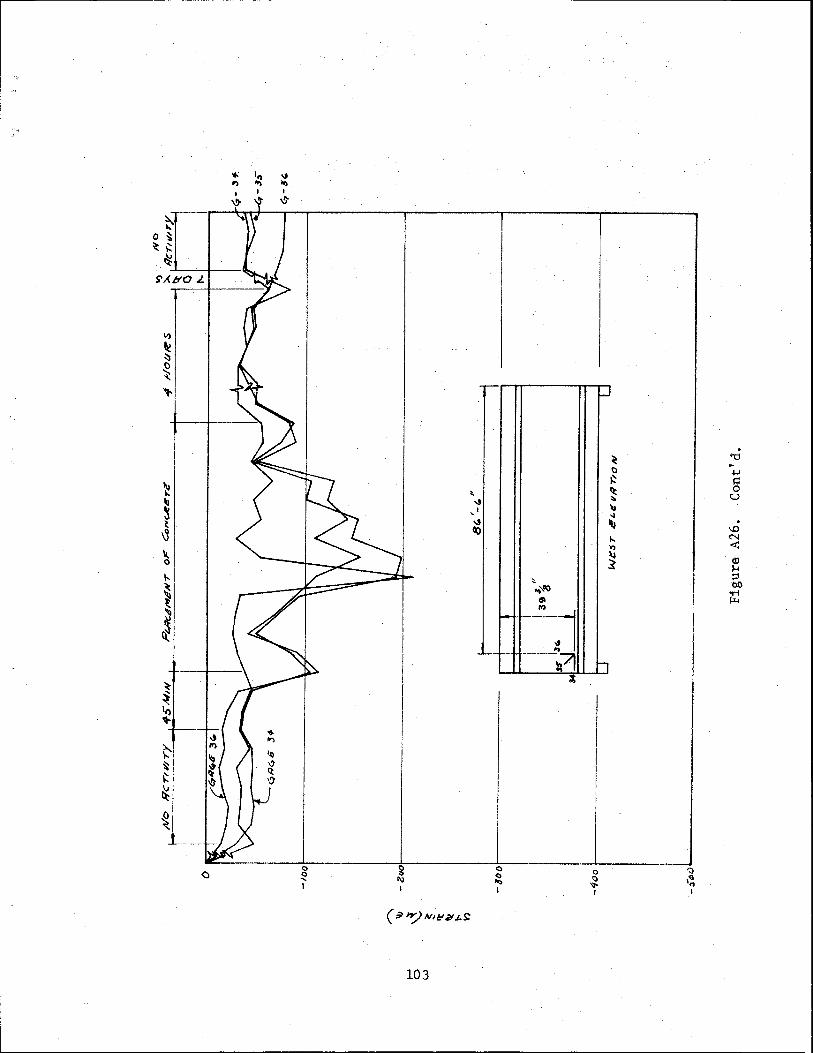
103
I
() () ... I
~..,,oo $ I'Q
" ... ~71
LJ
b
0 I) ~ I
I !
I
I I
I
';)
.~ .. I
. '1::J -...... !=: 0 u
. \0 N < (!) 1-o :1 00
...-i f.:L<
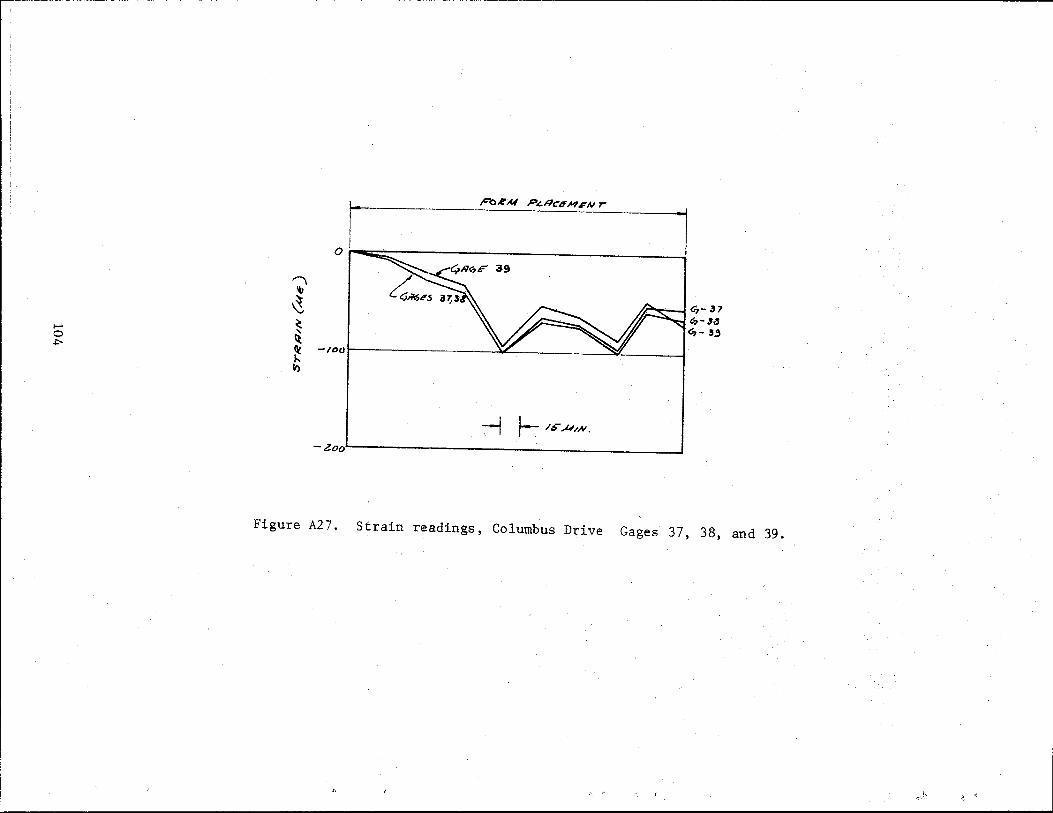
J-1 0 ~
'\ lb
~ ~ ~
~ ~
-t~u~--------------------~~------·
~. ~ /S"P/N.
-zoo
/~'7-37
19-3/J G?- ,,
Figure A27. Strain readings, Columbus Drive Gages 37, 38, and 39.
i ' i
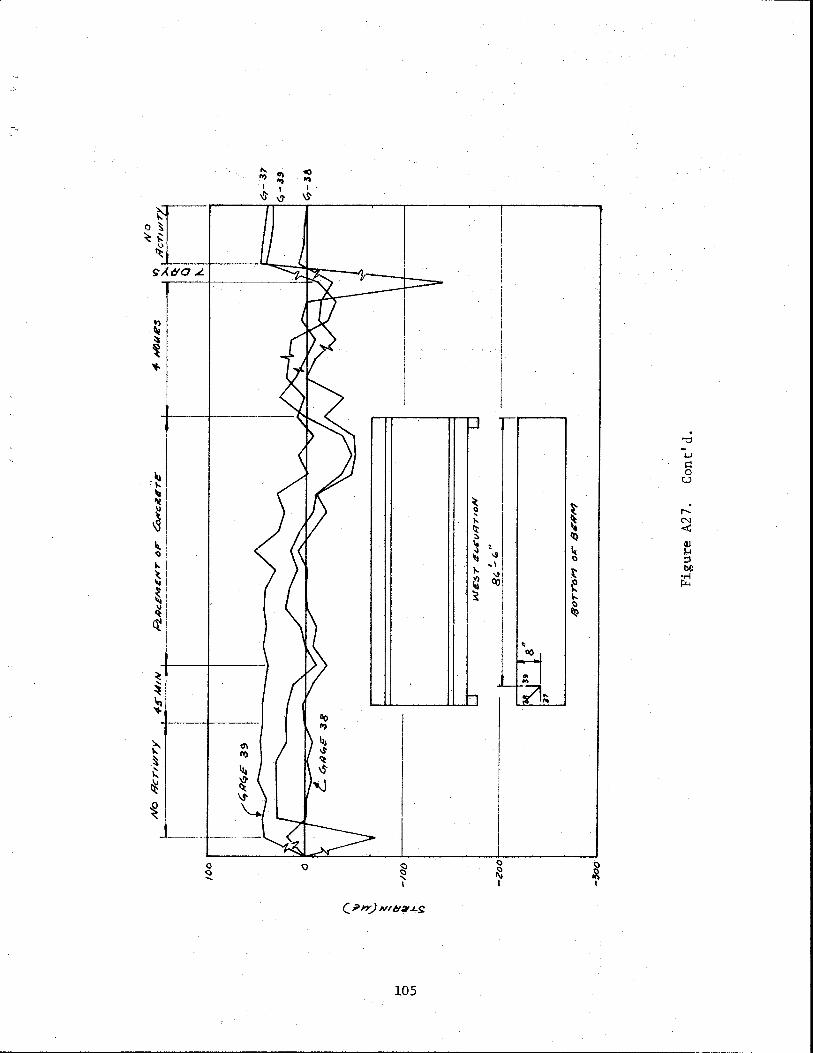
~ ~
~, ~,
I
r . '"tJ
.1-J ~ 0
u
~ .
....... N
~ < ~
" Ill
-ll ~ ~ ::1 .. ,
b()
" l: ..-I ~ ~ ~
~ ';)
~
I ,~I ~I 1\1· II
~ "' <l
....
~ ~ ~
0
~ i:. ~ ::.
"' ~ ... ~ ~
~
~
~ ~
~
~ 0'1
~ l'f.)
~
:L 0 <:) .....
Q
~ I
~ I
105
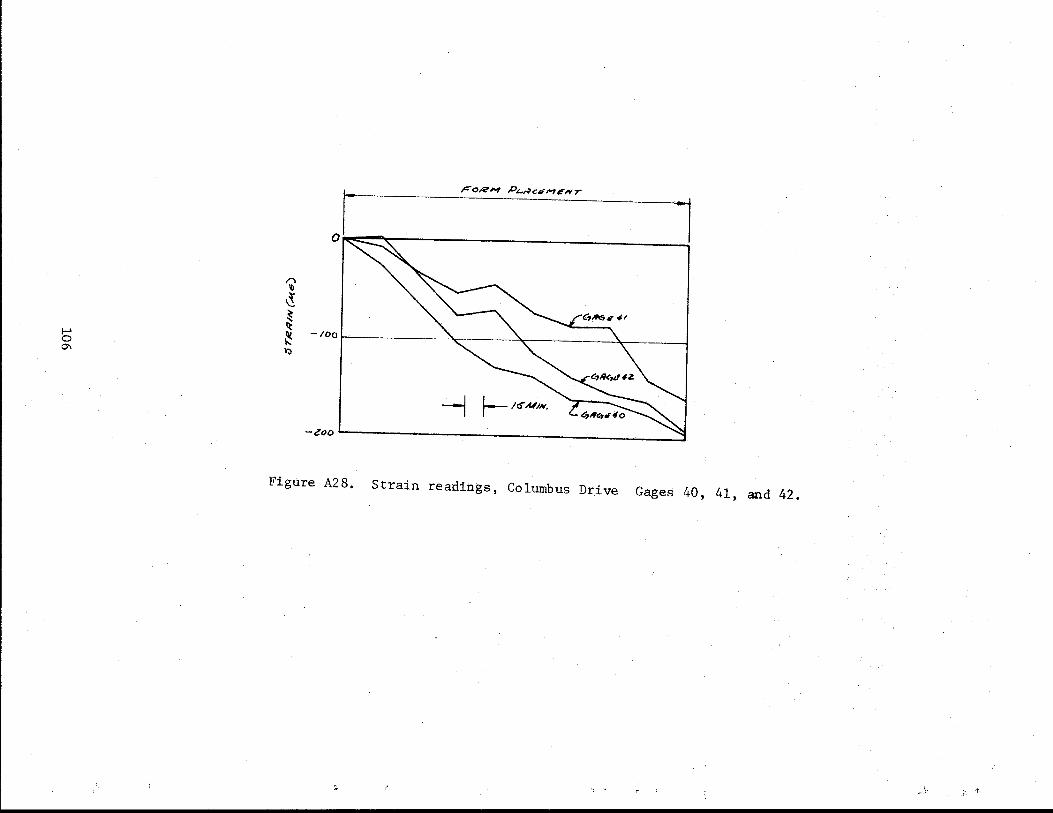
l5 0\
~ ~ ~ !t ~ w;,
Po/?,.., P"-,~c.-MINT - I
l
-100~-----------
--1 r-- IrS" MIN.
-zoo~--------------------------------------~~
Figure A28. Strain readings, Columbus Drive Gages 40, 41, and 42.
·. _.. ~~ -t:· 1>

f-J
Ill ~
. ~~ .....
... , ... Ill ,I ,.
~ .. ,to " ... 1- "!.~ i
i I I
h j_
0
~ I
107
~ ~
" ' 0
~ 0 ~
~
' ~ .. ~ llj
0 0 ..... I
. '"d
.1-J s:: 0 u
00 N < v J:-1 ::l 00
•r-l ~

!--" 0 co
Po.eM P~11c6MII'N T ·--·---~ r . -o.~
~ ~ool-------------~~~~----------------------~ ~
~ ~ ~
-aoor-----------------------------------------~--~
--j 1-- lfi M1AI.
-300~~--~------------------~----------------~
Figure A29. Strain readings, Columbus Drive Gages 43, and 44.
f ,.~;

SAb'O .L
~ ~ ~ () \)
\ 0
... ~ ~, ~· ~I
I
~t ~ ·~
....
~ ~ ~ ~ ~
!_
)
j
""" ...
g ..... I
109
I
() 0 Ill I
.., .. ...... "" {~ ff .ll
I I I I
I I I I
I l .
"0 -+J
§ u
~ 0\
.... N
It <tl Ill G)
~ 1-1
It ;::l 00
1:) -M.
t fl<.<
~
~ 1li ~ 14_ Q ~
~ ~
Q.
~
i 0
~ I
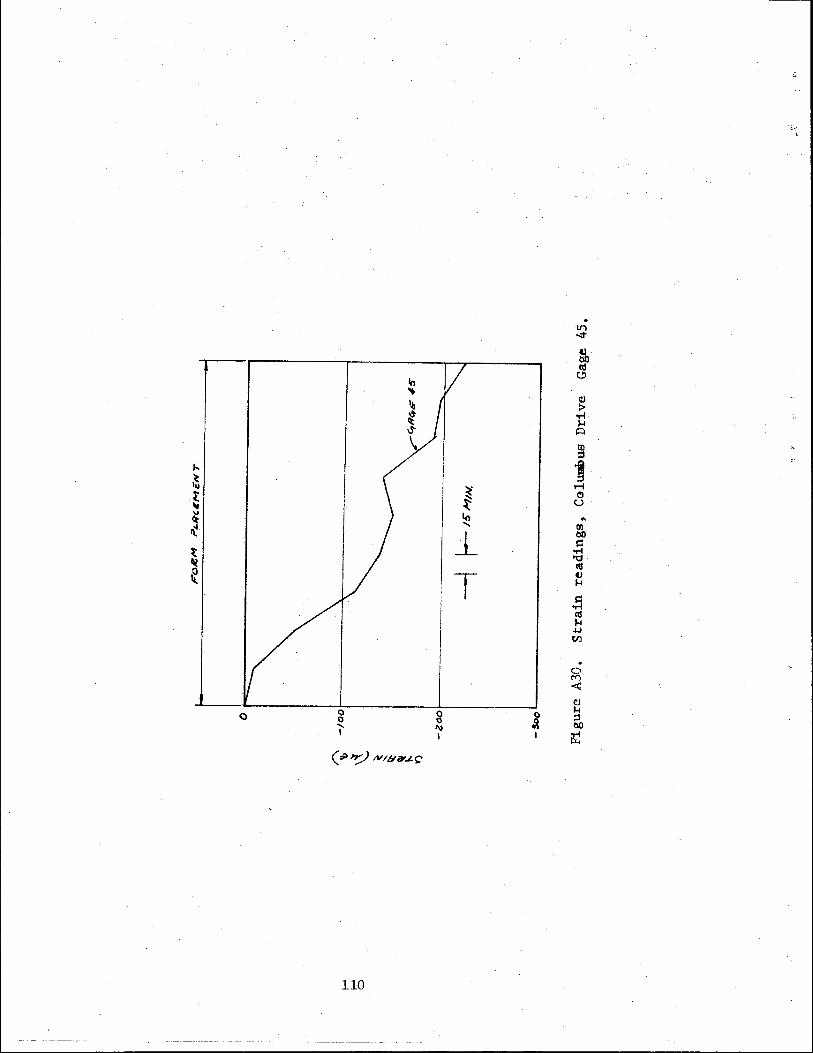
0 () 0 ..... I
110
~
~ Ia .....
_L
T
i
. ll"' ..;t
~· Cd
c.!)
C) :>
..-1
'"' A 0)
='
1 ,....j 0 u
.. 0) 00 s=
..-1 "d
"' G)
'"' s=
..-1 Cd
'"' ~ tf.l
. 0 M < CJ
'"' =' 00
;£
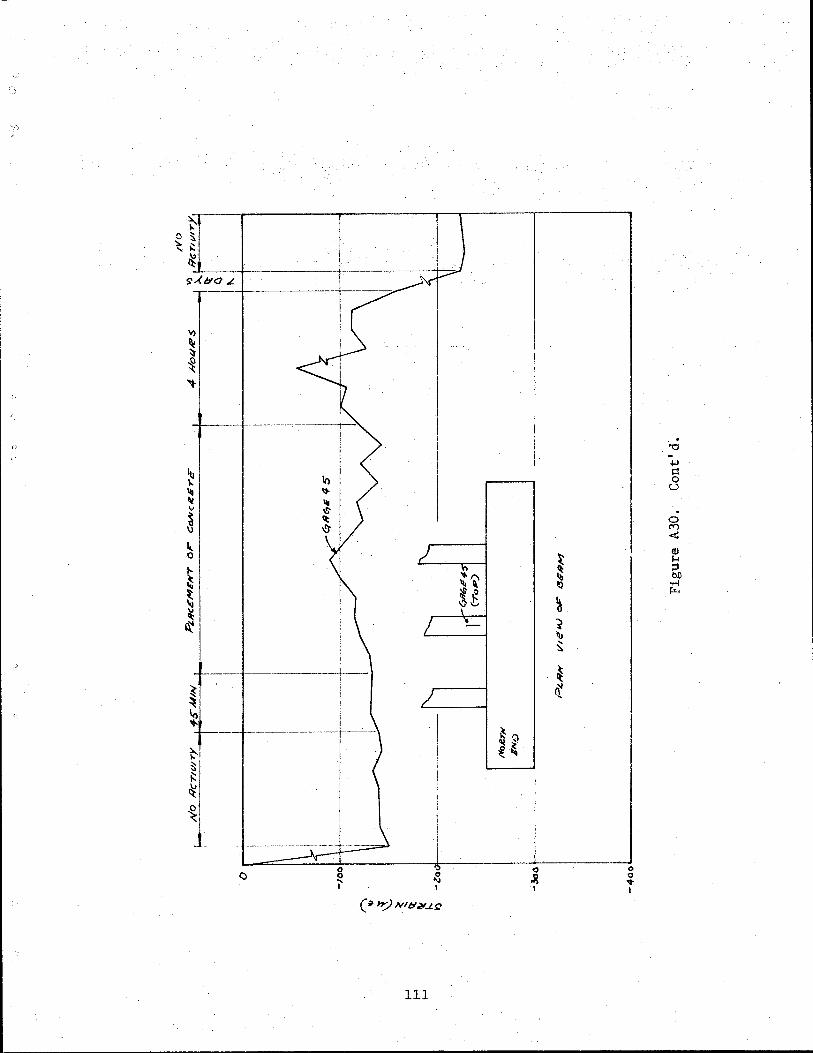
s-< 1:10 _L:_t_ _____ _
L--+------- ----
tni '1:1-;
"' I "I It I
"'"I I
)
I
/
~ I
111
__,..
~ '1.~ ~~ '('""' L
~C\ ~ ~-~~
I
~ ~ ~ t 'II ~
~ ~
0
~ I
0 0 .... I
. '0
+J 1=1 0 u
0 (V')
<: cv '"' ::I l.lO •rl ~
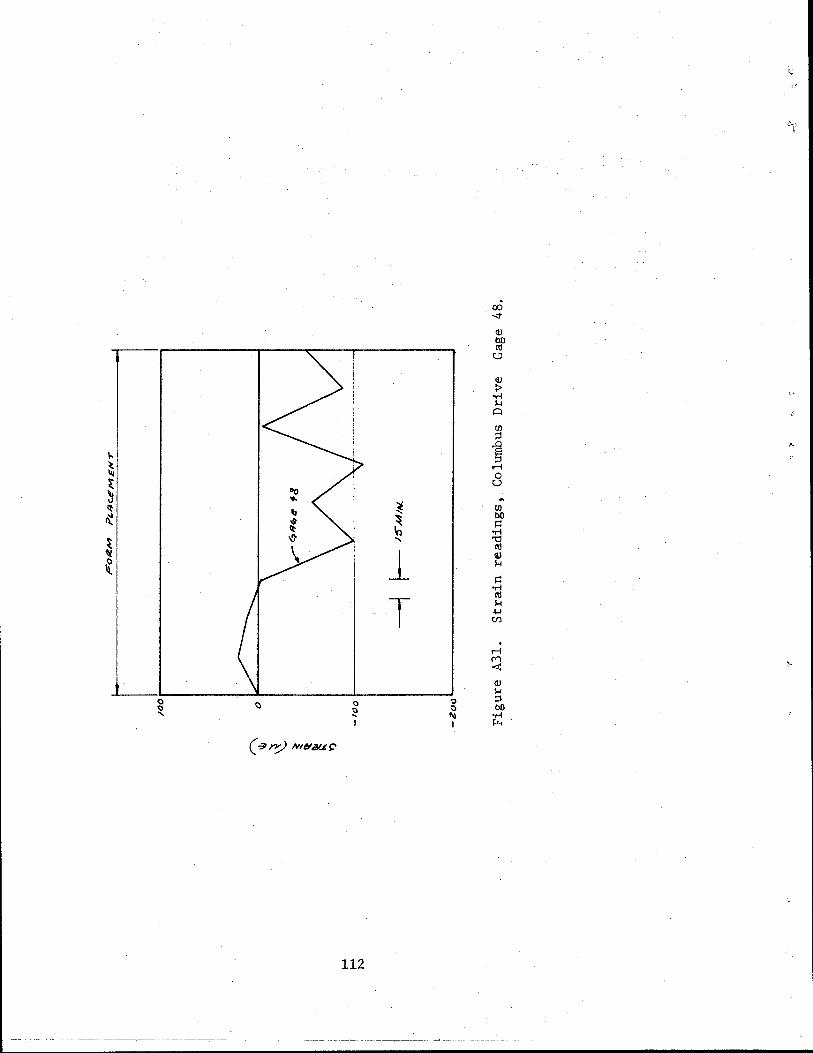
00 -.::t
Q)
~ 0
Q)
:> -.4 ~ p
CIJ ;:I
~ ;::1
..-i 0 u
~ ~I
I
~ CIJ .... 00
~ ~ -.4 ... "C:1 cu
1 Q) ~
~ •.-l cu
T ~ +J U)
. ..-i C"'l < Q)
~ '0 ;::1 ::> b()
1\) •.-l I r.r..
112

or ~~I ~ -'---f-~--
sA/:10 L
II)
~ ~ "t-
, __
G
llJ " '~ ~ \l
~ ~
"' ()
1--~ ~
~ ~I ((
~
~ ... ':>.
" ~ ~
~ ~
1\. ~
Ill
0 0 ~ I
113
/
/
I
.. ~ ,.. 0
,s.~
t-.I
0() F'\ ,.. ... ~
~~ ~ a ~~
0
~ I
i ' '0
II. 1)
'l '4 ~
~ ~
0 0 .., I
"0 --I.J r:: 0 u
. ,.., (V)
<!! Q) H ;:j 00
•r-4 I'Ll