Embed Size (px)
Citation preview
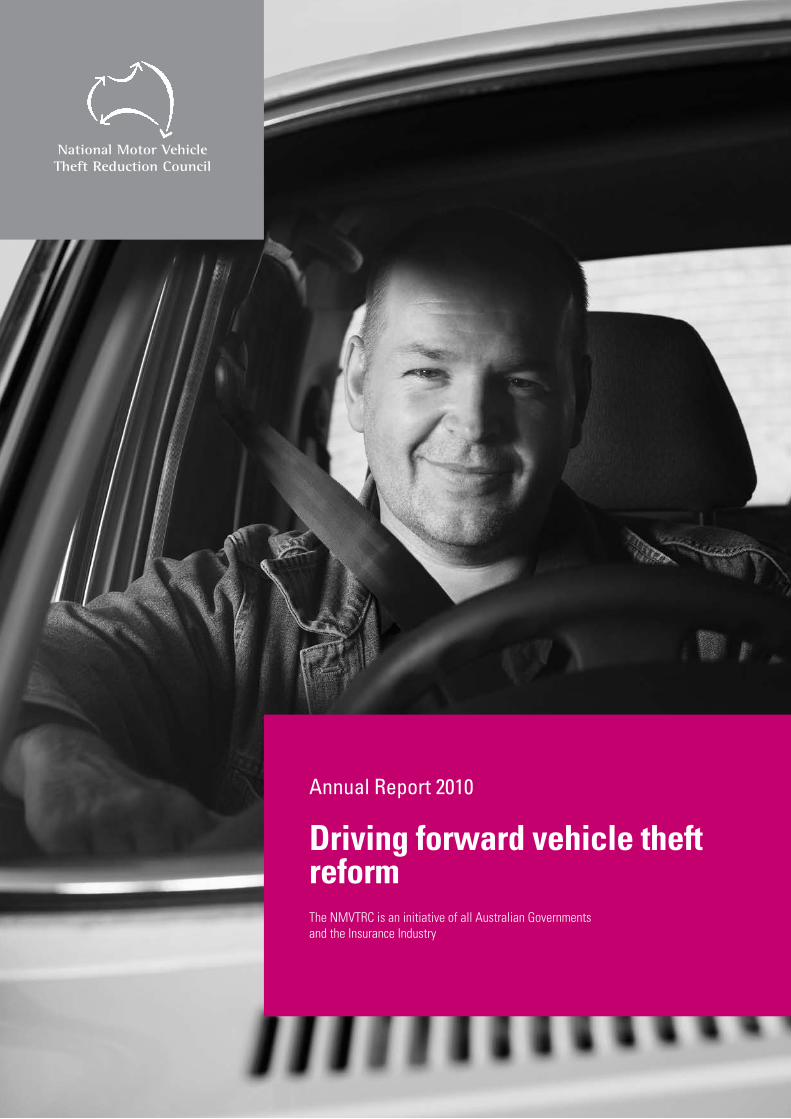
Annual Report 2010
Driving forward vehicle theft reformThe NMVTRC is an initiative of all Australian Governments and the Insurance Industry
1 Letter of transmittal
2 NMVTRC members
3 Chairman’s report
4 Executive Director’s report
7 Our people
8 Motor vehicle theft in Australia 2009/10
10 Reform activity
20 Performance indicators
25 Financial statements
36 Appendices
Contents
VisionTo achieve the lowest rate of motor vehicle theft in the developed world, thereby improving Australia’s economic and social well-being.
MissionTo deliver a culture of continuous and sustainable vehicle theft reduction in Australia by advancing reform and cooperation between industry, government and community stakeholders.
Operating philosophyThe NMVTRC is committed to developing close partnerships and common goals with stakeholders through the promotion of the economic and social benefits of reduced vehicle theft. Its credibility will be judged by the quality of its proposals for change.
1National Motor Vehicle Theft Reduction Council – Annual Report 2010
Letter of transmittal
31 October 2010
Ministerial Council for Police and Emergency Management – Police (MCPEMP)
The Hon. Bob Cameron MP The Hon. Simon Corbell MLAThe Hon. Michael Daley MLC The Hon. Paul Henderson MLAThe Hon. Rob Johnson JP MLAThe Hon. Brendan O’Connor MPThe Hon. Neil Roberts MP The Hon. Lin Thorp MLC The Hon. Michael Wright MP
Insurance Council of Australia President
Mr Terry Towell
In accordance with the Rules of Association of the National Motor Vehicle Theft Reduction Council Inc, I have pleasure in submitting the NMVTRC’s Annual Report for the year ended 30 June 2010.
Yours sincerely,
David M MorganChairman
2 National Motor Vehicle Theft Reduction Council – Annual Report 2010
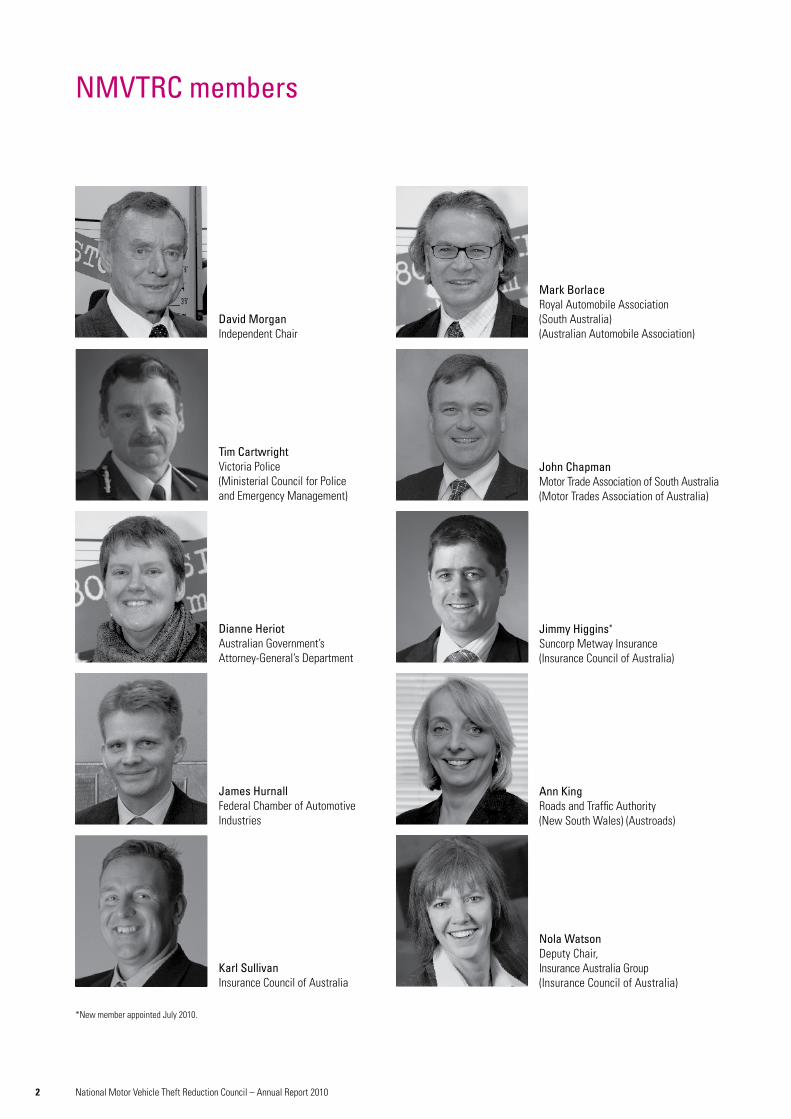
NMVTRC members
David MorganIndependent Chair
John ChapmanMotor Trade Association of South Australia (Motor Trades Association of Australia)
Mark BorlaceRoyal Automobile Association (South Australia) (Australian Automobile Association)
Dianne HeriotAustralian Government’s Attorney-General’s Department
Jimmy Higgins*
Suncorp Metway Insurance (Insurance Council of Australia)
James HurnallFederal Chamber of Automotive Industries
Ann KingRoads and Traffic Authority (New South Wales) (Austroads)
Tim CartwrightVictoria Police (Ministerial Council for Police and Emergency Management)
Karl SullivanInsurance Council of Australia
Nola WatsonDeputy Chair, Insurance Australia Group (Insurance Council of Australia)
*New member appointed July 2010.
3National Motor Vehicle Theft Reduction Council – Annual Report 2010
Chairman’s report
The year also saw the long-awaited establishment of a true one-stop-shop for vehicle status information take significant strides with the Senate’s passing of the Personal Property Securities Act in November. From May 2011 the Personal Property Securities Register will replace state and territory vehicle securities registers, making it simpler for lenders to record security interests and delivering a single national vehicle status check for consumers and motor traders.
Regrettably, the year was marred by a series of tragic incidents in which innocent road users were killed in collisions with stolen vehicles driven by recidivist offenders. These tragedies remind us all that car theft can have consequences that far surpass the immediate inconvenience and personal costs of being denied access to a vehicle. Inevitably, such incidents re-ignite the public and media debate on police pursuit policies, but the real question is what can be done to try and prevent young people from engaging in such high-risk activity and causing similar tragedies in the future.
While the issues are complex and there is no single answer to the challenge, the NMVTRC’s model young offender program, U-turn, has proven that it can be very effective in addressing the underlying motivations of persistent car theft offenders. It was therefore very encouraging to see the Tasmanian Government’s leadership and vision by committing to fund its Hobart-based U-turn program through to at least 2013, which will mark its 10th anniversary. The NMVTRC hopes 2011 will also see some exciting new developments in securing the future of U-turn type programs on mainland Australia.
The year also saw some key changes in the membership of the Council with John Chapman replacing the MTAA’s long serving representative, Peter Fitzpatrick, and Jimmy Higgins filling the Insurance Council’s vacancy following Rob Whelan’s appointment as that organisation’s Chief Executive. My thanks to all those involved for ensuring a smooth transition, but particular thanks to Peter for his valued input and commitment over the past five years.
My thanks also to the rest of the Council for their on-going support and guidance.
In closing, I would like to again congratulate our Executive Director and his staff for their outstanding commitment and energy in driving a profoundly important reform program for the nation forward.
David M MorganChairman
1. Based on an independent economic analysis conducted by MM Stars Pty Ltd for the NMVTRC (November 2008) which estimated victims’ costs per incident to be $11,500 for recovered vehicles and $20,610 for vehicles not recovered depending on a range of personal and other factors.
The 2009/10 year delivered Australia another significant reduction in stolen vehicle numbers with the 57,971 thefts recorded nationally representing a 7 per cent fall for the year.
The hard work and cooperation of the National Motor Vehicle Theft Reduction Council’s (NMVTRC) stakeholders has clearly changed the vehicle theft landscape with rates falling by more than 23 per cent since 2005.
The reduction in theft numbers for the year has saved the community an estimated $60 million1. While this is good news, the number of unrecovered vehicles remains a concern. The unrecovered rate is the primary indicator of organised criminal activity that seeks to convert stolen vehicles into cash. As a group, missing vehicles now present a bigger proportion of total thefts with one in four stolen vehicles now unrecovered, compared to just over one in six, five years ago.
The NMVTRC’s work program continues to place a primary focus on combating the major structural weaknesses in our government and industry practices and policies that allow profit-motivated thieves to continue to ply their trade.
Highlights for the year included the:
• waystakeholdersembracedthecollaborativeprocesstodevelopnew damage assessment criteria for the management of written-off vehicles (WOV) to better meet the system’s current and future needs;
• establishmentoftwosignificantInter-agencyTaskForces(ITFs)inNew South Wales and Victoria to gain new insights into the trade in separated parts and the extent of unlicensed trading, sub-standard repairs and criminal manipulation of WOV practices; and
• continuingsuccessofourpartnershipwithlocalgovernmenttodeliver targeted theft prevention messages to those communities most at risk via Operation Bounce Back.
4 National Motor Vehicle Theft Reduction Council – Annual Report 2010
Executive Director’s report
We have also adopted a rolling five year time scale for baseline data to keep the format contemporary and ensure current changes and trends are easily discernable.
The short term thefts category comprises those theft incidents where the vehicle has been stolen for transport or used to commit another crime but has been recovered intact or subject to malicious damage2. The year saw the number of passenger/light commercial (PLC) vehicles stolen for short term use drop by 11 per cent to 35,257. The significant reduction represents the 10th consecutive year of declining theft numbers.
The prevailing rate of theft per 1,000 vehicles registered reflects this strong reduction, now standing at 2.4 compared to 4.0 five years ago. Short term motorcycle theft remained unchanged from 2008/09 at 2,789 bikes stolen.
Profit-motivated theft refers to vehicles stolen for conversion into cash via various illegal methods. A total of 11,514 PLC vehicles were stolen not recovered (SNR) for the year – when adjusted for late recoveries this represents a slight reduction from the previous 12 months3.
While it appears there has been less change in the volume of profit-motivated theft over the past five years, the characteristics that make up this type of theft have shifted dramatically.
One in four of all vehicle thefts are profit-motivated, however the overwhelming majority of these thefts are still of older vehicles, with 84 per cent of all not recovered PLCs being more than six years old. This is explored in more detail later in the Performance indicators section of this Report.
The NMVTRC has long maintained that poor vehicle identification standards have a significant downstream impact on the efficiency and effectiveness of investigation and registration barriers to vehicle crime. Improving the standard has therefore been one of the NMVTRC’s long term goals.
The NMVTRC has made a number of important changes in its method of operating over the past 12 months to build on its successes and respond to the changing environment of its stakeholders.
The most significant change saw the commitment of more resources to facilitating an operational, on-the-ground response to address perceived gaps in existing institutional arrangements or knowledge base.
The consequence is a more targeted work program comprising several longer term projects. The new approach is best illustrated by the establishment of Inter-agency Task Forces (ITFs) in New South Wales and Victoria to gather better empirical evidence of the dynamics of the illicit parts trade and unlicensed trading in repairable write-offs.
Although the final results of the ITFs will not be reported until later this calendar year, the early indications are that separating these broadly based ‘discovery exercises’ from day-to-day police investigations, combined with the individual expertise and statutory powers brought to the team by the staff of the participating agencies, can yield a rich vein of intelligence to inform our strategy development.
One of the major benefits of the approach is that the team on-the-ground can base their assessment of the legitimacy or otherwise of the activity they observe based on the balance of probability rather than the higher evidentiary standards required for a successful criminal prosecution. Any criminal or other statutory offences revealed are referred on for follow up investigation at the conclusion of the ITFs’ term.
There is more information on the design of the ITFs’ field work in the Reform activity section of this Report.
To provide a more incisive picture of the drivers of motor vehicle theft in Australia the NMVTRC has also made some key changes to the way it analyses and presents theft trend data. The shift to reporting short term and profit-motivated theft separately is designed to make it easier to quickly understand the key prevailing trends.
5National Motor Vehicle Theft Reduction Council – Annual Report 2010
While in an ideal world a single industry-wide system of comprehensive vehicle identification, such as VIN based microdots, would deliver optimal investigative and deterrence outcomes, a one size fits all identification system is increasingly being seen as unlikely to be achieved in the near to medium term.
Recognising the complexity of the environment in which the motor industry currently operates the NMVTRC proposes to adopt a more scalable approach based on demonstrable risk. Under such a model the NMVTRC will advocate that the highest risk vehicles require the most comprehensive identification systems while manufacturers of lower risk models will be encouraged to adopt more incremental improvements. The NMVTRC’s work program for 2010/11, released as part of the 2010 Strategic Plan, includes a substantial body of work under the Disrupt Separated Parts Markets and Encouraging Innovation themes to deliver improved vehicle identification standards.
Finally, I am pleased to note that the results of this year’s strategic planning consultations and annual stakeholder surveys again indicate that the NMVTRC enjoys strong buy-in from the organisations on which we rely to implement our reform program. With this on-going commitment the NMVTRC is well positioned to continue its leadership role in driving down vehicle theft in Australia.
Ray CarrollExecutive Director
2. Short term use numbers will include an unknown but assumed small number of recovered vehicles that were recovered in a substantially stripped condition and were the likely target of profit-motivated thieves.
3. SNR volumes are inflated by an unknown number of missing vehicles that are stolen and simply dumped in waterways and bushland.
6 National Motor Vehicle Theft Reduction Council – Annual Report 2010
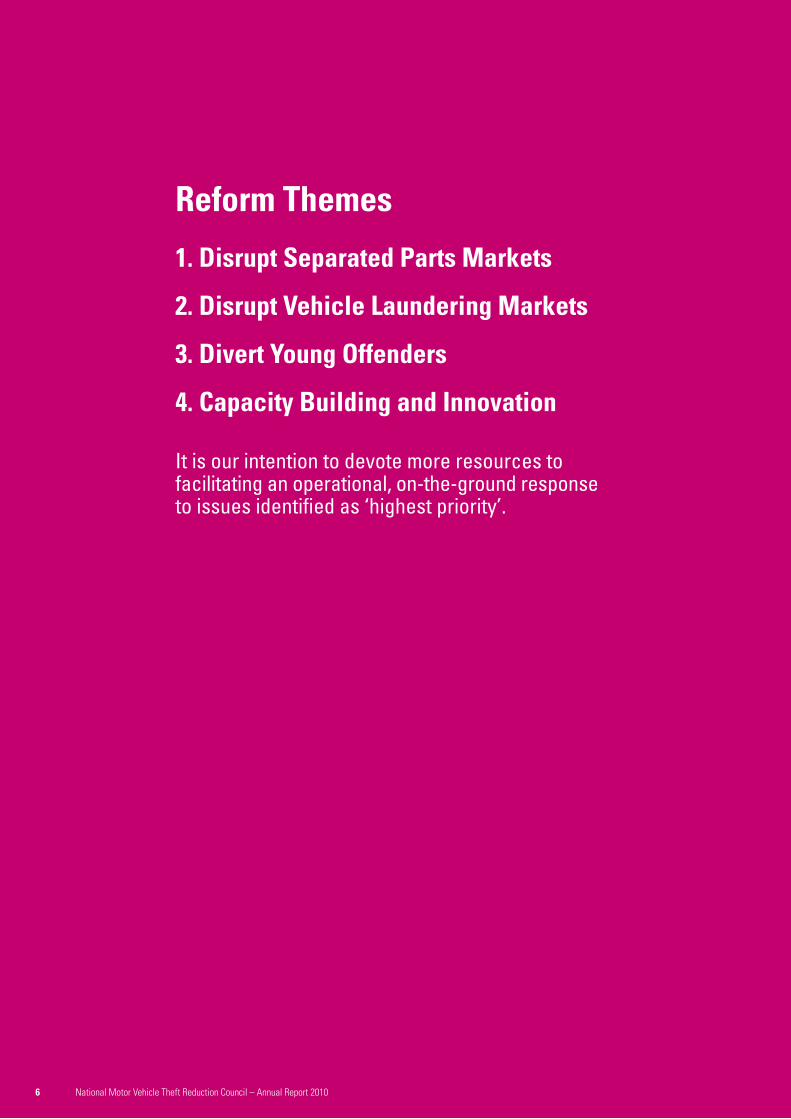
Reform Themes
1. Disrupt Separated Parts Markets
2. Disrupt Vehicle Laundering Markets
3. Divert Young Offenders
4. Capacity Building and Innovation
It is our intention to devote more resources to facilitating an operational, on-the-ground response to issues identified as ‘highest priority’.

7National Motor Vehicle Theft Reduction Council – Annual Report 2010
Our people
Ray CarrollExecutive Director
Geoff HughesDirector Strategy and Programming
Christine PejicProject Officer
Kate RoadleyAdministration Officer
8 National Motor Vehicle Theft Reduction Council – Annual Report 2010
Motor vehicle theft in Australia 2009/10
Profit-motivated theftProfit-motivated theft is defined as vehicles that are stolen for conversion to profit, either as a whole vehicle or as separated parts, through various illegal methods. The number of vehicles stolen not recovered (SNR) is used as a surrogate measure for the level of profit-motivated theft.
A total of 11,514 PLC vehicles were SNR in 2009/10, and when adjusted for late recoveries this represents a slight improvement on the previous 12 months.
As a result of the significant decline in short term theft and a lesser reduction in SNR a quarter of all PLC vehicle thefts in 2009/10 were profit-motivated, compared to close to one in six five years ago. The overwhelming majority of SNR vehicles however remain older, with 84 per cent of all not recovered PLCs being more than six years old.
The SNR theft rates of 1.1 per 1,000 registrations and 0.8 per 1,000 population, have remained relatively stable over the past five years. Popular family cars continue to be the target of profit-motivated thieves with the total value of stolen Holden Commodores and Ford Falcons alone exceeding $12 million. The Nissan Skyline is also a common choice, with close to 200 stolen in the period.
The number of motorcycles stolen for profit or personal gain increased by 165 and represented 60 per cent of all motorcycle thefts. Overall, SNR motorcycle theft has risen by 15 per cent over the past five years. A total of 2,824 heavy, plant and equipment vehicles were stolen and remain unrecovered for the period.
4. The term ASE was developed by the NMVTRC to cover original equipment immobilisers that comply with the Australian Design Rules and after-market devices that meet Australian Standards.
5. Excludes off-road and other non-registered bikes.
6. Based on an independent economic analysis conducted by MM Stars Pty Ltd for the NMVTRC (November 2008) which updated the NMVTRC’s cost models to $11,500 for recovered vehicles and $20,610 for vehicles not recovered depending on a range of personal and other factors.
The nation has once again seen a strong overall reduction in motor vehicle theft over the past 12 months. A total of 57,971 vehicles were stolen in 2009/10 representing a decline of 7 per cent and setting a new benchmark for theft in Australia.
To provide a more detailed picture of the drivers of motor vehicle theft in Australia the NMVTRC has made some key changes to the way it analyses and presents theft trend data. The main change is to report short term and profit-motivated theft categories separately. This will make it easier for stakeholders to quickly see the prevailing trends across Australia. A rolling five year time scale for baseline data has also been adopted to ensure the format remains contemporary and trends are readily discernable.
Short term theftShort term theft represents vehicles that are stolen by opportunistic thieves for purposes such as the commission of other crimes, joyriding, or transport. By definition these vehicles are recovered but have often been subjected to malicious damage. Theft in the short term category has consistently fallen since 2001. Over the past five years the number of passenger/light commercial (PLC) vehicles stolen recovered has declined by over 33 per cent.
The 2009/10 fiscal year saw this downward trend continue with an 11 per cent reduction from the previous 12 months bringing the total number of PLC thefts nationally down to 35,257.
PLCs aged more than 11 years continue to make up the bulk of short term theft, with over two thirds of all short term theft targets manufactured prior to 1999. One in every 408 registered PLCs was stolen and recovered, down from one in 347 in 2008/09. The recovered theft rate per 1,000 registrations and population now stands at 2.4 and 1.8 respectively. The penetration of Australian-Standards Equivalent (ASE)4 immobilisers in the fleet grew 4 per cent so that over two thirds (67 per cent) of Australia’s car fleet is now secured by an ASE immobiliser.
Stolen and recovered motorcycles matched last year’s total of 2,789 thefts however a greater number were stolen not recovered5. The volume of heavy vehicles, plant and equipment theft was down just 22 to 2,846 stolen recovered.
The overall reduction in short term theft numbers over the year has saved the community an estimated $60 million6.

9National Motor Vehicle Theft Reduction Council – Annual Report 2010
Figure 1: Short term thefts of passenger/light commercial vehicles, Australia, 2005/06 – 2009/10
0
5
10
15
20
25
30
35
40
45
0-5 Years
2005
/06
2006
/07
2007
/08
2008
/09
2009
/10
2005
/06
2006
/07
2007
/08
2008
/09
2009
/10
Num
ber o
f Veh
icle
s (’0
00)
Financial Year
0
1
2
3
4
5
6
7
9
8
Num
ber o
f Veh
icle
s (’0
00)
Financial Year
6-10 Years
11+ Years
2,000
2,500
3,000
Short term thefts
2005
/06
2006
/07
2007
/08
2008
/09
2009
/10
Num
ber o
f Veh
icle
s
Financial Year
Profit-motivated thefts
Num
ber o
f Veh
icle
s
Financial Year
0-5 Years
6-10 Years
11+ Years
7
Sep
05
Jan
06
May
06
Sep
06
Jan
07
May
07
Sep
07
Jan
08
May
08
Sep
08
Jan
09
May
09
Sep
09
Jan
10
May
10
Sep
10
15
14
13
12
11
10
9
8
Num
ber o
f Veh
icle
s (’0
00)
Data as at July 2010
Quarter Stolen
Adjusted for late recovery
2,000
4,0003,800
3,600
3,4003,200
2,6002,4002,200
Num
ber o
f Veh
icle
s
Data as at July 2010
2,800
3,000
Quarter Stolen
Adjusted for late recovery
Sep
05
Dec
05
Mar
06
Jun
06
Sep
06
Dec
06
Mar
07
Jun
07
Sep
07
Dec
07
Mar
08
Jun
08
Sep
08
Dec
08
Mar
09
Jun
09
Sep
09
Dec
09
Mar
10
0
1,800
1,600
1,400
1,200
600
400
200
Num
ber o
f Veh
icle
s
Total
800
1,000
Quarter Stolen
Pre 1994
1994 to 1999
2000 to 2008
Dec
07
Feb
08
Apr 0
8
Jun
08
Aug
08
Oct 0
8
Dec
08
Feb
09
Jun
10
Sep
10
Dec
10
4,000
4,500
5,000
2005
/06
2006
/07
2007
/08
2008
/09
2009
/10
Figure 2: Profit-motivated thefts of passenger/light commercial vehicles, Australia, 2005/06 – 2009/10
Figure 3: Short term thefts of motorcycles, Australia, 2005/06 – 2009/10
Figure 4: Profit-motivated thefts of motorcycles, Australia, 2005/06 – 2009/10
0
5
10
15
20
25
30
35
40
45
0-5 Years
2005
/06
2006
/07
2007
/08
2008
/09
2009
/10
2005
/06
2006
/07
2007
/08
2008
/09
2009
/10
Num
ber o
f Veh
icle
s (’0
00)
Financial Year
0
1
2
3
4
5
6
7
9
8
Num
ber o
f Veh
icle
s (’0
00)
Financial Year
6-10 Years
11+ Years
2,000
2,500
3,000
Short term thefts
2005
/06
2006
/07
2007
/08
2008
/09
2009
/10
Num
ber o
f Veh
icle
s
Financial Year
Profit-motivated thefts
Num
ber o
f Veh
icle
s
Financial Year
0-5 Years
6-10 Years
11+ Years
7
Sep
05
Jan
06
May
06
Sep
06
Jan
07
May
07
Sep
07
Jan
08
May
08
Sep
08
Jan
09
May
09
Sep
09
Jan
10
May
10
Sep
10
15
14
13
12
11
10
9
8
Num
ber o
f Veh
icle
s (’0
00)
Data as at July 2010
Quarter Stolen
Adjusted for late recovery
2,000
4,0003,800
3,600
3,4003,200
2,6002,4002,200
Num
ber o
f Veh
icle
s
Data as at July 2010
2,800
3,000
Quarter Stolen
Adjusted for late recovery
Sep
05
Dec
05
Mar
06
Jun
06
Sep
06
Dec
06
Mar
07
Jun
07
Sep
07
Dec
07
Mar
08
Jun
08
Sep
08
Dec
08
Mar
09
Jun
09
Sep
09
Dec
09
Mar
10
0
1,800
1,600
1,400
1,200
600
400
200
Num
ber o
f Veh
icle
s
Total
800
1,000
Quarter Stolen
Pre 1994
1994 to 1999
2000 to 2008
Dec
07
Feb
08
Apr 0
8
Jun
08
Aug
08
Oct 0
8
Dec
08
Feb
09
Jun
10
Sep
10
Dec
10
4,000
4,500
5,000
2005
/06
2006
/07
2007
/08
2008
/09
2009
/10
0
5
10
15
20
25
30
35
40
45
0-5 Years
2005
/06
2006
/07
2007
/08
2008
/09
2009
/10
2005
/06
2006
/07
2007
/08
2008
/09
2009
/10
Num
ber o
f Veh
icle
s (’0
00)
Financial Year
0
1
2
3
4
5
6
7
9
8
Num
ber o
f Veh
icle
s (’0
00)
Financial Year
6-10 Years
11+ Years
2,000
2,500
3,000
Short term thefts
2005
/06
2006
/07
2007
/08
2008
/09
2009
/10
Num
ber o
f Veh
icle
s
Financial Year
Profit-motivated thefts
Num
ber o
f Veh
icle
s
Financial Year
0-5 Years
6-10 Years
11+ Years
7
Sep
05
Jan
06
May
06
Sep
06
Jan
07
May
07
Sep
07
Jan
08
May
08
Sep
08
Jan
09
May
09
Sep
09
Jan
10
May
10
Sep
10
15
14
13
12
11
10
9
8
Num
ber o
f Veh
icle
s (’0
00)
Data as at July 2010
Quarter Stolen
Adjusted for late recovery
2,000
4,0003,800
3,600
3,4003,200
2,6002,4002,200
Num
ber o
f Veh
icle
s
Data as at July 2010
2,800
3,000
Quarter Stolen
Adjusted for late recovery
Sep
05
Dec
05
Mar
06
Jun
06
Sep
06
Dec
06
Mar
07
Jun
07
Sep
07
Dec
07
Mar
08
Jun
08
Sep
08
Dec
08
Mar
09
Jun
09
Sep
09
Dec
09
Mar
10
0
1,800
1,600
1,400
1,200
600
400
200N
umbe
r of V
ehic
les
Total
800
1,000
Quarter Stolen
Pre 1994
1994 to 1999
2000 to 2008
Dec
07
Feb
08
Apr 0
8
Jun
08
Aug
08
Oct 0
8
Dec
08
Feb
09
Jun
10
Sep
10
Dec
10
4,000
4,500
5,000
2005
/06
2006
/07
2007
/08
2008
/09
2009
/10
0
5
10
15
20
25
30
35
40
45
0-5 Years
2005
/06
2006
/07
2007
/08
2008
/09
2009
/10
2005
/06
2006
/07
2007
/08
2008
/09
2009
/10
Num
ber o
f Veh
icle
s (’0
00)
Financial Year
0
1
2
3
4
5
6
7
9
8
Num
ber o
f Veh
icle
s (’0
00)
Financial Year
6-10 Years
11+ Years
2,000
2,500
3,000
Short term thefts
2005
/06
2006
/07
2007
/08
2008
/09
2009
/10
Num
ber o
f Veh
icle
sFinancial Year
Profit-motivated thefts
Num
ber o
f Veh
icle
s
Financial Year
0-5 Years
6-10 Years
11+ Years
7
Sep
05
Jan
06
May
06
Sep
06
Jan
07
May
07
Sep
07
Jan
08
May
08
Sep
08
Jan
09
May
09
Sep
09
Jan
10
May
10
Sep
10
15
14
13
12
11
10
9
8
Num
ber o
f Veh
icle
s (’0
00)
Data as at July 2010
Quarter Stolen
Adjusted for late recovery
2,000
4,0003,800
3,600
3,4003,200
2,6002,4002,200
Num
ber o
f Veh
icle
s
Data as at July 2010
2,800
3,000
Quarter Stolen
Adjusted for late recovery
Sep
05
Dec
05
Mar
06
Jun
06
Sep
06
Dec
06
Mar
07
Jun
07
Sep
07
Dec
07
Mar
08
Jun
08
Sep
08
Dec
08
Mar
09
Jun
09
Sep
09
Dec
09
Mar
10
0
1,800
1,600
1,400
1,200
600
400
200
Num
ber o
f Veh
icle
s
Total
800
1,000
Quarter Stolen
Pre 1994
1994 to 1999
2000 to 2008
Dec
07
Feb
08
Apr 0
8
Jun
08
Aug
08
Oct 0
8
Dec
08
Feb
09
Jun
10
Sep
10
Dec
10
4,000
4,500
5,000
2005
/06
2006
/07
2007
/08
2008
/09
2009
/10

10 National Motor Vehicle Theft Reduction Council – Annual Report 2010
Reform activity
Disrupting separated parts markets New South Wales (NSW) Inter-agency Task Force into Separated Vehicle Parts
As the rebirthing of whole vehicles becomes progressively harder, the dismantling or stripping of stolen vehicles becomes increasingly more attractive for profit-motivated car criminals. There are many and varied potential channels for the distribution of stolen components. However, to date little empirical data has been available to estimate volumes per channel or inform the development of robust countermeasures.
It is generally claimed that the majority of those involved in the illicit trade in stolen vehicle parts operate outside the legitimate licensed motor trades. These people either work from well resourced backyard workshops or rented premises that have the appearance of a legitimate business. However, police intelligence suggests that this distinction is clouded – with some licensed businesses willing to purchase and use ‘cheap’ goods if offered, and also occasionally engage in more profitable illegal enterprises.
As the hub of profit-motivated car crime and one of only two Australian jurisdictions which licence or register both smash repairers and parts recyclers, NSW provides a unique opportunity to contrast the inventory control practices of licensed traders and suspected unlicensed counterparts. With the support of the NSW Police Force, the Department of Commerce, and the Roads and Traffic Authority, the NMVTRC facilitated the establishment of an Inter-agency Task Force (ITF) into the Separated Parts Market. The NSW ITF will attempt to utilise the combined powers and expertise of its agencies to build a more complete profile of the distribution channels for the illicit sale of separated parts, including any relationship with main street repairers and recyclers. It will, amongst other things, conduct business premises inspections of:
• smashrepairbusinesses(bothtradeassociationaffiliatedand non) to:
- inspect vehicles under repair and examine inventory and other business systems to determine the origin of related parts;
- check with claimed parts suppliers that purchase orders and invoices correlate; and
• vehicledismantlingbusinesses(bothtradeassociationaffiliatedand non) to audit compliance with regulatory requirements on inventory and environmental management.
It is envisaged that the ITF approach will provide:
• thebestmeansofquicklygatheringbetterempiricaldataonthescale and nature of the illicit separated parts market, including any links to main street repairers and recyclers; and
• valuableinputintothedevelopmentofmorerobustcountermeasuresvia regulation, incentive schemes, commercial agreements, voluntary codes or education.
The ITF is scheduled to report its findings by the end of 2010.
Disrupting vehicle laundering markets Better management of written-off vehicles
New Damage Assessment Criteria for Statutory Write-offsUnder the national framework for the management of WOVs developed by the NMVTRC and its stakeholders any collision, fire, water or weather-event damaged vehicle declared by an insurer (or self-insurer) to be a total loss must be classified to be either a statutory (SWO) or repairable (RWO) write-off.
Under the current regime a SWO may only be sold subject to a statutory restriction that it may only be used for parts or scrap metal. A RWO may be repaired and re-registered subject to the vehicle passing specific safety and identification inspections. A set of technical criteria determine when a WOV should be classified a SWO.
A national workshop of the NMVTRC’s key stakeholders in June 2009 resolved that the current criteria were in need of urgent updating to better reflect contemporary vehicle design and fabrication techniques and to make the system more impervious to manipulation by criminal networks and fraudsters.
In late 2009 the NMVTRC engaged forensic vehicle engineers Delta V Experts (DVE) to work with affected parties to develop new draft criteria to meet the system’s current and future needs. DVE was assisted by an Expert Reference Group (ERG) of affected parties established especially for this purpose. The ERG comprised twenty-one stakeholder representatives drawn nationally from a cross-section of transport agencies, police, insurers, and the motor trades. Discussions were also held with a range of other select organisations with an interest in related issues.
In parallel with the DVE project, the NMVTRC commissioned an independent audit of a sample of more than 400 WOVs sold at auction in Brisbane, Sydney, Melbourne and Perth to assess the consistency with which the current criteria were being applied. The audit was conducted by former insurance assessing executive Allan Gribble.
Overall, Gribble found that the classification system was generally operating to a high level and there was no evidence of the misclassification of vehicles either by design or the instruction of any party. However, he noted that the strict application of the current relatively simple damage criteria can result in severely damaged vehicles being categorised as RWOs when it should be obvious to a trained expert that the vehicle is suited only for dismantling. Gribble therefore recommended that DVE develop a means of more consistently identifying and appropriately classifying those vehicles suited only for dismantling as a priority.
A report proposing a set of revised criteria was circulated for comment in May 2010. The NMVTRC also hosted a half-day Information Briefing during the comment period for parties proposing to make a submission on the draft criteria.
11National Motor Vehicle Theft Reduction Council – Annual Report 2010
Changes in vehicle construction over recent years and the rapid acceleration in the use of new and composite materials mean that it is increasingly more complex to assure a complete and safe repair of a modern vehicle.
Police, industry sources and vehicle manufacturers have reported many examples of sub-standard RWO repairs with vehicles later presenting with reliability, safety or warranty issues. The NMVTRC’s extensive consultation with peak motor trades bodies across Australia also indicates that few if any ‘main street’ repairers are involved in repairing the RWOs that are presented for re-registration8.
The major vulnerabilities of the current inspection regimes are that they:
• concentratemostattentionandresourcesonthevehicleaspresented in its post-repair condition; and
• haveaheavyrelianceonpaperreceiptstoattempttoverify the provenance of parts used in repairs.
The June 2009 workshop referred to earlier resolved that there was a need for the system to place greater emphasis on assuring that repaired RWOs comply with the vehicle manufacturer’s specified method of repair for the type of damage sustained and that the vehicle is safe for road use, in addition to verifying its identity and the provenance of parts used in repairs.
In early 2010, the NMVTRC engaged public policy consultants Judy Oswin Consulting to develop a set of Best Practice Principles (BPP) for WOV safety and identification inspections that would assure any RWO granted re-registration:
• hasbeenrepairedinaccordancewiththevehiclemanufacturer’sspecified method of repair for the type of damage sustained;
• issafeforroaduse;
• intermsofitsidentity–isthevehicleitispurportedtobe;and
• hasbeenrepairedwithlegitimatelyacquiredparts.
7. Austroads is the association of Australian and New Zealand road transport and traffic authorities.
8. The term main street repairer is used here to describe a business that is clearly carrying on a collision repair business that:
- is open to the public;
- is likely to be a member of a peak trade association or collective buying group;
- is likely to be part of a preferred service provider network of one or more general insurers and or vehicle manufacturers; and
- could be expected to have management systems in place to assure compliance with all applicable regulations and potentially industry codes or other incentive based schemes.
In general terms, the comments received indicated a high degree of consensus about much of the proposed regime and a high level of consistency in comments on those elements which required clarification or re-working.
After reviewing the comments, the NMVTRC was of the view that most issues could be addressed by a combination of refined criteria and the separate development of a detailed photographic and/or illustrated technical guide to support consistent assessments in the field.
The ERG subsequently endorsed a modified set of criteria to be trialled in the field by a group of experienced assessors to determine the ease with which they could be applied and gather empirical evidence as to the likely impact of the new criteria on the prevailing ratios of RWOs to SWOs.
The key findings of the trial were that:
• applicationofthealternativecriteriacouldbeexpectedtoshiftupto 30 per cent of vehicles currently classified as repairable into the statutory (i.e. parts or scrap only) category resulting in a roughly equal distribution of the total WOV pool between the two categories;
• withonlyslightmodification,thetrialcriteriacouldeffectivelyremove all classes of damage considered to pose a structural repair risk from the RWO category;
• theprincipleofseparatelycountinglikeareasofunconnecteddamage in determining whether a vehicle has the three areas of damage required to render it a SWO did not have any undue or disproportionate impacts on the vehicle classification process; and
• thetrialcriteriaweregenerallyclear,unambiguousandthereforerelatively simple to apply once familiar with them.
The recommended criteria and the full report on the in-field tests can be downloaded from the publications page of the NMVTRC’s website carsafe.com.au
At time of writing the NMVTRC is preparing to make its final recommendations to Austroads and seek its members’ cooperation to commence planning for implementation of the new criteria7.
Best Practice Principles for Vehicle Safety and Identification InspectionsAs outlined above, RWOs permitted re-registration must pass a specific identification inspection (and in some jurisdictions a safety inspection).
12 National Motor Vehicle Theft Reduction Council – Annual Report 2010
Reform activity continued
• abackwardstrackingstudyofcompletedtransactions–areview of a sample of repaired written-off vehicles that have been re-registered in order to determine:
- the status of the persons or entities responsible for the purchase, repair and on sale of the vehicles (including whether they are legitimately presenting themselves as a private individual or business enterprise and whether they have met all legal requirements in regard to the transactions, including the provenance of the parts used); and
- whether those persons or entities can be linked to other re-registered RWOs;
• aforwardtrackingstudyofRWOspurchasedatauction–tofollowthe vehicle through its path to repair and re-registration (or its alternative use) via identifying appropriate intervention points in the purchase, storage, repair or vehicle identity validation inspection process to review repair documentation and/or inspect the vehicle.
The Victorian ITF is due to report in late 2010.
Audit of WOVs sold at public auction to confirm accuracy of classificationsThe accurate classification of written-off vehicles (WOVs) as either repairable or statutory write-offs is central to Australia’s system of managing wrecked vehicle identities.
Despite the use of common assessment criteria, there have been persistent suggestions that assessment outcomes vary from insurer to insurer and jurisdiction to jurisdiction. In such a scenario some vehicles which should be classified as statutory write-offs (and therefore not eligible for re-registration) are returning to the system as repairable vehicles and vice versa.
The best forum to provide an in-the-field picture of both the issues is the damaged vehicle auction process. In late 2009, the NMVTRC engaged former insurance assessing executive, Allan Gribble, to review the classification of more than 400 WOVs against the current national assessment criteria. Audits were conducted in Brisbane, Sydney, Melbourne and Perth.
Overall, Gribble found that the classification system was generally operating to a high level and there was no evidence of the misclassification of vehicles either by design or the instruction of any party. However, he noted that the strict application of the current relatively simple damage criteria can result in severely damaged vehicles being categorised as RWOs when it should be obvious to a trained expert that the vehicle is suited only for dismantling. Gribble therefore recommended that the NMVTRC’s review of damage criteria develop a means of more consistently identifying and appropriately classifying those vehicles suited only for dismantling as a priority.
The BPP are to be expressed as high level values for jurisdictions to, where necessary and over time, modify their existing inspection regime to reflect the BPP and optimise national consistency. The BPP cover such issues as:
• repairerskillsandcompetencies;
• compliancewithvehiclemanufacturers’specifiedrepairmethods;
• recordkeeping–includingthemaintenanceofrepairplans,diaries,photos, certification of measurements, specialist assessment of safety systems, etc.;
• requiringtheprincipalinspectiontobeconductedpriortoanyfillingor painting of the vehicle;
• theskillsandcompetenciesofinspectionpersonnel;and
• theprovenanceofparts.
At time of writing, a final set of BPP is being refined with Austroads’ Registration and Licensing Task Force.
Victorian Inter-agency Task Force into RWO Buyers and Unlicensed TradingRWOs purchased at auction may later be used as a ‘Trojan’ for stolen components with the rebuilt vehicle laundered via the registration system and on-sold to an unsuspecting buyer.
The production of high quality fraudulent receipts (and the payment of secret commissions to acquire ‘genuine’ receipts) – to give the parts used in repairing RWOs a veneer of authenticity – is considered to be rife.
RWO sales have also attracted a market for unlicensed motor car traders – who in some cases are known to have bought and sold up to 80 vehicles over a period of two years. In most states, the volume limit before licensing applies is between two and four vehicles. Police and industry sources report many examples of sub-standard repairs within this group with vehicles later presenting with reliability or safety issues. The vehicles are usually sold via print classifieds or on-line masquerading as private to private sales.
According to police in NSW and Western Australia (WA) the manipulation of RWO policies and practices is currently the most lucrative option for criminals seeking to convert stolen vehicles into cash. While the identified cases in NSW and WA are compelling, estimating precise volumes of vehicles involved has been a major issue of contention in the NMVTRC’s published analysis of the problem to date.
The Victorian ITF utilises the combined powers and expertise of Victoria Police and VicRoads to build a more complete profile of the incidence of RWOs being rebuilt using stolen parts and the extent of related unlicensed trading by:
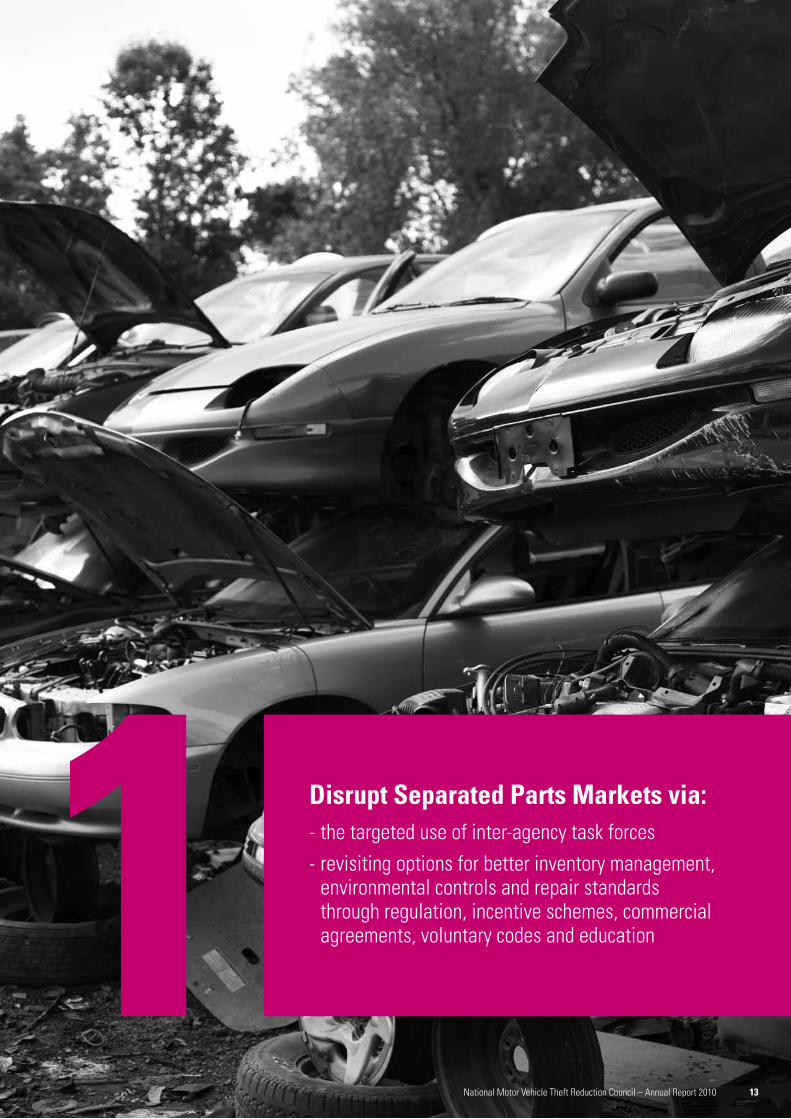
Disrupt Separated Parts Markets via:- the targeted use of inter-agency task forces
- revisiting options for better inventory management, environmental controls and repair standards through regulation, incentive schemes, commercial agreements, voluntary codes and education1
13National Motor Vehicle Theft Reduction Council – Annual Report 2010
14 National Motor Vehicle Theft Reduction Council – Annual Report 2010
Reform activity continued
However, in the private to private used vehicle market fewer than 10 per cent of buyers make any kind of check and occasionally even experienced motor traders get caught out buying vehicles that are not what they purport to be.
In simple terms, consumers and motor traders need to be able to verify that the vehicle they are considering buying is not stolen, is consistent with the description of the vehicle held by the registration authority (as protection against rebirthing), and is eligible for registration, i.e. it has not been declared a statutory write-off (as protection against rebirthing and fraud).
There is also objective evidence that the majority of repairable write-offs (RWOs) returning for re-registration have being repaired by ‘non-main street repairers’ which poses potential vehicle reliability and safety issues. More recently, vehicle manufacturers have also expressed a desire to be notified of a vehicle’s written-off status in order to manage warranty claims etc.
The Personal Property Securities Register (PPSR9) currently under development by the Australian Government’s Attorney-General’s Department (AGD) will at last establish a true one-stop-shop for vehicle status information.
The NMVTRC played a central role in ensuring that Austroads and the AGD reached agreement on terms that will ensure that the PPSR includes vital vehicle status information, including stolen and written-off status at a nominal cost.
Implementation of the PPSR is scheduled for May 2011. It will be important that implementation is supported by appropriate marketing from a variety of organisations to optimise consumer awareness and use.
Diverting young offendersA sustainable U-turn program for young recidivist offenders
Motor vehicles are stolen for many reasons, but young people are still responsible for three out of every four vehicle thefts in Australia. In larger Australian cities it is not uncommon for a ‘proficient’ young thief to have stolen more than 300 cars by his or her late teens.
High rate vehicle theft has also been shown to be a strong indicator of a young person’s likely involvement in other forms of crime. Traditional justice responses are costly and offenders are often returned to the community without the skills or support required to leave their former lifestyle behind.
The NMVTRC’s model young offender program U-turn uses the fascination that most young offenders have with vehicles to help them to develop practical automotive repair skills that can lead to further vocational or educational opportunities.
Management of end-of-life vehicles
Motor vehicles that have reached the end of their useful life (ELVs) are one of Australia’s most highly recycled consumer products. Current estimates put the annual volume of ‘retired vehicles’ at 600,000 and growing rapidly. Of these vehicles, up to 90 per cent reach metal recyclers for processing.
Hidden amongst these hundreds of thousands of legitimate transactions is an unknown number of stolen vehicles including the non-sanctioned collection of abandoned vehicles and stripped body shells. The disposal of stripped body shells through metal recycling also removes the risk to criminals of DNA and fingerprint identification.
Rising scrap metal prices over 2006/08 saw a rapid expansion in the demand for ELVs. By mid-2008 metal recyclers were paying up to $400/tonne for a vehicle (around a $250 premium over the long term rate of $150/tonne). These high returns led to the emergence of ‘theft for scrap’ rackets in several jurisdictions. Currently, more than half of all stolen/not recovered passenger and light commercial vehicles in Australia are valued at less than $5,000 (with about half of that group estimated to be worth less than $2,000). A significant proportion of these low value vehicles are thought to be lost to this methodology.
Generally, there are no statutory obligations on metal recyclers to verify or even record the identity of a person or their entitlement to sell a vehicle for scrap. Most payments to individuals are made in cash. The current system presents a very low risk for criminals to launder older stolen vehicles and stripped body shells.
There is also emerging evidence of insurance fraud in which an insured will conspire to have the vehicle stolen and shredded in order to make a false insurance claim.
In May 2010 the NMVTRC engaged public policy consultants SJ Wright and Associates to document the way the metal recycling industry is organised and structured by region and recommend a cost efficient model for better managing ELVs. A report is due for release in October 2010.
Exploring market resistance opportunities
Professional thieves and fraudsters rely on being able to disguise a stolen vehicle’s identity by altering its key identifiers or misrepresenting the vehicle’s status or history. This is much more difficult if potential purchasers are able to easily determine the vehicle’s true status.
Providing consumers and motor traders with easy access to quality, non-personal information about a vehicle’s history is a vital element of the NMVTRC’s strategy to combat the activities of criminals.
15National Motor Vehicle Theft Reduction Council – Annual Report 2010
Participating LGAs are required to submit a project plan that demonstrates their program is consistent with the NMVTRC’s best practice guide Tackling Vehicle Theft: A Guide for Local Communities.
OBB enables the NMVTRC to channel its community communications via a program of concentrated, precisely targeted and repeatable activities in the hottest of theft hot spots via partnerships with LGAs. The core focus of the program is to portray vehicle theft as a serious but preventable crime issue and chip away at community misperceptions about the dynamics of the problem by personalising the issue and promoting the concept that prevention is a shared responsibility.
OBB also extends the NMVTRC’s resources by developing activities that can be faithfully replicated across various settings.
The 2010 program was also extended to regional centres for the first time in several years with the inclusion of Ballarat in Victoria as well as Wyong and Newcastle in NSW. Grants are split into two distinct ‘flights’ of activity based on the local period of peak risk in order to ensure heightened community awareness at the most appropriate time of the year. This approach results in two clusters of activity from March to June and August to October.
As a consequence, at the time of writing only 11 of the 26 programs for 2010 have been completed and evaluated.
An analysis of theft figures in those LGAs again show encouraging signs with more than a third achieving reductions greater than their respective state averages. Table 1 on page 17 provides an overview of older passenger/light commercial theft numbers over the past two years for these LGAs.
Twenty-four per cent of all print materials were distributed in languages other than English. All NMVTRC public education resources are available via the Car-Safe website.
A number of LGAs achieved very positive community responses from their outstanding utilisation of the media in promoting OBB. Logan City Council and Glenorchy City Council ran a series of radio advertisements reminding residents to secure their vehicles in conjunction with on-air immobiliser giveaways. The City of Charles Sturt was featured on a prime time news channel, enhancing recognition of the program and the Car-Safe messages well beyond the municipality. 9. The PPSR has significant conceptual similarities with the current REVS service but
will have a much broader scope in relation to the types of goods over which a security interest may be registered. By volume, vehicles will represent up to 60 per cent of all goods subject to a registered security.
Independent expert evaluations of U-turn demonstrate that it has achieved high standards of participation, completion and relapse prevention. Despite this, it has proven difficult to get central agencies and service planners to see the program as a genuine alternative.
Mission Australia (MA), which has successfully operated the Tasmanian U-turn program for more than seven years, has more recently developed considerable expertise in developing self-funding transitional labour market programs for socially disadvantaged groups – particularly in Melbourne. MA uses the term social enterprise (SE) to describe its service model.
In October 2009, the NMVTRC and MA signed a Memorandum of Understanding to examine options for establishing U-turn as a self-funding social enterprise. A report on possible options will shortly be considered by the NMVTRC.
Supporting local government initiative and innovation
The NMVTRC also supported a successful application by the Cities of Bankstown and Canterbury in south-western Sydney for Australian Government funding under its Proceeds of Crime Act, to develop a smaller scale program based on the U-turn model. The NMVTRC will provide the program with on-going design advice and links to other expert input from a range of professionals who have past and current operational experience in delivering U-turn.
U-turn Tasmania
In the meantime, the original U-turn site based in Hobart saw its thirtieth group of young Tasmanians graduate in mid-2010.
Since commencing as a two-year pilot in 2003 with NMVTRC and Australian Government funding, U-turn Tasmania made a significant difference to the lives of more than 300 young people and their families. Its success has seen the Tasmanian Government commit to funding the program through to at least 2013. MA operates the site under contract to the Department of Police and Emergency Management. Building stakeholder/community capacity and encouraging innovationOperation Bounce Back
Operation Bounce Back (OBB) is the NMVTRC’s partnership with local government authorities (LGAs) in vehicle theft hot spots. OBB promotes awareness of vehicle security issues and helps theft victims get on with life. A grant package to the value of $35,000 is provided to up to 26 LGAs in theft hot spots nationally.
Each package consists of immobiliser installations, public education materials, and funding to support time specific projects designed to address theft of older vehicles in the local area. LGAs are selected on a ranking of their relative theft rates and older vehicle registration rates.
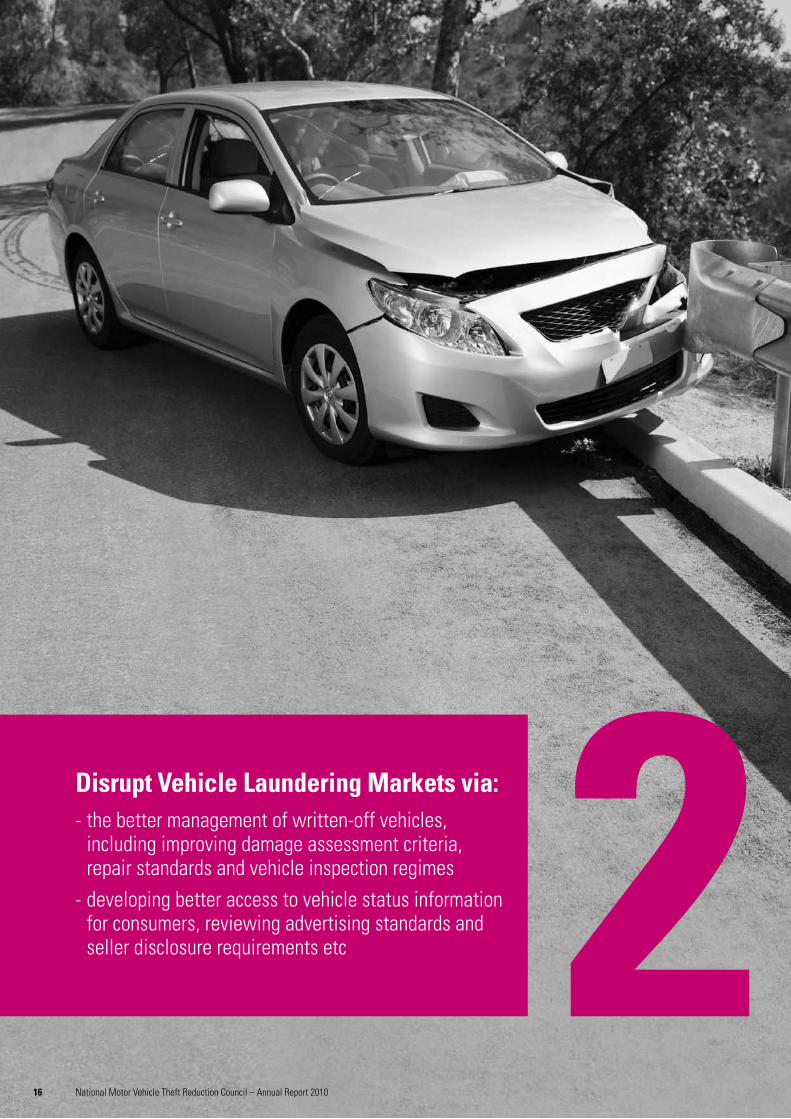
Disrupt Vehicle Laundering Markets via:- the better management of written-off vehicles,
including improving damage assessment criteria, repair standards and vehicle inspection regimes
- developing better access to vehicle status information for consumers, reviewing advertising standards and seller disclosure requirements etc 2
16 National Motor Vehicle Theft Reduction Council – Annual Report 2010
17National Motor Vehicle Theft Reduction Council – Annual Report 2010
factor when purchasing a new car, and concern about car key theft in order to steal a vehicle has risen noticeably since 2008 (now 93 per cent of respondents compared to 86 per cent).
These findings highlight the importance of targeted and relevant information for owners of both new and older model vehicles. The NMVTRC’s updated suite of educational brochures includes a greater focus on key theft and the importance of owners protecting car keys. The NMVTRC’s flagship media event, Secure By Design, which assesses the security features of new vehicles is also scheduled for 2010/11 and will reinforce the role secure vehicle design has to play in reducing theft. Better sanctions
There are no specific offences dealing specifically with profit-motivated vehicle theft in the criminal law of most Australian jurisdictions and offenders will normally be charged under general provisions relating to the theft of property. If force is used, the offender may also face robbery or armed robbery charges.
To attain a conviction under typical property crime laws the prosecution must establish basic points of proof around both the physical act of stealing and the mental intention of the accused to permanently deprive the owner of the property.
The major challenge facing prosecutors is providing the courts with sufficient evidence to convey the full extent of the criminal activity involved for a variety of reasons. Firstly, the criminal networks involved deploy a deliberate tactic to ‘compartmentalise’ the crime into distinct elements making it difficult to prove a course of conduct against key syndicate members.
Secondly, police must prove the true source of the re-identified or reconstructed vehicle and/or the disassembled parts that are suspected to be stolen. Such evidentiary shortfalls often lead to charges only being laid (and evidence of conduct being led) in respect of a relatively small proportion of the overall activity. As a consequence, significant numbers of cases result in plea bargains to lesser charges, such as receiving stolen property or forging documents, in order to secure a conviction.
10. Awareness and perceptions of car theft and preventative measures Nexus Research for the NVMTRC (March 2010).
OBB continues to provide an efficient and cost-effective channel for the delivery of key theft prevention messages and has been particularly successful in fostering stronger partnerships between community stakeholders, local government and police.
In addition to OBB, the NMVTRC also supports other community based programs by providing print and other educational resources to local police and many stakeholder organisations. A total of 70,000 security tips brochures and other education materials were distributed via these stakeholder channels.
Motorists’ attitudes to vehicle crime
Two of Australia’s major vulnerabilities to vehicle theft are the remaining numbers of older, non-secure vehicles on the nation’s roads and community apathy about understanding the risks and consequences of having a vehicle stolen.
A major focus of the NMVTRC’s overall communications strategy is therefore to better understand motorists’ attitudes and develop quality, cost-effective programs to inform the community and improve security practices.
We therefore periodically survey motorists on their attitudes to vehicle theft and security. This year’s survey of more than 1,200 motorists indicates that community awareness of the reality of vehicle theft and the importance of vehicle security continues to improve.
Awareness of effective security measures was very high among motorists with 99 per cent identifying engine immobilisers as offering the highest level of protection against theft. Close to two thirds of the respondents also nominated owners themselves as the group most able to assist with reducing vehicle theft. Pleasingly, these results indicate that education around theft of older vehicles and the notion of car theft prevention being a shared responsibility as promoted by Operation Bounce Back has had a significant and enduring impact within the community.
The overall level of community concern remained relatively steady with around seven in 10 motorists indicating they were concerned about the problem10. However the survey also pointed to a growing awareness of the importance of vehicle security in new cars. A third of respondents would consider car security as the third most important
Reform activity continued
Table 1: Thefts of older (10+ years) passenger/light commercial vehicles by select LGA for FY2008 and 2009
Local Government Area 2008/09 Thefts 2009/10 Thefts Local Change % State Average %
Bankstown (NSW) 581 540 -7 -1Frankston (VIC) 471 326 -31 -4Charles Sturt (SA) 479 297 -38 -22Gosnells (WA) 120 81 -32 -31
18 National Motor Vehicle Theft Reduction Council – Annual Report 2010
Minimising opportunities for insurance fraud
In 2007 the NMVTRC continued its collaboration with Austroads, its contracted information broker Motorweb and the Federal Chamber of Automotive Industries to develop an on-line registration data validation service for insurers (VIRS).
The system will enable an insurer to submit a query based on plate number (e.g. ABC 123) and State/Territory indicator to the broker and receive confirmed non-personal data from the national registration exchange system – including VIN, make, model, year of manufacture, body type, transmission, fuel, stolen status and written-off status.
A pilot of the system is scheduled to commence in November 2010.
Other strategic fraud issues
The NMVTRC continued to participate in the Insurance Council of Australia’s Economic Crime Working Group to reduce fraud opportunities against all classes of insurance and optimise the affordability of insurance for consumers.
It also often means that only the relatively junior members of the syndicate associated with the lower order activities such as the physical theft are successfully prosecuted.
Proponents of specific profit-motivated vehicle theft offences argue that the creation of particular offences enable police to better inform the courts about the elements of the theft and any prior convictions of the accused. Conversely, some legal professionals argue that courts are capable of differentiating the relative seriousness of the conduct and adjust penalties accordingly.
To address these perceived problems, the NSW Government introduced a raft of specific vehicle theft offences via the Crimes Amendment (Organised Car and Boat Theft) Bill 2006. The key change was the inclusion of an offence of knowingly facilitating a car rebirthing activity that is carried out on an organised basis.
In simple terms, a charge is proven if the Crown can demonstrate that the defendant participated in any part of the rebirthing chain, including providing finance or providing premises used in connection with the activity. The maximum penalty under the revised offence is 14 years imprisonment.
In December 2009 the NMVTRC engaged lawyers DLA Phillips Fox to review the impacts of the NSW laws and assess their potential for application in other jurisdictions. The NMVTRC will consider the final report in September 2010.
CARS data services
The NMVTRC’s world-leading Comprehensive Auto-theft Research System (CARS) again provided stakeholders and the media with fast, easy access to the most up to date vehicle theft data available with almost 2,500 self-directed searches made for the year via the on-line search tools Analyser and QuickStats.
Stakeholders also made more than 230 ad-hoc requests for detailed data and more than 190 copies of the annual CD-ROM containing some 650 pages of detailed trends and localised profiles were distributed.
The number of records flowing into the system from all sources (police, insurers, registration agencies and commercial auto intelligence services) totalled almost 30 million for the year.
Reform activity continued
19National Motor Vehicle Theft Reduction Council – Annual Report 2010 19National Motor Vehicle Theft Reduction Council – Annual Report 2010
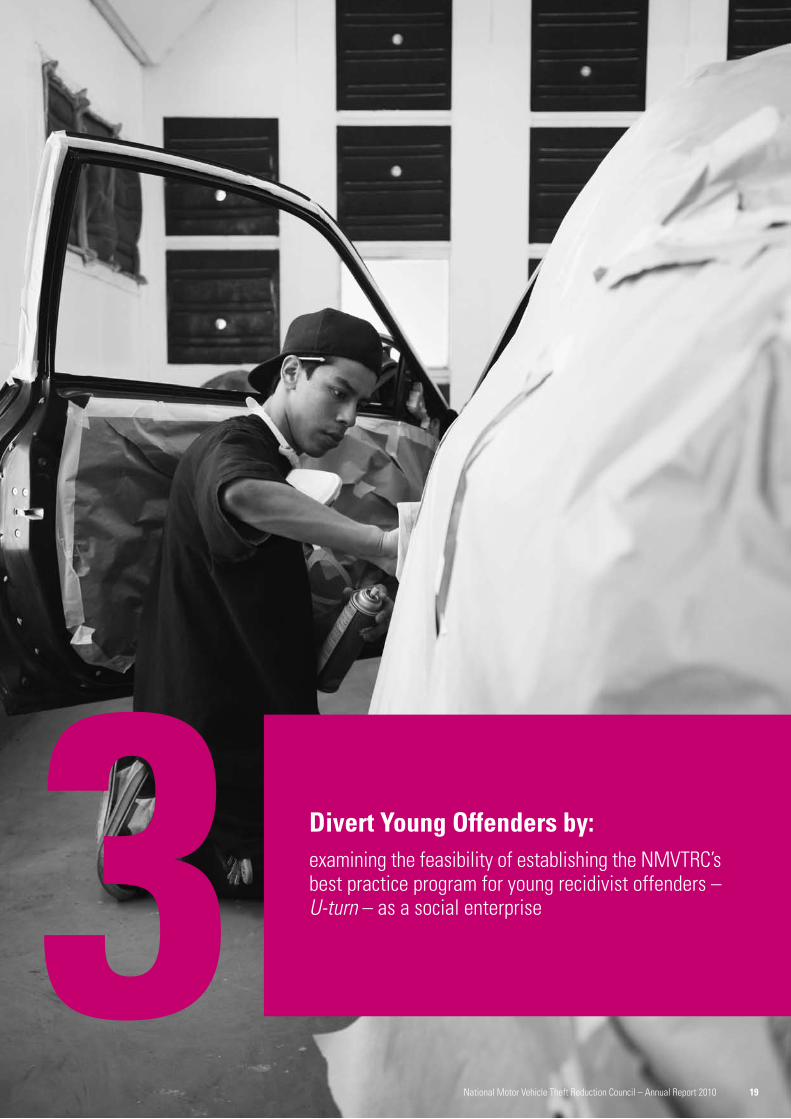
Divert Young Offenders by:examining the feasibility of establishing the NMVTRC’s best practice program for young recidivist offenders – U-turn – as a social enterprise3
20 National Motor Vehicle Theft Reduction Council – Annual Report 2010
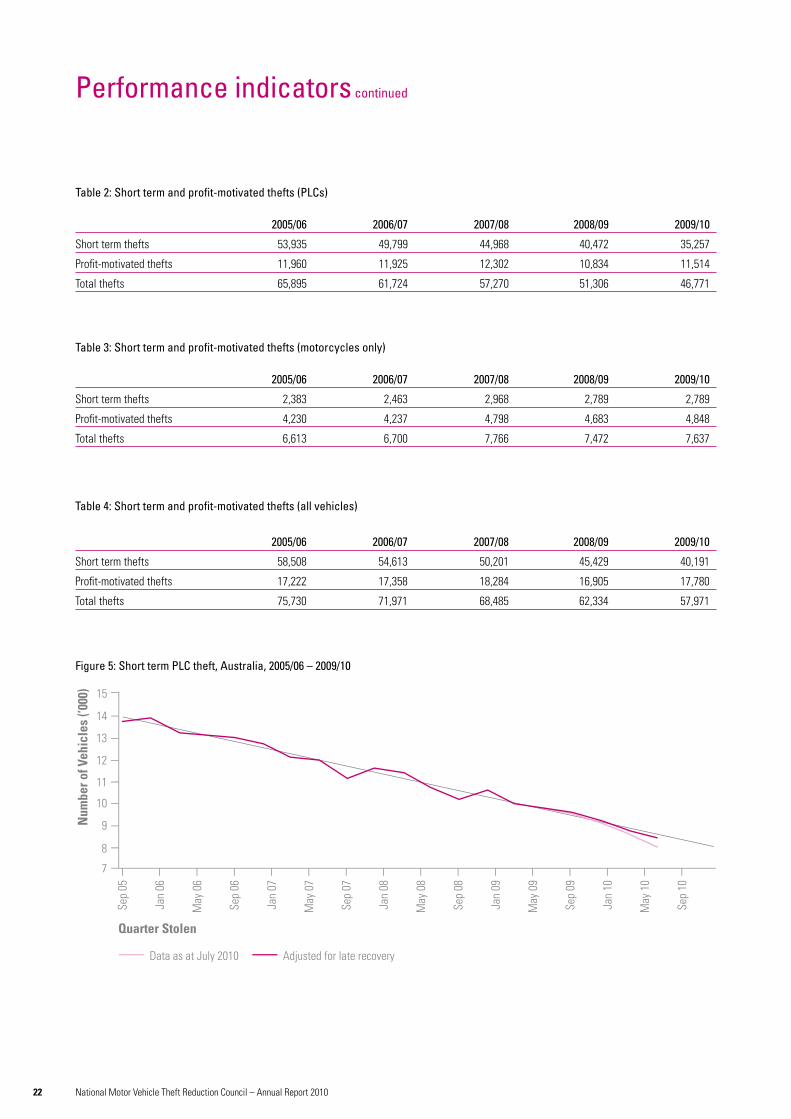
Short term passenger and light commercial (PLC) theftFigure 5 on page 22 shows a consistent decline in short term theft over the past five years. In FY 2009/10 35,257 short term thefts were recorded. Adjusted for late recoveries this represents an 11 per cent decrease on the FY 2008/09 and a 33 per cent decrease on the 2005/06 baseline.
PLCs more than 10 years old continue to make up the bulk of short term theft; over two thirds of all short term theft targets were manufactured prior to 2000. Between FY 2005/06 and 2009/10, thefts of vehicles aged zero to five have declined 20 per cent, six to 10, 29 per cent and the 11 plus age group by 38 per cent.
The number of vehicles in the fleet fitted with an Australian-Standards Equivalent (ASE) immobiliser grew by 4 per cent during the year and over two thirds (67 per cent) of the PLC fleet is now secured by an ASE immobiliser. Over 63 per cent of all short term thefts were from the 33 per cent of the fleet that is not secured by an ASE immobiliser.
Immobilisation of the fleet has played an important role in the continuing decline of short term theft however, there are still 4.7 million unsecured vehicles on Australian roads and in 2009/10 almost 13,000 thefts were vehicles fitted with an ASE immobiliser. While the majority of opportunistic thieves continue to focus on unsecured cars there is an emerging trend towards gaining access to keys and transponders via theft, fraud or opportunities arising from owner carelessness.
Policing strategies that have focused on detecting high rate recidivist offenders have also made a major contribution to the continuing reduction in the level of short term theft and an appropriate mix of legal sanctions and behavioral programs is needed to ensure recidivist offenders break the offending cycle following detection.
An unknown, but not insignificant proportion of short term theft reports are likely to be fraudulent insurance claims and during the year the insurance industry has continued to refine its analytical and investigative responses to limit opportunities for fraud to go undetected.
Profit-motivated PLC theftFigure 6 on page 23 shows significant fluctuation in the number of PLC SNR vehicles over the past five years, however the five year trend line does indicate a steady decline in the average number of vehicles stolen and not recovered. In FY 2009/10 11,514 profit-motivated thefts were recorded and when adjusted for late recoveries this represents a very slight decline on the 2008/09 year and an 11 per cent decline when compared with the five year baseline.
Around 85 per cent of all SNR PLCs are more than six years old reflecting the reluctance of criminals to deal in late model vehicles that are more difficult to sell in the second hand market without verifiable histories and have little demand for spare parts. Six in 10 SNR vehicles were more than 10 years old with the major portion of those valued at less than $5,000.
Vehicle theft in comparable developed nationsSince 2000, the NMVTRC has benchmarked its performance against a group of nine comparable OECD countries (Belgium, Canada, France, Germany, Italy, Japan, New Zealand, the United Kingdom (UK) and the United States) – the ‘Original Data Model’. In the absence of a single, uniform collation process data has to be sourced from a variety of international publications.
This process has seen Australia’s relative ‘world ranking’ improve (or hold steady) for the past five years.
However, the data compilation exercise has been getting increasingly more difficult with several countries discontinuing reporting or significantly changing related counting rules and definitions.
As a result of these changes and the number of assumptions which have to be made in an attempt to make disparate collection methods consistent, the NMVTRC’s assessment is that the Original Data Model is now too compromised to be a reliable benchmark of international performance. We therefore propose to seek an alternative means of comparison in 2011.
Changes in the incidence of theft for short term use and profit-motivated theftThe NMVTRC reports short term and profit-motivated theft separately to highlight the fact that different motivations drive each of these broad theft categories. It therefore follows that targeted strategic responses will impact each category of theft differently. The number of stolen and recovered vehicles is used as the surrogate measure for short term theft and stolen not recovered (SNR) for profit-motivated theft.
Aggregated data has the potential to mask trends that may be occurring within Australia particularly in regard to the mix of short term and profit-motivated theft but also in respect to changes in the age profile of stolen vehicles. It is necessary to separately examine the changes in the incidence of both short term and profit-motivated theft and the consequential changes in vehicle age in order to better understand the level of progress that is being made.
The impact of late recoveries on stolen recovered and SNR dataA percentage of stolen vehicles that were stolen in the financial year will be recovered after the close of the data period. This has the effect of artificially inflating the number of reported SNR and correspondingly understating the number of stolen recovered. In order to minimise this late recovery effect, the data presented to 30 June 2010 includes all recoveries reported up until 31 July 2010. Using historical data it can be estimated that additional late recoveries will be found up to 12 months after the 30th of June and will reduce the SNR by a further 8.2 per cent and increase the stolen recovered by 2.1 per cent.
Performance indicators
21National Motor Vehicle Theft Reduction Council – Annual Report 2010
the Comprehensive Auto-theft Research System (55 per cent) and Community Education Initiatives (50 per cent). The elements of the program stakeholders were least familiar with were the Motorist Surveys and the work of the Inter-agency Task Forces.
As has been reported in previous years, more than four in five stakeholders showed a very high level of satisfaction with the NMVTRC’s dissemination of vehicle theft information and information on the theft reform process.
Actively engaging stakeholders in program coordination was seen as a particular strength of the NMVTRC, with the Strategic Planning Series and Expert Reference Group process particularly highly valued.
Publications
All respondents felt that the quality of the NMVTRC’s publications deserved a rating of good or better than good, and 95 per cent awarded the same score in respect to the extent to which the NMVTRC’s publications met stakeholder needs and expectations. Ninety-five per cent also gave a score of good or better than good with respect to the extent to which the publications’ objectives were met.
The NMVTRC’s two quarterly newsletters, Theft Watch and Theft Torque, were the most recognised publications by respondents. Stakeholders noted that the newsletters are an effective conduit for sharing information and provide ‘an appropriate level of communication’.
A couple of stakeholders observed that the CAR-SAFE web site was not as contemporary in appearance as the NMVTRC’s other ‘communications channels’ and difficult to navigate. A major refresh of the web site is scheduled for late 2010.
Influence on reforms
Ninety-five per cent of respondents attributed the NMVTRC the major driver of reform progress in their sector or organisation, while 90 per cent felt that the NMVTRC has had been influential in advancing reform more generally.
A couple of respondents expressed the view that the NMVTRC could to more to co-ordinate local, state-based responses to key issues.
11. Based on an independent economic analysis conducted by MM Stars Pty Ltd for the NMVTRC (November 2008) which estimated victims’ costs per incident to be $11,500 for recovered vehicles and $20,610 for vehicles not recovered depending on a range of personal and other factors.
Some of the fluctuations that appear in the level of profit-motivated theft can be directly linked to changes in the prevailing economic settings. Figure 7 on page 23 shows the age distribution of vehicles SNR during the significant spike in thefts that occurred between March and September 2008. Almost all of the increase during that period was due to the theft of vehicles manufactured prior to 1994. This same period coincided with a sharp rise in scrap metal prices that peaked in the June to August period and then plummeted in September due to the global financial crisis. Scrap metal prices regained their historical average during the year and theft for scrap remains a significant contributor to the overall incidence of SNR.
The causes of other fluctuations are less obvious but it does appear that seasonal factors play a role, with the December quarter generally showing a sharp decline followed by a steady increase in SNR numbers in the March through to the June quarter.
Analysis of NMVTRC in the mediaVehicle theft featured prominently in the media this year with over 1000 related articles published. The NMVTRC was referenced in over 40 of these articles on a range of issues including repairable write-offs, local government specific theft targets and hot spots, state-wide trends, secure compliance labels and holiday period theft risks. Operation Bounce Back continued to achieve good media coverage and theft hot spots and vehicles most commonly stolen featured heavily in suburban newspapers throughout the year.
The NMVTRC also featured in a number of radio and television interviews and features relating to written-off vehicles, vehicle theft generally, car theft hot spots and Operation Bounce Back.
The cost of motor vehicle theftThe reduction in short term theft numbers for the year has saved the community an estimated $60 million11. The NMVTRC therefore estimates the cost of vehicle theft to be over $640 million, excluding the very large community costs associated with police investigations, courts, and corrections.
Stakeholder determined performance indicatorsA select sample of senior stakeholder executives from across Australia were asked to provide feedback via a short, online survey designed to assess the NMVTRC’s performance in relation to its program coordination and consultation, publications, and level of influence.
Program coordination and consultation
Ninety-five per cent of stakeholders rated the NMVTRC’s consultation performance as good or better than good. Overall awareness of the NMVTRC’s reforms and programs was high. The reforms respondents were most familiar with were those relating to the Better Management of Written-off Vehicles (85 per cent recognition), U-Turn (60 per cent),
22 National Motor Vehicle Theft Reduction Council – Annual Report 2010
Table 2: Short term and profit-motivated thefts (PLCs)
2005/06 2006/07 2007/08 2008/09 2009/10
Short term thefts 53,935 49,799 44,968 40,472 35,257
Profit-motivated thefts 11,960 11,925 12,302 10,834 11,514
Total thefts 65,895 61,724 57,270 51,306 46,771
Table 3: Short term and profit-motivated thefts (motorcycles only) 2005/06 2006/07 2007/08 2008/09 2009/10
Short term thefts 2,383 2,463 2,968 2,789 2,789
Profit-motivated thefts 4,230 4,237 4,798 4,683 4,848
Total thefts 6,613 6,700 7,766 7,472 7,637
Table 4: Short term and profit-motivated thefts (all vehicles)
2005/06 2006/07 2007/08 2008/09 2009/10
Short term thefts 58,508 54,613 50,201 45,429 40,191
Profit-motivated thefts 17,222 17,358 18,284 16,905 17,780
Total thefts 75,730 71,971 68,485 62,334 57,971
0
5
10
15
20
25
30
35
40
45
0-5 Years
2005
/06
2006
/07
2007
/08
2008
/09
2009
/10
2005
/06
2006
/07
2007
/08
2008
/09
2009
/10
Num
ber o
f Veh
icle
s (’0
00)
Financial Year
0
1
2
3
4
5
6
7
9
8
Num
ber o
f Veh
icle
s (’0
00)
Financial Year
6-10 Years
11+ Years
2,000
2,500
3,000
Short term thefts
2005
/06
2006
/07
2007
/08
2008
/09
2009
/10
Num
ber o
f Veh
icle
s
Financial Year
Profit-motivated thefts
Num
ber o
f Veh
icle
s
Financial Year
0-5 Years
6-10 Years
11+ Years
7
Sep
05
Jan
06
May
06
Sep
06
Jan
07
May
07
Sep
07
Jan
08
May
08
Sep
08
Jan
09
May
09
Sep
09
Jan
10
May
10
Sep
1015
14
13
12
11
10
9
8
Num
ber o
f Veh
icle
s (’0
00)
Data as at July 2010
Quarter Stolen
Adjusted for late recovery
2,000
4,0003,800
3,600
3,4003,200
2,6002,4002,200
Num
ber o
f Veh
icle
s
Data as at July 2010
2,800
3,000
Quarter Stolen
Adjusted for late recovery
Sep
05
Dec
05
Mar
06
Jun
06
Sep
06
Dec
06
Mar
07
Jun
07
Sep
07
Dec
07
Mar
08
Jun
08
Sep
08
Dec
08
Mar
09
Jun
09
Sep
09
Dec
09
Mar
10
0
1,800
1,600
1,400
1,200
600
400
200
Num
ber o
f Veh
icle
s
Total
800
1,000
Quarter Stolen
Pre 1994
1994 to 1999
2000 to 2008
Dec
07
Feb
08
Apr 0
8
Jun
08
Aug
08
Oct 0
8
Dec
08
Feb
09
Jun
10
Sep
10
Dec
10
4,000
4,500
5,000
2005
/06
2006
/07
2007
/08
2008
/09
2009
/10
Figure 5: Short term PLC theft, Australia, 2005/06 – 2009/10
Performance indicators continued
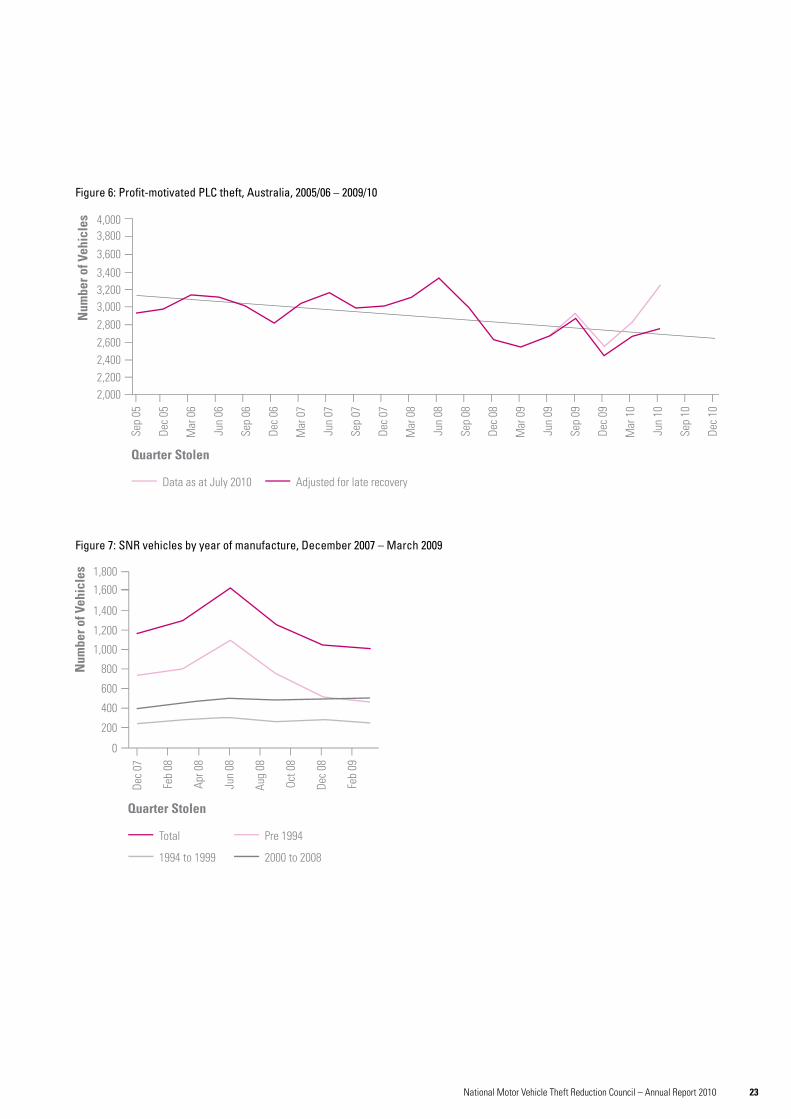
23National Motor Vehicle Theft Reduction Council – Annual Report 2010
0
5
10
15
20
25
30
35
40
45
0-5 Years
2005
/06
2006
/07
2007
/08
2008
/09
2009
/10
2005
/06
2006
/07
2007
/08
2008
/09
2009
/10
Num
ber o
f Veh
icle
s (’0
00)
Financial Year
0
1
2
3
4
5
6
7
9
8
Num
ber o
f Veh
icle
s (’0
00)
Financial Year
6-10 Years
11+ Years
2,000
2,500
3,000
Short term thefts
2005
/06
2006
/07
2007
/08
2008
/09
2009
/10
Num
ber o
f Veh
icle
s
Financial Year
Profit-motivated thefts
Num
ber o
f Veh
icle
s
Financial Year
0-5 Years
6-10 Years
11+ Years
7
Sep
05
Jan
06
May
06
Sep
06
Jan
07
May
07
Sep
07
Jan
08
May
08
Sep
08
Jan
09
May
09
Sep
09
Jan
10
May
10
Sep
10
15
14
13
12
11
10
9
8
Num
ber o
f Veh
icle
s (’0
00)
Data as at July 2010
Quarter Stolen
Adjusted for late recovery
2,000
4,0003,800
3,600
3,4003,200
2,6002,4002,200
Num
ber o
f Veh
icle
s
Data as at July 2010
2,800
3,000
Quarter Stolen
Adjusted for late recovery
Sep
05
Dec
05
Mar
06
Jun
06
Sep
06
Dec
06
Mar
07
Jun
07
Sep
07
Dec
07
Mar
08
Jun
08
Sep
08
Dec
08
Mar
09
Jun
09
Sep
09
Dec
09
Mar
10
0
1,800
1,600
1,400
1,200
600
400
200
Num
ber o
f Veh
icle
s
Total
800
1,000
Quarter Stolen
Pre 1994
1994 to 1999
2000 to 2008
Dec
07
Feb
08
Apr 0
8
Jun
08
Aug
08
Oct 0
8
Dec
08
Feb
09
Jun
10
Sep
10
Dec
10
4,000
4,500
5,000
2005
/06
2006
/07
2007
/08
2008
/09
2009
/10
Figure 6: Profit-motivated PLC theft, Australia, 2005/06 – 2009/10
Figure 7: SNR vehicles by year of manufacture, December 2007 – March 2009
0
5
10
15
20
25
30
35
40
45
0-5 Years
2005
/06
2006
/07
2007
/08
2008
/09
2009
/10
2005
/06
2006
/07
2007
/08
2008
/09
2009
/10
Num
ber o
f Veh
icle
s (’0
00)
Financial Year
0
1
2
3
4
5
6
7
9
8
Num
ber o
f Veh
icle
s (’0
00)
Financial Year
6-10 Years
11+ Years
2,000
2,500
3,000
Short term thefts
2005
/06
2006
/07
2007
/08
2008
/09
2009
/10
Num
ber o
f Veh
icle
s
Financial Year
Profit-motivated thefts
Num
ber o
f Veh
icle
s
Financial Year
0-5 Years
6-10 Years
11+ Years
7
Sep
05
Jan
06
May
06
Sep
06
Jan
07
May
07
Sep
07
Jan
08
May
08
Sep
08
Jan
09
May
09
Sep
09
Jan
10
May
10
Sep
10
15
14
13
12
11
10
9
8
Num
ber o
f Veh
icle
s (’0
00)
Data as at July 2010
Quarter Stolen
Adjusted for late recovery
2,000
4,0003,800
3,600
3,4003,200
2,6002,4002,200
Num
ber o
f Veh
icle
s
Data as at July 2010
2,800
3,000
Quarter Stolen
Adjusted for late recovery
Sep
05
Dec
05
Mar
06
Jun
06
Sep
06
Dec
06
Mar
07
Jun
07
Sep
07
Dec
07
Mar
08
Jun
08
Sep
08
Dec
08
Mar
09
Jun
09
Sep
09
Dec
09
Mar
10
0
1,800
1,600
1,400
1,200
600
400
200
Num
ber o
f Veh
icle
s
Total
800
1,000
Quarter Stolen
Pre 1994
1994 to 1999
2000 to 2008
Dec
07
Feb
08
Apr 0
8
Jun
08
Aug
08
Oct 0
8
Dec
08
Feb
09
Jun
10
Sep
10
Dec
10
4,000
4,500
5,000
2005
/06
2006
/07
2007
/08
2008
/09
2009
/10

24 National Motor Vehicle Theft Reduction Council – Annual Report 2010
Build Stakeholder/Community Capacity Encourage Innovation via:a select range of communications, public education and law reform projects 4
25National Motor Vehicle Theft Reduction Council – Annual Report 2010
26 Statement by members of the committee
27 Independent audit report
28 Statement of income and expenditure
29 Statement of financial position
30 Statement of cash flows
32 Notes to the financial statements
36 Appendices
Financial statements
4
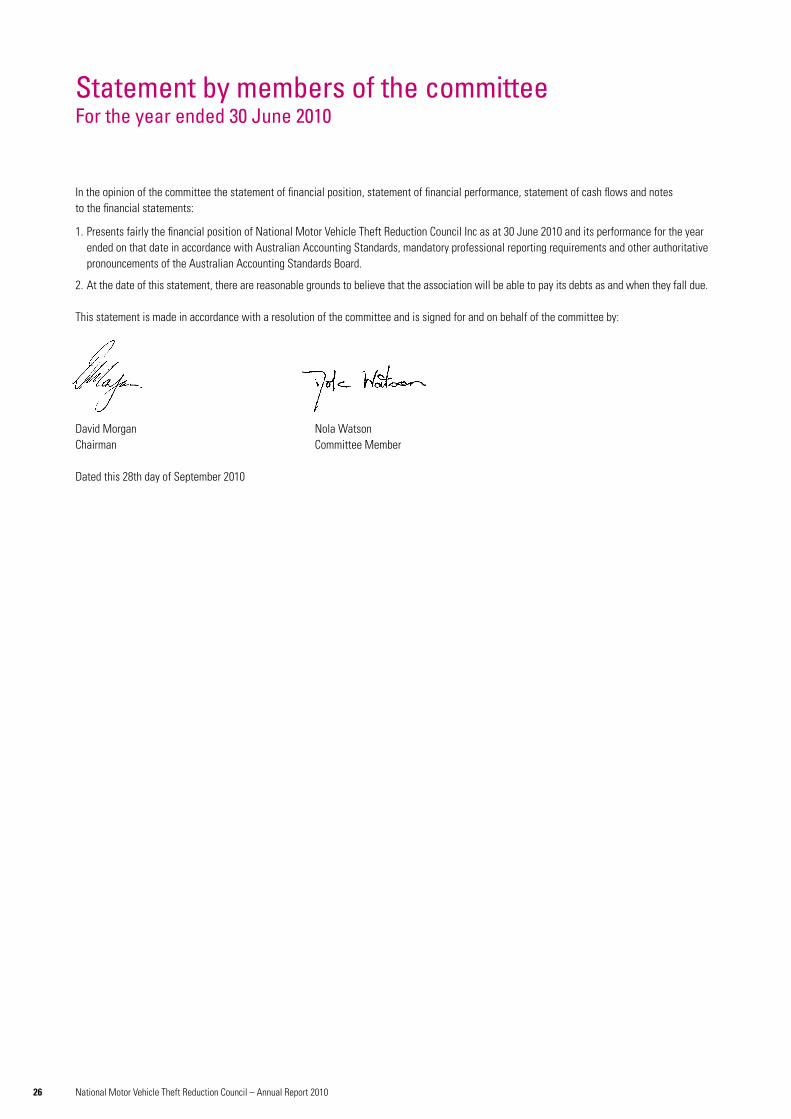
26 National Motor Vehicle Theft Reduction Council – Annual Report 2010
Statement by members of the committeeFor the year ended 30 June 2010
In the opinion of the committee the statement of financial position, statement of financial performance, statement of cash flows and notes to the financial statements:
1. Presents fairly the financial position of National Motor Vehicle Theft Reduction Council Inc as at 30 June 2010 and its performance for the year ended on that date in accordance with Australian Accounting Standards, mandatory professional reporting requirements and other authoritative pronouncements of the Australian Accounting Standards Board.
2. At the date of this statement, there are reasonable grounds to believe that the association will be able to pay its debts as and when they fall due.
This statement is made in accordance with a resolution of the committee and is signed for and on behalf of the committee by:
David Morgan Nola WatsonChairman Committee Member
Dated this 28th day of September 2010
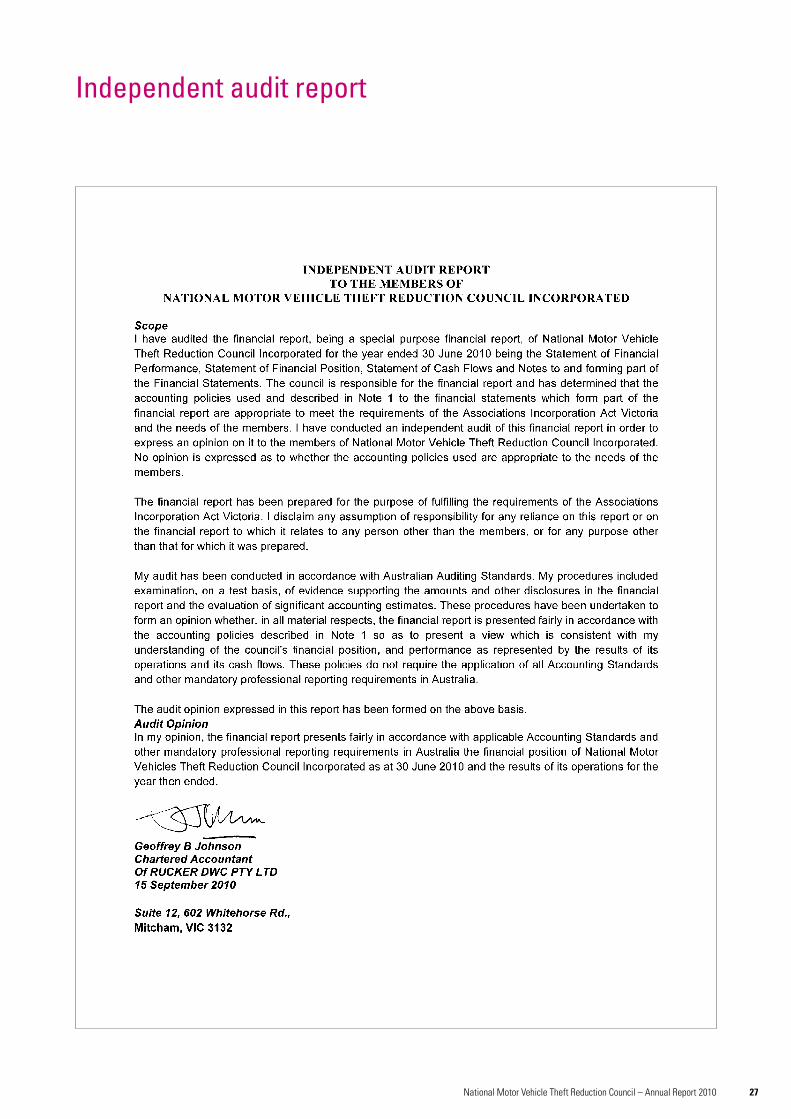
27National Motor Vehicle Theft Reduction Council – Annual Report 2010
Independent audit report
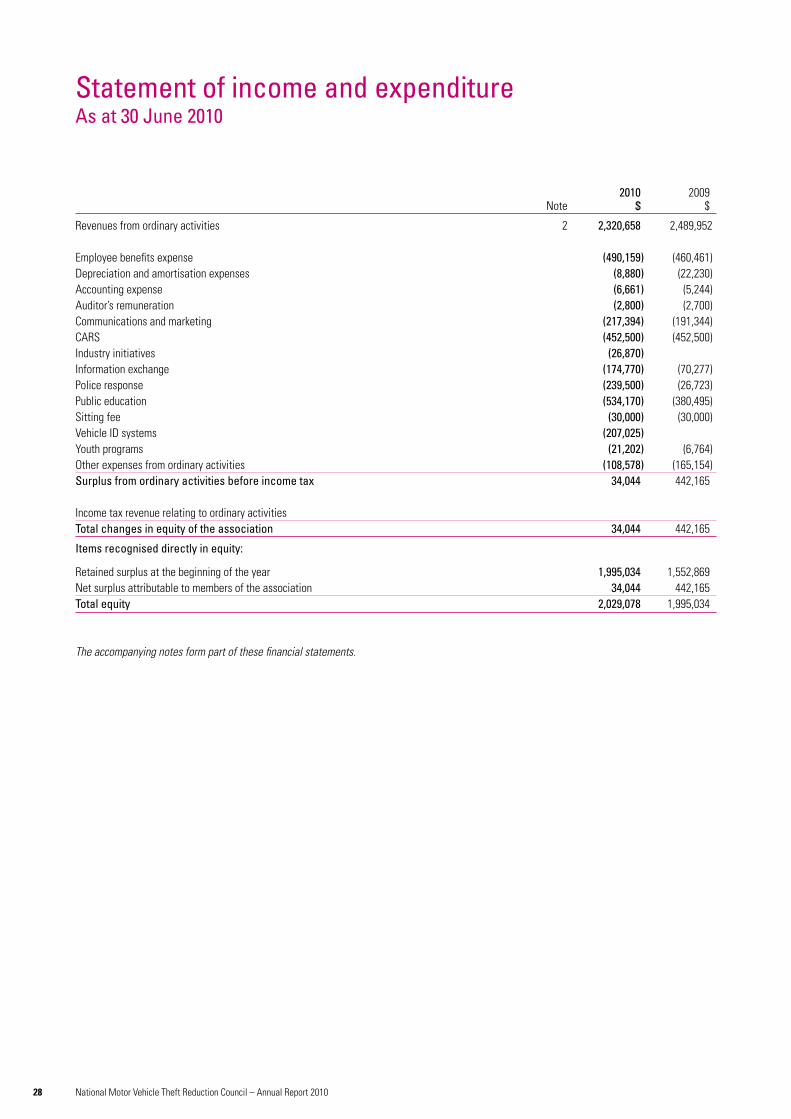
28 National Motor Vehicle Theft Reduction Council – Annual Report 2010
2010 2009 Note $ $
Revenues from ordinary activities 2 2,320,658 2,489,952
Employee benefits expense (490,159) (460,461)Depreciation and amortisation expenses (8,880) (22,230)Accounting expense (6,661) (5,244)Auditor’s remuneration (2,800) (2,700)Communications and marketing (217,394) (191,344)CARS (452,500) (452,500)Industry initiatives (26,870)Information exchange (174,770) (70,277)Police response (239,500) (26,723)Public education (534,170) (380,495)Sitting fee (30,000) (30,000)Vehicle ID systems (207,025)Youth programs (21,202) (6,764)Other expenses from ordinary activities (108,578) (165,154)Surplus from ordinary activities before income tax 34,044 442,165
Income tax revenue relating to ordinary activitiesTotal changes in equity of the association 34,044 442,165
Items recognised directly in equity:
Retained surplus at the beginning of the year 1,995,034 1,552,869Net surplus attributable to members of the association 34,044 442,165Total equity 2,029,078 1,995,034
The accompanying notes form part of these financial statements.
Statement of income and expenditureAs at 30 June 2010
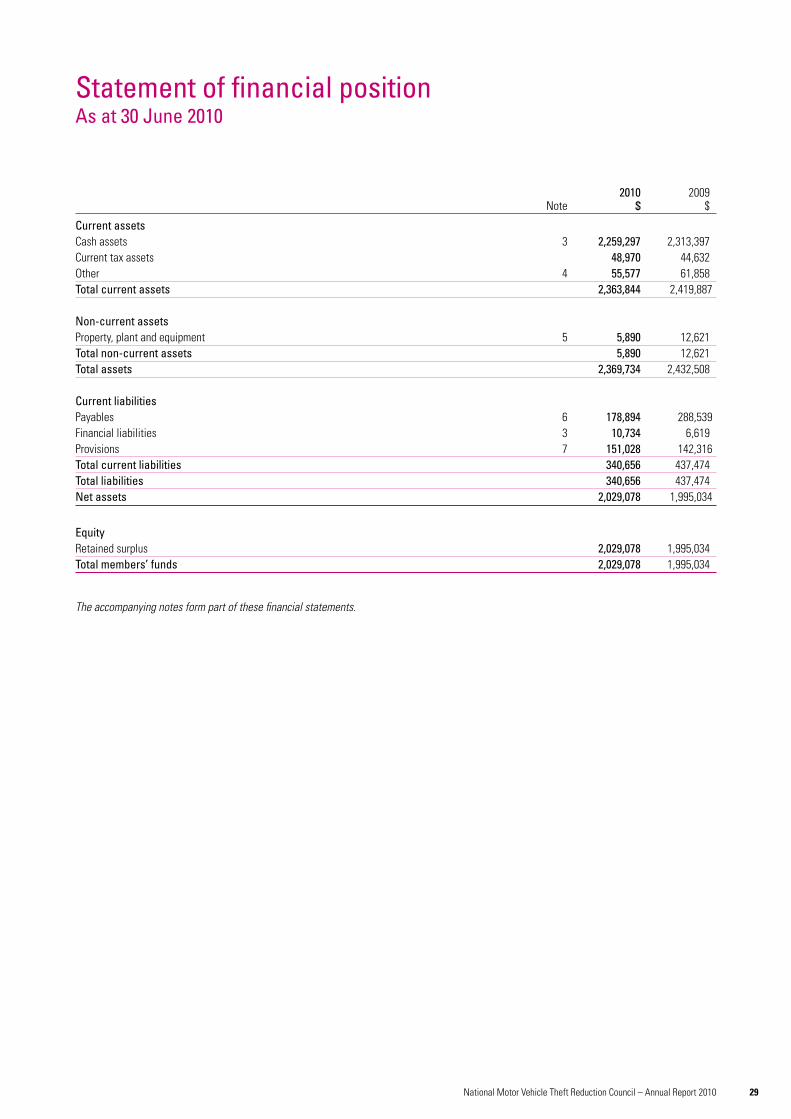
29National Motor Vehicle Theft Reduction Council – Annual Report 2010
2010 2009 Note $ $
Current assetsCash assets 3 2,259,297 2,313,397Current tax assets 48,970 44,632Other 4 55,577 61,858Total current assets 2,363,844 2,419,887
Non-current assetsProperty, plant and equipment 5 5,890 12,621Total non-current assets 5,890 12,621Total assets 2,369,734 2,432,508
Current liabilitiesPayables 6 178,894 288,539Financial liabilities 3 10,734 6,619Provisions 7 151,028 142,316Total current liabilities 340,656 437,474Total liabilities 340,656 437,474Net assets 2,029,078 1,995,034
EquityRetained surplus 2,029,078 1,995,034Total members’ funds 2,029,078 1,995,034
The accompanying notes form part of these financial statements.
Statement of financial positionAs at 30 June 2010
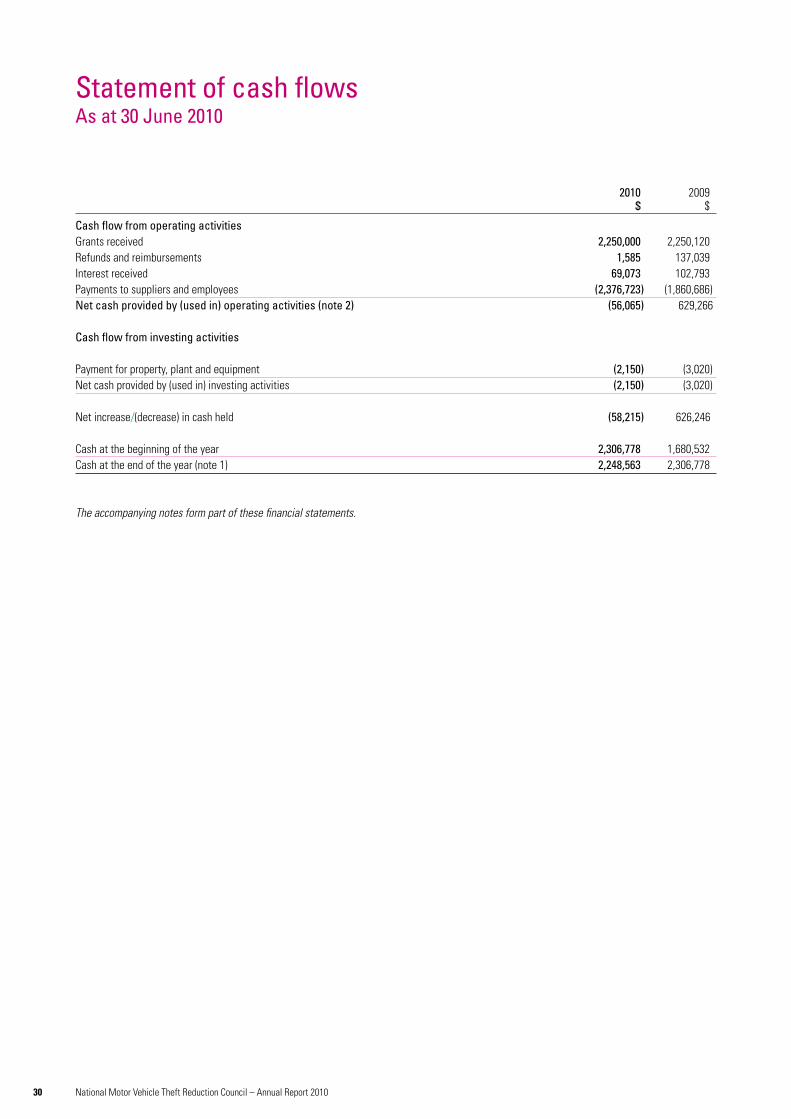
30 National Motor Vehicle Theft Reduction Council – Annual Report 2010
2010 2009 $ $
Cash flow from operating activitiesGrants received 2,250,000 2,250,120Refunds and reimbursements 1,585 137,039 Interest received 69,073 102,793Payments to suppliers and employees (2,376,723) (1,860,686)Net cash provided by (used in) operating activities (note 2) (56,065) 629,266
Cash flow from investing activities
Payment for property, plant and equipment (2,150) (3,020)Net cash provided by (used in) investing activities (2,150) (3,020)
Net increase/(decrease) in cash held (58,215) 626,246
Cash at the beginning of the year 2,306,778 1,680,532Cash at the end of the year (note 1) 2,248,563 2,306,778
The accompanying notes form part of these financial statements.
Statement of cash flows As at 30 June 2010
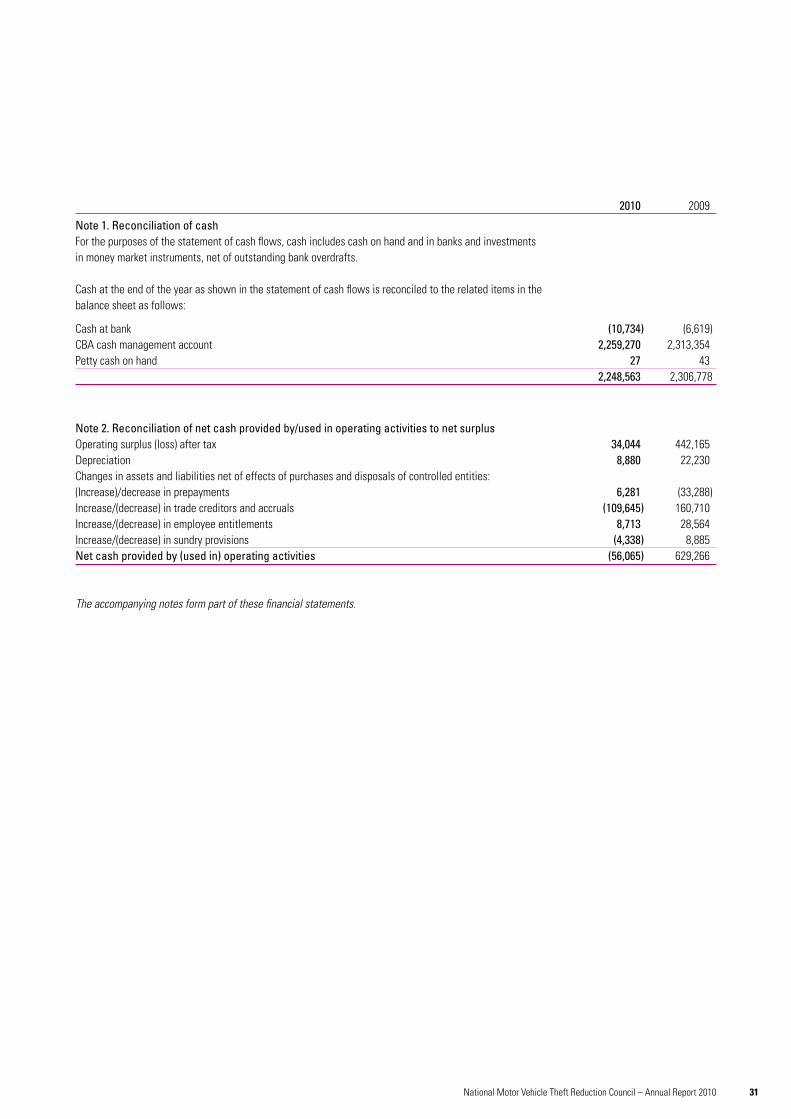
31National Motor Vehicle Theft Reduction Council – Annual Report 2010
2010 2009
Note 1. Reconciliation of cashFor the purposes of the statement of cash flows, cash includes cash on hand and in banks and investments in money market instruments, net of outstanding bank overdrafts.
Cash at the end of the year as shown in the statement of cash flows is reconciled to the related items in the balance sheet as follows:
Cash at bank (10,734) (6,619)CBA cash management account 2,259,270 2,313,354Petty cash on hand 27 43 2,248,563 2,306,778
Note 2. Reconciliation of net cash provided by/used in operating activities to net surplusOperating surplus (loss) after tax 34,044 442,165Depreciation 8,880 22,230Changes in assets and liabilities net of effects of purchases and disposals of controlled entities:(Increase)/decrease in prepayments 6,281 (33,288)Increase/(decrease) in trade creditors and accruals (109,645) 160,710Increase/(decrease) in employee entitlements 8,713 28,564Increase/(decrease) in sundry provisions (4,338) 8,885Net cash provided by (used in) operating activities (56,065) 629,266
The accompanying notes form part of these financial statements.
32 National Motor Vehicle Theft Reduction Council – Annual Report 2010
Notes to the financial statements As at 30 June 2010
Note 1: Statement of significant accounting policiesThe financial report is a general purpose financial report that has been prepared in accordance with Accounting Standards and other authoritative pronouncements of the Australian Accounting Standards Board and the requirements of the Associations Incorporations Act of Victoria.
The financial report covers National Motor Vehicle Theft Reduction Council Inc as an individual entity. National Motor Vehicle Theft Reduction Council Inc is an association incorporated in Victoria under the Association Incorporations Act 1984 and domiciled in Australia.
The financial report has been prepared on an accruals basis and is based on historical costs and does not take into account changing money values or, except where stated, current valuations of non-current assets. Cost is based on the fair values of the consideration given in exchange for assets.
The following is a summary of the material accounting policies adopted by the economic entity in the preparation of the financial report. The accounting policies have been consistently applied, unless otherwise stated.
Income tax
The association is exempt from income tax under Division 50 of the Income Tax Assessment Act 1997. Therefore, no provision for income tax has been raised.
Property, plant and equipment
Each class of property, plant and equipment is carried at cost or fair value less, where applicable, any accumulated depreciation.
(a) Plant and equipment The carrying amount of plant and equipment is reviewed annually to ensure it is not in excess of the recoverable amount from those assets. The recoverable amount is assessed on the basis of the expected net cash flows that will be received from the assets employment and subsequentdisposal. The expected net cash flows have not been discounted to present values in determining the recoverable amounts.
(b) DepreciationThe depreciable amount of all fixed assets greater than $1,000 are depreciated on a straight line basis over their useful lives to National Motor Vehicle Theft Reduction Council Inc commencing from the time the asset is held ready for use. Leasehold improvements are depreciated over the shorter of either the unexpired period of the lease or the estimated useful lives of the improvements. Assets costing less than $1,000 are depreciated over 12 months, commencing from the time the asset was held ready for use.
The depreciation rates used for each class of depreciable asset are:
Class of asset Depreciation
Leasehold improvements Period of leaseOffice equipment 3 years straight lineComputer equipment 3 years straight lineFurniture and fittings 3 years straight line
Employee entitlements
Provision is made for the liability for employee entitlements arising from services rendered by employees to balance date. Employee entitlements expected to be settled within one year, together with entitlements arising from wages and salaries, annual leave and sick leave which will be settled after one year, have been measured at the amounts expected to be paid when the liability is settled plus related on-costs. Other employee entitlements payable later than one year have been measured at the present value of the estimated future cash out flows to be made for those entitlements.
Contributions are made by National Motor Vehicle Theft Reduction Council Inc to an employee superannuation fund and are charged as expenses when incurred.
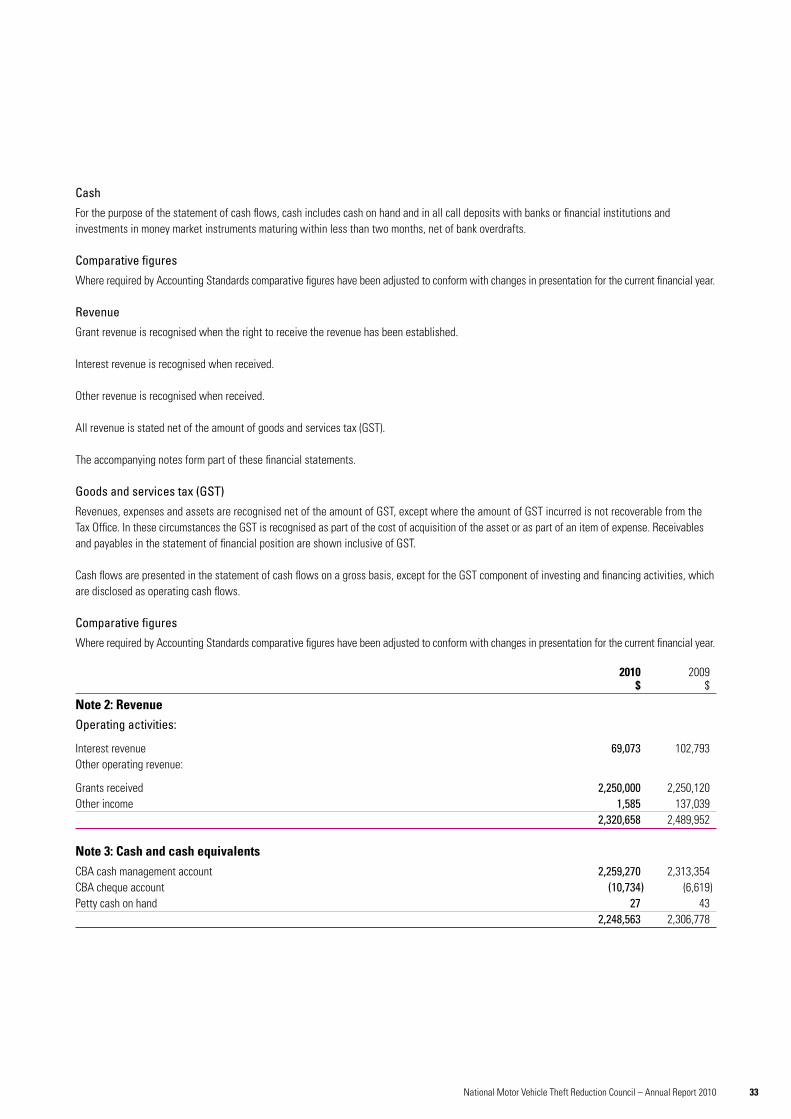
33National Motor Vehicle Theft Reduction Council – Annual Report 2010
Cash
For the purpose of the statement of cash flows, cash includes cash on hand and in all call deposits with banks or financial institutions and investments in money market instruments maturing within less than two months, net of bank overdrafts.
Comparative figures
Where required by Accounting Standards comparative figures have been adjusted to conform with changes in presentation for the current financial year.
Revenue
Grant revenue is recognised when the right to receive the revenue has been established.
Interest revenue is recognised when received.
Other revenue is recognised when received.
All revenue is stated net of the amount of goods and services tax (GST).
The accompanying notes form part of these financial statements.
Goods and services tax (GST)
Revenues, expenses and assets are recognised net of the amount of GST, except where the amount of GST incurred is not recoverable from the Tax Office. In these circumstances the GST is recognised as part of the cost of acquisition of the asset or as part of an item of expense. Receivables and payables in the statement of financial position are shown inclusive of GST.
Cash flows are presented in the statement of cash flows on a gross basis, except for the GST component of investing and financing activities, which are disclosed as operating cash flows.
Comparative figures
Where required by Accounting Standards comparative figures have been adjusted to conform with changes in presentation for the current financial year.
2010 2009 $ $
Note 2: RevenueOperating activities:
Interest revenue 69,073 102,793Other operating revenue:
Grants received 2,250,000 2,250,120Other income 1,585 137,039 2,320,658 2,489,952
Note 3: Cash and cash equivalentsCBA cash management account 2,259,270 2,313,354CBA cheque account (10,734) (6,619)Petty cash on hand 27 43 2,248,563 2,306,778
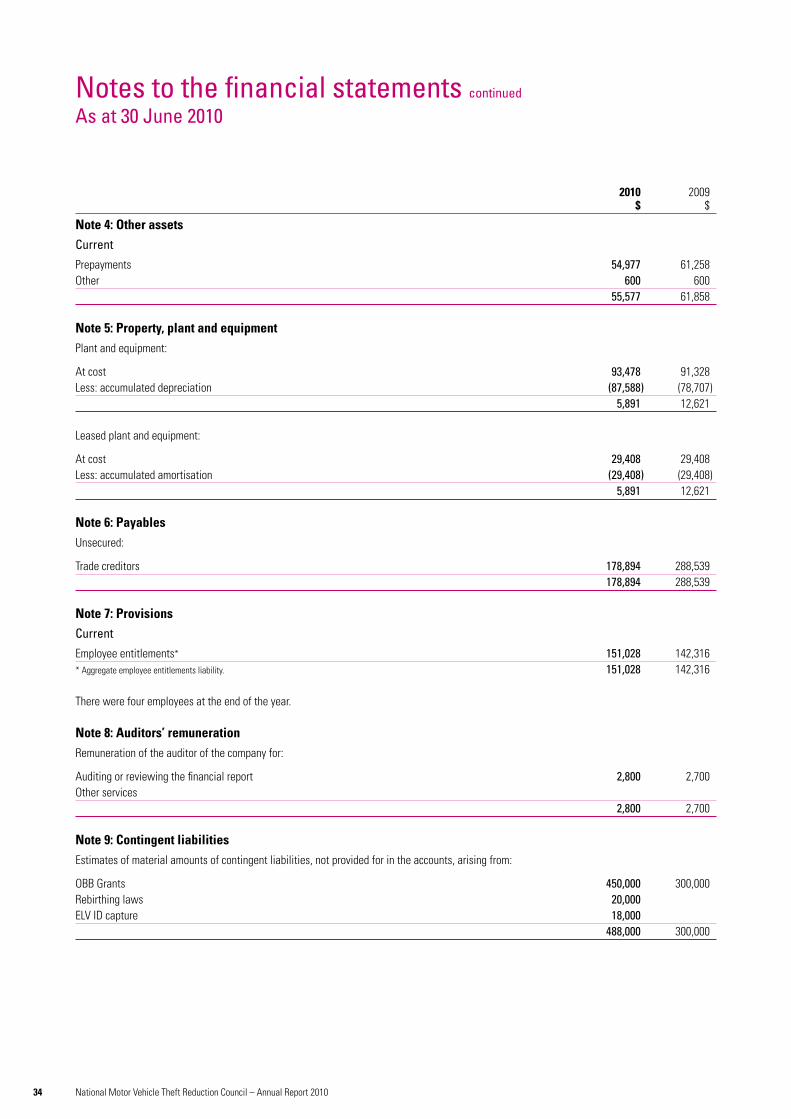
34 National Motor Vehicle Theft Reduction Council – Annual Report 2010
Notes to the financial statements continued As at 30 June 2010
2010 2009 $ $
Note 4: Other assetsCurrent
Prepayments 54,977 61,258Other 600 600 55,577 61,858
Note 5: Property, plant and equipmentPlant and equipment:
At cost 93,478 91,328Less: accumulated depreciation (87,588) (78,707) 5,891 12,621
Leased plant and equipment:
At cost 29,408 29,408Less: accumulated amortisation (29,408) (29,408) 5,891 12,621
Note 6: PayablesUnsecured:
Trade creditors 178,894 288,539 178,894 288,539
Note 7: ProvisionsCurrent
Employee entitlements* 151,028 142,316* Aggregate employee entitlements liability. 151,028 142,316
There were four employees at the end of the year.
Note 8: Auditors’ remunerationRemuneration of the auditor of the company for:
Auditing or reviewing the financial report 2,800 2,700Other services 2,800 2,700
Note 9: Contingent liabilitiesEstimates of material amounts of contingent liabilities, not provided for in the accounts, arising from:
OBB Grants 450,000 300,000Rebirthing laws 20,000 ELV ID capture 18,000 488,000 300,000

35National Motor Vehicle Theft Reduction Council – Annual Report 2010
Note 10: Entity detailsThe registered office of the association is:
National Motor Vehicle Theft Reduction Council IncSuite 1, 50-51 Howard StreetNorth Melbourne Victoria 3051
The principal place of business is the same address.
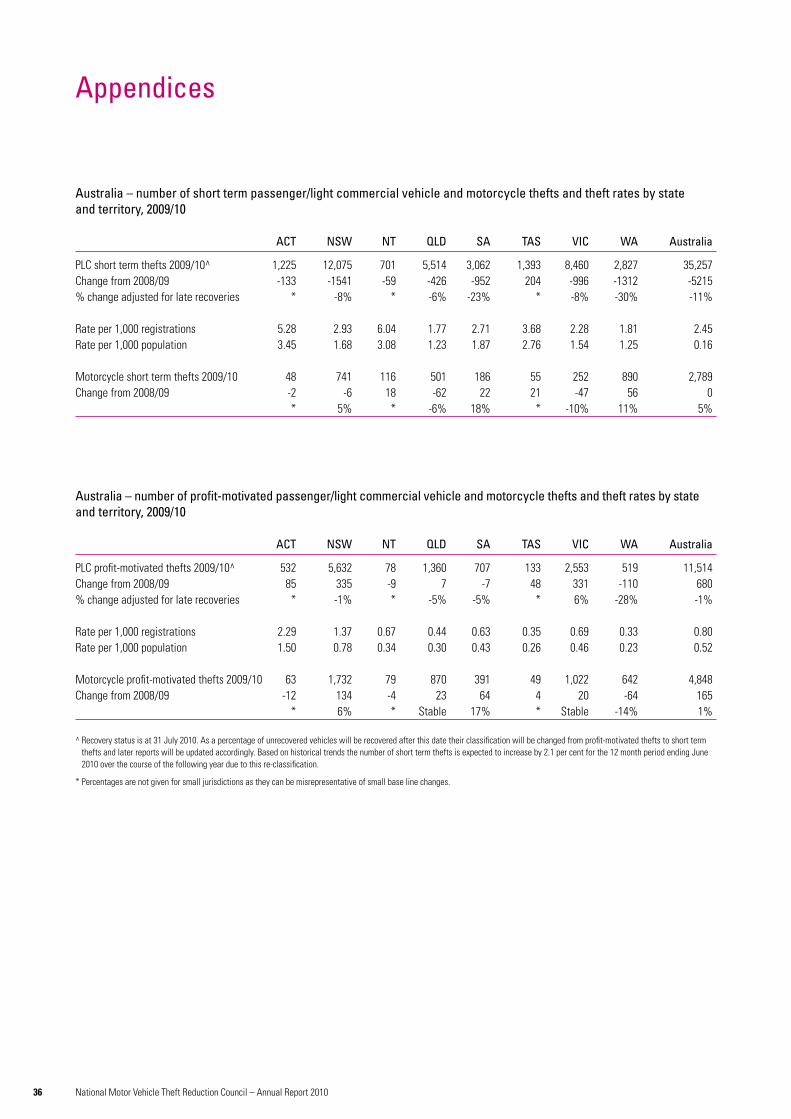
36 National Motor Vehicle Theft Reduction Council – Annual Report 2010
Australia – number of short term passenger/light commercial vehicle and motorcycle thefts and theft rates by state and territory, 2009/10 ACT NSW NT QLD SA TAS VIC WA Australia
PLC short term thefts 2009/10^ 1,225 12,075 701 5,514 3,062 1,393 8,460 2,827 35,257Change from 2008/09 -133 -1541 -59 -426 -952 204 -996 -1312 -5215% change adjusted for late recoveries * -8% * -6% -23% * -8% -30% -11% Rate per 1,000 registrations 5.28 2.93 6.04 1.77 2.71 3.68 2.28 1.81 2.45Rate per 1,000 population 3.45 1.68 3.08 1.23 1.87 2.76 1.54 1.25 0.16 Motorcycle short term thefts 2009/10 48 741 116 501 186 55 252 890 2,789Change from 2008/09 -2 -6 18 -62 22 21 -47 56 0 * 5% * -6% 18% * -10% 11% 5% Australia – number of profit-motivated passenger/light commercial vehicle and motorcycle thefts and theft rates by stateand territory, 2009/10 ACT NSW NT QLD SA TAS VIC WA Australia
PLC profit-motivated thefts 2009/10^ 532 5,632 78 1,360 707 133 2,553 519 11,514Change from 2008/09 85 335 -9 7 -7 48 331 -110 680% change adjusted for late recoveries * -1% * -5% -5% * 6% -28% -1% Rate per 1,000 registrations 2.29 1.37 0.67 0.44 0.63 0.35 0.69 0.33 0.80Rate per 1,000 population 1.50 0.78 0.34 0.30 0.43 0.26 0.46 0.23 0.52 Motorcycle profit-motivated thefts 2009/10 63 1,732 79 870 391 49 1,022 642 4,848Change from 2008/09 -12 134 -4 23 64 4 20 -64 165 * 6% * Stable 17% * Stable -14% 1% ^ Recovery status is at 31 July 2010. As a percentage of unrecovered vehicles will be recovered after this date their classification will be changed from profit-motivated thefts to short term
thefts and later reports will be updated accordingly. Based on historical trends the number of short term thefts is expected to increase by 2.1 per cent for the 12 month period ending June 2010 over the course of the following year due to this re-classification.
* Percentages are not given for small jurisdictions as they can be misrepresentative of small base line changes.
Appendices

Designed and produced by MDM Design
National Motor Vehicle Theft Reduction Council Inc
50-52 Howard Street, North Melbourne Victoria 3051 Australia
Tel (03) 9348 9600 Fax (03) 9348 9988 [email protected]
www.carsafe.com.au
ISBN 978 1 876704 86 5