Embed Size (px)
Citation preview
DRIVER DISTRACTION: A REVIEW OF THE LITERATURE
Kristie Young Michael Regan
Mike Hammer
November 2003
Report No. 206

i DRIVER DISTRACTION: A REVIEW OF THE LITERATURE
MONASH UNIVERSITY ACCIDENT RESEARCH CENTRE REPORT DOCUMENTATION PAGE
Report No. Date ISBN Pages
206 November 2003 0 7326 1715 4 66 Title and sub-title: Driver Distraction: A Review of the Literature
Authors: Kristie L. Young Michael A. Regan Mike Hammer*
Sponsoring Organisation: Holden Ltd
Abstract: This report provides a comprehensive review of the current research on driver distractions deriving from within the vehicle. The impact of technology (e.g., mobile phones and route guidance systems) and non technology-based distractions (e.g., eating, smoking and conversing with passengers) on driving performance is examined and the relative influence of these distractions on driving is discussed. Approximately one quarter of vehicle crashes in the United States are estimated to result from the driver being inattentive or distracted. Whilst the full extent to which distraction is a causal factor in vehicle crashes in Australia is not yet known, there is converging evidence that it likely to be a significant problem here. As more wireless communication, entertainment and driver assistance systems proliferate the vehic le market, the prevalence of distraction-related crashes here and overseas is expected to escalate. The various methods that have been employed to measure driver distraction are examined and those measurement techniques that appear most promising in being able to accurately measure in-vehicle distraction are identified. In the final section of the report, recommendations for research and for the management of driver distraction are provided as a first step in stimulating development of a national agenda for dealing with this issue.
Key Words: Disclaimer Driver Distraction, Road Safety, Mobile Phones.
This report is disseminated in the interest of information exchange. The views expressed here are those of the authors, and not necessarily those of Monash University
Reproduction of this page is authorised * Holden Ltd.
Monash University Accident Research Centre, Building 70, Clayton Campus, Victoria, 3800, Australia.
Telephone: +61 3 9905 4371, Fax: +61 3 9905 4363

MONASH UNIVERSITY ACCIDENT RESEARCH CENTRE ii
iii DRIVER DISTRACTION: A REVIEW OF THE LITERATURE
Table Of Contents EXECUTIVE SUMMARY................................................................................................V
ACKNOWLEDGMENTS................................................................................................ XI
1. INTRODUCTION ..................................................................................................... 1
2. WHAT IS DRIVER DISTRACTION?....................................................................... 2
3. TECHNOLOGY-BASED DISTRACTION................................................................ 3 3.1 MOBILE PHONES.................................................................................................. 3 3.2 IN-VEHICLE ROUTE GUIDANCE SYSTEMS .............................................................10 3.3 IN-VEHICLE INTERNET AND E-MAIL FACILITIES ....................................................13 3.4 ENTERTAINMENT SYSTEMS.................................................................................14
4. NON TECHNOLOGY-BASED DISTRACTION..................................................... 17 4.1 EATING AND DRINKING.......................................................................................17 4.2 SMOKING ...........................................................................................................18 4.3 PASSENGERS ......................................................................................................18
5. THE ROLE OF DRIVER DISTRACTION IN CRASHES: SOURCES OF DISTRACTION AND THEIR RELATIVE DANGERS.................................................. 19
5.1 THE ROLE OF DRIVER DISTRACTION IN CRASHES OVERSEAS.................................20 5.2 THE ROLE OF DRIVER DISTRACTION IN CRASHES IN AUSTRALIA ...........................24 5.3 CURRENT POLICES AND PRACTICES FOR MANAGING DRIVER DISTRACTION IN AUSTRALIA....................................................................................................................25
6. DRIVING PERFORMANCE VARIABLES AND THEIR SENSITIVITY TO DISTRACTION............................................................................................................... 26
6.1 LATERAL POSITION.............................................................................................26 6.2 SPEED MAINTENANCE AND CONTROL..................................................................26 6.3 REACTION TIMES................................................................................................27 6.4 GAP ACCEPTANCE ..............................................................................................27 6.5 WORKLOAD .......................................................................................................27 6.6 ATTENTION TO SAFE DRIVING PRACTICES............................................................28
7. METHODS FOR MEASURING DISTRACTION................................................... 28 7.1 ON-ROAD AND TEST TRACK STUDIES...................................................................28 7.2 DRIVING SIMULATORS........................................................................................29 7.3 DUAL-TASK STUDIES ..........................................................................................31 7.4 EYE GLANCE STUDIES.........................................................................................34 7.5 THE VISUAL OCCLUSION TECHNIQUE ..................................................................34 7.6 THE 15-SECOND RULE.........................................................................................37 7.7 WHAT IS THE MOST PROMISING MEASURE OF DRIVER DISTRACTION?...................37
8. CONCLUSION........................................................................................................ 39 8.1 SUMMARY OF KEY FINDINGS...............................................................................40 8.2 RECOMMENDED DISTRACTION MEASUREMENT TECHNIQUES ................................41 8.3 COUNTERMEASURES FOR MINIMISING DISTRACTION ............................................42

MONASH UNIVERSITY ACCIDENT RESEARCH CENTRE iv
v DRIVER DISTRACTION: A REVIEW OF THE LITERATURE
EXECUTIVE SUMMARY
PURPOSE OF THIS REPORT The purpose of this review, which was commissioned by Holden, is to examine the current literature on driver distraction, focussing specifically on in-vehicle distraction; that is, distraction caused by activities or objects inside the vehicle rather than those outside the vehicle.
The first section of the report discusses the impact of technology-based distractions (e.g., mobile phones, route navigation and email/internet) and non-technology-based distractions (e.g., conversing with passengers, eating/drinking and smoking) on driving performance. In the second half of the report, the various methods that have been used to measure distraction are described and the measurement techniques that appear most promising in being able to accurately measure in-vehicle distraction are identified. Future research needs and recommendations for minimising driver distraction are made in the final section of the report. INTRODUCTION Despite the complexities of the driving task, it is not unusual to see drivers engaged in various other activities while driving, including talking to passengers and listening to the radio and even reading. Preoccupation with electronic devices while driving is also becoming increasingly common. Any activity that distracts the driver or competes for their attention while driving has the potential to degrade driving performance and have serious consequences for road safety. Research by the National Highway Traffic Safety Administration (NHTSA) estimates that driver inattention in its various forms contributes to approximately 25 percent of police-reported crashes. Driver distraction is one form of driver inattention and is claimed to be a contributing factor in over half of inattention crashes (Stutts, Reinfurt, Staplin & Rodgman, 2001; Wang, Knipling & Goodman, 1996). However, as more wireless communication, entertainment and driver assistance systems proliferate the vehicle market, it is probable that the rate of distraction-related crashes will escalate (Stutts et al., 2001). TECHNOLOGY AND NON TECHNOLOGY BASED DISTRACTION Several in-vehicle devices and activities reviewed in this report appear to have the potential to distract the driver and significantly impair their driving performance and safety. The major findings to emerge from the reviewed literature are summarised below.
Mobile Phones
• Many studies have found that using a hands-free phone while driving is no safer than using a hand-held phone. Using a mobile phone while driving can increase the risk of being involved in a collision by up to four times.
MONASH UNIVERSITY ACCIDENT RESEARCH CENTRE vi
• Research suggests that both the physical and cognitive distraction caused by using mobile phones while driving can significantly impair a driver’s visual search patterns, reaction times, decision-making processes and their ability to maintain speed, throttle control and lateral position on the road.
• Mobile phone use also often involves associated tasks that may further distract the driver. These activities can include writing down phone numbers on a piece of paper whilst driving or writing down dates or notes in diaries.
• Sending a text message is more distracting than simply talking on a mobile phone.
• Research has found that talking on a mobile phone is more distracting than holding an intelligent conversation with a passenger, but no more distracting than eating a cheeseburger.
Route Guidance Systems
• Entering destination information is believed to be the most distracting task associated with the use of a route guidance system, however use of voice input technology can reduce the distraction associated with this task.
• Route guidance systems that present navigation instructions using voice output are less distracting and more usable than those systems that present the information on a visual display.
• Route guidance systems with voice recognition technology are a more ergonomic and safer option than systems that require visual-manual entry.
• Route guidance systems that provide turn-by turn instructions, rather than presenting complex holistic route information, are less distracting to the driver and present the most useable means of navigation.
Email and Internet Facilities
• Some researchers believe that speech-based email systems have the potential to distract drivers and undermine road safety. As a result, a growing number of system designers are recognising that speech-based systems are not a panacea for driver distraction and are focusing on developing alternative interfaces such as those that rely on tactile feedback.
Entertainment Systems
• Tuning a radio while driving appears to have a detrimental effect on driving performance, particularly for inexperienced drivers.
• Research suggests that simply listening to radio broadcasts while driving can impair driving performance.
• Research suggests that operating a CD player while driving is more distracting
than dialling a mobile phone and eating, however the use of voice-activation may minimise this distraction.
vii DRIVER DISTRACTION: A REVIEW OF THE LITERATURE
Non-Technology Distraction
• A recent study revealed that a greater proportion of drivers involved in traffic accidents are distracted by eating or drinking (1.7%) than by talking on a mobile phone (1.5%). Another study corroborated this finding and found that eating a cheeseburger was as distracting as using a voice-activated dialling system, but less distracting than continuously operating a CD player.
• Several studies have found that smoking while driving increases the risk of being involved in a crash.
• A summary of current research on teenage passengers revealed that the presence of passengers increases crash risk, particularly for younger drivers, and this is believed to result largely from distraction and peer-pressure.
In summary, there is converging evidence that both technology-based and non-technology-based distractions can have a detrimental effect on human driving performance. The extent, however, to which distraction compromises safety is dependent on the frequency with which the driver is exposed to the source of distraction in question. Very little, if anything, is currently known in Australia (and indeed in most other countries) about the relative frequency with which technology and non-technology-based tasks are performed. The findings reported here do, nevertheless, provide important information that can be used to optimise the ergonomic design of the Human Machine Interface (HMI) in vehicle cockpits and inform the development of other countermeasures for minimising driver distraction.
RECOMMENDED DISTRACTION MEASUREMENT TECHNIQUES AND MEASURES In addition to reviewing what is known about both technology and non-technology-based distractions deriving from within the vehicle, the authors reviewed the various scientific techniques which have been used to measure driver distraction and the measures of driving performance (e.g., lane keeping) which appear to be vulnerable to the different types of distraction. While this material was reviewed primarily to assist Holden, it is reported here to assist others undertaking distraction-related research. The following scientific techniques for measuring distraction were identified:
• on-road and test track studies; • driving simulator studies; • dual-task studies; • eye glance monitoring studies; • the visual occlusion method; • the peripheral detection task; and • the 15 Second Rule.
The findings of this review suggest that using a range of distraction measurement techniques, rather than a single technique, would be appropriate in evaluating HMI design concepts and prototypes in vehicles. The particular technique, or sub-set of
MONASH UNIVERSITY ACCIDENT RESEARCH CENTRE viii
techniques, employed, however, will depend on the particular aspect of the HMI to be assessed, and in particular on the form of distraction (e.g., visual, physical etc) that is imposed on the driver by that aspect of the interface. With the possible exception of on-road and test track studies, and the 15-second rule, all of the above methods are considered suitable for use in HMI evaluation studies. On-road studies are more dangerous to conduct and are less experimentally controlled than simulator studies, and there is some doubt in the literature about the validity of the 15-second rule.
COUNTERMEASURES FOR MINIMISING DISTRACTION Whilst the magnitude of distraction as a road safety problem in Australia is not yet fully known, there is converging evidence from studies overseas that it is likely to be a significant issue here and that it is likely to become a greater contributor to road trauma as the number of technology-based sources of distraction in vehicles increases. On the basis of the literature reviewed, the following recommendations are made for minimising the effects of driver distraction. Research
• A carefully designed study of the prevalence of driver involvement in distracting activities within the vehicle should be undertaken. This information, combined with the epidemiological data from the previously mentioned study being conducted by the University of Western Australia Department of Public health Injury Research Centre, will enable an initial assessment of the magnitude of the problem in Australia to be made. If driver distraction is shown to be a significant problem, then better recording by Police of the role of distraction in crashes will be needed.
• An inventory of existing and emerging technologies and services which can be accessed on-board the vehicle or through portable devices carried into the vehicle should be compiled. From this, research is needed to develop a taxonomy of driver distractions that defines the different sources of distraction deriving from within the vehicle and categorises them according to how distracting they are in absolute and relative terms.
• Research is required to better understand drivers’ willingness to engage in potentially distracting tasks while driving, the factors that influence this willingness and under what conditions drivers engage in distracting tasks.
• There is currently little knowledge regarding how drivers use in-vehicle technologies: whether they use them in the manner intended by the designer; and at what point (or threshold) and under what conditions they become a distraction.
• Research needs to be conducted into whether and how individual difference factors such as age, gender, driving skill and experience influences the ease with which drivers are distracted.
• To complement the above activities, research is needed to develop a taxonomy of distracting events and objects occurring outside the vehicle. As for sources of distraction deriving from within the vehicle, research is needed to quantify how distracting they are in absolute and relative terms, alone and in combination with
ix DRIVER DISTRACTION: A REVIEW OF THE LITERATURE
internal distracters. Some research on this issue is being undertaken by the Monash University Accident Research Centre and this should be closely monitored.
• There is a need to develop objective, standardised, measures of distraction in order to enable more accurate comparisons of results across studies (NHTSA, 2002a).
• Further research is needed on alternative modes of input and output, such as tactile feedback and voice activation, to determine whether these interaction methods are a safe and viable alternative to manual entry systems.
• The operation of certain on-board and portable technologies, such as mobile phones, often involves associated tasks such as writing down phone numbers and address details on pieces of paper. There is a need for research to design the HMI so that it eliminates as far as possible the need for these secondary tasks.
• No research, to the knowledge of the authors, has examined the potentially distracting effects of portable devices used by pedestrians and other road users (e.g., mobile telephones, pedestrian navigators) to access information and services when negotiating their way by means other than driving through the road system.
• The overall costs and benefits afforded by various technologies must be assessed before restricting or prohibiting drivers from engaging in distracting tasks while driving. Listening to a radio broadcast, for example, might be distracting: yet, for a truck driver, this activity might be beneficial in maintaining vigilance in a low workload driving environment.
Education and Training
• A good deal is already known about the risks associated with engaging whilst driving in various distracting activities. It is important that these are brought to the attention of drivers and passengers. As a matter of priority, it is important to make the motoring public aware that hands-free mobile phones can be just as distracting as hand-held phones.
• As with the use of mobile phones, drivers must be educated and trained in the optimal manner in which to interact with existing and emerging on-board technologies and services accessed through portable devices in order to minimise distraction.
• Where flexibility exists in the manner in which these devices can be operated (there are, for example, many ways to tune and select a radio station), user manuals and tutorials provided by vehicle manufacturers and service providers should highlight the most ergonomic and least distracting methods for doing so.
Legislation and Enforcement • Existing legislation should be reviewed and, where necessary, new legislation
created to limit driver exposure to, and deter drivers from engaging in, activities which have the potential to distract them. There is sufficient evidence, for example, to justify a ban on the use of hands-free phones whilst driving if this can be practically enforced by the Police.
MONASH UNIVERSITY ACCIDENT RESEARCH CENTRE x
Vehicle Design • The most effective way to minimise technology-based distraction is to design
the Human Machine Interface (HMI) ergonomically. In Europe, North America and Japan, draft standards have already been developed which contain performance based goals which must be reached by the HMI so that the in-car technologies do not distract or visually entertain the driver while driving (e.g., the European Statement of Principles for Driver Interactions with Advanced In-vehicle Information and Communication systems). It is important that the development of these standards be closely monitored by relevant authorities in Australia and that local vehicle manufacturers and system developers are encouraged to refer to these standards in designing their systems.
• The operation of certain devices including mobile phones and route guidance systems often involves associated tasks such as accessing written information, which can further distract the driver. There is a need for research to develop the HMI so that it eliminates the need for these associated tasks.
Licensing
• Handbooks for learner and probationary drivers should draw attention to the potential risks associated with engaging in distracting activities within the vehicle.
• Knowledge tests should include items pertaining to the relative risks associated with engaging in these activities.
• Where appropriate, the graduated licensing system should be used to restrict driver exposure to distracting activities that are known to compromise safety. The findings presented here, for example, suggest that there is a case for restricting Probationary drivers from using (but not carrying) mobile phones while driving during some or all of the P-period.
Fortunately, we are at an early enough stage in the evolution of the vehicle cockpit to prevent distraction from escalating into a major road safety problem.
xi DRIVER DISTRACTION: A REVIEW OF THE LITERATURE
ACKNOWLEDGMENTS
The authors would like to thank Holden for sponsoring the research from which this report derives. Thanks also to Dr Jim Foley, from International Organisation for Standardization (ISO) Technical Committee 22, Sub-Committee SC13, for providing several documents used in the review.

MONASH UNIVERSITY ACCIDENT RESEARCH CENTRE xii
1DRIVER DISTRACTION: A REVIEW OF THE LITERATURE
1. Introduction
The driving task is a complex one, requiring the interaction and coordination of various cognitive, physical, sensory and psychomotor skills. It also requires a substantial degree of attention and concentration on the part of the driver (Beirness, Simpson & Pak, 2002; Peters & Peters, 2001). Despite these complexities, it is not unusual to see drivers engaged in various other activities while driving. These activities range from talking to passengers and listening to the radio, to applying make-up, shaving and even reading. With the advent of wireless communication (e.g., mobile phones), more sophisticated entertainment systems and the introduction of technologies such as route navigation and the internet into vehicles, preoccupation with electronic devices while driving is also becoming increasingly common. Any activity that distracts the driver or competes for their attention while driving has the potential to degrade driving performance and have serious consequences for road safety. Research by the National Highway Traffic Safety Administration (NHTSA) estimates that driver inattention in its various forms contributes to approximately 25 percent of police-reported crashes. Driver distraction is one form of driver inattention and is claimed to be a contributing factor in over half of inattention crashes (Stutts, Reinfurt, Staplin & Rodgman, 2001; Wang, Knipling & Goodman, 1996). However, as more wireless communication, entertainment and driver assistance systems proliferate the vehicle market, it is probable that the rate of distraction-related crashes will escalate (Stutts et al., 2001). This report provides a comprehensive review of the current literature on driver distraction, focussing specifically on in-vehicle distraction; that is, distraction caused by activities or objects inside the vehicle rather than those outside the vehicle. The overall aim of the report is to review what is known about the effects of in-vehicle distraction on driver performance and safety; review the range of techniques that have been used to measure and quantify the effects of distraction on driver performance; identify future research needs in the area; and recommend countermeasures for minimising driver distraction. To the knowledge of the authors, the report provides the most comprehensive summary of accumulated literature currently in existence. The first section of the report discusses the impact of technology-based distractions (e.g., mobile phones, route navigation and email/internet) and non-technology-based distractions (e.g., conversing with passengers, eating/drinking and smoking) on driving performance. The relative influence of the various technology and non-technology based distractions on driving performance is also examined and the driving performance variables (e.g., speed maintenance and reaction time) that seem to be most sensitive to specific distracters are identified. In the second half of the report, the various methods that have been used to measure distraction are described and the measurement techniques that appear most promising in being able to accurately measure in-vehicle distraction are identified. The concluding section of the report contains a brief summary of the key findings emerging from the literature review, recommendations for the selection of distraction measurement techniques suitable for use in assessing the Human Machine Interface (HMI) in vehicles, and some recommendations for future research and countermeasures
MONASH UNIVERSITY ACCIDENT RESEARCH CENTRE 2
to minimised driver distraction. We begin by defining and characterising the various forms of driver distraction. 2. What is Driver Distraction?
Driver distraction forms part of the broader category of driver inattention. The American Automobile Association Foundation for Traffic Safety defines driver distraction as occurring “when a driver is delayed in the recognition of information needed to safely accomplish the driving task because some event, activity, object or person within or outside the vehicle compelled or tended to induce the driver’s shifting attention away from the driving task.” (Treat, 1980, p. 21). The presence of a triggering event or activity distinguishes driver distraction from the broader category of driver inattention (Beirness et al., 2002). According to the NHTSA there are four distinct types of driver distraction: visual, auditory, biomechanical (physical) and cognitive distraction. Visual Distraction. There are three different types of visual distraction. The first form occurs when the driver’s visual field is blocked by objects, such as stickers on the car’s windscreen or windows or dark window tints, that prevent them from detecting or recognising objects or hazards in the road environment (Ito, Uno, Atsumi & Akamatsu, 2001). The second type of visual distraction occurs when the driver neglects to look at the road and instead focuses on another visual target, such as an in-car route navigation system or billboard, for an extended period of time. The third type involves a loss of visual “attentiveness”, often referred to as “looked, but did not see”, and interferes with the driver’s ability to recognise hazards in the road environment (Ito et al., 2001). The second type of visual distraction is of most interest in this review. Auditory Distraction. Auditory distraction occurs when the driver momentarily or continually focuses their attention on sounds or auditory signals rather than on the road environment. Auditory distraction can occur when listening to the radio or when holding a conversation with a passenger, but is most pronounced when using a mobile phone (Direct Line Motor Insurance, 2002). Biomechanical (Physical) Distraction. Biomechanical distraction occurs when drivers remove one or both hands from the steering wheel to physically manipulate an object instead of focusing on the physical tasks required to drive safely such as steering in the appropriate direction or changing gears (RoSPA, 1997). Cognitive Distraction. Cognitive distraction includes any thoughts that absorb the driver’s attention to the point where they are unable to navigate through the road network safely and their reaction time is reduced (Direct Line Motor Insurance, 2002). Talking on a mobile phone while driving is one of the most well documented forms of cognitive distraction, however it can also occur when trying to operate in-vehicle devices such as route navigation systems or talking to a passenger. It is important to note that these four forms of distraction, although classed separately, are not mutually exclusive. For example, operating a particular device, such as a mobile
3DRIVER DISTRACTION: A REVIEW OF THE LITERATURE
phone, may involve all four forms of distraction: physical distraction caused by dialling a phone number or pressing buttons to receive a call; visual distraction caused by looking at the phone to dial a number or receive a call; auditory distraction caused by holding a conversation with a person; and cognitive distraction caused by focusing on the topic of conversation rather than monitoring any hazards or changes in the road environment. In addition to the afore mentioned forms of distraction, the NHTSA recognises 13 sources of distraction (Stutts et al., 2001). These include:
1. eating or dinking; 2. outside person, object or event; 3. adjusting radio, cassette, or CD; 4. other occupants in vehicle; 5. moving object in vehicle; 6. smoking related; 7. talking or listening on mobile phone; 8. dialling mobile phone; 9. using device/object brought into vehicle; 10. using device/controls integral to vehicle; 11. adjusting climate controls; 12. other distraction; and 13. unknown distraction.
For the purpose of this report, sources of distraction will be further broken down into technology-based distracters (e.g., mobile phones, route navigation and CD players) and non-technology based distracters (e.g., talking to passengers, eating/drinking and smoking). 3. Technology-based Distraction
The following sections of the report examine the impact of technology-based and non-technology based distractions on driving performance and road safety. The focus is on distraction caused by activities or objects inside the vehicle, rather than outside the vehicle.
3.1 Mobile Phones There is a vast body of literature examining the impact of mobile phone usage on driving performance (Direct Line Motor Insurance, 2002; Goodman, Bents, Tijerina, Wierwille, Lerner & Benel, 1997). In general, this research indicates that there is a significant association between mobile phone use while driving and crash risk (Lam, 2002). However, given the wide range of methodologies used to measure the effects of mobile phone use on driving performance (e.g., epidemiological, on-road, closed-course, and simulator studies), the many variables involved in the vehicle-driver-road environment system, and the differing levels of complexity associated with mobile phone conversations, there has been little consensus in the literature regarding the
MONASH UNIVERSITY ACCIDENT RESEARCH CENTRE 4
precise impact of mobile phone use on specific aspects of driving performance (Nowakowski, Friedman & Green, 2001; STTG, 2002). Using a mobile phone while driving can distract drivers visually, physically, aurally, and/or cognitively. Physical and visual distraction is particularly pronounced when operating a hand-held phone, but can also occur when using a hands-free phone. Regardless of whether the phone is hands-free or hand-held, drivers are forced to remove their eyes from the road and their hands off the wheel to reach for the phone and initiate a connection by either dialling a number or answering an incoming call. Hand-held phones have the additional physical distraction of requiring the driver to drive one handed while holding the phone to their ear during a conversation (Goodman et al., 1997; RoSPA, 1997). Auditory distraction can result from the driver being startled by the initial ringing of the phone or from the conversation itself. While auditory distraction occurs during any conversation, it is particularly pronounced while conversing on a mobile phone, as the sound quality and reception can vary throughout the conversation and drivers often struggle to hear the person on the other end of the line (Direct Line Motor Insurance, 2002). Regardless of whether the phone is hand-held or hands-free, there is strong evidence that the actual task of conversing on the phone, whether it be listening or talking, while driving places significant cognitive demands on drivers and distracts them from concentrating on the safe operation of the vehicle and any hazards arising in the road environment (Goodman et al., 1997; Matthews, Legg & Charlton, 2003). Research suggests that the impact of talking on a mobile phone on driving performance differs from that of holding a conversation with a passenger, as passengers are aware of the road environment and will generally let the conversation lapse during a dangerous driving situation, allowing the driver to concentrate fully on negotiating the hazard. A person on a mobile phone, however, is not aware of any potential hazards and they will often continue to talk, distracting the driver at critical moments (Direct Line Motor Insurance, 2002). There may also be social pressures (e.g., when talking to the boss) to maintain a telephone conversation despite the presence of potential hazards. Mobile phone use also often involves the performance of secondary tasks that may further distract the driver. These can include writing down information such as a telephone number on a piece of paper or writing dates or notes in diaries. Thus, the distracting effects of using mobile phones while driving may extend beyond the actual operation of the phone itself (Goodman et al., 1997). The various forms of distraction caused by using a mobile phone can affect driving performance in several ways. A review of the mobile phone literature conducted by the Royal Society for the Prevention of Accidents (RoSPA) concluded that the use of mobile phones impairs the following driving performance measures:
• maintenance of lane position; • maintenance of appropriate and predictable speed; • maintenance of appropriate following distances from vehicles in front; • reaction times; • judgement and acceptance of safe gaps in traffic; and • general awareness of other traffic (RoSPA, 2002, pg, 7).
5DRIVER DISTRACTION: A REVIEW OF THE LITERATURE
The extent to which these driving performance measures are affected by mobile phone use depends on the type of mobile phone being used. The following section of the report discusses the effects of hand-held and hands-free mobile phones on driving performance and behaviour. 3.1.1 Hand-Held Mobile Phones The dangers of using a hand-held phone while driving have been debated in the literature for years (Goodman et al., 1997). A vast number of studies have examined the effects of operating a hand-held phone on driving performance. The results of these studies generally suggest that using a hand-held phone degrades driving performance significantly and, in response, many countries including Australia, Brazil, Italy and England, and several states in the U.S., have prohibited the use of hand-held mobile phones while driving (Goodman et al., 1997; Matthews et al., 2003; RoSPA, 2002; STTG, 2002). An on-road study by Green, Hoekstra and Williams (1993) examined the effects of interacting with a hand-held mobile phone on several driving performance measures. Eight participants drove a 1991 Honda Accord along a 19 turn, 35 minute test route that included sections of residential neighbourhoods, city streets and expressways. Participants were guided through the test route by an in-vehicle experimental route navigation system that issued turn-by turn instructions. During the trip each driver dialled a familiar telephone number and engaged in three types of secondary tasks using a hand-held mobile phone: a listening task in which drivers listened to a 30 second description of a scenario and then were prompted to make a decision about the scenario based on the information heard; a talking task in which participants had to describe something (e.g., what they did on the weekend) for 30 seconds; and a listing task in which they had to list as many items as possible that belonged to a given category. Measurements of the lateral position of the car on the road, speed, throttle position, steering wheel angle and eye fixation measures were recorded while participants were using and not using (baseline) the mobile phone. Based on observed increases in steering wheel angle standard deviations, dialling the phone number was the most distracting task. The three mobile phone tasks did not differ in their level of distraction, however they were more distracting than driving alone. Differences were observed in the standard deviation of throttle position, with variations in throttle position greatest for the talking task and lowest for the dialling task. No other significant effects of phone usage were observed, however this may have been due to the small sample size or the short testing period used (Green et al., 1993). The results do, however, suggest that using a hand-held mobile phone while driving may adversely influence a driver’s ability to maintain their lateral position on the road and their throttle control. Reed and Green (1999) also examined the impact of using a hand-held mobile phone on driving performance, both on real roads and in a fixed-based driving simulator. The primary focus of the study was to determine if the results found in the driving simulator corresponded to results found in an on-road instrumented vehicle. However, it does provide important insights into the degrading effects of mobile phone use on driving. Six male and six female drivers drove along a freeway route in an instrumented vehicle while periodically making calls on a hand-held mobile phone. The same participants
MONASH UNIVERSITY ACCIDENT RESEARCH CENTRE 6
then drove a similar route in a driving simulator while also making phone calls. Lane position, speed, steering wheel angle and throttle position measurements were taken in both driving situations. Results revealed that use of the mobile phone reduced driving precision both on the road and in the driving simulator. Compared to normal driving, greater variations in lane position and speed and throttle control were observed both on the road and in the simulator when participants were making calls on the mobile phone. Moreover, the older participants (aged 60+) showed greater decrements in their ability to maintain speed and lane position than the younger participants aged 20 to 30 years. The authors also noted that the driving simulator demonstrated good validity for measuring speed control and the effects of the phone tasks on driving (Reed & Green, 1999). More recently, a British study conducted by the Transport Research Laboratory (TRL) for Direct Line Motor Insurance examined the dangers of using a mobile phone when driving (Burns, Parkes, Burton & Smith, 2002). Using a hand-held and a hands-free mobile phone while driving was compared to driving while over the UK legal alcohol limit (80mg/100ml, or 0.08), driving while not under the influence of alcohol and driving while not using a phone. Twenty participants were tested using the TRL advanced driving simulator on two occasions. On one test trial, the participants used a hand-held and a hands-free mobile phone to converse with the experimenter while driving. On the second test trial, the participants consumed a drink containing alcohol or a similar tasting placebo before driving. Each participant experienced four driving conditions: a motorway with moderate traffic conditions; maintaining a safe following distance from a vehicle ahead; attempting to negotiate a bend; and driving on a dual carriageway with traffic lights. Driver’s reaction times to hazards were on average 30 percent slower when conversing on a hand-held mobile phone than when driving under the influence of alcohol, and 50 percent slower than under normal driving conditions. There was also evidence of reduced speed control when using a mobile phone. The authors concluded that using a hand-held mobile phone while driving significantly impairs driving performance and represents a significant road safety danger (Burns et al., 2002). The above studies demonstrate the adverse effects of using a hand-held phone on driving performance. In an effort to determine what specific aspects of hand-held mobile phone use have the greatest distracting effects, the National Police Agency of Japan conducted a study which investigated 129 mobile phone-related vehicle crashes (Japanese National Police Agency, 1996). They found that 42% of the crashes involved the driver responding to a call at the time of the crash, 32% of the drivers were dialling a number, 16% were conversing on the phone and 5.4% of drivers were hanging up the phone. Based on this data the authors concluded that the main risk associated with mobile phone use while driving was the physical distraction caused through handling and manipulating the phone (Japanese National Police Agency, 1996). As the physical manipulation of hand-held phones was believed to be the main cause of driver distraction, hands-free mobile phones were developed in an effort to reduce, or even eliminate, the physical distraction caused by handling the phone while driving (Wheatley, 2000). However, as subsequent investigations discovered, this did not turn out to be the case. Research revealed that it is not just the physical distraction of handling the phone that presents a significant safety hazard, but also the cognitive
7DRIVER DISTRACTION: A REVIEW OF THE LITERATURE
distraction of being engaging in a conversation. Indeed, many studies have found that using a hands-free phone while driving is no safer than using a hand-held phone (Haigney, Taylor & Westerman, 2000; Matthews et al. 2003; Redelmeier & Tibshirani, 1997). 3.1.2 Hands-Free Mobile Phones Using an epidemiological approach, Redelmeier and Tibshirani (1997) examined whether using a mobile phone while driving increases the risk of being involved in a vehicle crash and whether hand-free phones offer any safety advantages over hand-held phones. A total of 699 Toronto drivers who owned a mobile phone and who were involved in a vehicle crash resulting in substantial property damage, but no personal injury, participated in the study. Each driver’s mobile phone calls on the day of the crash and during the week prior to the crash were analysed through detailed mobile phone billing records. The time of each collision was determined through each driver’s statement, police records and records of calls made to emergency services. Case-crossover analysis was used to assess the risk associated with mobile phone use. Results revealed that the risk of being involved in a vehicle crash while using a mobile phone was four times greater than the risk among the same drivers when they were not conversing on a phone. Moreover, the authors observed no safety advantages of using a hands-free phone as opposed to a hand-held mobile phone while driving. The authors concluded that their results did not support the policy being adopted in many countries of prohibiting the use of hand-held, but not hands-free, mobile phones while driving (Redelmeier & Tibshirani, 1997). A more recent study by Haigney, Taylor and Westerman (2000) also revealed similar results. Using a driving simulator, Haigney and colleagues examined the relative effects of hand-held and hands-free mobile phone use on driving performance. Thirty participants (mean age 26.93 years) first completed a questionnaire designed to obtain demographic information such as age and driving experience. The participants were then seated in the Aston Driving Simulator and fitted with a heart rate sensor in order to measure any deviations from their resting heart rate while using the mobile phone. Participants completed four simulated drives in which they had to deal with an incoming call, twice using a hands-free phone and twice using a hand-held phone. Mean speed, standard deviation of accelerator pedal travel, brake pedal travel, number of gear changes, and the number of overtaking manoeuvres, off-road excursions and collisions were recorded as dependent measures. Results revealed that speed and standard deviation of accelerator pedal travel were lower while using the mobile phone, but mean heart rate increased during phone use. Moreover, as heart rate increases were not associated with phone type, the authors concluded that heart rate increases were not related to the physical demands of holding the phone, but rather to the cognitive demands associated with the phone conversation. Given that increased cognitive demand may contribute to driver distraction and render drivers less responsive to hazards in the road environment, the authors recommended that drivers should not engage in any mobile phone use, neither hand-held nor hands-free, while driving. Armed with the knowledge that that it is also the cognitive distraction of being engaged in a conversation and not just the physical distraction of handling the phone that contributes to driver distraction, researchers sought to establish the impact of cognitive distraction on various measures of driving performance and examine whether and how
MONASH UNIVERSITY ACCIDENT RESEARCH CENTRE 8
the level of cognitive distraction, as determined by the complexity or emotionality of the phone conversation, influences driver behaviour. Harbluk, Noy and Eizenman (2002) investigated the impact of cognitive distraction on driver’s visual behaviour in an on-road experiment. A total of 21 drivers, aged 21 to 43 years, drove an instrumented Toyota Camry along an 8-kilometre city test route while carrying out secondary tasks of varying cognitive complexity. These tasks were communicated via a hands-free mobile phone. Each participant drove the test route under three task conditions: while performing no secondary task; while completing easy addition problems (e.g., 6+9); and while completing complex addition tasks (e.g., 47+38). Three measures of driver behaviour were recorded: visual scanning behaviour using eye tracking equipment fitted to the car; measures of vehicle control, such as braking and longitudinal deceleration; and drivers’ subjective assessments of workload, safety and distraction. Measurement of drivers’ visual scanning patterns revealed that as the cognitive complexity of the mobile phone task increased, drivers made significantly less saccadic eye movements (high-speed eye movements which facilitate exploration of the road environment) and spent more time looking centrally and less time looking to the right periphery for impending hazards (i.e., pedestrians). Drivers also spent less time checking their mirrors and instruments and many drivers displayed a change in their inspection patterns of their forward view (e.g., spent more time looking up or down), although not all drivers changed their visual inspection patterns in the same way. Significant changes were also observed in vehicle control, as evidenced by an increased incidence of hard braking during the complex addition task. Finally, as the complexity of the addition tasks increased, drivers’ perception of workload (as recorded using the NASA-TLX), distraction and perceptions of their driving as being less safe also increased (Harbluk et al., 2002). While Harbluk et al. (2002) focused on the effects of cognitive distraction on drivers’ visual behaviour, the Surface Transportation Technical Group (STTG) (2002) assessed whether the complexity of a conversation when using a mobile phone affects a driver’s response time to stimuli. An open-loop driving simulation and tracking task was utilized to study three different conditions of talking on a mobile phone: no telephone use; simple phone conversation (e.g., how is your day?); and complex conversation (e.g., remembering meeting times). Thirty college participants were randomly divided into three groups. One group performed the 3-minute simulated driving and tracking task without using the mobile phone, the second group performed the driving and tracking tasks while involved in a simple conversation on the mobile phone and the third group performed the tasks while engaged in the complex telephone conversation. In the simulated driving task, participants viewed a 3-minute long rural highway video scene, which was projected on a large screen. Stimuli, including road signs and pedestrians, were projected onto the roadway scene and the participants were asked to respond to the stimuli by pressing a specified key on a keyboard. The time they took to respond to the stimuli was recorded. In the tracking task, participants were required to track a small circle that moved randomly across a computer screen. Overall accuracy, time on target and the number of times the target was missed was recorded. In the simulated driving task, engaging in a complex telephone conversation resulted in significant increases in reaction times to stimuli presented compared to not using a
9DRIVER DISTRACTION: A REVIEW OF THE LITERATURE
phone or engaging in a simple telephone conversation. There were no significant differences observed in response times between the simple conversation and the no-phone condition. In addition, a significant reduction in tracking accuracy was observed between the complex conversation condition and the simple conversation and no-phone conditions, but not the simple conversation and no-phone condition. These results suggest that a driver’s ability to perceive and respond to hazardous situations in the driving environment is significantly impaired when conversing on a mobile phone, particularly when the conversation is complex in nature. In addition, the impact of mobile phone-based distraction on drivers’ decision-making ability and, in particular, their ability to make safe cross-traffic turning decisions was examined by Cooper & Zheng (2002). Using a closed course driving experiment, 39 participants were seated in an instrumented car and exposed to approximately 100 gaps between eight vehicles that circled the test circuit continuously. This test circuit was wet for half of the trials. Participants were asked to press down on the accelerator pedal when they felt that it was safe to turn in front of the approaching vehicles (although the test vehicle stayed stationary). For half the time participants were required to listen to a complex message consisting of a statement followed by target words and state whether the target words were consistent with the criterion statement. On the other half of the trials participants were not distracted. The influence of engaging in the verbal message task on drivers’ gap acceptance decisions was measured. Regardless of whether the drivers were, or were not, distracted by the verbal message task, they were more likely to decide to turn across oncoming traffic if the gap between themselves and the approaching vehicle was large, if the speed of the approaching vehicle was slow and the intervals between making successive turning decisions were low. Younger participants were also more likely than the older drivers to accept shorter gaps. When the drivers were not distracted, they also took into account the condition of the road surface (whether it was wet or dry) when making a decision to turn. In contrast, when distracted by the verbal message task, drivers did not account for the road surface condition when deciding whether to accept or reject a gap. Indeed, on the wet road surface, the participants were estimated to have initiated twice as many potential collisions when distracted as when not distracted. The authors concluded that listening and responding to verbal messages (as occurs during a phone conversation) while driving, reduces a driver’s ability to adequately consider and process all the information necessary for safe decision-making and, in turn, can adversely impact road safety (Cooper & Zheng, 2002). Recently, increases in traffic density and the complexity of the traffic environment has also been found to exacerbate the distracting effects of mobile phones on driving performance (Strayer, Drews & Johnston, 2003). Using a driving simulator, Strayer et al. found that conversing on a hands-free mobile phone while driving lead to an increase in reaction times to a lead braking vehicle, with this increase in reaction times becoming more pronounced as the density of the traffic increased. One important aspect of this finding is that neither the test car nor the lead vehicle interacted with the additional vehicles on the road, suggesting that simply increasing the perceptual complexity of the road environment can intensify the distracting effects of engaging in a phone conversation while driving.
MONASH UNIVERSITY ACCIDENT RESEARCH CENTRE 10
In summary, the studies reviewed suggest that both the physical and cognitive distraction caused by using a mobile phone while driving can significantly impair a driver’s ability to maintain speed, throttle control and his/her lateral position on the road (Green et al., 1993; Reed & Green, 1999). It can also impair drivers’ visual search patterns, reaction times, decision-making processes and can increase the risk of being involved in a collision by up to four times (Direct Line Motor Insurance, 2002; Cooper & Zheng, 2002; Harbluk et al., 2002; Redelmeier & Tibshirani, 1997). Moreover, research suggests that drivers are not aware of the negative effects of using mobile phones on their driving performance (Lesch & Hancock, in press). It is important to note that the literature on the distracting effects of mobile phones while driving is extensive. For a more comprehensive review of the research examining the effects of mobile phones on driving performance, the reader is referred to a review conducted by the RoSPA (2002). 3.1.3 Text Messaging To the knowledge of the authors, very little research has been conducted on the distracting effects of sending or receiving text messages while driving. A Direct Line MORI survey of 2,000 drivers in the United Kingdom revealed that drivers considered sending a text message to be the most distracting activity (above reading a map, using a hand-held or hands-free phone, eating fast food or changing a tape) to perform while driving (MORI, 2001, cited in Direct Line Motor Insurance, 2002). Despite these concerns, two Australian surveys, one conducted by the University of Sydney and the other by Telstra, have found that 30 percent of the people surveyed had, in the past, sent text messages while driving (Canada Safety Council, 2002) and that one in six drivers regularly send text messages while driving (Telstra, 2003). Such a high prevalence of text messaging while driving is disturbing, given that the physical, visual and cognitive distraction associated with text messaging while driving is likely to be greater than that associated with simply talking on a hand-held phone (Direct Line, 2002). It is, therefore, critical for future research to concentrate on examining the impact of sending a text message on driving performance.
3.2 In-vehicle Route Guidance Systems In-vehicle route guidance systems (also referred to as navigation systems) are designed to guide drivers along the most direct route to a particular destination. Drivers enter a required destination into the system and the system then automatically plots the fastest or the shortest route to that destination and issues turn by turn instructions on how to reach the destination (Farber, Foley & Scott, 2000). As well as potentially increasing driving exposure, concerns have also been raised over the distracting nature of route guidance systems (Regan, Oxley, Godley & Tingvall, 2001). Route guidance systems can distract drivers physically through the manual entry of destination details; visually, by looking at the visual display when entering destinations or when viewing the electronic map; aurally, when listening to auditory turn-by-turn instructions; and/or cognitively, when the driver focuses their attention on turning instructions or destination entry. Thus, driver distraction when using an in-vehicle route guidance system can occur while entering destination data and/or when following the turn-by-turn instructions issued by the system. These two sources of distraction are discussed below.
11DRIVER DISTRACTION: A REVIEW OF THE LITERATURE
3.2.1 Destination Entry One major concern with the use of route guidance systems while driving is the task of entering destination information. This is a time consuming process and is often very distracting for the driver. Depending on the type of system and how the information is entered, entering destination details can take a driver up to 9 minutes to complete (Farber et al., 2000). Moreover, while some route guidance systems only allow destination information to be entered while the vehicle is stationary, a number of systems actually allow the driver to enter this information while the vehicle is in motion. A number of methods exist for entering information into route guidance systems: selecting the required destination from a scrolling list of cities, suburbs and street names; manually typing in the street number and name and suburb of the destination letter by letter; or using voice input to enter the destination details (Farber et al., 2000; Tijerina, Johnston, Parmer, Winterbottom & Goodman, 2000). The first two methods of data entry are the lengthiest and the most physically and cognitively demanding however, they are also the most commonly used methods by drivers. A survey of 130 route guidance users revealed that only 10 percent of respondents use voice input to enter destination information and 25 percent regularly enter information manually while driving (Hway-liem, 2002). The relative benefits of using voice rather than manual input when operating route guidance systems has become a major focus of the distraction research on route guidance systems. Tijerina and colleagues examined the distracting effects of entering destination information into four different route guidance systems while driving (Tijerina, Parmer & Goodman, 1998). Each route guidance system required different destination entry methods: three involved visual-manual destination entry, while the fourth involved voice input and output. The visual attention required to dial a hand-held mobile phone and tune the radio was also recorded as a comparison. Sixteen participants drove a 7.5-mile test track with traffic lights in an instrumented vehicle. While driving along the test route, participants were required to enter destination information into each of the four route guidance systems. Mean glance time at the road and the in-vehicle device, number of lane exceedences and time taken to enter destination information was recorded for each route guidance system. Results revealed that the three systems which required visual-manual destination entry were associated with the longer completion times, longer eyes-off-road times, more frequent glances at the device, and a greater number of lane exceedences compared to the voice activated system. In particular, the drivers aged less than 35 years took, on average, over one minute to enter destination information into the systems manually, while drivers aged over 55 took twice as long to perform the same tasks. The voice activated system, however, was associated with more frequent glances at a card containing the destination details than the visual-manual entry systems, presumably because of the added necessity to spell the destination correctly. Regardless of the type of route guidance system, the destination entry task took substantially longer to complete than either the mobile phone dialling or radio tuning tasks. The authors concluded that route guidance systems with voice recognition technology are a more viable and safer option than systems that require visual-manual entry (Tijerina et al., 1998). However, continuing concerns over the amount of time required to enter
MONASH UNIVERSITY ACCIDENT RESEARCH CENTRE 12
destination information, whether manually or by voice-activation, led the developers of a number of systems to limit access to certain navigation functions while the vehicle is moving. A number of route navigation systems now ‘lock out’ the destination entry function when the vehicle is in motion (Farber et al., 2000). 3.2.2 Route Guidance Once a driver has entered the destination information and is en route, the route guidance system will issue instructions to the driver as to the best course to take. The form that these instructions take varies widely across systems. Information can be presented using a visual display, auditory messages or both. In the case of visual displays, information can be presented either as a route map, or as a turn-by-turn display (Tijerina et al., 2000; Srinivasan & Jovanis, 1997). Numerous studies have examined and compared the relative distracting effects of route guidance systems that present navigation information in different forms. One of the most notable of these was the camera car study, conducted as part of the evaluation of the TravTek navigation system by the NHTSA in Orlando, Florida between 1992 and 1993 (Dingus et al., 1995). Four different route guidance system conditions were examined: turn-by-turn guidance screens with and without voice guidance and electronic route map with and without voice guidance. Two control conditions, written directions on paper and a conventional paper map, were also examined. Eighteen visitors and 12 local people served as participants. Participants drove an instrumented “camera car”, which allowed detailed measurement of driving performance while interacting with the various configurations of the TravTek route guidance system, the paper map and the written direction list. Results indicated that the electronic route map without voice guidance and the conventional map control resulted in the most driving intrusion of all the systems tested. Use of the electronic route map without voice guidance created high visual attention demand, requiring drivers to look longer at the display to retrieve the required information. Use of this system also resulted in more braking errors and lane deviations than the other navigation systems. Results also revealed that the using the conventional map required a large amount of cognitive attention, as evidenced by the higher number of abrupt braking manoeuvres and high workload ratings under this condition. Of all the conditions, the turn-by-turn guidance screen with voice guidance provided the best performance with regard to usability, safety and attentional demand, suggesting that route guidance systems which provide turn-by turn instructions, rather than presenting complex holistic route information, are less distracting to the driver and present the most useable means of navigation (Dingus et al., 1995). A more recent study by Srinivasan and Jovanis (1997) used a high fidelity driving simulator to examine the effect on driving performance of interacting with complex route guidance systems. More specifically, the study sought to determine whether route guidance systems result in better driving performance than conventional maps and whether the addition of voice guidance or a turn-by-turn display further enhances the effects of route guidance systems. Eighteen participants drove along a simulated network consisting of urban two-lane undivided arterials, four-lane undivided arterials and four-lane divided roads. Each participant used four route guidance systems: head-down electronic route map; paper map; head-up turn-by-turn guidance display with head-down electronic map; and voice guidance with head-down electronic map. Driving
13DRIVER DISTRACTION: A REVIEW OF THE LITERATURE
speed, workload (NASA TLX), navigation errors, and reaction time to external events were measured while interacting with each system. The voice guidance/electronic map system was associated with better driving performance, resulting in the fastest mean speeds on all road types, the lowest workload ratings and least number of navigational errors. In contrast, use of the paper map resulted in the lowest mean speeds, the highest workload ratings and the greatest number of navigational errors. The authors concluded that lower mean speeds were an indication that the system required more of the driver’s attentional capacity, as drivers would drive at slower speeds to compensate for their reduced attention to the roadway. The authors therefore viewed faster mean speeds as better driving performance. Which route guidance system least affected drivers’ reaction times to external events depended on the type of event examined. Reactions times to crossing vehicles were the quickest when using the electronic map systems, while reaction times to traffic signal changes were fastest when using the heads-up display/electronic map system. Based on the results of this and the Dingus et al. (1995) study, it appears that route guidance systems which provide voice guidance instructions are deemed the most usable and the least distracting to drivers. In summary, the studies reviewed suggest that the extent to which route guidance systems distract drivers depends on the mode of destination information entry and the presentation of navigation instructions. Generally, entering destination information is believed to be the most distracting task associated with the use of a route guidance system, however use of voice input technology can reduce the distraction associated with this task. Similarly, route guidance systems that present navigation instructions using voice output are less distracting and more usable than those systems that present the information on a visual display. Turn-by-turn route guidance instructions are also deemed more acceptable and usable by drivers than more complex holistic maps, particularly when coupled with voice-activation.
3.3 In-vehicle Internet and E-mail Facilities The availability of in-vehicle internet and email access is predicted to become an important element of so-called car ‘infotainment’ systems. It will enable the driver to download traffic updates and weather reports to improve traffic flow, obtain information on restaurant locations and parking availability and to access emails and web information (Burns & Lansdown, 2002). However, the distraction associated with the use of such systems while driving is a concern for researchers, car manufacturers and designers. A major focus in the development of these systems has been on designing an interface that is the least distracting for drivers to use while they are driving (Technical Insights, 2001). Several alternative interfaces have been designed and are currently commercially available. These include: systems that use tactile marks on the buttons to give each button a distinct feel, thus reducing the need for drivers to look away from the road to see what they are pressing (e.g., the BMW iDrive infotainment system); systems that employ steering mounted buttons to input information (e.g., Volvo’s concept car PC); and systems which rely on voice activation for input (e.g., the General Motors and Mercedes-Benz systems). Many system designers feel that the application of speech-based systems will solve the problem of interacting with complex internet and email display while driving (Technical Insights, 2001). However, some researchers believe that speech-based email systems have the potential to distract drivers and undermine road safety (Burns & Lansdown, 2002; Technical Insights, 2001).
MONASH UNIVERSITY ACCIDENT RESEARCH CENTRE 14
A recent study by Lee, Caven, Haake, and Brown (2002) revealed that using speech-based email while driving degrades driving performance. They used a medium-fidelity driving simulator to examine how a speech-based email system affects drivers’ attention to the roadway and their reaction time to a periodically braking lead vehicle. A total of 24 university students drove a series of 5 to 7 minute simple and complex driving scenarios, in which they used voice commands to operate either a simple (three level menu) or complex (four to seven level menu) email system. Participants were required to access several new email messages, read and reply to the messages and exit the system, using only voice commands. Measures of each participant’s reaction time to a braking lead vehicle, subjective cognitive workload and a measure of their situation awareness were collected. The data showed that when interacting with the speech-based email system, regardless of the complexity of the system, drivers’ reaction time to the braking lead vehicle was 30% longer than when not interacting with the system. Moreover, this 30% increase in reaction time translated into a 3.5 to 38.5% increase in collisions and 27.3 to 80.7% increase in collision velocity. Interaction with the speech-based system also increased drivers’ subjective workload and this was highest for the complex email system. While the results suggest that a speech-based interface does not eliminate the problem of driver distraction when interacting with complex systems, the results should be interpreted with caution. Of particular concern is that the speech-based email system was not compared to email systems that used other modes of input (e.g., manual input) and thus it may simply be the task of interacting with an email system, regardless of the mode of input and output, that creates a distraction and not the use of a speech-based system per se. A growing number of system designers are recognising that speech-based systems are not a panacea for driver distraction and are focusing on developing alternative interfaces such as those that rely on tactile feedback. However, to the knowledge of the authors, the effect of these types of interfaces on driver performance has not been experimentally tested.
3.4 Entertainment Systems 3.4.1 In-car Radios Despite being equipped to almost every car on the road, surprisingly little research has directly examined the distracting effects of interacting with, or listening to, a car radio. Therefore, little is known about the cognitive, physical and visual demands that interacting with a radio places on drivers. It is likely that radio use places different demands on drivers depending on the nature of the specific task they are performing and the type of interface used. Tuning a station, for example, is likely to be associated with increased physical and visual distraction, while listening to the radio is likely to create more of a cognitive or auditory distraction (Haigney & Westerman, 2001). Research that has examined radio use while driving has tended to use radio tuning only as a comparison task against which the distracting effects of other in-car tasks are judged. This is because the level of distraction created by using a radio is generally deemed ‘acceptable’ (Haigney & Westerman, 2001). Indeed, several studies have found that tuning the radio is less distracting than dialling or talking on a mobile phone (Department of California Highway Patrol, 1987; McKnight & McKnight, 1991; Strayer, Drew, Albert & Johnston, 2001) or operating route guidance systems (Tijerina et al., 1998). However, numerous other studies have found that tuning a radio degrades
15DRIVER DISTRACTION: A REVIEW OF THE LITERATURE
driving performance more than holding a simple conversation on a mobile phone, particularly when driving in adverse conditions (e.g., in wet, slippery conditions) (Briem & Hedman, 1995; Wikman, Nieminen & Summala, 1998). An on-road study conducted by Wikman and colleagues (1998) examined the allocation of visual attention of 23 experienced and 24 inexperienced drivers as they tuned the radio, changed a cassette and dialled a mobile phone while driving along rural and city roads. The results revealed that drivers spent greater lengths of time glancing away from the road when tuning the radio compared to when using the mobile phone. Changing the cassette resulted in the shortest glance durations away from the road. Compared to the experienced drivers, the novice drivers made more short (less than 0.5 seconds) and long (more than 3 seconds) glances away from the road, which were associated with large deviations in lane position. These results suggest that tuning a radio while driving appears to have a detrimental effect on driving performance, particularly for inexperienced drivers. Similar results were also revealed by Horberry, Anderson, Regan, Triggs & Brown (2003) in a study examining the distracting effects of operating a car radio and cassette player while driving in both simple (no billboards and few buildings and traffic) and complex (many billboards, buildings and oncoming vehicles) simulated driving environments. Thirty participants from three age groups (under 25, 30-45, and 60-75 years) took part in the study, which was conducted in the Advanced Driving Simulator located at Monash University. Participants were required to perform two distraction tasks while driving: a hands-free mobile phone task, in which they answered a series of general knowledge questions and an entertainment system task, in which they were required to tune the radio, change the radio’s bass/treble and speaker balance and insert and eject cassettes. Measures of mean speed, speed deviation from the posted speed limit, perceived workload (NASA TLX) and responses to hazards were taken. The results revealed that perceived workload was highest for the radio task in both the simple and complex driving environments and was the lowest for the no distraction condition. The radio task was also associated with lower mean speeds and greater deviations from the posted speed limit than either the phone task or no distraction condition. Participants were also less responsive to some hazards when distracted by the radio or the phone tasks compared to the no distraction condition. Research also suggests that simply listening to radio broadcasts while driving can impair driving performance (Jäncke, Musial, Vogt & Kalveram, 1994). Using a simulation approach, Jäncke et al. examined the conditions under which listening to the radio affects driving behaviour. A total of twenty participants controlled a graphically displayed car on a computer monitor along simple and complex simulated roads at different times of day while either listening or not listening to a radio program. Listening to the radio program resulted in a strong deterioration in driving performance, as measured by deviations from the correct lane, particularly under the complex driving condition. The Wikman et al. (1998), Horberry et al. (2003) and Jäncke et al. (1994) studies clearly demonstrate that tuning or even simply listening to the radio while driving can distract the driver and degrade driving performance. Even though the level of distraction caused by interacting with a radio may be smaller than that caused by other in-car tasks (e.g., using route navigation or holding a complex conversation on a mobile phone), it should
MONASH UNIVERSITY ACCIDENT RESEARCH CENTRE 16
not be discounted. This is particularly important given that in-car radios are extremely common and thus the frequency with which drivers interact with radios while driving is probably much higher than the rate at which drivers interact with route guidance systems. Indeed, evidence from a recent AAA study conducted in the United States demonstrated that adjusting the radio, CD player or tape cassette was found to be the second highest cause of distraction-related vehicle crashes (Stutts et al., 2001). 3.4.2 In-Vehicle CD Players In-car CD players are now a common feature in many cars. However, few studies have examined the distracting effects of using these systems while driving. The process of changing a CD and selecting a new track is likely to be relatively more distracting than simply listening to music, as these tasks place greater visual and physical demand on drivers. Indeed, research suggests that operating a CD player while driving is more distracting than dialling a mobile phone. Jenness, Lattanzio, O’Toole and Taylor (2002) examined the effect of continuously operating a CD player on simulated driving behaviour. Twenty-six participants completed five driving conditions, while eating a cheeseburger, reading directions, using a voice-activated or manual-dial system to place calls on a mobile phone, or continuously operating a CD player (selecting a CD, inserting it, selecting a track, removing the CD and placing it back in its case). Measures of speed violations, lane keeping errors, glances away from the road and driving times were recorded. The results indicated that participants made more lane deviations and glances away from the road and had the longest driving times when operating the CD player, than when eating or dialling numbers on a mobile phone. Preliminary evidence suggests that the use of voice-activation may minimise the distraction associated with using CD players while driving (Gärtner, König and Wittig, 2002). Gärtner and colleagues examined the relative impact on driving performance of using manual and speech input to operate a radio, CD player, telephone and a navigation system. A total of 16 participants drove a vehicle equipped with a Driver Information System (radio, CD player, telephone and navigation system) and a speech input system while performing 12 simple (e.g., changing the radio station) and complex tasks (e.g., using the route navigation system). When using voice-input to operate the systems, drivers were less likely to deviate from their lane and drive at too lower speeds. Drivers also glanced more often at their mirrors and less at the display when using the voice-activated system. Unfortunately, the authors did not report these results separately for each system, and thus it is difficult to draw firm conclusions regarding the effects of the voice-activation system on the operation of the CD player. The pattern of results does, however, suggest that use of a voice-activated system minimises the some of the distraction associated with operating a CD player. Of course, some aspects of operating a CD player, such as getting CDs in and out of their cases and inserting them in the CD player, will not be minimised by the development of voice-activation technologies. 3.4.3 In-vehicle Television and Video Rear seat television/video/DVD systems are currently among one of the best selling in-car devices on the market in the United States (Technical Insights, 2001). The market for in-vehicle television and video systems was worth $208 million dollars in the United States in the year 2000, and experts estimate that revenues for the market will increase to $450 million during 2003. With such high market proliferation, it is important to
17DRIVER DISTRACTION: A REVIEW OF THE LITERATURE
establish the distracting influence these systems on drivers. As the market is still in its introductory phase, no research, to the knowledge of the authors, has examined the influence of these systems on driver performance. It is likely that televisions and video/DVD systems will create a visual (if mounted so that the driver can view the screen), auditory and cognitive distraction as drivers try to listen to the program. Legislation already in place in the United States and Australia prohibits television and video/DVD systems to mounted anywhere in the vehicle where they can be viewed by the driver while they are driving (NHTSA, 2000b). Clearly, however, research is required to examine if and how these systems distract drivers in order to inform their future design. 3.4.4 Portable Devices There is an emerging trend towards the provision of services to the driver through portable devices such as the mobile phone or pocket PC. In Europe, for example, it is possible to access Internet services, navigation assistance and entertainment information through a pocket PC or mobile telephone. These services can be expected to be available in Australia shortly. Currently, there are no guidelines, standards, or regulations in Australia governing the use of portable devices used for these purposes whilst driving.
Entertainment systems, particularly radios and CD players, are common features in most cars and the popularity of more complex systems such as television and video is also increasing. The studies reviewed suggest that tuning or manipulating, or even simply listening to the radio or CD player while driving, can distract the driver and degrade driving performance. Some studies even suggest that performing these tasks is more distracting than dialling or talking on a mobile phone. Despite the increasing popularity of rear seat televisions and videos, little is known about whether and how these systems distract drivers. 4. Non Technology-based Distraction
Drivers often engage in a number of non technology-based activities which have the potential to distract them from the driving task and increase the risk of a crash. The range of non technology-based activities that are performed while driving is endless, however some of the main activities that drivers engage in include eating, drinking, smoking and talking to passengers. This section of the report reviews research that has examined the distracting effects of these activities on driving.
4.1 Eating and Drinking Eating and drinking are activities that are commonly carried out by drivers. While eating and drinking are deemed acceptable activities while driving, and no legislation exists prohibiting drivers from carry out these activities, eating and drinking can create a physical and visual distraction for drivers as it requires them to remove their eyes off the road and one or both hands off the steering wheel for extended periods of time. When a spill occurs, the process of eating and drinking can become even more
MONASH UNIVERSITY ACCIDENT RESEARCH CENTRE 18
distracting. A recent study by the American Automobile Association’s Foundation for Traffic Safety (AAA) revealed that a greater proportion of drivers involved in traffic accidents are distracted by eating or drinking (1.7%) than by talking on a mobile phone (1.5%) (Stutts et al., 2001). Results of an experimental study by Jenness et al. (2002) also corroborate the results of Stutts et al. They found that eating a cheeseburger was as distracting as using a voice-activated dialling system, but less distracting than continuously operating a CD player.
4.2 Smoking Smoking is a common activity among drivers, however it can distract drivers as they remove their hands from the wheel to light a cigarette, hold it for an extended period of time and put it out. Several studies have found that smoking while driving increases the risk of being involved in a crash (Brison, 1990; Christie, 1990; Violanti & Marshall, 1996). Brison used a case-controlled study to investigate the risk of a motor vehicle crash in smokers and non-smokers. A self-administered questionnaire was sent out to 1,000 people known to be involved in a motor accident and 1,100 controls who had not been involved in a crash, to obtain information on each driver’s smoking status. The results revealed that smokers had an increased risk of being involved in a motor accident than non-smokers and the tendency to smoke while driving further increased this risk. Brison concluded that the association between smoking and increased crash risk could be the result of three factors: distraction caused by smoking, behavioural differences between smokers and non-smokers, and carbon-monoxide toxicity. A review of the literature by Christie (1990) also revealed that smokers have an increased crash risk compared to non-smokers and this greater risk remains when age, gender, education, alcohol consumption and driving experience are accounted for. Again, the studies reviewed by Christie offered a range of explanations for the smoking crash risk association, ranging from smoking being a physical distraction to decrements in driving performance due to high levels of carbon-monoxide. Regardless of the exact cause of smokers’ increased risk of being involved in a crash, it is clear that smoking while driving is a hazard. Indeed, research conducted by Stutts et al. (2001) revealed that smoking was a source of distraction in 0.9% of distraction-related crashes, which equated to approximately 12,780 crashes over the 5 year period examined.
4.3 Passengers Conversing with passengers is an activity that is carried out by almost every driver and although this is generally considered to be a low-risk activity, passengers can, under certain circumstances, be a source of distraction to drivers. For instance, passengers can become a distraction when they are engaged in an argument or intense conversation with the driver or another passenger, or when the driver has to turn around to attend to or console a passenger or child. Although, to the knowledge of the authors, no research has directly examined whether and how passengers distract drivers, research does exist which provides anecdotal evidence that passengers may be a distraction. A summary of the current research on teenage passengers by Williams (2001) revealed that the presence of passengers increases crash risk, particularly for younger drivers, and this is believed to result largely from distraction and risk-taking. When passengers are present there is often an increase in verbal and sometimes physical interaction and this is
19DRIVER DISTRACTION: A REVIEW OF THE LITERATURE
believed to increase drivers’ inattention to the driving task, which in young, inexperienced, drivers can have dangerous consequences (Williams, 2001). A study by Regan and Mitsopoulos (2001) also provides evidence that passengers can be distracting to drivers. They conducted focus groups with 28 ACT residents to examine passenger influences on driver behaviour. The results of the focus group discussions revealed that some of the participants found passengers to be distracting under certain circumstances. One participant stated that they found the presence of passengers distracting to the point where they were less likely to detect traffic light changes or road signs. Another participant mentioned that they had been distracted by helping a passenger look for something in their wallet and almost had an accident. Research conducted by Stutts et al. (2001) for the AAA provides further evidence of the distracting effects of passengers. They found that passengers in the vehicle were the source of distraction in 10.9% of distraction related crashes. Drivers claimed that at the time of the crash they were arguing or fighting with a passenger, looking at a passenger or helping them with tasks such as buckling their seatbelt. Overall, it appears that many everyday, non technology-based activities carried out by drivers, such as eating, drinking, smoking and interacting with passengers, can distract them and increase their crash risk. Eating, drinking and smoking can create a physical and visual distraction, as they require drivers to remove their eyes from the road and one or both hands from the steering wheel for extended periods of time. The distracting effects of passengers is less well understood due to a lack of direct research, however, anecdotal evidence suggests that passengers can indeed create a distraction under certain circumstances. 5. The Role of Driver Distraction in Crashes: Sources of
Distraction and their Relative Dangers
Several studies have examined the relative levels of distraction afforded by various in-vehicle systems or activities. In general, these studies suggest that the more complex sources of distraction (e.g., navigation systems) afford greater levels of driver distraction than do more ‘simple’ sources (e.g., eating or smoking) that require fewer steps to complete. However, in determining which sources of distraction have the greatest distracting effects on drivers, a clear distinction needs to be made between the actual levels of distraction afforded by performing an activity per se, and the frequency with which this activity is carried out by drivers. For example, talking to a passenger may be less of a distraction in isolation than interacting with a navigation system; however, the frequency with which drivers engage in conversation with passengers is likely to be far greater than the frequency with which drivers interact with navigation systems and therefore has more opportunity to distract drivers and contribute to a crash. This raises an important issue: should an activity that is less distracting, but is performed frequently and thus has the potential to result in more crashes, be considered more distracting than a more complex activity that is performed rarely. It is clear that when attempting to determine how distracting an activity is, exposure to that activity needs to be considered. This is particularly important when reviewing studies that are based on crash data, as the number of crashes attributed to being distracted by a certain activity may not reflect how distracting the activity is, but rather how frequently drivers
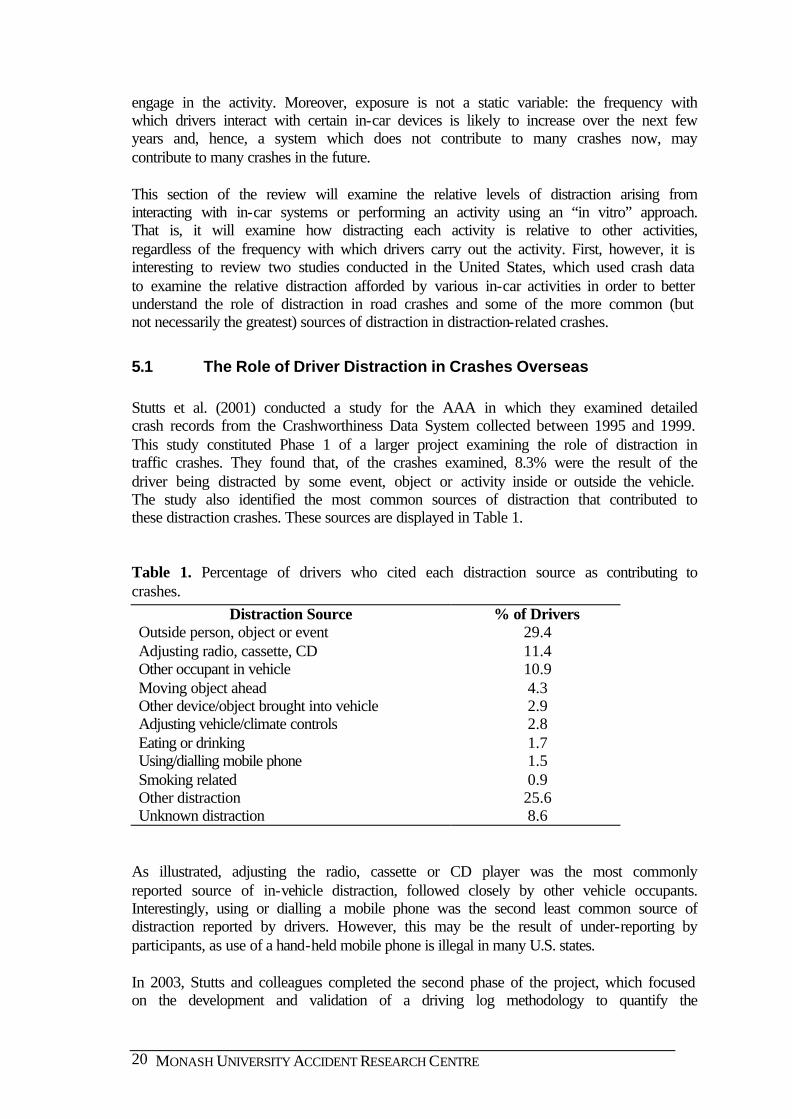
MONASH UNIVERSITY ACCIDENT RESEARCH CENTRE 20
engage in the activity. Moreover, exposure is not a static variable: the frequency with which drivers interact with certain in-car devices is likely to increase over the next few years and, hence, a system which does not contribute to many crashes now, may contribute to many crashes in the future. This section of the review will examine the relative levels of distraction arising from interacting with in-car systems or performing an activity using an “in vitro” approach. That is, it will examine how distracting each activity is relative to other activities, regardless of the frequency with which drivers carry out the activity. First, however, it is interesting to review two studies conducted in the United States, which used crash data to examine the relative distraction afforded by various in-car activities in order to better understand the role of distraction in road crashes and some of the more common (but not necessarily the greatest) sources of distraction in distraction-related crashes.
5.1 The Role of Driver Distraction in Crashes Overseas Stutts et al. (2001) conducted a study for the AAA in which they examined detailed crash records from the Crashworthiness Data System collected between 1995 and 1999. This study constituted Phase 1 of a larger project examining the role of distraction in traffic crashes. They found that, of the crashes examined, 8.3% were the result of the driver being distracted by some event, object or activity inside or outside the vehicle. The study also identified the most common sources of distraction that contributed to these distraction crashes. These sources are displayed in Table 1. Table 1. Percentage of drivers who cited each distraction source as contributing to crashes.
Distraction Source % of Drivers Outside person, object or event 29.4 Adjusting radio, cassette, CD 11.4 Other occupant in vehicle 10.9 Moving object ahead 4.3 Other device/object brought into vehicle 2.9 Adjusting vehicle/climate controls 2.8 Eating or drinking 1.7 Using/dialling mobile phone 1.5 Smoking related 0.9 Other distraction 25.6 Unknown distraction 8.6
As illustrated, adjusting the radio, cassette or CD player was the most commonly reported source of in-vehicle distraction, followed closely by other vehicle occupants. Interestingly, using or dialling a mobile phone was the second least common source of distraction reported by drivers. However, this may be the result of under-reporting by participants, as use of a hand-held mobile phone is illegal in many U.S. states. In 2003, Stutts and colleagues completed the second phase of the project, which focused on the development and validation of a driving log methodology to quantify the
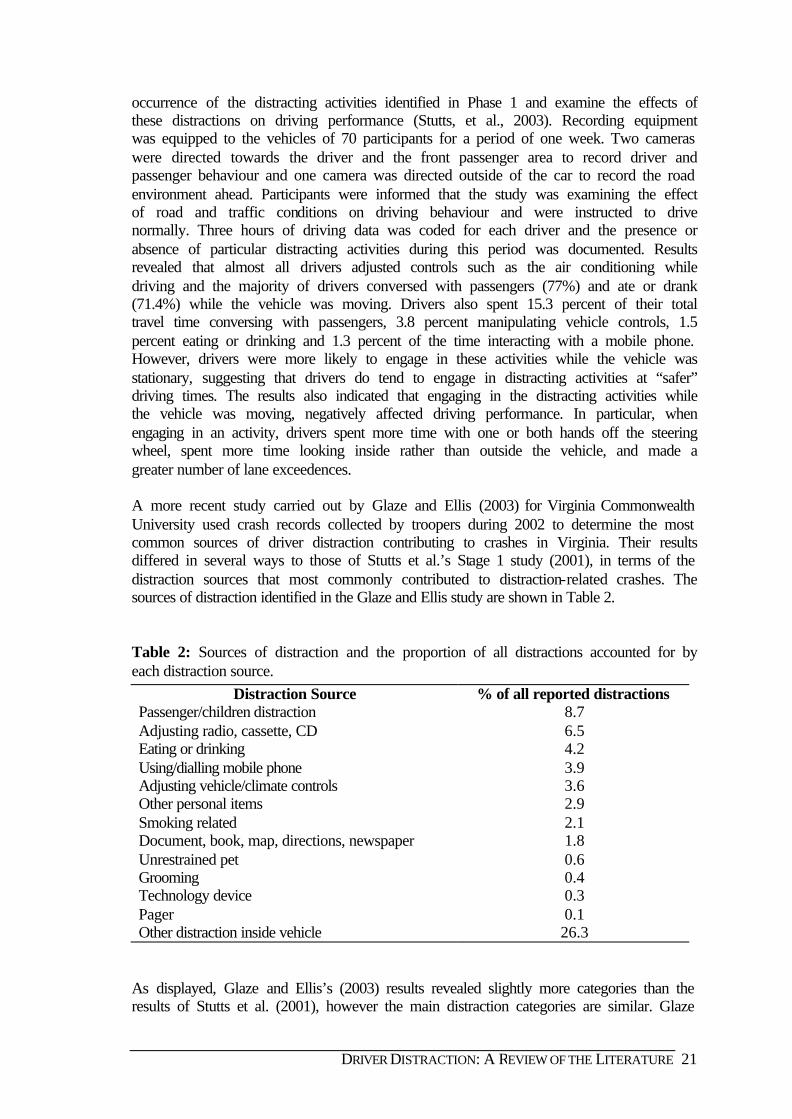
21DRIVER DISTRACTION: A REVIEW OF THE LITERATURE
occurrence of the distracting activities identified in Phase 1 and examine the effects of these distractions on driving performance (Stutts, et al., 2003). Recording equipment was equipped to the vehicles of 70 participants for a period of one week. Two cameras were directed towards the driver and the front passenger area to record driver and passenger behaviour and one camera was directed outside of the car to record the road environment ahead. Participants were informed that the study was examining the effect of road and traffic conditions on driving behaviour and were instructed to drive normally. Three hours of driving data was coded for each driver and the presence or absence of particular distracting activities during this period was documented. Results revealed that almost all drivers adjusted controls such as the air conditioning while driving and the majority of drivers conversed with passengers (77%) and ate or drank (71.4%) while the vehicle was moving. Drivers also spent 15.3 percent of their total travel time conversing with passengers, 3.8 percent manipulating vehicle controls, 1.5 percent eating or drinking and 1.3 percent of the time interacting with a mobile phone. However, drivers were more likely to engage in these activities while the vehicle was stationary, suggesting that drivers do tend to engage in distracting activities at “safer” driving times. The results also indicated that engaging in the distracting activities while the vehicle was moving, negatively affected driving performance. In particular, when engaging in an activity, drivers spent more time with one or both hands off the steering wheel, spent more time looking inside rather than outside the vehicle, and made a greater number of lane exceedences. A more recent study carried out by Glaze and Ellis (2003) for Virginia Commonwealth University used crash records collected by troopers during 2002 to determine the most common sources of driver distraction contributing to crashes in Virginia. Their results differed in several ways to those of Stutts et al.’s Stage 1 study (2001), in terms of the distraction sources that most commonly contributed to distraction-related crashes. The sources of distraction identified in the Glaze and Ellis study are shown in Table 2. Table 2: Sources of distraction and the proportion of all distractions accounted for by each distraction source.
Distraction Source % of all reported distractions Passenger/children distraction 8.7 Adjusting radio, cassette, CD 6.5 Eating or drinking 4.2 Using/dialling mobile phone 3.9 Adjusting vehicle/climate controls 3.6 Other personal items 2.9 Smoking related 2.1 Document, book, map, directions, newspaper 1.8 Unrestrained pet 0.6 Grooming 0.4 Technology device 0.3 Pager 0.1 Other distraction inside vehicle 26.3
As displayed, Glaze and Ellis’s (2003) results revealed slightly more categories than the results of Stutts et al. (2001), however the main distraction categories are similar. Glaze
MONASH UNIVERSITY ACCIDENT RESEARCH CENTRE 22
and Ellis found that passengers were the most common source of distraction, while devices such as pagers and technologies, were the least common source of driver distraction. Using a mobile phone was also found to be a more common source of distraction in the Virginia study than in the Stutts et al. (2001) study. There are several possible explanations for the observed differences in results found between the two studies, including differences in sample size (the Virginia study had a much smaller sample size) or differences in methodology (Stutts et al. obtained their data from the CDS which is vehicle-based, whereas the Virginia study had troopers complete crash surveys for each crash they attended). The results may also be the result of time differences. The data for the Stutts et al. study was obtained during the years 1995 to 1999, whereas the data for the Virginia study was obtained during the last half of 2002. It is likely that the use of certain devices, particularly mobile phones, would have increased in the period between these two studies and this may explain why certain devices were a more common source of driver distraction in the Virginia study. As discussed earlier, however, the data from these two studies are influenced by drivers’ exposure to the various distraction sources. Those activities which drivers engage in more frequently are likely to be more common sources of distraction regardless of how distracting they are per se. As no exposure data is available, it is not possible to determine the relative levels of distraction afforded by the various sources based on the results of these studies. Experiments that compare the distracting effects of two or more in-car activities provide a much clearer picture of the relative levels of distraction afforded by different distracters, because the level of exposure to each of the activities is controlled. Numerous studies have compared the differential effects on driving performance of interacting with different in-car devices or performing different activities. A large amount of research has been conducted into the relative distracting effects of interacting both with different types of mobile phones and with mobile phones and other in-vehicle devices or activities. Studies which have examined the differential effects on driving performance of interacting with different phone types have generally revealed that using a hands-free mobile phone is no less distracting than using a hand-held phone (Haigney et al., 2000; Matthews et al., 2003; Redelmeier & Tibshirani, 1997). However, sending a text message is far more distracting than simply talking on a mobile phone (Direct Line, 2002). Research has also found that talking on a mobile phone is more distracting than holding an intelligent conversation with a passenger, but no more distracting than eating a cheeseburger (Jenness et al., 2002; RoSPA, 1997). Most commonly, however, the distracting effects of mobile phones have been compared to tuning a car radio. Although many of these studies have found that tuning a radio is less distracting than talking on a mobile phone (Department of California Highway Patrol, 1987; McKnight & McKnight, 1993; Strayer et al., 2001), some studies have revealed that tuning the radio is actually more distracting than holding a simple conversation on a mobile phone, particularly under wet conditions (Briem & Hedman, 1995; Wikman et al., 1998). One major criticism of studies that have compared the effects of mobile phones and radios is that almost every study has tested radio tuning by getting participants to turn a continuously turning knob or continuously pushing the ‘seek’ button, rather than pressing pre-set buttons. Thus, comparing mobile phone use and radio tuning using modern systems has not been tested at present, but is likely to yield more meaningful results.
23DRIVER DISTRACTION: A REVIEW OF THE LITERATURE
The driver distraction created by using route guidance systems has also been compared to the distraction caused by other in-vehicle devices and activities. One study by Tijerina and colleagues (1998) compared the distracting effects of using four different route guidance systems with dialling a number on a mobile phone and tuning the radio. They found that using all four route guidance systems created a greater distraction than dialling a mobile phone or tuning a radio. Another study by Baker and Boardman (2001) compared the distracting effects of using a route guidance system, adjusting the radio and climate control settings and accessing email. They found that the more complex tasks of using the route guidance system and accessing emails were significantly more distracting to drivers, in terms of lane position and speed variability and task completion time, than adjusting the radio and climate control settings. In addition, the distraction created by interacting with an in-car CD player has been compared to other in-car activities. Jenness et al. (2002) compared the effects of using a CD player to dialling a phone, eating a cheeseburger and reading directions on drivers’ performance. The results revealed that operating a CD player is as distracting as reading directions, and both of these activities are significantly more distracting than eating a cheeseburger or dialling a mobile phone. Another study by Gartner and colleagues (2002) examined the distraction caused by operating a CD player, a radio, route guidance system and a mobile phone. They found that drivers made more lane deviations while using the route guidance system, dialling the mobile phone or storing a station into the radio, than when operating the CD player. Finally, it is important to note that several studies have found that age can also affect the relative distracting effects of in-vehicle devices (Lam, 2002; McKnight & McKnight, 1993; Stutts et al., 2001). A recent Australian study examined the association between distraction, both inside and outside the vehicle, and the risk, for drivers of different ages, of being involved in a crash (Lam, 2002). Fatal and injury crash data collected by NSW police during the years 1996 and 2000 was examined and crashes were categorised as resulting from no distraction, distraction inside the vehicle and distraction outside the vehicle. The in-vehicle distractions included using a hand-held phone, attending to passengers, tuning the radio, adjusting the CD player and smoking. Results revealed that drivers in the 25-29 year age group had the greatest risk of being involved in a fatal or injury crash when using a hand-held mobile phone of all age groups examined. In contrast, the risk of being involved in a fatal or injury crash resulting from other in-vehicle distractions increased with increasing driver age. This result supports the findings of a study by McKnight and McKnight (1993) and is believed to result from the decreased ability of older drivers to share attention between two concurrent tasks. With regard to the finding that 25 to 29 year olds are at a greater crash risk when using a mobile phone than other age groups, Lam suggested that this may result from differential exposure to mobile phone use across age groups, rather than differences in attention sharing ability. Drivers in the 25 to 29 year age group may be more likely to use their mobile phone while driving than older drivers and this increased exposure heightened their crash risk. Overall, many studies have examined the relative distraction afforded by different in-vehicle devices and activities. However, these studies have differed in several ways, including using different variants of the same devices and activities, different methodologies (e.g., on-road studies versus simulator based studies) and comparing different combinations of devices and activities. Such differences make it difficult to
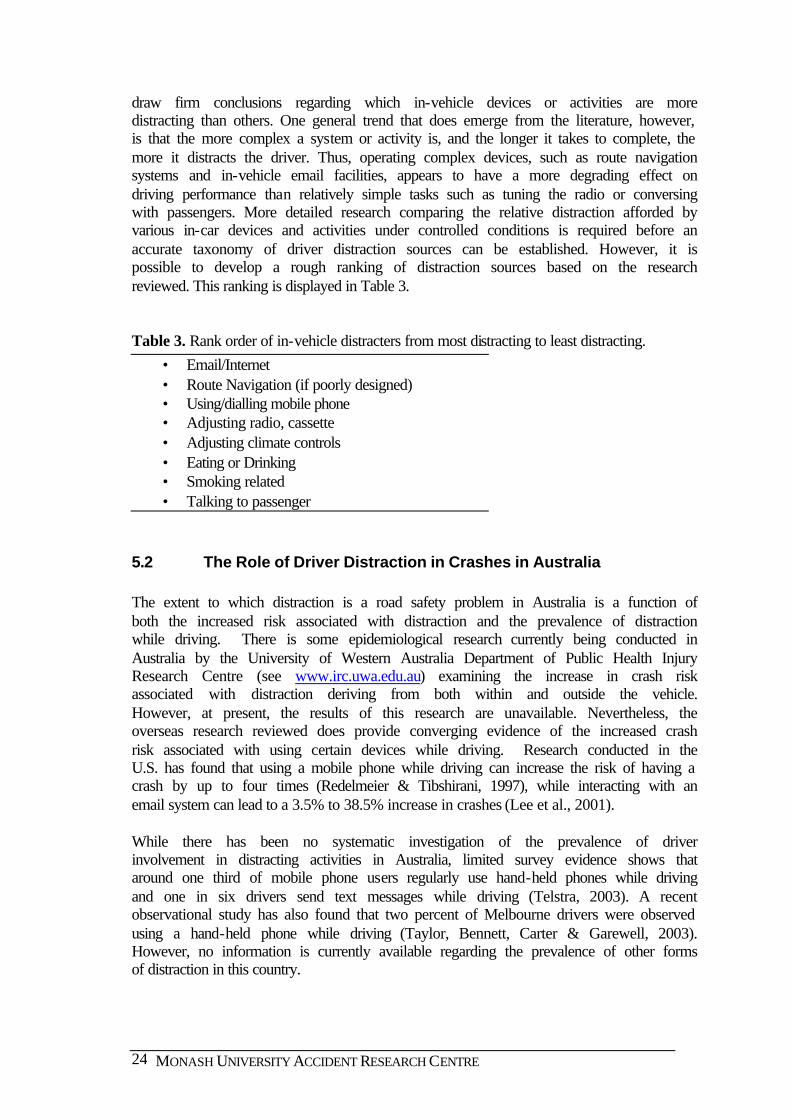
MONASH UNIVERSITY ACCIDENT RESEARCH CENTRE 24
draw firm conclusions regarding which in-vehicle devices or activities are more distracting than others. One general trend that does emerge from the literature, however, is that the more complex a system or activity is, and the longer it takes to complete, the more it distracts the driver. Thus, operating complex devices, such as route navigation systems and in-vehicle email facilities, appears to have a more degrading effect on driving performance than relatively simple tasks such as tuning the radio or conversing with passengers. More detailed research comparing the relative distraction afforded by various in-car devices and activities under controlled conditions is required before an accurate taxonomy of driver distraction sources can be established. However, it is possible to develop a rough ranking of distraction sources based on the research reviewed. This ranking is displayed in Table 3. Table 3. Rank order of in-vehicle distracters from most distracting to least distracting.
• Email/Internet • Route Navigation (if poorly designed) • Using/dialling mobile phone • Adjusting radio, cassette • Adjusting climate controls • Eating or Drinking • Smoking related • Talking to passenger
5.2 The Role of Driver Distraction in Crashes in Australia The extent to which distraction is a road safety problem in Australia is a function of both the increased risk associated with distraction and the prevalence of distraction while driving. There is some epidemiological research currently being conducted in Australia by the University of Western Australia Department of Public Health Injury Research Centre (see www.irc.uwa.edu.au) examining the increase in crash risk associated with distraction deriving from both within and outside the vehicle. However, at present, the results of this research are unavailable. Nevertheless, the overseas research reviewed does provide converging evidence of the increased crash risk associated with using certain devices while driving. Research conducted in the U.S. has found that using a mobile phone while driving can increase the risk of having a crash by up to four times (Redelmeier & Tibshirani, 1997), while interacting with an email system can lead to a 3.5% to 38.5% increase in crashes (Lee et al., 2001). While there has been no systematic investigation of the prevalence of driver involvement in distracting activities in Australia, limited survey evidence shows that around one third of mobile phone users regularly use hand-held phones while driving and one in six drivers send text messages while driving (Telstra, 2003). A recent observational study has also found that two percent of Melbourne drivers were observed using a hand-held phone while driving (Taylor, Bennett, Carter & Garewell, 2003). However, no information is currently available regarding the prevalence of other forms of distraction in this country.
25DRIVER DISTRACTION: A REVIEW OF THE LITERATURE
5.3 Current Polices and Practices for Managing Driver Distraction in Australia
The current Australian Road Rules (ARRs) contain a number of rules regarding the use of in-vehicle devices and technologies while driving that are designed to minimise driver distraction.
• Rule 300: Use of hand-held mobile phones states that: “The driver of a vehicle (except for emergency or police vehicles) must not use a hand-held mobile phone while the vehicle is moving, or is stationary but not parked, unless the driver is exempt from this rule under another law of this jurisdiction”.
A failure to obey this rule can result in a loss of demerit points (3 points in Victoria and NSW and 1 point in WA) and a fine ($135 fine in Victoria, $220 in NSW and $100 in WA).
• Rule 299: Television receivers and visual display units in motor vehicles states
that: “A driver must not drive a motor vehicle that has a television receiver or visual display unit in or on the vehicle operating while the vehicle is moving, or is stationary but not parked, if any part of the image on the screen is visible to the driver from the normal driving position or is likely to distract another driver. This rule does not apply if the visual display unit is, or is part of, a driver’s aid (e.g. closed-circuit television security cameras, dispatch system, navigational or intelligent highway and vehicle system equipment, rear-view screens, ticket-issuing machines, or a vehicle monitoring device).
While there is currently no law in Australia prohibiting the use of advanced driver assistance systems (e.g. in-vehicle navigation systems) while the vehicle is moving, many vehicle manufacturers recognise the dangers associated with using these devices while driving. In the case of in-vehicle navigation systems, some vehicle manufacturers ‘lock-out’ some navigation functions, particularly the destination entry function, when the vehicle is in motion (Farber et al., 2000). As noted elsewhere in this report, a worrying trend is the increasing use in vehicles of portable devices, such as mobile phones, Personal Digital Assistants (PDAs) and pocket PCs, which are already being used overseas to provide access to navigation, entertainment and traffic information services. There are currently in Australia no traffic regulations prohibiting the use of portable devices that might be used to access such services when they become available here.
MONASH UNIVERSITY ACCIDENT RESEARCH CENTRE 26
6. Driving Performance Variables and their Sensitivity to
Distraction
Driver distraction research has assessed the effects of various different devices and activities on numerous driving performance measures. The driving performance measures examined have most commonly included maintenance of the vehicle’s lateral position on the road, speed maintenance and control, reaction time to external events, gap acceptance, subjective workload, and attention to safe driving practices. This section of the review describes the impact of engaging in the activities and operating the devices discussed in the proceeding sections of this report (e.g., mobile phones, route guidance systems and eating) on each of these driving performance measures.
6.1 Lateral Position Lateral position refers to the position of a vehicle on the road in relation to the centre of the lane in which the vehicle should be driven. Research on the distracting effects of mobile phones suggests that a driver’s ability to maintain their lateral position on the road is adversely affected when using a mobile phone. Drivers make greater lane position deviations and exceedences while dialling or talking on either a hand-held or hands-free mobile phone, even when driving on straight roads with little other traffic (Green et al., 1993; Reed & Green, 1999). Research also suggests that drivers make a greater number of lane deviations and exceedences when manually entering destination information into a route guidance system or when following navigation instructions presented visually, rather than through voice guidance (Dingus et al., 1995; Tijerina et al., 1998). Tuning the radio or simply listening to radio broadcasts can result in a strong deterioration in driving performance, as measured by deviations from the correct lane position (Jäncke et al., 1994; Wikman et al., 1998). Interacting with a CD player while driving has also been shown to increase the number of lane deviations made by drivers (Jenness et al., 2002). However the use of voice-input, rather than manual input, to operate CD players, does significantly reduce the number of lane deviations made (Gärtner et al., 2002).
6.2 Speed Maintenance and Control Several studies have demonstrated that drivers tend to display larger variations in driving speeds and throttle control when using a mobile phone, and this has been demonstrated for hands-free as well as hand-held phones (Burns et al., 2002; Green et al., 1993; Reed & Green, 1999). In particular, drivers tend to reduce their speed when talking on a mobile phone (Burns et al., 2002; Haigney et al., 2000). Some researchers interpret these speed reductions as evidence that drivers pay less attention to maintaining their speed while using a mobile phone, while others interpret it as evidence that drivers engage in compensatory behaviours when talking on the phone in order to reduce their crash risk. In reality, it is likely that both factors are relevant.
27DRIVER DISTRACTION: A REVIEW OF THE LITERATURE
A study by Srinivasan and Jovanis (1997) also found that mean speeds were lower when drivers operated a route navigation system using manual inputs and outputs, rather than voice-activation. Operating a CD player while driving also results in lower driving speeds (Jenness et al., 2002). However, the use of voice inputs to operate these devices has been shown to reduce the likelihood of travelling at too lower speeds (Gärtner et al., 2002).
6.3 Reaction Times
Drivers’ reactions to external events or objects are generally slower when using a mobile phone, particularly when engaging in a complex conversation. A number of researchers have found that using either a hand-held or hands-free phone can increase drivers’ reactions to hazards and common road events such as traffic light changes by up to 30 percent (Brookhuis, de Vries & de Waard, 1991; Burns et al., 2002; Strayer & Johnston, 2001; STTG, 2002; Tokunaga, Hagiwara, Kagaya & Onodera, 2000). Drivers’ reaction times can also be reduced by operating a route guidance system while driving. A study by Srinivasan and Jovanis (1997) found that drivers’ reaction times to vehicles crossing their path or traffic light changes increased when using a route-navigation system which issued turn-by-turn navigation instructions. Interacting with an in-vehicle email system while driving has also been found to increase drivers’ reaction times to a periodically braking lead vehicle by 30 percent (Lee et al., 2002).
6.4 Gap Acceptance Negotiating gaps in traffic is a complex task requiring vast amounts of visual attention and cognitive resources. When using a mobile phone, drivers tend to accept shorter gaps in traffic when turning compared to when driving without using a phone (RoSPA, 1997). A study by Cooper and Zheng (2002) also found that, when using a mobile phone, drivers did not consider the weather conditions or the surface of the road when making a decision to turn across oncoming traffic. The authors concluded that when using the mobile phone and the road surface was wet, drivers initiated twice as many collisions as when not using the phone.
6.5 Workload Workload refers to the amount of cognitive resources or cognitive effort an individual has to allocate to complete a task correctly. Research shows that operating or talking on a mobile phone of any type while driving results in increased workload and greater levels of frustration, particularly when the conversation is complex or highly emotional (Harbluk et al., 2002; Matthews et al., 2003). Operating a route guidance system while driving also increases drivers’ subjective workload, particularly if the system is operated manually, rather than through voice-activation (Srinivasan & Jovanis, 1997). Interacting with an in-car email system, even when it is voice-activated, also increases drivers’ subjective workload and this workload increase is further heightened as the system becomes more complex to operate (Lee et al., 2002).
MONASH UNIVERSITY ACCIDENT RESEARCH CENTRE 28
6.6 Attention to Safe Driving Practices Research has found that when using a mobile phone or operating a CD player, drivers tend to spend less time checking their mirrors and instruments, which affects their ability to monitor and negotiate traffic safely (Burns et al., 2002; Gartner et al., 2002; Harbluk et al., 2002). The above discussion highlights that many driving performance measures are degraded by distraction. A particular driving performance measure, such as the ability to maintain lateral position on the road, can be affected by numerous in-vehicle devices and activities. Similarly, a particular device or activity can degrade numerous performance measures simultaneously, creating a cocktail for disaster. At present it is difficult to draw conclusions regarding which driving performance measures are most sensitive to distraction, given the variability across studies in the driving performance measures examined and how they are measured. However, it does appear that drivers’ ability to maintain their lane position and speed and their reaction times to external events are particularly affected by distraction. 7. Methods for Measuring Distraction
Numerous measures and techniques have been employed to measure driver distraction. These measures range from high-tech equipment such as advanced driving simulators, which are capable of measuring a range of driving performance measures, to relatively “low-tech” measures designed to measure specific aspects of distraction, such as the visual occlusion technique. This section of the report discusses the various methods that have been used to measure driver distraction and examines both their advantages and their disadvantages as measurement tools.
7.1 On-road and Test Track Studies One of the most realistic methods that has been employed to measure the distracting effects of various in-vehicle technologies is the on-road evaluation study. With this method, drivers are required to drive an instrumented vehicle for a specified period of time and driving performance data are collected using data loggers. Driving performance while interacting with the various technologies is compared against a baseline measure, usually driving when not interacting with the devices (NHTSA, 2002b). While this method yields a vast amount of data in real-world conditions, it is time consuming (taking months or years to complete) and very expensive, and thus is rarely used as a method to measure driver distraction. Short-duration on-road evaluations or test-track studies also represent real world driving and are often used to examine the distracting effects of technologies (Cooper & Zheng, 2002; Green et al., 1993; Harbluk et al., 2002). Participants are required to drive a vehicle equipped with one or more in-vehicle technologies on a test route, on actual roads or on a closed test track. Data on participants’ driving performance while interacting with the technologies is collected, either by a data logger and/or an observer, and compared against a baseline measure to determine the distraction afforded by the technologies. This method does approximate real driving conditions and driving on a closed test track does minimise the safety risks associated with driving on actual roads (Goodman et al., 1997). However,
29DRIVER DISTRACTION: A REVIEW OF THE LITERATURE
the data collected can be affected by the effects of learning to use the technologies and, in some cases, of being watched by an observer (NHTSA, 2002b). The nature of the course can also affect the data collected. If the course is relatively short and there is little or no traffic or obstacles, then the drivers may not ascribe as much priority to the driving task (and greater priority to the technologies) as they would on actual roads (Goodman et al., 1997).
7.2 Driving Simulators Research examining driver distraction often makes use of driving simulators, as they allow for a number of driving performance measures to be examined in a relatively realistic and safe driving environment. Driving simulators, however, vary substantially in their characteristics and this can affect their realism and the validity of the results obtained. High-fidelity simulators offer a realistic driving environment, complete with realistic components and layout, a coloured, textured, visual scene with roadside objects such as trees and signposts, and often have a motion base. Low-fidelity simulators offer less realistic driving environments, usually with only major markings (e.g., road line markings) reproduced in the visual scene and they are often fixed-based (Godley, Triggs & Fildes, 2001; Reed & Green, 1999). Driving simulators have a number of advantages over on-road and test-track studies. First, simulators provide a safe environment to conduct research that is too dangerous to be conducted on the road (Goodman et al., 1997). Measuring the distracting effects of certain devices on driving is one example of potentially dangerous research that is often conducted in driving simulators. Although test-tracks may be used to examine the distracting effects of devices on driving using single vehicle scenarios, using multiple-vehicle scenarios in such situations can be hazardous. Driving simulators, on the other hand, provide a safe environment for the examination of these issues using multiple vehicle scenarios, where the driver can negotiate or interact with other vehicles or road users while using certain devices (Goodman et al., 1997; Reed & Green, 1999). Second, greater experimental control can also be applied in driving simulators compared to on-road studies, as they allow the type and difficulty of driving tasks to be precisely specified and potentially confounding variables such as weather can be eliminated (Reed & Green, 1999). Third, the cost of modifying the cockpit of a simulator to address different research questions may be significantly less than modifying an actual vehicle and ensuring that the modifications are roadworthy or meet the design rules (Reed & Green, 1999). Fourth, a large number of driving performance measures can be examined in driving simulators, such as speed control and maintenance and lateral position on the road. Additional measures such as eye-movements and glance behaviour can also be collected when using simulation (Triggs, 1996). Finally, a large number of different test conditions (e.g., night and day, different weather conditions or road environments) can also be administered with relative ease, and these conditions can include hazardous or risky driving situations that would be difficult or dangerous to generate under real driving conditions (Reed & Green, 1999; Srinivasan & Jovanis, 1997; Triggs, 1996). Use of driving simulators as research tools does, however, have a number of disadvantages. First, data collected from a driving simulator includes the effects of learning to use the simulator and any in-vehicle devices and may also include the effects of being monitored by the experimenter (NHTSA, 2000b). Driving simulators,
MONASH UNIVERSITY ACCIDENT RESEARCH CENTRE 30
particularly high-fidelity simulators, can also be very expensive to install and operate and are often much more expensive than other equipment used to measure driver distraction (e.g., visual occlusion goggles) (Reed & Green, 1997). Simulator discomfort or sickness is another problem encountered with simulators, and is particularly common among older drivers (Goodman et al., 1997). However, one of the most problematic aspects of driving simulator research that has major implications for driver distraction research is the effect of the simulator on driver’s priorities in relation to the driving task and the concurrent tasks of interacting with in-vehicle devices. Driver’s behaviour and the amount of cognitive resources they devote to performing concurrent tasks while in the simulator may differ significantly from their behaviour in real cars on actual roads because there are no serious consequences that result from driving errors in the simulator (Goodman et al., 1997). Thus, a driver may glance away from the road, or remove their hands from the steering wheel for greater lengths of time when dialling a phone in a simulator than they would in the real world because their safety is not compromised. This issue is a contentious one in driving simulator research and raises the issue of the validity of driving simulators as tools for human factors research. Blaauw (1982) proposed two aspects of simulator validity. The first concerns the physical correspondence between the simulator’s components, control layout, and its response characteristics, with its real-world counterpart. This has been labelled physical validity, but is also commonly referred to as the simulator’s fidelity. The closer a simulator approximates the real-world driving environment, in terms of the design and layout of its controls, the realism of the visual scene and its physical response characteristics, the greater fidelity it is reported to have (Godley et al., 2001; Triggs, 1996). A simulator that offers a realistic visual scene complete with a coloured, textured, background and roadside objects such as signposts and trees, would have greater fidelity, for example, than one which offers a black and white representation of the roadway, with only major road line markings visible. Similarly, a simulator that has a motion-base and can simulate the kinaesthetic and motion cues present in real world driving would be considered to have greater fidelity than a fixed-based simulator (Reed & Green, 1999). The level of fidelity required by a simulator depends on the type of research that is to be conducted. It has been suggested that higher fidelity levels are required for research where the results of the simulation will be used to draw conclusions about real-world driving performance, such as would occur when assessing whether an in-vehicle device is likely to distract drivers in the real-world (Triggs, 1996). Several driving simulation studies have demonstrated how a simulator’s level of fidelity can affect driving performance. For example, previous research has found that the performance of driving tasks, such as speed control and lane performance, are less precise in fixed-based, or lower fidelity, simulators than in higher-fidelity, motion-based simulators or real vehicles due to the absence of haptic and motion cues (Blaauw, 1982; McLane & Wierwille, 1975). The second aspect of simulator validity is behavioural validity and concerns the correspondence between the way in which the driver or operator behaves in the simulator and in actual vehicles (Blaauw, 1982). The best method for determining the behavioural validity of a simulator is to compare driving performance in the simulator to driving performance in real vehicles using the same driving tasks (Blaauw, 1982). There are two levels of behavioural validity: absolute validity and relative validity. If the numerical values for certain tasks obtained from the simulator and actual vehicles are identical or near identical, absolute validity is said to have been achieved (Godley et
31DRIVER DISTRACTION: A REVIEW OF THE LITERATURE
al., 2001; Harms, 1996). Relative validity is achieved when variations in driving tasks have a similar impact, in terms of direction of change and magnitude, on driving performance in both the simulator and real vehicles (Harms, 1996). While the number of driving simulator studies is limited, research has generally found that simulators have demonstrated good relative behavioural validity for many driving performance measures, although absolute validity has rarely been demonstrated (Blaauw, 1982; Carsten, Groeger, Blana & Jamson, 1997; Godley et al., 2001; Harms, 1996; McLane & Wierwille, 1975; Reed & Green, 1999). Of most interest here is a study conducted by Reed and Green (1999) to assess the validity of a low cost driving simulator for its use in measuring the distracting effects of dialling a mobile phone. Twelve participants drove both an instrumented car along a freeway route and a driving simulator while periodically dialling a mobile phone. Measures of lane position, speed, steering wheel angle and throttle position were recorded and compared for the simulator and actual driving conditions. The results revealed that mean speeds were similar in both the simulator and the instrumented vehicle, however lane-keeping was less precise in the simulator than in the instrumented vehicle. More specifically, the variation in lane position was twice as large in the simulator than in the instrumented vehicle, and may reflect drivers’ tendency to be less cautious about making driving errors in the simulator because the consequences for doing so are far less than they are in actual vehicles. The authors concluded that the simulator demonstrated good absolute validity for speed measurements and good relative validity for the effects of the phone task on driving (Reed & Green, 1999). It should be noted however, that while the research of Reed and Green is promising in terms of a simulator’s ability to accurately measure driver distraction, demonstrating the validity of one simulator for a particular driving task does not mean that all simulators will be as equally valid. Therefore, validity information for individual simulators should be collected separately for each driving situation they are to be used for (Triggs, 1996).
7.3 Dual-task Studies Human beings only have a finite amount of cognitive processing resources to devote to performing tasks. When the concurrent performance of two tasks exceeds this resource pool, greater attention is devoted to one task and the performance of the other task is adversely affected (Reed, 1996). This can often occur in the driving situation when the driver is simultaneously trying to engage in a conversation with a passenger and negotiate traffic. Driving performance may deteriorate as the conversation becomes interesting and the driver devotes more attention to it. Alternatively, the conversation may be disrupted if the road environment suddenly becomes more hazardous. Interacting with the growing number of in-vehicle technologies is likely to degrade driving performance in much the same way as conversing with passengers, as the driver devotes greater attention to using the device and less to the driving task. Dual-task studies assess the effects of performing one task on the performance of another concurrent task. In the context of driver distraction, these studies generally examine the effects of using an in-vehicle device (e.g., mobile phone), or engaging in an activity (e.g., eating) on driving performance. Virtually all the studies reviewed in this report are dual-task studies, as they examined the effect of engaging in one task (e.g., dialling a mobile phone or entering destination information into a navigation system) on another task – driving.
MONASH UNIVERSITY ACCIDENT RESEARCH CENTRE 32
One major drawback of most of the dual-task studies reviewed, however, is that they do not examine performance trade-offs between the driving and the distraction tasks. Many studies have examined how increasing the complexity of the distraction task further influences driving performance, but few have examined how increasing the complexity of the driving task effects the performance of the distraction task. For example, would increasing the complexity of the driving environment result in less attention being devoted to the distraction task? Would drivers stop performing the distraction task altogether until the driving task required less attention, or would they still attempt to engage in the distraction task, further degrading driving performance and/or resulting in errors in the distraction task (e.g., dialling incorrect numbers on a mobile phone)? The examination of performance trade-offs is also important for another reason. Many studies measure the effect of performing two distracter tasks and assume that, if one of the tasks has a greater adverse effect on driving performance than the other that it is the most distracting task. It may be, however, that participants simply chose to devote more attention to that task (i.e., the one assumed to be most distracting) than the other, at greater expense of the driving task. In order to gain a greater understanding of the distracting effects of in-vehicle technologies, it is important for research on driver distraction to examine the performance trade-offs between the driving and the distraction tasks. One variant of dual-task studies that has recently been developed and shows promise as a tool for measuring distraction is the Peripheral Detection Task (PDT). The PDT was developed by van Winsum, Martens and Herland (1999) to measure driver mental workload and visual distraction. With this method, participants are required to perform a series of tasks while detecting and responding to targets (e.g., lights) presented in the periphery. As drivers become more distracted by the primary task, they respond slower and fail to detect more PDT targets (Olsson & Burns, 2000). Performance of the PDT task therefore provides a measure of how distracting the primary task is. While the PDT was originally developed to measure increases in driving task demands, research has recently examined whether the PDT is a valid method for measuring the level of distraction afforded by in-vehicle technologies and the results are promising. Using a driving simulator, Martens and van Winsum (1999) examined the validity of the PDT to measure increased workload and driver distraction resulting from use of a driver support system. Participants were required to drive along simulated roads and motorways while responding to a red square that was presented on the simulator screen to the driver’s periphery. At various times along the road network, participants were confronted with critical incidences such a braking lead vehicle. Participants also interacted with either a driver support system that issued tactile warnings, a driver support system that issued auditory warnings or no driver support system. Reaction times to, and detection rates of, the red light were measured and higher reaction times and failure to detect the red light were interpreted as the result of increased workload or greater distraction. The results revealed that as the complexity of the driving task increased, reaction times and failures to detect the signal also increased. PDT performance also deteriorated when speech-based, but not tactile-based, warnings were issued by the driver support system. On the basis of these results, the authors concluded that the PDT is a valid and sensitive method for measuring increases in driver workload and driver distraction resulting from messages provided by driver support systems.
33DRIVER DISTRACTION: A REVIEW OF THE LITERATURE
Olsson and Burns (2000) have examined, in a real traffic environment, whether the PDT is a valid and useful measure of driver mental workload and visual distraction caused by the use of in-vehicle systems. They had 13 participants drive along a motorway and country roads while changing a CD, tuning the radio and counting backwards. A small red light was randomly presented on the windscreen in the driver’s peripheral field of view and participants were required to respond to this light by pressing a button. PDT reaction time, hit rate, subjective mental workload and heart-rate variability were recorded and compared to baseline performance in order to assess the distracting effects of engaging in the three tasks. The PDT measure revealed significant differences between the three tasks in terms of reaction times and hit rate. Mean reaction times were slowest for the counting backwards task, while hit rates were the worst for the CD task. The authors concluded that the PDT is a sensitive measure of the visual and cognitive distraction caused by in-vehicle tasks. Furthermore, the participants deemed the detection task as acceptable to perform while driving and passengers noted that responding to the targets did not adversely affect the participants’ driving. More recently, Harms and Patten (2003) examined the sensitivity of the PDT to distinguish between different route navigation message modes. Twenty-four male professional drivers drove an instrumented car equipped with an in-vehicle information system (IVIS) for navigation, PDT-equipment and advanced data collection systems, which recorded following distance, speed variance, brake activity and lateral position on the road. Drivers drove two test routes: one using only their memory of the directions given to them and one where they were guided by a route navigation system. One-third of the participants were issued with visual navigation directions, one-third with verbal directions and one-third with both visual and verbal navigation messages. Participants were asked to respond to the PDT stimuli as soon as they detected them while still maintaining their attention to the road environment. The participants’ driving behaviour, in terms of speed variance and brake activity, was not affected by the different navigation modalities. In terms of PDT detection and hit-rate, participants’ reaction time to the stimuli was longer when interacting with the navigation system than when driving the test route from memory, however this was only significant for the full navigation condition in which participants received visual and verbal directions. Participants’ hit-rate was also lower when interacting with the navigation system than when driving from memory, particularly when they received only visual directions from the system. The authors concluded that, while the PDT task was sensitive to variation in task demand across the navigation and memory conditions, only navigation messages presented in a visual mode had a significant effect on the PDT task. They proposed that the PDT is therefore biased towards measuring the effects of visual distraction and its sensitivity to cognitive load is questionable. The authors suggested that the PDT would be best used in combination with other measures of distraction, although it should have a prominent place in the test battery given the importance of visual processing to safe driving. While the studies reviewed provide support for the PDT as a valid and useful measure of visual distraction, more research is needed to further validate the use of the PDT as a measure of cognitive load. Research should also be conducted to establish the concurrent validity of the PDT. That is, the results obtained from using the PDT need to be compared against the results obtained from using another well-validated measure of driver distraction to determine if there are any discrepancies between results. If no major discrepancies are evident, then the validity of the PDT will be further enhanced.
MONASH UNIVERSITY ACCIDENT RESEARCH CENTRE 34
7.4 Eye Glance Studies Visual behaviour while driving has been studied widely since the 1960’s (Farber et al., 2000). One aspect of drivers’ visual behaviour that has been the focus of widespread attention is the visual distraction caused by the use of in-car devices such as radios, phones and climate control systems. Two approaches for measuring visual demand or distraction are used: eye glance recordings and the visual occlusion technique. The eye glance technique measures visual behaviour by recording the frequency and duration of eye glances at particular objects in the driver’s visual field (Farber et al., 2000). When drivers perform a secondary task while driving, they usually complete this task through a series of brief glances (1 to 2 seconds) at the object interspersed with glances at the roadway. Eye glance studies record and measure the frequency and duration of glances towards the secondary task which gives a measure of the total “eyes off road time”, and hence the visual demand or interference associated with performing the task (Haigney & Westerman, 2001). Total eyes-off-road-time is a widely accepted and valid measure of the visual demand associated with the performance of a secondary task and is highly correlated with the number of lane excursions committed during secondary task performance (Curry, Greenberg & Blanco, 2002; Haigney & Westerman, 2001). Eye glance behaviour has traditionally been measured by using a video recorder to record the driver’s eye and hand movements. The time consuming process of analysing the tapes frame-by-frame is then conducted to obtain the eye glance data (Farber et al., 2000). Today, sophisticated head and eye tracking devices have simplified this process and allow for the real-time measurement of frequency and duration of eye glances, scan paths, eye-closures, and over-the-shoulder head turns. The FaceLAB system developed by Seeing Machines with funding from Volvo is one example of a promising head and eye gaze tracker. FaceLAB is a video-based tracking system that works in real-time, eliminating the video transcription process. It is not intrusive to the driver and is capable of tracking head and eye movements under different lighting, vibration and head motion conditions (Seeing Machines, 2002). The validity of the FaceLAB system as a measure of visual behaviour has been evaluated by researchers at Volvo and the Australian National University (Victor, Blomberg & Zelinsky, 2001). They compared the measurement performance of the FaceLAB system with the traditional method of video transcription for six tasks (e.g., adjusting climate controls and reading a test message) carried out by participants while driving in a fixed-based driving simulator. The results revealed high correlations between the FaceLAB system and the video transcription for the measures of task length, total glance time, glance frequency and glance duration. The authors concluded that the FaceLAB system is a valid measure of the visual distraction associated with the performance of several in-vehicle tasks and is an easy to use and efficient method for testing the safety of in-vehicle systems.
7.5 The Visual Occlusion Technique Despite the advantages of new eye tracking equipment, these systems are often expensive, time consuming and technically difficult to install and calibrate (Farber et al., 2000). Visual Occlusion is an alternative method for measuring the visual behaviour of drivers. This method is based on the assumption that drivers only need to observe the
35DRIVER DISTRACTION: A REVIEW OF THE LITERATURE
roadway part of the time and the rest of the time is available for other purposes, such as interacting with in-vehicle devices. With this technique, the driver’s vision is partially or fully occluded through the use of a shield/visor or another similar device that opens and shuts at various time intervals. The aim of the method is to simulate an on-road situation where the driver is interacting with a device while driving. The phase where the driver’s vision is occluded simulates the time they are looking at the road, while the open phase represents the time that they are looking at the in-vehicle device. Using this method it is possible to evaluate whether an in-vehicle task (e.g., tuning the radio) can be successfully carried out using only short glances or small amounts of visual attention (typically only 1 to 2 seconds) and if it can be easily resumed after interruption. If a task can be carried out using only short, periodic, glances it is classed as “chunkable”. The assumption is that a task that can be chunked is acceptable to be carried out while driving, while a task that cannot be chunked is not acceptable to perform while driving (Fagerstrom, Fichtenberg & Karlsson, 2001; Green & Tsimhoni, 2001; NHTSA, 2000b). There are many methods for achieving occlusion including the eyes closed method, full windshield LCD, motorcycle helmet with visor, LCD goggles and LCD face shield. However, only the latter three methods are commonly used as they provide the greatest control and are technically feasible (Green & Tsimhoni, 2001). Numerous studies have evaluated the validity of the visual occlusion technique as a measure of visual distraction (Baumann, Rösler, Jahn & Krems, in press; Eckstein, 2001; Fagerstrom et al., 2001; Keinath, Baumann, Gelau, Bengler & Krems, 2001; Tsimhoni & Green, 1999; Wooldridge, Bruer, Green & Fitzpatrick, 1999). With a few exceptions, these studies have found that the visual occlusion technique is a valid and reliable research tool for measuring the visual demand associated with various in-vehicle devices and interfaces. Krems and colleagues (ISO, 2000) have conducted one of the most comprehensive series of laboratory and on-road studies examining the validity and reliability of the visual occlusion technique as a method to evaluate in-vehicle interfaces. In a series of laboratory studies, Krems and colleagues examined the ability of the visual occlusion technique to distinguish between tasks of differing complexity and between tasks that are, or are not, easily resumed after interruption. The results of these studies revealed that the visual occlusion technique is capable of distinguishing between displays and tasks of different visual complexity and can validly discriminate between those tasks that can be easily resumed after an interruption and those that cannot. Based on these results, the authors concluded that the visual occlusion technique is a valid measure for identifying HMI designs that are not suitable for use while driving. Krems and colleagues have also evaluated the use of the visual occlusion technique in an on-road study. Participants were required to enter destination information into a navigation system under one of three conditions: in a parking lot without occlusion, in a parking lot with occlusion and on the road. Results showed that the occlusion method produces a comparable cognitive load to real traffic situations and is suitable for the simulation of real-world conditions (Keinath et al., 2001). Recently, Bauman and colleagues (in press) examined the validity of the visual occlusion and PDT as measures of visual distraction. This study was carried out as part of the ADAM (Advanced Driver Attention Metrics) project, a joint initiative between DaimlerChrysler and BMW to gain a better understanding of attentional demands
MONASH UNIVERSITY ACCIDENT RESEARCH CENTRE 36
placed on drivers by in-vehicle technologies and activities. Briefly, the main aims of the ADAM project are to assess the influence of performing secondary tasks, such as operating in-vehicle devices, on driving performance and to identify and evaluate the validity of several measurement techniques that can be used during the design and development phase of new systems to assess their potential to distract drivers (Breuer, Bengler, Heinrich & Reichelt, in press). A set of 12 in-vehicle secondary tasks were developed and used in all the experiments carried out during the ADAM project, allowing for the results obtained across studies to be compared. These tasks included radio tuning, sound adjustment, cassette changing, destination entry, pointing to certain points on a navigation map, entering information into a mobile phone, unwrapping a sweet, talking on the phone, unfolding a tissue, looking up an address in an address book, examining a paper map and retrieving coins from a purse. Baumann and colleagues had 24 drivers complete the set of 12 in-car tasks under a baseline condition, under a visual occlusion condition and under a PDT condition. Under the occlusion condition, participants’ vision was occluded for 2800 to 3200 milliseconds while performing each task. Under the PDT condition, participants were required to detect and respond to a visual stimulus presented on a wall directly in front of them while completing the in-car tasks. As a validation criterion, the results obtained with these two measures were compared with eye-movement data obtained from a simulator study that used the same in-vehicle tasks (Bengler, Huesmann & Praxenthaler, in press). Results revealed that the participants completed the in-car tasks in the shortest amount of time under the baseline condition and had the longest completion times under the occlusion condition. There was also a significant correlation found between the visual occlusion and PDT conditions in the order in which the tasks were ranked as more or less visually demanding. Moderately high correlations were also found between the results of the occlusion (r = 0.70) and PDT tasks (r = 0.71) and the eye-movement data collected from the simulator study. The authors concluded, on the basis of these results, that both the visual occlusion and PDT are valid methods for measuring the visual demand associated with the operation of in-vehicle devices and activities (Baumann et al., in press). Visual occlusion is deemed by many researchers to be a potentially promising technique for evaluating the visual distraction associated with the use of in-vehicle devices, as it is relatively inexpensive and easy to use. The technique also allows for various aspects of a system to be evaluated including: chunkability, completion time, ease of resumption after interruption and visual complexity. However, to date, only limited research has evaluated the validity of the visual occlusion technique as a measure of driver distraction and what research has been conducted appears to be largely un-coordinated. Indeed, there seems to be little consensus in the literature regarding the best means of achieving occlusion, the length of the interval periods, whether the occlusion and inspection intervals should be computer or self-paced and if they should be fixed or variable, the level of training given to participants and whether a distracter task is necessary during the occlusion interval to prevent participants from rehearsing their next move or operation during this period. Clearly, further validation and standardisation of the visual occlusion technique and its parameters both inside and outside the laboratory are required. A more comprehensive review of the visual occlusion technique as a measure of driver distraction is currently being prepared by the UK Transport Research Laboratory (TRL; Stevens, A, personal communication, October 21, 2003).
37DRIVER DISTRACTION: A REVIEW OF THE LITERATURE
7.6 The 15-second Rule The Society of Automotive Engineers (SAE) has developed a standard for assessing the maximum allowable level of distraction afforded by the use of in-vehicle navigation systems (Farber et al., 2000). This standard establishes a design limit for the total time required to input information into navigation systems while the vehicle is in motion. In essence, it states: “All navigation functions that are accessible by the driver while the vehicle is in motion, shall have a statistically measured total task time of less than 15 seconds” (Farber et al., 2000, pg.7). That is, if an in-vehicle task can be completed within 15 seconds or less in a stationary vehicle, then that function can be available to drivers while the vehicle is moving. While this standard was developed to assess route navigation systems, it can also be applied to evaluate the distraction afforded by any in-vehicle technology and has an advantage over many other measurement techniques of being simple to use. The 15-second rule was evaluated by Tijerina and colleagues to determine how well the results from static vehicles correspond to the results collected from a moving vehicle (Tijerina et al., 2000). Ten participants, five females and five males, aged 55 to 69, drove around a 7.5-mile test track in an instrumented vehicle. While driving, participants were required to enter destination details into four different route guidance systems, three requiring visual-manual input and one requiring voice input. As comparison tasks, participants were required to tune the radio, dial familiar and unfamiliar phone numbers on a mobile phone and adjust the Heating, Ventilation and Air Conditioning (HVAC) controls. Results revealed that the correlations between task completion time in a static vehicle and task completion time in a moving vehicle were low. Surprisingly, some tasks took less time to complete while the vehicle was moving than when it was static. Completion of the comparison tasks also often took longer than 15 seconds to complete while the vehicle was moving. The authors concluded that the 15-second rule was effective in identifying the most distracting tasks, but did this no better than would a 30-second rule. They also raised the concern that the static test was not sufficient to identify tasks with significant distraction potential. Several other limitations of the rule were also noted including its failure to address issues of speed maintenance or object detection, a failure to address whether and how a task may be chunked (e.g., whether an in-vehicle task can be carried out using only short glances or small amounts of visual attention), and there are no baselines against which to measure driving performance while completing a task (Tijerina et al., 2000). Nonetheless, some researchers do believe that the 15-second rule does achieve its fundamental purpose of reducing the performance of tasks with long completion times while the vehicle is moving and, with revision, may provide a guide for designers as to what in-vehicle systems should and should not be available to drivers while driving (Farber et al., 2000; NHTSA, 2000b).
7.7 What is the Most Promising Measure of Driver Distraction? When examining driver distraction researchers are faced with a range of measurement techniques and methods that they could potentially use. There is, however, no single best measure of driver distraction, although researchers have agreed that objective measures are typically better than subjective measures (Kantowitz, 1992). The most appropriate method to use depends to a great extent on what aspect, or aspects, of driver
MONASH UNIVERSITY ACCIDENT RESEARCH CENTRE 38
distraction are being examined. If measuring the visual distraction afforded by an in-vehicle system, methods such as the PDT or the visual occlusion technique are likely to be the most appropriate. However, researchers have also suggested that these two measurement techniques are appropriate for different types of assessment: the PDT is likely to be more appropriate if the level of visual demand or workload required by a particular device is the focus of the research, and the visual occlusion technique is likely to be more appropriate if the focus of the research is to assess whether a task, such as a destination entry task, can be completed in a series of glances or whether it requires sustained visual attention for a period of time (Gelau, 2002). Furthermore, while being inexpensive and simple to use, these measures only measure specific aspects of driver distraction – visual distraction. In terms of safety, validity and the ability to measure many driving performance measures and in-vehicle tasks simultaneously, the driving simulator appears to be a very promising tool for measuring driver distraction. The introduction of high fidelity simulators which offer realistic visual scenes and kinaesthetic and motion cues has increased the realism of driving simulators so that they more closely resemble real driving environments. As well as offering a realistic driving environment, simulators also offer a safe environment to test the distracting effects of in-vehicle devices, as the safety consequences of veering out of the correct lane or failing to brake are eliminated. A number of in-vehicle devices (e.g., navigation system, CD player, mobile phone) can be equipped to the driving simulator and a number of driving performance measures are also capable of being measured simultaneously, potentially reducing the number and length of testing sessions needed to evaluate a range of in-vehicle systems. Finally, simulators can be used in combination with other measures of distraction, such as eye tracking equipment, the visual occlusion method and the PDT, and are therefore capable of measuring many more aspects of distraction than other distraction measures alone. Another important, but often underrated, aspect to consider when measuring driver distraction is the selection of an appropriate baseline measure against which to compare driving performance when interacting with various devices. There is no single “best” baseline measure and researchers have questioned some of the baseline measures that have been used in previous research. For example, studies that have examined the distracting effects of mobile phones have often used radio tuning as a baseline comparison, claiming that if using a mobile phone is no more distracting than tuning the radio then it is an acceptable task to perform while driving. However, this conclusion is based on the assumption that tuning the radio is actually an acceptable task to perform while driving. The research reviewed earlier in this report suggests that radio tuning can indeed distract the driver and degrade driving performance (Briem & Hedman, 1995; Wikman et al., 1998). Moreover, many mobile phone studies have examined the effects of the radio task using a continuous tuning dial, not the pre-set buttons found on many modern radio systems. Use of this type of interface is likely to require a greater amount of time to tune a station than simply pressing a pre-tuned button. This may have increased the distracting effects of the radio-tuning task and, thus, may have led to erroneous conclusions regarding the acceptability of using mobile phones while driving. Other studies have compared the distracting effects of in-vehicle technologies with unrelated forms of driver impairment such as having a blood alcohol concentration above the legal limit (Burns et al., 2002). The use of such forms of driver impairment as a baseline measure in driver distraction
39DRIVER DISTRACTION: A REVIEW OF THE LITERATURE
research has been questioned by researchers on the basis that they are two different, unrelated forms of driver impairment (Stevens, 2002). Finally, many research studies have simply compared driving while interacting with an in-vehicle system with driving while not interacting with any system. It is likely that the most appropriate baseline measure is likely to differ depending on the type of in-vehicle system and the specific aspects of distraction being evaluated. However it appears that an appropriate baseline measure is one that does not interfere with the primary task of driving, as this would ensure that any conclusions based on comparisons with the baseline task about the distracting effects of an in-vehicle system are valid. In summary, there is no one best measurement tool for measuring driver distraction. Rather, the particular technique, or sub-set of techniques, that are most appropriate will depend on the particular aspect of the HMI to be assessed, and in particular on the form of distraction (e.g., visual, physical, etc) that is imposed on the driver by that aspect of the interface. With the exception of on-road and test track studies, and the 15-second rule, all of the methods discussed above are considered suitable for use in distraction research. On-road studies are more dangerous to conduct and are less experimentally controlled than simulator studies, and there is some doubt in the literature about the validity of the 15-second rule. 8. Conclusion
In this report we reviewed the accumulating body of literature on driver distraction, focussing specifically on in-vehicle distraction. The overall aims of the review were to: review what is known about the effects of in-vehicle distraction on driver performance and safety; review the range of techniques that have been used to measure and quantify the effects of distraction on driver performance; identify future research needs in the area; and recommend countermeasures for minimising driver distraction. The first section of the report discussed the impact of technology-based distractions (e.g., mobile phones, route navigation and email/internet) and non-technology-based distractions (e.g., conversing with passengers, eating/drinking and smoking) on driving performance. The relative influence of the various technology and non-technology based distractions on driving performance was also examined and the driving performance variables (e.g., speed maintenance and reaction time) that seem to be most sensitive to specific distracters were identified. In the second half of the report, the various methods that have been used to measure distraction were described and the measurement techniques that appear most promising in being able to accurately measure in-vehicle distraction were identified. As noted previously, this report was concerned about sources of distraction deriving from within the vehicle. We did not review the body of research relating to sources of distraction deriving from outside the vehicle, such as billboards. It was beyond the scope of the review to do so. Obviously, however, the degree to which a driver is distracted from the primary driving task is a function of the total distraction deriving from both within and outside the vehicle.
MONASH UNIVERSITY ACCIDENT RESEARCH CENTRE 40
In this, final, section of the report we summarise the key findings that emerge from the literature review and make recommendations for future research and countermeasure development for minimising distraction.
8.1 Summary of Key Findings The following are the key findings that emerged from this literature review:
8.1.1 Mobile Phones
• Many studies have found that using a hands-free phone while driving is no safer than using a hand-held phone (Haigney, Taylor & Westerman, 2000; Matthews et al. 2003; Redelmeier & Tibshirani, 1997). Using a mobile phone while driving can increase the risk of being involved in a collision by up to four times (Redelmeier & Tibshirani, 1997).
• Research suggests that both the physical and cognitive distraction caused by using mobile phones while driving can significantly impair a driver’s visual search patterns, reaction times, decision-making processes and their ability to maintain speed, throttle control and lateral position on the road (Green et al., 1993; Reed & Green, 1999).
• Mobile phone use also often involves associated tasks that may further distract the driver. These activities can include accessing written information such as a phone number on a piece of paper or writing dates or notes in diaries.
• Sending a text message is far more distracting than simply talking on a mobile phone (Direct Line, 2002).
• Research has found that talking on a mobile phone is more distracting than holding an intelligent conversation with a passenger, but no more distracting than eating a cheeseburger (Jenness et al., 2002; RoSPA, 1997).
8.1.2 Route Guidance Systems
• Entering destination information is believed to be the most distracting task associated with the use of a route guidance system, however use of voice input technology can reduce the distraction associated with this task.
• Route guidance systems that present navigation instructions using voice output are less distracting and more usable than those systems that present the information on a visual display.
• Route guidance systems with voice recognition technology are a more ergonomic and safer option than systems that require visual-manual entry (Tijerina et al., 1998).
• Route guidance systems that provide turn-by turn instructions, rather than presenting complex holistic route information, are less distracting to the driver and present the most useable means of navigation (Dingus et al., 1995).
41DRIVER DISTRACTION: A REVIEW OF THE LITERATURE
8.1.3 Email and Internet Facilities
• Some researchers believe that speech-based email systems have the potential to distract drivers and undermine road safety (Burns & Lansdown, 2002; Technical Insights, 2001). As a result, a growing number of system designers are recognising that speech-based systems are not a panacea for driver distraction and are focusing on developing alternative interfaces such as those that rely on tactile feedback.
8.1.4 Entertainment Systems
• Tuning a radio while driving appears to have a detrimental effect on driving performance, particularly for inexperienced drivers.
• Research also suggests that simply listening to radio broadcasts while driving can impair driving performance (Jäncke et al., 1994).
• Research suggests that operating a CD player while driving is more distracting than dialling a mobile phone and eating, however the use of voice-activation may minimise this distraction.
8.1.5 Non-Technology Based Distraction
• A recent study by the American Automobile Association’s Foundation for Traffic Safety revealed that a greater proportion of drivers involved in traffic accidents are distracted by eating or drinking (1.7%) than by talking on a mobile phone (1.5%) (Stutts et al., 2001). Results of an experimental study by Jenness et al. (2002) also corroborate the results of Stutts et al. They found that eating a cheeseburger was as distracting as using a voice-activated dialling system, but less distracting than continuously operating a CD player.
• Several studies have found that smoking while driving increases the risk of being involved in a crash (Brison, 1990; Christie, 1990; Violanti & Marshall, 1996).
• A summary of current research on teenage passengers revealed that the presence of passengers increases crash risk, particularly for younger drivers, and this is believed to result largely from distraction and peer-pressure (Williams, 2001).
Overall, there is evidence that both technology-based and non-technology-based distractions can have a detrimental effect on driving performance. The extent, however, to which distraction compromises safety is dependent on the frequency with which the driver is exposed to the source of distraction in question. Very little, if anything, is currently known in Australia, or in other countries, about the relative frequency with which technology and non-technology-based tasks are performed.
8.2 Recommended Distraction Measurement Techniques In addition to reviewing what is known about both technology and non-technology-based distractions deriving from within the vehicle, the authors reviewed the various
MONASH UNIVERSITY ACCIDENT RESEARCH CENTRE 42
scientific techniques which have been used to measure driver distraction and the measures of driving performance (e.g., lane keeping) which appear to be sensitive to the different types of distraction. The following scientific techniques for measuring distraction were identified:
• on-road and test track studies; • driving simulator studies; • dual-task studies; • eye glance monitoring studies; • the visual occlusion method; • the peripheral detection task; and • the 15 Second Rule.
The findings of this review suggest that using a range of distraction measurement techniques, rather than a single technique, would be appropriate in evaluating HMI design concepts and prototypes in vehicles. The particular technique, or sub-set of techniques, employed, however, will depend on the particular aspect of the HMI to be assessed, and in particular on the form of distraction (e.g., visual, physical etc) that is imposed on the driver by that aspect of the interface. With the exception of on-road and test track studies and the 15-second rule, all of the above methods are considered suitable for use in HMI evaluation studies. On-road studies are obviously more dangerous to conduct and are less experimentally controlled than simulator studies and there is some doubt in the literature about the validity of the 15-second rule.
8.3 Countermeasures for Minimising Distraction There is converging evidence that driver distraction contributes to road trauma and that the prevalence of distraction as a risk factor will increase as new technologies proliferate the market. It is important, therefore, that policies and programs are developed and implemented in Australia to manage existing and emerging risks associated with driver distraction. The following countermeasures are recommended.
8.3.1 Research
• A carefully designed study of the prevalence of driver involvement in distracting activities within the vehicle should be undertaken. This information, combined with the epidemiological data from the previously mentioned study being conducted by the University of Western Australia Department of Public health Injury Research Centre, will enable an initial assessment of the magnitude of the problem in Australia to be made. If driver distraction is shown to be a significant problem, then better recording by Police of the role of distraction in crashes will be needed.
• An inventory of existing and emerging technologies and services which can be accessed on-board the vehicle or through portable devices carried into the vehicle should be compiled. From this, research is needed to develop a taxonomy of driver distractions that defines the different sources of distraction deriving from within the vehicle and categorises them according to how distracting they are in absolute and relative terms.
43DRIVER DISTRACTION: A REVIEW OF THE LITERATURE
• Research is required to better understand drivers’ willingness to engage in potentially distracting tasks while driving, the factors that influence this willingness and under what conditions drivers engage in distracting tasks.
• There is currently little knowledge regarding how drivers use in-vehicle technologies: whether they use them in the manner intended by the designer; and at what point (or threshold) and under what conditions they become a distraction.
• Research needs to be conducted into whether and how individual difference factors such as age, gender, driving skill and experience influences the ease with which drivers are distracted.
• To complement the above activities, research is needed to develop a taxonomy of distracting events and objects occurring outside the vehicle. As for sources of distraction deriving from within the vehicle, research is needed to quantify how distracting they are in absolute and relative terms, alone and in combination with internal distracters. Some research on this issue is being undertaken by the Monash University Accident Research Centre and this should be closely monitored.
• There is a need to develop objective, standardised, measures of distraction in order to enable more accurate comparisons of results across studies (NHTSA, 2002a).
• Further research is needed on alternative modes of input and output, such as tactile feedback and voice activation, to determine whether these interaction methods are a safe and viable alternative to manual entry systems.
• The operation of certain on-board and portable technologies, such as mobile phones, often involves associated tasks such as writing down phone numbers and address details on pieces of paper. There is a need for research to design the HMI so that it eliminates as far as possible the need for these secondary tasks.
• No research, to the knowledge of the authors, has examined the potentially distracting effects of portable devices used by pedestrians and other road users (e.g., mobile telephones, pedestrian navigators) to access information and services when negotiating their way by means other than driving through the road system.
• The overall costs and benefits afforded by various technologies must be assessed before restricting or prohibiting drivers from engaging in distracting tasks while driving. Listening to a radio broadcast, for example, might be distracting: yet, for a truck driver, this activity might be beneficial in maintaining vigilance.
8.3.2 Education and Training
• A good deal is already known about the risks associated with engaging whilst driving in various distracting activities. It is important that these are brought to the attention of drivers and passengers. As a matter of priority, it is important to make the motoring public aware that hands-free mobile phones can be just as distracting as hand-held phones.
• As with the use of mobile phones, drivers must be educated and trained in the optimal manner in which to interact with existing and emerging on-board
MONASH UNIVERSITY ACCIDENT RESEARCH CENTRE 44
technologies and services accessed through portable devices in order to minimise distraction.
• Where there is flexibility in the manner in which these devices can be operated (there are, for example, many ways to tune and select a radio station), user manuals and tutorials provided by vehicle manufacturers and service providers should point out the most ergonomic and least distracting methods for doing so.
8.3.3 Legislation and Enforcement • Existing legislation should be reviewed and, where necessary, new legislation
created to limit driver exposure to, and deter drivers from engaging in, activities which have the potential to distract them. There is sufficient evidence, for example, to justify a ban on the use of hands-free phones whilst driving if this can be practically enforced by the Police.
8.3.4 Vehicle Design • The most effective way to minimise technology-based distraction is to design
the Human Machine Interface (HMI) ergonomically. In Europe, North America and Japan, draft standards have already been developed which contain performance based goals which must be reached by the HMI so that the in-car technologies do not distract or visually entertain the driver while driving (e.g., the European Statement of Principles for Driver Interactions with Advanced In-vehicle Information and Communication systems). It is important that the development of these standards be closely monitored by relevant authorities in Australia and that local vehicle manufacturers and system developers are encouraged to refer to these standards in designing their systems.
• The operation of certain devices including mobile phones and route guidance systems often involves associated tasks such as accessing written information, which can further distract the driver. There is a need for research to develop the HMI so that it eliminates the need for these associated tasks.
8.3.5 Licensing • Handbooks for learner and probationary drivers should draw attention to the
potential risks associated with engaging in distracting activities within the vehicle.
• Knowledge tests should include items pertaining to the relative risks associated with engaging in these activities.
• Where appropriate, the graduated licensing system should be used to restrict driver exposure to distracting activities that are known to compromise safety. The findings presented here, for example, suggest that there is a case for restricting Probationary drivers from using (but not carrying) mobile phones while driving during some or all of the P-period.
There is converging evidence that driver distraction is contributing to road trauma, in Australia and overseas. If not taken seriously by the road safety community, driver distraction has the potential to escalate into a major road safety problem in Australia. Fortunately, however, we are at an early enough stage in the evolution of driver distraction to prevent it from doing so.
45DRIVER DISTRACTION: A REVIEW OF THE LITERATURE
References
Anderson, D., Abdalla, A., Pomietto, B., Goldberg, C. N., & Clement, V. (2001).
Distracted driving: Review of current needs, efforts and recommended strategies. George Mason University, Centre for the Advancement of Public Health, VA.
Baker, G. E., & Boardman, A. J. (2001). Human factors studies of vehicle interior
products – Interactive driving simulator applied research. SAE 2001 World Congress, Detroit, MI.
Baumann, M., Rösler, D., Jahn, G., & Krems, J. F. (in press). Assessing driver
distraction using occlusion method and peripheral detection task. Chemnitz University of Technology, Department of Psychology, Chemnitz, Germany.
Beirness. D. J., Simpson. H. M., & Pak. A. (2002) The Road Safety Monitor: Driver
distraction. Traffic Injury Research Foundation. Ontario, Canada. http://www.trafficinjuryresearch.com/publications/PDFpublications/RSM_DriverDistraction.pdf
Bengler, K., Huesmann, A., & Praxenthaler, M. (in press). Investigation of Visual
Demand in a static driving simulator within the ADAM project. BMW Group, Munich, Germany.
Blikman, G. (1988). A new method for traffic safety research on driver distraction.
Traffic Safety Theory and Research Methods, Amsterdam, Netherlands. Blaauw, G. J. (1982). Driving experience and task demands in simulator and
instrumented car: A validation study. Human Factors, 24, 473-486. Breuer, J., Bengler, K., Heinrich, C., & Reichelt, W. (in press). Development of
advanced driver attention metrics (ADAM). DaimlerChrysler and BMW, Germany.
Briem, V., & Hedman, L. R. (1995). Behavioral effects of mobile telephone use during
simulated driving. Ergonomics, 38, 2536-2562. Brison, R. J. (1990). Risk of automobile accidents in smokers. Canadian Journal of
Public Health, 81, 102-106. Brookhuis, K. A., de Vries, G., & de Waard, D. (1991). The effects of mobile phone
telephoning on driving performance. Accident Analysis and Prevention, 23, 309-316.
Burns, P. C., & Lansdown, T. C. (2000). E-distraction: The challengers for safe and
useable internet services in vehicles. On-line paper. Available at www.nrd.nhtsa.dot..gov/departments/nrd-13/driver-distraction/welcome.htm.
Burns, P. C., Parkes, A., Burton, S., Smith, R. K., & Burch, D. (2002). How dangerous
is driving with a mobile phone? Benchmarking the impairment to alcohol, TRL Report TRL547. TRL Limited, Berkshire, United Kingdom.
MONASH UNIVERSITY ACCIDENT RESEARCH CENTRE 46
California Highway Patrol (2002). A special report to the legislature on the findings of the mobile phone safety study. Author, USA.
Canada Safety Council (2002). Eyes on the road, hands on the wheel. Available at
www.safety-council.org/info/traffic/distract.html. Carsten, O. M. J., Groeger, J. A., Blana, E., & Jamson, A. H. (1997). Driver
performance in the EPSRC Driving Simulator (LADS): A validation study. Final report for EPSRC project GR/K56162.
Christie, R. (1991). Smoking and traffic accident involvement: A review of the
literature. GR/91-3. VicRoads, Victoria, Australia. Cooper, P. J., & Zheng, Y. (2002). Turning gap acceptance decision-making: impact of
driver distraction. Journal of Safety Research, 33, 321-335. Crash Avoidance Metrics Partnership (CAMP). (2000). Proposed driver workload
metrics and methods project. On-line paper. Available at www.nrd.nhtsa.dot..gov/departments/nrd-13/driver-distraction/welcome.htm.
Curry, D. G. (2002). In-vehicle cell phones: Fatal distraction? Professional Safety, 47
(3), 28-33. Curry, R., Greenberg, J., & Blanco, M. (2002). An alternate method to measure driver
distraction. Intelligent Transportation Society of America’s Twelfth Annual Meeting and Exposition, USA.
Dingus, T., McGehee, D., Hulse, M., Jahns, S., & Manakkal, N. (1995). Travtrek
evaluation task C3 – Camera Car study. Report No. FHWA-RD-94-076. Office of Safety and Traffic Operations, McLean, VA.
Direct Line (Motor Insurance). (2002). The Mobile Phone Report: A report on the
effects of using a hand-held and a hands-free mobile phone on road safety. Direct Line Insurance Croydon. United Kingdom.
Eckstein, L. (2001). Daimler Chrysler assessment of driver distraction – the DC
approach. Exploring the Occlusion Technique: Progress in recent research and applications, Turin, Italy.
European Commission. (2001). Report of the expert group on the expansion of the
principles on human machine interface for in-vehicle information and communication systems. Author.
Fagerstrom, M., Fichtenberg, N., & Karlsson, R. (2001). How different occlusion
intervals affect total shutter open time. Volvo Car Company, Sweden. Falkmer, T., Nilsson, L., & Tornros, J. (2000). Detection and identification of
information presented peripherally inside the car – effects of driving task demands, stimulus position and direction of motion of the stimulus. VTI Report 461A-2000. Swedish National Road and Transport Research Institute, Sweden.
47DRIVER DISTRACTION: A REVIEW OF THE LITERATURE
Farber, E., Foley, J., & Scott, S. (2000). Visual attention design limits for ITS in-vehicle systems: The Society of Automotive Engineers standard for limiting visual distraction while driving. Transportation Research Board Annual General Meeting, Washington DC.
Feindt, U. (2001). Telematics and Driver Distraction. ITS World, 6, 12-13. Ferguson, S. A. (2003). Other high-risk factors for young drivers – how graduated
licensing does, doesn’t, or could address them. Journal of Safety Research, 34, 71-77.
Furnham, A., & Strbac, L. (2002). Music is as distracting as noise: the differential
distraction of background music and noise on the cognitive test performance of introverts and extroverts. Ergonomics, 45, 203-217.
Gartner, U., & Konig, W., & Wittig, T. (2002). Evaluation of manual vs. speech input
when using a driver information system in real traffic. On-line paper. Available at http://ppc.uiowa.edu/driving-asse…nt%20Papers/02_Gartner_Wittig.htm.
Gelau, C. (2002). HMI Topic 2.1 Measuring driver distraction. ATLANTIC Forum on
driver distraction. www.atlan-tic.net. Glaze, A. L., & Ellis, J. M. (2003). Pilot study of distracted drivers. Report prepared for
Virginia Commonwealth University, Transportation and Safety Training Centre, VA, USA.
Godley, S. T., Triggs, T. J., & Fildes, B. N. (2001). Driving simulator validation for
speed research. Accident Analysis and Prevention, 34, 589-600. Goodman, M. J., Bents, F. D., Tijerina, L., Wierwille, W., Lerner, N., & Benel, D.
(1997). An investigation of the safety implications of wireless communication in vehicles. Department of Transportation, NHTSA, Washington, DC.
Green, P., Hoekstra, E., & Williams, M. (1993). Further on-the-road tests of driver
interfaces: examination of a route guidance system and car phone. Report No. UMTRI-93-35. University of Michigan Transportation Research Institute, Ann Arbor, MI.
Green, P., & Tsimhoni, O. (2001). Visual occlusion to assess the demands of driving
tasks: the literature. Exploring the Occlusion Technique: Progress in recent research and applications, Turin, Italy.
Haigney, D., & Taylor, R. G. (1998). Mobile phone use while driving: Phone operation
vs. vehicle transmission. RoSPA, United Kingdom. Haigney, D., & Westerman, S. J. (2001). Mobile phone use and driving: a critical
review of research methodology. Ergonomics, 44, 132-143.
MONASH UNIVERSITY ACCIDENT RESEARCH CENTRE 48
Haigney, D. E., Taylor, R. G., & Westerman, S. J. (2000). Concurrent mobile (cellular) phone use and driving performance: task demand characteristics and compensatory processes. Transportation Research Part F, 3, 113-121.
Harbluk, J. L., Noy, Y. I., Eizenman, M. (2002). The impact of cognitive distraction on
driver visual behaviour and vehicle control, TP No. 13889 E. Transport Canada, Canada.
Harms, L. (1992). Experimental studies of dual-task performance in a driving simulator:
The relationship between task demands and subjects’ general performance. IATSS Research, 16, 35-41.
Harms, L., Patten, C. (2003). Peripheral detection as a measure of driver distraction. A
study of memory-based versus system-based navigation in a built-up area. Transportation Research Part F, 6, 23-36.
Horberry, T., Anderson, J., Regan, M. A., Triggs, T. J., & Brown, J. (2003). Driver
distraction: the effects of concurrent in-vehicle tasks, road environment complexity and age on driving performance. Manuscript submitted for publication.
Hurwizt, J. B., & Wheatley, D. J. (2002) Using driver performance measures to estimate
workload. Proceedings of the Human Factors and Ergonomics Society 46th Annual Meeting, Pittsburgh, PA.
Hway-liem, O. (2002). Mogelijke veiligheidseffecten van navigatiesystemen. R-2002-
30. SWOV, Leidschendam, Netherlands. ISO (2000). Evaluating visual display designs in vehicles: advantages and
disadvantages of the occlusion technique. ISO/TC 22/SC 13/WG 8 N263. Ito, H., Uno, H., Atsumi, B., & Akamatsu, M. (2001). Visual distraction while driving:
Trends in research and standardisation. IATSS Research, 25, 20-28. Jancke, L., Musial, F., Vogt, J., & Kalveram, K. T. (1994). Monitoring radio programs
and time of day affect simulated car driving performance. Perceptual Motor Skills, 79, 484-486.
Japanese National Police Agency. (1996) Study of Injury Producing Crashes during
June, 1996. Daily Automobile Newspaper, Japan. Jenness, J. W., Lattanzio, R. J., O’Toole, M., & Taylor, N. (2002). Voice-activated
dialling or eating a cheeseburger: Which is more distracting during simulated driving? Proceedings of the Human Factors and Ergonomics Society 46th Annual Meeting, Pittsburgh, PA.
Kantowitz, B. H. (1992). Selecting measures for human factors research. Human
Factors, 34, 387-398.
49DRIVER DISTRACTION: A REVIEW OF THE LITERATURE
Keinath, A., Baumann, M., Gelau, C., Bengler, K., & Krems, J. F. (2001). Evaluation of in-vehicle HMI using occlusion techniques: Experimental results and practical implications. Exploring the Occlusion Technique: Progress in recent research and applications, Turin, Italy.
Lam, L. T. (2002). Distractions and the risk of car crash injury. The effects of drivers
age. Journal of Safety Research, 33, 411-419. Lee, J. D., Caven, B., Haake, S., & Brown, T. L. (2001). Speech-based interaction with
in-vehicle computers: The effects of speech-based E-mail on drivers’ attention to the roadway. Human Factors 45, 631-639.
Lesch, M.F., & Hancock, P.A. (in press). Driving performance during concurrent cell-
phone use: are drivers aware of their performance decrements? Accident Analysis and Prevention.
Manser, M. P., & Even, D. M. (2002). Effect of distraction complexity on driving
performance and emergency event response. Proceedings of the Human Factors and Ergonomics Society 46th Annual Meeting, Pittsburgh, PA.
Martens, M. H., & van Winsum, W. (1999). Measuring distraction: the Peripheral
Detection Task. Online paper. Available at www.nrd.nhtsa.dot..gov/departments/nrd-13/driver-distraction/welcome.htm.
Matthews, R., Legg, S., & Charlton, S. (2003). The effect of cell phone type on drivers
subjective workload during concurrent driving and conversing. Accident Analysis and Prevention, 35, 441-450.
McKnight, A. J., & McKnight, A. S. (1993). The effect of cellular phone use upon
driver attention. Accident Analysis and Prevention, 25, 259-265. McLane, R. C., & Wierwille, W. W. (1975). The influence of motion and audio cues on
driver performance in an automobile simulator. Human Factors, 17, 488-501. NHTSA. (2000a). Driver distraction expert working group meetings: Summary and
proceedings. On-line paper. Available at www.nrd.nhtsa.dot..gov/departments/nrd-13/driver-distraction/welcome.htm.
NHTSA. (2000b). Internet Forum on Driver Distraction. Available at
www.nrd.nhtsa.dot..gov/departments/nrd-13/driver-distraction/welcome.htm Nowakowski, C., Friedman, D., & Green, P. (2001). Cell phone ring suppression and
HUD caller ID: Effectiveness in reducing momentary driver distraction under varying workload levels. The University of Michigan, Transportation Research Institute (UMTRI), Technical Report UMTRI-2001-29.
Olsson, S., & Burns, P. C. (2000). Measuring distraction with a peripheral detection
task. On-line paper. Available at www.nrd.nhtsa.dot..gov/departments/nrd-13/driver-distraction/welcome.htm.
MONASH UNIVERSITY ACCIDENT RESEARCH CENTRE 50
Peters, G. A., & Peters, B. J. (2001). The distracted driver. The Journal of The Royal Society for the Promotion of Health, 121, 23-28.
Ranney, T. A., Garrott, W. R., & Goodman, M. J. (2000). NHTSA driver distraction
research: past, present and future. On-line paper. Available at www.nrd.nhtsa.dot..gov/departments/nrd-13/driver-distraction/welcome.htm.
Redelmeier. D. A., & Tibshirani. R. J. (1997) Association between Cellular Telephone
Calls and Motor Vehicle Collisions. The New England Journal of Medicine, 336(7), 453-458.
Reed, M. P., & Green, P. A. (1999). Comparison of driving performance on-road and in
low-cost simulator using a concurrent telephone dialling task. Ergonomics, 42, 1015-1037.
Reed, S. K. (1996). Cognition: Theory and applications (4th ed.). Pacific Grove, CA:
Brooks/Cole Publishing. Regan, M. A., & Mitsopoulos, E. (2001). Understanding passenger influences on driver
behaviour: implications for road safety and recommendations for countermeasure development. Report No. 180. Monash University Accident Research Centre, Victoria, Australia.
Regan, M. A., Oxley, J. A., Godley, S. T., & Tingvall, C. (2001). Intelligent transport
system: Safety and human factors issues. Report No. 01/01. Report prepared by the Monash University Accident Research Centre for the Royal Automobile Club of Victoria (RACV), Australia.
RoSPA (2002) The Risk of Using a Mobile Phone While Driving. On-line paper.
Available at http://www.rospa.org.uk/pdfs/road/mobiles/report.pdf RoSPA. (1997). Mobile phones and driving: A literature review. The Royal Society for
the Prevention of Accidents, United Kingdom. Seeing Machines (2002) FaceLAB frequently asked questions.
www.seeingmachines.com. Srinivasan, R., & Jovanis, P. P. (1997). Effect of in-vehicle route guidance systems on
driver workload and choice of vehicle speed: Findings from a driving simulator experiment. In Y. I. Noy (Ed.). Ergonomics and safety if intelligent driver interfaces. New Jersey: Lawrence Erlbaum Associates, Publishers.
Stevens, A. (2002). HMI Topic 2.1 Measuring driver distraction. ATLANTIC Forum
on driver distraction. Available at www.atlan-tic.net. Strayer, D. L., Drews, F. A., Albert, R. W., Johnston, W. A. (2002). Cell phone induced
perceptual impairments during simulated driving. On-line paper. Available at http://ppc.uiowa.edu/driving-asse…ent%20Papers/03_Strayer_David.htm.
51DRIVER DISTRACTION: A REVIEW OF THE LITERATURE
Strayer, D. L., Drews, F. A., & Johnston, W. A. (2003). Cell-phone induced failures of visual attention during simulated driving. Journal of Experimental Psychology: Applied, 9, 23-32.
Strayer, D. L., & Johnston, W. A. (2001). Driven to Distraction: Dual-task studies of
simulated driving and conversing on a cellular telephone. Psychological Science, 12, 462-466.
STTG. (2002). Effect of cellular telephone use on choice response time in a simulated
driving task and tracking accuracy in a simple tracking task. Surface Transportation Technical Group, USA.
Stutts, J. C., Reinfurt, D. W., Staplin, L., & Rodgman, E. A. (2001). The role of driver
distraction in traffic crashes. Report prepared for AAA Foundation for Traffic Safety, Washington, DC.
Stutts, J. C., Feaganes, J., Rodgman, E., Hamlett, C., Meadows, T., Reinfurt, D., Gish,
K., Mercadante, M., & Staplin, L. (2003). Distractions in everyday driving. Report prepared for AAA Foundation for Traffic Safety, Washington, DC.
Taylor, D., Bennett, D. M., Carter, M., Garewell, D. (2003). Mobile telephone use
among Melbourne drivers: a preventable exposure to injury risk. Medical Journal of Australia, 179, 140-142.
Technical Insights. (2001). Human-vehicle interface. Report No. 003. Technical
Insights. Telstra. (2003). Telstra, Police and NRMA Insurance join forces to target mobile phone
use on Australian roads. Telstra News Release. www.telstra.com.au/newsroom. Tijerina, L., Johnston, S., Parmer, E., Winterbottom, M. D., & Goodman, M. (2000).
Driver distraction with wireless telecommunications and route guidance systems. DOT HS 809-069. NHTSA, Washington, DC.
Tijerina, L., Parmer, E., & Goodman, M. J. (1998). Driver workload assessment of route
guidance system destination entry while driving: A test track study. Proceedings of the 5th ITS World Congress, Seoul, Korea.
Tokunaga, R. A., Hagiwara, T., Kagaya, S., & Onodera, Y. (2000). Effects of
conversation through cellular telephone while driving on driver reaction time and subjective mental workload. Transportation Research Board, Washington, DC.
Treat, J. R. (1980). A study of pre-crash factors involved in traffic accidents. HSRI
Research Review, 10/11, 1-35. Triggs, T. J. (1996). Driving simulation for railway crossing research. Paper prepared
for the Seventh International Symposium on Railroad-Highway Grade Crossing Research and Safety – Getting Active at Passive Crossings, Monash University, Clayton, Australia.
MONASH UNIVERSITY ACCIDENT RESEARCH CENTRE 52
Tsimhoni, O., & Green, P. A. (1999). Visual demand of driving curves as determined by visual occlusion. Paper presented at the Vision in Vehicles Conference.
Velichkovsky, B. M., Dornhoefer, S. M., Kopf, M., Helmert, J., & Joos, M. (2002).
Change detection and occlusion modes in road-traffic scenarios. Transportation Research Part F, 5, 99-109.
van Winsum, W., Martens, M., & Herland, L. (1999). The effect of speech versus tactile
driver support messages on workload, driver behaviour and user acceptance. TNO-report TM-99-C043. Soesterberg, Netherlands.
Victor, T. (2000). A technical platform for driver inattention research. On-line paper.
Available at: www.nrd.nhtsa.dot..gov/departments/nrd-13/driver-distraction /welcome.htm.
Victor, T., Blomberg, O., & Zelinsky, A. (2001). Automatic driver visual behaviour
measurement. In A.G. Gale et al. (Eds.), Vision in Vehicles 9. Elsevier Science. B.V.
Violanti, J. M., & Marshall, J. R. (1996). Cellular phones and traffic accidents: An
epidemiological approach. Accident Analysis and Prevention, 28, 265-270. Violanti. J. (1998) Cellular phones and fatal traffic collisions. Accident Analysis and
Prevention 30, 519-524 Wang, J. S., Knipling, R. R., & Goodman, M. J. (1996). The role of driver inattention in
crashes: New statistics from the 1995 Crashworthiness Data System. 40th Annual Proceedings of the Association for the Advancement of Automotive Medicine, Vancouver, Canada.
Wheatley, D. J. (2000). The driving need for human factors in the car of the future.
Society of Automotive Engineers, Warrendale, PA. Wikman, A-S., Nieminen, T., & Summala, H. (1998). Driving experience and time
sharing during in-car tasks on roads of different width. Ergonomics, 41, 358-372. Williams, A. F. (2001). Teenage passengers in motor vehicle crashes: A summary of
current research. Insurance Institute for Highway Safety, Arlington, VA. Wooldridge, M., Bauer, K., Green, P., & Fitzpatrick, K. (1999). Comparison of driver
visual demand in test track, simulator, and on-road environments. Prepared for Transportation Research Board, 79th Annual Meeting, Washington DC.