Embed Size (px)
Citation preview

Abstract Front crashworthiness evaluations by the Insurance Institute for Highway Safety include driver (left)
side small overlap (25%) frontal crash tests at 64 km/h with a rigid, radius‐edged flat barrier. Ratings are based
on occupant compartment structural integrity, driver dummy injury measures, and analysis of restraints and
dummy kinematics. Additional tests offset to the passenger (right) side were conducted with seven small SUVs
rated Good in left‐side tests to compare small overlap crash protection for drivers and front passengers. Provi‐
sional ratings based on right‐side tests ranged from Good to Poor. Higher right‐side occupant compartment
structural intrusion was the main reason for different assessments of driver and front passenger protection. Ad‐
ditionally, some near‐side front passenger dummies recorded higher forces on their outboard legs than their
near‐side driver counterparts. While injury measures from far‐side driver dummies suggest lower risk compared
with near‐side counterparts, observations of inadequate restraint system performance reveal a need to further
investigate their relevance with real‐world far‐side driver injuries. These results indicate a need for auto manu‐
facturers to consider both sides of the vehicle when developing front small overlap crash protection strategies
and may also indicate a need to include the driver dummy in right‐side evaluations of frontal small overlap
crashworthiness.
Keywords Far‐side, Front passengers, Near‐side, Small overlap tests, Structural symmetry
I. INTRODUCTION
The Insurance Institute for Highway Safety (IIHS) has conducted driver‐side (left) small overlap frontal crash
tests (64 km/h and 25% overlap) against a rigid, radius‐edged flat barrier as part of its consumer information
test program since 2012. Crashworthiness ratings are based on the structural integrity of the occupant com‐
partment, injury measures from a driver Hybrid III midsize male dummy, and analysis of restraints and dummy
kinematics. Many vehicles initially rated Poor, mainly because of collapse of the occupant compartment in the
area of the driver. The small overlap crash configuration is challenging because the frame rails and other struc‐
tures typically designed to manage crash energy are bypassed. Manufacturers have responded quickly to the
need for structural improvements for driver‐side small overlap protection. Since 2012, 97 models have been
structurally redesigned for small overlap crashes, and most designs were successful, with 72% receiving Good
ratings after the changes.
Three manufacturers — Honda, Volvo, and Subaru — have identified and documented their structural design
strategies to improve performance in the small overlap test [1‐6]. These strategies are typically achieved by
modifications to the vehicle structures, as shown in Fig. 1.
Fig. 1. Main vehicle structures identified for improvement in small overlap performance.
B.C. Mueller is Senior Research Engineer (email: [email protected]; tel: +1 434‐985‐4600) and J.M. Nolan is Chief Administrative Officer and Senior Vice President at the Insurance Institute for Highway Safety in Ruckersville, VA, USA.
Comparison of Vehicle Structure and Occupant Responses in
Driver‐ and Passenger‐Side IIHS Small Overlap Frontal Crash Tests
Becky C. Mueller and Joseph M. Nolan
IRC-16-83 IRCOBI Conference 2016
- 620 -

Modifications include: visible rigid structures attached to the bumper beam, side frame, or engine cradle
forward of the wheel well; stronger upper inner‐fender (shotgun) structures tied into the main frame rail or
other energy‐absorbing structures; stronger occupant compartment firewall and doorframe structures such as
the A‐pillar, hinge pillar, rocker panel, and floorpan; and wheel and suspension modifications to promote energy
absorption and prevent the wheel from intruding into the occupant compartment.
A 2014 study by Mueller et al. [7] found that other automakers are employing similar strategies with changes
to at least some of these structural elements. All vehicles studied included reinforced occupant compartment
structure, but the most effective designs also included use of energy‐absorbing inner‐fender structures and the
addition of early engagement structures to induce vehicle lateral translation. This study also revealed that in
some of these vehicles, the countermeasures appeared to be applied only to the left side.
The IIHS small overlap front test currently only includes a driver dummy and is conducted with the barrier
overlapping the left side. Thus, as an initial attempt to improve front small overlap crashworthiness, left‐side
improvements are a reasonable strategy for automakers, especially as the driver seat is always (or nearly al‐
ways) occupied in real crashes. However, consumers likely reasonably expect that crashworthiness ratings are
meaningful for all seating positions. Moreover, analysis of real‐world injury data shows that right front passen‐
gers, when present, are at risk for injuries. In 2014, 1,673 right front passengers were killed in frontal crashes in
the United States [8]. A 2009 study of injured occupants in frontal crashes in vehicles with Good IIHS moderate
overlap ratings found 17% of case occupants were right front passengers [9]. Additionally, 24% of injured drivers
in small overlap configurations were located on the non‐struck side, and the majority of injuries were attributed
to inadequate restraint system performance. Ultimately, one would expect similar levels of protection for both
drivers and right front passengers in near‐side small overlap crashes.
The objective of this study was to examine the level of protection afforded to right front passengers in right‐
side small overlap crashes compared with drivers in left‐side crashes with the same small overlap configuration.
Additionally, the protection for drivers in left‐side and right‐side small overlap frontal crashes is also compared.
II. METHODS
Seven small SUV models that received Good IIHS overall ratings in small overlap left‐side tests following the
implementation of structural countermeasures were chosen for this study: 2015 Honda CR‐V, 2015 Toyota
RAV4, 2016 Hyundai Tucson, 2015 Subaru Forester, 2015 Buick Encore, 2014 Nissan Rogue, and 2015 Mazda CX‐
5 were subjected to right‐side small overlap tests. Right‐side small overlap tests were also performed on the
previous generation CR‐V and RAV4 prior to the implementation of any small overlap countermeasures in order
to compare the degrees of improvement on the driver and passenger sides.
Left‐Side Test Setup
All left‐side small overlap tests were conducted at a nominal speed of 64.4 km/h (40 mi/h) and a nominal 25% overlap with the IIHS small overlap barrier. All test setup and measurements followed the IIHS small over‐lap test protocol [10]. An instrumented Hybrid III midsize male dummy was installed in the driver seat for all tests. The dummy was seated according to the University of Michigan Transportation Research Institute (UMTRI) ATD positioning procedure [11], and grease paint was applied to the dummy’s head to document head contact locations, according to the IIHS small overlap frontal crash test protocol [10]. Dummy instrumentation included sensors in the head, neck, chest, and lower extremities. Comparison data include measures of structural defor‐mation, dummy injury metrics, and restraint system and dummy kinematics assessments.
Right‐Side Test Setup
All right‐side small overlap tests were prepared and conducted to match the paired left‐side tests, following the protocols in terms of test speed, configuration, overlap, and data, but offset to the right side [10]. Vehicles with the same trim levels and wheel types as the driver‐side tests were chosen to reduce variation.
The following test setup modifications were made: In addition to the instrumented Hybrid III midsize male driver dummy seated according to the UMTRI ATD positioning procedure [11], an additional Hybrid III midsize male dummy was installed in the right front passenger seat according to the Federal Motor Vehicle Safety Standard No. 208 procedure. Four onboard high‐speed cameras were installed focusing on the driver and right front passenger dummies to capture dummy kinematics and interaction with the restraint system. The overall vehicle test mass allowance was increased by 85 kg for the mass of the extra dummy and equipment.
IRC-16-83 IRCOBI Conference 2016
- 621 -

Structural intrusion targets were measured pre‐and post‐crash to evaluate structural deformation on the right‐side occupant compartment. The locations of these targets were chosen to compare with the standard left‐side intrusion targets [10], but also modified when necessary to capture structural intrusion relevant to the right front passenger seating position. For example, the steering wheel target is not relevant to a right front pas‐senger. Instead, a target on the dash in front the dummy, called center dash, provides a measure of the upper dash intrusion toward the dummy’s head and chest. A comparison of all intrusion target locations is shown in Fig. 2. Targets that can be compared directly are shown in Table I.
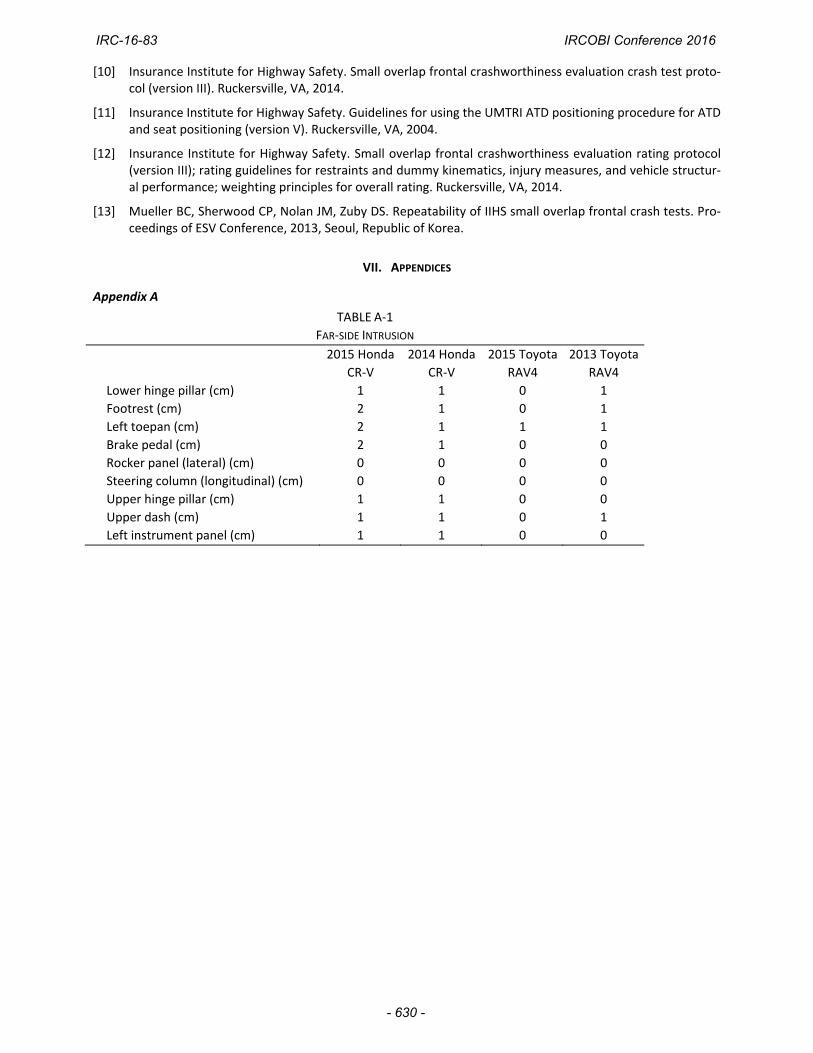
In the right‐side tests of the Honda CR‐V and Toyota RAV4, the standard driver‐side intrusion targets were recorded as well. This was discontinued in later testing because intrusion on the non‐struck side was found to be very low, on average 1 cm, even in vehicles with significant intrusion on the struck side.
Fig. 2. Locations of driver (left) and passenger (right) side intrusion targets.
TABLE I COMPARATIVE DRIVER AND PASSENGER – SIDE INTRUSION TARGETS
Driver‐side target Passenger‐side target
Upper hinge pillar Upper hinge pillar
Left instrument panel Right instrument panel
Steering wheel Center dash
Left toepan Right toepan
Brake pedal Center toepan
Upper dash Upper dash
Footrest Footrest
Lower hinge pillar Lower hinge pillar
Rocker panel (lateral) Rocker panel (lateral)
Comparing Left‐ and Right‐Side Tests
Three aspects of left‐side and right‐side tests were compared: dummy sensor measures, restraint system performance, and vehicle structure. Dummy sensor measures were compared for all instrumented body regions of the Hybrid III midsize male dummies: head, neck, chest, and lower extremities. Dummy kinematics were de‐termined using high‐speed video footage, excursion measurements, and contact evidence from paint transfer. Vehicle structural comparison was based on the pre‐ and post‐crash measurements between the standard driv‐er‐side intrusion targets [10] and the passenger‐side targets described previously in Table I.
Vehicle Ratings
Dummy sensor measures, restraint system performance, and vehicle structure are combined into an overall
rating for comparing vehicle performance. The ratings criteria for driver‐side small overlap impacts are in the
IIHS ratings protocols [12]. The left‐side criteria were modified to create comparable provisional ratings for the
right‐side impacts.
The right‐side structural rating was based on the same ratings logic as described in the IIHS ratings protocol
IRC-16-83 IRCOBI Conference 2016
- 622 -
[12], but for each of the driver‐side targets, the comparable passenger target is substituted (Table I). The driver
parking brake pedal target had no passenger side comparison and was excluded from the rating.
Rating of dummy injury measures follows the driver side protocol [12], but both the far‐side driver and near‐
side passenger dummy are included in the overall evaluation and carry equal weight.
The driver restraints and kinematics downgrades as stated in the official protocol [12] were applied directly
to the far‐side driver dummy, with the following modification for the near‐side passenger dummy: The demerit
count for head‐to‐airbag interaction for the passenger dummy was changed from one to two points for partial
and three points for minimal head‐to‐airbag interaction, accounting for the protection needed for a wide range
of possible occupant kinematics without the presence of a steering‐wheel‐mounted airbag.
The overall rating is based on the same number of overall points as the driver‐side rating protocol.
III. RESULTS
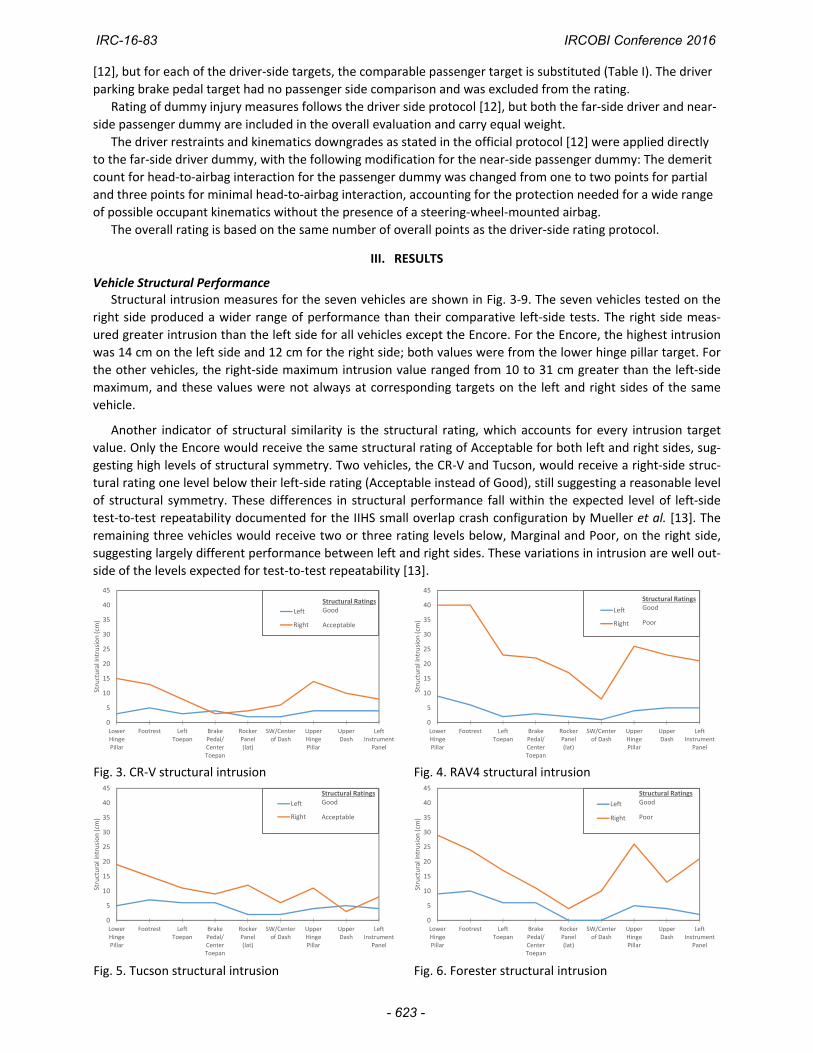
Vehicle Structural Performance Structural intrusion measures for the seven vehicles are shown in Fig. 3‐9. The seven vehicles tested on the
right side produced a wider range of performance than their comparative left‐side tests. The right side meas‐
ured greater intrusion than the left side for all vehicles except the Encore. For the Encore, the highest intrusion
was 14 cm on the left side and 12 cm for the right side; both values were from the lower hinge pillar target. For
the other vehicles, the right‐side maximum intrusion value ranged from 10 to 31 cm greater than the left‐side
maximum, and these values were not always at corresponding targets on the left and right sides of the same
vehicle.
Another indicator of structural similarity is the structural rating, which accounts for every intrusion target
value. Only the Encore would receive the same structural rating of Acceptable for both left and right sides, sug‐
gesting high levels of structural symmetry. Two vehicles, the CR‐V and Tucson, would receive a right‐side struc‐
tural rating one level below their left‐side rating (Acceptable instead of Good), still suggesting a reasonable level
of structural symmetry. These differences in structural performance fall within the expected level of left‐side
test‐to‐test repeatability documented for the IIHS small overlap crash configuration by Mueller et al. [13]. The
remaining three vehicles would receive two or three rating levels below, Marginal and Poor, on the right side,
suggesting largely different performance between left and right sides. These variations in intrusion are well out‐
side of the levels expected for test‐to‐test repeatability [13].
0
5
10
15
20
25
30
35
40
45
LowerHingePillar
Footrest LeftToepan
BrakePedal/CenterToepan
RockerPanel(lat)
SW/Centerof Dash
UpperHingePillar
UpperDash
LeftInstrument
Panel
Structural Intrusion (cm
)
Left
Right
Structural RatingsGood
Acceptable
0
5
10
15
20
25
30
35
40
45
LowerHingePillar
Footrest LeftToepan
BrakePedal/CenterToepan
RockerPanel(lat)
SW/Centerof Dash
UpperHingePillar
UpperDash
LeftInstrument
Panel
Structural Intrusion (cm
)
Left
Right
Structural RatingsGood
Poor
Fig. 3. CR‐V structural intrusion Fig. 4. RAV4 structural intrusion
0
5
10
15
20
25
30
35
40
45
LowerHingePillar
Footrest LeftToepan
BrakePedal/CenterToepan
RockerPanel(lat)
SW/Centerof Dash
UpperHingePillar
UpperDash
LeftInstrument
Panel
Structural Intrusion (cm
)
Left
Right
Structural RatingsGood
Acceptable
0
5
10
15
20
25
30
35
40
45
LowerHingePillar
Footrest LeftToepan
BrakePedal/CenterToepan
RockerPanel(lat)
SW/Centerof Dash
UpperHingePillar
UpperDash
LeftInstrument
Panel
Structural Intrusion (cm
)
Left
Right
Structural RatingsGood
Poor
Fig. 5. Tucson structural intrusion Fig. 6. Forester structural intrusion
IRC-16-83 IRCOBI Conference 2016
- 623 -
0
5
10
15
20
25
30
35
40
45
LowerHingePillar
Footrest LeftToepan
BrakePedal/CenterToepan
RockerPanel(lat)
SW/Centerof Dash
UpperHingePillar
UpperDash
LeftInstrument
Panel
Structural Intrusion (cm
)Left
Right
Structural RatingsAcceptable
Acceptable
0
5
10
15
20
25
30
35
40
45
LowerHingePillar
Footrest LeftToepan
BrakePedal/CenterToepan
RockerPanel(lat)
SW/Centerof Dash
UpperHingePillar
UpperDash
LeftInstrument
Panel
Structural Intrusion (cm
)
Left
Right
Structural RatingsAcceptable
Poor
Fig. 7. Encore structural intrusion Fig. 8. Rogue structural intrusion
0
5
10
15
20
25
30
35
40
45
LowerHingePillar
Footrest LeftToepan
BrakePedal/CenterToepan
RockerPanel(lat)
SW/Centerof Dash
UpperHingePillar
UpperDash
LeftInstrument
Panel
Structural Intrusion (cm
)
Left
Right
Structural RatingsAcceptable
Marginal
Fig. 9. CX‐5 structural intrusion
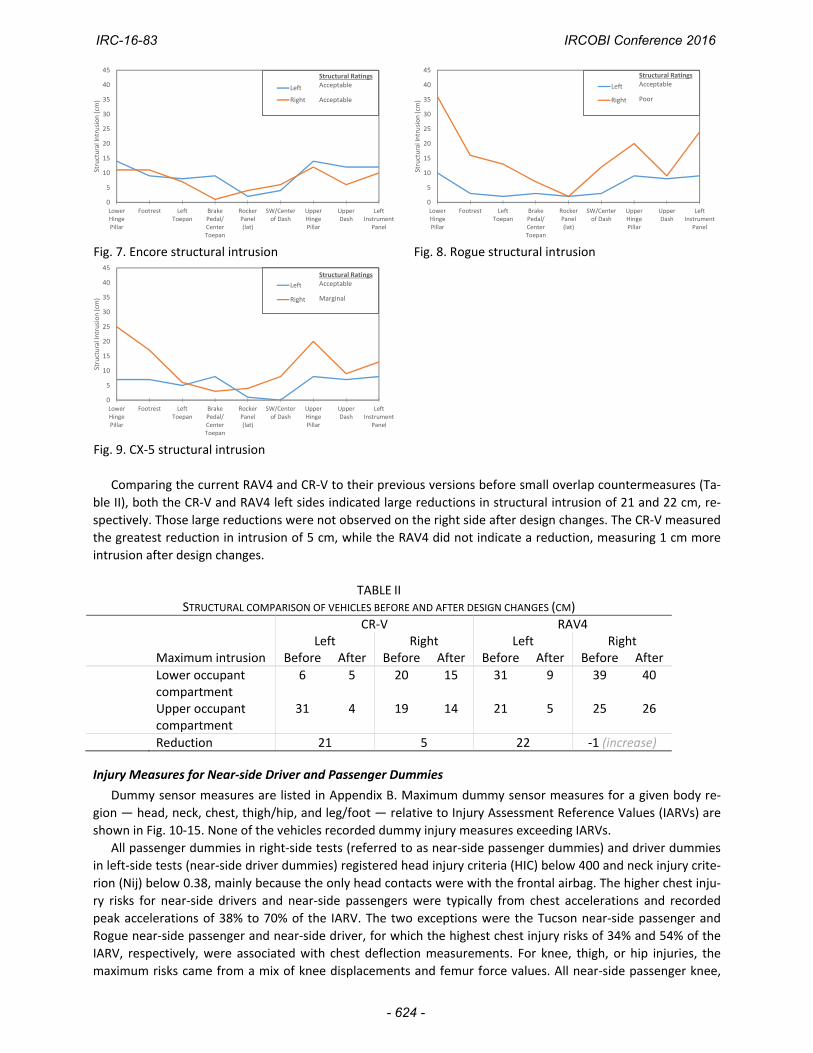
Comparing the current RAV4 and CR‐V to their previous versions before small overlap countermeasures (Ta‐
ble II), both the CR‐V and RAV4 left sides indicated large reductions in structural intrusion of 21 and 22 cm, re‐
spectively. Those large reductions were not observed on the right side after design changes. The CR‐V measured
the greatest reduction in intrusion of 5 cm, while the RAV4 did not indicate a reduction, measuring 1 cm more
intrusion after design changes.
TABLE IISTRUCTURAL COMPARISON OF VEHICLES BEFORE AND AFTER DESIGN CHANGES (CM)
CR‐V RAV4 Left Right Left Right Maximum intrusion Before After Before After Before After Before After
Lower occupant compartment
6 5 20 15 31 9 39 40
Upper occupant compartment
31 4 19 14 21 5 25 26
Reduction 21 5 22 ‐1 (increase) Injury Measures for Near‐side Driver and Passenger Dummies
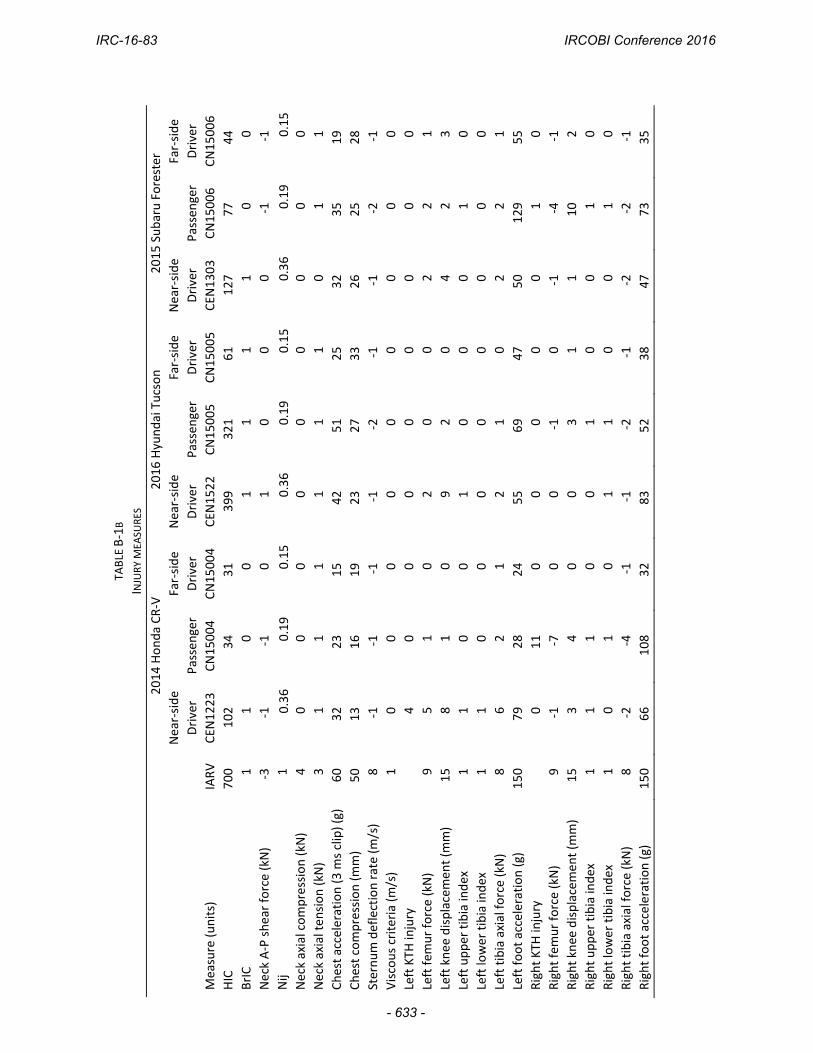
Dummy sensor measures are listed in Appendix B. Maximum dummy sensor measures for a given body re‐
gion — head, neck, chest, thigh/hip, and leg/foot — relative to Injury Assessment Reference Values (IARVs) are
shown in Fig. 10‐15. None of the vehicles recorded dummy injury measures exceeding IARVs.
All passenger dummies in right‐side tests (referred to as near‐side passenger dummies) and driver dummies
in left‐side tests (near‐side driver dummies) registered head injury criteria (HIC) below 400 and neck injury crite‐
rion (Nij) below 0.38, mainly because the only head contacts were with the frontal airbag. The higher chest inju‐
ry risks for near‐side drivers and near‐side passengers were typically from chest accelerations and recorded
peak accelerations of 38% to 70% of the IARV. The two exceptions were the Tucson near‐side passenger and
Rogue near‐side passenger and near‐side driver, for which the highest chest injury risks of 34% and 54% of the
IARV, respectively, were associated with chest deflection measurements. For knee, thigh, or hip injuries, the
maximum risks came from a mix of knee displacements and femur force values. All near‐side passenger knee,
IRC-16-83 IRCOBI Conference 2016
- 624 -
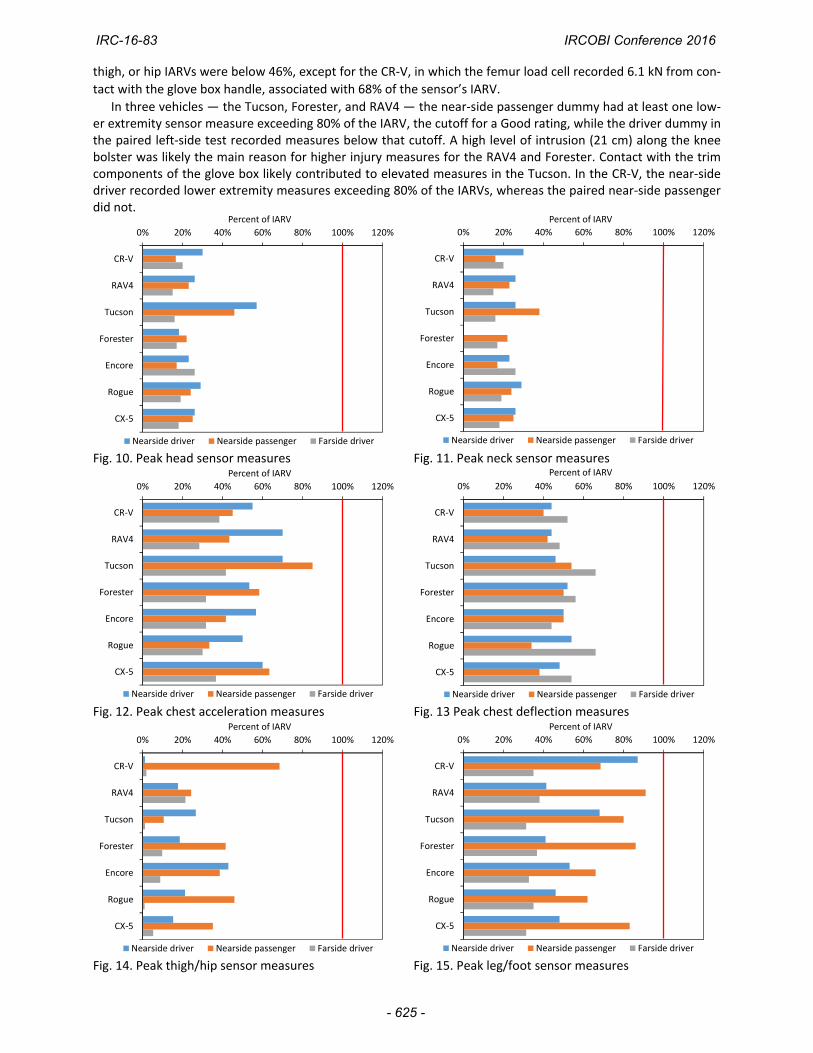
thigh, or hip IARVs were below 46%, except for the CR‐V, in which the femur load cell recorded 6.1 kN from con‐
tact with the glove box handle, associated with 68% of the sensor’s IARV.
In three vehicles — the Tucson, Forester, and RAV4 — the near‐side passenger dummy had at least one low‐er extremity sensor measure exceeding 80% of the IARV, the cutoff for a Good rating, while the driver dummy in the paired left‐side test recorded measures below that cutoff. A high level of intrusion (21 cm) along the knee bolster was likely the main reason for higher injury measures for the RAV4 and Forester. Contact with the trim components of the glove box likely contributed to elevated measures in the Tucson. In the CR‐V, the near‐side driver recorded lower extremity measures exceeding 80% of the IARVs, whereas the paired near‐side passenger did not.
0% 20% 40% 60% 80% 100% 120%
CR‐V
RAV4
Tucson
Forester
Encore
Rogue
CX‐5
Percent of IARV
Nearside driver Nearside passenger Farside driver
0% 20% 40% 60% 80% 100% 120%
CR‐V
RAV4
Tucson
Forester
Encore
Rogue
CX‐5
Percent of IARV
Nearside driver Nearside passenger Farside driver
Fig. 10. Peak head sensor measures Fig. 11. Peak neck sensor measures
0% 20% 40% 60% 80% 100% 120%
CR‐V
RAV4
Tucson
Forester
Encore
Rogue
CX‐5
Percent of IARV
Nearside driver Nearside passenger Farside driver
0% 20% 40% 60% 80% 100% 120%
CR‐V
RAV4
Tucson
Forester
Encore
Rogue
CX‐5
Percent of IARV
Nearside driver Nearside passenger Farside driver
Fig. 12. Peak chest acceleration measures Fig. 13 Peak chest deflection measures
0% 20% 40% 60% 80% 100% 120%
CR‐V
RAV4
Tucson
Forester
Encore
Rogue
CX‐5
Percent of IARV
Nearside driver Nearside passenger Farside driver
0% 20% 40% 60% 80% 100% 120%
CR‐V
RAV4
Tucson
Forester
Encore
Rogue
CX‐5
Percent of IARV
Nearside driver Nearside passenger Farside driver
Fig. 14. Peak thigh/hip sensor measures Fig. 15. Peak leg/foot sensor measures
IRC-16-83 IRCOBI Conference 2016
- 625 -
Injury Measures for Near‐side and Far‐side Driver Dummies
Far‐side driver sensor measures for all body regions except the chest were lower when compared with the near‐side drivers. All HIC measures were low, mainly because the only head contacts were with the frontal air‐bag. Tibia indices for all far‐side dummies were below 0.4. In three vehicles, the far‐side dummy’s legs did not contact the knee bolster during the test.
Far‐side driver chest measures indicated a mix of results when compared with near‐side drivers. While chest
accelerations typically indicated the higher injury risks for near‐side drivers compared to chest deflection, the
opposite was true for far‐side drivers where the range of 38% to 66% of IARV came from chest deflections. Far‐
side driver chest accelerations were lower than near‐side drivers for all vehicles. Chest deflection measures
were slightly higher compared with near‐side drivers, by 2‐10 mm in all vehicles except the Encore (Table III).
Higher belt loading for far‐side occupants, supported only by the frontal airbag and seat belt, translates into the
higher observed chest deflections compared with near‐side occupants, typically receiving additional support
from the curtain airbag. In the Encore, however, the shoulder belt slid off the dummy’s shoulder and crossed
the chest below the sternum where the chest deflection sensor is located.
TABLE III DRIVER CHEST COMPRESSION (MM)
Vehicle model Near‐side Far‐side Vehicle model Near‐side Far‐side
2015 Honda CR‐V 22 26 2015 Subaru Forester 26 28
2015 Toyota RAV4 22 24 2015 Buick Encore 25 22
2013 Toyota RAV4 18 22 2014 Nissan Rogue 27 33
2014 Honda CR‐V 13 19 2015 Mazda CX‐5 24 27
2016 Hyundai Tucson 23 33
Dummy Kinematics
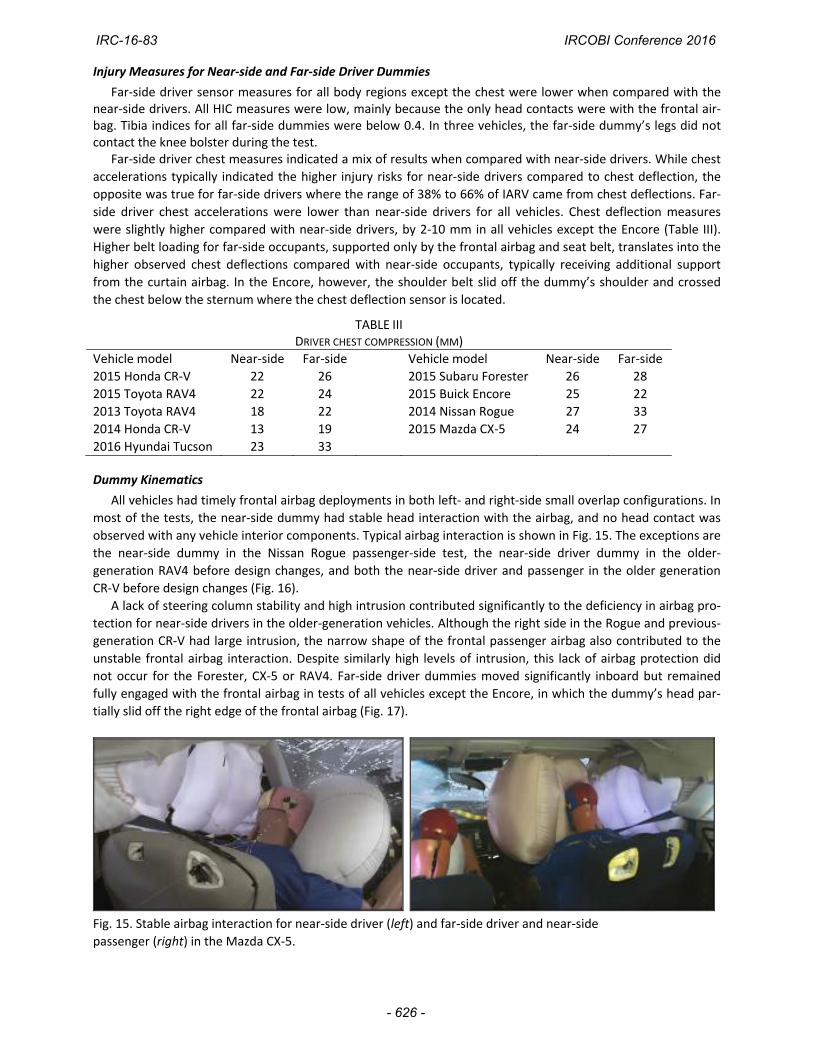
All vehicles had timely frontal airbag deployments in both left‐ and right‐side small overlap configurations. In
most of the tests, the near‐side dummy had stable head interaction with the airbag, and no head contact was
observed with any vehicle interior components. Typical airbag interaction is shown in Fig. 15. The exceptions are
the near‐side dummy in the Nissan Rogue passenger‐side test, the near‐side driver dummy in the older‐
generation RAV4 before design changes, and both the near‐side driver and passenger in the older generation
CR‐V before design changes (Fig. 16).
A lack of steering column stability and high intrusion contributed significantly to the deficiency in airbag pro‐
tection for near‐side drivers in the older‐generation vehicles. Although the right side in the Rogue and previous‐
generation CR‐V had large intrusion, the narrow shape of the frontal passenger airbag also contributed to the
unstable frontal airbag interaction. Despite similarly high levels of intrusion, this lack of airbag protection did
not occur for the Forester, CX‐5 or RAV4. Far‐side driver dummies moved significantly inboard but remained
fully engaged with the frontal airbag in tests of all vehicles except the Encore, in which the dummy’s head par‐
tially slid off the right edge of the frontal airbag (Fig. 17).
Fig. 15. Stable airbag interaction for near‐side driver (left) and far‐side driver and near‐side
passenger (right) in the Mazda CX‐5.
IRC-16-83 IRCOBI Conference 2016
- 626 -
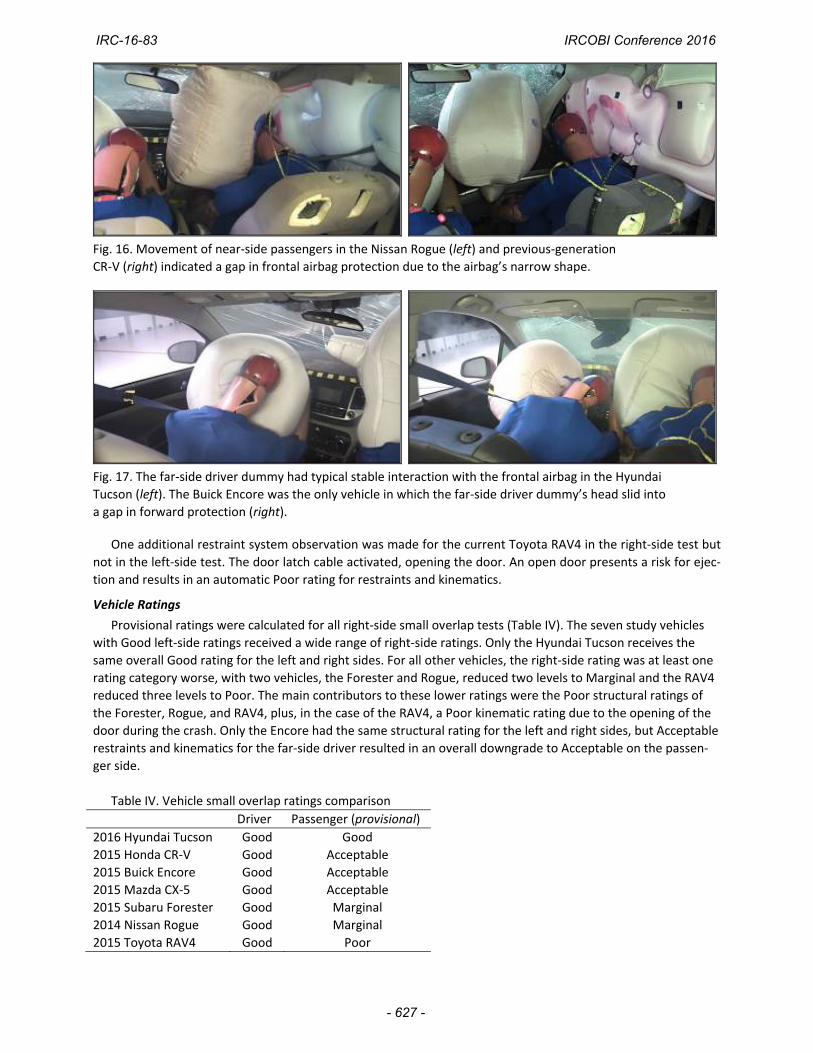
Fig. 16. Movement of near‐side passengers in the Nissan Rogue (left) and previous‐generation
CR‐V (right) indicated a gap in frontal airbag protection due to the airbag’s narrow shape.
Fig. 17. The far‐side driver dummy had typical stable interaction with the frontal airbag in the Hyundai
Tucson (left). The Buick Encore was the only vehicle in which the far‐side driver dummy’s head slid into
a gap in forward protection (right).
One additional restraint system observation was made for the current Toyota RAV4 in the right‐side test but
not in the left‐side test. The door latch cable activated, opening the door. An open door presents a risk for ejec‐
tion and results in an automatic Poor rating for restraints and kinematics.
Vehicle Ratings
Provisional ratings were calculated for all right‐side small overlap tests (Table IV). The seven study vehicles
with Good left‐side ratings received a wide range of right‐side ratings. Only the Hyundai Tucson receives the
same overall Good rating for the left and right sides. For all other vehicles, the right‐side rating was at least one
rating category worse, with two vehicles, the Forester and Rogue, reduced two levels to Marginal and the RAV4
reduced three levels to Poor. The main contributors to these lower ratings were the Poor structural ratings of
the Forester, Rogue, and RAV4, plus, in the case of the RAV4, a Poor kinematic rating due to the opening of the
door during the crash. Only the Encore had the same structural rating for the left and right sides, but Acceptable
restraints and kinematics for the far‐side driver resulted in an overall downgrade to Acceptable on the passen‐
ger side.
Table IV. Vehicle small overlap ratings comparison
Driver Passenger (provisional)
2016 Hyundai Tucson Good Good
2015 Honda CR‐V Good Acceptable
2015 Buick Encore Good Acceptable
2015 Mazda CX‐5 Good Acceptable
2015 Subaru Forester Good Marginal
2014 Nissan Rogue Good Marginal
2015 Toyota RAV4 Good Poor
IRC-16-83 IRCOBI Conference 2016
- 627 -
IV. DISCUSSION
Structural Performance
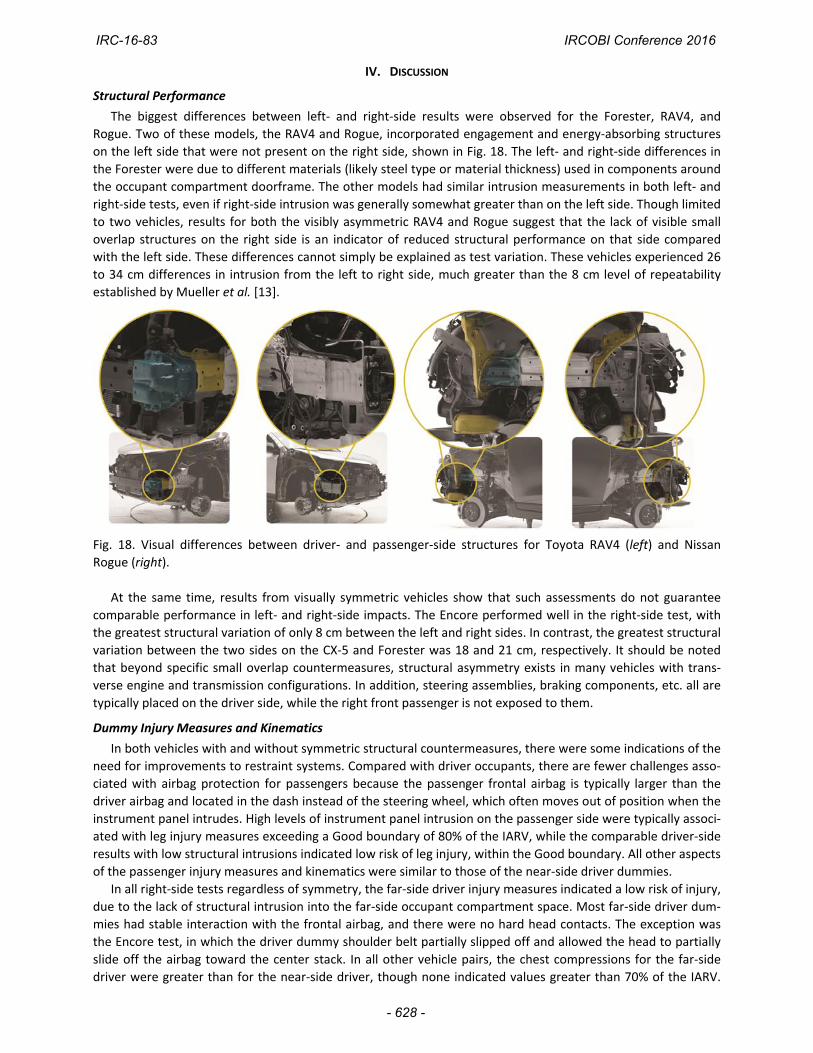
The biggest differences between left‐ and right‐side results were observed for the Forester, RAV4, and
Rogue. Two of these models, the RAV4 and Rogue, incorporated engagement and energy‐absorbing structures
on the left side that were not present on the right side, shown in Fig. 18. The left‐ and right‐side differences in
the Forester were due to different materials (likely steel type or material thickness) used in components around
the occupant compartment doorframe. The other models had similar intrusion measurements in both left‐ and
right‐side tests, even if right‐side intrusion was generally somewhat greater than on the left side. Though limited
to two vehicles, results for both the visibly asymmetric RAV4 and Rogue suggest that the lack of visible small
overlap structures on the right side is an indicator of reduced structural performance on that side compared
with the left side. These differences cannot simply be explained as test variation. These vehicles experienced 26
to 34 cm differences in intrusion from the left to right side, much greater than the 8 cm level of repeatability
established by Mueller et al. [13].
Fig. 18. Visual differences between driver‐ and passenger‐side structures for Toyota RAV4 (left) and Nissan
Rogue (right).
At the same time, results from visually symmetric vehicles show that such assessments do not guarantee
comparable performance in left‐ and right‐side impacts. The Encore performed well in the right‐side test, with
the greatest structural variation of only 8 cm between the left and right sides. In contrast, the greatest structural
variation between the two sides on the CX‐5 and Forester was 18 and 21 cm, respectively. It should be noted
that beyond specific small overlap countermeasures, structural asymmetry exists in many vehicles with trans‐
verse engine and transmission configurations. In addition, steering assemblies, braking components, etc. all are
typically placed on the driver side, while the right front passenger is not exposed to them.
Dummy Injury Measures and Kinematics
In both vehicles with and without symmetric structural countermeasures, there were some indications of the
need for improvements to restraint systems. Compared with driver occupants, there are fewer challenges asso‐
ciated with airbag protection for passengers because the passenger frontal airbag is typically larger than the
driver airbag and located in the dash instead of the steering wheel, which often moves out of position when the
instrument panel intrudes. High levels of instrument panel intrusion on the passenger side were typically associ‐
ated with leg injury measures exceeding a Good boundary of 80% of the IARV, while the comparable driver‐side
results with low structural intrusions indicated low risk of leg injury, within the Good boundary. All other aspects
of the passenger injury measures and kinematics were similar to those of the near‐side driver dummies.
In all right‐side tests regardless of symmetry, the far‐side driver injury measures indicated a low risk of injury,
due to the lack of structural intrusion into the far‐side occupant compartment space. Most far‐side driver dum‐
mies had stable interaction with the frontal airbag, and there were no hard head contacts. The exception was
the Encore test, in which the driver dummy shoulder belt partially slipped off and allowed the head to partially
slide off the airbag toward the center stack. In all other vehicle pairs, the chest compressions for the far‐side
driver were greater than for the near‐side driver, though none indicated values greater than 70% of the IARV.
IRC-16-83 IRCOBI Conference 2016
- 628 -
For the far‐side driver, the seat belt likely plays a larger role in restraining the dummy and, therefore, there is
greater chest loading compared with the near‐side driver. Observations from left‐side tests indicate the driver
dummy’s lateral motion is partially controlled by the curtain airbag, requiring less loading by the belt. While the
far‐side driver faces lower injury risks compared with the near‐side passenger, observations about restraint sys‐
tem performance hint that there are still potential risks that cannot be ignored. These observations also align
with the real‐world far‐side driver injury mechanisms identified by Brumbelow and Zuby [9]. Additionally, the
driver seat is always occupied in real‐world crashes, and this new evaluation provides an opportunity to monitor
and improve performance of the driver‐side restraint system in these types of crashes. No conclusions about
observed injury risks for right front passenger dummies in driver‐side small overlap crashes can be made, as no
tests have been conducted in that configuration. Further research is needed to fully evaluate the real‐world rel‐
evance of far‐side occupant injuries for both drivers and right front passengers in small overlap crashes.
V. CONCLUSIONS
IIHS has been rating vehicles for small overlap protection on the basis of left‐side tests since 2012. These rat‐
ings have encouraged manufacturers to make structural changes to vehicles in order to earn higher ratings. No
such incentive exists to make improvements to the right side. Early on, IIHS encouraged implementing left‐side‐
only countermeasures in the short‐term if it meant more models would be outfitted with countermeasures, but
it was always assumed that future designs would provide comparable levels of protection on both sides of the
vehicle. Consumers are unlikely to accept that vehicles provide different levels of protection on the left and right
sides of vehicles.
The range of performance in right‐side small overlap tests among vehicles with Good left‐side small overlap
ratings suggest automakers have not yet consistently applied design changes to both sides of the vehicle. These
tests also highlight the need to evaluate vehicle protection for far‐side drivers. While far‐side driver dummies
indicate reduced risks compared with their near‐side counterparts that experienced higher structural intrusions,
observations of inadequate restraint system performance suggest a potential need to evaluate risks for far‐side
drivers in this crash mode.
IIHS will continue to monitor differences in small overlap driver‐ and passenger‐side performance and may
begin issuing passenger‐side small overlap ratings as early as 2018.
VI. REFERENCES
[1] Thomas C. The role of the vehicle structure in reducing injuries in small overlap crashes. Proceedings of International Automotive Body Congress, Troy, Michigan, 2011.
[2] Fuju Heavy Industries Ltd. Subaru 14MY Forester: concept of small overlap collision. May 2014.
[3] Jakobsson L, McInally G, Axelson A, Lindman M, Kling A, Broberg T, Fermér M, Wågström L. Severe frontal collisions with partial overlap: two decades of car safety development. SAE Technical Paper 2013‐01‐0759. Warrendale, PA: SAE International, 2013.
[4] Ohnaka, R. 2013 Honda Accord: NVH collision safety. Proceedings International Automotive Body Con‐gress 2012. Red Hood, NY: Curran Associates Inc., 2013, 136‐151.
[5] Planath I. Norin H, Nilsson S. Severe frontal collisions with partial overlap: significance, test methods and car design. SAE Technical Paper 930636. Warrendale, PA: SAE International, 1993.
[6] Weissler P. 2014 MDX re‐engineered to pass IIHS test, reduce NVH. Automotive Articles, June 7. Warren‐dale, PA: SAE International, 2014.
[7] Mueller BC, Brethwaite AS, Zuby DS, Nolan JM. Structural design strategies for improved small overlap crashworthiness performance. Stapp Car Crash Journal, 2014, 58:145‐174.
[8] Insurance Institute for Highway Safety. [Unpublished analysis of data from the Fatality Analysis Report System]. Arlington, VA, 2016.
[9] Brumbelow ML, Zuby DS. Impact and injury patterns in frontal crashes of vehicles with good ratings for frontal crash protection. Proceedings of ESV Conference, 2009, Stuttgart, Germany.
IRC-16-83 IRCOBI Conference 2016
- 629 -
[10] Insurance Institute for Highway Safety. Small overlap frontal crashworthiness evaluation crash test proto‐col (version III). Ruckersville, VA, 2014.
[11] Insurance Institute for Highway Safety. Guidelines for using the UMTRI ATD positioning procedure for ATD and seat positioning (version V). Ruckersville, VA, 2004.
[12] Insurance Institute for Highway Safety. Small overlap frontal crashworthiness evaluation rating protocol (version III); rating guidelines for restraints and dummy kinematics, injury measures, and vehicle structur‐al performance; weighting principles for overall rating. Ruckersville, VA, 2014.
[13] Mueller BC, Sherwood CP, Nolan JM, Zuby DS. Repeatability of IIHS small overlap frontal crash tests. Pro‐ceedings of ESV Conference, 2013, Seoul, Republic of Korea.
VII. APPENDICES
Appendix A
TABLE A‐1
FAR‐SIDE INTRUSION
2015 Honda
CR‐V
2014 Honda
CR‐V
2015 Toyota
RAV4
2013 Toyota
RAV4
Lower hinge pillar (cm) 1 1 0 1
Footrest (cm) 2 1 0 1
Left toepan (cm) 2 1 1 1
Brake pedal (cm) 2 1 0 0
Rocker panel (lateral) (cm) 0 0 0 0
Steering column (longitudinal) (cm) 0 0 0 0
Upper hinge pillar (cm) 1 1 0 0
Upper dash (cm) 1 1 0 1
Left instrument panel (cm) 1 1 0 0
IRC-16-83 IRCOBI Conference 2016
- 630 -

TABLE
A‐2
A
NEA
R‐SIDE INTR
USION
2015 Honda CR‐V
2015 Toyo
ta RAV4
2016 Hyu
ndai Tucson
2015 Subaru Forester
2015 Buick En
core
Driver
Passenger
Driver
Passenger
Driver
Passenger
Driver
Passenger
Driver
Passenger
Lower hinge pillar (cm
) 3
15
9
40
5
19
9
29
14
11
Footrest (cm
) 5
13
640
715
10
24
911
Left toep
an (cm
) 3
8
2
23
6
11
6
17
8
7
Brake ped
al/cen
ter toep
an (cm
) 4
3
3
22
6
9
6
11
9
1
Rocker pan
el (lateral) (cm
) 2
4
2
17
2
12
0
4
2
4
Stee
ring whee
l/center of dash (cm
) 2
61
82
6
010
46
Upper hinge pillar (cm
) 4
14
4
26
4
11
5
26
14
12
Upper dash (cm
) 4
10
5
23
5
3
4
13
12
6
Left in
strument pan
el (cm
) 4
8
5
21
4
8
2
21
12
10
TA
BLE
A‐2
B
NEA
R‐SIDE INTR
USION
2014 Nissan Rogu
e
2015 M
azda CX‐5
2014 Honda CR‐V
2014 Toyo
ta RAV4
Driver
Passenger
Driver
Passenger
Driver
Passenger
Driver
Passenger
Lower hinge pillar (cm
) 10
36
725
26
20
31
39
Footrest (cm)
3
16
7
17
15
17
20
25
Left toep
an (cm
) 2
13
5
6
13
5
4
13
Brake ped
al/cen
ter toep
an (cm
) 3
7
8
3
10
3
7
9
Rocker pan
el (lateral) (cm
) 2
21
414
9
12
16
Stee
ring whee
l/center of dash (cm
) 3
12
0
8
11
5
4
9
Upper hinge pillar
9
20
8
20
31
19
21
25
Upper dash
8
9
7
9
26
12
17
25
Left in
strumen
t pan
el
9
24
813
26
10
17
19
IRC-16-83 IRCOBI Conference 2016
- 631 -

Appen
dix B
TABLE
B‐1
A
INJURY MEA
SURES
2015 Honda CR‐V
2015 Toyo
ta RAV4
2013 Toyo
ta RAV4
Nea
r‐side
Driver
Passenger
Far‐side
Driver
Nea
r‐side
Driver
Passenger
Far‐side
Driver
Nea
r‐side
Driver
Passenger
Far‐side
Driver
Measure (units)
IARV
CEN
1444
CN15001
CN15001
CEN
1451
CN15002
CN15002
CEN
1319
CN15003
CN15003
HIC
700
137
116
99
163
102
33
283
58
42
BrIC
1
1
1
0
1
1
0
1
0
0
Neck A‐P shea
r force (kN)
‐3
‐1
0
0
‐1
0
0
‐1
0
‐1
Nij
1
0.30
0.16
0.20
0.26
0.23
0.15
0.27
0.18
0.17
Neck axial compression (kN
) 4
0
0
0
0
0
0
0
0
0
Neck axial tension (kN
) 3
1
1
1
1
1
1
2
1
1
Chest acceleration (3 m
s clip) (g)
60
33
27
23
42
26
17
27
26
16
Chest compression (mm)
50
22
20
26
22
21
24
18
16
22
Sternum deflection rate (m
/s)
8
‐1
‐1
‐1
‐1
‐1
‐1
‐1
‐1
‐1
Viscous criteria (m/s)
1
0
0
0
0
0
0
0
0
0
Left KTH
injury
0
0
0
0
0
0
0
0
0
Left fem
ur force (kN)
9
01
02
1
23
11
Left knee displacemen
t (m
m)
15
0
2
1
0
2
2
5
1
1
Left upper tibia index
1
1
0
0
0
1
0
1
0
0
Left lo
wer tibia index
1
0
0
0
0
1
0
1
1
0
Left tibia axial force (kN)
8
21
04
1
15
11
Left foot acceleration (g)
150
56
49
23
62
71
32
67
96
41
Right KTH
injury
0
7
0
0
0
0
0
1
0
Right femur force (kN)
9
0‐6
0‐1
‐2
‐1‐1
‐3‐1
Right kn
ee displacemen
t (m
m)
15
03
01
4
31
41
Right upper tibia in
dex
1
1
1
0
0
0
0
0
0
0
Right lower tibia in
dex
1
1
0
0
0
1
0
0
1
0
Right tibia axial force (kN)
8
‐1‐1
‐1‐2
‐1
‐1‐2
‐1‐1
Right foot acceleration (g)
150
61
46
41
47
118
50
125
103
56
IRC-16-83 IRCOBI Conference 2016
- 632 -
TA
BLE
B‐1
B
INJURY MEA
SURES
2014 Honda CR‐V
2016 Hyundai Tucson
2015 Subaru Forester
Nea
r‐side
Driver
Passenger
Far‐side
Driver
Nea
r‐side
Driver
Passenger
Far‐side
Driver
Nea
r‐side
Driver
Passenger
Far‐side
Driver
Measure (units)
IARV
CEN
1223
CN15004
CN15004
CEN
1522
CN15005
CN15005
CEN
1303
CN15006
CN15006
HIC
700
102
34
31
399
321
61
127
77
44
BrIC
1
1
0
0
1
1
1
1
0
0
Neck A‐P shea
r force (kN)
‐3
‐1‐1
01
0
00
‐1‐1
Nij
1
0.36
0.19
0.15
0.36
0.19
0.15
0.36
0.19
0.15
Neck axial compression (kN
) 4
0
0
0
0
0
0
0
0
0
Neck axial tension (kN
) 3
1
1
1
1
1
1
0
1
1
Chest acceleration (3 m
s clip) (g)
60
32
23
15
42
51
25
32
35
19
Chest compression (mm)
50
13
16
19
23
27
33
26
25
28
Sternum deflection rate (m
/s)
8
‐1
‐1
‐1
‐1
‐2
‐1
‐1
‐2
‐1
Viscous criteria (m/s)
1
0
0
0
0
0
0
0
0
0
Left KTH
injury
4
00
00
00
00
Left fem
ur force (kN)
9
5
1
0
2
0
0
2
2
1
Left knee displacemen
t (m
m)
15
8
1
0
9
2
0
4
2
3
Left upper tibia index
1
1
0
0
1
0
0
0
1
0
Left lo
wer tibia index
1
10
00
0
00
00
Left tibia axial force (kN)
8
6
2
1
2
1
0
2
2
1
Left foot acceleration (g)
150
79
28
24
55
69
47
50
129
55
Right KTH
injury
0
11
0
0
0
0
0
1
0
Right femur force (kN)
9
‐1‐7
00
‐1
0‐1
‐4‐1
Right kn
ee displacement (m
m)
15
3
4
0
0
3
1
1
10
2
Right upper tibia in
dex
1
1
1
0
0
1
0
0
1
0
Right lower tibia in
dex
1
0
1
0
1
1
0
0
1
0
Right tibia axial force (kN)
8
‐2‐4
‐1‐1
‐2
‐1‐2
‐2‐1
Right foot acceleration (g)
150
66
108
32
83
52
38
47
73
35
IRC-16-83 IRCOBI Conference 2016
- 633 -

TA
BLE
B‐1
C
INJURY MEA
SURES
2015 Buick En
core
2014 Nissan Rogu
e 2015 M
azda CX‐5
Nea
r‐side
Driver
Passenger
Far‐side
Driver
Nea
r‐side
Driver
Passenger
Far‐side
Driver
Nea
r‐side
Driver
Passenger
Far‐side
Driver
Measure (units)
IARV
CEN
1502
CN15007
CN15007
CEN
1407
CN15008
CN15008
CEN
1345
CN15009
CN15009
HIC
700
107
110
105
185
68
53
181
120
62
BrIC
1
1
1
1
1
1
0
1
0
1
Neck A‐P shea
r force (kN)
‐3
00
1‐1
‐1
‐10
00
Nij
1
0.23
0.17
0.26
0.29
0.24
0.19
0.26
0.25
0.18
Neck axial compression (kN
) 4
0
0
0
0
0
0
0
0
0
Neck axial tension (kN
) 3
1
1
1
1
1
1
1
1
1
Chest acceleration (3 m
s clip) (g)
60
34
25
19
30
20
18
36
38
22
Chest compression (mm)
50
25
25
22
27
17
33
24
19
27
Sternum deflection rate (m
/s)
8
‐1
‐1
‐1
‐1
‐2
‐2
‐1
‐1
‐1
Viscous criteria (m/s)
1
0
0
0
0
0
0
0
0
0
Left KTH
injury
1
00
00
00
00
Left fem
ur force (kN)
9
4
1
0
2
3
0
1
2
0
Left knee displacemen
t (m
m)
15
7
4
0
2
5
0
3
6
1
Left upper tibia index
1
1
1
0
0
0
0
0
0
0
Left lo
wer tibia index
1
00
00
0
00
00
Left tibia axial force (kN)
8
2
2
0
1
1
0
1
2
0
Left foot acceleration (g)
150
56
46
35
28
45
44
52
34
47
Right KTH
injury
0
1
0
0
2
0
0
1
0
Right femur force (kN)
9
0‐4
‐10
‐4
00
‐30
Right kn
ee displacement (m
m)
15
2
5
4
0
5
1
0
3
1
Right upper tibia in
dex
1
0
1
0
0
1
0
0
0
0
Right lower tibia in
dex
1
0
0
0
0
1
0
0
1
0
Right tibia axial force (kN)
8
‐1‐2
0‐1
‐1
0‐2
‐2‐1
Right foot acceleration (g)
150
49
50
49
26
48
33
58
57
27
IRC-16-83 IRCOBI Conference 2016
- 634 -