Embed Size (px)
Citation preview

Drinking Water Quality in My Community October 2021
Environment and Local Government

Drinking Water Quality in My Community
Published by:
Province of New Brunswick
P. O. Box 6000
Fredericton, NB
E3B 5H1 Canada
ISBN # # 978-1-4605-2910-2 (PDF: English)
ISBN # 978-1-4605-2911-9 (PDF: Française)
i
Table of Contents
Executive Summary ................................................................................................................... 1
1.0 Introduction ..................................................................................................................... 2
2.0 Water Quality Testing – One of Many Steps to Safe Drinking Water ............................... 6
3.0 Water Quality Test Results Reviewed ............................................................................. 8
4.0 Water Quality Test Results Across the Province .............................................................10
4.1. Bacteria Findings ........................................................................................................10
4.2. Chemistry Findings .....................................................................................................12
5.0 Other Considerations ......................................................................................................15
6.0 Conclusion .....................................................................................................................17
7.0 Glossary .........................................................................................................................18
Appendix A – Drinking Water Quality Delivered to Users Listed by Water System (Treated
Water) .......................................................................................................................................22
Overview for Context .............................................................................................................23
Alma ......................................................................................................................................24
Aroostook ..............................................................................................................................25
Atholville ................................................................................................................................26
Baker Brook...........................................................................................................................27
Balmoral ................................................................................................................................28
Bas-Caraquet ........................................................................................................................29
Bath .......................................................................................................................................30
Bathurst / Beresford ...............................................................................................................31
Belledune ..............................................................................................................................34
Blacks Harbour ......................................................................................................................35
Bouctouche ...........................................................................................................................37
Campbellton ..........................................................................................................................38
Caraquet ...............................................................................................................................39
Charlo....................................................................................................................................40
Clair .......................................................................................................................................41
Dalhousie ..............................................................................................................................43
Doaktown ..............................................................................................................................45
Dorchester .............................................................................................................................46
ii
Drummond ............................................................................................................................47
Edmundston ..........................................................................................................................48
Eel River Crossing .................................................................................................................50
Fredericton ............................................................................................................................51
Fredericton Junction ..............................................................................................................52
Grand Falls ............................................................................................................................53
Hampton ................................................................................................................................54
Hartland .................................................................................................................................55
Hillsborough ..........................................................................................................................56
Kedgwick ...............................................................................................................................57
Lamèque ...............................................................................................................................58
McAdam ................................................................................................................................59
Memramcook .........................................................................................................................60
Miramichi ...............................................................................................................................62
Moncton / Dieppe / Riverview ................................................................................................65
Nackawic ...............................................................................................................................69
New Maryland .......................................................................................................................70
Oromocto ..............................................................................................................................71
Penobsquis Regional Water Supply ......................................................................................72
Perth-Andover .......................................................................................................................73
Petit-Rocher ..........................................................................................................................74
Plaster Rock ..........................................................................................................................75
Port Elgin ...............................................................................................................................76
Quispamsis ...........................................................................................................................78
Richibucto .............................................................................................................................80
Riverside-Albert .....................................................................................................................82
Rivière-Verte .........................................................................................................................83
Rothesay ...............................................................................................................................84
Sackville ................................................................................................................................86
Saint Andrews .......................................................................................................................87
Saint John .............................................................................................................................88
Saint-André ...........................................................................................................................93
Saint-Antoine .........................................................................................................................94

iii
Sainte-Anne-de-Madawaska .................................................................................................95
Saint-François-de-Madawaska ..............................................................................................96
Saint-Hilaire ...........................................................................................................................97
Saint-Léonard ........................................................................................................................98
Saint-Louis-de-Kent ...............................................................................................................99
Saint-Quentin ...................................................................................................................... 100
Shediac ............................................................................................................................... 101
Shippagan ........................................................................................................................... 103
St. George ........................................................................................................................... 104
St. Margarets Water Commission ........................................................................................ 105
St. Stephen ......................................................................................................................... 106
Sussex ................................................................................................................................ 108
Sussex Corner ..................................................................................................................... 109
Tide Head ............................................................................................................................ 110
Tracadie-Sheila ................................................................................................................... 111
Woodstock .......................................................................................................................... 112
Appendix B - Water Quality of Raw Source Water (Before Treatment) .................................... 113
Bacteria Findings for Raw Source Water (Before Treatment) .............................................. 114
Summary of Inorganic Chemistry Findings for Raw Water Sources ..................................... 119
Summary of Organic Chemistry Findings for Raw Water Sources ....................................... 129

iv
Figures
Map 1: Local Governments with Regulated Drinking Water Systems Included in this Report…. 4
Figure 1: Number of New Brunswick Drinking Water Systems Reviewed ................................... 5
Figure 2: Multi-Barrier Approach to Drinking Water Protection ................................................... 6
Figure 3: Drinking Water Quality Delivered to Users ................................................................ 13
Figure 4: Water Quality in Sources of Raw Water .................................................................... 14
Tables Table 1: Chemistry Tests Required by Drinking Water Sampling Plans ...................................... 9
Table 2: Other Chemistry Tests that are Sometimes Reported ................................................ 10
Table 3: Percentages of Samples in which Bacteria were Detected: Overall and Minimum-
Maximum for Individual Distribution Systems or Raw Water Sources ........................................ 11
Table 4: Comparison of NBDWQG and Canadian Guideline Exceedances for Parameters
Tested in NB……………………………………………………………………………………………..16
1
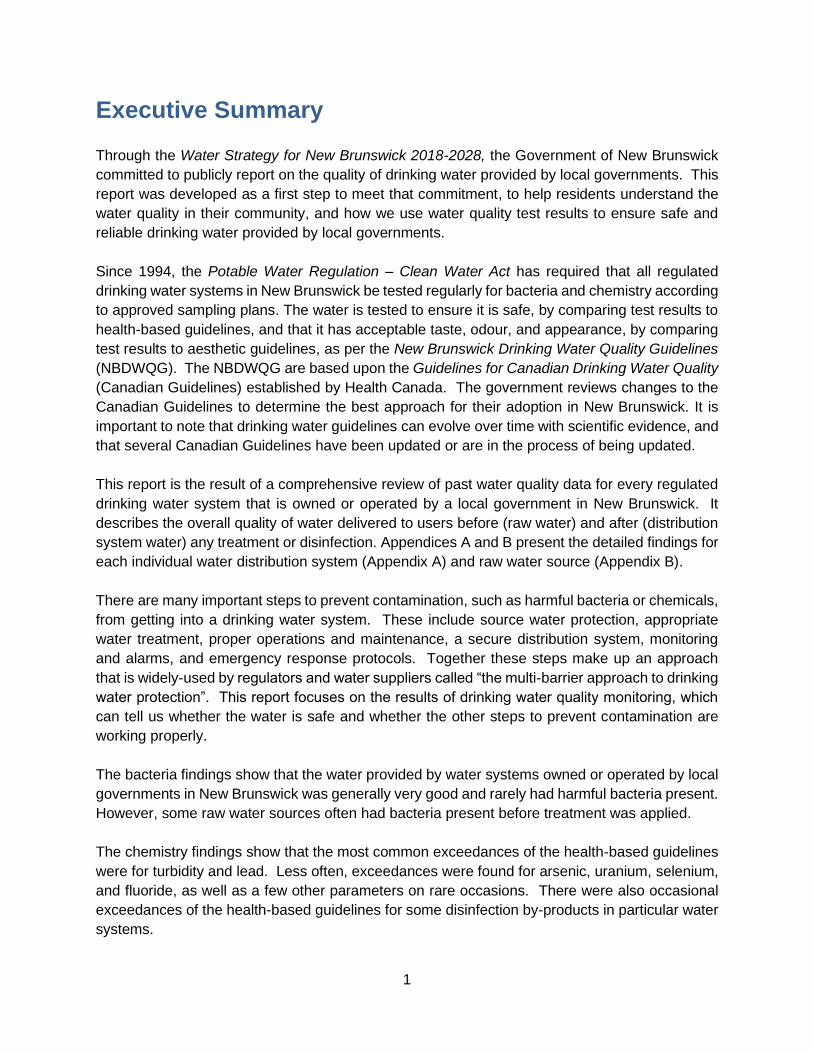
Executive Summary
Through the Water Strategy for New Brunswick 2018-2028, the Government of New Brunswick
committed to publicly report on the quality of drinking water provided by local governments. This
report was developed as a first step to meet that commitment, to help residents understand the
water quality in their community, and how we use water quality test results to ensure safe and
reliable drinking water provided by local governments.
Since 1994, the Potable Water Regulation – Clean Water Act has required that all regulated
drinking water systems in New Brunswick be tested regularly for bacteria and chemistry according
to approved sampling plans. The water is tested to ensure it is safe, by comparing test results to
health-based guidelines, and that it has acceptable taste, odour, and appearance, by comparing
test results to aesthetic guidelines, as per the New Brunswick Drinking Water Quality Guidelines
(NBDWQG). The NBDWQG are based upon the Guidelines for Canadian Drinking Water Quality
(Canadian Guidelines) established by Health Canada. The government reviews changes to the
Canadian Guidelines to determine the best approach for their adoption in New Brunswick. It is
important to note that drinking water guidelines can evolve over time with scientific evidence, and
that several Canadian Guidelines have been updated or are in the process of being updated.
This report is the result of a comprehensive review of past water quality data for every regulated
drinking water system that is owned or operated by a local government in New Brunswick. It
describes the overall quality of water delivered to users before (raw water) and after (distribution
system water) any treatment or disinfection. Appendices A and B present the detailed findings for
each individual water distribution system (Appendix A) and raw water source (Appendix B).
There are many important steps to prevent contamination, such as harmful bacteria or chemicals,
from getting into a drinking water system. These include source water protection, appropriate
water treatment, proper operations and maintenance, a secure distribution system, monitoring
and alarms, and emergency response protocols. Together these steps make up an approach
that is widely-used by regulators and water suppliers called “the multi-barrier approach to drinking
water protection”. This report focuses on the results of drinking water quality monitoring, which
can tell us whether the water is safe and whether the other steps to prevent contamination are
working properly.
The bacteria findings show that the water provided by water systems owned or operated by local
governments in New Brunswick was generally very good and rarely had harmful bacteria present.
However, some raw water sources often had bacteria present before treatment was applied.
The chemistry findings show that the most common exceedances of the health-based guidelines
were for turbidity and lead. Less often, exceedances were found for arsenic, uranium, selenium,
and fluoride, as well as a few other parameters on rare occasions. There were also occasional
exceedances of the health-based guidelines for some disinfection by-products in particular water
systems.
2
For those chemistry-based parameters with aesthetic guidelines, the most common exceedances
were for manganese and iron, and less often copper, chloride, and sodium.
The bacteria and chemistry test results highlight that proper water treatment, disinfection, and
operations are key to ensuring safe and good quality drinking water.
This report will increase the transparency of drinking water quality data available to the public and
can also help government to prioritize which water systems may need additional support to ensure
even more consistent, safe and reliable drinking water in the future.
1.0 Introduction The year 2019 marked the 25th anniversary of the Potable Water Regulation – Clean Water Act,
which requires that all regulated drinking water systems in New Brunswick (those that are owned
or operated by a local government or the province) be tested regularly for bacteria and chemistry
according to sampling plans approved by the Department of Environment and Local Government
and the Department of Health.
Water samples are collected by the water system operator and sent to an accredited laboratory
for analysis. These results have been used regularly to confirm that drinking water from the
regulated water systems is safe by comparing test results to health-based guidelines, and that it
has acceptable taste, odour, and appearance, by comparing test results to aesthetic guidelines.
These guidelines are described in the New Brunswick Drinking Water Quality Guidelines1. The
results also allow regulators and water system owners and operators to take appropriate actions
when the guidelines are not met.
This report is the result of water quality data reviews for every regulated drinking water supply
system that is owned or operated by a local government in New Brunswick2, which included a
review of:
• Available bacteria data (between 2008 to 2014)3 and all available chemistry data (dating
back to 1994 in some cases and up to 2016 or 2017) for 73 separate water distribution
systems serving 70 communities (see Map 1).
• Each individual raw water source (before any disinfection or treatment) was also reviewed
separately (see Figure 1).
1 www2.gnb.ca/content/gnb/en/departments/ocmoh/healthy_environments/content/drinking_water_guidelines.html 2 While the Potable Water Regulation – Clean Water Act also regulates drinking water supply systems owned or operated by the Crown in right of the Province, these were not included in this review, as most of them serve institutional buildings rather than a community. 3 Although some older data for bacteria testing exist, analysis of the data was limited to 2008 to 2014 to ensure a consistent basis for comparison, as 2008 was the earliest full year for which there was a complete historical data set available for microbiology test results in all municipal drinking water systems. 2014 was the end date because the microbiology data analyses were done in 2015.

3
o This included 207 groundwater wells4, 12 surface water supplies, 6 infiltration
galleries and 4 springs (these types of raw water sources are defined in the
Glossary).
This report summarizes the most important water quality issues that affect water quality delivered
to New Brunswick communities by regulated water supply systems. The detailed findings for
each individual water distribution system are presented in Appendix A, and those for raw water
sources are presented in Appendix B.
Note that because this report is based on a review of past data, more recent data should always
be consulted as part of any investigation or action prompted by the findings, as the current water
quality results may have changed since the review was done.
This report compares water quality results to the current New Brunswick Drinking Water Quality
Guidelines.5 Note that the guidelines include 2 types: Maximum Acceptable Concentrations
(MAC) for preventing adverse effects on human health, and Aesthetic Objectives (AO) for
avoiding unpleasing aesthetic impacts – see the Glossary for definitions.
4 These are the numbers for the bacteria data reviews: an additional 28 wells, 1 spring and 1 infiltration gallery were captured in the chemistry data reviews, and 5 retired wells found in the bacteria data reviews had no chemistry data available. The difference in numbers arises because these additional water sources were not in use during the limited date range (2008-2014 inclusive) of test results considered in the microbiology data reviews. 5 The New Brunswick Drinking Water Quality Guidelines (NBDWQG) are adopted from the Guidelines for Canadian Drinking Water Quality established by Health Canada. Health Canada has updated various drinking water guidelines and government is in the process of reviewing the changes to determine the best approach for their adoption in New Brunswick.

4

5
Figure 1: Number of New Brunswick Drinking Water Systems Reviewed
73 Drinking Water Distribution Systems serving 70 Communities
6 Infiltration Galleries 4 Springs
12 Surface Water Supplies 207 Groundwater Wells

6
2.0 Water Quality Testing – One of Many Steps to
Safe Drinking Water
Drinking water quality testing is an important step needed to properly manage drinking water
systems that serve the public, and to make sure the water delivered to users is safe. There are
many important steps to prevent contamination (such as harmful bacteria or chemicals) from
getting into a drinking water system. These include source water protection, appropriate water
treatment, proper operations and maintenance, a secure distribution system, monitoring and
alarms, and emergency response protocols. Together these steps make up an approach that is
widely-used by regulators and water suppliers called “the multi-barrier approach to drinking water
protection” (see Figure 2 below). This report focuses on the results of drinking water quality
monitoring, which can tell us whether the water is safe and whether the other steps to prevent
contamination are working properly.
Figure 2: Multi-Barrier Approach to Drinking Water Protection

7
New Brunswick has many regulations in place to support the multi-barrier approach including:
• Potable Water Regulation that requires regulated water supplies to sample and test water
according to an approved sampling plan;
• Watershed and Wellfield Protected Area Designation Orders that allow for source water
protection;
• Clean Environment Act and Water Quality Regulation that require water supply systems
to have Approvals to Operate (which set conditions for operating and maintaining a safe
water supply); and
• Public Health Act that allows for issuing advisories or actions to limit health hazards, such
as boil-water orders.
Monitoring water quality is a very important step because it confirms that the water is safe for
drinking and that steps to prevent contamination are working properly. The findings in this report
are useful because they will increase the transparency of drinking water quality data that is
available to the public and can help government to:
• Prioritize water systems to determine which ones may need improvements in treatment,
disinfection, or distribution system operations;
• Prioritize wells that should be investigated as possible Groundwater Under Direct
Influence of surface water (GUDI) sources, which are more likely to become contaminated
by surface water, and so require additional water treatment;
• Inform funding priorities for infrastructure improvements;
• Assist in evaluating which infrastructure investments are working to improve or maintain
water safety;
• Provide information about the success and / or challenges of the source water protection
programs (Watershed and Wellfield Protected Area Designation Orders);
• Provide information about the success and / or challenges of the multi-barrier approach
to drinking water protection used in the Approvals to Operate; and
• Identify bacteria or chemistry parameters that should be tested more (or less) often to be
sure the right testing is being done to address potential problems in a water system.

8
3.0 Water Quality Test Results Reviewed Laboratory test results were reviewed for the following parameters:
• Escherichia coli (E. coli) is one of the most common types of bacteria found in the faeces of
animals and humans. If E. coli is found in drinking water, that means the water was recently
in contact with sewage or other sources of faecal matter, and that treatment and / or
disinfection was not working properly to make the water safe for drinking.
Some strains of E. coli can cause serious or even fatal gastrointestinal illness and other
complications such as kidney damage.
When E. coli is found in a water sample, then other kinds of harmful bacteria, viruses and
parasites can also be present. The water should not be used for drinking, cooking, food
preparation, juice and drink mix preparation, making ice, washing fruits and vegetables or
brushing teeth. In this case, since boiling water with bacteria present will make it safe for
drinking, a boil order will be issued to a water system. Boil orders can remain in place until the
problem causing the E. coli to get into the water system is corrected, and resampling has
shown that the water is safe again.
• Total Coliforms are a group of bacteria6 often found in the natural environment. Most Total
Coliforms are not harmful and do not pose a risk to health. However, Total Coliforms are a
good indicator of overall cleanliness in water systems. They should normally not be found in
disinfected water distribution systems. If Total Coliforms are often found in distribution system
samples, this might mean that:
o the treatment and / or disinfection steps are not working properly,
o that proper operations and maintenance are not being followed, or
o that the distribution system is not secure against intrusion (i.e. there are leaks or cross-
connections that allow contaminants to enter)
Also, when Total Coliforms are found in raw water from groundwater wells, this may mean
that water from the surface, which may contain bacteria or chemicals, is getting into the
groundwater well.
• Chemistry tests include both Inorganic Chemistry and Organic Chemistry:
o Inorganic tests include substances (e.g.: lead, arsenic, copper, etc.) that are found in
the natural environment, or which can get into a water system through non-natural
sources such as leaching from plumbing materials or chemical spills.
o Organic tests include substances (all of which are small molecules based on carbon
atoms) that can get into a water system through by-products of disinfection, chemical
spills, or contact with certain kinds of materials.
6 The Total Coliform group includes the genera Escherichia (of which E. coli is a member species), Klebsiella, Enterobacter, Citrobacter, Serratia, and many others. They were originally defined as a group of bacteria that can grow by fermenting the sugar lactose, producing acid and gas in the process.

9
The list of chemistry tests required (Table 1) or occasionally tested voluntarily (Table 2) in drinking
water in New Brunswick is shown below, including the symbols used in the tables in the
Appendices and the New Brunswick Drinking Water Quality Guideline value and whether it is a
Maximum Acceptable Concentration (MAC) or an Aesthetic Objective (AO) for each:
Table 1: Chemistry Tests Required by Drinking Water Sampling Plans
Inorganic Chemistry Organic Chemistry
Symbol Name NB Guideline Symbol Name NB Guideline Al Aluminum -- 1,2-DCB 1,2-Dichlorobenzene MAC 0.20 mg/L As Arsenic MAC 0.01 mg/L 1,2-DCE 1,2-Dichloroethane MAC 0.005 mg/L B Boron MAC 5.0 mg/L 1,4-DCB 1,4-Dichlorobenzene MAC 0.005 mg/L Ba Barium MAC 1.0 mg/L 5-Cl-PH Pentachlorophenol MAC 0.06 mg/L Cd Cadmium MAC 0.005 mg/L B(a)P Benzo(a)pyrene MAC 0.00001 mg/L Cr Chromium MAC 0.05 mg/L BENZ Benzene MAC 0.005 mg/L Cu Copper AO 1.0 mg/L CCl4 Carbon Tetrachloride MAC 0.005 mg/L F Fluoride MAC 1.5 mg/L DCM Dichloromethane MAC 0.05 mg/L Fe Iron AO 0.3 mg/L EBENZ Ethylbenzene AO 0.0024 mg/L Hg Mercury MAC 0.001 mg/L
PCE Perchloroethylene (aka Tetrachloroethylene)
MAC 0.03 mg/L
Mn Manganese AO 0.05 mg/L TCE
Trichloroethylene
MAC 0.005 mg/L NO3- Nitrate MAC 45 mg/L
Pb Lead MAC 0.01 mg/L THM Trihalomethanes (2) MAC 0.100 mg/L Sb Antimony MAC 0.006 mg/L TOL Toluene AO 0.024 mg/L Se Selenium MAC 0.01 mg/L XYL Xylenes AO 0.30 mg/L Tl Thallium -- VINYL Vinyl Chloride MAC 0.002 mg/L
TURB Turbidity MAC, see note (1) U Uranium MAC 0.02 mg/L
(1) The Turbidity guideline is quite complex – see the entry for Turbidity in the Glossary for full details.
(2) Total THM is the sum of four related compounds that are disinfection by-products: chloroform,
bromodichloromethane, dibromochloromethane, and bromoform. To account for seasonal variations and
differences in levels throughout the distribution system, the MAC is based on the annual running average of
at least four quarterly samples at specific locations in the extremities of the system and not single test results.

10
Table 2: Other Chemistry Tests that are Sometimes Reported
Inorganic Chemistry Organic Chemistry
Symbol, Name ALK Alkalinity Cl Chloride COND Conductivity HARD Hardness K Potassium NO2- Nitrite Na Sodium pH pH SO4-- Sulphate Zn Zinc
NB Guideline --
AO 250 mg/L -- -- -- --
AO 200 mg/L --
AO 500 mg/L --
Symbol, Name HAA Haloacetic Acids (3) PAH Polycyclic Aromatic
Hydrocarbons VOC Volatile Organic Compounds
NB Guideline --
B(a)P only (4)
various
(3) HAA includes up to nine related compounds that are all disinfection by-products. It is most commonly reported
as HAA5 (sum of the five most common HAAs: monochloroacetic acid, dichloroacetic acid, trichloroacetic
acid, monobromoacetic acid, dibromoacetic acid) but is also occasionally reported as HAA6 (HAA5 plus one
additional HAA, bromochloroacetic acid), or rarely as HAA9 (sum of all 9 related compounds).
(4) B(a)P (Benzo(a)pyrene) is a PAH. There are many other related PAH compounds, but none have NB
Guidelines.
4.0 Water Quality Test Results Across the Province The overall findings for water distribution systems (drinking water quality delivered to users) are
shown in Figure 3, and those for water quality in sources of raw water (before treatment or
disinfection) are shown in Figure 4. Table 3 describes the percentages of samples in which
bacteria were found and describes the overall, minimum and maximum values for the bacteria
findings in individual distribution systems or raw water sources.
Further details about these findings are provided in the Appendices.
4.1. Bacteria Findings Water systems in New Brunswick are typically required to test for both E. coli and Total Coliforms
weekly in distribution systems, and monthly in raw water supplies.
The bacteria test findings show that the water provided by water systems owned or operated by
local governments in New Brunswick was generally very good and rarely had harmful bacteria
present.
More than 68,000 distribution system samples were tested for bacteria in the 7-year period
studied and it was found that:
• 64 of 73 water distribution systems met the E. coli guideline in 100% of their samples. Those
that did not nevertheless met the guideline in at least 99.6% of samples; and
• 9 of 73 water distribution systems met the Total Coliforms guideline in 100% of samples.
Those that did not nevertheless met the guideline in at least 89% of samples.
11
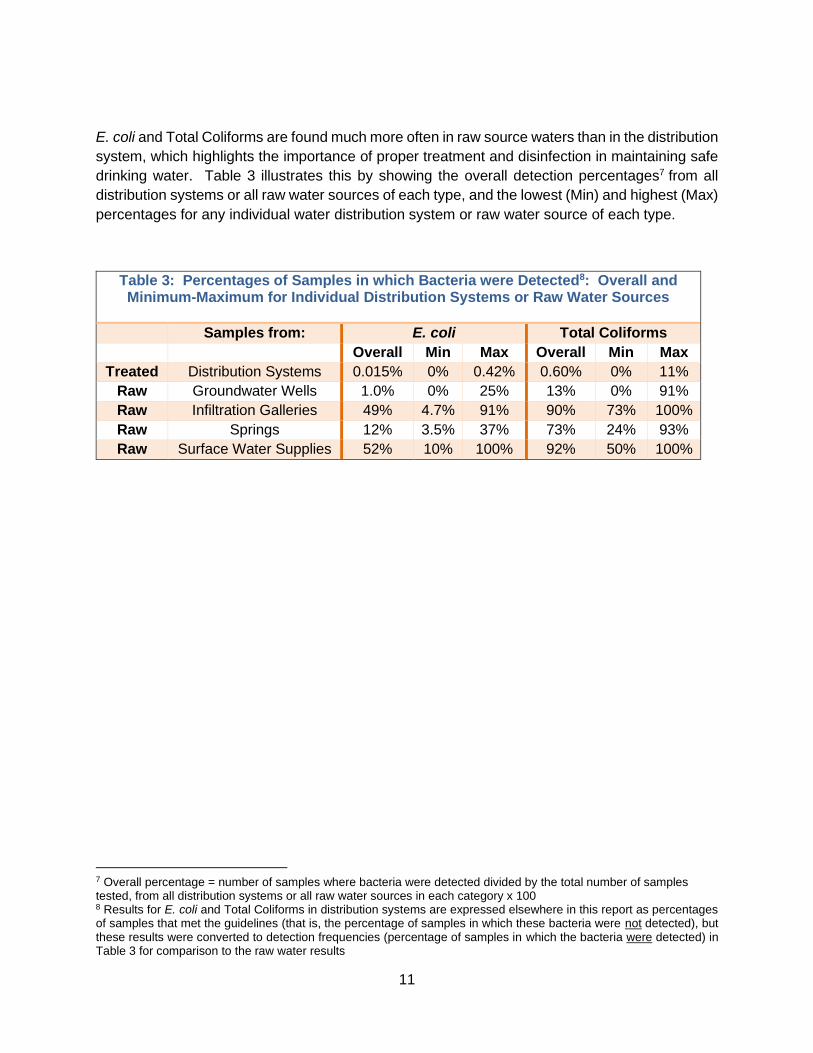
E. coli and Total Coliforms are found much more often in raw source waters than in the distribution
system, which highlights the importance of proper treatment and disinfection in maintaining safe
drinking water. Table 3 illustrates this by showing the overall detection percentages7 from all
distribution systems or all raw water sources of each type, and the lowest (Min) and highest (Max)
percentages for any individual water distribution system or raw water source of each type.
Table 3: Percentages of Samples in which Bacteria were Detected8: Overall and Minimum-Maximum for Individual Distribution Systems or Raw Water Sources
Samples from: E. coli Total Coliforms
Overall Min Max Overall Min Max
Treated Distribution Systems 0.015% 0% 0.42% 0.60% 0% 11%
Raw Groundwater Wells 1.0% 0% 25% 13% 0% 91%
Raw Infiltration Galleries 49% 4.7% 91% 90% 73% 100%
Raw Springs 12% 3.5% 37% 73% 24% 93%
Raw Surface Water Supplies 52% 10% 100% 92% 50% 100%
7 Overall percentage = number of samples where bacteria were detected divided by the total number of samples tested, from all distribution systems or all raw water sources in each category x 100 8 Results for E. coli and Total Coliforms in distribution systems are expressed elsewhere in this report as percentages of samples that met the guidelines (that is, the percentage of samples in which these bacteria were not detected), but these results were converted to detection frequencies (percentage of samples in which the bacteria were detected) in Table 3 for comparison to the raw water results

12
4.2. Chemistry Findings
Water systems in New Brunswick are typically required to test for organic chemistry four times
per year (those with surface water supplies) or twice per year (those with groundwater supplies),
and for inorganic chemistry twice per year (surface water) or once per year (groundwater).
Testing frequencies may be different if sampling plan modifications have been approved.
19 of 73 water distribution systems met the New Brunswick Drinking Water Quality Guidelines for
all chemistry parameters in 100% of available testing results. Those that did not are discussed in
the overview below and in detail for each individual water distribution system in Appendix A.
Organic Chemistry Tests
The results show that the most common exceedances for organic chemistry were due to the
disinfection by-products trihalomethanes (THMs) in certain water systems.
Results exceeding the guidelines for other organic chemistry parameters with a Maximum
Acceptable Concentration (MAC, a health-based guideline) were rare 9 . Many of these
exceedances likely occurred due to conditions at the sampling site, such as from vapours due to
fuels, paints, or adhesives, cleaning products, inappropriate sampling techniques such as flaming
the tap before taking water samples, and other sources of false positives.
The findings for raw water sources as compared to those for distribution systems indicate that
exceedances of the guidelines for organic chemistry parameters were even rarer in raw water,
which further suggests that many of the exceedances found in distribution system samples were
not due to contamination of the water sources.
Inorganic Chemistry Tests
The inorganic chemistry results show that the most common exceedances of the health-based
guidelines were for turbidity and lead. Less often, exceedances were found for arsenic, uranium,
selenium, and fluoride, as well as a few other parameters on rare occasions.
For inorganic chemistry parameters with Aesthetic Objectives (AO), the most common
exceedances were for manganese and iron, and less frequently, copper, chloride, and sodium.
The findings for raw water sources as compared to those for distribution systems indicate that
exceedances of parameters like manganese, iron and turbidity occur more often in raw water than
in distribution systems. This shows the importance of water treatment that is already in place in
some water systems, but also shows that such types of water treatment may need to be improved
in other systems.
Water quality results for each individual drinking water system are found in Appendices A and B.
9 Benzo(a)pyrene, carbon tetrachloride and 1,4-dichlorobenzene all exceeded their MACs in more than one water system, but these were all isolated occurrences rather than being found in many samples and were possibly due to false positives – see Appendix A for more details.

13
Figure 3: Drinking Water Quality Delivered to Users
73 Drinking Water Distribution
Systems serving 70 Communities
E. coli
99.985% of samples
met the Guideline
(Best systems 100%;
worst 99.6%)
Total Coliforms
99.4% of samples
met the Guideline
(Best systems 100%;
worst 89%)
Inorganic Chemistry
(Number of systems with any exceedances*, out of 73
systems in total)
Health Guidelines: Turbidity (41)**, Lead (14),
Arsenic (4), Uranium (3), Fluoride (2), Selenium (2),
Antimony (1), Barium (1), Chromium (1), Nitrate (1)
Aesthetic Guidelines: Manganese (34), Iron (23),
Copper (6), Chloride (3), Sodium (1)
Organic Chemistry
(Number of systems with any exceedances*, out of 73
systems in total)
Health Guidelines: Trihalomethanes (7),
Benzo(a)pyrene (3), 1,4-Dichlorobenzene (2),
Carbon Tetrachloride (2), Tetrachloroethylene (1)
Aesthetic Guidelines: Ethylbenzene (6)
* “Exceedances” means that the named parameter surpassed its NB guideline in at least 1 sample from a given
water system. Repeated exceedances were generally a small portion of these totals – see Appendix A for details.
** The Turbidity guideline is quite complex, so a screening-level value was used, which may overestimate the
number of actual exceedances – see the entry for Turbidity in the Glossary for full details.

14
Figure 4: Water Quality in Sources of Raw Water
E. coli
Found in 49% of all samples Best: 4.7% of samples
Worst: 91% of samples
E. coli
Found in 12% of all samples Best: 3.5% of samples
Worst: 37% of samples
Total Coliforms
Found in 92% of all samples Best: 50% of samples
Worst: 100% of samples
Total Coliforms
Found in 90% of all samples Best: 73% of samples
Worst: 100% of samples
Total Coliforms
Found in 73% of all samples Best: 24% of samples
Worst: 93% of samples
Inorganic Chemistry (Numbers of raw water sources, out of 255, with at least one result that exceeded the Guideline)
Health Guidelines: Turbidity (148), Lead (21), Arsenic (13), Uranium (6), Fluoride (5), Antimony (2), Barium (2), Selenium (2), Chromium (1), Nitrate (1),
Mercury (1) Aesthetic Guidelines: Manganese (143), Iron (84), Chloride (7), Sodium (2), Copper (1)
Organic Chemistry (Numbers of raw water sources, out of 255, with at least one result that exceeded the Guideline)
Health Guidelines: Benzo(a)pyrene (2) Aesthetic Guidelines: Toluene (1)
E. coli
Found in 1% of all samples Best: Never found
Worst: 25% of samples
E. coli
Found in 52% of all samples Best: 10% of samples
Worst: 100% of samples
Total Coliforms
Found in 13% of all samples Best: Never found
Worst: 91% of samples
15
5.0 Other Considerations
The New Brunswick Drinking Water Quality Guidelines (NBDWQG) have been adopted from the
Guidelines for Canadian Drinking Water Quality (Canadian Guidelines) established by Health
Canada. New Brunswick participates in the development of the Health Canada guidelines
through the Federal-Provincial-Territorial Committee for Drinking Water. Health Canada updates
various drinking water guidelines on an ongoing basis as new science and evidence becomes
available. The government reviews changes to the Canadian Guidelines to determine the best
approach for their adoption in New Brunswick.
This means that there are some Canadian Guidelines that are not yet included in the NBDWQG,
and in some cases, the guideline values may differ.
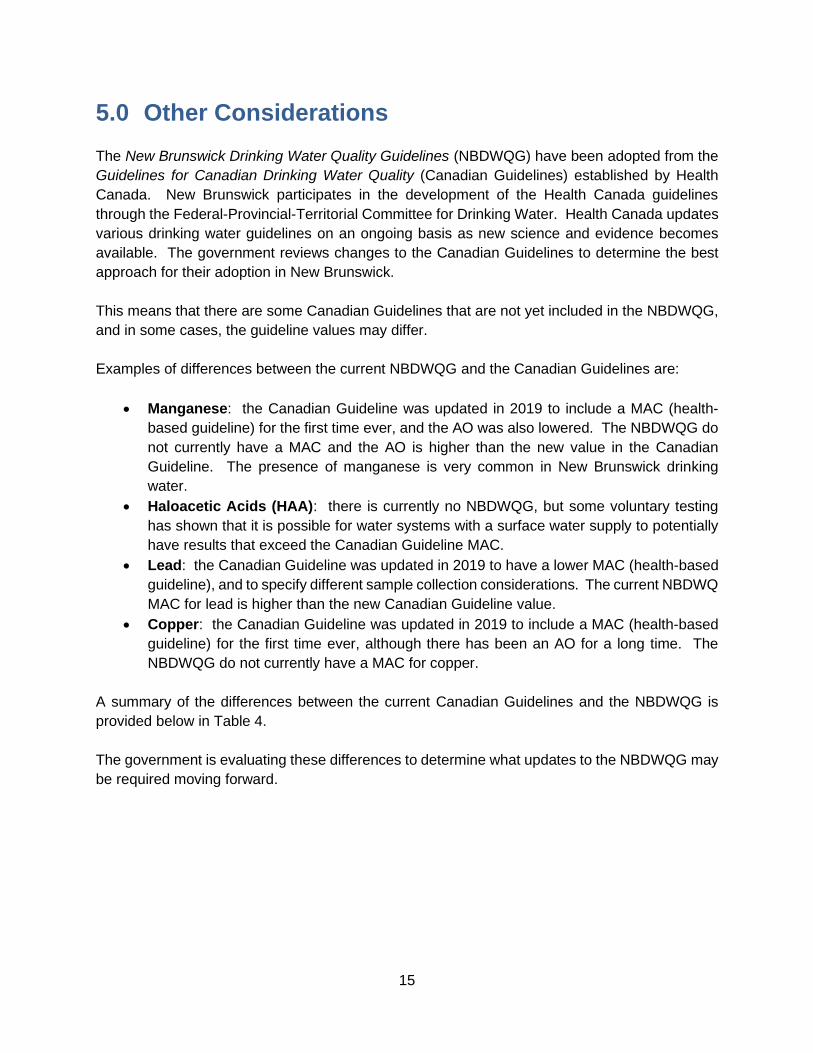
Examples of differences between the current NBDWQG and the Canadian Guidelines are:
• Manganese: the Canadian Guideline was updated in 2019 to include a MAC (health-
based guideline) for the first time ever, and the AO was also lowered. The NBDWQG do
not currently have a MAC and the AO is higher than the new value in the Canadian
Guideline. The presence of manganese is very common in New Brunswick drinking
water.
• Haloacetic Acids (HAA): there is currently no NBDWQG, but some voluntary testing
has shown that it is possible for water systems with a surface water supply to potentially
have results that exceed the Canadian Guideline MAC.
• Lead: the Canadian Guideline was updated in 2019 to have a lower MAC (health-based
guideline), and to specify different sample collection considerations. The current NBDWQ
MAC for lead is higher than the new Canadian Guideline value.
• Copper: the Canadian Guideline was updated in 2019 to include a MAC (health-based
guideline) for the first time ever, although there has been an AO for a long time. The
NBDWQG do not currently have a MAC for copper.
A summary of the differences between the current Canadian Guidelines and the NBDWQG is
provided below in Table 4.
The government is evaluating these differences to determine what updates to the NBDWQG may
be required moving forward.

16
Table 4 – Comparison of NBDWQG and Canadian Guideline Exceedances for Parameters Tested
in NB
(Note that the guideline values are the same for any parameters not appearing in this table)
Parameter (Type of guideline)
# distribution systems that had at least one result
above the NBDWQG10
# distribution systems that had at
least one result above the current
Canadian Guidelines
Parameters for which there is currently no corresponding NBDWQG
Aluminum (OG) (Note 1) -- 16
Copper (MAC) (Note 2) -- 5
Manganese (MAC) -- 28
1,2-Dichlorobenzene (AO) (Note 3) -- 1
1,4-Dichlorobenzene (AO) (Note 3) -- 14
Ethylbenzene (MAC) -- 0
Pentachlorophenol (AO) (Note 3) -- 0
Toluene (MAC) (Note 2) -- 0
Xylenes (MAC) -- 0
Parameters for which the Canadian Guideline is currently lower than the NBDWQG
Lead (MAC) 14 19
Manganese (AO) 34 44
Carbon Tetrachloride (MAC) 2 4
Ethylbenzene (AO) 6 9
Tetrachloroethylene (MAC) 1 1
Xylenes (AO) 0 5
Parameters for which the NBDWQG is currently lower than the Canadian Guideline
Selenium (MAC) 2 0
Benzo(a)pyrene (MAC) 3 1
Current Voluntary Testing Parameters (see Table 2) with a Canadian Guideline only
Haloacetic Acids (MAC) -- 3, but testing rare
Hardness (Note 4) -- 17
Nitrite (MAC) -- 0, but testing rare
pH (OG) (Note 1) -- 19 Low pH, 0 High pH
Zinc (AO) -- 0
(1) OG = Operational Guideline (this type of guideline does not exist in the NBDWQG)
(2) The NBDWQG do not have a MAC for Copper or Toluene but the AOs for them are the same as in the Canadian
Guidelines
(3) The NBDWQG do not have an AO for 1,2-Dichlorobenzene, 1,4-Dichlorobenzene or Pentachlorophenol but the
MACs for them are the same as in the Canadian Guidelines
(4) Although there is no guideline limit value for Hardness in the Canadian Guidelines, the guideline technical
document states that “Water supplies with a hardness greater than 200 mg/L are considered poor but have been
tolerated by consumers.” The number of water distribution systems with at least 1 Hardness result above this
level is presented here for information only.
10 NBDWQG = New Brunswick Drinking Water Quality Guidelines
17
6.0 Conclusion
This report provides a review of past water quality data for every regulated drinking water system
that is owned or operated by a local government in New Brunswick and compares the results to
the New Brunswick Drinking Water Quality Guidelines. Detailed findings for each individual water
distribution system are available in Appendix A.
The bacteria findings show that the water provided by these water systems was generally very
good and rarely had harmful bacteria present. However, some raw water often had bacteria
present.
The chemistry findings show that the most common exceedances of the health-based guidelines
were for turbidity and lead. Less often, exceedances were found for arsenic, uranium, selenium,
and fluoride, as well as a few other parameters on rare occasions. There were also occasional
exceedances of the health-based guidelines for some disinfection by-products in particular water
systems.
For those chemistry-based parameters with aesthetic guidelines, the most common exceedances
were for manganese and iron, and less often copper, chloride, and sodium.
The bacteria and chemistry test results highlight that proper water treatment, disinfection, and
operations are key to ensuring safe and good quality drinking water.
The findings in this report are useful because they will increase the transparency of drinking water
quality data that is available to the public and can help government to prioritize which water
systems may need additional support to ensure even more consistent, safe and reliable drinking
water in the future.

18
7.0 Glossary
AO (Aesthetic Objective) – a maximum concentration of a substance in drinking water,
established to prevent impairment of the taste, smell, or colour of water; or to prevent conditions
that may interfere with the supply of good quality water. AOs are specified in the New Brunswick
Drinking Water Quality Guidelines.
Boil Order – an Order issued by a Regional Medical Officer of Health under the Public Health
Act, requiring a water system owner to advise consumers to boil water before use. Boiling water
according to the directions is designed to kill any potentially disease-causing microorganisms,
making it safe to drink.
Coliform bacteria – see Total coliforms
Disinfection – inactivation or destruction of pathogens in drinking water by chlorination, ultraviolet
light or other methods.
Disinfection by-products – substances that form as a result of the drinking water disinfection
process (e.g. due to the chemical reaction of chlorine with naturally-occurring organic compounds
in water).
Distribution system – the storage tanks, water towers, pipes, etc. that are involved in carrying
drinking water to the users after treatment.
E. coli – the most abundant microorganism in mammalian faeces. Its presence in drinking water
always indicates recent contact with sewage or other sources of faecal matter, and signals a
health risk due to the likely presence of pathogens that can be present in faeces.
Exceedance – when a test result value is greater than the Guideline value (or outside the range
in a few cases where the Guideline is a range rather than a maximum). An exceedance in a test
sample indicates that the water quality was not acceptable due to the affected parameter.
Guideline – refers to the New Brunswick Drinking Water Quality Guidelines, except where noted.
Genera – plural of genus, a part of the classification and naming system of living organisms, e.g.
Escherichia coli (E. coli) is the name of one particular species of bacteria belonging to the genus
Escherichia. Similarly, Escherichia and Klebsiella are two genera belonging to the Total Coliforms
group.
Groundwater Well – a drilled well that draws water from an underground aquifer.
Infiltration Gallery – a man-made water intake structure with perforated pipes and gravel filter
beds built into a river bank.

19
Inorganic Chemistry – the study of elements and chemical compounds that do not contain
carbon. Examples of inorganic chemistry parameters typically tested in drinking water include
metals, sodium, chloride and nitrate.
MAC (Maximum Acceptable Concentration) – a maximum concentration of a substance in
drinking water, established to prevent adverse health effects. MACs are specified in the New
Brunswick Drinking Water Quality Guidelines.
Microbiology – the study of living microorganisms such as bacteria, viruses and microscopic
parasites. In the context of drinking water testing, the Microbiology parameters tested are typically
E. coli and Total Coliforms.
Multi-Barrier Approach – a framework for ensuring the safety of drinking water that forms the
basis for regulating drinking water systems in New Brunswick. The barriers that prevent
contamination of water are: source water protection, appropriate water treatment, proper
operations and maintenance, a secure distribution system, monitoring and alarms, and
emergency response protocols.
mg/L (milligrams per litre) - 1 mg/L is equivalent to 1 ppm (part per million)
µg/L (micrograms per litre) - 1 µg/L is equivalent to 1 ppb (part per billion)
NBDWQG - New Brunswick Drinking Water Quality Guidelines
NTU (Nephelometric Turbidity Unit) - a measure of the cloudiness of water based on the
scattering of a beam of light, which indicates the amount of suspended particles in water. NTUs
are the units used for Turbidity measurements.
OG (Operational Guideline) – a maximum concentration or acceptable range of a substance in
drinking water established to avoid adverse affects on processes at a water treatment plant or in
the drinking water distribution system. OGs are specified in the Guidelines for Canadian Drinking
Water Quality.
Organic Chemistry – the study of chemical compounds that contain carbon (except for simple
salts such as carbonates, which are considered to be part of inorganic chemistry). Examples of
organic chemistry parameters typically tested in drinking water include ethylbenzene and
trihalomethanes.
Parameters – the specific types of metals, chemicals, bacteria, etc. that are tested in a water
sample.
Pathogens – living microorganisms such as bacteria and viruses that can cause disease in
humans. (Also, when used as an adjective: pathogenic).

20
Raw water – source water before it is treated to remove contaminants or disinfected to
destroy/inactivate microorganisms.
Spring – a groundwater source that reaches the land surface naturally rather than via drilled
wells.
Surface Water Supply – a lake, river or dammed reservoir that supplies water via an intake pipe.
Total coliforms – include bacteria of the genera Escherichia, Klebsiella, Enterobacter,
Citrobacter, Serratia, and many others that occur commonly in the natural environment. Most
total coliforms are not disease-causing (pathogenic). However, their presence in drinking water
can indicate that conditions exist where a health risk from other organisms might occur.
Trace metals – metallic elements normally present in water in small but measurable amounts.
Turbidity – a measure of cloudiness in water caused by tiny suspended particles. Although
turbidity can sometimes be caused by benign substances (such as clay or silt), increases in
turbidity may indicate a serious water quality issue such as surface water getting into a well,
excess runoff into a surface water supply, or a breakdown of filter performance in cases where
treatment for lowering turbidity is already in place. Because of the accompanying risk of
microbiological contamination, there is a Maximum Acceptable Concentration (health-based
guideline) assigned for turbidity, but it is quite complex. The complete New Brunswick Drinking
Water Quality Guideline for Turbidity is:
Private wells 1.0 NTU For private wells, determine the source of the problem and necessary corrective actions
Unfiltered surface water or ground water under direct influence of surface water
1.0 NTU In at least 95% of the measurements made, or at least 95% of the time each calendar month, and shall not exceed 3.0 NTU at any time
Chemically assisted filtration 0.3 NTU In at least 95% of the measurements made, or at least 95% of the time each calendar month, and shall not exceed 1.0 NTU at any time
Slow sand or diatomaceous earth filtration
1.0 NTU In at least 95% of the measurements made, or at least 95% of the time each calendar month, and shall not exceed 3.0 NTU at any time
Membrane filtration 0.1 NTU In at least 99% of the measurements made, or at least 99% of the time each calendar month, and shall not exceed 0.3 NTU at any time
Because of the complexity of applying this guideline across all water systems, a threshold
screening value of 1.0 NTU was used throughout this report to flag possible exceedances.
However, this approach may sometimes capture events that were not true exceedances of the
guideline, and may miss some exceedances in systems where filtration is in place.
VOCs (Volatile Organic Compounds) – a group of Organic compounds that evaporate easily.
All of the Organic compounds tested under municipal sampling plans and included in this report

21
are VOCs except benzo(a)pyrene and pentachlorophenol, but there are many other VOCs other
than the ones that are required test parameters.
Watershed Protected Area Designation Order – a legislative instrument under the Clean Water
Act that enables the protection of surface waters that serve as public drinking water supplies. The
Designation Order establishes appropriate restrictions on land use in a watershed.
Wellfield Protected Area Designation Order – a legislative instrument under the Clean Water
Act that enables the protection of water wells that serve as public drinking water supplies. The
Designation Order establishes appropriate restrictions on land use near the wells.
≤ – less than or equal to the number stated
< – less than the number stated
> – greater than the number stated

22
Appendix A – Drinking Water Quality
Delivered to Users Listed by Water System
(Treated Water)

23
Microbiology and Chemistry of Water in Distribution Systems: Summary of Guideline Exceedances
Individual water system findings in the pages that follow can be compared to these totals to indicate how common or uncommon each finding was.
Range of E. coli and Total Coliforms Detection Frequencies in Distribution Systems
Detection Frequency E. coli Total Coliforms
Not Detected in Any Sample In 64 of 73 systems In 9 of 73 systems
Median Detection Frequency -- 0.50% of samples
System with Most Frequent Detection 0.42% of samples 11% of samples
Key11 Number of Distribution Systems (out of 73) with at Least One Result that Exceeded the NB Guideline
Blank = the guideline was never exceeded As B Ba Cd Cr Cu F Fe Hg Mn NO3- Pb Sb Se TURB U Cl Na SO4
The guideline was exceeded in at least 10% of samples (or in at least 2 samples when 10 or fewer total samples)
1 0 1 0 0 1 0 10 0 23 0 1 0 1 18 2 2 1 0
The guideline was exceeded in less than 10% of samples (or in only 1 sample when 10 or fewer total samples)
3 0 0 0 1 5 2 13 0 11 1 13 1 1 23 1 1 0 0
Total 4 0 1 0 1 6 2 23 0 34 1 14 1 2 41 3 3 1 0
Key11 Number of Distribution Systems (out of 73) with at Least One Result that Exceeded the NB Guideline
Blank = the guideline was never exceeded 1,2-DCB 1,2-DCE 1,4-DCB 5-Cl-PH B(a)P BENZ CCl4 DCM EBENZ PCE TCE THM TOL XYL VINYL
The guideline was exceeded in at least 10% of samples (or in at least 2 samples when 10 or fewer total samples)
0 0 0 0 0 0 0 0 1 0 0 5 0 0 0
The guideline was exceeded in less than 10% of samples (or in only 1 sample when 10 or fewer total samples)
0 0 2 0 3 0 2 0 5 1 0 2 0 0 0
Total 0 0 2 0 3 0 2 0 6 1 0 7 0 0 0
11 See Table 1 for definitions of the symbols used for each test parameter
Overview for Context

24
For questions about current water quality please contact your local government.
Bacteria in Water Distribution System: Exceedances of Guidelines
(January 1, 2008 - December 31, 2014)
Total Number of Samples = 373
E. coli Total coliforms
Total coliform bacteria are used as an indicator and their presence in drinking water is not considered a risk to human health, but their presence can indicate unsanitary conditions in the water system. They are monitored regularly in drinking water to ensure public health and safety. For questions about current water quality please contact your local government.
Chemistry of Water in Distribution System: Exceedances of Guidelines
(January 1, 19941 - January 24, 2017)
Total Number of Samples = 12 Inorganic and 46 Organic
Turbidity is a measure of cloudiness in water caused by tiny suspended particles, which may be harmless. However, increases in turbidity can also indicate a serious water quality issue. It is monitored regularly in drinking water to ensure public health and safety. For questions about current water quality please contact your local government.
Ethylbenzene is a component of petroleum products such as gasoline, diesel fuel, solvents, and adhesives. It is monitored regularly in drinking water to ensure appropriate water quality (such as taste, odour and appearance). For questions about current water quality please contact your local government.
Notes:
1. The earliest available data were from 2005.
2. Or in at least 2 samples when there were 10 or fewer samples in total.
3. The actual Turbidity guideline is much more complex than this, but a 1 NTU threshold was used to flag
possible exceedances. However, this approach may sometimes capture events that were not true
exceedances and may miss some exceedances in systems where filtration is in place.
4. Or in only 1 sample when there were 10 or fewer samples in total.
5. All Ethylbenzene detections (and Xylenes, which were detected but at levels below the NB guideline)
occurred on the same day in May 2005. This was the first ever sampling day under the Clean Water
Act for this system when it was newly constructed, so these detections may have been a result of
construction. It is also possible that these detections could have been an artifact due to sampling or
analysis methods.
Alma
Not detected Detected in 2 samples
(0.54% of all samples)
The guideline was exceeded in at least 10% of samples2
Maximum result Guideline
Turbidity 1.9 NTU 1.0 NTU3
The guideline was exceeded in less than 10% of samples4
Maximum result Guideline
Ethylbenzene5 0.0094 mg/L AO = 0.0024 mg/L

25
For questions about current water quality please contact your local government.
Total coliform bacteria are used as an indicator and their presence in drinking water is not considered a risk to human health, but their presence can indicate unsanitary conditions in the water system. They are monitored regularly in drinking water to ensure public health and safety. For questions about current water quality please contact your local government.
Chemistry of Water in Distribution System: Exceedances of Guidelines
(January 1, 19941 - January 27, 2017)
Total Number of Samples = 4 Inorganic and 33 Organic
Notes:
1. The earliest available data were from 2007. Very few inorganic chemistry results were available.
For questions about current water quality please contact your local government.
Bacteria in Water Distribution System: Exceedances of Guidelines
(January 1, 2008- December 31, 2014)
Total Number of Samples = 357
E. coli Total coliforms
Aroostook
Not detected Detected in 1 sample
(0.28% of all samples)
No Exceedances of NB Guidelines

26
For questions about current water quality please contact your local government.
Bacteria in Water Distribution System: Exceedances of Guidelines
(January 1, 2008 - December 31, 2014)
Total Number of Samples = 714
E. coli Total coliforms
Total coliform bacteria are used as an indicator and their presence in drinking water is not considered a risk to human health, but their presence can indicate unsanitary conditions in the water system. They are monitored regularly in drinking water to ensure public health and safety. For questions about current water quality please contact your local government.
Chemistry of Water in Distribution System: Exceedances of Guidelines
(January 1, 1994 - January 30, 2017)
Total Number of Samples = 34 Inorganic and 62 Organic
For questions about current water quality please contact your local government.
Atholville
Not detected Detected in 1 sample
(0.14% of all samples)
No Exceedances of NB Guidelines

27
For questions about current water quality please contact your local government.
Bacteria in Water Distribution System: Exceedances of Guidelines
(January 1, 2008 - December 31, 2014)
Total Number of Samples = 415
E. coli Total coliforms
Total coliform bacteria are used as an indicator and their presence in drinking water is not considered a risk to human health, but their presence can indicate unsanitary conditions in the water system. They are monitored regularly in drinking water to ensure public health and safety. For questions about current water quality please contact your local government.
Chemistry of Water in Distribution System: Exceedances of Guidelines
(January 1, 1994 - January 30, 2017)
Total Number of Samples = 19 Inorganic and 133 Organic
Manganese is commonly found in rocks, soils and water in many areas of NB. It is monitored regularly in drinking water to ensure appropriate water quality (such as taste, odour and appearance). For questions about current water quality please contact your local government.
Lead in drinking water is most commonly due to leaching from lead service lines. Other plumbing components, such as solder or brass faucets or valves, may also contain lead. It is monitored regularly in drinking water to ensure public health and safety. Turbidity is a measure of cloudiness in water caused by tiny suspended particles, which may be harmless. However, increases in turbidity can also indicate a serious water quality issue. It is monitored regularly in drinking water to ensure public health and safety. For questions about current water quality please contact your local government.
Notes:
1. Or in at least 2 samples when there were 10 or fewer samples in total.
2. Or in only 1 sample when there were 10 or fewer samples in total.
3. The actual Turbidity guideline is much more complex than this, but a 1 NTU threshold was used to flag
possible exceedances. However, this approach may sometimes capture events that were not true
exceedances and may miss some exceedances in systems where filtration is in place.
Baker Brook
Not detected Detected in 7 samples
(1.68% of all samples)
The guideline was exceeded in at least 10% of samples1
Maximum result Guideline
Manganese 0.25 mg/L AO = 0.05 mg/L
The guideline was exceeded in less than 10% of samples2
Maximum result Guideline
Lead 0.012 mg/L MAC = 0.01 mg/L
Turbidity 4.3 NTU 1.0 NTU3

28
For questions about current water quality please contact your local government.
Bacteria in Water Distribution System: Exceedances of Guidelines
(January 1, 2008 - December 31, 2014)
Total Number of Samples = 365
E. coli Total coliforms
Total coliform bacteria are used as an indicator and their presence in drinking water is not considered a risk to human health, but their presence can indicate unsanitary conditions in the water system. They are monitored regularly in drinking water to ensure public health and safety. For questions about current water quality please contact your local government.
Chemistry of Water in Distribution System: Exceedances of Guidelines
(January 1, 1994 - February 14, 2017)
Total Number of Samples = 15 Inorganic and 32 Organic
Turbidity is a measure of cloudiness in water caused by tiny suspended particles, which may be harmless. However, increases in turbidity can also indicate a serious water quality issue. It is monitored regularly in drinking water to ensure public health and safety. Iron is present in almost all soils and many rocks. It is monitored regularly in drinking water to ensure appropriate water quality (such as taste, odour and appearance). For questions about current water quality please contact your local government.
Notes:
1. Or in only 1 sample when there were 10 or fewer samples in total.
2. This was the only exceedance of this parameter, and the sample was taken in 1999.
3. The actual Turbidity guideline is much more complex than this, but a 1 NTU threshold was used to flag
possible exceedances. However, this approach may sometimes capture events that were not true
exceedances and may miss some exceedances in systems where filtration is in place.
4. This was the only exceedance of this parameter, and the sample was taken in 1999.
Balmoral
Not detected Detected in 2 samples
(0.55% of all samples)
The guideline was exceeded in less than 10% of samples1
Maximum result Guideline
Turbidity 2.2 NTU2 1.0 NTU3
Iron 0.347 mg/L4 AO = 0.3 mg/L

29
For questions about current water quality please contact your local government.
Bacteria in Water Distribution System: Exceedances of Guidelines
(January 1, 2008 - December 31, 2014)
Total Number of Samples = 361
E. coli Total coliforms
Total coliform bacteria are used as an indicator and their presence in drinking water is not considered a risk to human health, but their presence can indicate unsanitary conditions in the water system. They are monitored regularly in drinking water to ensure public health and safety. For questions about current water quality please contact your local government.
Chemistry of Water in Distribution System: Exceedances of Guidelines
(January 1, 1994 - February 15, 2017)
Total Number of Samples = 13 Inorganic and 43 Organic
For questions about current water quality please contact your local government.
Bas-Caraquet
Detected in 3 samples
(0.83% of all samples) Not detected
No Exceedances of NB Guidelines

30
For questions about current water quality please contact your local government.
Bacteria in Water Distribution System: Exceedances of Guidelines
(January 1, 2008 - December 31, 2014)
Total Number of Samples = 366
E. coli Total coliforms
Total coliform bacteria are used as an indicator and their presence in drinking water is not considered a risk to human health, but their presence can indicate unsanitary conditions in the water system. They are monitored regularly in drinking water to ensure public health and safety. For questions about current water quality please contact your local government.
Chemistry of Water in Distribution System: Exceedances of Guidelines
(January 1, 19941 - February 16, 2017)
Total Number of Samples = 14 Inorganic and 38 Organic
Notes:
1. The earliest available data were from 2004.
For questions about current water quality please contact your local government.
Bath
Not detected Detected in 2 samples
(0.55% of all samples)
No Exceedances of NB Guidelines

31
For questions about current water quality please contact your local government.
Bacteria in Water Distribution System: Exceedances of Guidelines
(January 1, 2008 - December 31, 2014)
Total Number of Samples = 1296 (Bathurst); 446 (Beresford)
E. coli Total coliforms
Bathurst
Beresford
E. coli (Escherichia coli) is a species of bacteria that is naturally found in the intestines of humans and warm-blooded animals. As it is not usually found naturally in soils or water, the presence of E. coli in a water sample is a good indicator of recent faecal contamination. Drinking water should not contain any E. coli. It is monitored regularly in drinking water to ensure public health and safety. Total coliform bacteria are used as an indicator and their presence in drinking water is not considered a risk to human health, but their presence can indicate unsanitary conditions in the water system. They are monitored regularly in drinking water to ensure public health and safety. For questions about current water quality please contact your local government.
Bathurst / Beresford
Detected in 2 samples
(0.15% of all samples)
Not detected
Detected in 12 samples
(0.93% of all samples)
Detected in10 samples
(2.24% of all samples)
32
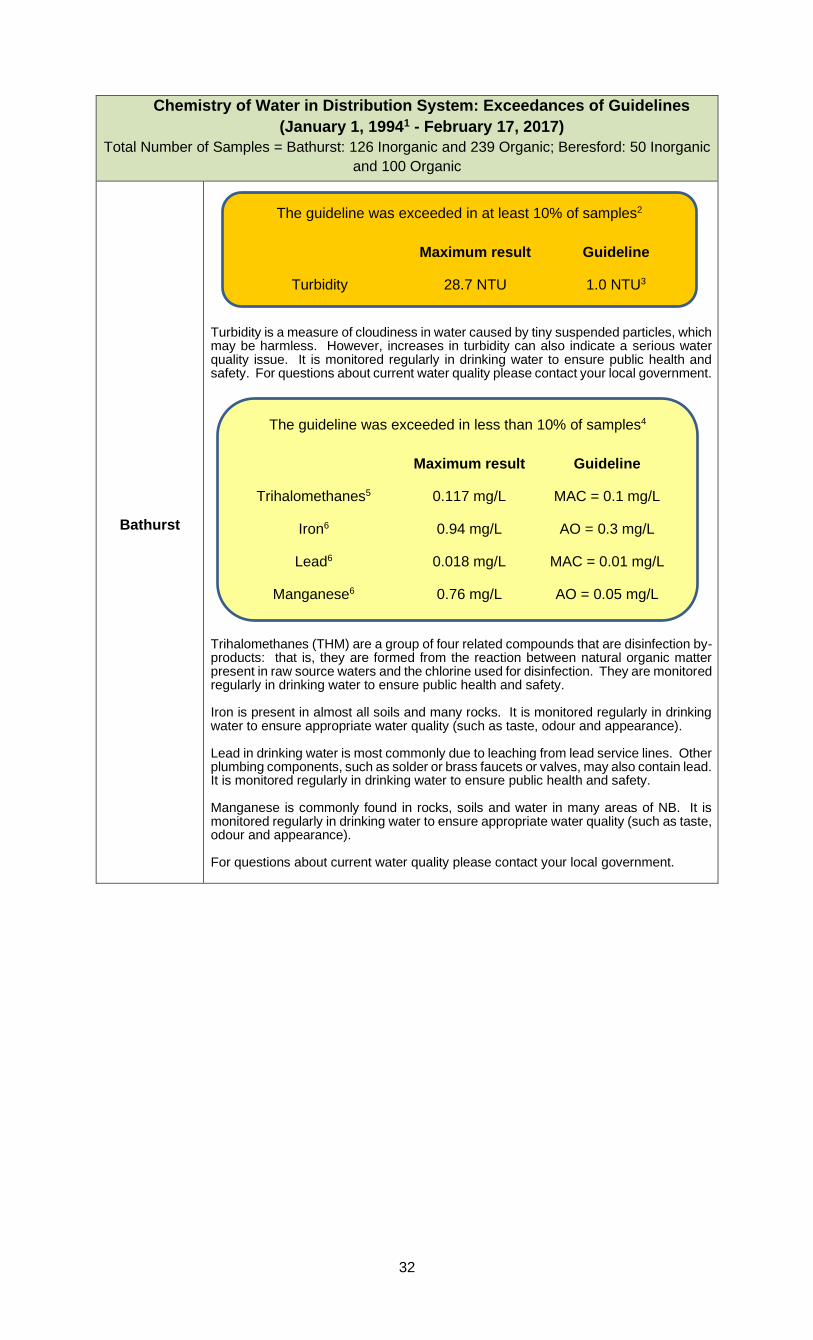
Chemistry of Water in Distribution System: Exceedances of Guidelines
(January 1, 19941 - February 17, 2017)
Total Number of Samples = Bathurst: 126 Inorganic and 239 Organic; Beresford: 50 Inorganic
and 100 Organic
Bathurst
Turbidity is a measure of cloudiness in water caused by tiny suspended particles, which may be harmless. However, increases in turbidity can also indicate a serious water quality issue. It is monitored regularly in drinking water to ensure public health and safety. For questions about current water quality please contact your local government.
Trihalomethanes (THM) are a group of four related compounds that are disinfection by-products: that is, they are formed from the reaction between natural organic matter present in raw source waters and the chlorine used for disinfection. They are monitored regularly in drinking water to ensure public health and safety. Iron is present in almost all soils and many rocks. It is monitored regularly in drinking water to ensure appropriate water quality (such as taste, odour and appearance). Lead in drinking water is most commonly due to leaching from lead service lines. Other plumbing components, such as solder or brass faucets or valves, may also contain lead. It is monitored regularly in drinking water to ensure public health and safety. Manganese is commonly found in rocks, soils and water in many areas of NB. It is monitored regularly in drinking water to ensure appropriate water quality (such as taste, odour and appearance). For questions about current water quality please contact your local government.
The guideline was exceeded in at least 10% of samples2
Maximum result Guideline
Turbidity 28.7 NTU 1.0 NTU3
The guideline was exceeded in less than 10% of samples4
Maximum result Guideline
Trihalomethanes5 0.117 mg/L MAC = 0.1 mg/L
Iron6 0.94 mg/L AO = 0.3 mg/L
Lead6 0.018 mg/L MAC = 0.01 mg/L
Manganese6 0.76 mg/L AO = 0.05 mg/L
33
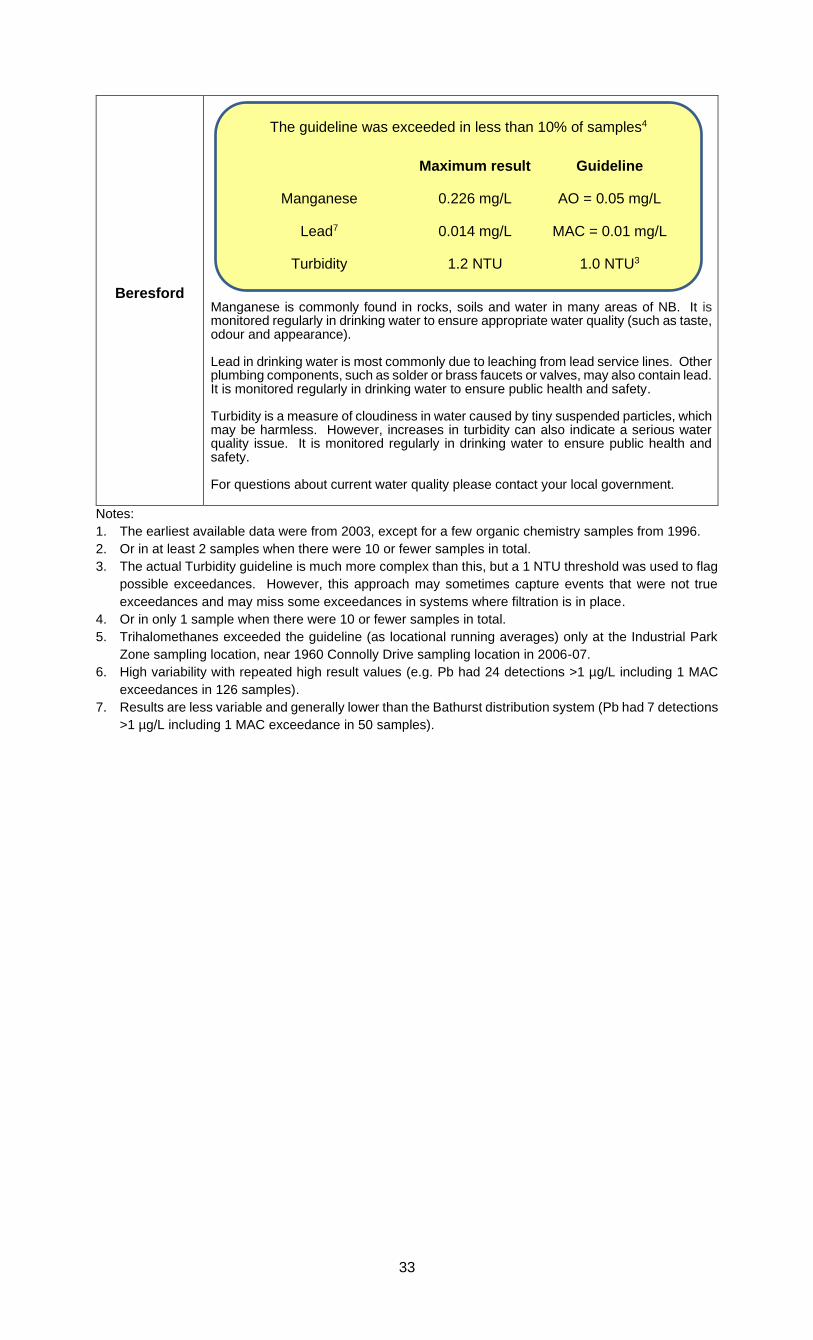
Beresford
Manganese is commonly found in rocks, soils and water in many areas of NB. It is monitored regularly in drinking water to ensure appropriate water quality (such as taste, odour and appearance). Lead in drinking water is most commonly due to leaching from lead service lines. Other plumbing components, such as solder or brass faucets or valves, may also contain lead. It is monitored regularly in drinking water to ensure public health and safety. Turbidity is a measure of cloudiness in water caused by tiny suspended particles, which may be harmless. However, increases in turbidity can also indicate a serious water quality issue. It is monitored regularly in drinking water to ensure public health and safety. For questions about current water quality please contact your local government.
Notes:
1. The earliest available data were from 2003, except for a few organic chemistry samples from 1996.
2. Or in at least 2 samples when there were 10 or fewer samples in total.
3. The actual Turbidity guideline is much more complex than this, but a 1 NTU threshold was used to flag
possible exceedances. However, this approach may sometimes capture events that were not true
exceedances and may miss some exceedances in systems where filtration is in place.
4. Or in only 1 sample when there were 10 or fewer samples in total.
5. Trihalomethanes exceeded the guideline (as locational running averages) only at the Industrial Park
Zone sampling location, near 1960 Connolly Drive sampling location in 2006-07.
6. High variability with repeated high result values (e.g. Pb had 24 detections >1 µg/L including 1 MAC
exceedances in 126 samples).
7. Results are less variable and generally lower than the Bathurst distribution system (Pb had 7 detections
>1 µg/L including 1 MAC exceedance in 50 samples).
The guideline was exceeded in less than 10% of samples4
Maximum result Guideline
Manganese 0.226 mg/L AO = 0.05 mg/L
Lead7 0.014 mg/L MAC = 0.01 mg/L
Turbidity 1.2 NTU 1.0 NTU3

34
For questions about current water quality please contact your local government.
Bacteria in Water Distribution System: Exceedances of Guidelines
(January 1, 2010 – December 31, 2014)1
Total Number of Samples = 239
E. coli Total coliforms
Notes
1. Only 5 years of data were available (2010 to 2014).
E. coli (Escherichia coli) is a species of bacteria that is naturally found in the intestines of humans and warm-blooded animals. As it is not usually found naturally in soils or water, the presence of E. coli in a water sample is a good indicator of recent faecal contamination. Drinking water should not contain any E. coli. It is monitored regularly in drinking water to ensure public health and safety. Total coliform bacteria are used as an indicator and their presence in drinking water is not considered a risk to human health, but their presence can indicate unsanitary conditions in the water system. They are monitored regularly in drinking water to ensure public health and safety. For questions about current water quality please contact your local government.
Chemistry of Water in Distribution System: Exceedances of Guidelines
(January 1, 19941 - February 22, 2017)
Total Number of Samples = 10 Inorganic and 37 Organic
Notes:
1. The earliest available data were from 2010.
For questions about current water quality please contact your local government.
Belledune
Detected in 1 sample
(0.42% of all samples)
Detected in 1 sample
(0.42% of all samples)
No Exceedances of NB Guidelines

35
For questions about current water quality please contact your local government.
Bacteria in Water Distribution System: Exceedances of Guidelines
(January 1, 2008 - December 31, 2014)
Total Number of Samples = 468
E. coli Total coliforms
For questions about current water quality please contact your local government.
Chemistry of Water in Distribution System: Exceedances of Guidelines
(January 1, 1994 - February 27, 2017)
Total Number of Samples = 102 Inorganic and 67 Organic
Iron is present in almost all soils and many rocks. It is monitored regularly in drinking water to ensure appropriate water quality (such as taste, odour and appearance). Manganese is commonly found in rocks, soils and water in many areas of NB. It is monitored regularly in drinking water to ensure appropriate water quality (such as taste, odour and appearance). Turbidity is a measure of cloudiness in water caused by tiny suspended particles, which may be harmless. However, increases in turbidity can also indicate a serious water quality issue. It is monitored regularly in drinking water to ensure public health and safety. For questions about current water quality please contact your local government.
Arsenic detected in drinking water is almost always due to natural sources in the rock and soil surrounding a well, and this can be common in some areas of NB. It is monitored regularly in drinking water to ensure public health and safety. Fluoride is sometimes used in large public water supply systems for its public health benefits, but it also often occurs naturally in well water and the amounts can vary greatly from one well to another. Fluoride levels are monitored regularly in drinking water to ensure public health and safety. For questions about current water quality please contact your local government.
Notes:
Blacks Harbour
Not detected Not detected
The guideline was exceeded in at least 10% of samples1
Maximum result Guideline
Iron 6.26 mg/L AO = 0.3 mg/L
Manganese 0.297 mg/L AO = 0.05 mg/L
Turbidity 7.14 NTU 1.0 NTU2
The guideline was exceeded in less than 10% of samples3
Maximum result Guideline
Arsenic4 0.017 mg/L MAC = 0.010 mg/L
Fluoride5 32 mg/L MAC = 1.5 mg

36
1. Or in at least 2 samples when there were 10 or fewer samples in total.
2. The actual Turbidity guideline is much more complex than this, but a 1 NTU threshold was used to flag
possible exceedances. However, this approach may sometimes capture events that were not true
exceedances and may miss some exceedances in systems where filtration is in place.
3. Or in only 1 sample when there were 10 or fewer samples in total.
4. Arsenic was detected in 83 of 102 samples, including three samples that exceeded the MAC
5. Fluoride maximum value of 32 mg/L is an unexplained outlier (the next highest recorded value was 0.6
mg/L)

37
For questions about current water quality please contact your local government.
Bacteria in Water Distribution System: Exceedances of Guidelines
(January 1, 2008 - December 31, 2014)
Total Number of Samples = 535
E. coli Total coliforms
Total coliform bacteria are used as an indicator and their presence in drinking water is not considered a risk to human health, but their presence can indicate unsanitary conditions in the water system. They are monitored regularly in drinking water to ensure public health and safety. For questions about current water quality please contact your local government.
Chemistry of Water in Distribution System: Exceedances of Guidelines
(January 1, 1994 - February 27, 2017)
Total Number of Samples = 21 Inorganic and 85 Organic
For questions about current water quality please contact your local government.
Bouctouche
Not detected Detected in 3 samples
(0.56% of all samples)
No Exceedances of NB Guidelines

38
For questions about current water quality please contact your local government.
Bacteria in Water Distribution System: Exceedances of Guidelines
(January 1, 2008 - December 31, 2014)
Total Number of Samples =1070
E. coli Total coliforms
Total coliform bacteria are used as an indicator and their presence in drinking water is not considered a risk to human health, but their presence can indicate unsanitary conditions in the water system. They are monitored regularly in drinking water to ensure public health and safety. For questions about current water quality please contact your local government.
Chemistry of Water in Distribution System: Exceedances of Guidelines
(January 1, 1994 - February 28, 2017)
Total Number of Samples = 20 Inorganic and 146 Organic
For questions about current water quality please contact your local government.
Campbellton
Not detected Detected in 3 samples
(0.28% of all samples)
No Exceedances of NB Guidelines

39
For questions about current water quality please contact your local government.
Bacteria in Water Distribution System: Exceedances of Guidelines
(January 1, 2008 - December 31, 2014)
Total Number of Samples = 566
E. coli Total coliforms
Total coliform bacteria are used as an indicator and their presence in drinking water is not considered a risk to human health, but their presence can indicate unsanitary conditions in the water system. They are monitored regularly in drinking water to ensure public health and safety. For questions about current water quality please contact your local government.
Chemistry of Water in Distribution System: Exceedances of Guidelines
(January 1, 19941 - March 1, 2017)
Total Number of Samples = 20 Inorganic and 56 Organic
Chromium is a common element in nature. It is monitored regularly in drinking water to ensure public health and safety. For questions about current water quality please contact your local government.
Notes:
1. Data were available back to 1994, but there were no data available between 1996 and 2002 inclusive.
2. Or in only 1 sample when there were 10 or fewer samples in total.
3. Chromium exceedance (0.12 mg/L) is an outlier; it was the only sample with a detectable level.
Caraquet
Not detected Detected in 2 samples
(0.35% of all samples)
The guideline was exceeded in less than 10% of samples2
Maximum result Guideline
Chromium2 0.12 mg/L MAC = 0.05 mg/L

40
For questions about current water quality please contact your local government.
Bacteria in Water Distribution System: Exceedances of Guidelines
(January 1, 2008 – March 1, 2017)
Total Number of Samples = 426
E. coli Total coliforms
E. coli (Escherichia coli) is a species of bacteria that is naturally found in the intestines of humans and warm-blooded animals. As it is not usually found naturally in soils or water, the presence of E. coli in a water sample is a good indicator of recent faecal contamination. Drinking water should not contain any E. coli. It is monitored regularly in drinking water to ensure public health and safety. Total coliform bacteria are used as an indicator and their presence in drinking water is not considered a risk to human health, but their presence can indicate unsanitary conditions in the water system. They are monitored regularly in drinking water to ensure public health and safety. For questions about current water quality please contact your local government.
Chemistry of Water in Distribution System: Exceedances of Guidelines
(January 1, 1994 - March 1, 2017)
Total Number of Samples = 10 Inorganic and 25 Organic
For questions about current water quality please contact your local government.
Charlo
Detected in 1 sample
(0.23% of all samples)
Detected in 2 samples
(0.47% of all samples)
No Exceedances of NB Guidelines

41
For questions about current water quality please contact your local government.
Bacteria in Water Distribution System: Exceedances of Guidelines
(January 1, 2008 - December 31, 2014)
Total Number of Samples = 419
E. coli Total coliforms
Total coliform bacteria are used as an indicator and their presence in drinking water is not considered a risk to human health, but their presence can indicate unsanitary conditions in the water system. They are monitored regularly in drinking water to ensure public health and safety. For questions about current water quality please contact your local government.
Chemistry of Water in Distribution System: Exceedances of Guidelines
(January 1, 19941 - March 2, 2017)
Total Number of Samples = 12 Inorganic and 49 Organic
Clair
(2002 to
2017)
Manganese is commonly found in rocks, soils and water in many areas of NB. It is monitored regularly in drinking water to ensure appropriate water quality (such as taste, odour and appearance). Lead in drinking water is most commonly due to leaching from lead service lines. Other plumbing components, such as solder or brass faucets or valves, may also contain lead. It is monitored regularly in drinking water to ensure public health and safety. Turbidity is a measure of cloudiness in water caused by tiny suspended particles, which may be harmless. However, increases in turbidity can also indicate a serious water quality issue. It is monitored regularly in drinking water to ensure public health and safety. For questions about current water quality please contact your local government.
The guideline was exceeded in at least 10% of samples2
Maximum result Guideline
Manganese 0.23 mg/L AO = 0.05 mg/L
Lead3 0.02 mg/L MAC = 0.01 mg/L
Turbidity 4.19 NTU 1.0 NTU4
Not detected Detected in 5 samples
(1.19% of all samples)
Clair

42
Clair
(1997 to
1999)5
Manganese is commonly found in rocks, soils and water in many areas of NB. It is monitored regularly in drinking water to ensure appropriate water quality (such as taste, odour and appearance). For questions about current water quality please contact your local government.
Arsenic detected in drinking water is almost always due to natural sources in the rock and soil surrounding a well, and this can be common in some areas of NB. It is monitored regularly in drinking water to ensure public health and safety. Iron is present in almost all soils and many rocks. It is monitored regularly in drinking water to ensure appropriate water quality (such as taste, odour and appearance). Turbidity is a measure of cloudiness in water caused by tiny suspended particles, which may be harmless. However, increases in turbidity can also indicate a serious water quality issue. It is monitored regularly in drinking water to ensure public health and safety. For questions about current water quality please contact your local government.
Notes:
1. The earliest available data were from 1997
2. Or in at least 2 samples when there were 10 or fewer samples in total.
3. From 2002 to 2015, lead was frequently detected (8 of 12 samples, including 2 that exceeded the
guideline).
4. The actual Turbidity guideline is much more complex than this, but a 1 NTU threshold was used to flag
possible exceedances. However, this approach may sometimes capture events that were not true
exceedances and may miss some exceedances in systems where filtration is in place.
5. The water chemistry appeared to be considerably different during this time period compared to later
data, likely due to a change in water source(s).
6. Or in only 1 sample when there were 10 or fewer samples in total.
7. From 1997 to 1999 only, arsenic was present at significant levels (range 2.9 to 19.6 µg/L) including 1
exceedance.
The guideline was exceeded in at least 10% of samples2
Maximum result Guideline
Manganese 0.23 mg/L AO = 0.05 mg/L
The guideline was exceeded in less than 10% of samples6
Maximum result Guideline
Arsenic7 0.0196 mg/L MAC = 0.01mg/L
Iron 2.17 mg/L AO = 0.3 mg/L
Turbidity 10.8 NTU 1.0 NTU4

43
For questions about current water quality please contact your local government.
Bacteria in Water Distribution System: Exceedances of Guidelines
(January 1, 2008 - December 31, 2014)
Total Number of Samples = 510
E. coli Total coliforms
E. coli (Escherichia coli) is a species of bacteria that is naturally found in the intestines of humans and warm-blooded animals. As it is not usually found naturally in soils or water, the presence of E. coli in a water sample is a good indicator of recent faecal contamination. Drinking water should not contain any E. coli. It is monitored regularly in drinking water to ensure public health and safety. Total coliform bacteria are used as an indicator and their presence in drinking water is not considered a risk to human health, but their presence can indicate unsanitary conditions in the water system. They are monitored regularly in drinking water to ensure public health and safety. For questions about current water quality please contact your local government.
Dalhousie
Detected in 1 sample
(0.20% of all samples)
Detected in 4 samples
(0.78% of all samples)
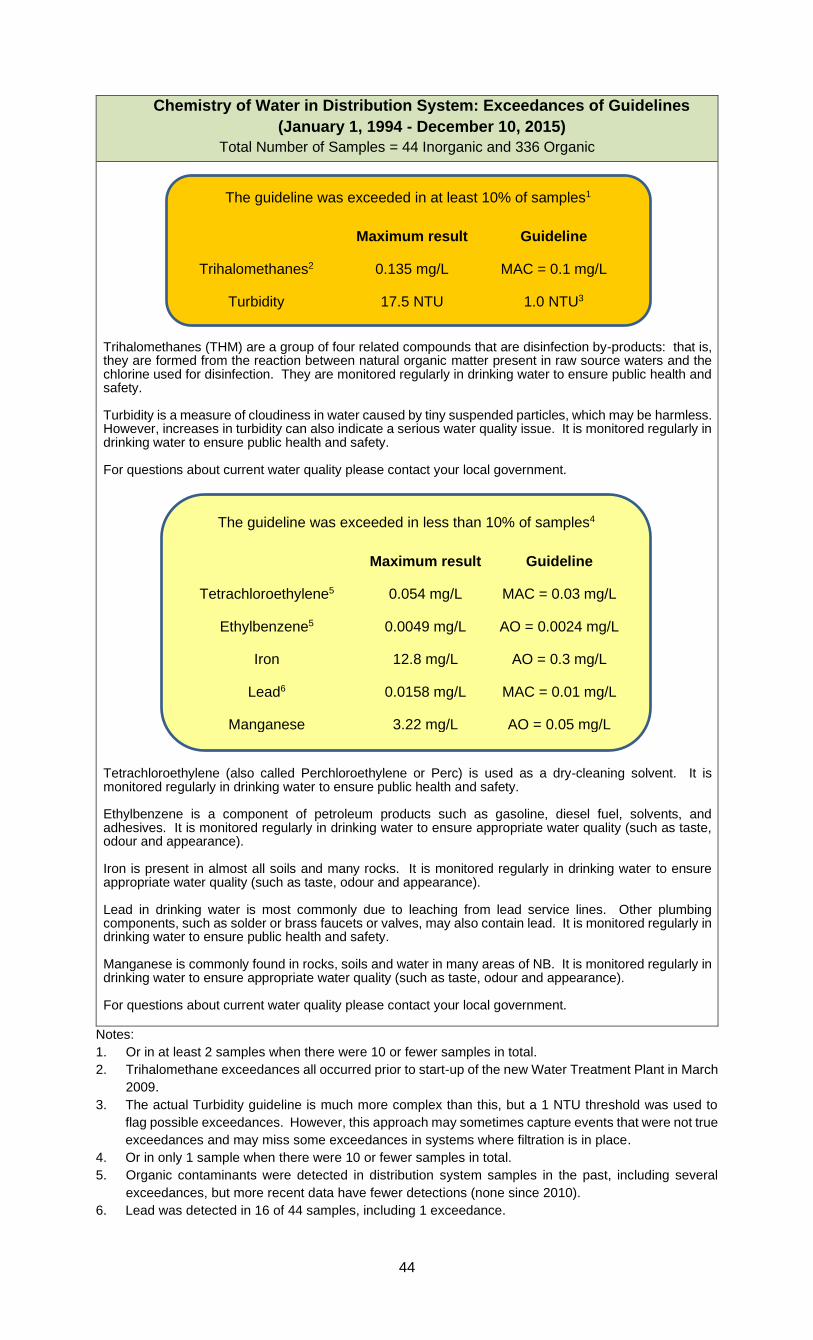
44
Chemistry of Water in Distribution System: Exceedances of Guidelines
(January 1, 1994 - December 10, 2015)
Total Number of Samples = 44 Inorganic and 336 Organic
Trihalomethanes (THM) are a group of four related compounds that are disinfection by-products: that is, they are formed from the reaction between natural organic matter present in raw source waters and the chlorine used for disinfection. They are monitored regularly in drinking water to ensure public health and safety. Turbidity is a measure of cloudiness in water caused by tiny suspended particles, which may be harmless. However, increases in turbidity can also indicate a serious water quality issue. It is monitored regularly in drinking water to ensure public health and safety. For questions about current water quality please contact your local government.
Tetrachloroethylene (also called Perchloroethylene or Perc) is used as a dry-cleaning solvent. It is monitored regularly in drinking water to ensure public health and safety. Ethylbenzene is a component of petroleum products such as gasoline, diesel fuel, solvents, and adhesives. It is monitored regularly in drinking water to ensure appropriate water quality (such as taste, odour and appearance). Iron is present in almost all soils and many rocks. It is monitored regularly in drinking water to ensure appropriate water quality (such as taste, odour and appearance). Lead in drinking water is most commonly due to leaching from lead service lines. Other plumbing components, such as solder or brass faucets or valves, may also contain lead. It is monitored regularly in drinking water to ensure public health and safety. Manganese is commonly found in rocks, soils and water in many areas of NB. It is monitored regularly in drinking water to ensure appropriate water quality (such as taste, odour and appearance). For questions about current water quality please contact your local government.
Notes:
1. Or in at least 2 samples when there were 10 or fewer samples in total.
2. Trihalomethane exceedances all occurred prior to start-up of the new Water Treatment Plant in March
2009.
3. The actual Turbidity guideline is much more complex than this, but a 1 NTU threshold was used to
flag possible exceedances. However, this approach may sometimes capture events that were not true
exceedances and may miss some exceedances in systems where filtration is in place.
4. Or in only 1 sample when there were 10 or fewer samples in total.
5. Organic contaminants were detected in distribution system samples in the past, including several
exceedances, but more recent data have fewer detections (none since 2010).
6. Lead was detected in 16 of 44 samples, including 1 exceedance.
The guideline was exceeded in at least 10% of samples1
Maximum result Guideline
Trihalomethanes2 0.135 mg/L MAC = 0.1 mg/L
Turbidity 17.5 NTU 1.0 NTU3
The guideline was exceeded in less than 10% of samples4
Maximum result Guideline
Tetrachloroethylene5 0.054 mg/L MAC = 0.03 mg/L
Ethylbenzene5 0.0049 mg/L AO = 0.0024 mg/L
Iron 12.8 mg/L AO = 0.3 mg/L
Lead6 0.0158 mg/L MAC = 0.01 mg/L
Manganese 3.22 mg/L AO = 0.05 mg/L
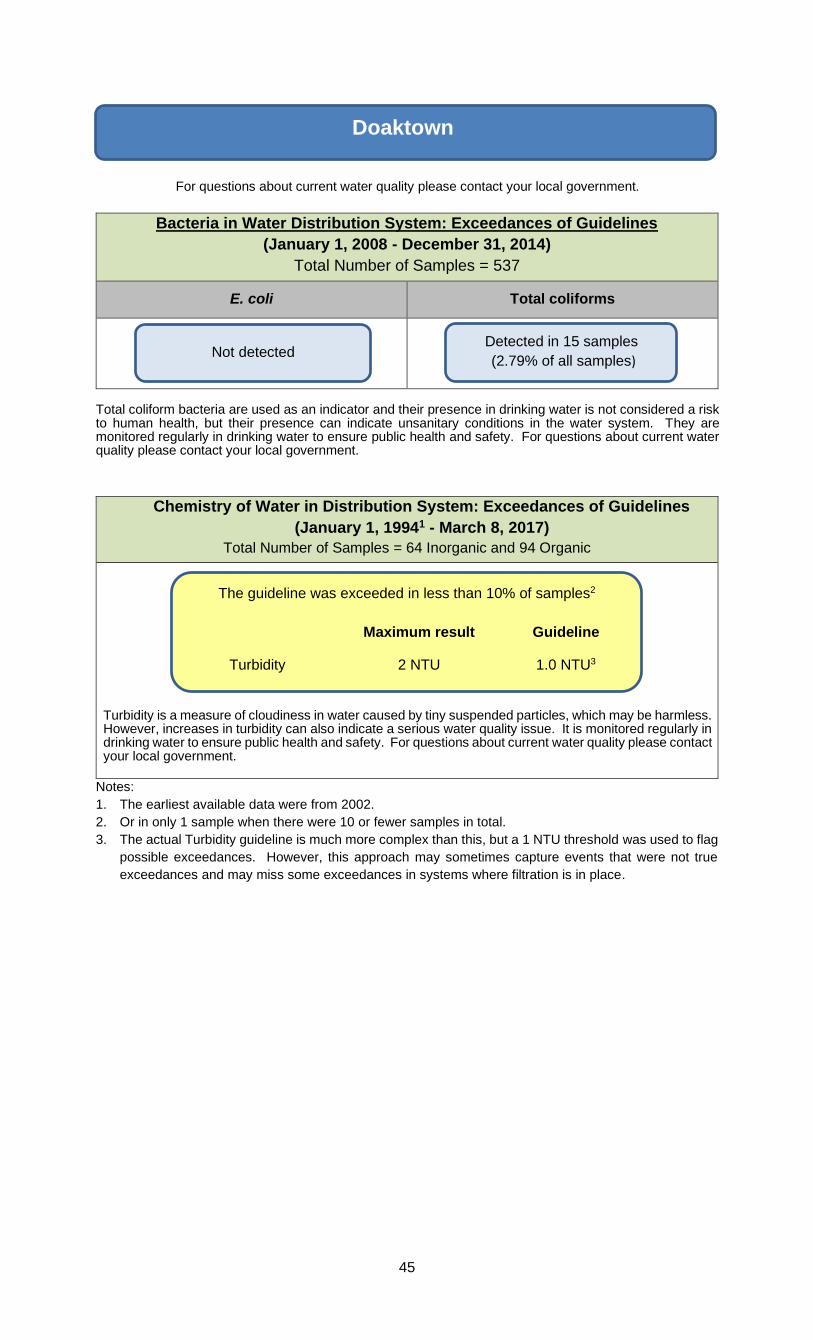
45
For questions about current water quality please contact your local government.
Bacteria in Water Distribution System: Exceedances of Guidelines
(January 1, 2008 - December 31, 2014)
Total Number of Samples = 537
E. coli Total coliforms
Total coliform bacteria are used as an indicator and their presence in drinking water is not considered a risk to human health, but their presence can indicate unsanitary conditions in the water system. They are monitored regularly in drinking water to ensure public health and safety. For questions about current water quality please contact your local government.
Chemistry of Water in Distribution System: Exceedances of Guidelines
(January 1, 19941 - March 8, 2017)
Total Number of Samples = 64 Inorganic and 94 Organic
Turbidity is a measure of cloudiness in water caused by tiny suspended particles, which may be harmless. However, increases in turbidity can also indicate a serious water quality issue. It is monitored regularly in drinking water to ensure public health and safety. For questions about current water quality please contact your local government.
Notes:
1. The earliest available data were from 2002.
2. Or in only 1 sample when there were 10 or fewer samples in total.
3. The actual Turbidity guideline is much more complex than this, but a 1 NTU threshold was used to flag
possible exceedances. However, this approach may sometimes capture events that were not true
exceedances and may miss some exceedances in systems where filtration is in place.
Doaktown
Not detected Detected in 15 samples
(2.79% of all samples)
The guideline was exceeded in less than 10% of samples2
Maximum result Guideline
Turbidity 2 NTU 1.0 NTU3

46
For questions about current water quality please contact your local government.
Bacteria in Water Distribution System: Exceedances of Guidelines
(January 1, 2008 - December 31, 2014)
Total Number of Samples = 539
E. coli Total coliforms
E. coli (Escherichia coli) is a species of bacteria that is naturally found in the intestines of humans and warm-blooded animals. As it is not usually found naturally in soils or water, the presence of E. coli in a water sample is a good indicator of recent faecal contamination. Drinking water should not contain any E. coli. It is monitored regularly in drinking water to ensure public health and safety. Total coliform bacteria are used as an indicator and their presence in drinking water is not considered a risk to human health, but their presence can indicate unsanitary conditions in the water system. They are monitored regularly in drinking water to ensure public health and safety. For questions about current water quality please contact your local government.
Chemistry of Water in Distribution System: Exceedances of Guidelines
(January 1, 19941 - January 7, 2016)
Total Number of Samples = 11 Inorganic and 49 Organic
Manganese is commonly found in rocks, soils and water in many areas of NB. It is monitored regularly in drinking water to ensure appropriate water quality (such as taste, odour and appearance). For questions about current water quality please contact your local government.
Benzo(a)pyrene can be present in fire residues, creosote, and heavy oil products. It is monitored regularly in drinking water to ensure public health and safety. Turbidity is a measure of cloudiness in water caused by tiny suspended particles, which may be harmless. However, increases in turbidity can also indicate a serious water quality issue. It is monitored regularly in drinking water to ensure public health and safety. For questions about current water quality please contact your local government.
Notes:
1. The earliest available data were from 2002.
2. Or in at least 2 samples when there were 10 or fewer samples in total.
3. Or in only 1 sample when there were 10 or fewer samples in total.
4. Benzo(a)pyrene exceeded the MAC in 1 sample.
5. The actual Turbidity guideline is much more complex than this, but a 1 NTU threshold was used to flag
possible exceedances. However, this approach may sometimes capture events that were not true
exceedances and may miss some exceedances in systems where filtration is in place.
Dorchester
Detected in 1 sample
(0.19% of all samples)
Detected in 1 sample
(0.19% of all samples)
The guideline was exceeded in at least 10% of samples2
Maximum result Guideline
Manganese 0.958 mg/L AO = 0.05 mg/L
The guideline was exceeded in less than 10% of samples3
Maximum result Guideline
Benzo(a)pyrene4 0.00012 mg/L MAC = 0.00001 mg/L
Turbidity 1.3 NTU 1.0 NTU5

47
For questions about current water quality please contact your local government.
Bacteria in Water Distribution System: Exceedances of Guidelines
(January 1, 2008 - December 31, 2014)
Total Number of Samples = 415
E. coli Total coliforms
E. coli (Escherichia coli) is a species of bacteria that is naturally found in the intestines of humans and warm-blooded animals. As it is not usually found naturally in soils or water, the presence of E. coli in a water sample is a good indicator of recent faecal contamination. Drinking water should not contain any E. coli. It is monitored regularly in drinking water to ensure public health and safety. Total coliform bacteria are used as an indicator and their presence in drinking water is not considered a risk to human health, but their presence can indicate unsanitary conditions in the water system. They are monitored regularly in drinking water to ensure public health and safety. For questions about current water quality please contact your local government.
Chemistry of Water in Distribution System: Exceedances of Guidelines
(January 1, 19941 - January 8, 2016)
Total Number of Samples = 6 Inorganic and 8 Organic
Nitrate sometimes occurs naturally in groundwater at low levels, but higher levels may indicate impacts to the water due to fertilizer runoff or sewage. It is monitored regularly in drinking water to ensure public health and safety. For questions about current water quality please contact your local government.
Notes: 1. The earliest available data were from 1997, but there were no inorganic chemistry data available from
1999 to 2005 inclusive, and no organic chemistry data available from 1998 to 2008 inclusive. 2. Or in only 1 sample when there were 10 or fewer samples in total. 3. Nitrate exceeded the guideline in 1 of 6 samples but was detected at significant levels in all of them
(range 5.6 to 10.4 mg/L as N), which suggests that Nitrite could potentially also be present. Nitrite does not have a New Brunswick Drinking Water Quality Guideline and is not a required sampling plan test parameter in New Brunswick, but the Guidelines for Canadian Drinking Water Quality have a Nitrite MAC of 1 mg/L as N. For this water system, Nitrite data were available for 2 distribution system samples, as well as from 7 and 9 samples from the two raw water sources: all results were non-detect (<0.05 mg/L), well below the Guidelines for Canadian Drinking Water Quality Nitrite MAC.
Drummond
Detected in 1 sample
(0.24% of all samples)
Detected in 5 samples
(1.20% of all samples)
The guideline was exceeded in less than 10% of samples2
Maximum result Guideline
Nitrate3 10.4 mg/L MAC = 10 mg/L as N
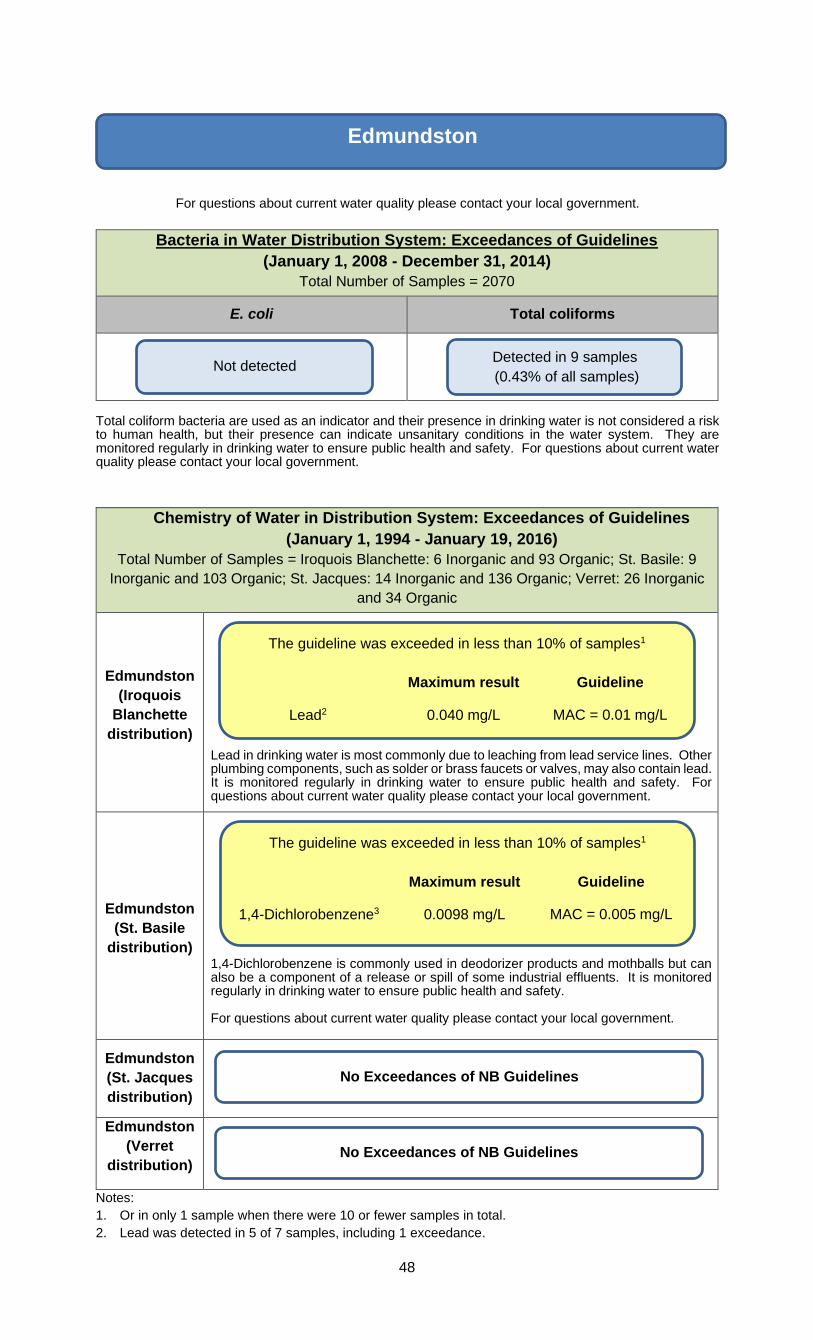
48
For questions about current water quality please contact your local government.
Bacteria in Water Distribution System: Exceedances of Guidelines
(January 1, 2008 - December 31, 2014)
Total Number of Samples = 2070
E. coli Total coliforms
Total coliform bacteria are used as an indicator and their presence in drinking water is not considered a risk to human health, but their presence can indicate unsanitary conditions in the water system. They are monitored regularly in drinking water to ensure public health and safety. For questions about current water quality please contact your local government.
Chemistry of Water in Distribution System: Exceedances of Guidelines
(January 1, 1994 - January 19, 2016)
Total Number of Samples = Iroquois Blanchette: 6 Inorganic and 93 Organic; St. Basile: 9
Inorganic and 103 Organic; St. Jacques: 14 Inorganic and 136 Organic; Verret: 26 Inorganic
and 34 Organic
Edmundston
(Iroquois
Blanchette
distribution)
Lead in drinking water is most commonly due to leaching from lead service lines. Other plumbing components, such as solder or brass faucets or valves, may also contain lead. It is monitored regularly in drinking water to ensure public health and safety. For questions about current water quality please contact your local government.
Edmundston
(St. Basile
distribution)
1,4-Dichlorobenzene is commonly used in deodorizer products and mothballs but can also be a component of a release or spill of some industrial effluents. It is monitored regularly in drinking water to ensure public health and safety. For questions about current water quality please contact your local government.
Edmundston
(St. Jacques
distribution)
Edmundston
(Verret
distribution)
Notes:
1. Or in only 1 sample when there were 10 or fewer samples in total.
2. Lead was detected in 5 of 7 samples, including 1 exceedance.
Edmundston
The guideline was exceeded in less than 10% of samples1
Maximum result Guideline
1,4-Dichlorobenzene3 0.0098 mg/L MAC = 0.005 mg/L
Not detected Detected in 9 samples
(0.43% of all samples)
The guideline was exceeded in less than 10% of samples1
Maximum result Guideline
Lead2 0.040 mg/L MAC = 0.01 mg/L
No Exceedances of NB Guidelines
No Exceedances of NB Guidelines

49
3. 1,4-Dichlorobenzene was detected in 4 of 103 samples, including 1 exceedance of the MAC.
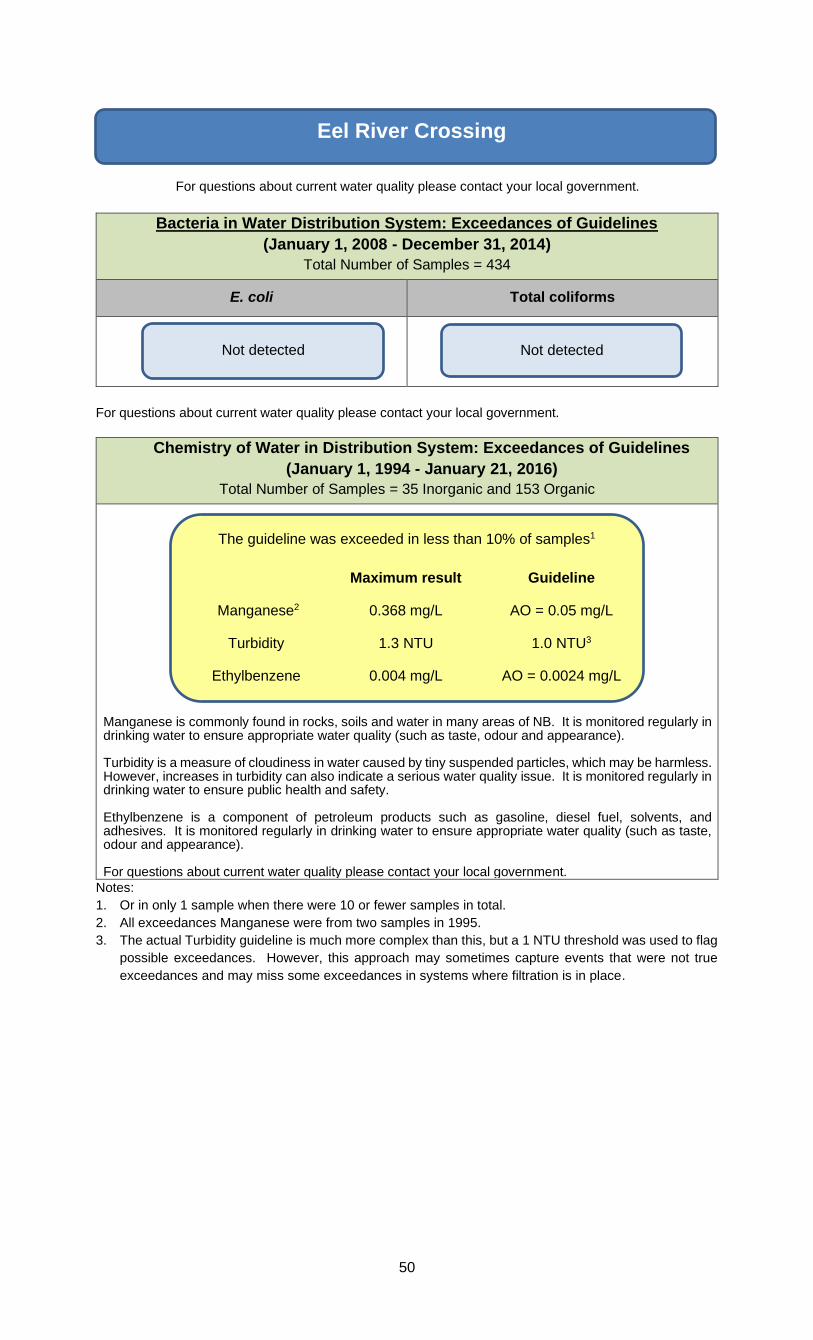
50
For questions about current water quality please contact your local government.
Bacteria in Water Distribution System: Exceedances of Guidelines
(January 1, 2008 - December 31, 2014)
Total Number of Samples = 434
E. coli Total coliforms
For questions about current water quality please contact your local government.
Chemistry of Water in Distribution System: Exceedances of Guidelines
(January 1, 1994 - January 21, 2016)
Total Number of Samples = 35 Inorganic and 153 Organic
Manganese is commonly found in rocks, soils and water in many areas of NB. It is monitored regularly in drinking water to ensure appropriate water quality (such as taste, odour and appearance). Turbidity is a measure of cloudiness in water caused by tiny suspended particles, which may be harmless. However, increases in turbidity can also indicate a serious water quality issue. It is monitored regularly in drinking water to ensure public health and safety. Ethylbenzene is a component of petroleum products such as gasoline, diesel fuel, solvents, and adhesives. It is monitored regularly in drinking water to ensure appropriate water quality (such as taste, odour and appearance). For questions about current water quality please contact your local government.
Notes:
1. Or in only 1 sample when there were 10 or fewer samples in total.
2. All exceedances Manganese were from two samples in 1995.
3. The actual Turbidity guideline is much more complex than this, but a 1 NTU threshold was used to flag
possible exceedances. However, this approach may sometimes capture events that were not true
exceedances and may miss some exceedances in systems where filtration is in place.
Eel River Crossing
Not detected Not detected
The guideline was exceeded in less than 10% of samples1
Maximum result Guideline
Manganese2 0.368 mg/L AO = 0.05 mg/L
Turbidity 1.3 NTU 1.0 NTU3
Ethylbenzene 0.004 mg/L AO = 0.0024 mg/L
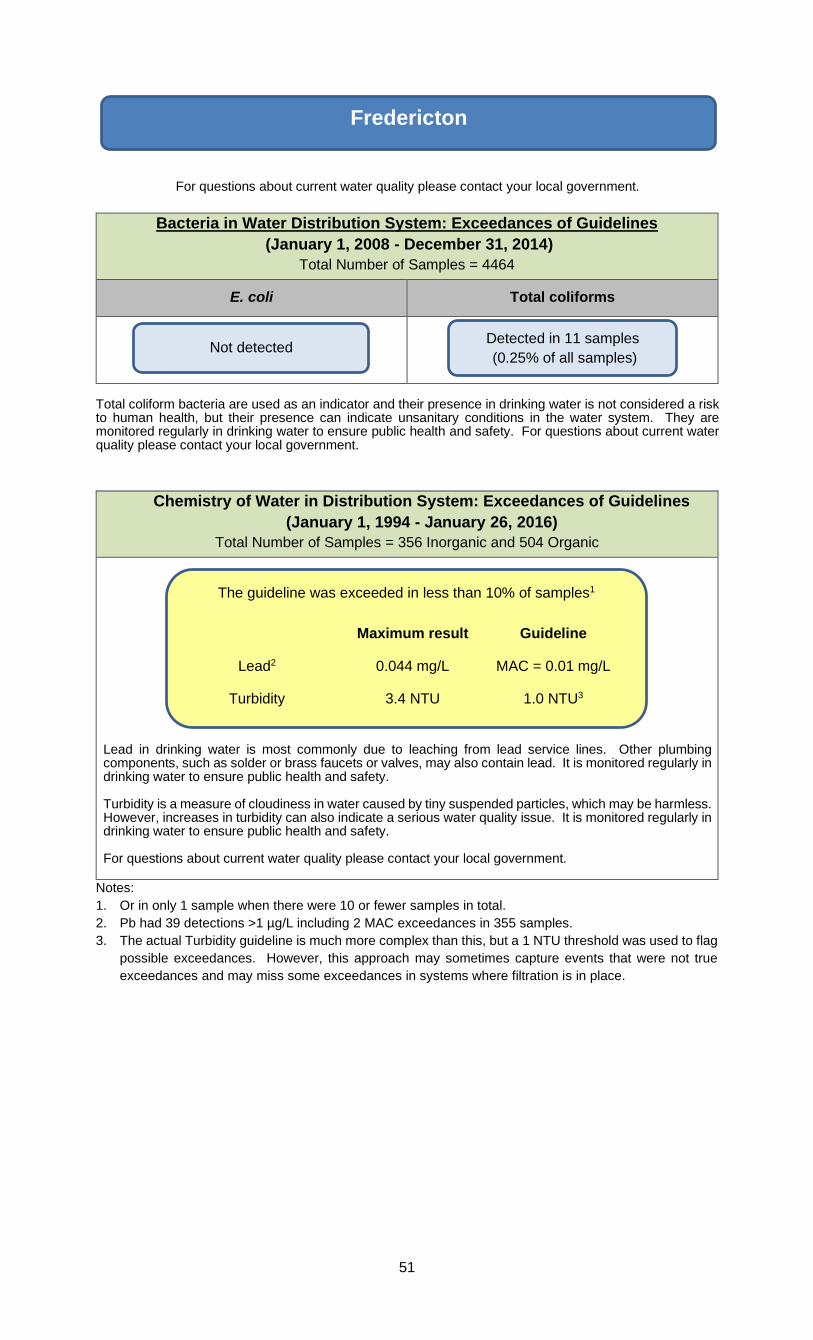
51
For questions about current water quality please contact your local government.
Bacteria in Water Distribution System: Exceedances of Guidelines
(January 1, 2008 - December 31, 2014)
Total Number of Samples = 4464
E. coli Total coliforms
Total coliform bacteria are used as an indicator and their presence in drinking water is not considered a risk to human health, but their presence can indicate unsanitary conditions in the water system. They are monitored regularly in drinking water to ensure public health and safety. For questions about current water quality please contact your local government.
Chemistry of Water in Distribution System: Exceedances of Guidelines
(January 1, 1994 - January 26, 2016)
Total Number of Samples = 356 Inorganic and 504 Organic
Lead in drinking water is most commonly due to leaching from lead service lines. Other plumbing components, such as solder or brass faucets or valves, may also contain lead. It is monitored regularly in drinking water to ensure public health and safety. Turbidity is a measure of cloudiness in water caused by tiny suspended particles, which may be harmless. However, increases in turbidity can also indicate a serious water quality issue. It is monitored regularly in drinking water to ensure public health and safety. For questions about current water quality please contact your local government.
Notes:
1. Or in only 1 sample when there were 10 or fewer samples in total.
2. Pb had 39 detections >1 µg/L including 2 MAC exceedances in 355 samples.
3. The actual Turbidity guideline is much more complex than this, but a 1 NTU threshold was used to flag
possible exceedances. However, this approach may sometimes capture events that were not true
exceedances and may miss some exceedances in systems where filtration is in place.
Fredericton
Not detected Detected in 11 samples
(0.25% of all samples)
The guideline was exceeded in less than 10% of samples1
Maximum result Guideline
Lead2 0.044 mg/L MAC = 0.01 mg/L
Turbidity 3.4 NTU 1.0 NTU3

52
For questions about current water quality please contact your local government.
Bacteria in Water Distribution System: Exceedances of Guidelines
(January 1, 2008 - December 31, 2014)
Total Number of Samples = 399
E. coli Total coliforms
E. coli (Escherichia coli) is a species of bacteria that is naturally found in the intestines of humans and warm-blooded animals. As it is not usually found naturally in soils or water, the presence of E. coli in a water sample is a good indicator of recent faecal contamination. Drinking water should not contain any E. coli. It is monitored regularly in drinking water to ensure public health and safety. Total coliform bacteria are used as an indicator and their presence in drinking water is not considered a risk to human health, but their presence can indicate unsanitary conditions in the water system. They are monitored regularly in drinking water to ensure public health and safety. For questions about current water quality please contact your local government.
Chemistry of Water in Distribution System: Exceedances of Guidelines
(January 1, 1994 - March 4, 2016)
Total Number of Samples = 46 Inorganic and 102 Organic
Manganese is commonly found in rocks, soils and water in many areas of NB. It is monitored regularly in drinking water to ensure appropriate water quality (such as taste, odour and appearance). Turbidity is a measure of cloudiness in water caused by tiny suspended particles, which may be harmless. However, increases in turbidity can also indicate a serious water quality issue. It is monitored regularly in drinking water to ensure public health and safety. For questions about current water quality please contact your local government.
Iron is present in almost all soils and many rocks. It is monitored regularly in drinking water to ensure appropriate water quality (such as taste, odour and appearance). For questions about current water quality please contact your local government.
Notes:
1. Or in at least 2 samples when there were 10 or fewer samples in total.
2. The actual Turbidity guideline is much more complex than this, but a 1 NTU threshold was used to flag
possible exceedances. However, this approach may sometimes capture events that were not true
exceedances and may miss some exceedances in systems where filtration is in place.
3. Or in only 1 sample when there were 10 or fewer samples in total.
Fredericton Junction
Detected in 1 sample
(0.25% of all samples)
Detected in 2 samples
(0.50% of all samples)
The guideline was exceeded in at least 10% of samples1
Maximum result Guideline
Manganese 0.118 mg/L AO = 0.05 mg/L
Turbidity 3.38 NTU 1.0 NTU2
The guideline was exceeded in less than 10% of samples3
Maximum result Guideline
Iron 0.36 mg/L AO = 0.3 mg/L

53
For questions about current water quality please contact your local government.
Bacteria in Water Distribution System: Exceedances of Guidelines
(January 1, 2008 - December 31, 2014)
Total Number of Samples = 712
E. coli Total coliforms
E. coli (Escherichia coli) is a species of bacteria that is naturally found in the intestines of humans and warm-blooded animals. As it is not usually found naturally in soils or water, the presence of E. coli in a water sample is a good indicator of recent faecal contamination. Drinking water should not contain any E. coli. It is monitored regularly in drinking water to ensure public health and safety. Total coliform bacteria are used as an indicator and their presence in drinking water is not considered a risk to human health, but their presence can indicate unsanitary conditions in the water system. They are monitored regularly in drinking water to ensure public health and safety. For questions about current water quality please contact your local government.
Chemistry of Water in Distribution System: Exceedances of Guidelines
(January 1, 1994 - March 20, 2017)
Total Number of Samples = 46 Inorganic and 102 Organic
Manganese is commonly found in rocks, soils and water in many areas of NB. It is monitored regularly in drinking water to ensure appropriate water quality (such as taste, odour and appearance). For questions about current water quality please contact your local government.
Notes:
1. Or in at least 2 samples when there were 10 or fewer samples in total.
Grand Falls
Detected in 1 sample
(0.14% of all samples) Detected in 3 samples
(0.42% of all samples)
The guideline was exceeded in at least 10% of samples1
Maximum result Guideline
Manganese 0.071 mg/L AO = 0.05 mg/L

54
For questions about current water quality please contact your local government.
Bacteria in Water Distribution System: Exceedances of Guidelines1
(January 1, 2008 - December 31, 2014)
Total Number of Samples = 126
E. coli Total coliforms
Notes:
1. The distribution system was sampled approximately 1.5 times per month
Total coliform bacteria are used as an indicator and their presence in drinking water is not considered a risk to human health, but their presence can indicate unsanitary conditions in the water system. They are monitored regularly in drinking water to ensure public health and safety. For questions about current water quality please contact your local government.
Chemistry of Water in Distribution System: Exceedances of Guidelines
(January 1, 19941 - March 14, 2016)
Total Number of Samples = 12 Inorganic and 17 Organic
Chloride occurs in nature as part of many salts (e.g. table salt is pure sodium chloride) and it typically occurs in all waters to some degree. It is monitored regularly in drinking water to ensure appropriate water quality (such as taste, odour and appearance). Sodium occurs in nature as part of many minerals and salts (e.g. table salt is pure sodium chloride) and it typically occurs in all waters to some degree. It is monitored regularly in drinking water to ensure appropriate water quality (such as taste, odour and appearance). Uranium detected in drinking water is almost always due to natural sources in the rock and soil surrounding a well. It is monitored regularly in drinking water to ensure public health and safety. For questions about current water quality please contact your local government.
Notes:
1. The earliest data were from 2001, except for 1 Organic sample from 1998.
2. Or in at least 2 samples when there were 10 or fewer samples in total.
3. U was detected in 10 of 12 samples, of which 8 exceeded the MAC.
Hampton
Not detected Detected in 14 samples
(11.1% of all samples)
The guideline was exceeded in at least 10% of samples2
Maximum result Guideline
Chloride 552 mg/L AO = 250 mg/L
Sodium 287 mg/L AO = 200 mg/L
Uranium3 0.026 mg/L MAC = 0.02 mg/L

55
For questions about current water quality please contact your local government.
Bacteria in Water Distribution System: Exceedances of Guidelines
(January 1, 2008 - December 31, 2014)
Total Number of Samples =375
E. coli Total coliforms
Total coliform bacteria are used as an indicator and their presence in drinking water is not considered a risk to human health, but their presence can indicate unsanitary conditions in the water system. They are monitored regularly in drinking water to ensure public health and safety. For questions about current water quality please contact your local government.
Chemistry of Water in Distribution System: Exceedances of Guidelines
(January 1, 1994 - March 15, 2016)
Total Number of Samples = 10 Inorganic and 79 Organic
For questions about current water quality please contact your local government.
Hartland
Not detected Detected in 1 sample
(0.27% of all samples)
No Exceedances of NB Guidelines

56
For questions about current water quality please contact your local government.
Bacteria in Water Distribution System: Exceedances of Guidelines
(January 1, 2008 - December 31, 2014)
Total Number of Samples = 559
E. coli Total coliforms
Total coliform bacteria are used as an indicator and their presence in drinking water is not considered a risk to human health, but their presence can indicate unsanitary conditions in the water system. They are monitored regularly in drinking water to ensure public health and safety. For questions about current water quality please contact your local government.
Chemistry of Water in Distribution System: Exceedances of Guidelines
(January 1, 1994 - March 15, 2016)
Total Number of Samples = 27 Inorganic and 83 Organic
Turbidity is a measure of cloudiness in water caused by tiny suspended particles, which may be harmless. However, increases in turbidity can also indicate a serious water quality issue. It is monitored regularly in drinking water to ensure public health and safety. For questions about current water quality please contact your local government.
Antimony can be leached from some plumbing materials, and it occurs naturally in soil and can enter water supplies during runoff. It is monitored regularly in drinking water to ensure public health and safety. For questions about current water quality please contact your local government.
Notes:
1. Or in at least 2 samples when there were 10 or fewer samples in total.
2. The actual Turbidity guideline is much more complex than this, but a 1 NTU threshold was used to flag
possible exceedances. However, this approach may sometimes capture events that were not true
exceedances and may miss some exceedances in systems where filtration is in place.
3. Or in only 1 sample when there were 10 or fewer samples in total.
4. Antimony was detected at >1 µg/L (>0.001 mg/L) in only 1 sample in March 1997, but it exceeded the
MAC. It was not detected (<1 µg/L) in a resample taken 1 month later.
Hillsborough
Not detected Detected in 2 samples
(0.36% of all samples)
The guideline was exceeded in at least 10% of samples1
Maximum result Guideline
Turbidity 2.12 NTU 1.0 NTU2
The guideline was exceeded in less than 10% of samples3
Maximum result Guideline
Antimony4 0.0066 mg/L MAC = 0.006 mg/L
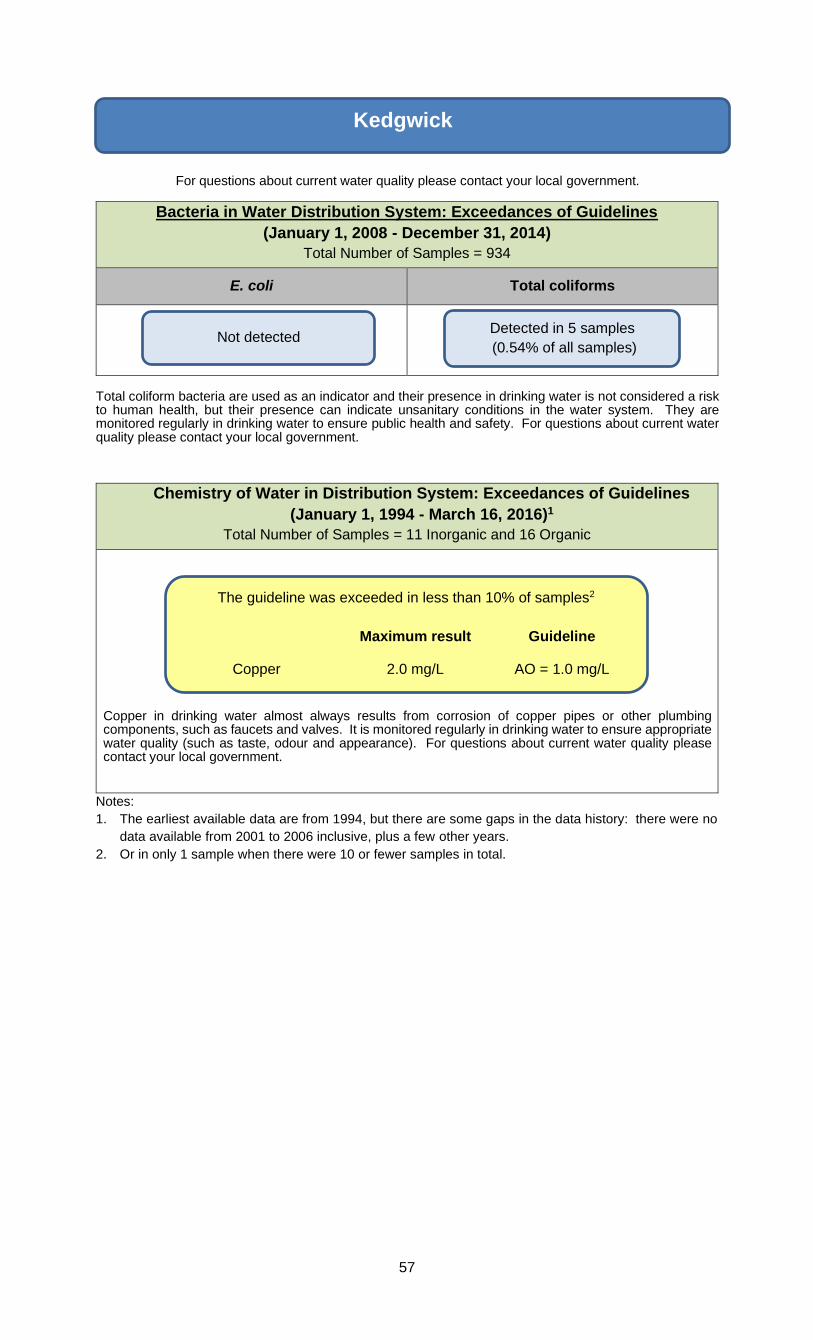
57
For questions about current water quality please contact your local government.
Bacteria in Water Distribution System: Exceedances of Guidelines
(January 1, 2008 - December 31, 2014)
Total Number of Samples = 934
E. coli Total coliforms
Total coliform bacteria are used as an indicator and their presence in drinking water is not considered a risk to human health, but their presence can indicate unsanitary conditions in the water system. They are monitored regularly in drinking water to ensure public health and safety. For questions about current water quality please contact your local government.
Chemistry of Water in Distribution System: Exceedances of Guidelines
(January 1, 1994 - March 16, 2016)1
Total Number of Samples = 11 Inorganic and 16 Organic
Copper in drinking water almost always results from corrosion of copper pipes or other plumbing components, such as faucets and valves. It is monitored regularly in drinking water to ensure appropriate water quality (such as taste, odour and appearance). For questions about current water quality please contact your local government.
Notes:
1. The earliest available data are from 1994, but there are some gaps in the data history: there were no
data available from 2001 to 2006 inclusive, plus a few other years.
2. Or in only 1 sample when there were 10 or fewer samples in total.
Kedgwick
Not detected Detected in 5 samples
(0.54% of all samples)
The guideline was exceeded in less than 10% of samples2
Maximum result Guideline
Copper 2.0 mg/L AO = 1.0 mg/L

58
For questions about current water quality please contact your local government.
Bacteria in Water Distribution System: Exceedances of Guidelines
(January 1, 2008 - December 31, 2014)
Total Number of Samples = 363
E. coli Total coliforms
For questions about current water quality please contact your local government.
Chemistry of Water in Distribution System: Exceedances of Guidelines
(January 1, 19941 - March 16, 2016)
Total Number of Samples = 11 Inorganic and 53 Organic
Iron is present in almost all soils and many rocks. It is monitored regularly in drinking water to ensure appropriate water quality (such as taste, odour and appearance). Manganese is commonly found in rocks, soils and water in many areas of NB. It is monitored regularly in drinking water to ensure appropriate water quality (such as taste, odour and appearance). Turbidity is a measure of cloudiness in water caused by tiny suspended particles, which may be harmless. However, increases in turbidity can also indicate a serious water quality issue. It is monitored regularly in drinking water to ensure public health and safety. For questions about current water quality please contact your local government.
Notes:
1. The earliest available data were from 2003, except for some additional organic chemistry samples from
1994 to 1996.
2. Or in only 1 sample when there were 10 or fewer samples in total.
3. The actual Turbidity guideline is much more complex than this, but a 1 NTU threshold was used to flag
possible exceedances. However, this approach may sometimes capture events that were not true
exceedances and may miss some exceedances in systems where filtration is in place.
Lamèque
Not detected Not detected
The guideline was exceeded in less than 10% of samples2
Maximum result Guideline
Iron 0.829 mg/L AO = 0.3 mg/L
Manganese 0.056 mg/L AO = 0.05 mg/L
Turbidity 1.9 NTU 1.0 NTU3

59
For questions about current water quality please contact your local government.
Bacteria in Water Distribution System: Exceedances of Guidelines
(January 1, 2008 - December 31, 2014)1
Total Number of Samples = 746
E. coli Total coliforms
Total coliform bacteria are used as an indicator and their presence in drinking water is not considered a risk to human health, but their presence can indicate unsanitary conditions in the water system. They are monitored regularly in drinking water to ensure public health and safety. For questions about current water quality please contact your local government.
Chemistry of Water in Distribution System: Exceedances of Guidelines
(January 1, 1994 - March 16, 2016)1
Total Number of Samples = 41 Inorganic and 103 Organic
Notes:
1. The water chemistry in McAdam was quite different between the periods 1994-2002 and 2005-
2016 due to changes in raw water sources (the old wells were replaced by new wells), but there
were no exceedances of the New Brunswick Drinking Water Quality Guidelines for chemistry
parameters during either period (note there were no data available from 2003-2004, however).
For questions about current water quality please contact your local government.
McAdam
Not detected Detected in 3 samples
(0.40% of all samples)
No Exceedances of NB Guidelines

60
For questions about current water quality please contact your local government.
Bacteria in Water Distribution System: Exceedances of Guidelines
(January 1, 2008 - December 31, 2014)
Total Number of Samples = 382
E. coli Total coliforms
Total coliform bacteria are used as an indicator and their presence in drinking water is not considered a risk to human health, but their presence can indicate unsanitary conditions in the water system. They are monitored regularly in drinking water to ensure public health and safety. For questions about current water quality please contact your local government.
Chemistry of Water in Distribution System: Exceedances of Guidelines
(January 1, 1994 - March 21, 2016)
Total Number of Samples = 16 Inorganic and 65 Organic
Manganese is commonly found in rocks, soils and water in many areas of NB. It is monitored regularly in drinking water to ensure appropriate water quality (such as taste, odour and appearance). Turbidity is a measure of cloudiness in water caused by tiny suspended particles, which may be harmless. However, increases in turbidity can also indicate a serious water quality issue. It is monitored regularly in drinking water to ensure public health and safety. For questions about current water quality please contact your local government. Lead in drinking water is most commonly due to leaching from lead service lines. Other plumbing components, such as solder or brass faucets or valves, may also contain lead. It is monitored regularly in drinking water to ensure public health and safety. Ethylbenzene is a component of petroleum products such as gasoline, diesel fuel, solvents, and adhesives. It is monitored regularly in drinking water to ensure appropriate water quality (such as taste, odour and appearance). For questions about current water quality please contact your local government.
Notes:
1. Or in at least 2 samples when there were 10 or fewer samples in total.
2. The actual Turbidity guideline is much more complex than this, but a 1 NTU threshold was used to flag
possible exceedances. However, this approach may sometimes capture events that were not true
exceedances and may miss some exceedances in systems where filtration is in place.
3. Or in only 1 sample when there were 10 or fewer samples in total.
Memramcook
Not detected Detected in 1 sample
(0.26% of all samples)
The guideline was exceeded in at least 10% of samples1
Maximum result Guideline
Manganese 0.2 mg/L AO = 0.05 mg/L
Turbidity 1.4 NTU 1.0 NTU2
The guideline was exceeded in less than 10% of samples3
Maximum result Guideline
Lead4 0.0106 mg/L MAC = 0.01 mg/L
Ethylbenzene 0.0037 mg/L AO = 0.0024 mg/L

61
4. Pb had 7 detections >1 µg/L, including 1 MAC exceedance, in 30 samples (there were more samples
taken for Pb than the other inorganic chemistry parameters). There were also 2 MAC exceedances in
2 additional samples at a temporary sampling site.

62
For questions about current water quality please contact your local government.
Bacteria in Water Distribution System: Exceedances of Guidelines
(January 1, 2008 - December 31, 2014)
Total Number of Samples = 1181 (Chatham); 435 (Douglastown); 797 (Newcastle)
E. coli Total coliforms
Miramichi (Chatham)
Miramichi (Douglastown)
Miramichi (Newcastle)
Total coliform bacteria are used as an indicator and their presence in drinking water is not considered a risk to human health, but their presence can indicate unsanitary conditions in the water system. They are monitored regularly in drinking water to ensure public health and safety. For questions about current water quality please contact your local government.
Chemistry of Water in Distribution System: Exceedances of Guidelines
(January 1, 1994 - April 1, 2016)
Total Number of Samples = Chatham: 71 Inorganic and 189 Organic; Douglastown: 43
Inorganic and 84 Organic; Newcastle: 25 Inorganic and 91 Organic
Miramichi
(Chatham)
Manganese is commonly found in rocks, soils and water in many areas of NB. It is monitored regularly in drinking water to ensure appropriate water quality (such as taste, odour and appearance). For questions about current water quality please contact your local government.
1,4-Dichlorobenzene is commonly used in deodorizer products and mothballs but can also be a component of a release or spill of some industrial effluents. It is monitored regularly in drinking water to ensure public health and safety. Turbidity is a measure of cloudiness in water caused by tiny suspended particles, which may be harmless. However, increases in turbidity can also indicate a serious water quality issue. It is monitored regularly in drinking water to ensure public health and safety. For questions about current water quality please contact your local government.
Miramichi
The guideline was exceeded in at least 10% of samples1
Maximum result Guideline
Manganese 0.194 mg/L AO = 0.05 mg/L
The guideline was exceeded in less than 10% of samples2
Maximum result Guideline
1,4-Dichlorobenzene 0.0077 mg/L MAC = 0.005 mg/L
Turbidity 1.4 NTU 1.0 NTU3
Not detected
Not detected
Not detected
Detected in 6 samples
(0.51% of all samples)
Detected in 14 samples
(3.22% of all samples)
Detected in 10 samples
(1.25% of all samples)

63
Miramichi
(Douglastown)
Manganese is commonly found in rocks, soils and water in many areas of NB. It is monitored regularly in drinking water to ensure appropriate water quality (such as taste, odour and appearance). For questions about current water quality please contact your local government.
Iron is present in almost all soils and many rocks. It is monitored regularly in drinking water to ensure appropriate water quality (such as taste, odour and appearance). Turbidity is a measure of cloudiness in water caused by tiny suspended particles, which may be harmless. However, increases in turbidity can also indicate a serious water quality issue. It is monitored regularly in drinking water to ensure public health and safety. For questions about current water quality please contact your local government.
Miramichi
(Newcastle)
Iron is present in almost all soils and many rocks. It is monitored regularly in drinking water to ensure appropriate water quality (such as taste, odour and appearance). Manganese is commonly found in rocks, soils and water in many areas of NB. It is monitored regularly in drinking water to ensure appropriate water quality (such as taste, odour and appearance). For questions about current water quality please contact your local government.
Benzo(a)pyrene can be present in fire residues, creosote, and heavy oil products. It is monitored regularly in drinking water to ensure public health and safety. For questions about current water quality please contact your local government.
Notes:
1. Or in at least 2 samples when there were 10 or fewer samples in total.
2. Or in only 1 sample when there were 10 or fewer samples in total.
3. The actual Turbidity guideline is much more complex than this, but a 1 NTU threshold was used to flag
possible exceedances. However, this approach may sometimes capture events that were not true
exceedances and may miss some exceedances in systems where filtration is in place.
The guideline was exceeded in at least 10% of samples1
Maximum result Guideline
Manganese 0.14 mg/L AO = 0.05 mg/L
The guideline was exceeded in less than 10% of samples2
Maximum result Guideline
Iron 1.06 mg/L AO = 0.3 mg/L
Turbidity 2.3 NTU 1.0 NTU3
The guideline was exceeded in at least 10% of samples1
Maximum result Guideline
Iron 0.561 mg/L AO = 0.3 mg/L
Manganese 0.198 mg/L AO = 0.05 mg/L
The guideline was exceeded in less than 10% of samples2
Maximum result Guideline
Benzo(a)pyrene4 0.000014 mg/L MAC = 0.00001 mg/L

64
4. Benzo(a)pyrene exceeded the MAC in 1 sample and was detected at trace levels in 6 other samples
at the 279 Troy Avenue or Troy Avenue Hydrant locations during the Newcastle PAH Monitoring
Program 1999-2011. This compound was not detected in any routine Clean Water Act compliance
testing sample.

65
For questions about current water quality please contact your local government.
The following chemistry results represent the water quality pre (January 1, 1994 - December
31, 1999) and post (January 1, 2000 - April 18, 2016) commissioning of a new Water Treatment Facility in the City of Moncton.
Bacteria in Water Distribution System: Exceedances of Guidelines
(January 1, 2008 - December 31, 2014)
Total Number of Samples = 12,233 (Dieppe/Riverview); 360 (Mapleton Place)
E. coli Total coliforms
Moncton/Dieppe/ Riverview
Moncton (Mapleton Place)
Total coliform bacteria are used as an indicator and their presence in drinking water is not considered a risk to human health, but their presence can indicate unsanitary conditions in the water system. They are monitored regularly in drinking water to ensure public health and safety. For questions about current water quality please contact your local government.
Not detected
Not detected
Detected in 7 samples
(0.06% of all samples)
Not detected
Moncton / Dieppe / Riverview

66
Chemistry of Water in Distribution System: Exceedances of Guidelines
(January 1, 1994 - December 31, 1999)1
Total Number of Samples = Moncton/Dieppe/Riverview: 92 Inorganic and 223 Organic;
Mapleton Place: 9 Inorganic and 11 Organic
Moncton/Dieppe/
Riverview
Trihalomethanes (THM) are a group of four related compounds that are disinfection by-products: that is, they are formed from the reaction between natural organic matter present in raw source waters and the chlorine used for disinfection. They are monitored regularly in drinking water to ensure public health and safety. Iron is present in almost all soils and many rocks. It is monitored regularly in drinking water to ensure appropriate water quality (such as taste, odour and appearance). Manganese is commonly found in rocks, soils and water in many areas of NB. It is monitored regularly in drinking water to ensure appropriate water quality (such as taste, odour and appearance). Turbidity is a measure of cloudiness in water caused by tiny suspended particles, which may be harmless. However, increases in turbidity can also indicate a serious water quality issue. It is monitored regularly in drinking water to ensure public health and safety. For questions about current water quality please contact your local government.
Copper in drinking water almost always results from corrosion of copper pipes or other plumbing components, such as faucets and valves. It is monitored regularly in drinking water to ensure appropriate water quality (such as taste, odour and appearance). Lead in drinking water is most commonly due to leaching from lead service lines. Other plumbing components, such as solder or brass faucets or valves, may also contain lead. It is monitored regularly in drinking water to ensure public health and safety. For questions about current water quality please contact your local government.
The guideline was exceeded in at least 10% of samples2
Maximum result Guideline
Trihalomethanes 0.147 mg/L3 MAC = 0.1 mg/L
Iron
Manganese
Turbidity
1.26 mg/L
0.462 mg/L
12.9 NTU
AO = 0.3 mg/L
AO = 0.05 mg/L
1.0 NTU4
The guideline was exceeded in less than 10% of samples5
Maximum result Guideline
Copper 2.41 mg/L AO = 1.0 mg/L
Lead 1.86 mg/L MAC = 0.01 mg/L

67
Moncton
(Mapleton Place)
Turbidity is a measure of cloudiness in water caused by tiny suspended particles, which may be harmless. However, increases in turbidity can also indicate a serious water quality issue. It is monitored regularly in drinking water to ensure public health and safety. For questions about current water quality please contact your local government.
Notes:
1. In late 1999, the city of Moncton installed a new water treatment plant. Therefore, the data was split
using a date range to reflect the changes in water quality after the water treatment plant was installed.
This is the date range for before the new water treatment plant was installed.
2. Or in at least 2 samples when there were 10 or fewer samples in total.
3. A Locational Running Annual Average was calculated to compare Trihalomethanes to the guideline.
4. The actual Turbidity guideline is much more complex than this, but a 1 NTU threshold was used to
flag possible exceedances. However, this approach may sometimes capture events that were not
true exceedances and may miss some exceedances in systems where filtration is in place.
5. Or in only 1 sample when there were 10 or fewer samples in total.
Chemistry of Water in Distribution System: Exceedances of Guidelines
(January 1, 2000 - April 18, 2016)1
Total Number of Samples = Moncton/Dieppe/Riverview: 383 Inorganic and 797 Organic;
Mapleton Place: 29 Inorganic and 63 Organic
Moncton/Dieppe/
Riverview
Lead in drinking water is most commonly due to leaching from lead service lines. Other plumbing components, such as solder or brass faucets or valves, may also contain lead. It is monitored regularly in drinking water to ensure public health and safety. Manganese is commonly found in rocks, soils and water in many areas of NB. It is monitored regularly in drinking water to ensure appropriate water quality (such as taste, odour and appearance). Turbidity is a measure of cloudiness in water caused by tiny suspended particles, which may be harmless. However, increases in turbidity can also indicate a serious water quality issue. It is monitored regularly in drinking water to ensure public health and safety. Iron is present in almost all soils and many rocks. It is monitored regularly in drinking water to ensure appropriate water quality (such as taste, odour and appearance). For questions about current water quality please contact your local government.
The guideline was exceeded in at least 10% of samples2
Maximum result Guideline
Turbidity 3.7 NTU 1.0 NTU4
The guideline was exceeded in less than 10% of samples2
Maximum result Guideline
Lead 0.320 mg/L3 MAC = 0.01 mg/L
Manganese 1.23 mg/L4 AO = 0.05 mg/L
Turbidity
Iron
43.6 NTU5
2.08 mg/L7
1.0 NTU6
AO = 0.3 mg/L

68
Moncton
(Mapleton Place)
Manganese is commonly found in rocks, soils and water in many areas of NB. It is monitored regularly in drinking water to ensure appropriate water quality (such as taste, odour and appearance). For questions about current water quality please contact your local government.
Turbidity is a measure of cloudiness in water caused by tiny suspended particles, which may be harmless. However, increases in turbidity can also indicate a serious water quality issue. It is monitored regularly in drinking water to ensure public health and safety. For questions about current water quality please contact your local government.
Notes:
1. This is the date range for after the new water treatment plant was installed.
2. Or in only 1 sample when there were 10 or fewer samples in total.
3. Lead exceeded the guideline in 60 of 2519 samples.
4. Manganese exceeded the guideline in 14 of 2421 samples.
5. Turbidity exceeded the guideline in 224 of 14,683 samples.
6. The actual Turbidity guideline is much more complex than this, but a 1 NTU threshold was used to flag possible exceedances. However, this approach may sometimes capture events that were not true exceedances and may miss some exceedances in systems where filtration is in place. 7. Iron exceeded the guideline in 156 of 2421 samples.
8. Or in at least 2 samples when there were 10 or fewer samples in total.
9. Turbidity exceeded the guideline in 1 of 401 samples.
The guideline was exceeded in at least 10% of samples8
Maximum result Guideline
Manganese 0.088 mg/L AO = 0.05 mg/L
The guideline was exceeded in less than 10% of samples2
Maximum result Guideline
Turbidity 1.83 NTU9 1.0 NTU6

69
For questions about current water quality please contact your local government.
Bacteria in Water Distribution System: Exceedances of Guidelines
(January 1, 2008 - December 31, 2014)
Total Number of Samples = 450
E. coli Total coliforms
Total coliform bacteria are used as an indicator and their presence in drinking water is not considered a risk to human health, but their presence can indicate unsanitary conditions in the water system. They are monitored regularly in drinking water to ensure public health and safety. For questions about current water quality please contact your local government.
Chemistry1 of Water in Distribution System: Exceedances of Guidelines
(January 1, 19942 - June 7, 2016)
Total Number of Samples = 8 Inorganic and 13 Organic3
Notes:
1. No general chemistry parameters were tested (only specified sampling plan parameters were tested).
Thus, there were no data available on major ions (e.g. sodium, chloride), Alkalinity, Hardness, pH, etc.
2. The earliest available data were from 2004 (Organic) and 2005 (Inorganic).
3. There were also an additional 45 samples tested for THMs only.
For questions about current water quality please contact your local government.
Nackawic
Not detected Detected in 11 samples
(2.44% of all samples)
No Exceedances of NB Guidelines

70
For questions about current water quality please contact your local government.
Bacteria in Water Distribution System: Exceedances of Guidelines
(January 1, 2008 - December 31, 2014)
Total Number of Samples = 845
E. coli Total coliforms
Total coliform bacteria are used as an indicator and their presence in drinking water is not considered a risk to human health, but their presence can indicate unsanitary conditions in the water system. They are monitored regularly in drinking water to ensure public health and safety. For questions about current water quality please contact your local government.
Chemistry of Water in Distribution System: Exceedances of Guidelines
(January 1, 1994 - June 9, 2016)
Total Number of Samples = 99 Inorganic and 126 Organic
Copper in drinking water almost always results from corrosion of copper pipes or other plumbing components, such as faucets and valves. It is monitored regularly in drinking water to ensure appropriate water quality (such as taste, odour and appearance). Fluoride is sometimes used in large public water supply systems for its public health benefits, but it also often occurs naturally in well water and the amounts can vary greatly from one well to another. Fluoride levels are monitored regularly in drinking water to ensure public health and safety. Lead in drinking water is most commonly due to leaching from lead service lines. Other plumbing components, such as solder or brass faucets or valves, may also contain lead. It is monitored regularly in drinking water to ensure public health and safety. Manganese is commonly found in rocks, soils and water in many areas of NB. It is monitored regularly in drinking water to ensure appropriate water quality (such as taste, odour and appearance). Turbidity is a measure of cloudiness in water caused by tiny suspended particles, which may be harmless. However, increases in turbidity can also indicate a serious water quality issue. It is monitored regularly in drinking water to ensure public health and safety. For questions about current water quality please contact your local government.
Notes:
1. Or in only 1 sample when there were 10 or fewer samples in total.
2. Fluoride exceeded the guideline in 6 samples, all of which occurred between 1994 and 1996.
3. Pb was detected in 9 of 99 samples and exceeded the MAC in 3 of them.
4. The actual Turbidity guideline is much more complex than this, but a 1 NTU threshold was used to
flag possible exceedances. However, this approach may sometimes capture events that were not true
exceedances and may miss some exceedances in systems where filtration is in place.
New Maryland
Not detected Detected in 8 samples
(0.95% of all samples)
The guideline was exceeded in less than 10% of samples1
Maximum result Guideline
Copper >1.0 mg/L AO = 1.0 mg/L
Fluoride2 1.87 mg/L MAC = 1.5 mg/L
Lead3 >0.25 mg/L MAC = 0.01 mg/L
Manganese 0.899 mg/L AO = 0.05 mg/L
Turbidity 2.5 NTU 1.0 NTU4

71
For questions about current water quality please contact your local government.
Bacteria in Water Distribution System: Exceedances of Guidelines
(January 1, 2008 - December 31, 2014)
Total Number of Samples = 1434
E. coli Total coliforms
Total coliform bacteria are used as an indicator and their presence in drinking water is not considered a risk to human health, but their presence can indicate unsanitary conditions in the water system. They are monitored regularly in drinking water to ensure public health and safety. For questions about current water quality please contact your local government.
Chemistry of Water in Distribution System: Exceedances of Guidelines
(January 1, 19941 - June 29, 2016)
Total Number of Samples = 64 Inorganic and 130 Organic
Iron is present in almost all soils and many rocks. It is monitored regularly in drinking water to ensure appropriate water quality (such as taste, odour and appearance). For questions about current water quality please contact your local government.
Turbidity is a measure of cloudiness in water caused by tiny suspended particles, which may be harmless. However, increases in turbidity can also indicate a serious water quality issue. It is monitored regularly in drinking water to ensure public health and safety. For questions about current water quality please contact your local government.
Notes:
1. The earliest available data were from 2006.
2. Or in at least 2 samples when there were 10 or fewer samples in total.
3. Or in only 1 sample when there were 10 or fewer samples in total.
4. The actual Turbidity guideline is much more complex than this, but a 1 NTU threshold was used to flag
possible exceedances. However, this approach may sometimes capture events that were not true
exceedances and may miss some exceedances in systems where filtration is in place.
Oromocto
Not detected Detected in 4 samples
(0.28% of all samples)
The guideline was exceeded in at least 10% of samples2
Maximum result Guideline
Iron 0.908 mg/L AO = 0.3 mg/L
The guideline was exceeded in less than 10% of samples3
Maximum result Guideline
Turbidity 1.9 NTU 1.0 NTU4
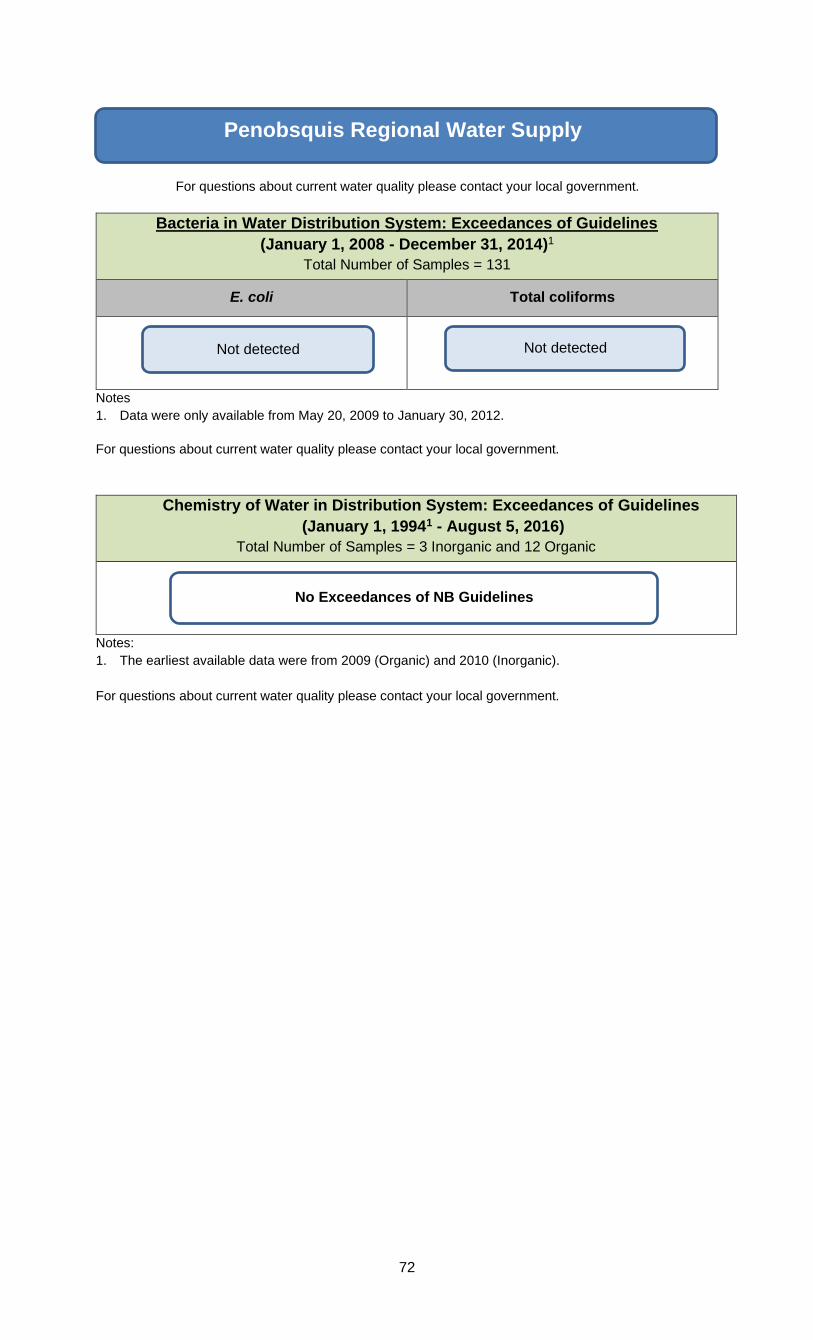
72
For questions about current water quality please contact your local government.
Bacteria in Water Distribution System: Exceedances of Guidelines
(January 1, 2008 - December 31, 2014)1
Total Number of Samples = 131
E. coli Total coliforms
Notes
1. Data were only available from May 20, 2009 to January 30, 2012.
For questions about current water quality please contact your local government.
Chemistry of Water in Distribution System: Exceedances of Guidelines
(January 1, 19941 - August 5, 2016)
Total Number of Samples = 3 Inorganic and 12 Organic
Notes:
1. The earliest available data were from 2009 (Organic) and 2010 (Inorganic).
For questions about current water quality please contact your local government.
Penobsquis Regional Water Supply
Not detected Not detected
No Exceedances of NB Guidelines

73
For questions about current water quality please contact your local government.
Bacteria in Water Distribution System: Exceedances of Guidelines
(January 1, 2008 - December 31, 2014)
Total Number of Samples = 386
E. coli Total coliforms
Total coliform bacteria are used as an indicator and their presence in drinking water is not considered a risk to human health, but their presence can indicate unsanitary conditions in the water system. They are monitored regularly in drinking water to ensure public health and safety. For questions about current water quality please contact your local government.
Chemistry of Water in Distribution System: Exceedances of Guidelines
(January 1, 19941 - August 8, 2016)
Total Number of Samples = 14 Inorganic and 10 Organic2
Notes:
1. The earliest available data were from 2002 (Inorganic) and 2006 (Organic), except for 1 Inorganic
sample from 1997.
2. There were also an additional 40 Organic samples with THMs data only.
For questions about current water quality please contact your local government.
Perth-Andover
Not detected Detected in 1 sample
(0.26% of all samples)
No Exceedances of NB Guidelines

74
For questions about current water quality please contact your local government.
Bacteria in Water Distribution System: Exceedances of Guidelines
(January 1, 2008 - December 31, 2014)
Total Number of Samples = 674
E. coli Total coliforms
Total coliform bacteria are used as an indicator and their presence in drinking water is not considered a risk to human health, but their presence can indicate unsanitary conditions in the water system. They are monitored regularly in drinking water to ensure public health and safety. For questions about current water quality please contact your local government.
Chemistry of Water in Distribution System: Exceedances of Guidelines
(January 1, 19941 - August 8, 2016)
Total Number of Samples = 32 Inorganic and 98 Organic2
Trihalomethanes (THM) are a group of four related compounds that are disinfection by-products: that is, they are formed from the reaction between natural organic matter present in raw source waters and the chlorine used for disinfection. They are monitored regularly in drinking water to ensure public health and safety. For questions about current water quality please contact your local government.
Notes:
1. The earliest available data were from 2002 (Inorganic) and 2003 (Organic), except for some Organic
data from 1994 to 1996.
2. There were also an additional 120 samples tested for THMs only.
3. Or in at least 2 samples when there were 10 or fewer samples in total.
4. All Trihalomethane sampling locations had frequent exceedances except Zone Est (sampled 2003 to
2011) and Edifice Municipal (sampled during 1994-96 only).
Petit-Rocher
Not detected Detected in 3 samples
(0.45% of all samples)
The guideline was exceeded in at least 10% of samples3
Maximum result Guideline
Trihalomethanes4 0.189 mg/L MAC = 0.1 mg/L

75
For questions about current water quality please contact your local government.
Bacteria in Water Distribution System: Exceedances of Guidelines
(January 1, 2008 - December 31, 2014)
Total Number of Samples = 404
E. coli Total coliforms
Total coliform bacteria are used as an indicator and their presence in drinking water is not considered a risk to human health, but their presence can indicate unsanitary conditions in the water system. They are monitored regularly in drinking water to ensure public health and safety. For questions about current water quality please contact your local government.
Chemistry of Water in Distribution System: Exceedances of Guidelines
(January 1, 19941 - August 9, 2016)
Total Number of Samples = 12 Inorganic and 52 Organic
Manganese is commonly found in rocks, soils and water in many areas of NB. It is monitored regularly in drinking water to ensure appropriate water quality (such as taste, odour and appearance). For questions about current water quality please contact your local government.
Notes:
1. The earliest available data were from 1998 (Inorganic) and 2005 (Organic).
2. Or in only 1 sample when there were 10 or fewer samples in total.
3. Manganese exceedance occurred in 1 sample. Manganese was not detected in any other samples.
Plaster Rock
Not detected Detected in 4 samples
(0.99% of all samples)
The guideline was exceeded in less than 10% of samples2
Maximum result Guideline
Manganese3 0.157 mg/L AO = 0.05 mg/L

76
For questions about current water quality please contact your local government.
Bacteria in Water Distribution System: Exceedances of Guidelines
(January 1, 2008 - December 31, 2014)
Total Number of Samples = 443
E. coli Total coliforms
Total coliform bacteria are used as an indicator and their presence in drinking water is not considered a risk to human health, but their presence can indicate unsanitary conditions in the water system. They are monitored regularly in drinking water to ensure public health and safety. For questions about current water quality please contact your local government.
Chemistry of Water in Distribution System: Exceedances of Guidelines
(January 1, 1994 - August 9, 2016)
Total Number of Samples = 28 Inorganic and 99 Organic
Port Elgin
2004 to
2016 data
Turbidity is a measure of cloudiness in water caused by tiny suspended particles, which may be harmless. However, increases in turbidity can also indicate a serious water quality issue. It is monitored regularly in drinking water to ensure public health and safety. For questions about current water quality please contact your local government.
Manganese is commonly found in rocks, soils and water in many areas of NB. It is monitored regularly in drinking water to ensure appropriate water quality (such as taste, odour and appearance). For questions about current water quality please contact your local government.
Port Elgin
1995 to 2003
data
Ethylbenzene is a component of petroleum products such as gasoline, diesel fuel, solvents, and adhesives. It is monitored regularly in drinking water to ensure appropriate water quality (such as taste, odour and appearance). For questions about current water quality please contact your local government.
Notes:
1. Or in at least 2 samples when there were 10 or fewer samples in total.
Port Elgin
The guideline was exceeded in at least 10% of samples1
Maximum result Guideline
Turbidity 3.4 NTU 1.0 NTU2
The guideline was exceeded in less than 10% of samples3
Maximum result Guideline
Manganese 0.157 mg/L AO = 0.05 mg/L
The guideline was exceeded in at least 10% of samples1
Maximum result Guideline
Ethylbenzene4 0.0038 mg/L AO = 0.0024 mg/L
Not detected Detected in 3 samples
(0.68% of all samples)

77
2. The actual Turbidity guideline is much more complex than this, but a 1 NTU threshold was used to flag
possible exceedances. However, this approach may sometimes capture events that were not true
exceedances and may miss some exceedances in systems where filtration is in place.
3. Or in only 1 sample when there were 10 or fewer samples in total.
4. Ethylbenzene was detected in 6 of 48 samples between 1995 and 2003, and exceeded the AO in 2 of
them, but it has also been repeatedly detected since then (in 11 of 55 samples taken between 2004
and 2016). However, none of these more recent samples exceeded the New Brunswick guideline.

78
For questions about current water quality please contact your local government.
Bacteria in Water Distribution System: Exceedances of Guidelines
(January 1, 2008 - December 31, 2014)
Total Number of Samples = 340 (Downeast); 317 (Ridgewood)
E. coli Total coliforms
Quispamsis
(Downeast)
Quispamsis
(Ridgewood)
Total coliform bacteria are used as an indicator and their presence in drinking water is not considered a risk to human health, but their presence can indicate unsanitary conditions in the water system. They are monitored regularly in drinking water to ensure public health and safety. For questions about current water quality please contact your local government.
Chemistry of Water in Distribution System: Exceedances of Guidelines
(January 1, 19941 - August 11, 2016)
Total Number of Samples = Downeast: 20 Inorganic and 37 Organic; Ridgewood: 23
Inorganic and 37 Organic
Quispamsis
(Downeast)
Quispamsis
Not detected
Not detected
Detected in 2 samples
(0.59% of all samples)
Detected in 1 sample
(0.32% of all samples)
No Exceedances of NB Guidelines

79
Quispamsis
(Ridgewood)
Arsenic detected in drinking water is almost always due to natural sources in the rock and soil surrounding a well, and this can be common in some areas of NB. It is monitored regularly in drinking water to ensure public health and safety. Uranium detected in drinking water is almost always due to natural sources in the rock and soil surrounding a well. It is monitored regularly in drinking water to ensure public health and safety. For questions about current water quality please contact your local government. Iron is present in almost all soils and many rocks. It is monitored regularly in drinking water to ensure appropriate water quality (such as taste, odour and appearance). Turbidity is a measure of cloudiness in water caused by tiny suspended particles, which may be harmless. However, increases in turbidity can also indicate a serious water quality issue. It is monitored regularly in drinking water to ensure public health and safety. For questions about current water quality please contact your local government.
Notes:
1. The earliest available data were from 2002 (Organic) and 2003 (Inorganic), except for 1 Organic
sample from 1996.
2. Or in at least 2 samples when there were 10 or fewer samples in total.
3. Or in only 1 sample when there were 10 or fewer samples in total.
4. Arsenic exceeded the guideline in 3 of 25 samples.
5. Uranium exceeded the guideline in 15 of 23 samples.
6. The actual Turbidity guideline is much more complex than this, but a 1 NTU threshold was used to
flag possible exceedances. However, this approach may sometimes capture events that were not
true exceedances and may miss some exceedances in systems where filtration is in place.
The guideline was exceeded in at least 10% of samples2
Maximum result Guideline
Arsenic4 0.011 mg/L MAC = 0.010 mg/L
Uranium5 0.025 mg/L MAC = 0.020 mg/L
The guideline was exceeded in less than 10% of samples3
Maximum result Guideline
Iron 0.98 mg/L AO = 0.3 mg/L
Turbidity 2.2 NTU 1.0 NTU6
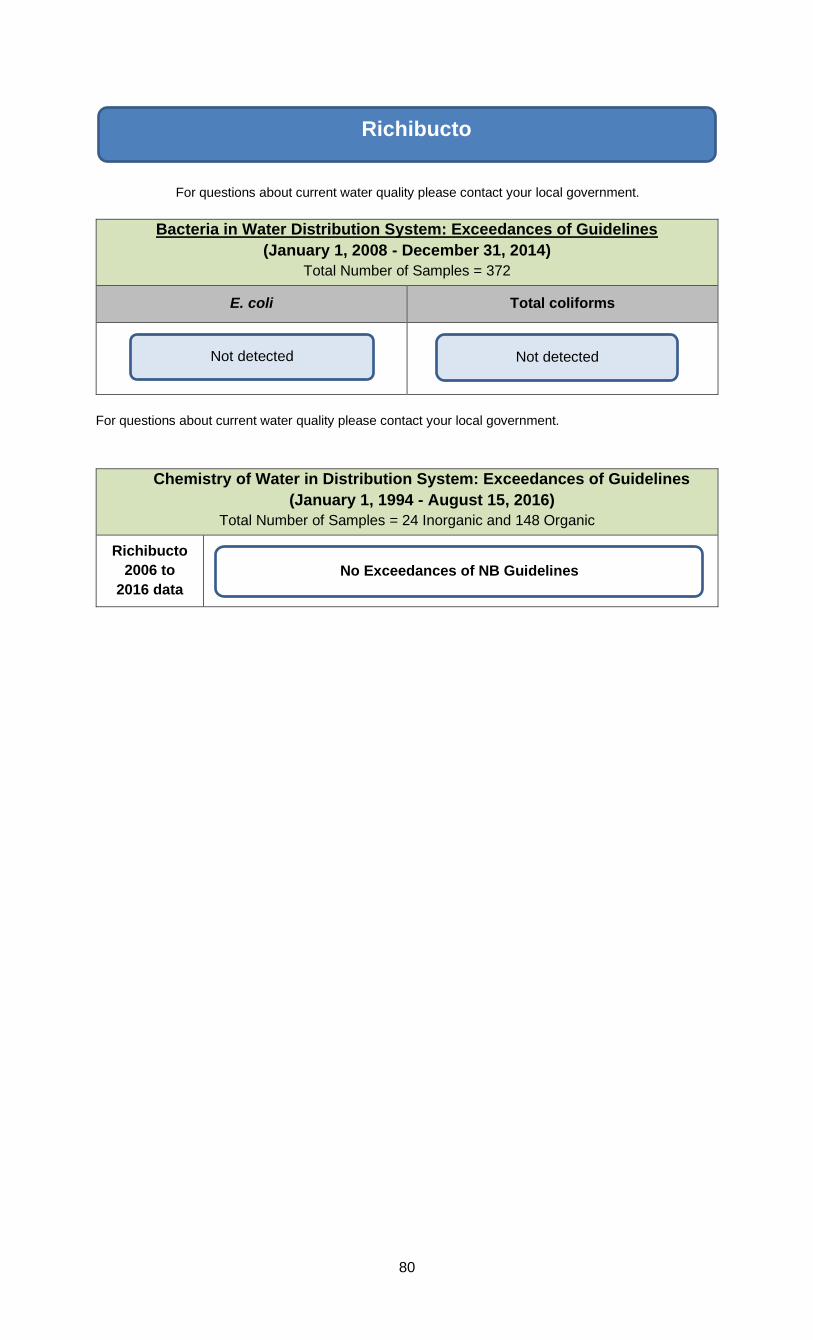
80
For questions about current water quality please contact your local government.
Bacteria in Water Distribution System: Exceedances of Guidelines
(January 1, 2008 - December 31, 2014)
Total Number of Samples = 372
E. coli Total coliforms
For questions about current water quality please contact your local government.
Chemistry of Water in Distribution System: Exceedances of Guidelines
(January 1, 1994 - August 15, 2016)
Total Number of Samples = 24 Inorganic and 148 Organic
Richibucto
2006 to
2016 data
Richibucto
Not detected Not detected
No Exceedances of NB Guidelines

81
Richibucto
1994 to
2005 data
Barium is a common trace element in rocks and minerals that is typically found at low levels in New Brunswick well water. It is monitored regularly in drinking water to ensure public health and safety. Chloride occurs in nature as part of many salts (e.g. table salt is pure sodium chloride) and it typically occurs in all waters to some degree. It is monitored regularly in drinking water to ensure appropriate water quality (such as taste, odour and appearance). Iron is present in almost all soils and many rocks. It is monitored regularly in drinking water to ensure appropriate water quality (such as taste, odour and appearance). Manganese is commonly found in rocks, soils and water in many areas of NB. It is monitored regularly in drinking water to ensure appropriate water quality (such as taste, odour and appearance). Selenium occurs naturally in soil and certain plumbing components (non-leaded brass). It is monitored regularly in drinking water to ensure public health and safety. Turbidity is a measure of cloudiness in water caused by tiny suspended particles, which may be harmless. However, increases in turbidity can also indicate a serious water quality issue. It is monitored regularly in drinking water to ensure public health and safety. Trihalomethanes (THM) are a group of four related compounds that are disinfection by-products: that is, they are formed from the reaction between natural organic matter present in raw source waters and the chlorine used for disinfection. They are monitored regularly in drinking water to ensure public health and safety. For questions about current water quality please contact your local government.
Notes:
1. Or in at least 2 samples when there were 10 or fewer samples in total.
2. Barium exceeded the MAC in 6 samples, all of them between 1999 and 2003 inclusive.
3. The actual Turbidity guideline is much more complex than this, but a 1 NTU threshold was used to
flag possible exceedances. However, this approach may sometimes capture events that were not true
exceedances and may miss some exceedances in systems where filtration is in place.
4. Selenium exceeded the MAC in 13 of 26 samples during this time period (there were additional
samples tested for selenium only besides the full inorganic chemistry test samples).
5. THM levels have declined over time. This was due in part to a change in raw water sources and in
part to changes in operations. There have been no exceedances of the MAC since 2005.
The guideline was exceeded in at least 10% of samples1
Maximum result Guideline
Barium2 1.39 mg/L MAC = 1.0 mg/L
Chloride 507 mg/L AO = 250 mg/L
Iron 1.07 mg/L AO = 0.3 mg/L
Manganese 1.50 mg/L AO = 0.05 mg/L
Selenium4 0.025 mg/L MAC = 0.01 mg/L
Turbidity 8.2 NTU 1.0 NTU3
Trihalomethanes5 0.195 mg/L MAC = 0.1 mg/L

82
For questions about current water quality please contact your local government.
Bacteria in Water Distribution System: Exceedances of Guidelines
(January 1, 2008 - December 31, 2014)
Total Number of Samples = 492
E. coli Total coliforms
Total coliform bacteria are used as an indicator and their presence in drinking water is not considered a risk to human health, but their presence can indicate unsanitary conditions in the water system. They are monitored regularly in drinking water to ensure public health and safety. For questions about current water quality please contact your local government.
Chemistry of Water in Distribution System: Exceedances of Guidelines
(January 1, 1994 - September 8, 2016)
Total Number of Samples = 41 Inorganic and 164 Organic
Riverside-
Albert
(excluding
outliers)1
Riverside-
Albert
(outliers only)
Notes:
1. Five samples (out of 41 inorganic chemistry samples in total) were rejected as outliers due to vastly
different levels of many parameters compared to typical levels found in most samples from this water
system. The parameters that showed statistically significant differences between the two groups of
samples included: Alkalinity, Calcium, Chloride, Hardness, Potassium, Magnesium, Sodium, Nitrate,
Sulphate and Saturation Index; there were also differences in the trace metal profiles. In general, the
water chemistry of the outlier samples was more typical of groundwater than of the surface water that
supplies this system. The affected sampling dates were in 1999, 2000, 2001, and 2003.
For questions about current water quality please contact your local government.
Riverside-Albert
Not detected Detected in 4 samples
(0.81% of all samples)
No Exceedances of NB Guidelines
No Exceedances of NB Guidelines
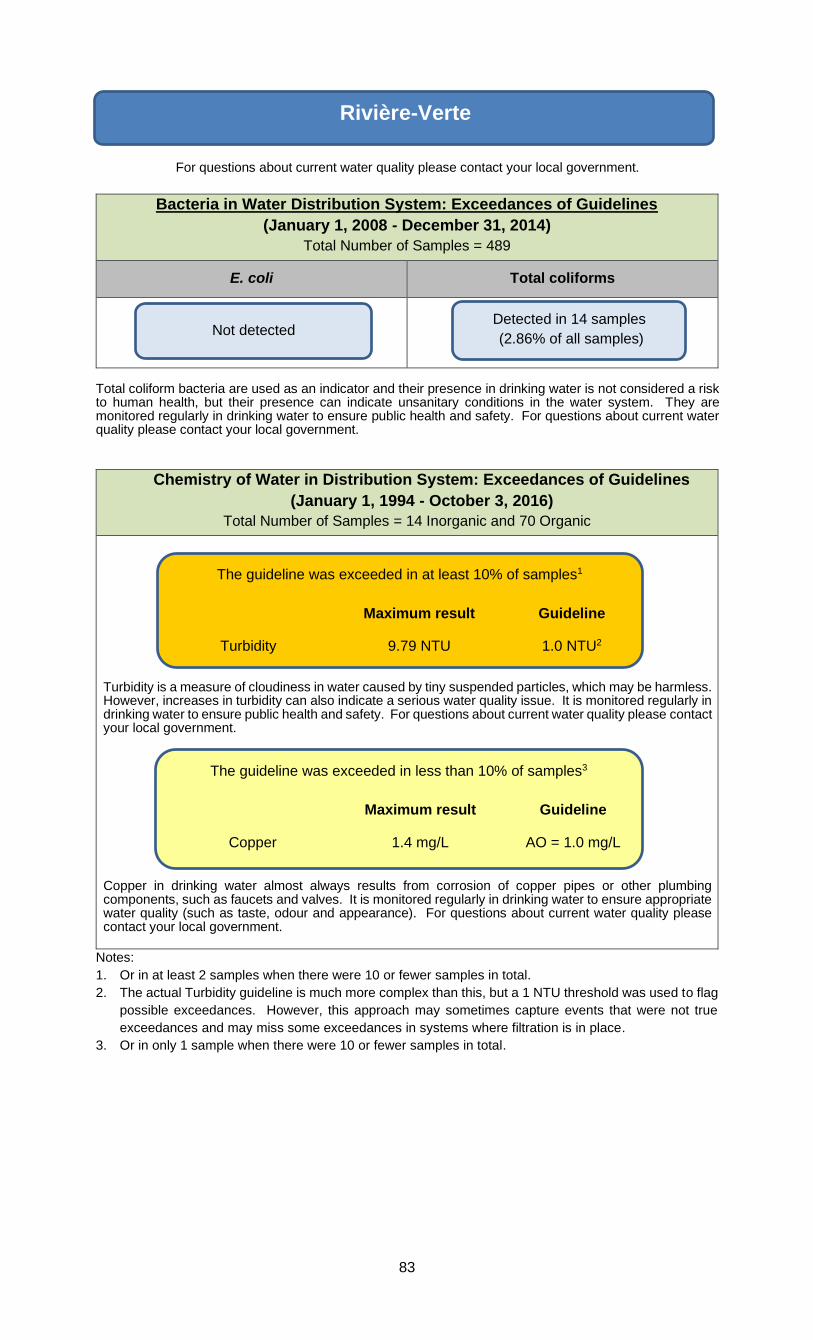
83
For questions about current water quality please contact your local government.
Bacteria in Water Distribution System: Exceedances of Guidelines
(January 1, 2008 - December 31, 2014)
Total Number of Samples = 489
E. coli Total coliforms
Total coliform bacteria are used as an indicator and their presence in drinking water is not considered a risk to human health, but their presence can indicate unsanitary conditions in the water system. They are monitored regularly in drinking water to ensure public health and safety. For questions about current water quality please contact your local government.
Chemistry of Water in Distribution System: Exceedances of Guidelines
(January 1, 1994 - October 3, 2016)
Total Number of Samples = 14 Inorganic and 70 Organic
Turbidity is a measure of cloudiness in water caused by tiny suspended particles, which may be harmless. However, increases in turbidity can also indicate a serious water quality issue. It is monitored regularly in drinking water to ensure public health and safety. For questions about current water quality please contact your local government.
Copper in drinking water almost always results from corrosion of copper pipes or other plumbing components, such as faucets and valves. It is monitored regularly in drinking water to ensure appropriate water quality (such as taste, odour and appearance). For questions about current water quality please contact your local government.
Notes:
1. Or in at least 2 samples when there were 10 or fewer samples in total.
2. The actual Turbidity guideline is much more complex than this, but a 1 NTU threshold was used to flag
possible exceedances. However, this approach may sometimes capture events that were not true
exceedances and may miss some exceedances in systems where filtration is in place.
3. Or in only 1 sample when there were 10 or fewer samples in total.
Rivière-Verte
Not detected Detected in 14 samples
(2.86% of all samples)
The guideline was exceeded in at least 10% of samples1
Maximum result Guideline
Turbidity 9.79 NTU 1.0 NTU2
The guideline was exceeded in less than 10% of samples3
Maximum result Guideline
Copper 1.4 mg/L AO = 1.0 mg/L

84
For questions about current water quality please contact your local government.
Bacteria in Water Distribution System: Exceedances of Guidelines
(January 1, 2008 - December 31, 2014)
Total Number of Samples = 1200
E. coli Total coliforms
Notes:
1. 1 of the 5 detections was from the West distribution system prior to joining the two water systems
together; the other 4 detections occurred after it became a single combined system in 2011.
Total coliform bacteria are used as an indicator and their presence in drinking water is not considered a risk to human health, but their presence can indicate unsanitary conditions in the water system. They are monitored regularly in drinking water to ensure public health and safety. For questions about current water quality please contact your local government.
Chemistry of Water in Distribution System: Exceedances of Guidelines
(January 1, 1994 - October 6, 2016)
Total Number of Samples = West: 29 Inorganic and 107 Organic; East: 31 Inorganic and 72
Organic
Rothesay
(West
Distribution)1
Turbidity is a measure of cloudiness in water caused by tiny suspended particles, which may be harmless. However, increases in turbidity can also indicate a serious water quality issue. It is monitored regularly in drinking water to ensure public health and safety. Trihalomethanes (THM) are a group of four related compounds that are disinfection by-products: that is, they are formed from the reaction between natural organic matter present in raw source waters and the chlorine used for disinfection. They are monitored regularly in drinking water to ensure public health and safety. Carbon Tetrachloride was phased out in Canada in 1996 but can still be imported for limited use in chemical production and may become a component of Industrial effluents. It is monitored regularly in drinking water to ensure public health and safety. For questions about current water quality please contact your local government.
Rothesay
The guideline was exceeded in less than 10% of samples2
Maximum result Guideline
Turbidity 1.27 NTU 1.0 NTU3
Trihalomethanes4 0.127 mg/L MAC = 0.1 mg/L
Carbon Tetrachloride5 0.042 mg/L MAC = 0.005 mg/L
Not detected Detected in 5 samples1
(0.42% of all samples)

85
Rothesay
(East
Distribution)1
Manganese is commonly found in rocks, soils and water in many areas of NB. It is monitored regularly in drinking water to ensure appropriate water quality (such as taste, odour and appearance). Uranium detected in drinking water is almost always due to natural sources in the rock and soil surrounding a well. It is monitored regularly in drinking water to ensure public health and safety. Carbon Tetrachloride was phased out in Canada in 1996 but can still be imported for limited use in chemical production and may become a component of Industrial effluents. It is monitored regularly in drinking water to ensure public health and safety. For questions about current water quality please contact your local government.
Notes:
1. Rothesay formerly had 2 separate water distribution systems, with the West system supplied by water
from the City of Saint John and the East system supplied by the Carpenter’s Pond wellfield. In
November 2011 the two systems were connected into one, which is supplied by the wellfield only.
2. Or in only 1 sample when there were 10 or fewer samples in total.
3. The actual Turbidity guideline is much more complex than this, but a 1 NTU threshold was used to flag
possible exceedances. However, this approach may sometimes capture events that were not true
exceedances and may miss some exceedances in systems where filtration is in place.
4. Trihalomethanes exceeded the guideline at one location (Pumping Station, 70 1/2 Elizabeth Parkway,
in the West Distribution System) in 2007, when the Rothesay West distribution system was still supplied
by water from the City of Saint John’s East distribution system.
5. Carbon Tetrachloride exceedances all occurred on the same day in January 2006, in both the East and
West distribution systems (which were not connected until November 2011), so these were likely the
result of external contamination during sampling or due to lab error.
6. Uranium exceeded the MAC in 2 samples, both taken on the same day in 1999.
The guideline was exceeded in less than 10% of samples2
Maximum result Guideline
Manganese 0.066 mg/L AO = 0.05 mg/L
Uranium6 0.028 mg/L MAC = 0.02 mg/L
Carbon Tetrachloride5 0.029 mg/L MAC = 0.005 mg/L
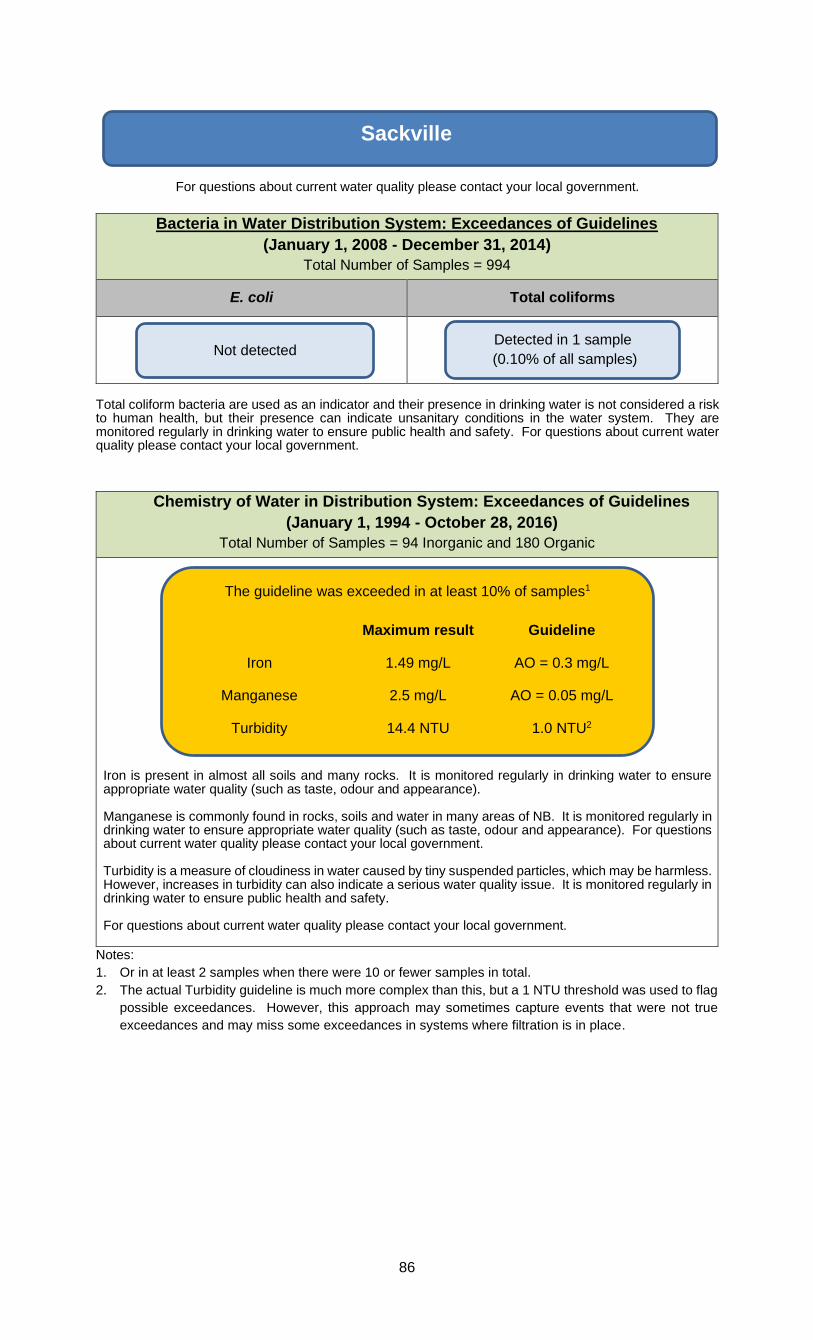
86
For questions about current water quality please contact your local government.
Bacteria in Water Distribution System: Exceedances of Guidelines
(January 1, 2008 - December 31, 2014)
Total Number of Samples = 994
E. coli Total coliforms
Total coliform bacteria are used as an indicator and their presence in drinking water is not considered a risk to human health, but their presence can indicate unsanitary conditions in the water system. They are monitored regularly in drinking water to ensure public health and safety. For questions about current water quality please contact your local government.
Chemistry of Water in Distribution System: Exceedances of Guidelines
(January 1, 1994 - October 28, 2016)
Total Number of Samples = 94 Inorganic and 180 Organic
Iron is present in almost all soils and many rocks. It is monitored regularly in drinking water to ensure appropriate water quality (such as taste, odour and appearance). Manganese is commonly found in rocks, soils and water in many areas of NB. It is monitored regularly in drinking water to ensure appropriate water quality (such as taste, odour and appearance). For questions about current water quality please contact your local government. Turbidity is a measure of cloudiness in water caused by tiny suspended particles, which may be harmless. However, increases in turbidity can also indicate a serious water quality issue. It is monitored regularly in drinking water to ensure public health and safety. For questions about current water quality please contact your local government.
Notes:
1. Or in at least 2 samples when there were 10 or fewer samples in total.
2. The actual Turbidity guideline is much more complex than this, but a 1 NTU threshold was used to flag
possible exceedances. However, this approach may sometimes capture events that were not true
exceedances and may miss some exceedances in systems where filtration is in place.
Sackville
Not detected Detected in 1 sample
(0.10% of all samples)
The guideline was exceeded in at least 10% of samples1
Maximum result Guideline
Iron 1.49 mg/L AO = 0.3 mg/L
Manganese 2.5 mg/L AO = 0.05 mg/L
Turbidity 14.4 NTU 1.0 NTU2

87
For questions about current water quality please contact your local government.
Bacteria in Water Distribution System: Exceedances of Guidelines
(January 1, 2008 - December 31, 2014)
Total Number of Samples = 376
E. coli Total coliforms
For questions about current water quality please contact your local government.
Chemistry of Water in Distribution System: Exceedances of Guidelines
(January 1, 1994 - December 14, 2016)
Total Number of Samples = 50 Inorganic and 167 Organic
Iron is present in almost all soils and many rocks. It is monitored regularly in drinking water to ensure appropriate water quality (such as taste, odour and appearance). For questions about current water quality please contact your local government.
Copper in drinking water almost always results from corrosion of copper pipes or other plumbing components, such as faucets and valves. It is monitored regularly in drinking water to ensure appropriate water quality (such as taste, odour and appearance). Lead in drinking water is most commonly due to leaching from lead service lines. Other plumbing components, such as solder or brass faucets or valves, may also contain lead. It is monitored regularly in drinking water to ensure public health and safety. Turbidity is a measure of cloudiness in water caused by tiny suspended particles, which may be harmless. However, increases in turbidity can also indicate a serious water quality issue. It is monitored regularly in drinking water to ensure public health and safety. For questions about current water quality please contact your local government.
Notes:
1. Or in at least 2 samples when there were 10 or fewer samples in total.
2. Or in only 1 sample when there were 10 or fewer samples in total.
3. Lead was detected in 42 of 50 samples and exceeded the MAC in 2 of them.
4. The actual Turbidity guideline is much more complex than this, but a 1 NTU threshold was used to flag
possible exceedances. However, this approach may sometimes capture events that were not true
exceedances and may miss some exceedances in systems where filtration is in place.
Saint Andrews
Not detected Not detected
The guideline was exceeded in at least 10% of samples1
Maximum result Guideline
Iron 0.563 mg/L AO = 0.3 mg/L
The guideline was exceeded in less than 10% of samples2
Maximum result Guideline
Copper 2.99 mg/L AO = 1.0 mg/L
Lead3 0.0253 mg/L MAC = 0.01 mg/L
Turbidity 1.0 NTU 1.0 NTU4
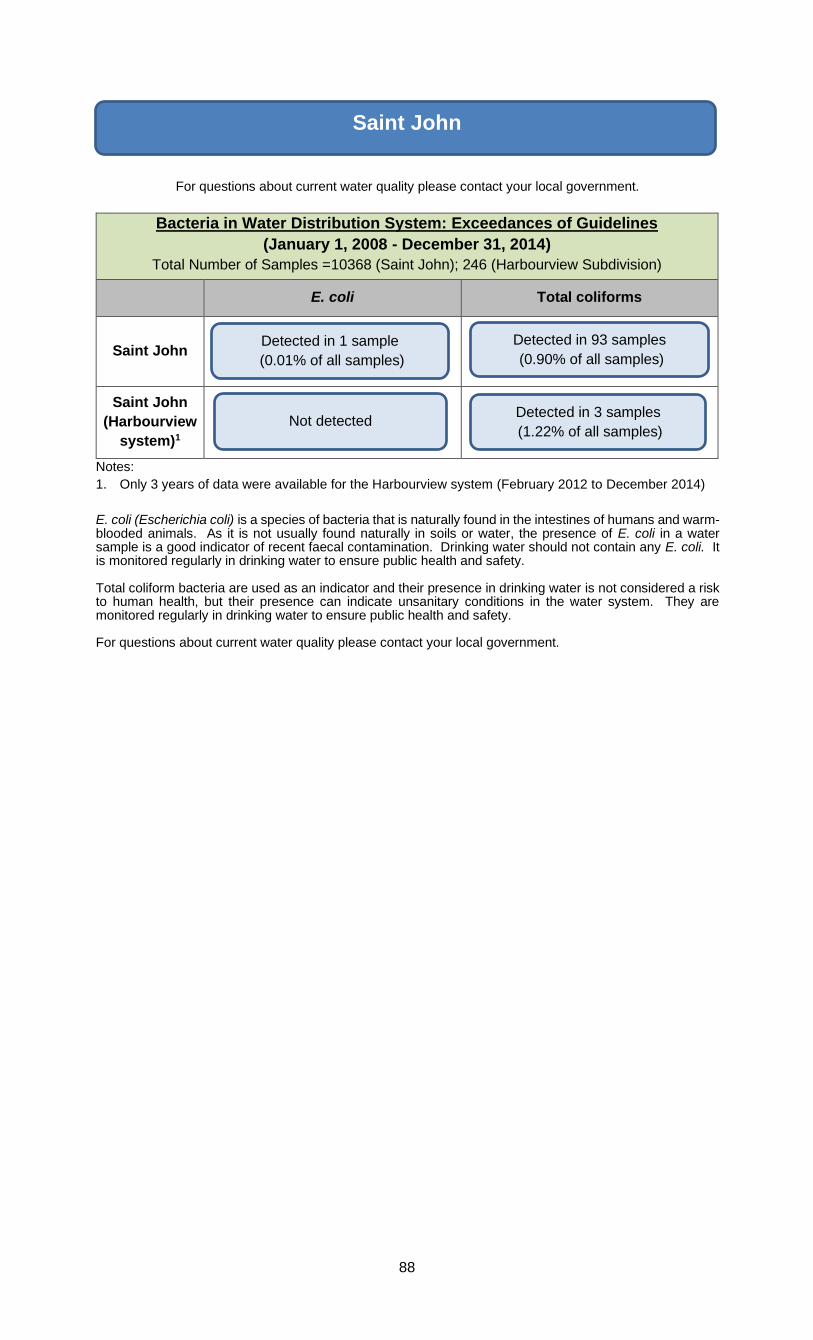
88
For questions about current water quality please contact your local government.
Bacteria in Water Distribution System: Exceedances of Guidelines
(January 1, 2008 - December 31, 2014)
Total Number of Samples =10368 (Saint John); 246 (Harbourview Subdivision)
E. coli Total coliforms
Saint John
Saint John
(Harbourview
system)1
Notes:
1. Only 3 years of data were available for the Harbourview system (February 2012 to December 2014)
E. coli (Escherichia coli) is a species of bacteria that is naturally found in the intestines of humans and warm-blooded animals. As it is not usually found naturally in soils or water, the presence of E. coli in a water sample is a good indicator of recent faecal contamination. Drinking water should not contain any E. coli. It is monitored regularly in drinking water to ensure public health and safety. Total coliform bacteria are used as an indicator and their presence in drinking water is not considered a risk to human health, but their presence can indicate unsanitary conditions in the water system. They are monitored regularly in drinking water to ensure public health and safety. For questions about current water quality please contact your local government.
Saint John
Not detected
Detected in 93 samples
(0.90% of all samples)
Detected in 3 samples
(1.22% of all samples)
Detected in 1 sample
(0.01% of all samples)

89
Chemistry of Water in Distribution System: Exceedances of Guidelines
(January 1, 19941 - October 31, 2016)
Total Number of Samples = West: 199 Inorganic and 363 Organic2; East: 234 Inorganic and
520 Organic2; Harbourview: 14 Inorganic and 34 Organic
Saint John
West
Distribution
System
Trihalomethanes (THM) are a group of four related compounds that are disinfection by-products: that is, they are formed from the reaction between natural organic matter present in raw source waters and the chlorine used for disinfection. They are monitored regularly in drinking water to ensure public health and safety. For questions about current water quality please contact your local government.
Iron is present in almost all soils and many rocks. It is monitored regularly in drinking water to ensure appropriate water quality (such as taste, odour and appearance). Manganese is commonly found in rocks, soils and water in many areas of NB. It is monitored regularly in drinking water to ensure appropriate water quality (such as taste, odour and appearance). For questions about current water quality please contact your local government. Turbidity is a measure of cloudiness in water caused by tiny suspended particles, which may be harmless. However, increases in turbidity can also indicate a serious water quality issue. It is monitored regularly in drinking water to ensure public health and safety. Ethylbenzene is a component of petroleum products such as gasoline, diesel fuel, solvents, and adhesives. It is monitored regularly in drinking water to ensure appropriate water quality (such as taste, odour and appearance). For questions about current water quality please contact your local government.
The guideline was exceeded in at least 10% of samples3
Maximum result Guideline
Trihalomethanes4 0.196 mg/L MAC = 0.1 mg/L
The guideline was exceeded in less than 10% of samples5
Maximum result Guideline
Iron 0.59 mg/L AO = 0.3 mg/L
Manganese 0.092 mg/L AO = 0.05 mg/L
Turbidity 4 NTU 1.0 NTU6
Ethylbenzene 0.064 mg/L AO = 0.0024 mg/L

90
Saint John
East
Distribution
System
Turbidity is a measure of cloudiness in water caused by tiny suspended particles, which may be harmless. However, increases in turbidity can also indicate a serious water quality issue. It is monitored regularly in drinking water to ensure public health and safety. Manganese is commonly found in rocks, soils and water in many areas of NB. It is monitored regularly in drinking water to ensure appropriate water quality (such as taste, odour and appearance). For questions about current water quality please contact your local government.
Lead in drinking water is most commonly due to leaching from lead service lines. Other plumbing components, such as solder or brass faucets or valves, may also contain lead. It is monitored regularly in drinking water to ensure public health and safety. For questions about current water quality please contact your local government.
Saint John
(Harbourview
Distribution
System)
Turbidity is a measure of cloudiness in water caused by tiny suspended particles, which may be harmless. However, increases in turbidity can also indicate a serious water quality issue. It is monitored regularly in drinking water to ensure public health and safety. For questions about current water quality please contact your local government.
Notes:
1. The earliest available data were from 1999 (West and East Distribution Systems) and 2012
(Harbourview).
2. There are also hundreds of other samples for subsets of the full Organic parameter list, including THMs
only, benzo(a)pyrene and pentachlorophenol, etc.
3. Or in at least 2 samples when there were 10 or fewer samples in total.
4. Trihalomethanes frequently exceeded the guidelines at all sampling locations in the West distribution
system. Results sometimes approached the guideline at some locations in the East distribution system,
but there were no exceedances in the East system (based on annual running average).
5. Or in only 1 sample when there were 10 or fewer samples in total.
6. The actual Turbidity guideline is much more complex than this, but a 1 NTU threshold was used to flag
possible exceedances. However, this approach may sometimes capture events that were not true
exceedances and may miss some exceedances in systems where filtration is in place.
7. Pb had 69 detections, including 4 MAC exceedances, in 219 samples.
The guideline was exceeded in at least 10% of samples3
Maximum result Guideline
Turbidity 3.84 NTU 1.0 NTU6
Manganese 0.805 mg/L AO = 0.05 mg/L
The guideline was exceeded in less than 10% of samples5
Maximum result Guideline
Lead7 0.0155 mg/L MAC = 0.01 mg/L
The guideline was exceeded in less than 10% of samples5
Maximum result Guideline
Turbidity 1.4 NTU 1.0 NTU6

91
For questions about current water quality please contact your local government.
The following represents the water quality results post commissioning of the new Loch Lomond Drinking Water Treatment Facility and commissioning of the new groundwater system that services part of west Saint John. It also includes the groundwater system that services the Harbourview Subidivision.
Bacteria in Water Distribution System: Exceedances of Guidelines
(September 1, 2018 - March 31, 2021)
Total Number of Samples =4329 (Saint John); 258 (Harbourview Subdivision)
E. coli Total coliforms
Saint John
Saint John
(Harbourview
system)
Notes:
1. Sample location was retested for two consecutive days and results were 0 cfu for E.coli.
E. coli (Escherichia coli) is a species of bacteria that is naturally found in the intestines of humans and warm-blooded animals. As it is not usually found naturally in soils or water, the presence of E. coli in a water sample is a good indicator of recent faecal contamination. Drinking water should not contain any E. coli. It is monitored regularly in drinking water to ensure public health and safety. Total coliform bacteria are used as an indicator and their presence in drinking water is not considered a risk to human health, but their presence can indicate unsanitary conditions in the water system. They are monitored regularly in drinking water to ensure public health and safety. For questions about current water quality please contact your local government.
Not detected
Detected in 16 samples
(0.37% of all samples)
Detected in 1 sample1
(0.02% of all samples)
Saint John
Not detected

92
Chemistry of Water in Distribution System: Exceedances of Guidelines
(September 1, 2018 - March 31, 2021)
Total Number of Samples = East: 4664 Inorganic and 3012 Organic; Harbourview: 364
Inorganic and 210 Organic
Saint John
West
Distribution
System
Saint John
East
Distribution
System
Turbidity is a measure of cloudiness in water caused by tiny suspended particles, which may be harmless. However, increases in turbidity can also indicate a serious water quality issue. It is monitored regularly in drinking water to ensure public health and safety.
Saint John
(Harbourview
Distribution
System)
Turbidity is a measure of cloudiness in water caused by tiny suspended particles, which may be harmless. However, increases in turbidity can also indicate a serious water quality issue. It is monitored regularly in drinking water to ensure public health and safety.
Iron is present in almost all soils and many rocks. It is monitored regularly in drinking water to ensure appropriate water quality (such as taste, odour and appearance). For questions about current water quality please contact your local government.
Notes:
1. Or in only 1 sample when there were 10 or fewer samples in total.
2. The actual Turbidity guideline is much more complex than this, but a 1 NTU threshold was used to
flag possible exceedances. However, this approach may sometimes capture events that were not
true exceedances and may miss some exceedances in systems where filtration is in place.
3. Or in at least 2 samples when there were 10 or fewer samples in total.
4. Iron exceeded the guideline in 1 of 20 samples.
No Detections
The guideline was exceeded in less than 10% of samples1
Maximum result Guideline
Turbidity
4.67 NTU
1.0 NTU2
The guideline was exceeded in less than 10% of samples1
Maximum result Guideline
Iron 0.6 mg/L4 AO = 0.3 mg/L
The guideline was exceeded in at least 10% of samples3
Maximum result Guideline
Turbidity 1.81 NTU 1.0 NTU2
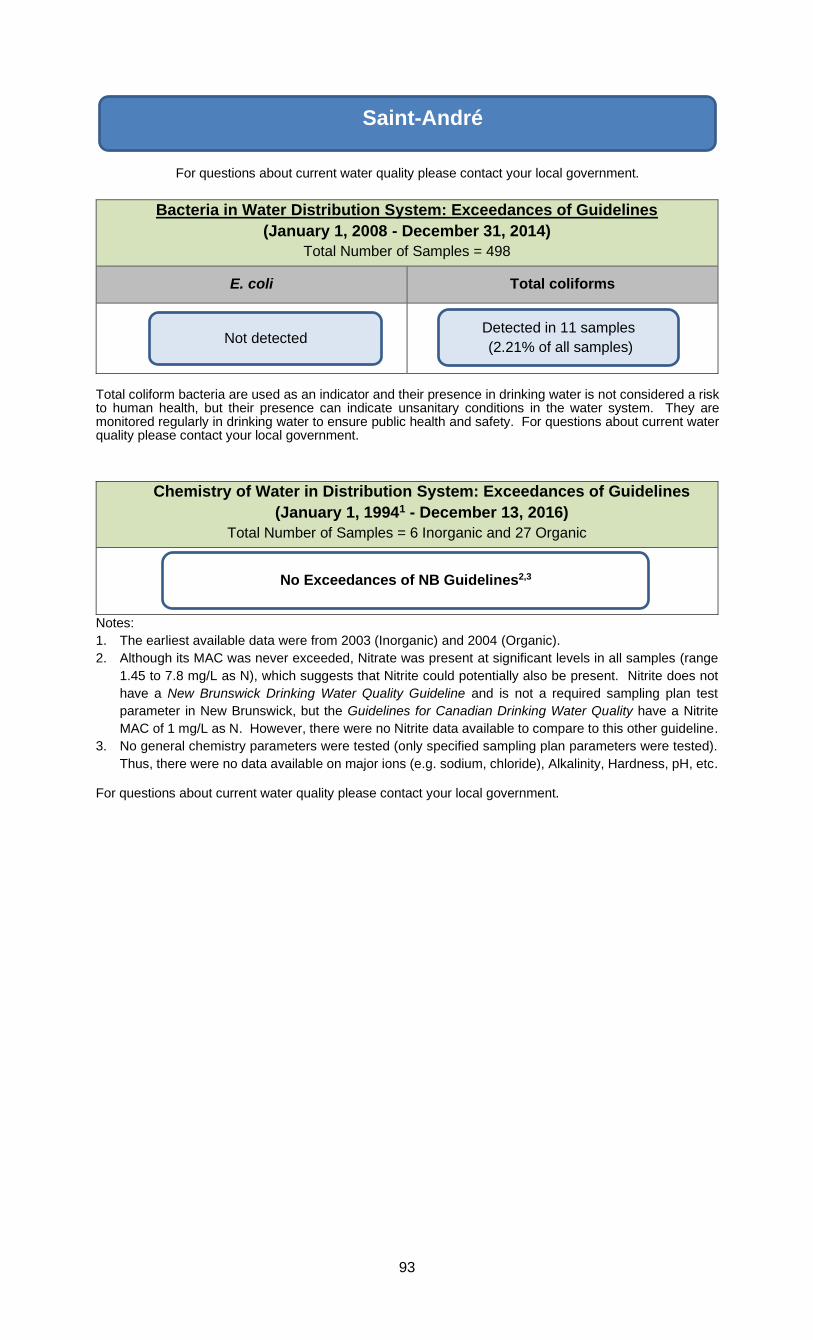
93
For questions about current water quality please contact your local government.
Bacteria in Water Distribution System: Exceedances of Guidelines
(January 1, 2008 - December 31, 2014)
Total Number of Samples = 498
E. coli Total coliforms
Total coliform bacteria are used as an indicator and their presence in drinking water is not considered a risk to human health, but their presence can indicate unsanitary conditions in the water system. They are monitored regularly in drinking water to ensure public health and safety. For questions about current water quality please contact your local government.
Chemistry of Water in Distribution System: Exceedances of Guidelines
(January 1, 19941 - December 13, 2016)
Total Number of Samples = 6 Inorganic and 27 Organic
Notes:
1. The earliest available data were from 2003 (Inorganic) and 2004 (Organic).
2. Although its MAC was never exceeded, Nitrate was present at significant levels in all samples (range
1.45 to 7.8 mg/L as N), which suggests that Nitrite could potentially also be present. Nitrite does not
have a New Brunswick Drinking Water Quality Guideline and is not a required sampling plan test
parameter in New Brunswick, but the Guidelines for Canadian Drinking Water Quality have a Nitrite
MAC of 1 mg/L as N. However, there were no Nitrite data available to compare to this other guideline.
3. No general chemistry parameters were tested (only specified sampling plan parameters were tested).
Thus, there were no data available on major ions (e.g. sodium, chloride), Alkalinity, Hardness, pH, etc.
For questions about current water quality please contact your local government.
Saint-André
Not detected Detected in 11 samples
(2.21% of all samples)
No Exceedances of NB Guidelines2,3

94
For questions about current water quality please contact your local government.
Bacteria in Water Distribution System: Exceedances of Guidelines
(January 1, 2008 - December 31, 2014)
Total Number of Samples = 522
E. coli Total coliforms
Total coliform bacteria are used as an indicator and their presence in drinking water is not considered a risk to human health, but their presence can indicate unsanitary conditions in the water system. They are monitored regularly in drinking water to ensure public health and safety. For questions about current water quality please contact your local government.
Chemistry of Water in Distribution System: Exceedances of Guidelines
(January 1, 19941 - November 17, 2016)
Total Number of Samples = 15 Inorganic and 60 Organic
Notes:
1. The earliest available data were from 2001.
For questions about current water quality please contact your local government.
Saint-Antoine
Not detected Detected in 2 samples
(0.38% of all samples)
No Exceedances of NB Guidelines

95
For questions about current water quality please contact your local government.
Bacteria in Water Distribution System: Exceedances of Guidelines
(January 1, 2008 - December 31, 2014)
Total Number of Samples = 423
E. coli Total coliforms
Total coliform bacteria are used as an indicator and their presence in drinking water is not considered a risk to human health, but their presence can indicate unsanitary conditions in the water system. They are monitored regularly in drinking water to ensure public health and safety. For questions about current water quality please contact your local government.
Chemistry of Water in Distribution System: Exceedances of Guidelines
(January 1, 19941 - November 17, 2016)
Total Number of Samples = 18 Inorganic2 and 18 Organic
Iron is present in almost all soils and many rocks. It is monitored regularly in drinking water to ensure appropriate water quality (such as taste, odour and appearance). Manganese is commonly found in rocks, soils and water in many areas of NB. It is monitored regularly in drinking water to ensure appropriate water quality (such as taste, odour and appearance). Turbidity is a measure of cloudiness in water caused by tiny suspended particles, which may be harmless. However, increases in turbidity can also indicate a serious water quality issue. It is monitored regularly in drinking water to ensure public health and safety. For questions about current water quality please contact your local government.
Arsenic detected in drinking water is almost always due to natural sources in the rock and soil surrounding a well, and this can be common in some areas of NB. It is monitored regularly in drinking water to ensure public health and safety. For questions about current water quality please contact your local government.
Notes:
1. The earliest available data were from 2001, except for 2 Organic samples from 1997.
2. There were also an additional 5 samples tested for Arsenic only.
3. Or in at least 2 samples when there were 10 or fewer samples in total.
4. The actual Turbidity guideline is much more complex than this, but a 1 NTU threshold was used to flag
possible exceedances. However, this approach may sometimes capture events that were not true
exceedances and may miss some exceedances in systems where filtration is in place.
5. Or in only 1 sample when there were 10 or fewer samples in total
6. Arsenic exceeded the MAC in only 1 sample in 2006, but was detected in all samples (23 of 23,
minimum value 2 µg/L or 0.002 mg/L)
Sainte-Anne-de-Madawaska
Not detected Detected in 7 samples
(1.65% of all samples)
The guideline was exceeded in at least 10% of samples3
Maximum result Guideline
Iron 0.954 mg/L AO = 0.3 mg/L
Manganese 0.19 mg/L AO = 0.05 mg/L
Turbidity 9.28 NTU 1.0 NTU4
The guideline was exceeded in less than 10% of samples5
Maximum result Guideline
Arsenic6 0.013 mg/L MAC = 0.010 mg/L

96
For questions about current water quality please contact your local government.
Bacteria in Water Distribution System: Exceedances of Guidelines
(January 1, 2008 - December 31, 2014)
Total Number of Samples = 425
E. coli Total coliforms
Total coliform bacteria are used as an indicator and their presence in drinking water is not considered a risk to human health, but their presence can indicate unsanitary conditions in the water system. They are monitored regularly in drinking water to ensure public health and safety. For questions about current water quality please contact your local government.
Chemistry of Water in Distribution System: Exceedances of Guidelines
(January 1, 1994 - November 18, 2016)
Total Number of Samples = 14 Inorganic and 81 Organic
Manganese is commonly found in rocks, soils and water in many areas of NB. It is monitored regularly in drinking water to ensure appropriate water quality (such as taste, odour and appearance). For questions about current water quality please contact your local government.
Iron is present in almost all soils and many rocks. It is monitored regularly in drinking water to ensure appropriate water quality (such as taste, odour and appearance). For questions about current water quality please contact your local government.
Notes:
1. Or in at least 2 samples when there were 10 or fewer samples in total.
2. No exceedances after 2006.
3. Or in only 1 sample when there were 10 or fewer samples in total.
Saint-François-de-Madawaska
Not detected Detected in 4 samples
(0.95% of all samples)
The guideline was exceeded in at least 10% of samples1
Maximum result Guideline
Manganese2 0.211 mg/L AO = 0.05 mg/L
The guideline was exceeded in less than 10% of samples3
Maximum result Guideline
Iron 3.45 mg/L AO = 0.3 mg/L

97
For questions about current water quality please contact your local government.
Bacteria in Water Distribution System: Exceedances of Guidelines
(January 1, 2008 - December 31, 2014)
Total Number of Samples =410
E. coli Total coliforms
Total coliform bacteria are used as an indicator and their presence in drinking water is not considered a risk to human health, but their presence can indicate unsanitary conditions in the water system. They are monitored regularly in drinking water to ensure public health and safety. For questions about current water quality please contact your local government.
Chemistry of Water in Distribution System: Exceedances of Guidelines
(January 1, 1994 - January 10, 2017)
Total Number of Samples = 12 Inorganic and 149 Organic
Manganese is commonly found in rocks, soils and water in many areas of NB. It is monitored regularly in drinking water to ensure appropriate water quality (such as taste, odour and appearance). For questions about current water quality please contact your local government.
Notes:
1. Or in at least 2 samples when there were 10 or fewer samples in total.
Saint-Hilaire
Not detected Detected in 6 samples
(1.47% of all samples)
The guideline was exceeded in at least 10% of samples1
Maximum result Guideline
Manganese 0.782 mg/L AO = 0.05 mg/L

98
For questions about current water quality please contact your local government.
Bacteria in Water Distribution System: Exceedances of Guidelines
(January 1, 2008 - December 31, 2014)
Total Number of Samples = 400
E. coli Total coliforms
Total coliform bacteria are used as an indicator and their presence in drinking water is not considered a risk to human health, but their presence can indicate unsanitary conditions in the water system. They are monitored regularly in drinking water to ensure public health and safety. For questions about current water quality please contact your local government.
Chemistry of Water in Distribution System: Exceedances of Guidelines
(January 1, 1994 - November 21, 2016)
Total Number of Samples = 11 Inorganic and 23 Organic
Manganese is commonly found in rocks, soils and water in many areas of NB. It is monitored regularly in drinking water to ensure appropriate water quality (such as taste, odour and appearance). Turbidity is a measure of cloudiness in water caused by tiny suspended particles, which may be harmless. However, increases in turbidity can also indicate a serious water quality issue. It is monitored regularly in drinking water to ensure public health and safety. For questions about current water quality please contact your local government.
Lead in drinking water is most commonly due to leaching from lead service lines. Other plumbing components, such as solder or brass faucets or valves, may also contain lead. It is monitored regularly in drinking water to ensure public health and safety. For questions about current water quality please contact your local government.
Notes:
1. Or in at least 2 samples when there were 10 or fewer samples in total.
2. The actual Turbidity guideline is much more complex than this, but a 1 NTU threshold was used to flag
possible exceedances. However, this approach may sometimes capture events that were not true
exceedances and may miss some exceedances in systems where filtration is in place.
3. Or in only 1 sample when there were 10 or fewer samples in total.
4. Pb exceeded the MAC in 1 sample taken in 2001.
Saint-Léonard
Not detected Detected in 1 sample
(0.25% of all samples)
The guideline was exceeded in at least 10% of samples1
Maximum result Guideline
Manganese 0.204 mg/L AO = 0.05 mg/L
Turbidity 2.6 NTU 1.0 NTU2
The guideline was exceeded in less than 10% of samples3
Maximum result Guideline
Lead4 0.078 mg/L MAC = 0.01 mg/L

99
For questions about current water quality please contact your local government.
Bacteria in Water Distribution System: Exceedances of Guidelines
(January 1, 2008 - December 31, 2014)
Total Number of Samples = 386
E. coli Total coliforms
For questions about current water quality please contact your local government.
Chemistry of Water in Distribution System: Exceedances of Guidelines
(January 1, 1994 - November 22, 2016)
Total Number of Samples = 11 Inorganic and 46 Organic
Manganese is commonly found in rocks, soils and water in many areas of NB. It is monitored regularly in drinking water to ensure appropriate water quality (such as taste, odour and appearance). For questions about current water quality please contact your local government.
Iron is present in almost all soils and many rocks. It is monitored regularly in drinking water to ensure appropriate water quality (such as taste, odour and appearance). For questions about current water quality please contact your local government.
Notes:
1. Or in at least 2 samples when there were 10 or fewer samples in total.
2. Or in only 1 sample when there were 10 or fewer samples in total.
Saint-Louis-de-Kent
Not detected Not detected
The guideline was exceeded in at least 10% of samples1
Maximum result Guideline
Manganese 0.075 mg/L AO = 0.05 mg/L
The guideline was exceeded in less than 10% of samples2
Maximum result Guideline
Iron 6.8 mg/L AO = 0.3 mg/L

100
For questions about current water quality please contact your local government.
Bacteria in Water Distribution System: Exceedances of Guidelines
(January 1, 2008 - December 31, 2014)
Total Number of Samples = 451
E. coli Total coliforms
For questions about current water quality please contact your local government.
Chemistry of Water in Distribution System: Exceedances of Guidelines
(January 1, 1994 - November 30, 20161)
Total Number of Samples = 12 Inorganic and 86 Organic
Notes:
1. There were no Inorganic data available more recently than 2002 (except for raw water samples, for
which there were data available throughout 1994 to 2016). Organic data in the distribution system were
also available throughout the date range.
For questions about current water quality please contact your local government.
Saint-Quentin
Not detected Not detected
No Exceedances of NB Guidelines

101
For questions about current water quality please contact your local government.
Bacteria in Water Distribution System: Exceedances of Guidelines
(January 1, 2008 - December 31, 2014)
Total Number of Samples = 653
E. coli Total coliforms
Total coliform bacteria are used as an indicator and their presence in drinking water is not considered a risk to human health, but their presence can indicate unsanitary conditions in the water system. They are monitored regularly in drinking water to ensure public health and safety. For questions about current water quality please contact your local government.
Chemistry of Water in Distribution System: Exceedances of Guidelines
(January 1, 1994 - December 1, 2016)
Total Number of Samples = 34 Inorganic and 26 Organic1
Distribution Systems
Manganese is commonly found in rocks, soils and water in many areas of NB. It is monitored regularly in drinking water to ensure appropriate water quality (such as taste, odour and appearance). For questions about current water quality please contact your local government.
Chloride occurs in nature as part of many salts (e.g. table salt is pure sodium chloride) and it typically occurs in all waters to some degree. It is monitored regularly in drinking water to ensure appropriate water quality (such as taste, odour and appearance). Lead in drinking water is most commonly due to leaching from lead service lines. Other plumbing components, such as solder or brass faucets or valves, may also contain lead. It is monitored regularly in drinking water to ensure public health and safety. Selenium occurs naturally in soil and certain plumbing components (non-leaded brass). It is monitored regularly in drinking water to ensure public health and safety. Turbidity is a measure of cloudiness in water caused by tiny suspended particles, which may be harmless. However, increases in turbidity can also indicate a serious water quality issue. It is monitored regularly in drinking water to ensure public health and safety. For questions about current water quality please contact your local government.
Shediac
Not detected Detected in 2 samples
(0.31% of all samples)
The guideline was exceeded in at least 10% of samples2
Maximum result Guideline
Manganese 0.079 mg/L AO = 0.05 mg/L
The guideline was exceeded in less than 10% of samples3
Maximum result Guideline
Chloride 266 mg/L AO = 250 mg/L
Lead4 0.110 mg/L MAC = 0.01 mg/L
Selenium 0.0105 mg/L MAC = 0.01 mg/L
Turbidity 1.0 NTU 1.0 NTU5

102
Notes:
1. There were also an additional 59 Organic samples tested for THMs only.
2. Or in at least 2 samples when there were 10 or fewer samples in total.
3. Or in only 1 sample when there were 10 or fewer samples in total.
4. Pb exceeded the MAC in 2 samples in 1995.
5. The actual Turbidity guideline is much more complex than this, but a 1 NTU threshold was used to flag
possible exceedances. However, this approach may sometimes capture events that were not true
exceedances and may miss some exceedances in systems where filtration is in place.

103
For questions about current water quality please contact your local government.
Bacteria in Water Distribution System: Exceedances of Guidelines
(January 1, 2008 - December 31, 2014)
Total Number of Samples = 428
E. coli Total coliforms
Total coliform bacteria are used as an indicator and their presence in drinking water is not considered a risk to human health, but their presence can indicate unsanitary conditions in the water system. They are monitored regularly in drinking water to ensure public health and safety. For questions about current water quality please contact your local government.
Chemistry of Water in Distribution System: Exceedances of Guidelines
(January 1, 1994 - December 13, 2016)
Total Number of Samples = 20 Inorganic and 94 Organic
Turbidity is a measure of cloudiness in water caused by tiny suspended particles, which may be harmless. However, increases in turbidity can also indicate a serious water quality issue. It is monitored regularly in drinking water to ensure public health and safety. For questions about current water quality please contact your local government.
Iron is present in almost all soils and many rocks. It is monitored regularly in drinking water to ensure appropriate water quality (such as taste, odour and appearance). For questions about current water quality please contact your local government.
Notes:
1. Or in at least 2 samples when there were 10 or fewer samples in total.
2. The actual Turbidity guideline is much more complex than this, but a 1 NTU threshold was used to flag
possible exceedances. However, this approach may sometimes capture events that were not true
exceedances and may miss some exceedances in systems where filtration is in place.
3. Or in only 1 sample when there were 10 or fewer samples in total.
Shippagan
Not detected Detected in 1 sample
(0.23% of all samples)
The guideline was exceeded in at least 10% of samples1
Maximum result Guideline
Turbidity 2.3 NTU 1.0 NTU2
The guideline was exceeded in less than 10% of samples3
Maximum result Guideline
Iron 0.416 mg/L AO = 0.3 mg/L

104
For questions about current water quality please contact your local government.
Bacteria in Water Distribution System: Exceedances of Guidelines
(January 1, 2008 - December 31, 2014)
Total Number of Samples = 714
E. coli Total coliforms
Total coliform bacteria are used as an indicator and their presence in drinking water is not considered a risk to human health, but their presence can indicate unsanitary conditions in the water system. They are monitored regularly in drinking water to ensure public health and safety. For questions about current water quality please contact your local government.
Chemistry of Water in Distribution System: Exceedances of Guidelines
(January 1, 1994 - December 14, 2016)
Total Number of Samples = 30 Inorganic and 76 Organic
Turbidity is a measure of cloudiness in water caused by tiny suspended particles, which may be harmless. However, increases in turbidity can also indicate a serious water quality issue. It is monitored regularly in drinking water to ensure public health and safety. For questions about current water quality please contact your local government.
Iron is present in almost all soils and many rocks. It is monitored regularly in drinking water to ensure appropriate water quality (such as taste, odour and appearance). For questions about current water quality please contact your local government.
Notes:
1. Or in at least 2 samples when there were 10 or fewer samples in total.
2. The actual Turbidity guideline is much more complex than this, but a 1 NTU threshold was used to flag
possible exceedances. However, this approach may sometimes capture events that were not true
exceedances and may miss some exceedances in systems where filtration is in place.
3. Or in only 1 sample when there were 10 or fewer samples in total.
St. George
Not detected Detected in 2 samples
(0.28% of all samples)
The guideline was exceeded in at least 10% of samples1
Maximum result Guideline
Turbidity 5 NTU 1.0 NTU2
The guideline was exceeded in less than 10% of samples3
Maximum result Guideline
Iron 0.46 mg/L AO = 0.3 mg/L
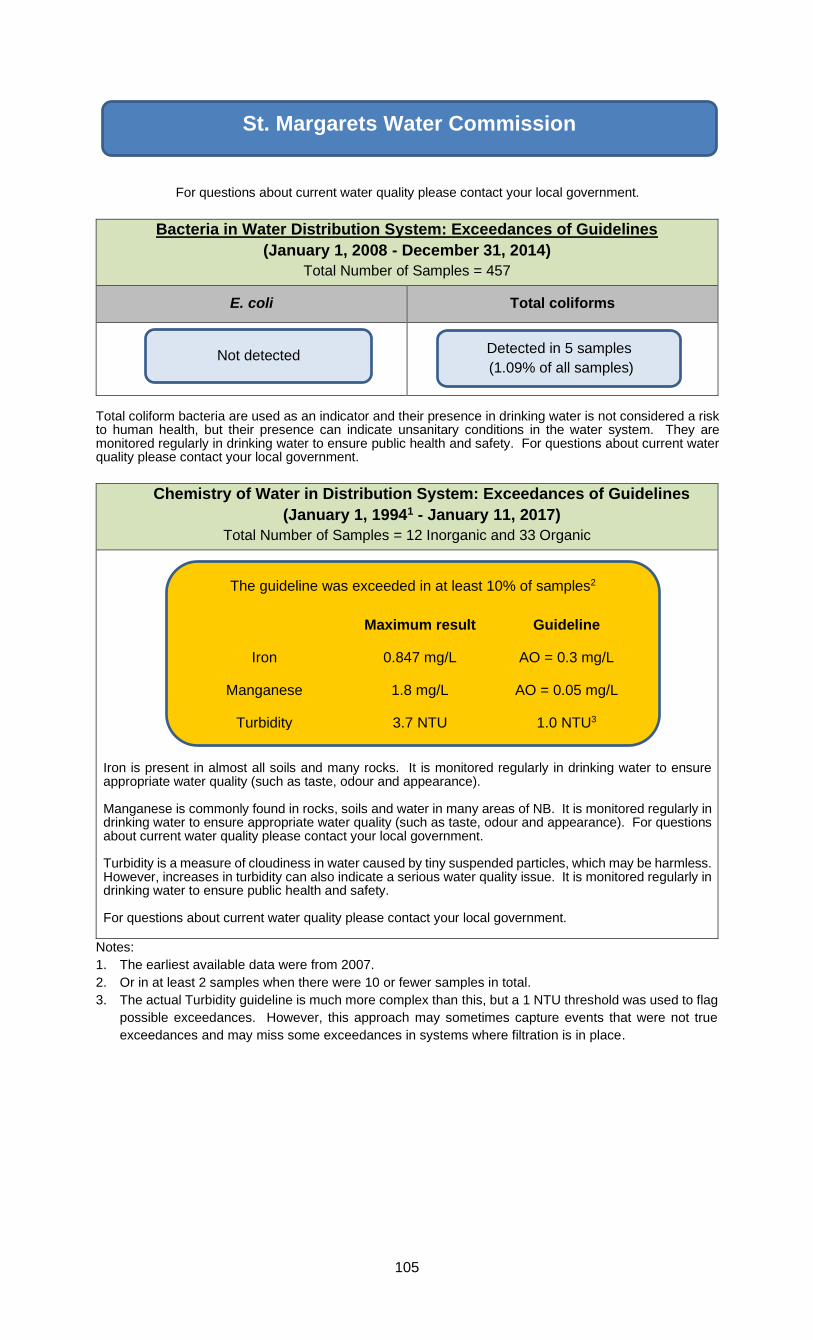
105
For questions about current water quality please contact your local government.
Bacteria in Water Distribution System: Exceedances of Guidelines
(January 1, 2008 - December 31, 2014)
Total Number of Samples = 457
E. coli Total coliforms
Total coliform bacteria are used as an indicator and their presence in drinking water is not considered a risk to human health, but their presence can indicate unsanitary conditions in the water system. They are monitored regularly in drinking water to ensure public health and safety. For questions about current water quality please contact your local government.
Chemistry of Water in Distribution System: Exceedances of Guidelines
(January 1, 19941 - January 11, 2017)
Total Number of Samples = 12 Inorganic and 33 Organic
Iron is present in almost all soils and many rocks. It is monitored regularly in drinking water to ensure appropriate water quality (such as taste, odour and appearance). Manganese is commonly found in rocks, soils and water in many areas of NB. It is monitored regularly in drinking water to ensure appropriate water quality (such as taste, odour and appearance). For questions about current water quality please contact your local government. Turbidity is a measure of cloudiness in water caused by tiny suspended particles, which may be harmless. However, increases in turbidity can also indicate a serious water quality issue. It is monitored regularly in drinking water to ensure public health and safety. For questions about current water quality please contact your local government.
Notes:
1. The earliest available data were from 2007.
2. Or in at least 2 samples when there were 10 or fewer samples in total.
3. The actual Turbidity guideline is much more complex than this, but a 1 NTU threshold was used to flag
possible exceedances. However, this approach may sometimes capture events that were not true
exceedances and may miss some exceedances in systems where filtration is in place.
St. Margarets Water Commission
Not detected Detected in 5 samples
(1.09% of all samples)
The guideline was exceeded in at least 10% of samples2
Maximum result Guideline
Iron 0.847 mg/L AO = 0.3 mg/L
Manganese 1.8 mg/L AO = 0.05 mg/L
Turbidity 3.7 NTU 1.0 NTU3

106
For questions about current water quality please contact your local government.
Bacteria in Water Distribution System: Exceedances of Guidelines
(January 1, 2008 - December 31, 2014)
Total Number of Samples = 567
E. coli Total coliforms
Total coliform bacteria are used as an indicator and their presence in drinking water is not considered a risk to human health, but their presence can indicate unsanitary conditions in the water system. They are monitored regularly in drinking water to ensure public health and safety. For questions about current water quality please contact your local government.
Chemistry of Water in Distribution System: Exceedances of Guidelines
(January 1, 1994 - January 11, 2017)
Total Number of Samples = 39 Inorganic1 and 103 Organic
Copper in drinking water almost always results from corrosion of copper pipes or other plumbing components, such as faucets and valves. It is monitored regularly in drinking water to ensure appropriate water quality (such as taste, odour and appearance). Iron is present in almost all soils and many rocks. It is monitored regularly in drinking water to ensure appropriate water quality (such as taste, odour and appearance). For questions about current water quality please contact your local government.
Manganese is commonly found in rocks, soils and water in many areas of NB. It is monitored regularly in drinking water to ensure appropriate water quality (such as taste, odour and appearance). Lead in drinking water is most commonly due to leaching from lead service lines. Other plumbing components, such as solder or brass faucets or valves, may also contain lead. It is monitored regularly in drinking water to ensure public health and safety. Turbidity is a measure of cloudiness in water caused by tiny suspended particles, which may be harmless. However, increases in turbidity can also indicate a serious water quality issue. It is monitored regularly in drinking water to ensure public health and safety. For questions about current water quality please contact your local government.
Notes:
St. Stephen
Not detected Detected in 4 samples
(0.71% of all samples)
The guideline was exceeded in at least 10% of samples2
Maximum result Guideline
Copper 2.3 mg/L AO = 1.0 mg/L
Iron 0.855 mg/L AO = 0.3 mg/L
The guideline was exceeded in less than 10% of samples3
Maximum result Guideline
Manganese 0.174 mg/L AO = 0.05 mg/L
Lead4 0.064 mg/L MAC = 0.01 mg/L
Turbidity 3.4 NTU 1.0 NTU5

107
1. There were also hundreds of additional Inorganic samples for a variety of individual parameters or
subsets of the full Inorganic parameter list, e.g. Arsenic, Calcium, Chloride, Iron, Lead, pH, Turbidity,
etc.
2. Or in at least 2 samples when there were 10 or fewer samples in total.
3. Or in only 1 sample when there were 10 or fewer samples in total.
4. Lead was detected in 153 of 209 samples including 3 exceedances of the MAC.
5. The actual Turbidity guideline is much more complex than this, but a 1 NTU threshold was used to flag
possible exceedances. However, this approach may sometimes capture events that were not true
exceedances and may miss some exceedances in systems where filtration is in place.

108
For questions about current water quality please contact your local government.
Bacteria in Water Distribution System: Exceedances of Guidelines
(January 1, 2008 - December 31, 2014)
Total Number of Samples = 2538
E. coli Total coliforms
Total coliform bacteria are used as an indicator and their presence in drinking water is not considered a risk to human health, but their presence can indicate unsanitary conditions in the water system. They are monitored regularly in drinking water to ensure public health and safety. For questions about current water quality please contact your local government.
Chemistry of Water in Distribution System: Exceedances of Guidelines
(January 1, 1994 – January 19, 2017)
Total Number of Samples = 23 Inorganic and 93 Organic
For questions about current water quality please contact your local government.
Sussex
Not detected Detected in 8 samples
(0.32% of all samples)
No Exceedances of NB Guidelines

109
For questions about current water quality please contact your local government.
Bacteria in Water Distribution System: Exceedances of Guidelines
(January 1, 2008 - December 31, 2014)
Total Number of Samples = 548
E. coli Total coliforms
Total coliform bacteria are used as an indicator and their presence in drinking water is not considered a risk to human health, but their presence can indicate unsanitary conditions in the water system. They are monitored regularly in drinking water to ensure public health and safety. For questions about current water quality please contact your local government.
Chemistry of Water in Distribution System: Exceedances of Guidelines
(January 1, 19941 - January 20, 2017)
Total Number of Samples = 23 Inorganic and 46 Organic
Notes:
1. The earliest available data were from 2003.
For questions about current water quality please contact your local government.
Sussex Corner
Not detected Detected in 13 samples
(2.37% of all samples)
No Exceedances of NB Guidelines

110
For questions about current water quality please contact your local government.
Bacteria in Water Distribution System: Exceedances of Guidelines
(January 1, 2008 - December 31, 2014)
Total Number of Samples = 471
E. coli Total coliforms
Total coliform bacteria are used as an indicator and their presence in drinking water is not considered a risk to human health, but their presence can indicate unsanitary conditions in the water system. They are monitored regularly in drinking water to ensure public health and safety. For questions about current water quality please contact your local government.
Chemistry of Water in Distribution System: Exceedances of Guidelines
(January 1, 1994 - January 20, 2017)
Total Number of Samples = 11 Inorganic and 28 Organic
Turbidity is a measure of cloudiness in water caused by tiny suspended particles, which may be harmless. However, increases in turbidity can also indicate a serious water quality issue. It is monitored regularly in drinking water to ensure public health and safety. For questions about current water quality please contact your local government.
Notes:
1. Or in only 1 sample when there were 10 or fewer samples in total.
2. The actual Turbidity guideline is much more complex than this, but a 1 NTU threshold was used to flag
possible exceedances. However, this approach may sometimes capture events that were not true
exceedances and may miss some exceedances in systems where filtration is in place.
Tide Head
Not detected Detected in 2 samples
(0.42% of all samples)
The guideline was exceeded in less than 10% of samples1
Maximum result Guideline
Turbidity 1.2 NTU 1.0 NTU2

111
For questions about current water quality please contact your local government.
Bacteria in Water Distribution System: Exceedances of Guidelines
(January 1, 2008 - December 31, 2014)
Total Number of Samples = 683
E. coli Total coliforms
Total coliform bacteria are used as an indicator and their presence in drinking water is not considered a risk to human health, but their presence can indicate unsanitary conditions in the water system. They are monitored regularly in drinking water to ensure public health and safety. For questions about current water quality please contact your local government.
Chemistry of Water in Distribution System: Exceedances of Guidelines
(January 1, 1994 - January 20, 2017)
Total Number of Samples = 46 Inorganic and 156 Organic
Tracadie-
Sheila
Manganese is commonly found in rocks, soils and water in many areas of NB. It is monitored regularly in drinking water to ensure appropriate water quality (such as taste, odour and appearance). For questions about current water quality please contact your local government.
Turbidity is a measure of cloudiness in water caused by tiny suspended particles, which may be harmless. However, increases in turbidity can also indicate a serious water quality issue. It is monitored regularly in drinking water to ensure public health and safety. For questions about current water quality please contact your local government.
Notes:
1. Or in at least 2 samples when there were 10 or fewer samples in total.
2. Or in only 1 sample when there were 10 or fewer samples in total.
3. The actual Turbidity guideline is much more complex than this, but a 1 NTU threshold was used to flag
possible exceedances. However, this approach may sometimes capture events that were not true
exceedances and may miss some exceedances in systems where filtration is in place.
Tracadie-Sheila
The guideline was exceeded in at least 10% of samples1
Maximum result Guideline
Manganese 0.159 mg/L AO = 0.05 mg/L
The guideline was exceeded in less than 10% of samples2
Maximum result Guideline
Turbidity 1.1 NTU 1.0 NTU3
Not detected Detected in 7 samples
(1.03% of all samples)

112
For questions about current water quality please contact your local government.
Bacteria in Water Distribution System: Exceedances of Guidelines
(January 1, 2008 - December 31, 2014)
Total Number of Samples = 567
E. coli Total coliforms
Total coliform bacteria are used as an indicator and their presence in drinking water is not considered a risk to human health, but their presence can indicate unsanitary conditions in the water system. They are monitored regularly in drinking water to ensure public health and safety. For questions about current water quality please contact your local government.
Chemistry of Water in Distribution System: Exceedances of Guidelines
(January 1, 19941 - January 25, 2017)
Total Number of Samples = 13 Inorganic and 15 Organic
Manganese is commonly found in rocks, soils and water in many areas of NB. It is monitored regularly in drinking water to ensure appropriate water quality (such as taste, odour and appearance). For questions about current water quality please contact your local government. Turbidity is a measure of cloudiness in water caused by tiny suspended particles, which may be harmless. However, increases in turbidity can also indicate a serious water quality issue. It is monitored regularly in drinking water to ensure public health and safety. For questions about current water quality please contact your local government.
Notes:
1. The earliest available data were from 2009.
2. Or in at least 2 samples when there were 10 or fewer samples in total.
3. Or in only 1 sample when there were 10 or fewer samples in total.
4. The actual Turbidity guideline is much more complex than this, but a 1 NTU threshold was used to flag
possible exceedances. However, this approach may sometimes capture events that were not true
exceedances and may miss some exceedances in systems where filtration is in place.
Woodstock
Not detected Detected in 7 samples
(1.23% of all samples)
The guideline was exceeded in at least 10% of samples2
Maximum result Guideline
Manganese 0.50 mg/L AO = 0.05 mg/L
The guideline was exceeded in less than 10% of samples3
Maximum result Guideline
Turbidity 1.4 NTU 1.0 NTU4

113
Appendix B - Water Quality of Raw
Source Water (Before Treatment)

114
Bacteria Findings for Raw Source Water (Before Treatment)
The following table lists the findings (from all available data 2008 to 2014) regarding the
microbiological quality of each individual municipal raw water supply before it was treated to
remove contaminants or disinfected. This is not a measure of the quality of water delivered to
users, but illustrates the need for proper disinfection and treatment, and the wide range of
conditions found in different raw water supplies.
Water Source Source Type
# of Samples
with E. coli Detected
# of Samples with Total Coliforms Detected
Total Number of Samples Tested
Alma (Well #1) Groundwater 0 10 92
Alma (Well #2) Groundwater 0 10 85
Aroostook (Well #1) Groundwater 0 0 80
Aroostook (Well #2) Groundwater 13 167 190
Atholville (Well #1) Groundwater 2 55 99
Atholville (Well #2A) Groundwater 0 0 88
Atholville (Well #3) Groundwater 0 5 93
Atholville (Well #4) Groundwater 3 21 93
Baker Brook (Étang de recharge) Surface Water 75 75 75
Baker Brook(Puits P-12-1) Groundwater 0 8 29
Baker Brook (Puits PW-1-80) Groundwater 0 2 7
Baker Brook (Puits PW-2-80) Groundwater 0 2 6
Baker Brook (Puits rivière St-Jean) Groundwater 11 40 100
Baker Brook (Puits Piste Cyclable) - retired Groundwater 2 38 62
Baker Brook (Puits Théophile) - retired Groundwater 0 1 5
Balmoral (Puits #1) Groundwater 5 42 90
Balmoral (Puits #2) Groundwater 0 12 79
Bas-Caraquet (Puits rue Frédérick) Groundwater 0 5 81
Bath (Well #1) Groundwater 0 3 77
Bath (Well #3) Groundwater 0 2 87
Bathurst (Middle River) Surface Water 72 83 83
Belledune (Jacquet River) Surface Water 63 81 81
Blacks Harbour (Wallace Cove Well) Groundwater 0 1 83
Blacks Harbour (Well #3) Groundwater 0 2 84
Blacks Harbour (Well #4) Groundwater 0 9 90
Bouctouche (Puits #1) Groundwater 0 1 15
Bouctouche (Puits #2) Groundwater 0 1 85
Bouctouche (Puits #3) Groundwater 2 2 8
Bouctouche (Puits #4) Groundwater 1 6 41
Campbellton (Raw Water) Surface Water 59 363 369
Caraquet (Puits de la rue du Portage) Groundwater 1 29 79
Caraquet (Puits de la rue Lavigne) Groundwater 0 0 84
Caraquet (Source du chemin St-Simon) Spring 3 20 85
Charlo (Puits - Well 1) Groundwater 0 0 86
Charlo (Puits - Well 2) Groundwater 0 3 86
Clair (Puits P-04-01) Groundwater 0 9 94
Clair (Puits P-06-01) Groundwater 0 5 93
Clair (Puits P-08-01) Groundwater 0 1 25
Clair (Puits P-11-01) Groundwater 0 1 27
Clair (Lac Thompson) - retired Surface Water 41 50 56
Dalhousie (Charlo River) Surface Water 44 69 73
Doaktown (Spring Reservoir) Spring 7 145 190
Dorchester Well #1 (CSC Woodlawn Well) Groundwater 0 4 86
Dorchester Well #2 (CSC Millbrook Well) Groundwater 0 7 73

115
Water Source Source Type
# of Samples
with E. coli Detected
# of Samples with Total Coliforms Detected
Total Number of Samples Tested
Dorchester Well #3 (CSC Back-up Well) Groundwater 0 1 5
Dorchester Well #4 (Village Well) Groundwater 1 7 98
Drummond (Puits chemin Tobique) Groundwater 7 75 102
Drummond (Puits rue Station) Groundwater 1 75 104
Edmundston (Iroquois Blanchette Puits 1) Groundwater 1 26 93
Edmundston (Iroquois Blanchette Puits 2) Groundwater 10 86 94
Edmundston (Iroquois Blanchette Puits 3) Groundwater 8 63 94
Edmundston (Iroquois Blanchette Puits 4) Groundwater 0 32 92
Edmundston (Iroquois Blanchette Puits 5) Groundwater 9 43 74
Edmundston (Iroquois Blanchette Puits 6) Groundwater 2 40 94
Edmundston (Verret Puits 1) Groundwater 7 75 99
Edmundston (Verret Puits 2) Groundwater 2 42 90
Eel River Crossing (Infiltration Gallery) Infiltration Gallery 50 84 85
Fredericton (Queen Square Well PW9) Groundwater 0 10 88
Fredericton (Queen Square Well PW10) Groundwater 0 2 87
Fredericton (Queen Square Well PW11) Groundwater 0 1 78
Fredericton (Wilmot Park Well #1) Groundwater 0 0 87
Fredericton (Wilmot Park Well #2) Groundwater 0 2 88
Fredericton (Wilmot Park Well #3) Groundwater 0 3 90
Fredericton (Wilmot Park Well #5) Groundwater 0 0 86
Fredericton (Wilmot Park Well #6) Groundwater 1 6 68
Fredericton (Wilmot Park Well #7) Groundwater 0 0 90
Fredericton (Wilmot Park Well #8) Groundwater 0 3 89
Fredericton (Kilarney Reservoir - raw) Groundwater 0 1 182
Fredericton (Cliffe St Well) - retired Groundwater 0 0 14
Fredericton (Kilarney Well K1) - retired Groundwater 0 0 12
Fredericton (Kilarney Well K10) - retired Groundwater 0 0 52
Fredericton (Tower Rd Well) - retired Groundwater 0 2 53
Fredericton Junction (Well #1) Groundwater 0 33 113
Fredericton Junction (Well #4) Groundwater 0 3 80
Fredericton Junction (Well #2) - retired Groundwater 0 10 37
Grand-Sault / Grand Falls (Well #1) Groundwater 0 0 16
Grand-Sault / Grand Falls (Well #2) Groundwater 0 2 20
Grand-Sault / Grand Falls (Well #3) Groundwater 0 3 21
Grand-Sault / Grand Falls (Well #5) Groundwater 0 0 16
Hampton Well Groundwater 0 11 119
Hartland (Well #1) Groundwater 0 0 84
Hartland (Well #2) Groundwater 3 10 99
Hillsborough (Well #1) Groundwater 18 66 89
Hillsborough (Well #3) Groundwater 0 0 48
Hillsborough (Well #2) - retired Groundwater 1 5 9
Kedgwick (Puits 2) Groundwater 0 34 219
Kedgwick (Puits 3) Groundwater 8 129 254
Lamèque (Puits 5) Groundwater 0 7 87
Lamèque (Puits 7) Groundwater 0 0 9
Lamèque (Puits 8) Groundwater 0 0 55
Lamèque (Puits 9) Groundwater 4 29 108
Lamèque (Puits 10) Groundwater 0 3 6
Lamèque (Puits 3) - retired Groundwater 0 10 87
McAdam (Well #10) Groundwater 1 13 92
McAdam (Well #11) Groundwater 0 1 88
McAdam (Well #12) Groundwater 1 11 86
McAdam (Well #13) Groundwater 0 3 90

116
Water Source Source Type
# of Samples
with E. coli Detected
# of Samples with Total Coliforms Detected
Total Number of Samples Tested
Memramcook (Puits #1) Groundwater 0 11 81
Memramcook (Puits #3) - retired Groundwater 3 28 38
Memramcook (Puits 08-01) Groundwater 0 1 52
Memramcook (Puits A) - retired Groundwater 10 33 41
Memramcook (Puits C) - retired Groundwater 0 1 39
Memramcook (Source Bourgeois) Spring 8 81 88
Memramcook (Source de l'Institut) Spring 36 91 98
Memramcook (Puits #2) - retired Groundwater 1 4 8
Miramichi (Chatham - Gordon Well) Groundwater 0 1 86
Miramichi (Chatham - Henderson Well 1) Groundwater 0 1 85
Miramichi (Chatham - Henderson Well 2) Groundwater 0 1 56
Miramichi (Chatham - Howard Well) Groundwater 0 4 84
Miramichi (Chatham - Industrial Park Well) Groundwater 0 21 117
Miramichi (Chatham - Martin Well) Groundwater 0 0 84
Miramichi (Chatham - Napan Road Well) Groundwater 0 3 91
Miramichi (Chatham - Nicol Well) Groundwater 0 0 84
Miramichi (Chatham - Springvale Well) Groundwater 0 3 88
Miramichi (Douglastown - Rennie Rd Well) Groundwater 0 4 93
Miramichi (Douglastown - Williston Ext Well) Groundwater 0 4 89
Miramichi (Douglastown - Williston Well) Groundwater 0 1 86
Miramichi (Newcastle - Allison Well) Groundwater 0 12 93
Miramichi (Newcastle - McKay Well) Groundwater 0 0 87
Miramichi (Newcastle - Millar Well) Groundwater 0 1 58
Miramichi (Newcastle - Mitchell Well) Groundwater 0 0 85
Miramichi (Newcastle - Trevors Well) Groundwater 0 2 90
Miramichi (Newcastle - Turcotte Well) Groundwater 0 6 71
Miramichi (Chatham - Walsh Well) - retired Groundwater 0 6 67
Moncton (Mapleton Well) Groundwater 0 0 358
Moncton (McLaughlin Reservoir) Surface Water 34 168 334
Moncton (Turtle Creek Reservoir) Surface Water 522 662 673
Nackawic (Well #3) Groundwater 0 1 95
Nackawic (Well #4) Groundwater 0 0 2
New Maryland (Well A-10) Groundwater 0 3 86
New Maryland (Well A-11) Groundwater 0 2 85
New Maryland (Well A-20) Groundwater 0 0 82
New Maryland (Well P-2) Groundwater 0 0 35
New Maryland (Well S-1) Groundwater 0 0 25
New Maryland (Well S-4) Groundwater 0 0 84
Oromocto (Oromocto River) Surface Water No Data No Data No Data
Penobsquis (Well #07-1 Springdale) Groundwater 0 0 36
Perth-Andover (Well 1) Groundwater 3 17 100
Perth-Andover (Well 2) Groundwater 0 0 97
Petit-Rocher (Infiltration Gallery) Infiltration Gallery 80 88 88
Plaster Rock (Well #1) Groundwater 0 1 95
Plaster Rock (Well #2) Groundwater 0 8 71
Port Elgin (Mitten Well) Groundwater 0 1 84
Port Elgin (Riverside Well) - retired Groundwater 0 0 80
Quispamsis (Downeast Well #1) Groundwater 0 68 310
Quispamsis (Downeast Well #2) Groundwater 0 122 311
Quispamsis (Ridgewood Well #1) Groundwater 0 0 307
Quispamsis (Ridgewood Well #2) Groundwater 0 9 306
Richibucto (Well #1) Groundwater 0 1 87
Richibucto (Well #3) Groundwater 0 51 123

117
Water Source Source Type
# of Samples
with E. coli Detected
# of Samples with Total Coliforms Detected
Total Number of Samples Tested
Richibucto (Well #4) Groundwater 0 2 54
Riverside-Albert (Reservoir 1) Surface Water 39 84 84
Rivière-Verte (Infiltration Gallery) Infiltration Gallery 62 94 94
Rothesay (Well #1) Groundwater 0 3 79
Rothesay (Well #2) Groundwater 0 8 80
Rothesay (Well #3) Groundwater 1 3 82
Rothesay (Well #4) Groundwater 0 9 80
Rothesay (Well #5) Groundwater 5 25 85
Rothesay (Well #6) Groundwater 0 2 81
Rothesay (Well #7) Groundwater 15 60 84
Rothesay (Well #8) Groundwater 1 15 80
Rothesay (Well #9) Groundwater 0 1 10
Sackville (Well #1) Groundwater 0 1 82
Sackville (Well #2) Groundwater 0 0 83
Sackville (Booster Pump well) Groundwater 0 0 87
Saint Andrews (Chamcook Lake) Surface Water 23 78 88
Saint John (Latimer Lake - East) Surface Water 184 386 386
Saint John (Spruce Lake - West) Surface Water 242 368 369
Saint John (Ocean Dr. Well - Harbourview) Groundwater 0 18 287
Saint John (Seaward Cres. Well - Harbourview) Groundwater 0 5 360
Saint-André (Puits 1) Groundwater 2 42 91
Saint-André (Puits 2) Groundwater 2 53 93
Saint-Antoine (Puits PW-1) Groundwater 0 0 84
Saint-Antoine (Puits PW-2) Groundwater 0 0 83
Saint-Antoine (Puits PW-3) Groundwater 0 0 84
Sainte-Anne-de-Madawaska (Puits 1) Groundwater 0 0 22
Sainte-Anne-de-Madawaska (Puits 2) Groundwater 0 0 21
Saint-François-de-Madawaska (Puits 1) Groundwater 0 3 32
Saint-François-de-Madawaska (Puits 2) Groundwater 0 0 34
Saint-François-de-Madawaska (Puits 3) Groundwater 0 8 98
Saint-François-de-Madawaska (Puits 4) Groundwater 0 2 97
Saint-Hilaire (Puits 1) Groundwater 0 1 34
Saint-Hilaire (Puits 2) Groundwater 0 7 83
Saint-Hilaire (Galerie d'Infiltration) - retired Infiltration Gallery 9 9 11
Saint-Léonard (Puits 1) Groundwater 0 2 19
Saint-Léonard (Puits 2) Groundwater 0 0 13
Saint-Louis-de-Kent (Puits #1) Groundwater 0 0 93
Saint-Louis-de-Kent (Puits #2) Groundwater 0 3 90
Saint-Quentin (Galerie d’infiltration) Infiltration Gallery 60 84 84
Shediac (Well #1) Groundwater 0 0 88
Shediac (Well #2) Groundwater 0 6 82
Shediac (Well #5) Groundwater 0 1 82
Shediac (Well #6) Groundwater 0 0 86
Shediac (Well #8) Groundwater 0 0 84
Shediac (Well #9) Groundwater 0 0 83
Shediac (Well #10) Groundwater 0 5 88
Shediac (Well #11) Groundwater 0 1 83
Shediac (Well #3) - retired Groundwater 0 0 48
Shediac (Well #7) - retired Groundwater 0 0 6
Shippagan (Puits 2B) Groundwater 1 16 85
Shippagan (Puits 3) Groundwater 0 11 84
Shippagan (Puits 5) Groundwater 0 1 84
Shippagan (Puits 6) Groundwater 2 53 93
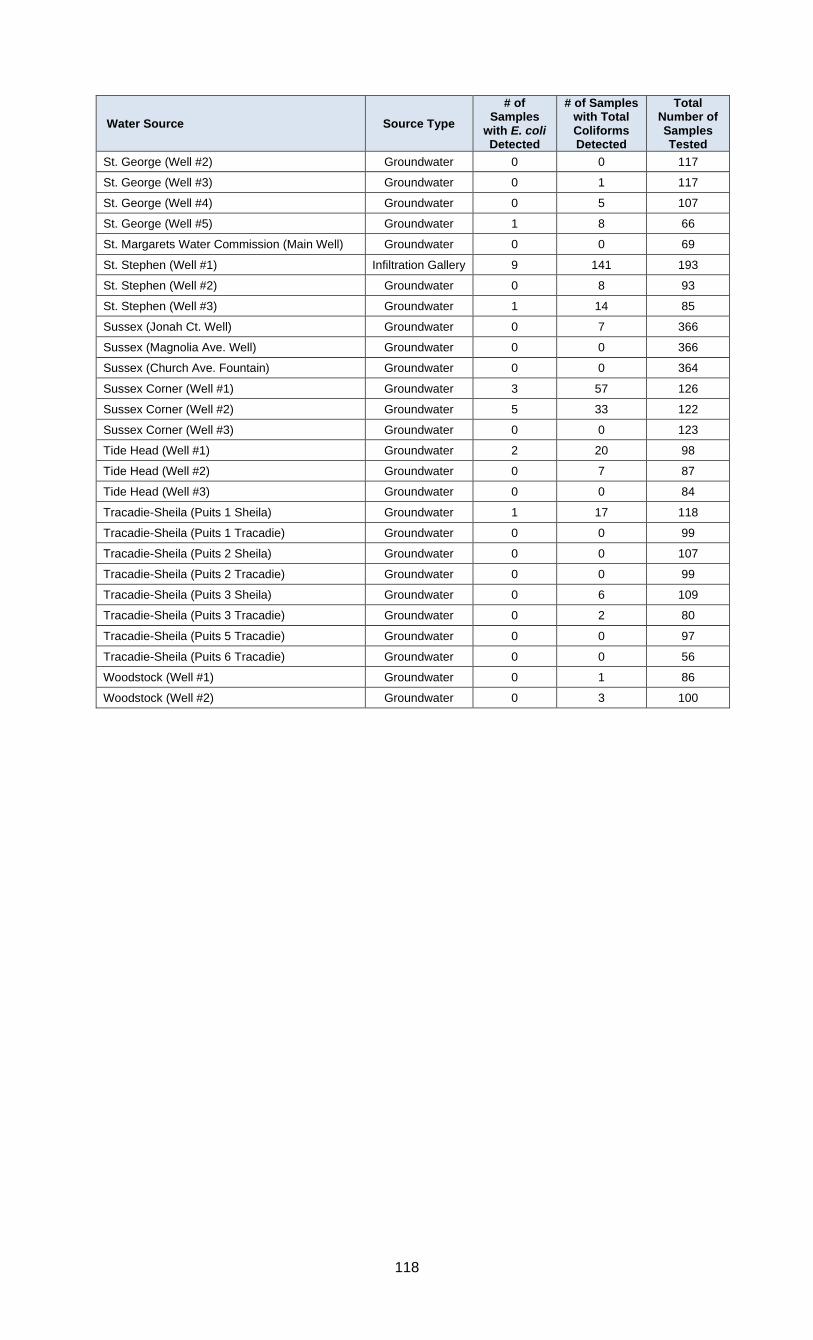
118
Water Source Source Type
# of Samples
with E. coli Detected
# of Samples with Total Coliforms Detected
Total Number of Samples Tested
St. George (Well #2) Groundwater 0 0 117
St. George (Well #3) Groundwater 0 1 117
St. George (Well #4) Groundwater 0 5 107
St. George (Well #5) Groundwater 1 8 66
St. Margarets Water Commission (Main Well) Groundwater 0 0 69
St. Stephen (Well #1) Infiltration Gallery 9 141 193
St. Stephen (Well #2) Groundwater 0 8 93
St. Stephen (Well #3) Groundwater 1 14 85
Sussex (Jonah Ct. Well) Groundwater 0 7 366
Sussex (Magnolia Ave. Well) Groundwater 0 0 366
Sussex (Church Ave. Fountain) Groundwater 0 0 364
Sussex Corner (Well #1) Groundwater 3 57 126
Sussex Corner (Well #2) Groundwater 5 33 122
Sussex Corner (Well #3) Groundwater 0 0 123
Tide Head (Well #1) Groundwater 2 20 98
Tide Head (Well #2) Groundwater 0 7 87
Tide Head (Well #3) Groundwater 0 0 84
Tracadie-Sheila (Puits 1 Sheila) Groundwater 1 17 118
Tracadie-Sheila (Puits 1 Tracadie) Groundwater 0 0 99
Tracadie-Sheila (Puits 2 Sheila) Groundwater 0 0 107
Tracadie-Sheila (Puits 2 Tracadie) Groundwater 0 0 99
Tracadie-Sheila (Puits 3 Sheila) Groundwater 0 6 109
Tracadie-Sheila (Puits 3 Tracadie) Groundwater 0 2 80
Tracadie-Sheila (Puits 5 Tracadie) Groundwater 0 0 97
Tracadie-Sheila (Puits 6 Tracadie) Groundwater 0 0 56
Woodstock (Well #1) Groundwater 0 1 86
Woodstock (Well #2) Groundwater 0 3 100

119
Summary of Inorganic Chemistry Findings for Raw Water Sources
The following table lists the findings (from all available data since 1994 – see Appendix A for the applicable date ranges for each community) regarding the inorganic chemistry
characteristics that exceeded guideline values at least once in each individual raw water supply before it was treated to remove contaminants or disinfected. This is not a
measure of the quality of water delivered to users, but illustrates the need for proper treatment, and the wide range of conditions found in different raw water supplies.
Key Numbers of Raw Water Sources (out of 255) with at Least One Result that Exceeded the Guideline
Blank / not shaded = The guideline was never exceeded As B Ba Cd Cr Cu F Fe Hg Mn NO3- Pb Sb Se TURB U Cl Na SO4
The guideline was exceeded in at least 10% of samples (or in at least 2 samples when 10 or fewer total samples)
XX 8 0 2 0 0 0 3 49 0 130 1 4 0 1 88 5 4 1 0
The guideline was exceeded in less than 10% of samples (or in only 1 sample when 10 or fewer total samples)
X 5 0 0 0 1 1 2 35 1 13 0 17 2 1 60 1 3 1 0
Total 13 0 2 0 1 1 5 84 1 143 1 21 2 2 148 6 7 2 0
Guideline values (note, the New Brunswick Drinking Water Quality Guidelines do not specifically apply to raw water quality, but they can help to identify what types of water treatment might be needed to meet the Guidelines in drinking water delivered to
users)
MAC 10 5 1 5 50 1.5 1 10 10 6 50 See
Glossary 20
AO 1000 0.3 0.05 250 200 500
Other 1
Units µg/L mg/L mg/L µg/L µg/L µg/L mg/L mg/L µg/L mg/L mg/L µg/L µg/L µg/L NTU µg/L mg/L mg/L mg/L
Raw Water Source Source Type As B Ba Cd Cr Cu F Fe Hg Mn NO3- Pb Sb Se TURB U Cl Na SO4
Alma (Well #1) Groundwater XX
Alma (Well #2) Groundwater X
Aroostook (Well #1) Groundwater XX X XX XX
Aroostook (Well #2) Groundwater
Atholville (Well #1) Groundwater
Atholville (Well #2A) Groundwater
Atholville (Well #3) Groundwater X
Atholville (Well #4) Groundwater X X X X XX
Baker Brook (Étang de recharge) Surface Water XX
Baker Brook (Nouveau Puits Théophile - retired) Groundwater X XX XX
Baker Brook (Puits Piste Cyclable - retired) Groundwater XX XX XX

120
Raw Water Source Source Type As B Ba Cd Cr Cu F Fe Hg Mn NO3- Pb Sb Se TURB U Cl Na SO4
Baker Brook (Puits rivière St-Jean) Groundwater XX X
Baker Brook (Puits, PW-1-80) Groundwater
Baker Brook (Puits, PW-2-80) Groundwater
Baker Brook (Puits P-12-1) Groundwater
Balmoral (Puits #1) Groundwater X
Balmoral (Puits #2) Groundwater
Bas-Caraquet (Puits rue Frédérick) Groundwater XX
Bath (Well #1) Groundwater X X X
Bath (Well #3) Groundwater
Bathurst (Grovehill Well - retired) Groundwater XX XX X XX
Bathurst (Middle River) Surface Water XX XX
Belledune (Jacquet River raw water) Surface Water XX XX XX
Blacks Harbour (Wallace Cove Well) Groundwater X X
Blacks Harbour (Well #3) Groundwater XX XX
Blacks Harbour (Well #4) Groundwater X XX XX XX
Bouctouche (Puits #1) Groundwater XX XX XX
Bouctouche (Puits #2) Groundwater XX
Bouctouche (Puits #3) Groundwater XX XX XX
Bouctouche (Puits #4) Groundwater
Bouctouche (Puits #5) Groundwater XX
Campbellton (Raw Water) Surface Water X
Caraquet (Puits de la rue du Portage) Groundwater
Caraquet (Puits de la rue Lavigne) Groundwater
Caraquet (Puits du chemin St-Simon - retired) Groundwater XX
Caraquet (Source du chemin St-Simon) Spring
Charlo (Puits - Well 1) Groundwater
Charlo (Puits - Well 2) Groundwater
Clair (Lac Thompson - retired) Surface Water X XX XX
Clair (Puits Avenue Industrielle - retired) Groundwater XX XX XX XX
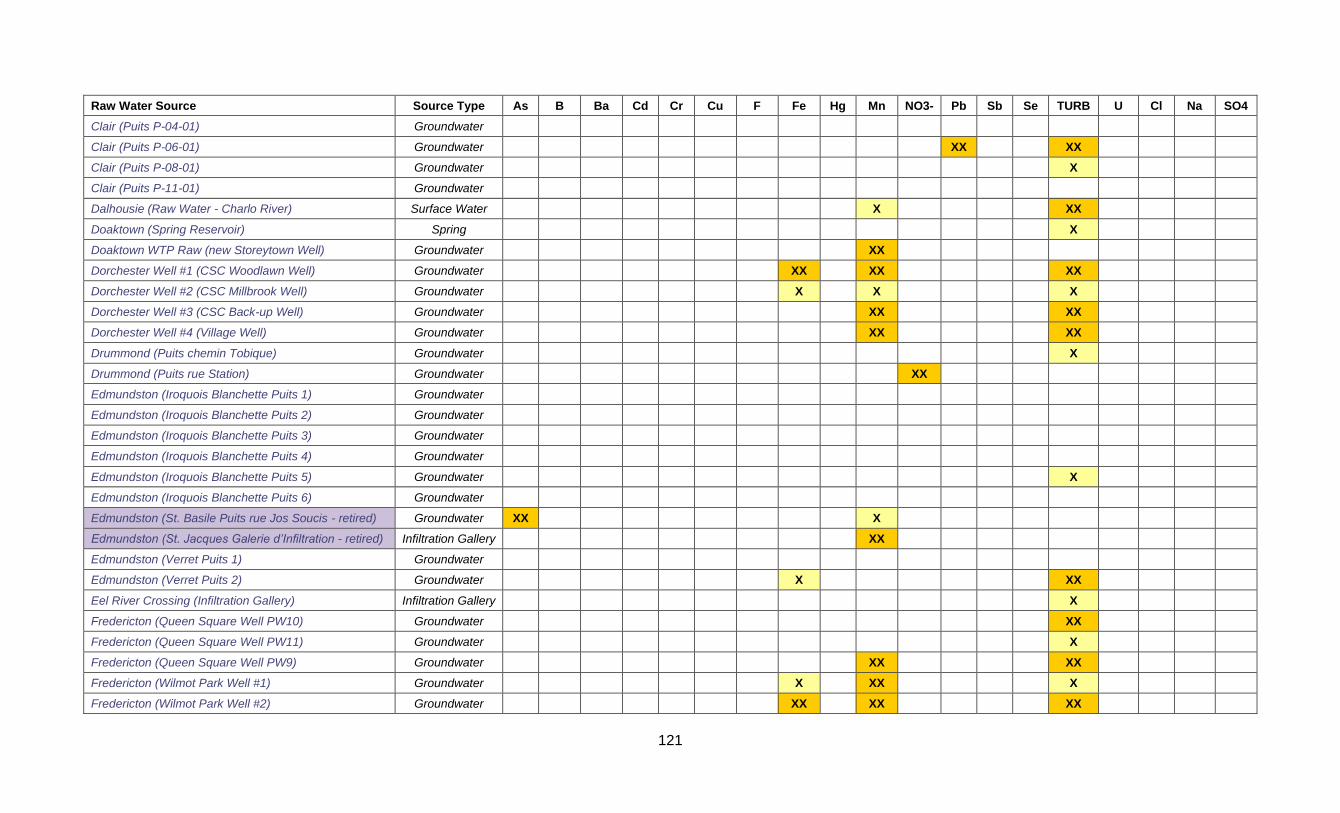
121
Raw Water Source Source Type As B Ba Cd Cr Cu F Fe Hg Mn NO3- Pb Sb Se TURB U Cl Na SO4
Clair (Puits P-04-01) Groundwater
Clair (Puits P-06-01) Groundwater XX XX
Clair (Puits P-08-01) Groundwater X
Clair (Puits P-11-01) Groundwater
Dalhousie (Raw Water - Charlo River) Surface Water X XX
Doaktown (Spring Reservoir) Spring X
Doaktown WTP Raw (new Storeytown Well) Groundwater XX
Dorchester Well #1 (CSC Woodlawn Well) Groundwater XX XX XX
Dorchester Well #2 (CSC Millbrook Well) Groundwater X X X
Dorchester Well #3 (CSC Back-up Well) Groundwater XX XX
Dorchester Well #4 (Village Well) Groundwater XX XX
Drummond (Puits chemin Tobique) Groundwater X
Drummond (Puits rue Station) Groundwater XX
Edmundston (Iroquois Blanchette Puits 1) Groundwater
Edmundston (Iroquois Blanchette Puits 2) Groundwater
Edmundston (Iroquois Blanchette Puits 3) Groundwater
Edmundston (Iroquois Blanchette Puits 4) Groundwater
Edmundston (Iroquois Blanchette Puits 5) Groundwater X
Edmundston (Iroquois Blanchette Puits 6) Groundwater
Edmundston (St. Basile Puits rue Jos Soucis - retired) Groundwater XX X
Edmundston (St. Jacques Galerie d’Infiltration - retired) Infiltration Gallery XX
Edmundston (Verret Puits 1) Groundwater
Edmundston (Verret Puits 2) Groundwater X XX
Eel River Crossing (Infiltration Gallery) Infiltration Gallery X
Fredericton (Queen Square Well PW10) Groundwater XX
Fredericton (Queen Square Well PW11) Groundwater X
Fredericton (Queen Square Well PW9) Groundwater XX XX
Fredericton (Wilmot Park Well #1) Groundwater X XX X
Fredericton (Wilmot Park Well #2) Groundwater XX XX XX
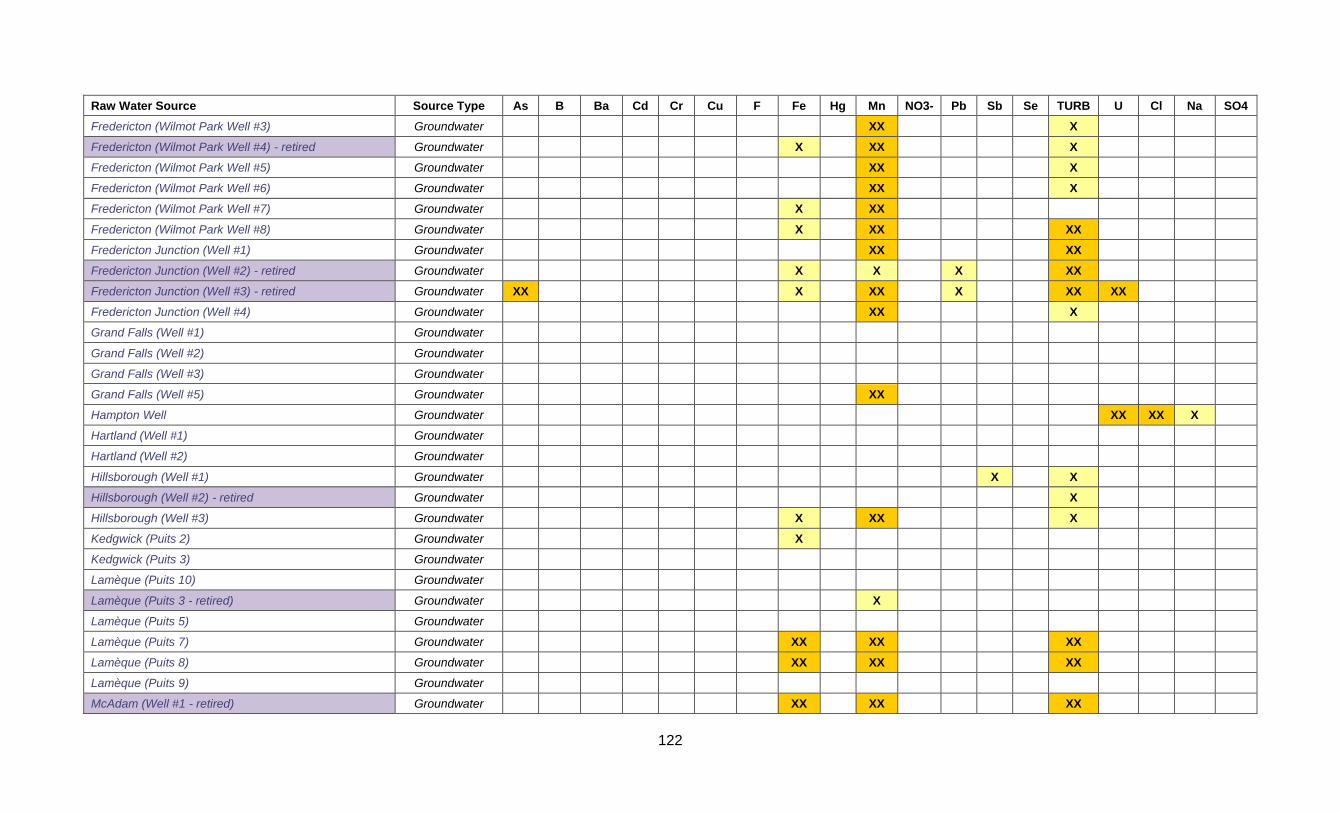
122
Raw Water Source Source Type As B Ba Cd Cr Cu F Fe Hg Mn NO3- Pb Sb Se TURB U Cl Na SO4
Fredericton (Wilmot Park Well #3) Groundwater XX X
Fredericton (Wilmot Park Well #4) - retired Groundwater X XX X
Fredericton (Wilmot Park Well #5) Groundwater XX X
Fredericton (Wilmot Park Well #6) Groundwater XX X
Fredericton (Wilmot Park Well #7) Groundwater X XX
Fredericton (Wilmot Park Well #8) Groundwater X XX XX
Fredericton Junction (Well #1) Groundwater XX XX
Fredericton Junction (Well #2) - retired Groundwater X X X XX
Fredericton Junction (Well #3) - retired Groundwater XX X XX X XX XX
Fredericton Junction (Well #4) Groundwater XX X
Grand Falls (Well #1) Groundwater
Grand Falls (Well #2) Groundwater
Grand Falls (Well #3) Groundwater
Grand Falls (Well #5) Groundwater XX
Hampton Well Groundwater XX XX X
Hartland (Well #1) Groundwater
Hartland (Well #2) Groundwater
Hillsborough (Well #1) Groundwater X X
Hillsborough (Well #2) - retired Groundwater X
Hillsborough (Well #3) Groundwater X XX X
Kedgwick (Puits 2) Groundwater X
Kedgwick (Puits 3) Groundwater
Lamèque (Puits 10) Groundwater
Lamèque (Puits 3 - retired) Groundwater X
Lamèque (Puits 5) Groundwater
Lamèque (Puits 7) Groundwater XX XX XX
Lamèque (Puits 8) Groundwater XX XX XX
Lamèque (Puits 9) Groundwater
McAdam (Well #1 - retired) Groundwater XX XX XX

123
Raw Water Source Source Type As B Ba Cd Cr Cu F Fe Hg Mn NO3- Pb Sb Se TURB U Cl Na SO4
McAdam (Well #10) Groundwater
McAdam (Well #11) Groundwater X XX X
McAdam (Well #12) Groundwater X
McAdam (Well #13) Groundwater X
McAdam (Well #2 - retired) Groundwater
Memramcook (Puits #1) Groundwater XX XX XX
Memramcook (Puits #2 - retired) Groundwater X XX XX X XX
Memramcook (Puits #3 - retired) Groundwater XX XX XX
Memramcook (Puits 08-01) Groundwater XX
Memramcook (Puits A - retired) Groundwater XX
Memramcook (Puits C - retired) Groundwater XX XX XX
Memramcook (Source Bourgeois) Spring X
Memramcook (Source Cormier - retired) Spring X X
Memramcook (Source de l'Institut) Spring XX XX XX
Miramichi (Chatham - Gordon Well) Groundwater XX X
Miramichi (Chatham - Henderson Well 1) Groundwater X XX X
Miramichi (Chatham - Henderson Well 2) Groundwater XX X
Miramichi (Chatham - Howard Well) Groundwater XX XX XX
Miramichi (Chatham - Industrial Park Well) Groundwater XX X
Miramichi (Chatham - Martin Well) Groundwater XX
Miramichi (Chatham - Napan Road Well) Groundwater X X
Miramichi (Chatham - Nicol Well) Groundwater XX
Miramichi (Chatham - Richard Well - retired) Groundwater XX
Miramichi (Chatham - Sky Park Well - retired) Groundwater XX X
Miramichi (Chatham - Springvale Well) Groundwater XX X
Miramichi (Chatham - Walsh Well - retired) Groundwater XX XX
Miramichi (Douglastown - Rennie Rd Well) Groundwater XX
Miramichi (Douglastown - Williston Ext Well) Groundwater XX
Miramichi (Douglastown - Williston Well) Groundwater XX

124
Raw Water Source Source Type As B Ba Cd Cr Cu F Fe Hg Mn NO3- Pb Sb Se TURB U Cl Na SO4
Miramichi (Newcastle - Allison Well) Groundwater X XX X
Miramichi (Newcastle - McKay Well) Groundwater XX XX XX
Miramichi (Newcastle - Millar Well) Groundwater XX XX
Miramichi (Newcastle - Mitchell P-2 Well) Groundwater XX
Miramichi (Newcastle - Reservoir Well - retired) Groundwater XX
Miramichi (Newcastle - Trevors Well) Groundwater XX XX XX
Miramichi (Newcastle - Turcotte Well) Groundwater XX XX XX
Moncton (Mapleton Place Well) Groundwater XX
Moncton (McLaughlin Reservoir - backup supply) Surface Water X XX XX X XX
Moncton (Turtle Creek Reservoir) Surface Water XX XX XX
Nackawic (Well #2 - retired) Groundwater XX XX X XX XX
Nackawic (Well #3) Groundwater X
Nackawic (Well #4) Groundwater X
New Maryland (Well A-1 - retired) Groundwater
New Maryland (Well A-10) Groundwater X XX X
New Maryland (Well A-11) Groundwater XX X
New Maryland (Well A-2 - retired) Groundwater
New Maryland (Well A-20) Groundwater X XX X
New Maryland (Well A-6 - retired) Groundwater X XX XX X XX
New Maryland (Well F-1 - retired) Groundwater X XX XX X
New Maryland (Well P-2) Groundwater X XX XX
New Maryland (Well S-1) Groundwater X XX
New Maryland (Well S-2 - retired) Groundwater X XX
New Maryland (Well S-3 - retired) Groundwater XX XX
New Maryland (Well S-4) Groundwater XX X
Oromocto (Oromocto River) Surface Water NO DATA
Penobsquis (Well #07-1 Springdale) Groundwater XX
Perth-Andover (Well 1) Groundwater
Perth-Andover (Well 2) Groundwater

125
Raw Water Source Source Type As B Ba Cd Cr Cu F Fe Hg Mn NO3- Pb Sb Se TURB U Cl Na SO4
Petit-Rocher (Infiltration Gallery) Infiltration Gallery XX
Plaster Rock (Well #1) Groundwater X
Plaster Rock (Well #2) Groundwater X
Port Elgin (Mitten Well) Groundwater
Port Elgin (Riverside Well - retired) Groundwater XX XX XX XX
Port Elgin (Well #2 - retired) Groundwater
Port Elgin (Well #3 - retired) Groundwater X
Quispamsis (Downeast Well #1) Groundwater X
Quispamsis (Downeast Well #2) Groundwater X X
Quispamsis (Ridgewood Well #1) Groundwater XX
Quispamsis (Ridgewood Well #2) Groundwater XX XX XX
Richibucto (Well #1) Groundwater XX XX X X
Richibucto (Well #2 - retired) Groundwater XX XX XX
Richibucto (Well #3) Groundwater XX XX XX
Richibucto (Well #4) Groundwater XX
Riverside-Albert (Reservoir 1) Surface Water
Rivière-Verte (École Mgr-Matthieu-Mazerolle - retired) Groundwater X XX X XX
Rivière-Verte (Infiltration Gallery) Infiltration Gallery X X XX
Rothesay (Well #1) Groundwater X XX XX
Rothesay (Well #2) Groundwater XX XX XX XX
Rothesay (Well #3) Groundwater X XX XX
Rothesay (Well #4) Groundwater XX XX XX
Rothesay (Well #5) Groundwater XX XX XX
Rothesay (Well #6) Groundwater XX
Rothesay (Well #7) Groundwater XX XX XX
Rothesay (Well #8) Groundwater XX X
Rothesay (Well #9) Groundwater XX
Sackville (Booster Pump Well) Groundwater XX
Sackville (Well #1) Groundwater XX XX XX

126
Raw Water Source Source Type As B Ba Cd Cr Cu F Fe Hg Mn NO3- Pb Sb Se TURB U Cl Na SO4
Sackville (Well #2) Groundwater XX XX XX
Sackville (Well #3) Groundwater XX XX XX
Saint John (Latimer Lake - East) Surface Water XX XX
Saint John (Ocean Dr. Well - Harbourview) Groundwater X XX
Saint John (Seaward Cres. Well - Harbourview) Groundwater X
Saint John (Spruce Lake - West) Surface Water XX
Saint-Antoine (Puits PW-1) Groundwater XX XX
Saint-Antoine (Puits PW-2) Groundwater XX
Saint-Antoine (Puits PW-3) Groundwater XX X
Sainte-Anne-de-Madawaska (Puits 1) Groundwater XX XX XX X XX
Sainte-Anne-de-Madawaska (Puits 2) Groundwater XX XX XX XX
Saint-François-de-Madawaska (Puits 1) Groundwater XX X
Saint-François-de-Madawaska (Puits 2) Groundwater XX
Saint-François-de-Madawaska (Puits 3) Groundwater X
Saint-François-de-Madawaska (Puits 4) Groundwater
Saint-Léonard (Puits 1) Groundwater XX XX XX
Saint-Léonard (Puits 2) Groundwater XX
Saint-Léonard (Puits 3 - puits de réserve) Groundwater X X XX XX
Saint-Louis-de-Kent (Puits #1) Groundwater X
Saint-Louis-de-Kent (Puits #2) Groundwater XX X
Saint-Quentin (Galerie d’infiltration) Infiltration Gallery
Shediac (Well #1) Groundwater X
Shediac (Well #10) Groundwater
Shediac (Well #11) Groundwater XX XX XX
Shediac (Well #2) Groundwater XX
Shediac (Well #3 - retired) Groundwater X XX XX
Shediac (Well #4 - retired) Groundwater XX XX XX XX
Shediac (Well #5) Groundwater XX
Shediac (Well #6) Groundwater XX X

127
Raw Water Source Source Type As B Ba Cd Cr Cu F Fe Hg Mn NO3- Pb Sb Se TURB U Cl Na SO4
Shediac (Well #7 - retired) Groundwater XX XX XX
Shediac (Well #8) Groundwater X XX XX
Shediac (Well #9) Groundwater XX XX XX
Shippagan (Puits 2B) Groundwater X
Shippagan (Puits 3) Groundwater X
Shippagan (Puits 5) Groundwater
Shippagan (Puits 6) Groundwater X
St. André (Puits 1) Groundwater
St. André (Puits 2) Groundwater X XX
St. Andrews (Chamcook Lake raw water) Surface Water
St. George (Well #1) - retired Groundwater XX XX
St. George (Well #2) Groundwater XX X XX XX XX
St. George (Well #3) Groundwater X X X X
St. George (Well #4) Groundwater XX X
St. George (Well #5) Groundwater
St. Hilaire (Galerie d'Infiltration - retired) Infiltration Gallery X X XX
St. Hilaire (Puits 1) Groundwater XX XX XX
St. Hilaire (Puits 2) Groundwater XX XX XX
St. Margaret's Water Commission (Main Well) Groundwater XX XX XX
St. Stephen (Well #1) Infiltration Gallery XX XX X
St. Stephen (Well #2) Groundwater X X
St. Stephen (Well #3) Groundwater X
Sussex (Church Ave. Fountain) Groundwater XX
Sussex (Jonah Ct. Well) Groundwater
Sussex (Magnolia Ave. Well) Groundwater
Sussex Corner (Well #1) Groundwater
Sussex Corner (Well #2) Groundwater XX
Sussex Corner (Well #3) Groundwater X XX
Tide Head (Well #1) Groundwater

128
Raw Water Source Source Type As B Ba Cd Cr Cu F Fe Hg Mn NO3- Pb Sb Se TURB U Cl Na SO4
Tide Head (Well #2) Groundwater
Tide Head (Well #3) Groundwater
Tracadie-Sheila (Puits 1 Sheila) Groundwater X
Tracadie-Sheila (Puits 1 Tracadie) Groundwater XX
Tracadie-Sheila (Puits 2 Sheila) Groundwater X
Tracadie-Sheila (Puits 2 Tracadie) Groundwater XX
Tracadie-Sheila (Puits 3 Sheila) Groundwater XX X
Tracadie-Sheila (Puits 3 Tracadie) Groundwater XX XX XX
Tracadie-Sheila (Puits 5 Tracadie) Groundwater XX
Tracadie-Sheila (Puits 6 Tracadie) Groundwater X XX X
Woodstock (Well #1) Groundwater XX
Woodstock (Well #2) Groundwater XX

129
Summary of Organic Chemistry Findings for Raw Water Sources
The following table lists the findings (from all available data since 1994 – see Appendix A for the applicable date ranges for each community) regarding the occurrence of organic
chemistry characteristics that exceeded guideline values at least once in each individual raw water supply before it was treated to remove contaminants or disinfected. This is not
a measure of the quality of water delivered to users.
Key Numbers of Raw Water Sources (out of 255) with at Least One Result that Exceeded the Guideline
Blank / not shaded = The guideline was never exceeded 1,2-DCB 1,2-DCE 1,4-DCB 5-Cl-PH B(a)P BENZ CCl4 DCM EBENZ PCE TCE THM TOL XYL VINYL
The guideline was exceeded in at least 10% of samples (or in at least 2 samples when 10 or fewer total samples)
XX 0 0 0 0 0 0 0 0 0 0 0 0 0 0 0
The guideline was exceeded in less than 10% of samples (or in only 1 sample when 10 or fewer total samples)
X 0 0 0 0 2 0 0 0 0 0 0 0 1 0 0
Total 0 0 0 0 2 0 0 0 0 0 0 0 1 0 0
Guideline values (note, the New Brunswick Drinking Water Quality Guidelines do not specifically apply to raw water quality, but they
can help to identify what types of water treatment might be needed to meet the Guidelines in drinking water delivered to users)
MAC 200 5 5 60 0.01 5 5 50 30 5 100 2
AO 2.4 24 300
Other
Units µg/L µg/L µg/L µg/L µg/L µg/L µg/L µg/L µg/L µg/L µg/L µg/L µg/L µg/L µg/L
Raw Water Source Source Type 1,2-DCB 1,2-DCE 1,4-DCB 5-Cl-PH B(a)P BENZ CCl4 DCM EBENZ PCE TCE THM TOL XYL VINYL
Alma (Well #1) Groundwater
Alma (Well #2) Groundwater
Aroostook (Well #1) Groundwater
Aroostook (Well #2) Groundwater
Atholville (Well #1) Groundwater
Atholville (Well #2A) Groundwater
Atholville (Well #3) Groundwater
Atholville (Well #4) Groundwater
Baker Brook (Étang de recharge) Surface Water
Baker Brook (Nouveau Puits Théophile - retired) Groundwater
Baker Brook (Puits Piste Cyclable - retired) Groundwater
Baker Brook (Puits rivière St-Jean) Groundwater

130
Raw Water Source Source Type 1,2-DCB 1,2-DCE 1,4-DCB 5-Cl-PH B(a)P BENZ CCl4 DCM EBENZ PCE TCE THM TOL XYL VINYL
Baker Brook (Puits, PW-1-80) Groundwater
Baker Brook (Puits, PW-2-80) Groundwater
Baker Brook (Puits P-12-1) Groundwater
Balmoral (Puits #1) Groundwater
Balmoral (Puits #2) Groundwater
Bas-Caraquet (Puits rue Frédérick) Groundwater
Bath (Well #1) Groundwater
Bath (Well #3) Groundwater
Bathurst (Grovehill Well - retired) Groundwater
Bathurst (Middle River) Surface Water
Belledune (Jacquet River raw water) Surface Water
Blacks Harbour (Wallace Cove Well) Groundwater
Blacks Harbour (Well #3) Groundwater
Blacks Harbour (Well #4) Groundwater
Bouctouche (Puits #1) Groundwater
Bouctouche (Puits #2) Groundwater
Bouctouche (Puits #3) Groundwater
Bouctouche (Puits #4) Groundwater
Bouctouche (Puits #5) Groundwater
Campbellton (Raw Water) Surface Water
Caraquet (Puits de la rue du Portage) Groundwater
Caraquet (Puits de la rue Lavigne) Groundwater
Caraquet (Puits du chemin St-Simon - retired) Groundwater
Caraquet (Source du chemin St-Simon) Spring
Charlo (Puits - Well 1) Groundwater
Charlo (Puits - Well 2) Groundwater
Clair (Lac Thompson - retired) Surface Water
Clair (Puits Avenue Industrielle - retired) Groundwater
Clair (Puits P-04-01) Groundwater

131
Raw Water Source Source Type 1,2-DCB 1,2-DCE 1,4-DCB 5-Cl-PH B(a)P BENZ CCl4 DCM EBENZ PCE TCE THM TOL XYL VINYL
Clair (Puits P-06-01) Groundwater
Clair (Puits P-08-01) Groundwater
Clair (Puits P-11-01) Groundwater
Dalhousie (Raw Water - Charlo River) Surface Water
Doaktown (Spring Reservoir) Spring
Doaktown WTP Raw (new Storeytown Well) Groundwater
Dorchester Well #1 (CSC Woodlawn Well) Groundwater
Dorchester Well #2 (CSC Millbrook Well) Groundwater
Dorchester Well #3 (CSC Back-up Well) Groundwater
Dorchester Well #4 (Village Well) Groundwater
Drummond (Puits chemin Tobique) Groundwater
Drummond (Puits rue Station) Groundwater
Edmundston (Iroquois Blanchette Puits 1) Groundwater
Edmundston (Iroquois Blanchette Puits 2) Groundwater
Edmundston (Iroquois Blanchette Puits 3) Groundwater
Edmundston (Iroquois Blanchette Puits 4) Groundwater
Edmundston (Iroquois Blanchette Puits 5) Groundwater
Edmundston (Iroquois Blanchette Puits 6) Groundwater
Edmundston (St. Basile Puits rue Jos Soucis - retired) Groundwater
Edmundston (St. Jacques Galerie d’Infiltration - retired) Infiltration Gallery
Edmundston (Verret Puits 1) Groundwater
Edmundston (Verret Puits 2) Groundwater
Eel River Crossing (Infiltration Gallery) Infiltration Gallery
Fredericton (Queen Square Well PW10) Groundwater
Fredericton (Queen Square Well PW11) Groundwater
Fredericton (Queen Square Well PW9) Groundwater
Fredericton (Wilmot Park Well #1) Groundwater
Fredericton (Wilmot Park Well #2) Groundwater
Fredericton (Wilmot Park Well #3) Groundwater
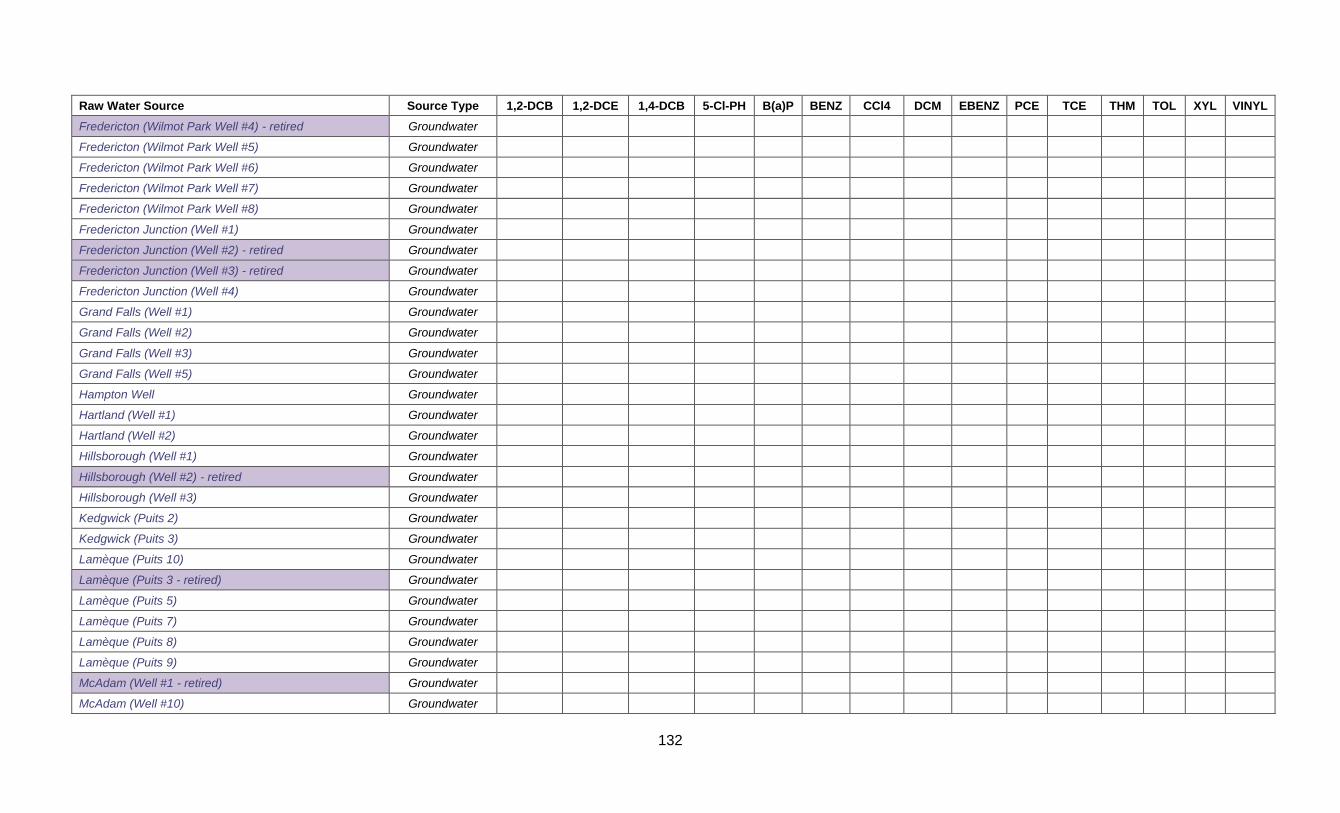
132
Raw Water Source Source Type 1,2-DCB 1,2-DCE 1,4-DCB 5-Cl-PH B(a)P BENZ CCl4 DCM EBENZ PCE TCE THM TOL XYL VINYL
Fredericton (Wilmot Park Well #4) - retired Groundwater
Fredericton (Wilmot Park Well #5) Groundwater
Fredericton (Wilmot Park Well #6) Groundwater
Fredericton (Wilmot Park Well #7) Groundwater
Fredericton (Wilmot Park Well #8) Groundwater
Fredericton Junction (Well #1) Groundwater
Fredericton Junction (Well #2) - retired Groundwater
Fredericton Junction (Well #3) - retired Groundwater
Fredericton Junction (Well #4) Groundwater
Grand Falls (Well #1) Groundwater
Grand Falls (Well #2) Groundwater
Grand Falls (Well #3) Groundwater
Grand Falls (Well #5) Groundwater
Hampton Well Groundwater
Hartland (Well #1) Groundwater
Hartland (Well #2) Groundwater
Hillsborough (Well #1) Groundwater
Hillsborough (Well #2) - retired Groundwater
Hillsborough (Well #3) Groundwater
Kedgwick (Puits 2) Groundwater
Kedgwick (Puits 3) Groundwater
Lamèque (Puits 10) Groundwater
Lamèque (Puits 3 - retired) Groundwater
Lamèque (Puits 5) Groundwater
Lamèque (Puits 7) Groundwater
Lamèque (Puits 8) Groundwater
Lamèque (Puits 9) Groundwater
McAdam (Well #1 - retired) Groundwater
McAdam (Well #10) Groundwater

133
Raw Water Source Source Type 1,2-DCB 1,2-DCE 1,4-DCB 5-Cl-PH B(a)P BENZ CCl4 DCM EBENZ PCE TCE THM TOL XYL VINYL
McAdam (Well #11) Groundwater
McAdam (Well #12) Groundwater
McAdam (Well #13) Groundwater
McAdam (Well #2 - retired) Groundwater
Memramcook (Puits #1) Groundwater
Memramcook (Puits #2 - retired) Groundwater
Memramcook (Puits #3 - retired) Groundwater
Memramcook (Puits 08-01) Groundwater
Memramcook (Puits A - retired) Groundwater
Memramcook (Puits C - retired) Groundwater
Memramcook (Source Bourgeois) Spring
Memramcook (Source Cormier - retired) Spring
Memramcook (Source de l'Institut) Spring
Miramichi (Chatham - Gordon Well) Groundwater
Miramichi (Chatham - Henderson Well 1) Groundwater
Miramichi (Chatham - Henderson Well 2) Groundwater
Miramichi (Chatham - Howard Well) Groundwater
Miramichi (Chatham - Industrial Park Well) Groundwater
Miramichi (Chatham - Martin Well) Groundwater
Miramichi (Chatham - Napan Road Well) Groundwater
Miramichi (Chatham - Nicol Well) Groundwater
Miramichi (Chatham - Richard Well - retired) Groundwater
Miramichi (Chatham - Sky Park Well - retired) Groundwater
Miramichi (Chatham - Springvale Well) Groundwater
Miramichi (Chatham - Walsh Well - retired) Groundwater
Miramichi (Douglastown - Rennie Rd Well) Groundwater
Miramichi (Douglastown - Williston Ext Well) Groundwater
Miramichi (Douglastown - Williston Well) Groundwater
Miramichi (Newcastle - Allison Well) Groundwater

134
Raw Water Source Source Type 1,2-DCB 1,2-DCE 1,4-DCB 5-Cl-PH B(a)P BENZ CCl4 DCM EBENZ PCE TCE THM TOL XYL VINYL
Miramichi (Newcastle - McKay Well) Groundwater
Miramichi (Newcastle - Millar Well) Groundwater
Miramichi (Newcastle - Mitchell P-2 Well) Groundwater
Miramichi (Newcastle - Reservoir Well - retired) Groundwater
Miramichi (Newcastle - Trevors Well) Groundwater
Miramichi (Newcastle - Turcotte Well) Groundwater
Moncton (Mapleton Place Well) Groundwater
Moncton (McLaughlin Reservoir - backup supply) Surface Water
Moncton (Turtle Creek Reservoir) Surface Water X
Nackawic (Well #2 - retired) Groundwater
Nackawic (Well #3) Groundwater
Nackawic (Well #4) Groundwater
New Maryland (Well A-1 - retired) Groundwater
New Maryland (Well A-10) Groundwater
New Maryland (Well A-11) Groundwater X
New Maryland (Well A-2 - retired) Groundwater
New Maryland (Well A-20) Groundwater
New Maryland (Well A-6 - retired) Groundwater
New Maryland (Well F-1 - retired) Groundwater
New Maryland (Well P-2) Groundwater
New Maryland (Well S-1) Groundwater
New Maryland (Well S-2 - retired) Groundwater
New Maryland (Well S-3 - retired) Groundwater
New Maryland (Well S-4) Groundwater
Oromocto (Oromocto River) Surface Water No Data
Penobsquis (Well #07-1 Springdale) Groundwater
Perth-Andover (Well 1) Groundwater
Perth-Andover (Well 2) Groundwater
Petit-Rocher (Infiltration Gallery) Infiltration Gallery

135
Raw Water Source Source Type 1,2-DCB 1,2-DCE 1,4-DCB 5-Cl-PH B(a)P BENZ CCl4 DCM EBENZ PCE TCE THM TOL XYL VINYL
Plaster Rock (Well #1) Groundwater
Plaster Rock (Well #2) Groundwater
Port Elgin (Mitten Well) Groundwater
Port Elgin (Riverside Well - retired) Groundwater
Port Elgin (Well #2 - retired) Groundwater
Port Elgin (Well #3 - retired) Groundwater
Quispamsis (Downeast Well #1) Groundwater
Quispamsis (Downeast Well #2) Groundwater
Quispamsis (Ridgewood Well #1) Groundwater
Quispamsis (Ridgewood Well #2) Groundwater
Richibucto (Well #1) Groundwater
Richibucto (Well #2 - retired) Groundwater
Richibucto (Well #3) Groundwater
Richibucto (Well #4) Groundwater
Riverside-Albert (Reservoir 1) Surface Water
Rivière-Verte (École Mgr-Matthieu-Mazerolle - retired) Groundwater
Rivière-Verte (Infiltration Gallery) Infiltration Gallery
Rothesay (Well #1) Groundwater
Rothesay (Well #2) Groundwater
Rothesay (Well #3) Groundwater
Rothesay (Well #4) Groundwater
Rothesay (Well #5) Groundwater
Rothesay (Well #6) Groundwater
Rothesay (Well #7) Groundwater
Rothesay (Well #8) Groundwater
Rothesay (Well #9) Groundwater
Sackville (Booster Pump Well) Groundwater
Sackville (Well #1) Groundwater
Sackville (Well #2) Groundwater

136
Raw Water Source Source Type 1,2-DCB 1,2-DCE 1,4-DCB 5-Cl-PH B(a)P BENZ CCl4 DCM EBENZ PCE TCE THM TOL XYL VINYL
Sackville (Well #3) Groundwater
Saint John (Latimer Lake - East) Surface Water
Saint John (Ocean Dr. Well - Harbourview) Groundwater
Saint John (Seaward Cres. Well - Harbourview) Groundwater
Saint John (Spruce Lake - West) Surface Water
Saint-Antoine (Puits PW-1) Groundwater
Saint-Antoine (Puits PW-2) Groundwater
Saint-Antoine (Puits PW-3) Groundwater
Sainte-Anne-de-Madawaska (Puits 1) Groundwater
Sainte-Anne-de-Madawaska (Puits 2) Groundwater
Saint-François-de-Madawaska (Puits 1) Groundwater
Saint-François-de-Madawaska (Puits 2) Groundwater
Saint-François-de-Madawaska (Puits 3) Groundwater
Saint-François-de-Madawaska (Puits 4) Groundwater
Saint-Léonard (Puits 1) Groundwater
Saint-Léonard (Puits 2) Groundwater
Saint-Léonard (Puits 3 - puits de réserve) Groundwater
Saint-Louis-de-Kent (Puits #1) Groundwater
Saint-Louis-de-Kent (Puits #2) Groundwater
Saint-Quentin (Galerie d’infiltration) Infiltration Gallery
Shediac (Well #1) Groundwater
Shediac (Well #10) Groundwater
Shediac (Well #11) Groundwater
Shediac (Well #2) Groundwater
Shediac (Well #3 - retired) Groundwater
Shediac (Well #4 - retired) Groundwater
Shediac (Well #5) Groundwater
Shediac (Well #6) Groundwater
Shediac (Well #7 - retired) Groundwater

137
Raw Water Source Source Type 1,2-DCB 1,2-DCE 1,4-DCB 5-Cl-PH B(a)P BENZ CCl4 DCM EBENZ PCE TCE THM TOL XYL VINYL
Shediac (Well #8) Groundwater
Shediac (Well #9) Groundwater
Shippagan (Puits 2B) Groundwater
Shippagan (Puits 3) Groundwater
Shippagan (Puits 5) Groundwater
Shippagan (Puits 6) Groundwater
St. André (Puits 1) Groundwater
St. André (Puits 2) Groundwater
St. Andrews (Chamcook Lake raw water) Surface Water
St. George (Well #1) - retired Groundwater
St. George (Well #2) Groundwater
St. George (Well #3) Groundwater X
St. George (Well #4) Groundwater
St. George (Well #5) Groundwater
St. Hilaire (Galerie d'Infiltration - retired) Infiltration Gallery
St. Hilaire (Puits 1) Groundwater
St. Hilaire (Puits 2) Groundwater
St. Margaret's Water Commission (Main Well) Groundwater
St. Stephen (Well #1) Infiltration Gallery
St. Stephen (Well #2) Groundwater
St. Stephen (Well #3) Groundwater
Sussex (Church Ave. Fountain) Groundwater
Sussex (Jonah Ct. Well) Groundwater
Sussex (Magnolia Ave. Well) Groundwater
Sussex Corner (Well #1) Groundwater
Sussex Corner (Well #2) Groundwater
Sussex Corner (Well #3) Groundwater
Tide Head (Well #1) Groundwater
Tide Head (Well #2) Groundwater

138
Raw Water Source Source Type 1,2-DCB 1,2-DCE 1,4-DCB 5-Cl-PH B(a)P BENZ CCl4 DCM EBENZ PCE TCE THM TOL XYL VINYL
Tide Head (Well #3) Groundwater
Tracadie-Sheila (Puits 1 Sheila) Groundwater
Tracadie-Sheila (Puits 1 Tracadie) Groundwater
Tracadie-Sheila (Puits 2 Sheila) Groundwater
Tracadie-Sheila (Puits 2 Tracadie) Groundwater
Tracadie-Sheila (Puits 3 Sheila) Groundwater
Tracadie-Sheila (Puits 3 Tracadie) Groundwater
Tracadie-Sheila (Puits 5 Tracadie) Groundwater
Tracadie-Sheila (Puits 6 Tracadie) Groundwater
Woodstock (Well #1) Groundwater
Woodstock (Well #2) Groundwater