Embed Size (px)
Citation preview

2014-15 HARRIS CENTRE RBC WATER RESEARCH AND OUTREACH FUND
A FRAMEWORK FORBETTER UNDERSTANDING DRINKING WATER QUALITY
AND PROTECTION OF MUNICIPALLY
MERLINE L.D. FONKWE, LABRADOR INSTITUTE, MEMORIAL UNIVERSITYAUGUST 2016
INDICATIONS FOR OPTIMIZATION
IN HAPPY VALLEY-GOOSE BAYLABRADOR:
SUPPLIED WATER

FINAL PROJECT REPORT
A framework for better understanding drinking-water quality in Happy
Valley-Goose Bay, Labrador: Implications for optimization and protection
of municipally supplied water
Prepared by
Dr. Merline L.D. Fonkwe, P.Geo., Principal Investigator Research Scientist – Applied Geochemistry and Mineralogy
Manager – Mineral deposits and Environment Geochemistry Research Program
Labrador Institute of Memorial University of Newfoundland, 219 Hamilton River Road,
P.O. Box 490, Station B, Happy Valley-Goose Bay, NL, A0P 1E0, Canada
Submitted to the Harris Centre
Memorial University of Newfoundland
1st Floor, Spencer Hall, 220 Prince Philip Drive
St. John's, NL, A1B 3R5, Canada
August 29, 2016

Disclaimer:
The information in this report is provided for informational purposes only. Although, I provide
interpretation of the quality of water sources (i.e. groundwater and surface water), drinking water,
and possible causes of its seasonal and spatial variations based on the data we have collected
during the research period, this subject involves complex hydrochemical and physical processes,
and a detailed discussion is not attempted here. Therefore, readers should not rely solely upon the
research results herein for either general or specific purposes.
To cite this report:
Fonkwe M.L.D. (2016): A framework for better understanding drinking-water quality in Happy
Valley-Goose Bay, Labrador: Implications for optimization and protection of municipally supplied
water. The Harris Centre, Memorial University of Newfoundland, St. John’s, NL, Canada, xiii + 74
pp.
Address correspondence to:
Dr. Merline Fonkwe
Labrador Institute of Memorial University of Newfoundland
Phone: 709 896-8589; Fax: 709 896-2970
Email: [email protected]

i
TABLE OF CONTENTS
Page
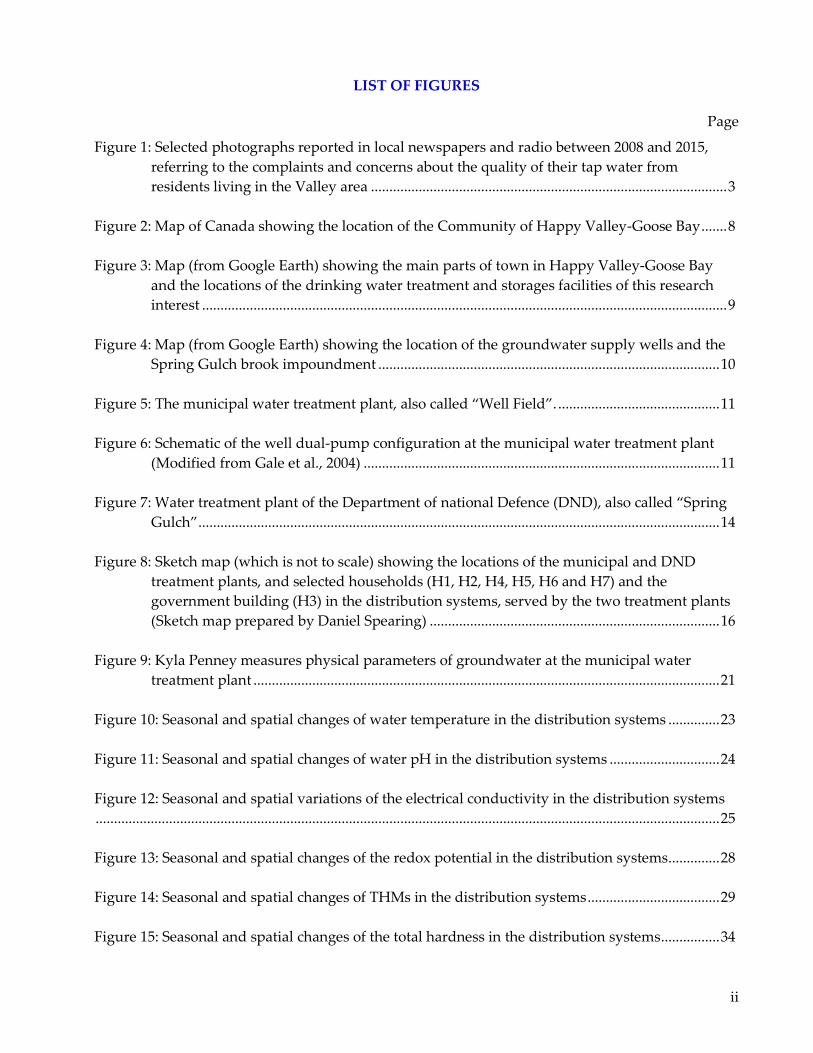
LIST OF FIGURES ........................................................................................................................................ ii
LIST OF TABLES .......................................................................................................................................... iv
MEET THE RESEARCH TEAM................................................................................................................... v
ACKNOWLEDGEMENTS ........................................................................................................................ vii
EXECUTIVE SUMMARY.............................................................................................................................ix
KEYWORDS ................................................................................................................................................ xiii
1. INTRODUCTION .................................................................................................................................. 1
1.1. Project background ....................................................................................................................... 1
1.2 Research rationale and motivation ............................................................................................. 4
1.3 Research objectives ........................................................................................................................ 4
1.4 Knowledge mobilization and deliverables ................................................................................ 5
2. STUDY AREA: THE COMMUNITY OF HAPPY VALLEY-GOOSE BAY................................... 6
2.1. Physiography and climate ............................................................................................................ 6
2.2. Surface and bedrock geology ....................................................................................................... 7
2.3. Drinking water supply in the community of Happy Valley-Goose Bay ............................... 8
2.3.1. Municipal water treatment plant ................................................................................... 9
2.3.2. Water treatment plant of the Department of National Defense ............................... 13
3. METHODOLOGY ................................................................................................................................ 15
3.1. Sampling design and approach ................................................................................................. 15
3.2. Sample collection, preservation and analytical methods ...................................................... 17
3.3. Quality assurance and quality control ..................................................................................... 22
4. RESULTS AND DISCUSSION .......................................................................................................... 22
4.1. Physical parameters .................................................................................................................... 22
4.2. Disinfection by-product trihalomethanes (THMs) ................................................................. 28
4.3. Total alkalinity and total hardness ............................................................................................ 31
4.4. Nutrients and inorganic anions ................................................................................................. 35
4.5. Major and trace elements ........................................................................................................... 40
4.5.1. Naturally-occurring elements ....................................................................................... 41
4.5.2. Natural- and plumbing corrosion-induced metals .................................................... 45
4.5.3. Plumbing corrosion-induced metals ............................................................................ 47
4.6. Stable hydrogen and oxygen isotopic compositions .............................................................. 51
5. CONCLUDING REMARKS AND RECOMMENDATIONS ...................................................... 54
REFERENCES ................................................................................................................................................ 57
APPENDIX: Letters of support from partner organizations ................................................................ 71
ii
LIST OF FIGURES
Page
Figure 1: Selected photographs reported in local newspapers and radio between 2008 and 2015,
referring to the complaints and concerns about the quality of their tap water from
residents living in the Valley area ................................................................................................. 3
Figure 2: Map of Canada showing the location of the Community of Happy Valley-Goose Bay ....... 8
Figure 3: Map (from Google Earth) showing the main parts of town in Happy Valley-Goose Bay
and the locations of the drinking water treatment and storages facilities of this research
interest ............................................................................................................................................... 9
Figure 4: Map (from Google Earth) showing the location of the groundwater supply wells and the
Spring Gulch brook impoundment ............................................................................................. 10
Figure 5: The municipal water treatment plant, also called “Well Field”. ............................................ 11
Figure 6: Schematic of the well dual-pump configuration at the municipal water treatment plant
(Modified from Gale et al., 2004) ................................................................................................. 11
Figure 7: Water treatment plant of the Department of national Defence (DND), also called “Spring
Gulch” .............................................................................................................................................. 14
Figure 8: Sketch map (which is not to scale) showing the locations of the municipal and DND
treatment plants, and selected households (H1, H2, H4, H5, H6 and H7) and the
government building (H3) in the distribution systems, served by the two treatment plants
(Sketch map prepared by Daniel Spearing) ............................................................................... 16
Figure 9: Kyla Penney measures physical parameters of groundwater at the municipal water
treatment plant ............................................................................................................................... 21
Figure 10: Seasonal and spatial changes of water temperature in the distribution systems .............. 23
Figure 11: Seasonal and spatial changes of water pH in the distribution systems .............................. 24
Figure 12: Seasonal and spatial variations of the electrical conductivity in the distribution systems
.......................................................................................................................................................................... 25
Figure 13: Seasonal and spatial changes of the redox potential in the distribution systems .............. 28
Figure 14: Seasonal and spatial changes of THMs in the distribution systems .................................... 29
Figure 15: Seasonal and spatial changes of the total hardness in the distribution systems ................ 34

iii
Figure 16: The electric kettle at one household shows a build-up of off-white, chalky scale from tap
water .............................................................................................................................................. 35
Figure 17: Seasonal and spatial variations of chloride concentrations in the distribution systems .. 37
Figure 18: Concentrations of fluoride concentrations in the distribution systems .............................. 40
Figure 19: Seasonal and spatial changes of barium, magnesium and potassium concentrations in the
distribution systems .................................................................................................................... 42
Figure 20: Seasonal and spatial variations of sodium, calcium and sulfur concentrations in the
distribution systems .................................................................................................................... 43
Figure 21: Seasonal and spatial variations of strontium and silicon concentrations in the
distribution systems .................................................................................................................... 44
Figure 22: Seasonal and spatial changes of iron concentrations in the distribution systems ............. 46
Figure 23: Seasonal and spatial changes of manganese concentrations in the distribution systems 47
Figure 24: Seasonal and spatial changes of copper concentrations in the distribution systems ........ 48
Figure 25: Seasonal and spatial changes of lead concentrations in the distribution systems ............. 50
Figure 26: Seasonal and spatial changes of zinc concentrations in the distribution system ............... 52
Figure 27: The relationships between δ2H and δ18O of the water samples ............................................ 53

iv
LIST OF TABLES
Page
Table 1: Free chlorine residual (the concentration of residual chlorine, which is present in treated
drinking water as dissolved gas Cl2) and percent blends of the treated at Sandhill reservoir
recorded during the timeframe of this study ............................................................................. 15
Table 2: Characteristics of the sampling sites and description of the collected samples and the
measured physical and hydrochemical parameters ................................................................. 19

v
MEET THE RESEARCH TEAM
Dr. Merline Fonkwe (P.Geo.) is a geoscientist –
applied geochemistry and mineralogy at the Labrador
Institute of Memorial University of Newfoundland.
One of her main lines of research is devoted to water
chemistry, stable isotopes and drinking water
treatment and supply, particularly in small and rural
communities. She is particularly interested in the
protection of groundwater source and identification of
potential physical and chemical hazards and their
impact on tap water quality. The purpose of her
research is to assist municipalities to develop a better
water quality management tailored to their unique water supply conditions, and thus to protect the
health and well-being of local residents and foster customers’ satisfaction and trust in the quality of
their tap water. Dr. Fonkwe works in close partnership with community residents, municipal and
private drinking water supplies, and governments.
Dr. Geert Van Biesen obtained his BSc in environmental
science at the Open University of the Netherlands
(Netherlands), and his MSc in environmental science and PhD
in analytical chemistry at Memorial University of
Newfoundland (Canada). He is currently a research
laboratory associate at the Core Research Equipment and
Instrument Training Network (CREAIT) Stable Isotope
Laboratory Facility at Memorial University.
Dr. Rebecca Schiff is an Assistant Professor in the Department of
Health Sciences at Lakehead University. Dr. Schiff has a long
history of working closely with indigenous communities across
Canada to investigate and research health issues and solutions,
with a particular focus on determinants of community health and
wellness. Dr. Schiff’s work with indigenous communities has
included projects focusing on a wide range of community health
determinants with funding from Tri-Council and other sources.
Dr. Schiff is the North American regional co - editor of the
international journal Rural and Remote Health. She has also been
involved with numerous groups at local, regional, and national
levels. This includes her past work with the Labrador Aboriginal
Health Research Committee, as co-chair for the Research
Exchange Group on Rural, Northern, and Aboriginal Health at the Newfoundland and Labrador
Centre for Applied Health Research, and her current work as member of the National Aboriginal
Academic Advisory Board for the Mitacs Aboriginal Community Engagement Program.

vi
Daniel Frawley is a native of Happy Valley-Goose
Bay (Labrador) and received his BSc in Earth
Sciences from Memorial University of
Newfoundland (Canada) in May 2015. He worked
as research assistant at the Labrador Institute of
Memorial University of Newfoundland (2014 and
2015) on projects related not only to the quality of
tap water, but also to mineral deposits (e.g. Fe-Ti-V
oxide and Ni-Cu sulfide deposits), and
contaminants assessment and monitoring in soil
and groundwater using tree-core methods
(phytoscreening and dendrochemistry). Daniel is
currently studying towards a BSc in Geographic
Information Systems (GIS) at the Southern Alberta Institute of Technology (Canada).
Danielle Spearing was born and raised in Happy
Valley-Goose Bay (Labrador). She worked as research
assistant at Labrador Institute of Memorial University
of Newfoundland in July-August 2015 as part of the
Women in Science and Engineering Student Summer
Employment Program (WISE SSEP). She was
involved in fieldwork and laboratory investigations
associated with assessment of the quality of drinking
water in Happy Valley-Goose Bay. Danielle
completed her final year of secondary school at the
Mealy Mountain Collegiate in June 2016.
Kyla Penney is working as research assistant
at the Labrador Institute of Memorial
University, from May to August, 2016. She is
currently entering her final year at Memorial
University pursuing a Bachelor of Science in
Earth Sciences. Part of Kyla’s time is devoted to
daily monitoring to assess temporal changes in
the quality of groundwater source of drinking
water in Happy Valley-Goose Bay. The other
part of her time involves the petrographic
characterization of magmatic Fe-Ti-V oxide
mineralization present in different plutonic
rocks across Labrador, in order to determine their oxide mineral compositions and textural
relationships for an increased understanding of oxide formation processes.

vii
ACKNOWLEDGEMENTS
This research benefited from financial support extended to Dr. Merline Fonkwe by the Harris
Centre - RBC Water Research and Outreach Fund 2014–2015.
This research was also partially supported by the Labrador Institute start-up grant 2015–2016 of Dr.
Merline Fonkwe from the Atlantic Canada Opportunities Agencies (ACOA) and the Department of
Business, Tourism, Culture and Rural Development, Newfoundland and Labrador (BTCRD NL).
We are thankful to the municipality of Happy Valley-Goose Bay, the Canadian Department of
National Defence and Canadian Force Base 5 Wing Goose Bay for their interest and support, and
for access to their respective drinking water treatment plants. We are also thankful to the
NunatuKavut Community Council (known as NunatuKavut) and Water Resources Management
Division of the Department of Environment and Conservation in Happy Valley-Goose Bay for
supporting this research project. The research assistant, Danielle Spearing participated in this
project thanks to the generous support of the Women in Science and Engineering Student Summer
Employment Program (WISE SSEP 2015); WISE NL is gratefully acknowledged.
Special thanks to:
The Mayor Jamie Snook for signing the support letter, helping getting the agreement to
access the DND’s treatment plant and the review of this report; and the Town Manager
Wyman Jacque for allowing access to the municipality water treatment plant and technical
information;
George Russell Jr, the Environment and Resource Manager at NunatuKavut and Grace
Gillis De Beer, Environmental Scientist (formerly with the Department of Environment and
Conservation, Water Resources Management Division in Happy Valley-Goose Bay) for their
support and input at the early stages of development and implementation of this research
project;
The superintendent of Works/Water & Sewer of the municipality of Happy Valley-Goose
Bay, and the operators of the municipality water treatment plant, Michael Clarke and
Bradley White for their generous logistical and technical support;
The staff at DND’s treatment plant for access to the plant and for providing us with needed
technical background information;

viii
Dr. Ron Sparkes at the Labrador Institute of Memorial University for providing advice and
assisting during the consultations with community members and local organizations in
various research stages;
All our volunteer households for allowing us into their houses during the sampling
campaigns and the team members who participated in water sampling and analysis;
Morgon Mills at the Labrador Institute of Memorial University for providing constructive
editorial comments on this report; and
My colleagues at the administration office (especially, to Mrs. Beatrice Dickers and Mrs.
Diane Brown to whom I wish a happy retirement!) for their generous assistance in the
preparation of financial reports and other administrative tasks at various stages of this
project.
ix
EXECUTIVE SUMMARY
Background:
This research project was driven by the recurring complaints and concerns voiced in the media by
residents living in the Valley area of the community of Happy Valley-Goose Bay, Labrador.
Drinking water in this town is supplied by two water treatment plants (a municipality treatment
plant and a DND treatment plant), which use raw water from two different sources (groundwater
from multiple wells versus surface water from Spring Gulch brook) and use two different processes
of drinking-water treatment. In fact, the drinking water supplied in the Valley area has a unique
distribution arrangement. To meet demand, the Valley area is served by a blend of treated waters
from a storage reservoir (Sandhill reservoir), which is fed by both water treatment plants. Most of
the time, treated water from the municipal treatment plant dominates in the mixture. As water
travels through the distribution system and household plumbing, specific reactions can occur
either in the water itself and/or at the solid–liquid interface at the pipe walls; this is strongly
influenced by the physical and chemical characteristics of the water. These reactions can introduce
undesirable chemical compounds and/or favor the growth of bacteria in the drinking water,
causing the deterioration of the quality of water reaching the consumer taps. In the distribution
system in general, these chemical constituents and bacteria may pose potential threats to health or
the water’s aesthetic qualities (smell, taste or appearance). Drinking water should be not only safe,
but also palatable.
Objectives:
The focus of this research is on the Valley area of Town. The main objectives were to: (i) evaluate
the physical parameters and the concentrations of chemical constituents of groundwater and
surface water (Spring Gulch) sources and municipally supplied water in the distributions systems;
and (ii) investigate the effects of treatment conditions, distribution arrangements, and seasonal and
spatial variations on the quality of drinking water. The ultimate purpose is to assist the
municipality in providing safe and aesthetically pleasing water at consumers’ taps. In addition,
stable isotope geochemistry was used to assess the importance of precipitation (rain or snow) for
groundwater recharge and to investigate the relationships between the groundwater, Spring Gulch
and the Churchill River.
Design, methodology and approach:
Water samples were collected in March, June, July and October 2015 at five key locations: (i)
municipality treatment plant; (ii) DND treatment plant; (iii) Sandhill reservoir; (iv) five private
households and one government building in the Valley area; and (v) one private household in the

x
northern sector of the town, which is solely served by DND treatment plant, for comparison.
Moreover, an extra sampling session was done during a period over the winter, when drinking
water in the town was exclusively supplied by the DND treatment plant, due to the shutdown of
the municipality treatment plant for repair. This provided an additional opportunity to compare
the treated water distributed by each plant, while controlling the downstream effects of the
residence time to water quality in the distribution system, especially in the Valley area. Sampling
locations were chosen at various distances from the Sandhill reservoir, and a variety of sampling
periods (winter, spring, summer and fall) and types of tap water sample (“first draw” and
“flushed”) ensured that seasonal and spatial changes could be adequately described. The
concentrations of 38 major and trace elements were measured together with inorganic anions,
alkalinity and THMs. pH, temperature, EC, TDS and ORP were measured directly at the sampling
sites. Hydrogen and oxygen stable isotope compositions were measured for water samples from
raw water sources (groundwater and Spring Gulch), treated waters, rainfall, and the Churchill
River.
Findings:
The physical parameters and chemical compositions of raw groundwater differed significantly
amongst the supply wells and varied between the seasons. As expected, groundwater quality was
considerably different to that of the surface water (Spring Gulch). Groundwater was fresh or
brackish, soft or very hard with a nearly neutral pH range. Moreover, groundwater showed a
change between mildly reducing (negative ORP) and oxidizing (positive ORP) conditions,
indicating differences in organic material loading. Spring Gulch was fresh, soft and moderately
alkaline, and showed consistent oxidizing conditions, suggesting very little accumulation of
organic material. The up-gradient former landfill does not appear to have affected the quality of the
water wells over the time frame of this study. Given their similar stable isotopic signatures, the
groundwater, Spring Gulch and the Churchill River are likely interconnected. During the study
timeframe, they were most likely recharged by snowmelt runoff in spring 2015, with lesser rainfall
events during the following summer.
Groundwater was characterized by higher concentrations of Cl−, SO42−, Ba, Mg, K, Na, S, Ca, Sr, Si,
Fe, Mn, and Br− compared to Spring Gulch water; the levels of F− in both water sources were very
low, and the other analyzed elements were not detected. Similar trends were observed in their
treated (or finished) waters; yet treated water from the municipal treatment plant was consistently
hard (i.e. contained high concentration of mineral substances) and showed significantly lower
levels of Cl−, SO42−, Ba, Mg, K, Na, S, Ca, Sr, Si, Fe, Mn, and Br− than the “parent” groundwater.
Removal efficiencies for Fe and Mn were higher than 90%; however, THMs formed during the

xi
treatment process. The difference between raw and treated Spring Gulch water was negligible,
except that the concentrations of F− were higher in treated water as the result of fluoridation
(addition of fluoride) done at the DND treatment plant to promote dental health, and THMs also
formed during the treatment process. The concentrations of total THMs and of each THM species,
varied among the two treatment plants: THMs in treated water at the municipal treatment plant
consisted mainly of CHCl3, CHCl2Br and CHBr3 with lesser amount of CHClBr2, whereas CHClBr2
was the sole THM component in treated water at the DND treatment plant. Levels of total THMs in
treated water at the DND treatment plant were consistently below the Canadian health-risk
guideline and considerably lower than the total THMs in treated water at the municipality
treatment plant; the latter exceeded the health risk guidelines at one particular time.
The physical and chemical properties of the blend of treated waters at the Sandhill reservoir, as
well as those of the tap water at the distribution line in the Valley area, typically reflected the
compositions of the treated waters, which dominated in the mixture. Nonetheless, the constituents
in the mixture of treated waters were slightly diluted, when treated water from the municipality
treatment plant dominated in the mixture; the opposite trend was observed when the majority of
treated water in the mixture was from the DND treatment plant. In tap water, irrespective of the
physical and chemical characteristics of the dominant treated water in the blend, the elements with
the lowest variation (both seasonal and spatial) were Cl−, SO42−, Ba, Mg, K, Na, S, Ca, Sr, Si, Br− and
F−, and those which displayed significant changes (mostly spatial, i.e. intra- and inter- household/
government building) were THMs, Fe, Mn, Cu, Pb and Zn. The first group of elements typically
included naturally-occurring elements from the raw water sources, with the exception of F− added
to water during the treatment process at the DND treatment plant. The concentrations of F− were
still too low to promote dental health, although they meet the Canadian aesthetic-based standard.
On the other hand, the second group of elements were either formed by the reactions between the
organic matter and chlorine in water (i.e. THMs) or released by corrosion reactions with the
materials of the distribution systems and plumbing inside the private households and government
building (i.e. Fe, Mn, Cu, Pb and Zn). Both treated waters were corrosive, but treated water from
DND treatment plant seemed to be less corrosive than the treated water from the municipality.
Although Cl− levels met the Canada aesthetic-based guideline, high hardness and levels of Fe, Mn,
Cu, and Zn locally exceeding aesthetic-based guidelines would have likely justified the aesthetic
problems detected by the consumers. Moreover, concentrations of total THMs increased gradually
in the distribution line and locally exceeded health-risk guideline, as did Pb. These chemical
constituents were found to be of the greatest concern as they (and also Cu) have been linked to
health problems in both children and adults. As a mitigation strategy to lower the metal exposure,

xii
flushing effectively reduced the levels of Cu and Zn, but did not always lower levels of Fe, Mn,
THMs and Pb below the aesthetic- or health-based guidelines.
Practical implications and recommended actions:
This research provides crucial information not only on the quality of drinking water sources, but
also on the variability of water quality at consumer’s taps. It is intended help the municipality
administrators and plant operators to develop and implement strategies for managing water
quality across the distribution systems and ultimately, providing safe, aesthetically pleasant tap
water. Moreover, this study provides sound baseline information on groundwater geochemical
evolution to foster the sustainable management of fresh groundwater resources in coastal aquifers.
As demonstrated by our statistical analysis of consumer perceptions of tap water quality in October
2014, the results presented here also highlights some possible misconceptions of the appropriate
authorities as to the extent of the chemical safety and aesthetic problems of water reaching
consumer taps (which are site- specific and differ from house to house), and possible ways they can
be addressed. Mitigations strategies should be evaluated and implemented at the municipal
treatment plant to reduce the formation of THMs (and other chlorination disinfection by-products),
as well as to combat water corrosiveness and hardness. Furthermore, the municipality’s decision to
add fluoride to drinking water might warrant a re-examination and systematic review, giving the
low levels of naturally-occurring fluoride in groundwater source. In the meantime, the appropriate
authorities should encourage residents to test their tap water for Pb (and other metals) by a
certified laboratory, especially in houses built before 1990, but even in newer houses with plastic
pipes and brass faucets and other plumbing fixtures. Location-specific testing is necessary because
the results of this study indicate that Pb comes from materials in the houses’ plumbing, not in the
town's water distribution pipes, and the composition of plumbing materials varies from house to
house. Moreover, residents should be encouraged to use topical fluoride (e.g. fluoridated
toothpaste, varnish, gel or mouth rinse) or other measures to promote dental health, as
recommended by the Canadian Dental Association.
Partner organizations and participants:
The municipality of Happy Valley-Goose Bay
The Canadian Forces Base 5 Wing Goose Bay
The NunatuKavut Community Council
Water Resource Management Division, Department of Environment and Conservation NL
Volunteer homeowners (6 from the Valley area and 1 from the northern sector)
Volunteer government building in the Valley area

xiii
KEYWORDS
Small and rural community water supply
Happy Valley-Goose Bay
Groundwater and surface water sources
Treated drinking-water blending
Tap water quality
Seasonal and spatial changes
Physical parameters
Hydrochemistry
Disinfection by-products trihalomethanes (THMs)
Total alkalinity and total hardness
Nutrients
Inorganic anions
Major and trace elements
Tap-water lead (Pb)
Stable hydrogen and oxygen isotope ratios
Groundwater recharge
Water quality management
Labrador

1
1. INTRODUCTION
1.1. Project background
Drinking water is absolutely essential for optimum healthy living and wellbeing, and must be kept
free of undesirable chemical constituents and bacteria, which are capable of adversely impacting
human health. It must not only be safe, but also aesthetically acceptable for human consumption.
The quality of drinking water is determined by the physical, hydrochemical and biological qualities
of water sources (i.e. surface water, groundwater or others), combined with the applied treatment
process and distribution practices. Both natural processes (e.g. weathering of bedrock minerals,
leaching of chemical components from soil and bedrock, surface runoff, saltwater intrusion in
coastal areas, etc.) and human activities (e.g. landfill leachate, industrial and municipal wastewater
discharge, etc.) can change the quality of the water source or lead to its contamination (e.g.
Medema et al., 2003; Appelo and Postma, 2005; Zhu and Schwartz, 2011). In order to enable the
provision of safe and pleasant water, thereby protecting human health, drinking water suppliers
must adhere to Canadian and provincial guidelines (except for First Nation reserves) health- and
aesthetic-based for drinking water quality (e.g. Health Canada, 2014).
While the fitness of drinking water can be determined through effective monitoring of its physical,
chemical and biological qualities, standards for the protection of drinking water’s aesthetic
qualities are much more difficult to establish (Health Canada, 2014; World Health Organization
WHO, 2011). Because the aesthetic characteristics of drinking water can be assessed directly by
human senses, they provide consumers with their only empirical basis for judging the safety of at
their taps (McGuire, 1995; Jardine et al., 1999; WHO, 2011). Therefore, tap water that has an
objectionable smell, taste or appearance can erode the confidence of consumers in drinking water
supplies, could considerably affect their attitude towards drinking water suppliers, and possibly
lead to the use of water from alternative sources, such as water treated with in-home devices,
commercial bottled water, and untreated water sources, such as spring, river, lake and/or ice-melt
water in rural communities (Fonkwe 2015; Fonkwe and Schiff, 2016; Goldhar et al., 2013; Hanrahan
et al., 2014: 2015; Kolodziej, 2004; Sarkar et al., 2015; WHO, 2011). Even though aesthetic aspects
may not present as direct a health risk as microbiological contamination or the presence of organic
and inorganic components, several studies have shown that these latter parameters may have an
effect on or could be associated with aesthetic problems (e.g. Dietrich, 2006).
Many small and rural communities in Newfoundland and Labrador (and elsewhere in Canada) are
facing drinking water access and/or quality problems, mainly due to the lack of: (i) government

2
water treatment systems and/or adequate treatment technologies to remove contaminants; (ii) fully
trained and qualified operators of water treatment facilities; (iii) protection of water resources; and
(iv) management capacity and financial resources (Dunn et al., 2014; Goldhar et al., 2013;
Guilherme and Rodriguez, 2014; Lightfoot, 2014; Minnes and Vodden, 2014; Scheili et al., 2015;
White et al., 2012). Happy Valley-Goose Bay, the largest community in central Labrador, is not an
exception to the at times poor acceptability of small communities' drinking water, as demonstrated
by some consumers’ complaints voiced in traditional news and social media. Figure 1 gives images
from the Happy Valley-Goose Bay in local newspaper, The Labradorian and local CBC News for a
period between 2008 and 2015. Typical water quality concerns reported by residents are about the
aesthetic qualities, safety and healthiness of their tap water, its corrosion of household appliances,
and/or the number of boil water advisories.
The residents’ complaints and concerns triggered the development and implementation of this
research project and the ultimate goal of Part 2 (the subject of this report) is to shed some light on
the question “Is it safe to drink?” As for Part 1 of this research, the focus was an online survey
questionnaire conducted in October 2014 to measure (quantitatively and qualitatively) residents’
satisfaction and acceptance of drinking water in Happy Valley-Goose Bay. The survey research
showed that most of respondents resided in the Valley area of town and in general, have indicated
dissatisfaction with the quality of their tap water, corroborating the complaints in the media
(Fonkwe, 2015; Fonkwe and Schiff, 2016). This represented a convincing indication of the need for
an evaluation of the quality of drinking water supplied by the municipality, specifically in the
Valley area, to assess whether or not consumer perceptions of tap water quality are correlated with
measured physical and chemical water quality.
Drinking water in the Valley area is a blend of treated waters from two water treatment plants, the
municipal treatment plant and the Department of National Defence (DND) treatment plant, which
draw their raw water from two different types of sources (groundwater from multiple wells versus
surface water) and therefore use two different treatment processes. The municipality has found it
difficult to maintain water quality across the distribution line throughout the Valley area. Although
this blending arrangement has been practiced since the municipal water treatment plant began
operation in 2002, systematic investigations have yet to be undertaken concerning the seasonal and
spatial changes of the physical and hydrochemical qualities of the water sources, drinking water in
the distributions systems and the effects of blending treated waters on the water quality in
distribution lines in the Valley area. The present research fills in these data gaps and provides
critical information for municipality administrators and plant operators to tailor their actions in
order to improve the safety and pleasantness of water at consumer taps.

3
“Residents upset at water quality” - The Labradorian, December 15, 2008. ……………..
“Happy Valley-Goose Bay residents concerned over tap water quality” - The Labradorian, January
06, 2014.
In-house water filter system completely covered in
an orange residue after only two months usage - Courtesy Jenny McCarthy.
Tap left running overnight to prevent her water lines from freezing turned brown a white face cloth put in
the sink - Courtesy Derek Montague.
“You don’t know what you’re drinking” - The Labradorian Published on July 23, 2015.
(A) Difference between new filters (white) for a reverse osmosis water filtration system and the old filters
covered with a brownish “slimy” substance). (B) Corroded part of a two-year-old water heater - Courtesy Derek Montague.
“Labrador business owner wants refund for disgusting water” - CBC news on July 3, 2015.
A full bathtub showing water quality in Happy Valley-Goose Bay after an annual flushing of water service
lines (Photo from CBC New July 03, 2015).
Figure 1: Selected photographs reported in local newspapers and radio between 2008 and 2015, referring to
the complaints and concerns about the quality of their tap water from residents living in the Valley area.

4
1.2. Research rationale and motivation
Before treated water reaches consumer taps, it must pass through a distribution system. One
challenge facing suppliers is that water quality (microbiological, physicochemical and aesthetic
parameters) tends to worsen along the way. Given that the municipality has found it difficult to
maintain water quality during distribution throughout the Valley area of the town, despite the care
taken to provide residents with safe and aesthetically pleasant tap water, it is critical to address
resident concerns about the quality and safety of their tap water. Giving that protection measures
taken at water treatment plants can be very expensive, it is advantageous to investigate the
physical and hydrochemical qualities of water from the point-of-collection (water treatment plants
and reservoir) to the point-of-use (i.e. at the household faucets), in order to provide decision-
making personnel with the necessary information to implement strategies for managing water
quality across the distribution systems.
This research will contribute critical information for a better understanding of local water treatment
and distribution arrangements, because it integrates a holistic sampling approach to provide new
information regarding the current situation of drinking-water quality in Happy Valley-Goose Bay.
Moreover, given the fact that a former landfill site is located up-gradient from the groundwater
supply wells and that hydroelectric power generating facilities under construction on the Churchill
River may affect the groundwater quality of the public supply-wells, it is necessary to understand
the processes controlling groundwater geochemical evolution in order to assess the degree of
vulnerability to pollution for long-term management strategies.
1.3. Research objectives
The main aim of this project was to investigate the seasonal and spatial variations of the physical
and hydrochemical qualities of water sources and municipally supplied drinking water in the
distributions systems. The ultimate purpose is to examine the effects of treatment conditions and
blending of treated waters on the quality of tap water Valley and to assist the municipality to
provide safe and aesthetically pleasing water at the consumer’ taps. In addition, stable isotope
geochemistry was used to investigate the origin of groundwater source and its relationship with
Spring Gulch and the Churchill River. The research involves the following tasks:
1. Consulting with community residents and local organizations at various stages of the
research project.

5
2. Identifying and selecting sampling locations, and recruiting volunteer homeowners in
targeted areas of the distribution network (i.e. tap water in private households and a
government building).
3. Performing test analyses of water samples for the disinfection by-products trihalomethanes
(THMs) by gas chromatography-mass spectrometry (GC-MS) at the Stable Isotope Laboratory
of Memorial University of Newfoundland; and selecting reference laboratories for the
analysis of inorganic anions, alkalinity, major and trace elements and stable isotopes.
4. Collecting water samples in winter, spring, summer and fall, and analysing water samples for
THMs, 39 major and trace elements, 7 inorganic anions, alkalinity and stable isotopes of
hydrogen and oxygen; and also measuring physical parameters (pH, temperature, electrical
conductivity, total dissolved solids and oxidation-reduction potential).
5. Investigating the quality of drinking water sources (5 groundwater wells and surface water),
and the changes in physical parameters, THMs, inorganic anions, and major and trace
elements of treated drinking water, as functions of treatment and distribution parameters,
both seasonal and spatial (within and between private households and the government
building along the distribution system toward the system’s extremity).
6. Determining the stable isotope ratios for hydrogen and oxygen in groundwater and Spring
Gulch water sources, as well as in rainwater and the Churchill River (which borders the
groundwater wells).
The outcomes of this research are intended contribute to: (i) improving water quality management
and providing a reliable supply of safe and aesthetically acceptable drinking-water to consumers;
(ii) building and maintaining consumer confidence; (iii) promoting and protecting the health and
well-being of residents; (iv) planning for a sustainable drinking groundwater resource; and (v)
training highly qualified personnel.
1.4. Knowledge mobilization and deliverables
The development and implementation of this research project involved several consultations with
volunteer homeowners and meetings with local government organizations. Research findings have
been presented to audiences in the local community at Labrador Institute of Memorial University
in Happy Valley-Goose Bay and at the Municipality of Happy Valley-Goose Bay. One abstract
submitted in February 2016, has been accepted for oral presentation at the upcoming National
Water and Wastewater conference 2016 organized by the Canadian Water and Wastewater
Association (CWWA) in Toronto (ON), November 13–16, 2016. Moreover, three additional

6
manuscripts are in advanced stages of development and preparation. Copies of all papers will be
given to the Harris Centre upon their publications.
Specific deliverables provided to date include:
Kyla Penney and Merline Fonkwe (2016): Summer Research Program: Evaluation of the
groundwater source of drinking water and Iron ore mineralogy. The Labrador Institute of
Memorial University, Happy Valley-Goose Bay, NL (August 11, 2016).
Merline Fonkwe and Rebecca Schiff (2016): Is it safe to drink? Residents’ perceptions and
hydrochemical characteristics of municipally-supplied tap water in the Valley area of the
community of Happy Valley-Goose Bay, Labrador. 2016 National Water and Wastewater
Conference, Toronto (ON), November 13–16, 2016 in Toronto (submitted on February 2016;
accepted on June 2016 for presentation on November 15, 2016).
Danielle Spearing and Merline Fonkwe (2015): Assessment of drinking water quality in
Happy Valley-Goose Bay. The Labrador Institute of Memorial University, Happy Valley-
Goose Bay, NL (August 13, 2015).
Merline Fonkwe (2015b): Assessment of municipally-supplied drinking water in the
community of Happy Valley-Goose Bay, Labrador: Preliminary results. Meeting with the
councillors of the municipality of Happy Valley-Goose Bay, NL (July 15, 2015).
Merline Fonkwe (2015a): A framework for better understanding drinking-water quality in
Happy Valley-Goose Bay, Labrador: Implications for optimization and protection of
municipally supplied water. Midterm Project Report to the Harris Centre of Memorial
University (March 27, 2015).
In addition, the project has also gained attention from local media, including a newspaper article
published on August 1, 2014 and February 29, 2016 in The Labradorian Happy Valley-Goose Bay
(NL), and an interview of the project leader and principal investigator Dr. Merline Fonkwe by the
local CBC radio on August 25, 2014. The project was featured in news releases by the Municipality
of Happy Valley-Goose Bay in July 3, 2015 and February 23, 2016.
2. STUDY AREA: THE COMMUNITY OF HAPPY VALLEY-GOOSE BAY
2.1. Physiography and climate
Happy Valley-Goose Bay is a small, remote community in the province of Newfoundland and
Labrador (53˚30' N and 60˚41' W; Fig. 2). It covers an area of 306 km2 and has a population of about

7
8000. The Town is divided into two parts: the northern sector (which is broken down into five
neighbourhoods including the Canadian Forces Base (CFB) 5 Wing Goose Bay, the North Side,
Dock/Terrington Basin, Spruce Park, and MOT/Hamilton Heights, and the down slope Valley area
(subdivided into Upper Valley and Lower Valley) (Fig. 3). The climate is subarctic, marked by
heavy snowfall from November to March with snow covering the ground from November to May
and high rainfall from June to September (average annual precipitation of 762 mm). The average
daily temperatures remain below freezing from November to April and vary between –17.6˚C and
15.5˚C.
The community of Happy Valley-Goose Bay is home to CFB 5 Wing Goose Bay (Fig. 3). This
military air force base was constructed in 1941 on a flat-lying terrace, which has an elevation
between 40 to 50 m above sea level and is bordered by the Terrington Basin to the north and the
Churchill River to the south. CFB 5 Wing Goose Bay operates its own water treatment system and
landfill, among others and provides supplies part of its potable water to the municipality. Before
1990, a variety of residential and industrial wastes generated at CFB 5 Wing Goose Bay were
disposed of on-site at several dumping areas making up a poorly-regulated and unlined landfill
along the escarpment at the south-southeast boundary of the military property (AMEC, 2009;
JWEL, 1992; see Fig. 3). This former landfill site is known to be contaminated by organic and
inorganic chemicals leaching from wastes (see Figs. 3 and 4; Fonkwe, 2016; Fonkwe and Trapp,
2016). Groundwater from the landfill site is unconfined and flows south to southeast towards the
Churchill River, following low topography (AMEC, 2009; Figs. 3 and 4).
2.2. Surface and bedrock geology
Happy Valley-Goose Bay lies at the western extremity of Lake Melville, an inlet of the Labrador Sea
that runs over 100 km inland. In this area, Lake Melville is surrounded by lowland, gently sloping
down toward the lake with very low relief (see Liverman, 1997, and references therein). This
contrasts with the bedrock-dominated highland plateaux that rise abruptly from this coastal plain.
These plateaux are heavily vegetated and reach elevations of greater than 300 m above mean sea
level. Lake Melville is fed by the Churchill River, Goose River and Grand Lake and many other
rivers. Landforms in the north and southwest are high and those in the southeast are low. Surficial
geology consists of about 100 m thick Quaternary marine and fluvial sediments (Liverman, 1997).
These sediments are inferred to overlie the terrestrial red-bed sequence of the Double Mer
Formation composed of mostly conglomerate and sandstone, and in places interbedded with thin
layers of siltstone and shale (Wardle, 1994; Nunn and van Nosttrand, 1996). Bedrock outcrops are
rare at lower elevations (Liverman, 1997). Bedrock is composed of a Paleoproterozoic anorthosite-

8
mangerite-charnockite-granite suite and the massif anorthosite of the Cape Caribou River
Allochthon (Valvasori et al., 2015; Wardle and Ash, 1986).
Figure 2: Map of Canada showing the location the community of Happy Valley-Goose Bay.
2.3. Drinking water supply in the community of Happy Valley-Goose Bay
The community of Happy Valley-Goose Bay is supplied the municipal treatment plant, (locally
called Well Field) and the treatment plant (locally called Spring Gulch) of CFB 5 Wing Goose Bay,
maintained by DND (Figs. 3 and 4). The water distribution system’s piping material throughout the
town consists of cast iron and ductile iron for the water main lines that connects the treatment plant
or the reservoirs to the looped pipe network in the streets, and copper pipes for service lines that
connect the water main lines to the customers’ property lines (F. Brown, pers. comm. June 09, 2014).
DND treatment plant primarily supplies water to CFB 5 Wing Goose Bay and the northern sector of
the town (Fig. 3). The rest of the town, the Valley area, is served solely by a blend of treated water
from a storage reservoir fed by the two water treatment plants; the municipal treatment plant
serves only this storage reservoir (Fig. 3). This unique mixture of treated groundwater and surface
water sources varies in blending ratios depending on water consumption demand (peak water use
typically during the summer months) or in occasional periods solely by either the municipal
treatment plant during low water consumption periods or the DND treatment plant during

9
shutdown of the municipality water treatment plant for maintenance and repair (as it was the case
in February 2015 during the course of this study). In general, the municipal treatment plant meets
in average 65% of the town’s total water needs, while DND treatment plant supplies the remaining
35% of the water at Sandhill reservoir.
Figure 3: Map (from Google Earth) showing the main parts of town in Happy Valley-Goose Bay and
locations of the drinking water treatment and storage facilities of this research interest. Note the former
landfill site highlighted in red.
2.3.1. Municipal water treatment plant
The municipal water treatment plant is located 6.5 km west of the town, between the Trans
Labrador Highway and the Churchill River, downstream of a former landfill site (Figs. 3, 4 and 5).
It has been operated since 2002, using blended water from five groundwater supply wells for its
water supply. The groundwater wells are located close to one another in the vicinity of the
treatment plant, bordered by the Churchill River, on which a hydroelectric dam complex is
currently under construction (Fig. 3 and 4). These wells, named Well #1, Well #2, Well #3, Well #4
and Well #5, reach down between 130–170 feet (ft) through the thick Quaternary marine and fluvial
sediments composed of silty clay layers underlain dominantly by fine-grained sand layers
(Liverman, 1997; Wardle, 1994; Nunn and van Nosttrand, 1996). The water recharge area is likely
extensive and primarily includes areas north of the Churchill River (e.g. NL Water Resources
Management Division, 2011).

10
Figure 4: Map (from Google Earth) showing the location of the groundwater wells and the Spring Gulch
brook impoundment. Note the proximity of the groundwater wells to the Churchill River and their locations
downstream of a former landfill site.
As is typical in most coastal areas, the groundwater aquifer is composed of freshwater (or
terrestrial water) underlain by more dense saltwater, as the result of seawater intrusion (see Fig. 6
modified after Gale et al., 2004). For this reason, water is pumped from Well #1 (168 ft),Well #2
(depth unknown), Well #3 (136 ft) and Well #4 (143 ft) using a dual-pump configuration system: an
upper pump extracts water from the freshwater layer at the top of the water column and transfers
it into the plant, while a lower pump removes the denser and saltier water from the bottom of the
well and discharges it as waste in the Churchill River (Figs. 5 and 6; Gale et al., 2004; M. Clarke,
pers. comm., March 2015). In contrast, pumping at Well #5 (155 ft) is accomplished with one pump,
which withdraws water, which is transferred into the plant (M. Clarke, pers. comm., March 2015).
Well #1 is the oldest among the supply wells and supplies most of the raw water to the plant (M.
Clarke, pers. comm., March 2015). The groundwater is classified as sodium-chloride type water
(NL Water Resources Management Division, 2011). This indicates that a mixture of freshwater and
saltwater is transferred into the plant.

11
Figure 5: The municipal water treatment plant, also called “Well Field”.
Figure 6: Schematic of the well dual-pump configuration at the municipal water treatment plant (Modified
from Gale et al., 2004).

12
At the municipal treatment plant, water treatment is typically an iron and manganese removal
process, also referred to as a direct filtration process (K. Murphy at CBCL Limited, pers. comm.,
March 2016). Unlike the conventional treatment process, direct filtration doesn’t have a
sedimentation step, which allows large particles to settle out naturally, prior to the filtration step;
therefore, all the particles removal takes place on the filters. Thus, direct filtration process is
recommended primarily for the treatment of raw water, which has fairly consistent quality, very
low turbidity (5 to 15 NTU) and color (20 to 40 units), and low concentrations of iron and
manganese (e.g. Spellman, 2013)
Groundwater is pumped simultaneously from Well #1, Well #2 and Wells #3-4-5 and fed to the base
of one reactor vessel, where the chemicals are added (Fig. 5). Then, the water is transferred
simultaneously into three filter vessels. Steps for water treatment process are as follow (K. Murphy
at CBCL Limited, pers. comm., March 2016):
Step 1 - In the reactor tank:
Oxidation by adding chlorine dioxide (ClO2) at the beginning of the treatment process to: (i)
convert dissolved forms of iron and manganese into particulate forms that can be
coagulated and filtered; (ii) disinfect the water (i.e. kill disease-causing bacteria); and (iii)
eliminate taste and odor compounds (mainly organic matter) in water.
Coagulation-flocculation: by adding aluminum sulfate [Al2(SO4)3] or “alum” to react with
small particles in the water and form particles large enough to be filtered out at the next
step.
Step 2 - Simultaneously in the three filtration tanks:
Removal of iron and manganese using a greensand filtration system through three filter tanks,
which are continuously regenerated by the injection of potassium permanganate (KMnO4)
as the water leaves the reactor vessel, to attract and hold iron and manganese particles.
Step 3 - Treated (or “finished”) water on-site storage and distribution:
pH adjustment by injecting calcium hydroxide or lime [Ca(OH)2] to quickly increase the pH
of water that is ready to be distributed;
Temporary storage in the underground reservoir (or clear water well) at the treatment plant
site. Depending upon the water demand, the treated water is sent to Sandhill reservoir, a
concrete underground reservoir located 7 km from the plant, where water is blended with
water from the DND treatment plant. The blended treated water is then sent into the
distribution line, which serves the Valley area of the town (Figs. 3 and 8).

13
Filters are frequently cleaned using a backwash process by which treated water flows upward to
flush out accumulated particles; the backwash process stars automatically after a set volume of
water is filtered. The slurry sludge released from the filters during backwashing is carried away
from the water treatment lines through the backwash line and stored in two underground
backwash holding tanks for about a day, during which time the suspended solids settle to the
bottom. Then, the supernatant waste-water is drawn off the tanks and discharged into the
Churchill River, while the wet residues are gravity drained and stored in two drying beds at the
vicinity the plant. Such residues from the water treatment process typically contain minerals and
organic matters removed from the raw groundwater, together with the chemicals used during the
treatment process. Therefore, consideration should be given to the residue nature and toxicity for
appropriate disposal.
The municipal treatment plant is equipped with monitoring equipment for daily sampling and
testing of treated water for free chlorine, total chlorine, turbidity and pH to assist with operational
decision-making. Free chlorine, which is the concentration of residual chlorine present in treated
drinking water as dissolved gas (Cl2) varied in concentrations between 0.77 and 1.08 milligrams per
liter (mg/L) during the sampling period (Table 1). Because chlorine is not stable in water, free
chlorine is monitored at representative points in the distribution system by the municipal plant
operators. Drinking water is also tested quarterly for trace elements and chlorination disinfection
by-products, THMs and haloacetic acids (HAAs) by the Water Resources Management Division of
the Department of Environment and Conservation in Happy Valley-Goose Bay (G. De Beer, pers.
comm., March 13, 2014). All data are archived at the water treatment plant or through online at the
Newfoundland and Labrador Water Resources web portal at http://maps.gov.nl.ca/water/.
2.3.2. Water treatment plant of the Department of National Defence
The DND water treatment plant is located within the CFB 5 Wing Goose Bay property. It was
constructed in 1952 and upgraded in 1994 (Figs. 3, 4 and 7). It withdraws raw water from an
impoundment of the Spring Gulch brook, which flows from a small, discrete watershed located up-
gradient to the town. Spring Gulch originates from a combination of rainfall, surface runoff and
local groundwater discharge (NL Water Resources Management Division, 2011). Water from
Spring Gulch is classified as calcium-bicarbonate type water, suggesting that the water has quick
travel times from recharge points and therefore, short contact times with local surficial sediments
and other materials (e.g. NL Water Resources Management Division, 2011; AECOM, 2013). The
DND treatment plant is located beside the Spring Gulch brook and the water is directly pumped
into the plant (as indicated by the arrow in Fig. 7).

14
The treatment process at the DND treatment plant is typically a purification method. Spring Gulch
water is pumped from the Spring Gulch brook and is treated as it flows continuously through the
pipes into the underground clear water well (Figs. 3, 4 and 7). The treatment process includes the
following steps (DND treatment plant staff pers. comm., October 2015):
1. Filtration to remove particulate matter from the water;
2. Ultraviolet (UV) disinfection to kill or prevent the reproduction of disease-causing bacteria,
which may be resistant to chlorine;
3. Chlorine disinfection, using chlorine gas (Cl2) to ensure the water is free from microbiological
contaminants (such as bacteria); and
4. Fluoridation and storage, addition of a fluoride compound into treated water to help promote
dental health, followed by temporary storage in an underground reservoir near the
treatment plant site. The water is then distributed to CFB 5 Wing Goose Bay, the northern
sector of the town and the Sandhill reservoir, where it is mixed with the treated water from
the municipal treatment plant (see Fig. 8).
The authorities of CFB 5 Wing Goose Bay are responsible for routine testing and monitoring of
drinking water quality. Free chlorine concentrations in summer and fall were 0.90 and 1.08 mg/L,
respectively.
Figure 7: Water treatment plant of the Department of National Defence, also called “Spring Gulch”.

15
3. METHODOLOGY
3.1. Sampling design and approach
A total of 175 samples were collected between March and October 2015 during each of the four
seasons, as divided under the Drinking Water Quality Monitoring and Reporting for Public Water
Supplies in Labrador by the NL Department of Environment and Conservation: “winter” (January
1st–March 15th), “spring” (May 1st–June 30th), “summer” (July 1st–August 30th), and “fall”
(October 1st–November 15th). The main focus of this project was the municipally supplied
drinking water in the Valley area of the town. However, sampling was also done at one location in
the northern sector of the town (see Fig.3), served by DND treatment plant for comparison. Also for
comparison, an extra sampling session took place in winter (March), when the entire town was
supplied with drinking water solely from the DND treatment plant, due to the shutdown of the
municipal treatment plant for repair. During the timeframe of this study, the percent blends of the
treated waters from the municipal and DND treatment plants, varied considerably. Table 1
summarizes the percentages of both treatment plants in the blended water at Sandhill reservoir,
together with concentrations of free chlorine residual (Cl2) provided by each treatment plant.
Table 1: Free chlorine residual (the concentration of residual chlorine, which is present in treated drinking
water as dissolved gas, Cl2) and percent blends of the treated water at Sandhill reservoir recorded during the
timeframe of this study. *Free chlorine range for summer and fall only.
Free
chlorine
residual
(mg/L)
Percent (%) blend at Sandhill reservoir
Winter
Spring Summer Fall 1st sampling
2nd sampling
Water
treatment
plant
MUNICIPAL
Source: Mix of groundwater
from Wells #1, #2, #3, #4 and #5
Treatment Process: Oxidation,
coagulation-flocculation,
filtration and pH adjustment
0.77 – 1.08 0
5
(Well #4
not in
operation)
60 88 90
DND
Source: Surface water from
Spring Gulch brook
Treatment process: Filtration,
UV and chlorine disinfection,
and fluoridation to help
promote dental health
0.90 – 1.0* 100 95 40 12 10

16
Water samples were collected at: (i) both water treatment plants; (ii) Sandhill reservoir; (iii) five
private households and one government building in the Valley area; and (iv) one private household
in the northern sector (Fig. 8; Table 2). A single pipeline is used to transfer water from Wells #3, #4
and #5 into the plant and therefore the wells cannot be sampled separately. Thus, only their
resulting mix samples were analyzed. Permission to access the DND treatment plant was granted
only during summer and fall sampling sessions, and therefore water samples were not collected in
winter and spring. In the Valley area, the households and government building were selected at
increasing distance up to 7 km from the Sandhill reservoir to capture the location changes
(temporal changes) in the tap water quality. The selected private households and government
building were between 2 and 65 years old at the timeframe of this study (i.e. year 2015). Their
plumbing (below the kitchen sink) were made of either copper pipes, plastic pipes or a mix of
copper pipes and pipes with other metal alloys.
Figure 8: Sketch map (which is not to scale) showing the locations of the municipal and DND treatment
plants, and selected households (H1, H2, H4, H5, H6 and H7) and the government building (H3) in the
distribution systems, served by the two treatment plants. (Sketch map prepared by Danielle Spearing).

17
3.2. Sample collection, preservation and analytical methods
Spring and summer sample collections were conducted by the research assistants, Daniel Frawley
and Danielle Spearing, under the supervision of Dr. Merline Fonkwe; the sampling in winter 1,
winter 2 and fall was done by Dr. Fonkwe alone. All collected samples were kept at temperatures
below 4˚C and analyzed within 4 to 10 days for major and trace elements, inorganic anions and
total alkalinity, and 1 or 2 days for THM compounds. Table 2 summarizes the characteristics of the
sampling sites and description of the water samples collected with respect to water source, age of
the private households and government building, in-house plumbing materials, and distances from
the treatment plants or Sandhill reservoir.
At each sampling location, water were collected from the kitchen cold-water faucet, because this is
where water is drawn most often for drinking and cooking. Two types of water samples were
collected: (i) a “first-draw” sample representing water, which has been sitting in the house
plumbing system overnight or for at least six hours to determine whether the quality of household-
specific tap water was affected by the in-house plumbing; and (ii) a “flushed” sample taken after
running the cold water faucet for five minutes to flush out the stagnant water in contact with the
in-household pipes and other plumbing fixtures in order to access water from the main drinking-
water distribution line. This sample determines whether the municipal water distribution system
and distances from the Sandhill reservoir or the DND treatment plant influence the tap water
quality. Collected samples were in total, 60 samples in Winter 1*, 78 samples in Winter 2, 80 in
spring, 81 samples in summer and 78 samples in fall.
Major and trace elements
106 water samples were analyzed for their total content (sum of dissolved and suspended) of 38
major and trace elements. The concentrations are expressed in mg/L for both major and trace
elements. The collected samples consist of raw groundwater (12), raw surface water source (4),
treated water at the municipal treatment plant (4), treated water at the DND treatment plant (2),
municipally-supplied treated water at the Sandhill reservoir before blending (4), DND-supplied
treated water at the Sandhill reservoir before blending (6), blended treated water at the Sandhill
reservoir (4), tap water (60) in the Valley area, and tap water (10) in the northern sector (see Fig. 8;
Table 2). Both “first-draw” and “flushed” samples were collected at the households and
government building taps, whereas only “flushed” samples were taken at the treatment plants and
at Sandhill reservoir (Table 2). All samples were collected in 125 mL High Density Polyethylene
(HDPE) plastic bottles containing 1.5mL of 18% nitric acid (HNO3) for immediate adjustment of the
sample pH to less than 2, in order to preserve trace metals and reduce precipitation, microbial

18
activity and sorption losses to sampling container walls. Analysis was done by inductively coupled
plasma mass spectroscopy (ICP-MS) at ALS Environmental laboratory (Mississauga, Canada),
following the United State Environmental Protection Agency (U.S. EPA) method 200.8 (U.S. EPA,
1994). The obtained concentrations of major and trace elements are mg/L.
Total alkalinity and inorganic anions
65 water samples were analyzed for total alkalinity (as CaCO3) and the concentrations of 7
inorganic anions. The collected samples consisted of raw groundwater source (12), raw surface
water source (4), treated water at the municipal treatment plant (4), treated water at the DND
treatment plant (2), municipally-supplied treated water at the Sandhill reservoir before blending
(4), DND-supplied treated water at the Sandhill reservoir before blending (6), blended treated
waters at the Sandhill reservoir (4), tap water (30) in the Valley area, and tap water (5) in the
northern Sector (see Fig. 8; Table 2). Only “flushed” samples were collected in 250 mL HDPE
plastic bottles. Analysis of inorganic anions was done by ion chromatography following the EPA
method 300.0 (Pfaff, 1993), except that orthophosphate content was determined by a colorimetric
technique, following the American Public Health Association (APHA) Method 4500-P B.E. (APHA,
1999). Water alkalinity (as CaCO3) was determined by autoanalyzer following the EPA method
310.2 (U.S. EPA, 1974). All the samples were analyzed at ALS Environmental laboratory
(Mississauga, Canada). The obtained concentrations for the total alkalinity and inorganic anions are
reported in mg/L.
Trihalomethane compounds
55 water samples were analyzed for the four THM compounds: chloroform (CHCl3),
dibromochloromethane (CHClBr2), bromodichloromethane (CHCl2Br) and bromoform (CHBr3).
The focus was on “flushed” treated water samples to investigate the spatial variation of THMs
concentrations across the municipality main distribution systems and the relationship between
treatment conditions, quality of treated water, blending of treated waters, the location of sampling
sites along the distribution systems (distance from Sandhill reservoir and DND treatment plant)
and the formation of THMs. In addition, a water sample was collected from one hot water faucet in
winter 2 sampling session to compare its THM content with that of water sample from cold water
faucet at one household. Samples were collected in duplicate, following the method described by
U.S. EPA (1998), at the municipal treatment plant (4), DND treatment plant (2), municipally-
supplied treated water at the Sandhill reservoir before blending (5), DND-supplied treated water at
the Sandhill reservoir before blending (5), blended treated waters at the Sandhill reservoir (4) and
tap water in the Valley area from Sandhill reservoir (24), and tap water (5) in the northern sector

19
(see Fig. 8; Table 2). Flushed samples were collected in 60 mL glass vials containing 1.00 g of a
buffer mixture of potassium phosphate and sodium phosphate (KH2PO4/Na2HPO4 99:1) and 6.0 mg

20
Table 2: Characteristics of the sampling sites and description of the collected samples and the measured physical and hydrochemical parameters. Details
are given in the text.*Refers to the pipe materials from the wall and connector to the faucets under the kitchen sink. ** From hot water faucet.
Sampling sites Water source Sample
collected
Type of water sample
collected for analyses
Measured physical and hydrochemical parameters
Physical parameters Alkalinity
and
inorganic
anions
Major
and trace
elements
THMs Stable
isotopes pH T˚C EC TDS ORP
DND treatment plant Surface water,
Spring Gulch
A0a Raw (untreated) water from
the impoundment
A0b Raw water inside the plant -
flushed
A1 Treated water - flushed
Municipal treatment plant Mix of groundwater
from 5 wells
Well #1 Raw water inside the plant -
flushed
Well #2 Raw water inside the plant -
flushed
Mix of
Well #3-4-5
Raw water inside the plant -
flushed
B1 Treated water - flushed
Sandhill reservoir
7 km from municipal treatment
plant/8 km from DND treatment
plant
Treated Spring
Gulch water A2
Treated water from DND
treatment plant - flushed
Treated mixed
groundwater B2
Treated water from the
municipal treatment plant -
flushed
Blend of treated
Spring Gulch water
and treated mixed
groundwater
A2+B2
Blend of treated waters
from the municipal and
DND treatment plants -
flushed
Private
households
(age at the
time of
sampling in
2015)
H1
Age 2/ 3.5 km
from Sandhill
reservoir/plastic
pipes*
Blend treated waters
from Sandhill
reservoir
H1-0 First-draw
H1-1 Flushed
H1-2 Flushed**
H2
Age ~15-20/ 4 km
from Sandhill
reservoir/cooper
pipes and metal
faucet connector*
Blend treated waters
from Sandhill
reservoir
H2-0 First-draw
H2-1 Flushed

21
H4
Age 15/ 5 km
from Sandhill
reservoir/ cooper
pipes and metal
faucet connector*
Blend treated waters
from Sandhill
reservoir
H4-0 First-draw
H4-1 Flushed
H5
Age 65/ 6 km
from Sandhill
reservoir/copper
faucet connector*
Blend treated waters
from Sandhill
reservoir
H5-0 First-draw
H5-1 Flushed
H6
Age 50/ 7km
from Sandhill
reservoir/copper
faucet connector*
Blend treated waters
from Sandhill
reservoir
H6-0 First-draw
H6-1 Flushed
H7
Age ~40-50/ 6km
from DND
reservoir/copper
faucet connector*
Treated water from
DND plant
H7-0 First-draw
H7-1 Flushed
Government
building
(Age in
2015)
H3
Age 42/ 3 km
from Sandhill
reservoir/ copper
faucet connector*
Blend treated waters
from Sandhill
reservoir
H3-0 First-draw
H3-1 Flushed
Rainfall
Churchill River

22
ammonium chloride NH4Cl for immediate preservation and dechlorination; the vials were closed
with polytetrafluoroethylene (PTFE)-lined septa lined screw caps. All the water samples were
analyzed at the Stable Isotope Laboratory, Memorial University of Newfoundland in St. John’s by
Dr. Geert Van Biesen by gas chromatography-mass spectrometry (GC-MS), following a modified
EPA Method 551.1, which includes liquid–liquid extraction with Methyl Tertiary Butyl Ether
(MTBE) (U.S. EPA, 1998). The concentrations of each individual THMs compound, as well as the
sum of these four compounds, are reported in micrograms per litre (µg/L).
Physical parameters
The physical parameters, pH, temperature (T˚C), electrical conductivity (EC), total dissolved solids
(TDS) and oxidation-reduction potential (ORP) were measured immediately after the collection of
“flushed” samples at the sampling site, because they are unstable and change during storage and
transport (see Fig. 8; Table 2). A Hanna Instruments (HI) multiprobe HI 98129 meter was used for
pH (±0.05 pH @ 20°C), T˚C (±0.5 °C @ 20°C), EC (±2% full scale @ 20°C) and TDS (±2% full scale @
20°C), whereas an HI 98120 meter was used for ORP (±2 mV @ 20°C). Both testers were calibrated
and checked every day before sampling. The HI 98129 was calibrated using calibration solutions,
including pH buffer solutions 4.01 (HI 7004) and 7.01 (HI 7007) and conductivity solution 1.413
mS/cm (HI 7031); the meter was not calibrated in TDS, since there is a known relationship between
EC and TDS readings. HI 98120 is factory calibrated and was checked using ORP test solutions 240
mV (HI 7021) and 470 mV (HI 7022). Because EC/TDS depends on the measured water
temperature, the obtained values were automatically corrected to the standard temperature value
of 25°C.
Figure 9: Kyla Penney measures physical parameters of groundwater at the municipal water treatment plant.
Hydrogen and oxygen stable isotopes
Water samples were collected in spring and summer from groundwater wells and Spring Gulch
impoundment, as well as from rainfall and the Churchill River bordering the groundwater wells to

23
determine the importance of precipitation (rainfall and snowfall), with respect of the origin of the
recharge water for the groundwater source and its relationships with surface water bodies, i.e.
Spring Gulch and the Churchill River (Table 2). All samples were collected in 20 ml scintillation
glass vials with rubber-lined screw-top caps. Filled vials had tape wrapped around the caps to
prevent caps from coming loose and the sample becoming evapoconcentrated. Hydrogen and
oxygen isotopes were measured using a gas stable isotope mass spectrometer at Isotope Tracer
Technologies Inc. (IT2) in Waterloo, Canada. Results are expressed in parts per thousand (‰) as
ratio of the heavy to light isotope of hydrogen (δ2H) and oxygen (δ18O) relative to the Vienna
Standard Mean Ocean Water (VSMOW) reference. The precision for δ2H and δ18O were ±1.0‰ and
±0.1‰, respectively.
3.3. Quality assurance and quality control
For quality assurance and quality control (QA/QC), “blind” duplicate samples collected at a
frequency of 10% of the total number of samples were used to monitor analytical performance in
addition to the laboratory quality for alkalinity, inorganic inions, major and trace elements and
THMs. For all the analyses, duplicate pairs showed comparable results. Moreover, for THM
analysis, trip blanks consisting of vials filled with nano-pure water did not indicate contamination.
Furthermore, each of the contracted laboratories independently followed their internal QA/QC
programs.
4. RESULTS AND DISCUSSION
The physical and hydrochemical parameters of the raw sources, treated waters and tap waters
were determined to assess their physical properties and the concentrations of chemical
constituents, and to investigate the effects of treatment conditions, distribution arrangements, and
seasonal and spatial variations on the quality of drinking water. Tap water results were compared
with Canada health- and aesthetic-based guidelines (Health Canada, 2009: 2014), and other
international guidelines (WHO 1999: 2004).
4.1. Physical parameters
Temperature
The temperature (T˚C) of water samples varied widely between 2˚C to 24˚C across seasons, sources
(groundwater and Spring Gulch), and the location (private household vs. government building)
(Fig. 10). The Canadian aesthetic-based guideline value of tap water T˚C is less than or equal to
15°C (Health Canada, 2014). Tap water T˚C at most of the households met the guideline, and the

24
values were commonly below 10˚C in winter and spring and between 10˚C and 14˚C in fall and
summer. Exceptionally, at the government building H3, tap water T˚C was above the guideline
value in winter, spring and summer. This is probably caused by greater size of the building,
smaller demand volumes of water from the kitchen tap, and consequently longer periods of
stagnancy of water in the building piping system; these factors seem to have more influence than
the ambient/outside temperature in this case. However, the weather forecast information can be
used to predict water temperature in drinking water distribution networks (Agudelo-Vera et al.,
2014). Moerman et al. (2014) have demonstrated that when water is demanded at the tap, the force
that pushes the water through the domestic water supply system (i.e. between the water meter or
connection to drinking water distribution network and the tap) also causes a temperature increase
between 1°C to 4°C.
Figure 10: Seasonal and spatial changes of water temperature in the distribution systems. See the sampling
locations in Figure 8.

25
Although the water temperature does not have direct health effects, it remains nonetheless an
important determinant of water quality because of its influence on the physical and chemical and
biological proprieties of drinking water (Health Canada, 2014; Liu et al., 2013; Powell et al., 2000).
High temperature accelerates chlorine loss and the formation of disinfection by-products (see
section 4.2), and favors bacteria growth and the corrosion of housing plumbing materials. This
results in adverse effects on the chemical and aesthetic qualities of drinking water reaching the
consumers’ taps in comparison with water at the main distribution line.
pH
Measured pH ranged between 6.5 and 7.6, indicating a slightly acidic to slightly basic condition
(Fig. 11). No clear trends are observed between seasons or sampling sites. Except for the
government building H3 in Winter 2, the samples showed pH values within the recommended
desirable range of 6.0 – 8.5 for groundwater, 6.5 – 8.5 for surface water and of 6.5 – 8.5 for tap water
(WHO, 2004; Health Canada, 2014).
Figure 11: Seasonal and spatial changes of water pH in the distribution systems. Note: the legend is the same
as in Figure 10. Sampling locations are shown in Figure 8.
pH is one of the most important operational parameters of water quality and it should therefore, be
checked routinely during water treatment and distribution. There is no direct effect of pH on
consumer health. However, improper pH can affect the disinfection action of chlorine, the degree

26
of metals corrosion and the formation and distribution of disinfection by-products (e.g. Rodrigez
and Sérodes, 2001; Liang et al., 2003). These outcomes, however, also depend on the composition of
the raw water and the nature of the piping materials used in the drinking-water distribution
system.
Electrical conductivity
Electrical conductivity (EC) is commonly used as a good indicator of salinity. The variation of EC
values during the sampling period is illustrated in Figure 12. Measured EC values of the
groundwater source varied widely, between 103 and 2771 µS/cm. The EC of the groundwater
samples were generally higher in winter than those collected during the other seasons. The lowest
values were recorded for Well #2 and the highest values for Well #1. Slight variations in the EC
values of the wells were observed between the seasons; however, the pattern remained constant,
Well #2 having the lowest values follow by Wells #3-4-5 and Well #1 having the highest values.
Higher EC values suggest higher concentrations of salts in Well #1, indicating that mixed
freshwater and saltwater was pumped from Well #1 into the treatment plant. Pumping of well
freshwater from the freshwater-saltwater aquifer depends on the upward movement of saltwater
within the aquifer when the well is pumped (Zack, 1988). Given that Well #1 provides most of the
raw water into the municipality treatment plant, this implies that the groundwater mix for
treatment was salt-enriched and not entirely freshwater. In contrast, EC values for Spring Gulch
water, which supplies the DND treatment plant were significantly lower, varying from 41 to 52
µS/cm; the lowest EC value was obtained in spring and the highest EC value in summer. This
suggests lower content of salts.
The EC of treated water ranged between 681 and 1142 µS/cm at the municipality treatment plant
and was strongly influenced by the EC of water from Well #1, whereas lower values of 26 – 38
µS/cm were obtained for the treated water at DND treatment plant. The EC of the treated waters
from the municipality and DND treatment plants varied a little when reaching Sandhill reservoir
with values of 553 – 1237 µS/cm, and 19 – 37 µS/cm, respectively. After the mixture of the treated
waters occurred at the Sandhill reservoir, EC ranged from 304 to 866 µS/cm. The EC the blend of
treated waters was strongly influenced by the proportions of each treated water in the mixture. In
the Valley area served by a blend of the treated waters, the EC of tap water varied slightly with
increasing distance of the private households H1, H2, H4, H5 and H6, and government building H3
from Sandhill reservoir and between seasons, reaching up to 919 µS/cm. EC of tap water from the
private household H7 in the northern sector (served by DND treatment plant) also varied slightly
with seasons, reaching up to 166 µS/cm.

27
Figure 12: Seasonal and spatial variations of the electrical conductivity in the distribution systems. Note: the
legend is the same as in Figure 10. See the sampling locations in Figure 8.
Total Dissolved Solids
Total dissolved solids (TDS) includes inorganic constituents (salts) and organic matter. TDS values
ranged from 51 – 1379 mg/L for the groundwater source (Figure not shown). The lowest values
(TDS <1000 mg/L) were recorded for Well #2 and Wells #3-4-5, classified as freshwater, and the
highest values (>1000 mg/L) were recorded for Well #1 in winter and spring, classified as brackish
water, i.e. a mixture of freshwater and saltwater (Freeze and Cherry, 1979). This implies that the
groundwater mix for treatment was salt-enriched or brackish and not freshwater, given that which
Well #1 provides most of the raw water into the municipality treatment plant. Therefore,
desalination technology should perhaps be considered to remove the dissolved salt content from
the brackish groundwater. TDS values of Spring Gulch were much lower, ranging between 20 and
25 mg/L, indicating freshwater (Freeze and Cherry, 1979). The TDS values of the treated waters
varied from 339 – 474 mg/L at the municipal treatment plant and from 14 – 19 mg/L at DND
treatment plant; these TDS values changed little at the Sandhill reservoir. Blending of the treated
waters diluted the TDS content in tap water to a maximum of 461 mg/L in the Valley area, when
dominated by treated water from the municipal treatment plant; minimum values were observed
in cases of dominance by treated water from DND treatment plant. TDS of tap water at the private
28
household in the northern sector (served by DND treatment plant) also varied seasonally from 10 –
74 mg/L.
In the Valley area, TDS concentrations were moderate and just below the Canadian aesthetic-based
guideline of 500 mg/L. Higher TDS concentrations impart an undesirable salty taste of drinking
water, and can cause excessive scaling and corrosion of plumbing materials and household
appliances (Health Canada, 2014). Nevertheless, because sensitivity to taste varies from person to
person, some people might still detect the salty taste of water at moderate-TDS concentrations
(Dietrich and Gallagher, 2003).
Oxidation-Reduction Potential
Oxidation-reduction potential (ORP) or redox potential measures the capacity of water to either
lose (oxidation) or gain (reduction) electrons from chemical (redox) reactions. It indicates the
oxidizing (aerobic) or reducing (anaerobic) tendency of water; positive values indicate oxidizing
conditions, while negative values occur when the water is more reducing. Redox reactions strongly
influence the mobilization or immobilization potential of metals (or contaminants) from both
natural and anthropogenic sources; the mobility of some metals increases under reducing
conditions, while others metals are more mobile under oxidizing conditions (e.g. McMahon and
Chapelle, 2008).
The variation of ORP during the sampling period is illustrated by Figure 13. Seasonal changes in
reducing and oxidizing conditions of the groundwater source were observed at all the wells. Redox
potential alternated from modestly negative values in spring to positive values during the other
seasons and ranged between -45 and +106 mV. The ORP concentrations obtained for Spring Gulch
water were higher than those for groundwater wells, from +326 and +545 mV in summer and fall,
respectively. Groundwater treatment produced positive and higher ORP from +546 to +554 mV,
due to the oxidizing nature of the chlorine and permanganate added to the water during the
treatment process. A similar trend of higher ORP values between +554 and +658 mV was recorded
for treated water from DND treatment plant, as the result of chlorine addition during water
disinfection. ORP values for both treated waters at the Sandhill reservoir and tap water in the
private households and the government building were variable, but in general decreased with
increasing distance along the distribution line in the Valley area. The ORP of drinking water from
DND treatment plant showed no change to little increase with distance from the plant, as
demonstrated by the ORP concentrations measured at household H7 (Fig. 13).

29
Figure 13: Seasonal and spatial changes of the redox potential in the distribution systems. Notes: The legend
is the same as in Figure 10. The ORP meter was not working during Winter 2** sampling session. See
sampling sites in Figure 8.
4.2. Disinfection by-products trihalomethanes
Disinfection by-products (DBPs) result from chlorination in drinking water treatment, and also
when other disinfectants, such as ozone and chloramines are used (e.g. Rook, 1974; Williams et al.,
1997; Singer, 1994; Rodriguez and Sérodes, 2001; Liang and Singer, 2003; Nikolaou et al., 2004;
Rodrigez et al., 2004; Nikolaou et al., 2004; Guilherme and Rodriguez, 2014; Scheili et al., 2015).
Although more than 600 different species of disinfection by-products (DBPs) have been identified
in tap water (Richardson, 2002; Richardson et al., 2007), only trihalomethanes (THMs) and
haloacetic acids (HAAs) are regulated, because of public health concerns. This study focused on the
four THM species: chloroform (CHCl3), dibromochloromethane (CHClBr2), bromodichloromethane
(CHCl2Br) and bromoform (CHBr3), because THMs are the most prevalent DBP class in drinking
waters and are often used as indicators for all other potentially harmful DBP classes (e.g. Krasner et
al. 1989). The sum of these four compounds or total THMs, is regulated at the heath-based
guideline value of 0.1 mg/L (or 100 μg/L) in tap water (Health Canada, 2006: 2014).
Figure 14 shows the concentrations and changes of total THMs in treated and tap waters as a
function of treatment and distribution conditions (see Table 1), season and residence time in the

30
distribution systems before reaching the consumer’s tap. When comparing the two treatment
plants, considerable variability was observed in concentrations of specific THMs species and
therefore of total THMs. Total THM levels were higher in treated water at the municipal treatment
plant than at the DND treatment plant. A possible explanation is the difference in water source,
and therefore in the content of THM precursors (i.e. organic and inorganic material which reacts
with chlorine to form THMs) and/or the difference in the chlorine doses. Only the THM species
CHCl3 was found in treated water from DND treatment plant, whereas in treated water from the
municipal treatment plant, CHClBr2, CHCl2Br and CHBr3 species dominated with minor amount of
CHCl3. This is probably due to the presence of bromide in groundwater (see section 4.4 of the text).
Figure 14: Seasonal and spatial changes of THMs in the distribution systems. Notes: water samples were not
collected at the DND treatment plant (A1) during winter 1, winter 2 and spring sampling sessions. The
sampling locations are shown in Figure 8.
The levels of total THMs in municipally treated water were higher at the plant and Sandhill
reservoir than at DND treatment plant. The highest concentrations of total THMs of 108 and
121μg/L respectively, exceeding the Canada health-risk guideline, were obtained in winter when
the plant was operating on a temporary basis after a shutdown for repair. This is likely due to

31
changes in operational parameters during the period following the repair, indicating a need to
verify the potability of threated water upon resuming operations, and prior to pumping water into
the distribution system.
Concentrations of total THMs in the treated water at the DND treatment plant remained fairly
constant at Sandhill reservoir, reaching 21 μg/L. When dominant in the blend at Sandhill reservoir,
the lower total THM levels of the treated water from DND treatment plant caused a reduction (up
to 3 times lower) of total THMs content in the mixture of the treated waters before distribution in
the Valley area. After the blending, when treated water from the DND treatment plant was
dominant, CHClBr2, CHCl2Br and CHBr3 remained the dominant species; however, their
concentrations decreased considerably, whereas the level of CHCl3 slightly increased in blended
treated water at Sandhill reservoir. On the other hand, when treated water from the municipal
treatment plant dominated in the mixture at Sandhill reservoir, CHClBr2, CHCl2Br and CHBr3
remained the dominant species, and their concentrations generally decreased slightly, whereas
CHCl3 content increased considerably.
From site to site across the distribution line in the Valley area, concentrations of total THMs varied
slightly, but remained lower (up to 55 μg/L), when treated water from DND treatment plant
accounted for 100 % and 95 % of the mixture at Sandhill reservoir (Fig. 14; Table 1). In contrast,
when treated water from the municipal plant dominated in the mixture, total THM levels in tap
water remained higher and increased with increasing distance from Sandhill reservoir, and
exceeding the Canada health-risk guideline at some households H4, H5 and H6, and the
government building H3 (Fig. 14). Higher total THM levels were reported at the beginning of the
distribution line at the government building H3 and not toward the end of the distribution line as
expected, probably because of higher stagnation times and the higher temperature (see Fig. 10) of
water in the plumbing. This building has longer plumbing lines and the kitchen tap is used only
periodically, compared to the private households toward the end of the distribution line.
The effect of seasonal changes on total THMs, especially in tap water at the distribution line, could
not be inferred with confidence from this study, because of the significant variations in the percent
blend of treated waters from the two treatment plants over the timeframe of this study. Constant
mixing proportions of the treated waters, and to some extent, similar operational parameters
between the seasons are crucial for such evaluation. However, it can be seen in Figure 14 that the
concentrations of total THMs were, in general, higher in spring, summer and fall (warmer seasons)
than in winter and this corroborates with other studies (e.g. Rodriguez and Sérodes, 2001; Toroz
and Uyak, 2005). An increase with travel time and a seasonal variability were observed at

32
household H7, which is served only by the DND treatment plant, with higher levels of total THMs
(32 μg/L) in warmer periods (spring, summer and fall) and lower levels in winter (up to 9 μg/L).
Higher THM content was observed in kitchen hot water taps than in cold water taps, because of
higher water temperature and longer stagnation time in the hot water tank. A difference in the
THM species present in water was also observed. For instance, at household H1 during Winter 1
sampling session (when drinking water was supplied solely by DND treatment plant), the level of
total THMs in water from the cold faucet tap (at a temperature of 9˚C) was 6 μg/L and consisted
exclusively of CHCl3. In contrast, the concentration of total THMs in water from the hot faucet tap
(at a temperature of 32˚C) was 6.8 times higher than that from the cold faucet tap, reaching 41 μg/L
(not shown in Figure 14) and THMs consisted dominantly of CHCl3 with lesser amounts of
CHClBr2, CHCl2Br and CHBr3. This suggests that THM levels increase when cold water stagnates
in household pipes and that this increase is even more significant when water sits in hot water
tanks. This observation corroborates findings by Dion-Fortier et al. (2009).
There is evidence that long-term exposure to levels of THMs above the guideline value has
potential adverse effects on human health (e.g. Canada Health, 2014: Mohamadshafiee and
Taghavi, 2012). Although total THMs are monitored under the regulations, the request for specific
concentrations of individual THM species is recommended, because potential health effects
associated with the exposure to elevated THMs may be different for each THMs species (e.g. IARC,
1999a: 1999b; Hunter et al., 2006). For instance, CHCl3 and CHCl2B are considered by the
International Agency for Research on Cancer (IARC) to be possibly carcinogenic in humans (IARC,
1999a: 1999b). Moreover, epidemiologic studies suggest possible relationships between exposure to
CHCl3 and increased risk of cancer, especially of the urinary bladder and colorectum (e.g. King and
Marrett, 1996; IARC, 2004; Richardson et al., 2007; Villanueva et al., 2004: 2007). Furthermore,
exposure to high concentrations of DBPs has been associated with significant increases in risks of
reproductive, developmental and birth defects (e.g. Nieuwenhuijsen, et al., 2000; Tardiff et al., 2006;
Chisholm et al., 2008; Smith et al., 2016). Humans are exposed to THMs by drinking tap water, as
well as through dermal absorption and inhalation during showering and bathing (Lin, 2000;
Backer, 2000; Nuckols et al., 2005).
4.3. Total alkalinity and total hardness
Total Alkalinity
Alkalinity measures water’s capacity to resist to pH changes. Adequate alkalinity, typically above
100 mg/L, will protect pH from fluctuation and therefore, will keep it stable. Alkalinity is primarily

33
a function of the presence of naturally-occurring carbonates, bicarbonates and to a lesser degree,
hydroxides and phosphates (e.g. Griggs and Ficke, 1977). It is influenced by local geology and by
the percolation of rain and surface water along with the dissolved carbon dioxide of the
atmosphere. Alkalinity is a commonly used indicator in the interpretation and control of water
processes.
Total alkalinity (as CaCO3) values of the groundwater vary from 31 to 79 mg/L between the wells.
Except for summer, a very narrow variation range was observed in each individual well. In
summer, total alkalinity was significantly lower for Well #1 and higher for Well #2 and Wells #3-4-
5. The total alkalinity of Spring Gulch water was lower than that of the groundwater, with values
of 17 and 15 mg/L in summer and fall. Treated groundwater showed total alkalinity values of 40 –
55 mg/L at the municipal treatment plant and a comparable range at the Sandhill reservoir. Treated
water from DND treatment plant had slightly lower total alkalinity, ranging from 10 to 14 mg/L at
both the plant site and Sandhill reservoir. The low total alkalinity obtained (below 100 mg/L)
suggests poor buffering capacity in both groundwater and surface water sources. This is possibly
due to the fact that the sedimentary rocks through which the groundwater and surface water move
through contain little carbonate or bicarbonate minerals or compounds. The total alkalinity of the
mixture of the treated waters varied between 21 and 51 mg/L and was strongly influenced by the
proportion of treated water from each of the treatment plants in the blend: the higher the
proportion of treated water from DND treatment plant in the blend, the lower the total alkalinity of
the mixed treated waters; the opposite was observed when treated water from the municipal
treatment plant dominated in the mixture. The total alkalinity of tap water samples varied little
along the distribution line in Valley area compared to corresponding treated water mixtures at the
Sandhill reservoir. “First-draw” and “flushed” samples from individual households and the
government building showed either similar values of total alkalinity or narrow variation ranges.
Similarly, the total alkalinity of tap water supplied by DND treatment plant at household H7
varied little, ranging between 12 and 15 mg/L, and was comparable to the values for corresponding
treated water at the DND treatment plant.
Total hardness
Water hardness is caused primarily by the presence of dissolved calcium- and magnesium-
carbonates, bicarbonates and hydroxides (namely carbonate hardness) and dissolved non-
carbonate salts, calcium- and magnesium- chlorides and sulphates (namely non-carbonate
hardness) with to some extent, several other dissolved metals forming divalent or multivalent
cations, such as aluminum, barium, strontium, iron, zinc, and manganese in water. Carbonate
hardness is equivalent to total alkalinity and any excess of hardness above total alkalinity is

34
considered to be non-carbonate hardness (e.g. Rice et al., 2012). Carbonate hardness can be
removed by boiling and as such is referred to as temporary hardness, whereas non-carbonate
hardness is permanent in water. Its constituents are from natural sources and are expected to occur
in higher concentrations in groundwater compared to surface water, because groundwater moves
through sedimentary rocks and is contaminated by seawater intrusion. Drinking water is classified
based on total hardness (TH) as CaCO3, which represents the sum of carbonate hardness and non-
carbonate hardness as: soft (TH less than 60 mg/L), moderately hard (TH between 60 and 120
mg/L), hard (TH between 120 and 180 mg/L), and very hard (TH above 180 mg/L) (Durfor and
Becker, 1964; Health Canada, 1979). Total hardness (as CaCO3) of water was calculated using the
formula below:
Total hardness as CaCO3 (mg/L) = 2.497 [Ca, mg/L] + 4.118 [Mg, mg/L]
The variability of TH in water presented in Figure 15 is similar to that of total alkalinity (figure not
shown). It can be seen in Figure 15 that groundwater samples from the wells fall within different
water hardness zones. With the exception of fall, water from Well #1 was very hard and had TH of
277 – 323 mg/L, whereas water from Well #2 and Well #3-4-5 was within the soft water zone (TH
>60 mg/L) in summer, spring and winter. In the fall, although slightly higher, water from Well #2
remained soft. On the contrary, water from Well #1 became soft with a substantial decline in TH to
23 mg/L, while a significant increase in TH of water from Well #2 was observed and reached 292
mg/L. The difference and seasonal changes in groundwater TH quality from the wells can possibly
be explained by the pumping of a mixture of freshwater and saltwater (i.e. brackish water) into the
treatment plant; saltwater is enriched in magnesium and sodium salts and non-carbonate salts,
such as chloride (see Figs. 17, 19 and 20).
The surface water source (Spring Gulch) supplying the DND treatment plant was soft, having a TH
of 12 mg/L. Treated water at the municipal treatment plant was hard and remained so, in general,
at the Sandhill reservoir (between 109 and 152 mg/L). On the other hand, treated water from DND
treatment plant remained soft with TH of 12 mg/L after treatment and after reaching the Sandhill
reservoir. Due to the high proportions in the blend of treated water distributed in the Valley area,
the hardness characteristic of the treated water from the municipal treatment plant dominated the
tap water TH in spring, summer and fall (also see Table 1). Tap water TH along the distribution
system was between moderately hard and hard, ranging between 99 and 138 mg/L, and in general
was above the Canada aesthetic-based guideline range of 80 – 100 mg/L (Health Canada, 2014). In
winter (Winter 1 and Winter 2), the percent blends of the treated waters were, in contrast,
dominated by treated water from DND treatment plant (also see Table 1). As result, tap water
showed TH range of 12 – 42 mg/L, indicating soft water. At household H7, supplied only by the

35
DND treatment plant, TH levels ranged from 11 to 16 mg/L, indicating soft water. Only negligible
changes were observed within the households and the government building.
Figure 15: Seasonal and spatial changes of the total hardness in the distribution systems. The classification of
the hardness in water is shown. See Figure 8 for the sampling locations.
Depending on pH and alkalinity, water with hardness above 100 mg/L may cause problems, such
as incrustation of pipes and deposition of off-white chalky scale in in-house plumbing fixtures and
water use appliances (Fig. 16); in the long term, this can shorten the operational lives or otherwise
damage domestic water-use machinery (e.g. Hudson and Gilcreas, 1976; Gray, 2008; Spellman,
2013). In addition, hard water may have corrosion tendencies and also, reduce the effectiveness of
soaps and detergents and thereby, increasing soap consumption. The breakdown of major

36
appliances such as dishwashers, washing machine and water boilers have prompted frequent
complaints from residents living in the Valley area (See Fig. 1), where TH concentration at the taps
ranged between 99 and 138 mg/L. Therefore, the reduction and monitoring of drinking-water
hardness is necessary to avoid not only more frequent cleaning, but also expensive repair and/or
replacement of household water-use appliances. Softening processes are common practices in
water treatment (Curtis and El-Midany, 2006; Spellman, 2013). The type of chemical used depends
on the type of hardness in the water.
Figure 16: The electric kettle at one household shows a build-up of off-white, chalky scale from tap water.
4.4. Nutrients and inorganic anions
Nutrients, nitrate-nitrogen (NO3-N), nitrite-nitrogen (NO2-N) and orthophosphate-phosphorus
(PO4-P) were not present in detectable levels (i.e. obtained concentrations were below their lower
limits of detection) or were present only at very low concentrations in all samples.
Bromide
Bromide (Br−) was detected only in groundwater and in tap water at the private households and
the government building in the Valley area (figure not shown). Groundwater from Well #1
contained Br− only in winter, spring and summer and the concentrations ranged from 1.79 to 1.95
mg/L. Well #2 contained Br− at 0.15 mg/L only in fall and Br− levels detected in groundwater Well
#3-4-5 were 0.15 and 0.41 mg/L in summer and fall, respectively. Br− in groundwater typically
originates from natural sources (Davis et al., 2004; Magazinovic et al., 2004). Although

37
anthropogenic sources of Br− have also been identified (e.g., Br− containing pesticides and fuel
additives), their contribution to overall Br− levels are, in general, expected to be negligible (Price et
al., 1988; Magazinovic et al., 2004). Given their similar physical and chemical properties, Br− is
commonly found in groundwater with sodium and chloride in coastal settings, such as Happy
Valley-Goose Bay (Davis et al., 1998; Davis et al., 2004). Therefore, the presence of Br− in raw
groundwater was likely the result of pumping a mix of saltwater and freshwater into the treatment
plan; it is also possible that sedimentary rocks made contributions. When present in raw
groundwater, Br− can react with chlorine and naturally-occurring organic matter, leading to
increasing formation of the brominated and mixed chlorinated–brominated species of THMs
(CHClBr2, CHCl2Br and CHBr3) and HAAs in drinking water (Chang et al., 2001; Chowdhury et al.,
2010). The presence of Br−, therefore, explained the dominance of these brominated and mixed
chlorinated–brominated THM species in treated water from the municipal treatment plant.
The content of Br− varied across the distribution line in the Valley area. With the exception of
household H3, Br− in tap water was commonly found in “first draw” samples at the households
closer to Sandhill reservoir (H1 and H2), while it was present in both “first draw” and “flushed”
samples towards the end of the distribution line at households H4, H5 and H6. The concentrations
of Br− were higher in “first draw” (up to 0.45 mg/L) than “flushed” samples (up to 0.25 mg/L). At
the government building H3, bromide was detected in both “first draw” and “flushed” samples
and its levels were either higher in “first draw” or in “flushed”; in both cases, the highest Br− level
obtained was 0.42 mg/L in “flushed” sample. There are no adverse health effects due to the
presence of Br− in drinking water (WHO, 2009).
Chloride
The variation of chloride (Cl−) levels in groundwater, surface water, treated and tap waters is
presented in Figure 17. The trend of Cl− is comparable to that of total hardness with regards to the
seasonal and local variations. In raw groundwater, Cl− concentrations varied over a wide range
among the wells, with the highest concentrations in Well #1 (2.29 – 715 mg/L), followed by Well #3-
4-5 (58.7 – 145 mg/L) and Well #2 (2.60 – 56.1 mg/L). As for EC and TDS, this suggests that mixed
saltwater and freshwater was pumped from Well #1 into the treatment plant. Lower Cl− level in
Well #1 was observed in the fall, whereas the level was higher during the other seasons. The
opposite was observed in Well #3-4-5, where Cl− content was lower in winter, spring and summer,
and higher in fall. Well #2 displayed similar Cl− seasonal evolution as in Well #3-4-5; however, the
obtained Cl− concentration range was narrower (Fig. 17). The seasonal changes in Cl− levels in raw
groundwater were likely due to the variation of saltwater proportion in water pumped into the

38
plant. Cl− was not present in raw surface water at the DND treatment plant, but it was found at
lower concentrations of 1.7 and 2.1 mg/L in treated water. This sudden appearance of Cl− in treated
water was likely due to reactions between the chlorine used for disinfection and elements in water
to form Cl− compounds.
Figure 17: Seasonal and spatial variations of chloride concentrations in the distribution systems. Note: The
legend is the same as in Figure 15. See sampling locations in Figure 8.
After the treatment process, Cl− content in treated water at the municipal treatment plant varied
between 233 and 292 mg/L. In the Valley area, when the blended treated water at Sandhill reservoir
included higher proportion of the water were from the municipal treatment plant in (also see Table
1), its Cl− content had a significant impact on the Cl− concentrations of tap water (spring, summer
and fall). The levels of Cl− in tap water along the distribution line showed a narrow range of
variability, from 199 to 250 mg/L. Because the percent blends of the treated waters were, in
contrast, dominated by treated water from DND treatment plant in winter (Winter 1 and Winter 2;
also see Table 1), Cl− content in tap water was significantly lower and ranged between 2.25 and
64.7 mg/L. At Household H7, which was supplied only by DND treatment plant, Cl−
concentrations ranged from 1.79 to 3.41 mg/L (Fig. 17). Negligible intra-household changes in the
levels of Cl− were observed.
39
Because of the taste concern posed by high levels of Cl− in tap water, Health Canada (2014) has
established an aesthetic-based guideline of 250 mg/L. Above that limit, consumer acceptability of
drinking-water can be hampered by the salty taste. Nevertheless, acceptability depends on the
sensitivity of the consumer and therefore, may vary among consumers. Cl− levels in treated water
from the municipality treatment plant exceeded the permissible limit in winter, spring and summer
(Fig. 17). On the other hand, Cl− concentrations in tap water, across all the seasons, distances from
the Sandhill reservoir, and sampling locations, tended to clusters near or at the permissible limit
(Fig. 17).
Chloride also has a significant influence on the corrosion of materials in the distribution system, as
well as household pipes and other plumbing materials. This may lead to detrimental consequences
by permitting the leaching of toxic metals into tap water (see section 4.5 of the text), and also may
shorten the life of household plumbing materials and water-use appliances. As already pointed
out, desalination should perhaps be considered for implementation to remove the salts, including
Cl− from the brackish groundwater.
Sulphate
Based on taste considerations, Health Canada (2014) recommends the aesthetic-based guideline
value of 500 mg/L for sulfate (SO42−) in drinking water. Moreover, SO42− concentrations exceeding
500 mg/L may cause diarrhea (Heizer et al., 1997). SO42− occurs naturally in groundwater and
surface water from the dissolution and/or oxidation of sulfate minerals in mineral deposits, soils
and rocks (e.g. shales), from seawater intrusion, or due to human activities, such as power plants
and industrial wastes (e.g., Krouse and Mayer, 1999; Seller and Canter, 1980).
Sulphate concentrations showed seasonal, intra-household/government building changes similar to
those observed for chloride concentrations and total hardness (figure not shown). SO42−
concentrations in groundwater varied among the wells, with the highest concentrations in Well #1
(1.73 – 86.6 mg/L), followed by Well #3-4-5 (7.42 – 82.6 mg/L) and Well #2 (1.86 – 7.47 mg/L). The
lower SO42− level in Well #1 was observed in the fall, while levels were high for the other seasons.
The opposite was observed in Well #3-4-5, where SO42− content was lower in winter, spring and
summer, and higher in fall. Well #2 showed similar SO42− seasonal change as in Well #3-4-5, but
with a much narrower range of SO42− concentrations. SO42− content in treated water at the
municipal treatment plant and Sandhill reservoir varied from 27.1 to 37.2 mg/L. Like chloride and
the total hardness, SO42− is likely from a natural source, i.e. the mixture of freshwater and saltwater
pumped into the plant. SO42− in raw surface water at DND treatment plant was very low and

40
reached up to 1.05 mg/L; this remained constant after treatment and at Sandhill reservoir and at
household H7 in the northern sector of the town. The level of SO42− in tap water at the distribution
line in the Valley area was influenced by the percent blend of the treated waters from the municipal
and DND treatment plants at Sandhill reservoir (see Table 1). With higher proportions of treated
water from the municipal treatment plant in spring, summer and fall, SO42− concentrations in tap
water were between 22.4 and 30.0 mg/L. In contrast, when the percent blend of the treated waters
was dominated by treated water from DND treatment plant in winter (Winter 1 and Winter 2), the
SO42− content in tap water was much lower, between 1.09 and 8.27 mg/L. Intra-household
variations were insignificant. Concentrations of SO42− were well below the Canadian aesthetic-
based guideline.
Fluoride
Fluoride (F−) occurs naturally in groundwater and surface water from many types of sedimentary
and igneous rocks. Health Canada (2014) suggests an aesthetic-based guideline value of 1.5 mg/L
for F− in drinking water. Although today exposure of humans to F− is through a variety of sources,
fluoridated drinking-water remains the principal source of the daily F− intake (WHO, 2004). The
benefits for dental health of drinking water fluoridation to increase naturally low fluoride
concentrations F− in water sources is still a matter of debate (e.g. Canadian Dental Association,
2012; Peckham and Awofeso, 2014). Nevertheless, since fluoridation of drinking water was
introduced in 1945, it has been agreed that a fluoride level of 0.7 mg/L represents the best balance
of F− in drinking water to promote dental health in both children and adults, while minimizing the
risk of excess F− intake through multiple daily sources of exposure (e.g. Griffin et al., 2007; Loskill
et al., 2013; Rabb-Waytowich, 2009; Yeung, 2007; WHO, 2004). Increase in the rates and severity of
dental caries may occur when levels fluoride in drinking water are less than 0.7 mg/L, whereas the
development of dental fluorosis (pitting and yellow to brown staining of teeth) has been linked to
long-term ingestion of higher levels of fluoride above the aesthetic-based guideline; and skeletal
and crippling fluorosis at much higher concentrations, above 4.0 mg/L (e.g. DenBesten and Li, 2011;
Health Canada, 2014; Rabb-Waytowich, 2009).
Figure 18 shows F− concentrations in groundwater, surface water (Spring Gulch), and treated and
tap water samples. When detected, F− concentrations in groundwater were, in general, very low in
all the wells and ranged from 0.04 to 1.00 mg/L. This observed range in raw groundwater remained
unchanged after the treatment process, since the municipality does not add F− to its treated water.
At the DND treatment plant, F− in raw Spring Gulch water was also low with concentration of 0.04
mg/L. However, this level increased (up to 0.58 mg/L) in treated water due to addition of a F−

41
compound, and this level remained constant in tap water served by the DND treatment plant only
(i.e. household H7, see Fig. 18). F− content at Sandhill reservoir and in tap water at the distribution
line in the Valley area was influenced by the percent blend of the treated waters from the municipal
and DND treatment plants (see Table 1). With the higher proportions of treated water from the
DND treatment plant in winter (Winter 1 and Winter 2; see Fig. 17), F− concentrations in tap water
were higher and varied between 0.34 and 0.43 mg/L. In contrast, when the percent blend of the
treated waters was dominated by treated water from the municipal treatment plant in spring,
summer and fall, the F− content in tap water was much lower and ranged from 0.09 to 0.22 mg/L.
Intra-household variations of fluoride content appears almost negligible.
Figure 18: Fluoride concentrations in the distribution systems. Note: The legend of the sampling locations is
the same as in Figure 15. Sampling locations is presented in Figure 8.
Overall, the concentrations of F− in tap water in the distribution systems at the Valley area and the
northern sector were well below the aesthetic-based guideline, below optimal promotion of dental
health (Fig. 18). For this reason, residents should be encouraged by the appropriate authorities to
use topical fluoride (e.g. fluoridated toothpaste, varnish, gel or mouth rinse) or other measures to
protect dental health, as recommended by the Canadian Dental Association (2012).
4.5. Major and trace elements
The following elements were either not detected (obtained concentrations were below their limits
of detection) or were present only in trace quantities (concentrations were close to their limits of

42
detection) in groundwater and surface water sources, and treated waters and tap water samples:
antimony (Sb), arsenic (As), barium (Ba), beryllium (Be), bismuth (Bi), boron (B), cadmium (Cd),
chromium (Cr), cobalt (Co), lithium (Li), molybdenum (Mo), phosphorus(P), selenium (Se), nickel
(Ni), silver (Ag), tellurium (Te), thallium (Tl), tin (Sn), titanium (Ti), tungsten (W), uranium (U),
vanadium (V) and Zirconium (Zr).
Elements actually detected in the analyzed water samples have been divided into three groups
based on their origin: (i) naturally-occurring elements, barium (Ba), magnesium (Mg), potassium
(K), sodium (Na), calcium (Ca), sulfur (S), strontium (Sr) and silicon (Si); (ii) Natural- and plumbing
corrosion-induced metals, iron (Fe) and manganese (Mn), and (iii) plumbing corrosion-induced
metals, copper (Cu), lead (Pb) and zinc (Zn).
4.5.1 Naturally-occurring elements
The variations of Ba, Mg, K, Na, Ca, S, Sr and Si in water samples are presented in Figure 19, 20 and
21. Their seasonal and special variations were similar to those of total hardness (Fig. 15), Cl− (Fig.
17), and SO42− and Br− (figures not shown). The variations in Ba, Mg, and K (Fig. 19), Na, Ca and S
(Fig. 20) and Sr and Si (Fig. 21) were predominantly controlled by seasonal differences in
concentration in groundwater from Well #1, Well #2 and Well #3-4-5. In addition, the percent blend
of the treated waters from the municipal and DND treatment plants at Sandhill reservoir (given in
Table 1) influenced the concentrations of these elements at taps in the Valley area. Except for Si, the
concentrations of the other elements were considerably higher in Well #1 in winter, spring and
summer compared to Well #2 and Well #3-4-5 (Figs. 19, 20 and 21). The opposite was observed in
fall, with groundwater from Well #3-4-5 containing substantially higher concentrations of Ba, Mg,
K, Na, Ca, S and Sr, followed by Well #2 and finally Well #1 (Figs. 19, 20 and 21). Groundwater Si
concentrations showed a less pronounced seasonal variation (Fig. 21). The treatment process at the
municipal treatment plant resulted in considerable reduction of these elements in the treated water.
On the other hand, the surface water source (Spring Gulch) had considerably lower contents of Ba,
Mg, K, Na, Ca, S, Sr and Si compared to groundwater supply wells; equivalent lower
concentrations were observed after treatment and in tap water supplied by the DND treatment
plant only, i.e. household H7 (Figs. 19, 20 and 21). After the mixture of the treated water occurred
at Sandhill reservoir, a higher percentage of treated water from DND treatment plant in winter
resulted in a significant dilution of Ba, Mg, K, Na, Ca, S, Sr and Si in tap water at the distribution
line in the Valley area. In contrast, the dominance in the mixture of treated water from the
municipality treatment plant in spring, summer and fall maintained the elevated concentrations in
these elements in water reaching the consumer’s taps (Figs. 19, 20 and 21).

43
Figure 19: Seasonal and spatial changes of barium, magnesium and potassium concentrations in the
distribution systems. Note: The legend of the sampling locations is the same as in Figure 15. See the sampling
locations in Figure 8.

44
Figure 20: Seasonal and spatial variations of sodium, calcium and sulfur concentrations in the distribution
systems. Notes: Sulfur was not determined in Winter 1 and Winter 2 samples. The legend of the sampling
locations is the same as in Figure 15. Sampling locations are shown Figure 8.

45
Figure 21: Seasonal and spatial variations of strontium and silicon concentrations in the distribution
systems. Note: The legend of the sampling locations is the same as in Figure 15. See the sampling locations in
Figure 8.
There are no documented adverse health effects due to the presence of Mg, Ca, K, S, Sr and Si in
drinking water and, therefore, no guidelines values have been issued for these elements (Health
Canada, 2014). Sr is, however, being reconsidered and evaluated further for establishment of
regulatory levels in drinking water by the U.S. EPA (Alfredo et al., 2014). An aesthetic-based
guideline level has been established at 200 mg/L for Na (Health Canada, 1992: 2014), because of
possible noticeable salty taste at higher concentrations; however, this limit may varies substantially
among people. For people on salt (or sodium)-restricted diet, it is suggested to consume drinking
water with less than 20 mg/L Na (Health Canada, 1992; U.S. EPA, 2003). Higher sodium

46
concentrations in tap water in the Valley area were observed (average 120 mg/L) compared to that
at household H7 (1.2 mg/L) at the northern sector, which was served only by DND treatment plant;
but all were below the Canadian aesthetic-based guideline.
4.5.2 Natural- and plumbing corrosion-induced metals
Natural- and plumbing corrosion-induced metals here refer to iron (Fe) and manganese (Mn). High
concentrations of Fe and Mn in drinking water are associated with colored (orange, red-brown or
black-brown) stains, which were one of the main reasons for drinking-water quality complaints
from customers (Fonkwe, 2015: Fonkwe and Schiff 2016; also see Fig. 1). Fe and Mn often occur
together and in higher concentrations in groundwater than surface water. While, naturally
occurring Fe and Mn in groundwater is generally the major source, because of weathering minerals
in the bedrock, human contamination from landfill leachate, sewage, and industrial wastewater
may also occur. It has also been demonstrated that depending on the chemical compositions of the
water, corrosion of cast iron and ductile iron pipes in drinking water distribution systems can
cause the formation of internal corrosion scales, especially as the pipes’ age increase, resulting in
the release of Fe and Mn into drinking water (Hallam et al., 2001; Maneesha et al., 2011; Sun et al.,
2014). The pipe materials of the water main supply line in Happy Valley-Goose Bay are made of
cast iron and ductile iron (F. Brown, pers. comm. June 09, 2014). Moreover, household pipes and
other plumbing materials can also contribute to the Fe and Mn load into tap water.
The variability of Fe and Mn in analyzed water samples is shown in Figures 22 and 23, respectively.
As expected, Fe and Mn concentrations were negligible in surface water from Spring Gulch,
reaching up to 0.10 mg/L for Fe and 0.014 mg/L for Mn. On the other hand, Fe content was much
higher in groundwater from Well #1 (up to 10.9 mg/L), followed by Well #2 (up to 6.6 mg/L) and
Well 3-4-5 (1.7 mg/L) in winter, spring and summer. In fall, the higher concentration of Fe in
groundwater was found in Well #3-4-5 (10.8 mg/L), followed by Well #1 (6.2 mg/L) and Well #2 (1.5
mg/L). This indicates seasonal variability of Fe in the groundwater supply wells. Similarly, Mn
showed higher concentrations in groundwater from Well #1 (up to 0.95 mg/L), whereas Well #2 and
Well 3-4-5 had similar Mn content, up to 0.4 mg/L in winter, spring and summer. A different Mn
trend in groundwater was observed in spring; higher concentration occurred in Well #3-4-5 (0.94
mg/L) and similar low concentration of 0.34 mg/L in Well #1 and Well #2.
Treated water (B1; see Fig. 22) had very low levels of Fe (up to 0.072 mg/L) and Mn (up to 0.034
mg/L) compare to raw groundwater (Figs. 22 and 23), demonstrating removal efficiencies higher
than 90% during treatment. Levels in tap water, however, increased with increasing distance from

47
the treatment plants or Sandhill reservoir. In general, the further a location in the Valley area was
from Sandhill reservoir, the higher the concentrations of Fe and Mn in its tap water. At the
households and the government building, the obtained concentrations of Fe and Mn were nearly
equal or equivalent in both the “first-draw” and “flushed” samples. This suggests that Fe and Mn
were released in tap water from corroded cast iron and ductile iron pipes of the main water line
(Figs. 22 and 23), and that in general, household/government building pipes and fixtures
contributed only to a small extent; this also depended upon the stagnation times of the water in the
pipes. As shown in Figure 23, much higher Mn concentrations in “first draw’ samples at household
H4 during winter and spring were due to significantly longer-stagnation times (more than 24
hours), compared to about 6 hours (or overnight) at the other locations. Fe and Mn concentrations
varied from season to season, but showed no clean trends (Figs. 22 and 23). In general, seasonal
maximum levels occurred during winter and fall for Fe and spring and fall for Mn; minimum levels
were observed during summer and fall for Fe and winter and summer for Mn.
Figure 22: Seasonal and spatial changes of iron concentrations in the distribution systems. Note: The legend
of the sampling locations is the same as in Figure 15. See the sampling locations in Figure 8.

48
Figure 23: Seasonal and spatial changes of manganese concentrations in the distribution systems. Note: The
legend of the sampling locations is the same as in Figure 15. See the sampling locations in Figure 8.
4.5.3 Plumbing corrosion-induced metals
Plumbing corrosion-induced metals in this study include copper (Cu), lead (Pb) and Zinc (Zn).
These elements were either not detected or found to be present only at very low concentrations
(close to their limits of detection) in groundwater, surface water from Spring Gulch and treated
waters from the municipal and DND treatment plants (Figs. 24, 25 and 26). However, Cu, Pb and
Zn were found at varied concentrations in tap water at the households and the government
building, depending upon housing ages in the Valley area and the northern sector (Figs. 24, 25 and
26; also see Table 2). This indicates that these metals were released by the corrosion of pipes and/or
other plumbing materials. Therefore measures to reduce water corrosivity and the exposure of tap
water to these metals should be evaluated and implemented.
Copper
Copper was detected in the “first draw” samples at concentrations well above the aesthetic-based
guideline value of 1.0 mg/L (Fig. 24; Health Canada, 2014) in all the households/government

49
building, except for household H1. The households/government building have Cu pipes and other
metal plumbing materials, whereas household H1 has plastic pipes and metal plumbing materials.
This explains the elevated levels of Cu in “first draw” samples in the former locations. Cu
concentrations did not show clear seasonal differences, whereas significant spatial (intra- and inter-
household/government building) variations in Cu content were observed (Fig. 24).
Figure 24: Seasonal and spatial changes of copper concentrations in the distribution systems. Note: The
legend of the sampling location is the same as in Figure 15. See the sampling locations in Figure 8.
On the other hand, “first draw” samples from household H1 with the plastic pipes contained lower
Cu, but higher than Cu content in the “flushed” samples, demonstrating a contribution of brass
fixtures and/or faucets to the load of Cu released in tap water (Fig. 24). In general, Cu content in
“flushed” samples increased with increasing distance from the DND treatment plant at household
H7, and from Sandhill reservoir in the Valley area at households H1, H2, H4, H5 and H6, and the
government building H3 (Fig. 24). Except at the government building H3, flushing was effective in
reducing the levels of Cu below the aesthetic-based guideline, but still in general, above the Cu
content in the blended treated water at the Sandhill reservoir. This indicates that Cu also entered
drinking water before reaching consumers’ household plumbing, while travelling through the
municipal copper pipes that connect the water main line to customers' property lines throughout

50
the town (F. Brown, pers. comm. June 09, 2014). The nearly constant high Cu levels in both the
“first draw” and “flushed” samples from the government building H3 indicate that the allowed
flushing time of five minutes did not successfully clear all the standing water in the building’s
plumbing and was therefore, ineffective in reducing the levels of Cu exposure, as observed at the
households. This is due to the greater size of the building. The effectiveness of flushing therefore
varies between the locations.
Corrosion of copper pipes can leave obvious bluish-green stains around sinks and bathroom
fixtures. At levels at or above the guideline 1.0 mg/L, Cu can also give a bitter, metallic taste to tap
water. Small amounts of Cu are essential to human health, but excess intake can cause adverse
health effects (e.g. Dietrich et al., 2004). Exposure to elevated Cu concentrations (4.0 – 7.0 mg/L) in
drinking water has been associated with gastrointestinal symptoms such as nausea, abdominal
pain, diarrhea, and vomiting in the short term (e.g. Potera, 2012). Based on limited evidence from
studies in humans, ingestion of very high concentrations of Cu over long period of time can lead to
liver and kidney damage (de Romaña et al., 2011; Stern, 2010). The long-term health effects of
copper at moderately high intake, as observed in the present study, are still not well defined.
Lead
The health-based guideline value for Pb in drinking water is 0.010 mg/L (Health Canada, 2014). Pb
was detected primarily in all “first draw” tap-water samples; but was also present in “flushed”
samples in two households, H5 and H7 and the government building H3 (Fig. 25). Pb content was
higher in the “first draw” samples than in “flushed” samples. No clear seasonal variations in Pb
concentrations were observed (Fig. 25). In contrast, the difference in lead levels within and between
the households and the government building was substantial in the Valley area, influenced mainly
by the types of plumbing materials (see Table 2). At household H5 (Winter 1 data was excluded
from analysis, because flushing instructions were not followed), Pb concentrations in “first draw”
tap water samples were up to 3.5 times higher than the health-based guideline. Pb exceedance in
“first draw” samples from the other households and the government building was sporadic and
occurred in both the Valley area and northern sector, during one sampling session in each case. At
household H1 with plastic pipes, Pb likely entered tap water from corrosion of the brass faucets or
other metallic plumbing fixtures. On the other hand, lead was, in general, not detected in “flushed”
samples. But at two households, H7 in the northern sector and H5 in the Valley area, Pb was found
in “flushed” samples at concentrations considerably less that than their corresponding “first-draw”
samples, but still exceeding the health-based guideline value in spring for H5 and fall for H7. The
results suggest that Pb in tap water solely arises from plumbing pipes and/or fixtures and faucets
in the households and the government building. They also demonstrate that although effective in

51
some cases, flushing for five minutes may not always reduce the level of lead and therefore, the
effectiveness of flushing should be verified and tailored to each household.
Figure 25: Seasonal and spatial changes of lead concentrations in the distribution systems. Notes: The legend
of the sampling location is the same as in Figure 15. Winter 1 result of household H5 was excluded because
flushing instruction was not followed. See the sampling locations in Figure 8.
Because Pb is a known cumulative toxicant (meaning that it remains in the body following
exposure), elevated lead in drinking water is a significant public health concern (Health Canada,
2007). Water lead levels have been shown to contribute significantly to blood lead levels in
humans; children under the age of 6 are especially vulnerable to the harmful health effects of Pb
(Edwards et al., 2009; Levallois et al., 2014; Ngueta et al., 2016). Lead exposure in children has been
linked to anemia, renal dysfunction, impaired hearing and postnatal growth, intellectual deficit (in
Ngueta et al., 2016). In adult, long-term lead exposure have been linked to renal dysfunction
(Loghman-Adham et al., 1997) and hypertension (Navas-Acien et al., 2007).
Lead is released in drinking water from Pb pipes (commonly in houses built before 1950),
galvanized (zinc-coated) pipes and/or lead solders (commonly in houses built before 1990), and/or

52
brass fittings or faucets, which are also found in newer houses/buildings with plastic pipes (Clark
et al., 2015; Elfland et al., 2010; Ng and Lin, 2016).
Zinc
Zinc in drinking water is not regarded as a health hazard to humans; however, the aesthetic-based
guideline level has been set at 5.0 mg/L, because of potential problems associated with taste, milky
appearance (opalescence), and the formation of greasy films at water surface upon boiling (Health
Canada, 2014).
Zinc (Zn) was found, in general, in “first draw” tap-water samples in significant amounts, whereas
“flushed” water samples typically contained small amounts, mostly below 0.1 mg/L (Fig. 26). Zn
content in “first draw” tap-water samples varied significantly, but irrespectively of the seasons and
Sandhill reservoir-to-household/government building distances in the Valley area (Fig. 26). At
household H2 and government building H3, “first draw” samples exceeded the Canadian
aesthetic-based guideline in fall, spring and summer, respectively (a “first draw” sample was not
collected for analysis in the fall at H3). The concentrations of Zn at other households were within
the aesthetic-based guideline. This suggests that the observed differences in Zn levels in tap-water
were solely controlled by the types of plumbing materials inside the households and the
government building (see Table 2). Zinc typically enters drinking water from the corrosion of
galvanized (zinc-coated) pipes and brass fittings. Flushing for five minutes was effective in
reducing the Zn level in tap water in all the households and the government building.
4.6. Stable hydrogen and oxygen isotopic compositions
Stable isotopes of hydrogen (δ2H) and oxygen (δ18O) of water have been widely used, as
complements to hydrochemical and physical data, in order investigate the origin of groundwater
and its interactions with surface water to assess groundwater recharge and vulnerability to
pollution (e.g. Clark, 2015; West et al., 2014; Yeh et al., 2014). In general, groundwater originates
from direct infiltration of water runoff from rainfall and snowmelt, or via infiltration of surface
water (lakes or rivers), or a combination of both. Groundwater recharge can also be impacted by
human activities. Since hydrogen and oxygen are components of the water molecule H2O, their
isotopic compositions in water tend to be conserved and thus ideal indicators of the origin of water
resources and the presence of potentially contaminating water sources. The water stable isotope
ratios provide a unique means to assess the long-term viability of water resources in terms of both
quantity and quality, and they are therefore essential indicators for the implementation of
strategies to achieve sustainable management (Clark, 2015; Elliot, 2014).

53
Figure 26: Seasonal and spatial changes of zinc concentrations in the distribution systems. Notes: The legend
of the sampling locations is the same as in Figure 15. “First draw” sample was not collected for analysis in
the fall at H3. See the sampling locations in Figure 8.
The results of the δ2H and δ18O analysis of groundwater, Spring Gulch water, the treated waters at
Sandhill reservoir, the Churchill River water and rainwater are plotted on a conventional δ2H and –
δ18O diagram (Fig. 27). For comparison the variation trend of Global Meteoric Water Line (GMWL;
δ2H = 8 δ18O + 10; Craig, 1961), a global average of several local meteoric water lines, is also
indicated in Figure 27. The δ2H and δ18O values of rainwater averaged respectively −76.1‰ ±
0.99‰ and −11.5‰ ± 0.32‰ and were significantly different from those of wells’ groundwater
(average −110.4‰ ± 0.47‰ δ2H and −15.1‰ ± 0.11‰ δ18O), Spring Gulch (−110.9‰ δ2H and
−15.5‰ δ18O) and the Churchill River (average −118.3‰ ± 0.37‰ δ2H and −16.1‰ ± 0.15‰ δ18O).
δ2H and δ18O data of rainwater lies along but slightly above the GMWL, indicating contribution of
the local re-evaporated (recycling) water vapor to the raining cloud. This corroborates with the
deuterium excess (or d-excess) values of rainwater, which range between 14‰ and 18‰ with a
mean value of 16‰. These values are higher than the d-access value GMWL of 10‰, which is
indicative of un-evaporated water (Craig, 1961). The d-excess, defined as d = δ2H – 8δ18O
(Dansgaard, 1964), has been widely used as isotopic indicator to assess the effect of evaporation in

54
modifying the isotopic compositions of rainwater prior to recharge of groundwater or surface
water (e.g. Clark, 2015; Lai and Ehleringer, 2010).
Figure 27: The relationships between δ2H and δ18O of the water samples. For comparison, the dashed line
shows the Global Meteoric Water Line (Craig, 1961).
The stable isotopes data of groundwater, Spring Gulch and the Churchill River are clustered on the
GMWL to the lower left corner, indicating precipitation recharge by rainfall (summer precipitation)
or snowfall (winter precipitation) or a combination of both. Their isotopic similarity may reflect the
hydraulic interconnections amongst the groundwater, Spring Gulch and the Churchill River. The
substantial depletion of δ2H and δ18O (most negative) in groundwater, Spring Gulch and the
Churchill River compared to water from rainfall likely indicates that in addition to rainwater, there
was a significant contribution from another sources of water with depleted isotopic signatures,
possibly water from snowmelt runoff in spring 2015. On the other hand, stable isotopic
compositions of both treated waters from the municipal and DND treatment plants were
representative of their groundwater and Spring Gulch sources (Fig. 27), possibly suggesting that
water had a short residence time in these reservoirs. δ2H and δ18O measurement in tap waters has
been successfully used to describe the flow of water in the human-hydrological system (Bowen et
al., 2007; Leslie et al., 2014).
This initial δ2H and δ18O results provide a basis of isotopic characteristics of groundwater, Spring
Gulch, the Churchill River and treated waters; however, considerable insight can still be gained
from this limited data. Further study is necessary to achieve a better understanding of the local
isotope hydrological characteristic and seasonality.

55
5. CONCLUDING REMARKS AND RECOMMENDATIONS
The results of this project lead to the following conclusions:
Groundwater showed a heterogeneous composition across supply wells and seasons. Water
pumped into the municipal treatment plant was a mixture of freshwater and saltwater, hard
to very hard with nearly a neutral pH range. The redox state of groundwater changed
between mildly reducing (negative ORP) and oxidizing (positive ORP) conditions.
Spring Gulch water was very distinct from groundwater, as expected; it was soft,
moderately alkaline, and characterized by oxidizing conditions.
The hydrochemical comparison between the two water sources indicates higher
concentrations of Cl−, SO42−, Ba, Mg, K, Na, S, Ca, Sr, Si, Fe, Mn and Br− in groundwater,
compared to Spring Gulch water, and very low levels of F− in both water sources.
The absence of typical landfill leachate contaminants (e.g. NO3-N, NO2-N, PO4-P, Cu, Pb
and Zn) in groundwater suggests that the former landfill located up-gradient of the
groundwater supply wells did not affect the quality of groundwater over the timeframe of
this study.
Stable isotopic compositions indicate that most recharge of groundwater, Spring Gulch, and
the Churchill River is from snowmelt runoff in spring 2015, with a small amount from
rainfall of the following summer; isotopic similarity possibly reflects hydraulic
interconnections between the groundwater, Spring Gulch and the Churchill River.
Treated waters at the municipal treatment plant shared similar trends with the “parent”
groundwater. However, treated water showed significantly lower levels of elements than
found in “parent” groundwater, while THMs dominated by CHCl3, CHCl2Br and CHBr3
with lesser amount of CHClBr2 were formed during the treatment process. The removal
efficiencies for Fe and Mn were higher than 90%.
Raw and treated Spring Gulch water shared similar physical and chemical characteristics,
except that the concentrations of F− were higher in treated water as the result of fluoridation
applied at the DND treatment plant to help promote dental health, and CHCl3 was formed
during the treatment process (the only THM species to arise).
The physical and chemical properties of the blended treated waters at Sandhill reservoir, as
well as those of the tap water along the distribution line in the Valley area, typically
reflected the proportions of the treated water that dominated in the mixture.

56
The elements with the lowest variation (both seasonal and spatial) in tap water were Cl−,
SO42−, Ba, Mg, K, Na, S, Ca, Sr, Si, Br− and F−, all originating from natural sources, except
for F−, which related to the treatment process at the DND treatment plant.
Among the elements, which displayed considerable variations (mostly spatial, i.e. within
and between the private households and the government building) were THMs formed by
the reactions between the organic matter and chlorine in water, and Fe, Mn, Cu, Pb and Zn
released by corrosion reactions with the materials of the distribution systems and plumbing
inside sampling locations. Both treated waters were corrosive, but the water from the DND
treatment plant seemed to be less corrosive than that from the municipal treatment plant.
Chloride levels at the Canada aesthetic-based guideline, in combination with high hardness
and elevated of Fe, Mn, Cu, and Zn, which locally exceeded the aesthetic-based guidelines,
likely explained the aesthetic problems detected by the consumers.
The levels of fluoride in tap water are lower than optimal for the promotion of dental
health.
Concentrations of THMs in tap water increased with increasing distance from Sandhill
reservoir in the Valley area or from the DND treatment plant in northern sector with
exceedance of the health-risk guidelines for THMs (in the Valley area) and Pb (locally in
both the Valley area and northern sector).
Although flushing, as a mitigation strategy to lower metal exposure, effectively reduced the
levels of Cu and Zn, it did not always lower the levels of Fe and Mn below the aesthetic-
based guidelines, or those of THMs and Pb below health-based guidelines.
Based on the findings of the present study, the following recommendations are appropriate:
Seasonal variability of the quality of groundwater supply wells should be taken into
account during the treatment operations.
Systematic evaluation of groundwater quality would be beneficial to better understand how
the quality of water pumped from the wells changes over (i) short (daily to monthly) and (ii)
long (seasonal to yearly) time period, so that plant operators may adjust the treatment to
changes in raw water quality. Given that the groundwater wells are located down gradient
of a former landfill, its quality must be continually monitored for contamination.
The appropriate authorities should encourage residents to use topical fluoride (e.g.
fluoridated toothpaste, varnish, gel or mouth rinse) or other measures to promote dental
health, as recommended by the Canadian Dental Association.

57
Giving that the groundwater source does not contain high levels of naturally-occurring
fluoride, the decision whether or not to add fluoride compound to drinking water at the
municipality treatment plant might warrant a re-examination and systematic reviews.
Mitigation strategies to further reduce the formation of THMs (and other DBPs) in the
treated water leaving the municipal treatment plant should be evaluated and implemented
for consistent protection from DBPs and to ensure compliance across the entire distribution
line in the Valley area.
Desalination technology should perhaps be considered to remove the dissolved salt content
from the brackish groundwater.
Measures to reduce or prevent tap water corrosivity and hardness should be evaluated and
implemented with the objectives to: (i) lower exposure to toxic metals; (ii) improve aesthetic
quality (e.g. chloride, hardness, iron and manganese); and (iii) improve consumer
satisfaction.
Since household pipes and plumbing materials are most likely to be the source of Pb (as
shown in this research), homeowners should be encouraged by the appropriate authorities
to do a two-sample test at an authorized laboratory to determine whether the tap water
contains lead (and other metals) and whether exposure can be avoided or reduced by
flushing the cold water tap for a specified length of time (e.g., five minutes).

58
REFERENCES
AECOM (2013): Hydrology of Labrador. Government of Newfoundland and Labrador,
Department of Environment and Conservation, Water Resources Management Division, pp. 68.
Available at:
http://www.env.gov.nl.ca/env/waterres/cycle/groundwater/Hydrogeology_Labrador.pdf. Last
accessed on August 10, 2016.
Agudelo-Veraa C., Blokkera M. and Pieterse-Quirijnsa I. (2014): Early warning systems to predict
temperature in the drinking water distribution network. Procedia Engineering, 70, 23–30.
Ahmad M. and Husain T. (2015): Development of predictive models for disinfectant by-products
and filtration technology assessments in small community water supply systems. Harris Centre,
Memorial University of Newfoundland. Available at:
http://www.mun.ca/harriscentre/reports/Tahir_Husain_Final.pdf. Last accessed on May 12, 2016.
Ahmad M. and Husain T. (2015): Use of activated carbon from oily fish to remove disinfectant by-
products from drinking water in small communities. Harris Centre, Memorial University of
Newfoundland. Available at: http://www.mun.ca/harriscentre/reports/Husain_RBC_Water_report-
final_12-13.pdf. Last accessed on May 12, 2016.
Alfredo K., Adams C., Eaton A., Roberson J.A. and Stanford B. (2014): The potential regulatory
implications of strontium. Journal of American Water Works Association, March 2015. Available at:
http://www.awwa.org/Portals/0/files/legreg/documents/2014AWWAStrontiumBriefingPaper.pdf.
Last accessed on July 1, 2016.
AMEC Earth and Environmental (2009) TCE plume refinement – South escarpment area, CFB 5
Wing Goose Bay, Newfoundland and Labrador. Contract no: DCC#HQ06010, Commission#75.
American Public Health Association (1999): Standard methods for the examination of water and
wastewater. Available at: http://www.umass.edu/mwwp/pdf/sm4500P-E.PDF. Last accessed on
April 12, 2016.
Appelo C.A.J. and Postma D. (2005): Geochemistry, groundwater and pollution (2nd edition).
Rotterdam, Balkema, pp. 321.
Backer L.C., Ashley D.L., Bonin M.A., Cardinali F.L., Kieszak S.M. and Wooten J.V. (2000):
Household exposures to drinking water disinfection by-products: whole blood trihalomethanes
levels. Journal of Exposure Analysis and Environmental Epidemiology, 10(4), 321–326.
Bowen G.J., Ehleringer J.R., Chesson L.A., Stange E. and Cerling T.E. (2007): Stable isotope ratios of
tap water in the contiguous United States. Water Resources Research, 43, W03419.
59
Boyalla R.L., Husain T. and Abdinazdegan A.M. (2009): Disinfection by-products in rural water
supply systems in Newfoundland: 2. Predictive Modeling. Journal of Nature Science and
Sustainable Technology, 3(2), 143–162.
Canadian Dental Association (2012): Use of fluorides in caries prevention. Canadian Dental
Association. Available at: http://www.cda-adc.ca/_files/position_statements/fluoride.pdf. Last
accessed on July 13, 2016.
Chang E.E., Lin Y.P. and Chiang P.C. (2001): Effects of bromide on the formation of THMs and
HAAs. Chemosphere, 43(8), 1029–1034.
Chisholm K., Cook A., Bower C. and Weinstein P. (2008): Risk of birth defects in Australian
communities with high Levels of brominated disinfection by-products. Environmental Health
Perspectives, 116(9), 1267–1273.
Chowdhury S., Champagne P. and McLellan J.P. (2010): Investigating effects of bromide ions on
trihalomethanes and developing model for predicting bromodichloromethane in drinking water.
Water Research, 44(7), 2349–2359.
Clark B.N., Masters S.V. and Edwards M.A. (2015): Lead release to drinking water from galvanized
steel pipe coatings. Journal of Environmental Engineering Science, 32(8), 713–721.
Clark I. (2015): Groundwater geochemistry and isotopes. CRC Press, Taylor & Francis Group, 456.
Curtis S. and El-Midany A. (2006): Water and sewage treatment. Industrial Minerals & Rocks:
Commodities, Markets, and Uses, 1259–1267.
Dansgaard W. (1964): Stable isotopes in precipitation. Tellus, 16(4), 436–468.
Davis S.N., Fabryka-Martin J.T. and Wolfsberg L.E. (2004): Variations of bromide in potable ground
water in the United States. Ground Water, 42(6), 902–909.
Davis S.N., Whittemore D.O. and Fabryka-Martin J. (1998): Uses of chloride/bromide ratios in
studies of potable water. Ground Water, 36(2), 338–350.
DenBesten P. and Li W. (2011): Chronic fluoride toxicity: Dental fluorosis. Monographs in Oral
Science, 22, 81–96.
Dietrich A.M., Glindemann D., Pizaro F., Gidi V., Olivares M., Araya M., Camper A., Duncan S.,
Dwyer S., Whelton A.J., Younos T., Subramanian S., Burlingame G.A., Khiari D. and Edwards M.
(2004): Health and aesthetic impacts of copper corrosion on drinking water. Water Science and
Technology, 49(2), 55–62.
Dietrich A. M. and Gallagher D.C. (2013): Consumer ability to detect the taste of total dissolved
solids. Journal of American Water Works Association, 105 (5), 255–263.

60
Dietrich, A. M. (2006): Aesthetic issues for drinking water. Journal of Water and Health, 4(1), 11–16.
Dion-Fortier A., Rodriguez M.J., Sérodes J. and Proulx F. (2009): Impact of water stagnation in
residential cold and hot water plumbing on concentrations of trihalomethanes and haloacetic acids.
Water Research, 43(12), 3057–3066.
Dunn G., Bakker K. and Harris L. (2014): Drinking Water Quality Guidelines across Canadian
Provinces and Territories: Jurisdictional Variation in the Context of Decentralized Water
Governance. International Journal of Environmental Research and Public Health, 11(5), 4634–4651.
Durfor C.M. and Becker E. (1964): Public water supply of the ten largest cities in the U.S. U.S.
Geological Survey, Water Supply paper 1812, pp. 364.
Edwards M., Triantafyllidou S. and Best D. (2009): Elevated blood lead in young children due to
lead-contaminated drinking water: Washington, DC, 2001−2004. Environmental Science and
Technology, 43(5), 1618−1623.
Elfland C., Scardina P. and Edwards M. (2010): Lead-contaminated water from brass plumbing
devices in new buildings. Journal of American Water Works Association, 102(11), 66–76.
Elliot T. (2014): Environmental tracers. Water 2014, 6(11), 3264–3269.
Fonkwe M.L.D. (2016): Documenting spatial and temporal variations of subsurface contaminants
using tree cores: Implications for the design of effective waste management strategies. The Harris
Centre, Memorial University of Newfoundland, St. John’s, NL, Canada, pp.45. Available at:
https://www.mun.ca/harriscentre/reports/Fonkwe_14-15_Waste.pdf. Last accessed on August 05,
2016.
Fonkwe M.L.D. and Trapp S (2016): Analyzing tree-cores to detect petroleum hydrocarbon
contaminated groundwater at a former landfill site in the remote community of Happy Valley-
Goose Bay, eastern Canadian subarctic. Environmental Science and Pollution Research, 23 (16),
16137–16151.
Fonkwe M.L.D. (2015): Assessment of municipally-supplied drinking water in the community of
Happy Valley-Goose Bay, Labrador: Preliminary results. Municipality of Happy Valley-Goose Bay,
NL.
Fonkwe M.L.D. and Schiff R. (2016): Is it safe to drink? Residents’ perceptions and hydrochemical
characteristics of municipally-supplied tap water in the Valley area of the community of Happy
Valley-Goose Bay, Labrador. (Accepted) 2016 National Water and Wastewater Conference, Toronto
(ON), November 13-16, 2016 in Toronto.
Freeze R.A. and Cherry J.A. (1979): Groundwater. Hemel Hempstead: Prentice-Hall International,
xviii + 604 pp.

61
Gale J.E., Bursey G.G., Parsons E., Seok E. and Keeping G. (2004): Use of Dual Pump Systems and
Inclined Wells to Optimize Potable Water Recovery and Hydrocarbon Remediation in Coastal
Aquifers. Fracflow Consultants Inc. Available at: http://www.bvsde.paho.org/bvsacd/cef-
2/JGduapusys.pdf. Last accessed on 17 March, 2016.
Ginige M.P., Wylie J. and Plumb J. (2011): Influence of biofilms on iron and manganese deposition
in drinking water distribution systems. Biofouling, 27(2), 151–163.
Goldhar C., Bell T. and Wolf J. (2013): Rethinking existing approaches to water security in remote
communities: An analysis of two drinking water systems in Nunatsiavut, Labrador, Canada. Water
Alternatives, 6(3): 462–486.
Gray N.F. (2008): Drinking water quality: Problems and solutions. Cambridge University Press, 2,
pp. 538.
Griffin S.O., Regnier E., Griffin P.M. and Huntley V. (2007): Effectiveness of fluoride in preventing
caries in adults. Journal of Dental Research, 86(5), 410–415.
Guilherme S. and Rodriguez M.J. (2014): Occurrence of regulated and non-regulated disinfection
by-products in small drinking water systems. Chemosphere, 117, 425–432.
Hallam N.B., West J.R., Forster C.F. and Simms J. (2001): The potential for biofilm growth in water
distribution systems. Water Research, 35(17), 4063–4071.
Handa B.K. (1969): Description and classification of media for hydrogeochemical investigations. In:
Symposium on ground water studies in arid and semiarid regions, Roorkee, India.
Hanrahan M., Sarkar A. and Hudson A. (2014): Exploring water insecurity in a Northern
indigenous community in Canada: The “never-ending job” of the Southern Inuit of Black Tickle,
Labrador. Arctic Anthropology, 51, 9–22.
Hanrahan M., Sarkar A. and Hudson A. (2015): Water insecurity in Indigenous Canada: a
community-based inter-disciplinary approach. Water Quality Research Journal of Canada, DOI:
10.2166/wqrjc.2015.010.
Health Canada (1979): Guidelines for Canadian Drinking Water Quality: Guideline Technical
Document – Hardness. Available at: http://healthycanadians.gc.ca/publications/healthy-living-vie-
saine/water-hardness-durete-eau/index-eng.php. Last accessed May 10, 2016.
Health Canada (1992): Guidelines for Canadian Drinking Water Quality: Guideline Technical
Document – Sodium. Available at: http://healthycanadians.gc.ca/publications/healthy-living-vie-
saine/water-sodium-eau/index-eng.php. Last accessed on on June 30, 2016.

62
Health Canada (2006): Guidelines for Canadian Drinking Water Quality: Guideline Technical
Document - Trihalomethanes. Available at: http://healthycanadians.gc.ca/publications/healthy-
living-vie-saine/water-trihalomethanes-eau/index-eng.php. Last accessed May 10, 2016.
Health Canada (2007): Minimizing exposure to lead from drinking water distribution systems.
Available at: http://www.hc-sc.gc.ca/ewh-semt/alt_formats/hecs-sesc/pdf/pubs/water-eau/lead-
plomb-eng.pdf. Last accessed on July 8, 2016.
Health Canada (2009): Guidelines for Canadian Drinking Water Quality: Chlorine Guideline
Technical Document. Available at: http://healthycanadians.gc.ca/publications/healthy-living-vie-
saine/water-chlorine-chlore-eau/index-eng.php. Last accessed on July 8, 2016.
Health Canada (2014): Guidelines for Canadian Drinking Water Quality—Summary Table. Water
and Air Quality Bureau, Healthy Environments and Consumer Safety Branch, Health Canada,
Ottawa, Ontario. Available at: http://www.hc-sc.gc.ca/ewh-semt/alt_formats/pdf/pubs/water-
eau/sum_guide-res_recom/sum_guide-res_recom_2014-10_eng.pdf. Last accessed on August 05,
2016.
Health Service Executive and Environmental Protection Agency (2011): Trihalomethanes in
Drinking Water. Available at:
https://www.epa.ie/pubs/advice/drinkingwater/EPA%20HSE%20Joint%20Position%20Statement%2
.0on%20TriHalomethanes%20in%20Drinking%20Water%20November%202011.pdf. Last accessed
on May 7, 2016.
Heizer W.D., Sandler R.S., Seal E., Murray S.C., Busby M.G., Schliebe B.G. and Pusek S.N. (1997):
Intestinal effects of sulfate in drinking water on normal human subjects. Digestive Diseases and
Sciences, 42(5), 1055–1061.
Hood E. (2005): Tap water and trihalomethanes: Flow of concerns continues. Environmental Health
Perspectives, 113(7), A474.
Hua G. and Reckhow D.A. (2008): DBP formation during chlorination and chloramination: effect of
reaction time, pH, dosage, and temperature. Journal of American Water Works Association, 100(8),
82–95.
Hudson H.E. and Gilcreas F.W. (1976): Health and economic aspects of water hardness and
corrosiveness. Journal of American Water Works Association, 68(4), 201–204.
Hunter E.S., Rogers E.H., Blanton M.R., Richard A.M. and Chernoff N. (2006): Bromochloro-
haloacetic acids: effects on mouse embryos in vitro and QSAR considerations. Reproductive
Toxicology, 21(3), 260–266.
International Agency for Research on Cancer (1999a): Chloroform. IARC Monographs of the
Evaluation of Carcinogenic Risks to Humans, 73, 131–182.

63
International Agency for Research on Cancer (1999b). Re-evaluation of some organic chemicals,
hydrazine and hydrogen peroxide. IARC Monographs on the evaluation of carcinogenic risks to
humans, 71, Chlorodibromomethane; pp. 1331–1338.
International Agency for Research on Cancer (2004): Monographs on the evaluation of carcinogenic
risks to humans: Some drinking-water disinfectants and contaminants, including arsenic. World
Health Organization, 84, pp. 526.
International Programme on Chemical Safety (2000): Disinfectants and disinfectant by-products.
Environmental Health Criteria 216. Geneva: World Health Organization. Available at:
http://apps.who.int/iris/bitstream/10665/42274/1/WHO_EHC_216.pdf. Last accessed on February
17, 2016.
Jadas-Hecart A., El Morer A., Stitou M., Bouillot P. and Legube B. (1992): The chlorine demand of a
treated water. Water Research, 26(8), 1073–1084.
Jardine C.G., Gibson N. and Hrudey S.E. (1999): Detection of odour and health risk perception of
drinking water. Water Science and Technology, 40(6), 91–98.
JWEL Jacques Whitford Environment Limited (1992): Environmental clean-up study, CFB 5 Wing
Goose Bay, Newfoundland and Labrador. Contract no: JWEL Project#7250.
Kim J. and Kang B. (2008): DBPs removal in GAC filter-adsorber. Water Research, 42(1-2), 145–152.
King W.D. and Marrett L.D. (1996): Case-control study of bladder cancer and chlorination by-
products in treated water (Ontario, Canada). Cancer Causes Control, 7(6), 596–604.
Kolodziej E. (2004): The bottled water story – here’s what the consumers said! Presentation at the
American Water Works. Association Annual Meeting, Orlando, FL, June 16, 2004.
Krasner S.W. and Barrett S.E. (1984): Aroma and flavor characteristics of free chlorine and
chloramines. Water Quality Technology, Denver, 381–398.
Krasner S.W., McGuire M.J., Jacangelo J.G., Patania N.L., Reagan K.M. and Aieta E.M. (1989): The
occurrence of disinfection by-products in U.S. drinking water. Journal of American Water Works
Association, 81 (8), 41–53.
Krouse H.R. and Mayer B. (1999): Sulfur and oxygen isotopes in sulphate. In: Cook PG, Herczeg
AL, editors. Environmental Tracers in Subsurface Hydrology. Kluwer; Boston, 195–231.
Lai C.T. and Ehleringer R.E. (2010): Deuterium excess reveals diurnal sources of water vapor in
forest air. Oecologia, 165(1), 213–223.
Leslie D., Welch K. and Lyons W. (2014): Domestic water supply dynamics using stable isotopes
δ18O, δD, and d-Excess. Journal of Water Resource and Protection, 6, 1517–1532.

64
Levallois P., St-Laurent J., Gauvin D., Courteau M., Prèvost M., Campagna C., Lemieux F., Nour S.,
D’Amour M. and Rasmussen P.E. (2014): The impact of drinking water, indoor dust and paint on
blood lead levels of children aged 1–5 years in Montreal (Quebec, Canada). Journal of Exposure
Science and Environmental Epidemiology, 24(2), 185–191.
Liang L. and Singer P.C. (2003): Factors influencing the formation and relative distribution of
haloacetic acids and trihalomethanes in drinking water. Environmental Science and Technology,
37(13), 2920–2928.
Lightfoot T. J. (2014): “We got it good here”: Exploring the drinking water system in Makkovik,
Nunatsiavut. Grenfell Campus Memorial University of Newfoundland. Available at:
http://nlwater.ruralresilience.ca/wp-content/uploads/2014/11/Makkovik-Short-Community-
Profile_FINAL.pdf. Last accessed on July 25, 2016.
Lin T.R. and Hoang S.W. (2000): Inhalation exposure to THMs from drinking water in south
Taiwan. Science of the Total Environment, 246(1), 41–49.
Liu G., Verberk J.Q. and Van Dijk J.C. (2013): Bacteriology of drinking water distribution systems:
an integral and multidimensional review. Applied Microbiology and Biotechnology, 97(21), 9265–
9276.
Liu Y. and Yamanaka T. (2012): Tracing groundwater recharge sources in a mountain-plain
transitional area using stable isotopes and hydrochemistry. Journal of Hydrology, 464/465, 116–126.
Liverman D.G.E. (1997): Quaternary geology of the Goose Bay area: Current Research, Department
of Mines and Energy, Geological Survey, Newfoundland and Labrador, Report 97-1: 173–182.
Loghman-Adham M. (1997): Renal effects of environmental and occupational lead exposure.
Environmental Health Perspectives, 105(9), 928−938.
Loskill P., Zeitz C., Grandthyll S., Thewes N., Muller F., Bischoff M., Herrmann M. and Jacobs K.
(2013): Reduced adhesion of oral bacteria on hydroxyapatite by fluoride treatment. Langmuir,
29(18), 5528–5533.
Mackey E.D., Baribeua H., Crozes G.F., Suffet I.H. and Piriou P. (2004): Public thresholds for
chlorinours flavors in U.S. tap water. Water Science Technology, 49(9), 335–340.
Magazinovic R.S., Nicholson B.C., Mulcahy D.E. and Davey D.E. (2004): Bromide levels in natural
waters: its relationship to levels of both chloride and total dissolved solids and the implications for
water treatment. Chemosphere, 57(4), 329–335.
Makris K.C., Andra S.S. and Botsaris G. (2014): Pipe scales and biofilms in drinking-water
distribution systems: Undermining finished water quality. Critical Reviews in Environmental
Science and Technology, 44 (13), 1477–1523.

65
McGuire M. (1995): Off-flavor as the consumer's measure of drinking water safety. Water science
and technology, 31(11), 1–8.
McGuire M.J., Jacangelo J.G., Patania N.L., Reagan K.M. and Aieta E.M. (1989): The occurrence of
disinfection by-products in US drinking water. Journal of American Water Works Association,
81(8), 41–53.
McMahon P.B. and Chapelle F.H. (2008): Redox processes and water quality of selected principal
aquifer systems. Ground Water, 46(2), 259–271.
Medema G.J., Payment P., Dufour A., Robertson W., Waite M., Hunter P., Kirby, R. and Andersson
Y. (2003): Safe drinking water: an ongoing challenge. In: Assessing microbial safety of drinking
water. (Eds.) IWA publishing, UK, 2003: 11–36.
Minnes S. and Vodden K. (2014): Exploring solutions for sustainable rural drinking water systems:
A study of Newfoundland and Labrador drinking water system. Memorial University of
Newfoundland. Available at: http://www.mun.ca/harriscentre/Rural_Water_Report.pdf. Last
accessed on February 17, 2016.
Moermana A., Blokkera M., Vreeburga J. and van der Hoekb J.P. (2014): Drinking water
temperature modelling in domestic systems. Procedia Engineering, 89, 143–150.
Mohamadshafiee M.R. and Taghavi L. (2012): Health effects of trihalomethanes as chlorinated
disinfection by products: A review article. International Journal of Environmental, Chemical,
Ecological, Geological and Geophysical Engineering, 6(8), 545−551.
Najm I., Patania N.L., Jacangelo J.G. and Krasner S.W. (1994): Evaluating surrogates for disinfection
by-products. Journal of American Water Works Association, 86(6), 98–106.
Navas-Acien A., Guallar E., Silbergeld E.K. and Rothenberg S.J. (2007): Lead exposure and
cardiovascular disease–A systematic review. Environmental Health Perspectives, 115(3), 472−482.
Ng D.Q. and Lin Y.P. (2016): Evaluation of lead release in a simulated lead-free premise plumbing
system using a sequential sampling approach. International Journal of Environmental Research
and Public Health, 13(3), 1–15.
Ngueta G., Abdous B., Tardif R., St-Laurent J. and Levallois P. (2016): Use of a cumulative exposure
Index to estimate the impact of tap water lead concentration on blood lead levels in 1- to 5-year-old
children (Montréal, Canada). Environmental Health Perspectives, 124(3), 388–395.
Nieuwenhuijsen M.J., Toledano M.B., Eaton N.E., Fawell J. and Elliott P. (2000): Chlorination
disinfection byproducts in water and their association with adverse reproductive outcomes: a
review. Occupational and Environmental Medicine, 57, 73–85.

66
Nikolaou A.D., Golfinopoulos S.K., Lekkas T.D. and Kostopoulou M.N. (2004): DBP levels in
chlorinated drinking water: effect of humic substances. Environmental Monitoring and
Assessment, 93(1-3), 301–319.
NL Water Resources Management Division (2011): Drinking Water Quality Sampling Program for
the Town of Happy Valley-Goose Bay, Newfoundland and Labrador, May 2010 to February 2011.
Government of Newfoundland and Labrador, Department of Environment and Conservation,
Water Resources Management Division, pp. 16. Available at: http://www.happyvalley-
goosebay.com/home/files/pg/drinking_water_quality_in_happy_valley_goose_bay_final_report.pd
f. Last accessed on August 10, 2016.
Nuckols J.R., Ashley D.L., Lyu C., Gordon S.M., Hinckley A.F. and Singer P. (2005): Influence of tap
water quality and household water use activities on indoor air and internal dose levels of
trihalomethanes. Environmental Health Perspectives, 113(7), 863–870.
Nunn G.A.G. and van Nosttrand T. (1996): Geology of the Kenemich River map area (NTS
13G/SW), Labrador, Department of Mines and Energy, Geological Survey, Newfoundland and
Labrador, Report 96-1:73–83.
Patterson K.S. (2010): A review of water fluoridation. Alberta Health, office of the chief medical
officer of health. Available at: http://www.health.alberta.ca/documents/Water-Fluoridation-Report-
2010.pdf. Last accessed on July 15, 2016.
Peckham S. and Awofeso N. (2014): Water fluoridation: A critical review of the physiological effects
of ingested fluoride as a public health intervention. The Scientific World Journal, Article ID 293019,
10. http://dx.doi.org/10.1155/2014/293019.
Pfaff J.D. (1993): Method 300.0 Determination of inorganic anions by ion chromatography. U.S.
Environmental Protection Agency. Available at: https://www.epa.gov/sites/production/files/2015-
08/documents/method_300-0_rev_2-1_1993.pdf. Last accessed on April 12, 2016.
Potera C. (2004): Copper in drinking water: Using symptoms of exposure to define safety.
Environmental Health Perspectives, 112(10), 568–569.
Powell J.C., Hallam N.B., West J.R., Forster C.F. and Simms J. (2000): Factors which control bulk
chlorine decay rates. Water Research, 34, 117–126.
Price D., Iddon B. and Wakefield B.J. (1988): Bromine compounds: Chemistry and applications.
Amsterdam; New York: Elsevier, pp. 442.
Puget S., Beno N., Chabanet C., Guichard E. and Danguin T.T. (2010): Tap water consumers differ
from non-consumers in chlorine flavor acceptability but not sensitivity. Water Research, 44(3), 956–
964.

67
Rabb-Waytowich D. (2009): Water fluoridation in Canada: Past and present. Available at:
www.cda-adc.ca/jcda/vol-75/issue-6/451.html. Accessed on June 21, 2016.
Rao N.S., Rao P.S., Reddy G.V., Nagamani M. and Vidyasagar G., and Satyanarayana N.L. (2012):
Chemical characteristics of groundwater and assessment of groundwater quality in Varaha River
Basin, Visakhapatnam District, Andhra Pradesh, India. Environmental Monitoring and
Assessment, 184(8), 5189–5214.
Rice E.W., Baird R.B., Eaton A.D. and Clesceri L.S. (2012): Standard methods for the examination of
water and wastewater. American Public Health Association. Washington, DC.
Richardson S.D. (2002): The role of GC-MS and LC-MS in the discovery of drinking water
disinfection by-products. Journal of Environmental Monitoring, 4(1), 1–9.
Richardson S.D., Plewa M.J., Wagner E.D., Schoeny R. and Demarini D.M. (2007): Occurrence,
genotoxicity, and carcinogenicity of regulated and emerging disinfection by-products in drinking
water: a review and roadmap for research. Mutation Research, 636, 178–242.
Rodriguez M.J. and Sérodes J.B. (2001): Spatial and temporal evolution of trihalomethanes in three
water distribution systems. Water Research, 35(6), 1572–1586.
Rodriguez M.J., Sérodes J.B. and Levallois P. (2004): Behavior of trihalomethanes and haloacetic
acids in a drinking water distribution system. Water Research, 38(20), 4367–4382.
Romaña D.L., Olivares M., Uauy R., and Araya M. (2011): Risks and benefits of copper in light of
new insights of copper homeostasis. Journal of Trace Elements in Medicine and Biology, 25(1), 3–
13.
Rook J.J. (1974): Formation of haloforms during chlorination of natural waters. Water Treatment
Examination, 23, 234–243.
Sarkar A., Hanrahan M. and Hudson A. (2015): Water insecurity in Canadian indigenous
communities: some inconvenient truths. Rural and Remote Health 15(4):3354.
Scheili A., Rodriguez M.J. and Sadiqb R. (2015): Seasonal and spatial variations of source and
drinking water quality in small municipal systems of two Canadian regions. Science of the Total
Environment, 508, 514–524.
Seller L.E. and Canter L.W. (1980): Sulfates in surface and ground water. National Center for
Ground Water Research; Norman, Oklahoma.
Sengupta P. (2013): Potential health impacts of hard water. International Journal of Preventive
Medicine, 4(8), 866–875.

68
Singer P. (1994): Control of disinfection by-products in drinking water. Journal of Environmental
Engineering, 120(4), 727–744.
Smith R.B., Edwards S.C., Best N., Wright J., Nieuwenhuijsen M.J. and Toledano M.B. (2016): Birth
weight, ethnicity, and exposure to trihalomethanes and haloacetic acids in drinking water during
pregnancy in the born in Bradford Cohort. Environmental Health Perspectives, 124(5), 681–689.
Spellman F.R. (2013): Handbook of water and wastewater treatment plant operations. CRC Press, 3,
pp. 923.
Stern B.R. (2010): Essentiality and toxicity in copper health risk assessment: Overview, update and
regulatory considerations. Journal of Toxicology and Environmental Health, 73(2-3), 114–127.
Sun H., Shi B., Lytle D.A., Bai Y. and Wang D. (2014): Formation and release behavior of iron
corrosion products under the influence of bacterial communities in a simulated water distribution
System. Environmental Science: Processes & Impacts, 16(3), 576–585.
Tardiff R.G., Carson M.L. and Ginevan M.E. (2006): Updated weight of evidence for an association
between adverse reproductive and developmental effects and exposure to disinfection by-products.
Regulatory Toxicology and Pharmacology, 45(2), 185–205.
Toroz I. and Uyak V. (2005): Seasonal variations of trihalomethanes (THMs) in water distribution
networks of Istanbul City. Desalination, 176, 127–141.
U.S. Environmental Protection Agency (1974): Method 310.2: Alkalinity (Colorimetric, Automated,
Methyl Orange) by Autoanalyzer. Available at: https://www.epa.gov/sites/production/files/2015-
08/documents/method_310-2_1974.pdf. Last accessed on April 12, 2016.
U.S. Environmental Protection Agency (1994): Method 200.8, Revision 5.4: Determination of Trace
Elements in Waters and Wastes by Inductively Coupled Plasma – Mass Spectrometry. Available at:
https://www.epa.gov/sites/production/files/2015-08/documents/method_200-8_rev_5-4_1994.pdf.
Last accessed on August 5, 2016.
U.S. Environmental Protection Agency (1995): Method 551.1, Revision 1.0: Determination of
chlorination disinfection by-products, chlorinated solvents, and halogenated pesticides/herbicides
in drinking water by liquid-liquid extraction and gas chromatography with electron-capture
detection. Available at: https://www.epa.gov/sites/production/files/2015-06/documents/epa-
551.1.pdf. Last accessed on August 5, 2016.
U.S. Environmental Protection Agency (2003): Drinking water advisory: Consumer acceptability
advice and health effects analysis on sodium. U.S. Environmental Protection Agency,
Washington,DC. Available at: https://www.epa.gov/sites/production/files/2014-
09/documents/support_cc1_sodium_dwreport.pdf. Last accessed on June 30, 2016.

69
Uyak V. and Toroz I. (2005): Enhanced coagulation of disinfection by-products precursors in
Istanbul water supply. Environmental Technology, 26(3), 261–266.
Valvasori A., Fonkwe, M.L.D., Piercey J.S. and Conliffe J. (2015): Orthomagmatic Fe-Ti-V oxide
mineralization hosted in Paleoproterozoic anorthosite in the Cape Caribou River Allochthon,
Grenville Province, Southeast Labrador: Preliminary Results, Current Research, Department of
Natural Resources, Geological Survey of Newfoundland and Labrador, Report 15-1:125–138.
Villanueva C.M., Cantor K.P., Cordier S., Jaakkola J.J., King W.D., Lynch C.F., Porru S. and
Kogevinas M. (2004): Disinfection by-products and bladder cancer: a pooled analysis.
Epidemiology, 15(3), 357–367.
Villanueva C.M., Cantor K.P., Grimalt J.O., Malats N., Silverman D., Tardon A., Garcia-Closas R.,
Serra C., Carrato A., Castaño-Vinyals G., Marcos R., Rothman N., Real F.X., Dosemeci M. and
Kogevinas M. (2007): Bladder cancer and exposure to water disinfection by-products through
ingestion, bathing, showering, and swimming in pools. American Journal of Epidemiology, 165(2),
148–156.
Walter R.L., Lin P.H., Edwards M. and Richardson R.E. (2011): Investigation of factors affecting the
accumulation of vinyl chloride in polyvinyl chloride piping used in drinking water distribution
systems. Water Research, 45(8), 2607–2615.
Wardle R.J. and Ash C. (1986): Geology of the Goose Bay-Goose River area, Current Research,
Mineral Department of Mines and Energy, Geological Survey, Newfoundland and Labrador,
Report 86-1:113–123.
Wells C. (2013): 5 Wing Goose Bay Remediation Project: A case study in sustainability? RPIC
Federal Contaminated Sited Regional Workshop, Halifax, Nova Scotia June 19, 2013:
http://www.rpic ibic.ca/documents/RPIC_FCS_REG_2013/Presentations/9_WellsC_E.pdf. Last
accessed on Accessed on October 8, 2013.
West A.G., February E.C. and Bowen G.J. (2014): Spatial analysis of hydrogen and oxygen stable
isotopes (“isoscapes”) in ground water and tap water across South Africa. Journal of Geochemical
Exploration, 145, 213–222.
White J.P., Murphy L. and Spence N. (2012): Water and indigenous peoples: Canada’s Paradox. The
International Indigenous Policy Journal, 3(3), 1−25.
Williams D., LeBel G. and Benoit F. (1997): Disinfection by-products in Canadian drinking water.
Chemosphere, 34(2), 299–316.
World Health Organization (1979): Sodium, chlorides and conductivity in drinking-water. Report
on a WHO Working Group, The Hague 1-5 May 1978. Regional Office for Europe, Copenhagen, 2,
63.

70
World Health Organization (2004a): Fluoride in drinking-water: Background document for
development of WHO Guidelines for Drinking-water Quality. Available at:
http://www.who.int/water_sanitation_health/dwq/chemicals/fluoride.pdf. Last accessed on May
25, 2016.
World Health Organization (2004b): Trihalomethanes in drinking-water: Background document for
development of WHO guidelines for Drinking-water Quality. Available at:
http://www.who.int/water_sanitation_health/dwq/chemicals/en/trihalomethanes.pdf. Last accessed
on May 7, 2016.
World Health Organization (2008): Guidelines for drinking-water quality, vol. 1: recommendations,
3rd edition. World Health Organization, Available at:
http://www.who.int/water_sanitation_health/dwq/gdwq3rev/en/. Accessed on June 21, 2016.
World Health Organization (2009): Bromide in drinking-water: Background document for
development of WHO Guidelines for Drinking-water Quality. Available at:
http://www.who.int/water_sanitation_health/dwq/chemicals/Fourth_Edition_Bromide_Final_Janua
ry_2010.pdf. Accessed on June 21, 2016.
World Health Organization (2011): Guidelines for drinking-water quality – 4th Edition. Available at:
http://www.who.int/water_sanitation_health/publications/2011/dwq_guidelines/en/. Last accessed
on August 5, 2016.
World Health Organization (2011): Hardness in drinking-water: Background document for
development of WHO Guidelines for Drinking-water Quality. Available at:
http://www.who.int/water_sanitation_health/dwq/chemicals/hardness.pdf. Accessed on June 21,
2016.
Yeh F.H., Lee C. H. and Hsu K. C. (2011): Oxygen and hydrogen isotopes for the characteristics of
groundwater recharge: a case study from the Chih-Pen Creek basin, Taiwan. Environmental Earth
Sciences, 62(2), 393–402.
Yeh H.F., Lin H.I., Lee C.H., Hsu K.C. and Wu C.S. (2014): Identifying seasonal groundwater
recharge using environmental stable isotopes. Water, 6, 2849–2861.
Yeung C.A. (2008): A systematic review of the efficacy and safety of fluoridation. Journal of
Evidence Based Dental, 9(2), 39–48.
Zack A.L. (1988): A well system to recover usable water from a freshwater-saltwater aquifer in
Puerto Rico. United States Geological Survey Water-Supply Paper 2328. Available at:
https://pubs.er.usgs.gov/publication/wsp2328. Last accessed on July 7, 2016.
Zhu C. and Schwartz W.F. (2011): Hydrogeochemical processes and controls on water quality and
water management. Elements, 7, 169–174.

71
Zwiener C. (2006): Trialomethanes (THMs), Haloacetic acids (HAAs), and emerging disinfection
by-products in drinking water. In: Organic pollutants in the water cycle: Properties, occurrence,
analysis and environmental relevance of polar compounds. T. Reemtsma and M. Jekel (Editors),
Wiley-VCH Verlag GmbH and Co. KGaA, Weinheim, FRG.

72
APPENDIX
Letters of support from partners organizations