Embed Size (px)
Citation preview
DRILLING THROUGH GAS HYDRATE FORMATIONS: POSSIBLE
PROBLEMS AND SUGGESTED SOLUTIONS
A Thesis
by
AFOLABI AYOOLA AMODU
Submitted to the Office of Graduate Studies of
Texas A&M University
in partial fulfillment of the requirements for the degree of
MASTER OF SCIENCE
August 2008
Major Subject: Petroleum Engineering
DRILLING THROUGH GAS HYDRATE FORMATIONS: POSSIBLE
PROBLEMS AND SUGGESTED SOLUTIONS
A Thesis
by
AFOLABI AYOOLA AMODU
Submitted to the Office of Graduate Studies of
Texas A&M University
in partial fulfillment of the requirements for the degree of
MASTER OF SCIENCE
Approved by:
Chair of Committee, Catalin Teodoriu
Committee Members, Hans Juvkam-Wold
Jerome Schubert
Gioia Falcone
Patrick Muana
Head of Department, Stephen A. Holditch
August 2008
Major Subject: Petroleum Engineering
iii
ABSTRACT
Drilling through Gas Hydrate Formations: Possible Problems and Suggested Solutions.
(August 2008)
Afolabi Ayoola Amodu,
B.S., University of Lagos, Nigeria
Chair of Advisory Committee: Dr Catalin Teodoriu
Gas hydrate research in the last two decades has taken various directions ranging
from ways to understand the safe and economical production of this enormous resource
to drilling problems. as more rigs and production platforms move into deeper waters to
its environmental impact on global warming and cooling. Gas hydrates are ice-like
structures of a water lattice with cavities, which contain guest gases. Gas hydrates are
stable at low temperatures and high pressures. The amount of energy trapped in gas
hydrates all over the world is about twice the amount found in all recoverable fossil fuels
today.
This research identifies the problems facing the oil and gas industry as it drills in
deeper waters where gas hydrates are present and suggests solutions to some of the
problems. The problems considered in this research have been approached from a drilling
point of view. Hence, the parameters investigated and discussed are drilling controlled
parameters. They include rate of penetration, circulation rate and drilling fluid density.
The rate of penetration in offshore wells contributes largely to the final cost of the
iv
drilling process. These 3 parameters have been linked in the course of this research in
order to suggest an optimum rate of penetration.
The results show the rate of penetration is directly proportional to the amount of
gas released when drilling through gas hydrate. As the volume of gas released increases,
the problems facing the drilling rigs, drilling crew and environment is seen to increase.
The results also show the extent of risk to be expected while drilling through gas hydrate
formations. A chart relating the rate of penetration, circulation rate and effective mud
weight was used to select the optimum drilling rate within the drilling safety window.
Finally, future considerations and recommendations in order to improve the
analyses presented in this work are presented. Other drilling parameters proposed for
future analysis include drill bit analysis with respect to heat transfer and the impact of
dissociation of gas hydrate around the wellbore and seafloor stability.

v
DEDICATION
I would like to dedicate this work to God, for giving me the strength and
guidance. To my late mum, for the awesome training she gave and the ever fighting spirit
she bestowed upon me. To my dad, first for being my friend and secondly for his support
both mentally and financially and to my siblings for always being a shoulder to rest on.
vi
ACKNOWLEDGEMENTS
I would like to express my sincere gratitude to Dr. Catalin Teodoriu, chair of my
graduate committee, for his continuous support and drive through out this work. His
contribution in guiding me and constantly being available to discuss my problems cannot be
overemphasized in the success of this work.
To Dr. Juvkam-Wold and Dr. Schubert, I say a big thank you for always willing to
listen, and discuss my progress and ideas. Your experience and support is highly
appreciated.
To Dr. Falcone and Dr. Muana, thank you for taking out time to be on my graduate
committee.
To Damola, Nyasha, Shelly, Kelly, Yomi, Faith, Olayide, Mowunmi and Wola, you
guys have been great friends. Your support out of class has been the driving force to return
to class every other day.
To Seun, Olisa, Jide and Bimbo, my brothers, I’ve come a long way with you guys,
thanks.
To my fellow students at Texas A&M University, it has been a lovely two years
studying with all of you. I would not have enjoyed going to school in Aggieland without the
likes of you guys. Finally, I would like to thank Texas A&M University for the wonderful
education I have received. Thank you all.
vii
TABLE OF CONTENTS
Page
ABSTRACT .............................................................................................................. iii
DEDICATION .......................................................................................................... v
ACKNOWLEDGEMENTS ...................................................................................... vi
TABLE OF CONTENTS .......................................................................................... vii
LIST OF FIGURES................................................................................................... ix
LIST OF TABLES .................................................................................................... xi
CHAPTER
I INTRODUCTION TO GAS HYDRATES ....................................... 1
1.1 Properties and Characteristics of Gas Hydrates .......................... 2
1.2 Stability of Gas Hydrates ............................................................ 4
1.3 Formation and Production of Gas Hydrates ................................ 7
1.4 Location of Gas Hydrates............................................................ 9
II DRILLING THROUGH GAS HYDRATES .................................... 11
2.1 Gas Hydrate Problems in the Industry ........................................ 11
2.2 Case Studies: Notable Hydrate Problems in Deepwater
Drilling ........................................................................................ 12
2.2.1 Case 1 .............................................................................. 12
2.2.2 Case 2 .............................................................................. 14
2.2.3 Case 3 .............................................................................. 17
2.3 New Drilling Solutions through Gas Hydrate Formations.......... 21
2.4 Research Objectives .................................................................... 25
2.5 Research Significance ................................................................. 26
III DRILLING FLUID ADDITIVES AND CHARACTERISTICS
FOR GAS HYDRATE APPLICATIONS......................................... 28
3.1 Selection Criteria for Drilling Fluids .......................................... 28
3.2 State of the Art Drilling Fluid Design ......................................... 29
3.2.1 Effect of Polar and Surface Active Additives on
Hydrate Formation ......................................................... 30
viii
CHAPTER Page
3.2.2 Kinetic Inhibitors and Crystal Modifiers ........................ 31
3.2.3 New Design for Hydrate Fluid Inhibition ....................... 32
3.3 Dissociation of Gas Hydrate and Entry of Gas into Drilling
Fluids ........................................................................................... 33
IV DRILLING HYDRAULICS PROPERTIES/PARAMETERS .........35
4.1 Drilling Fluids .............................................................................36
4.1.1 Drilling Fluid Properties..................................................37
4.2 Rate of Penetration ......................................................................38
4.3 Circulation Rate...........................................................................41
4.4 Depth of Gas Hydrate Sediments ................................................41
4.5 Drilling Hydraulics......................................................................46
V RESULTS AND DISCUSSION .......................................................51
VI CONCLUSIONS AND RECOMMENDATIONS............................62
6.1 Conclusions .................................................................................62
6.2 Recommendations and Future Work...........................................65
REFERENCES..........................................................................................................67
APPENDIX A ...........................................................................................................70
APPENDIX B ...........................................................................................................72
APPENDIX C ...........................................................................................................74
VITA .........................................................................................................................75
ix
LIST OF FIGURES
FIGURE Page
1.1 Gas hydrate mounds seen on the seafloor of the Gulf of Mexico ....................... 2
1.2 Physical structure/composition of hydrates......................................................... 3
1.3 Graph showing the depth-temperature zone in which methane hydrates are
stable in both permafrost region and outer continental margin marine setting... 6
1.4 Graph showing the relative stability of S1, SII and SH structures of hydrates
with respect to pressure and temperature ............................................................ 7
1.5 Various morphological forms of natural gas hydrate occurrence ....................... 9
1.6 Location of known and inferred gas hydrate occurrences................................... 10
2.1 Pictorial representation of some notable problems encountered while drilling
through gas hydrate formation ............................................................................ 12
2.2 Wellbore sketch for Case 1 ................................................................................. 14
2.3 Wellbore sketch for Case 2 ................................................................................. 17
2.4 Localization of gas hydrate in tree cap................................................................ 19
2.5a ROV photo of the TCRT on the Christmas tree prior to pumping the
SGN fluids........................................................................................................... 20
2.5b ROV photo of the TCRT on the Christmas tree surrounded by nitrogen gas
bubbles from the SGN reactions ......................................................................... 20
2.6a Various field developments to avoid drilling through gas hydrate formations.
3D Placemarks with wellhead set to 3000m, yellow dot represents well head,
red dot represents end of tubing and brown line represents simulation of
tubing................................................................................................................... 24
2.6b Various field developments to avoid drilling through gas hydrate formations.
Kuparuk River Unit 3D with 300ft thick hydrate at 2000ft below wellhead
Pad....................................................................................................................... 24
x
FIGURE Page
2.7 Flowchart showing the thought process of this thesis work. The dotted ellipse
highlights the main focus of the research............................................................ 26
4.1 Shows various locations of gas hydrate sediments around the world with
the depth of gas hydrate zone with respect to water depth.................................. 43
5.1 Prediction of hydrate gas volume shows a linear relationship with rate of
penetration ........................................................................................................... 52
5.2 Prediction of gas volume as a function of ROP for both downhole and seabed
conditions ............................................................................................................ 53
5.3 Prediction of variation of volume of gas with ROP for downhole, seafloor
and surface conditions ......................................................................................... 54
5.4 Prediction of mud weight as a function of circulation rate for various ROP ...... 56
5.5 Prediction of variation of mud weight with rate of penetration and circulation
Rate...................................................................................................................... 60
xi
LIST OF TABLES
TABLE Page
4.1 Gas hydrate sample data from the GOM (characterizing natural gas hydrates
in deep water Gulf of Mexico..………………………………………………...45
5.1 Change in effective mud weight as a function of rate of penetration and
circulation rate for randomly selected hydrates properties …………………….57
5.2 Change in effective mud weight as a function of rate of penetration and
circulation rate for extreme case of selected hydrate properties ……………….59
1
CHAPTER I
INTRODUCTION TO GAS HYDRATES
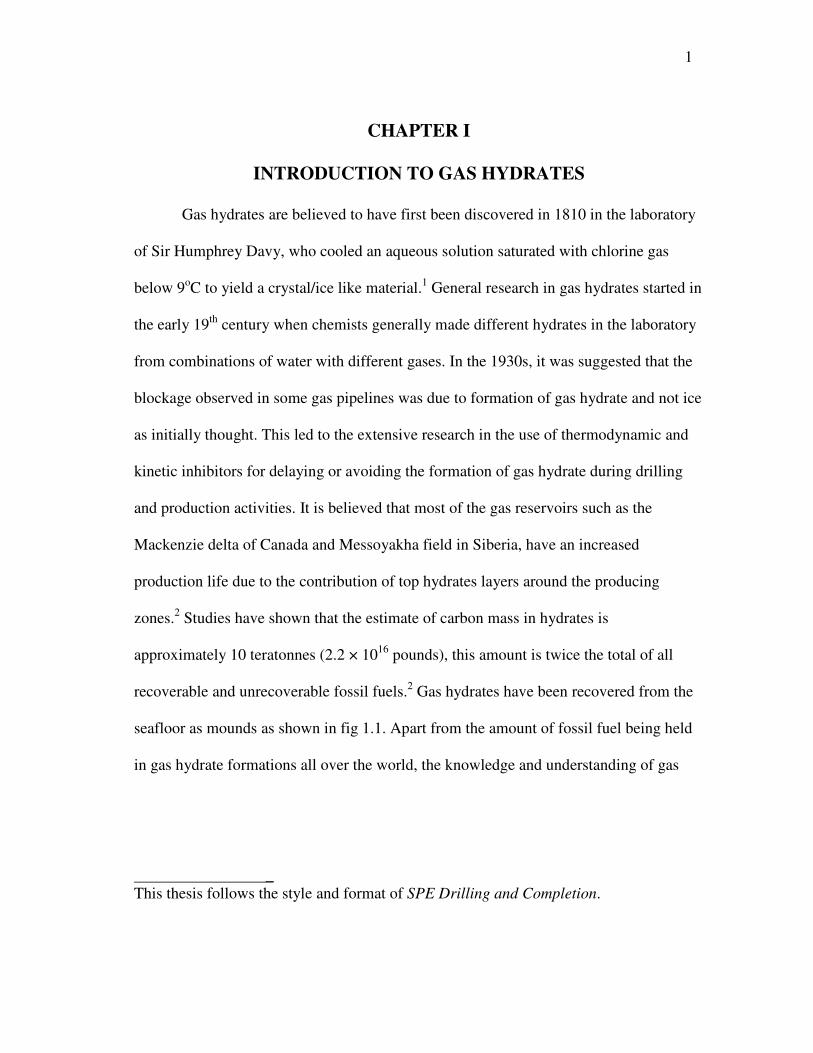
Gas hydrates are believed to have first been discovered in 1810 in the laboratory
of Sir Humphrey Davy, who cooled an aqueous solution saturated with chlorine gas
below 9oC to yield a crystal/ice like material.
1 General research in gas hydrates started in
the early 19th
century when chemists generally made different hydrates in the laboratory
from combinations of water with different gases. In the 1930s, it was suggested that the
blockage observed in some gas pipelines was due to formation of gas hydrate and not ice
as initially thought. This led to the extensive research in the use of thermodynamic and
kinetic inhibitors for delaying or avoiding the formation of gas hydrate during drilling
and production activities. It is believed that most of the gas reservoirs such as the
Mackenzie delta of Canada and Messoyakha field in Siberia, have an increased
production life due to the contribution of top hydrates layers around the producing
zones.2 Studies have shown that the estimate of carbon mass in hydrates is
approximately 10 teratonnes (2.2 × 10¹⁶
pounds), this amount is twice the total of all
recoverable and unrecoverable fossil fuels.2 Gas hydrates have been recovered from the
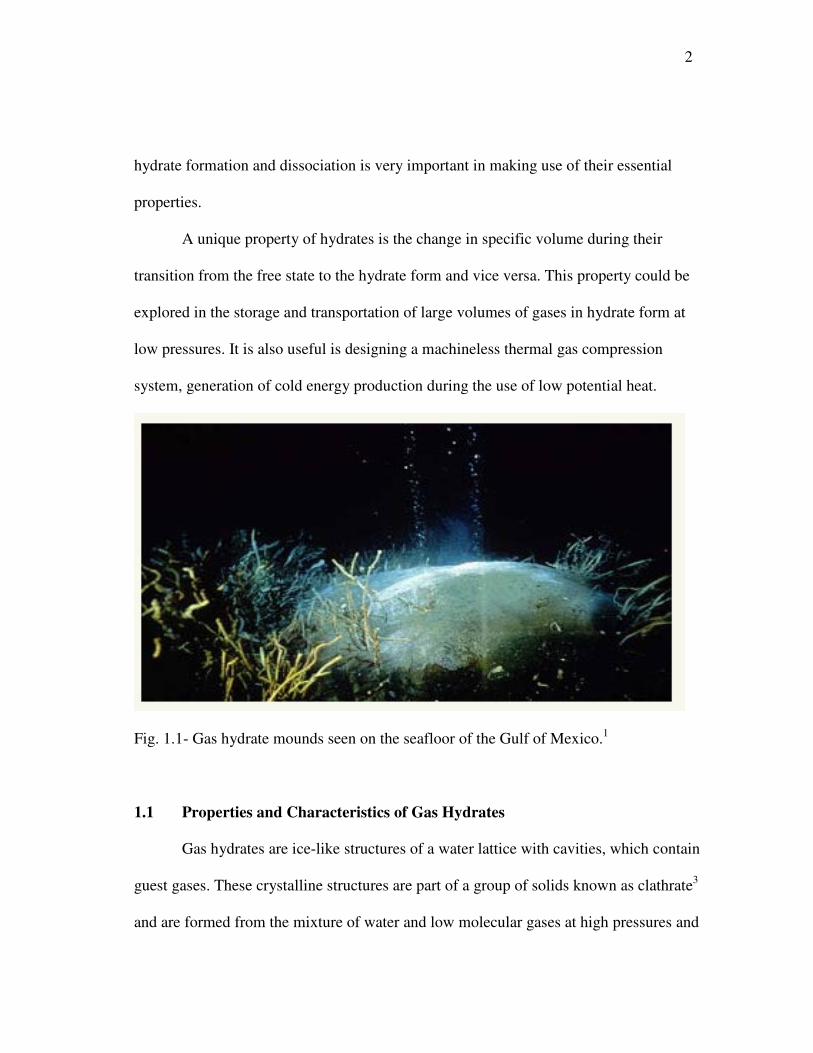
seafloor as mounds as shown in fig 1.1. Apart from the amount of fossil fuel being held
in gas hydrate formations all over the world, the knowledge and understanding of gas
_
This thesis follows the style and format of SPE Drilling and Completion.
2
hydrate formation and dissociation is very important in making use of their essential
properties.
A unique property of hydrates is the change in specific volume during their
transition from the free state to the hydrate form and vice versa. This property could be
explored in the storage and transportation of large volumes of gases in hydrate form at
low pressures. It is also useful is designing a machineless thermal gas compression
system, generation of cold energy production during the use of low potential heat.
Fig. 1.1- Gas hydrate mounds seen on the seafloor of the Gulf of Mexico.1
1.1 Properties and Characteristics of Gas Hydrates
Gas hydrates are ice-like structures of a water lattice with cavities, which contain
guest gases. These crystalline structures are part of a group of solids known as clathrate3
and are formed from the mixture of water and low molecular gases at high pressures and
3
low temperatures. Gases likely to combine with water to form hydrates include light
alkanes (methane and iso-butane), carbon dioxide, hydrogen sulfide, nitrogen, oxygen
and argon.
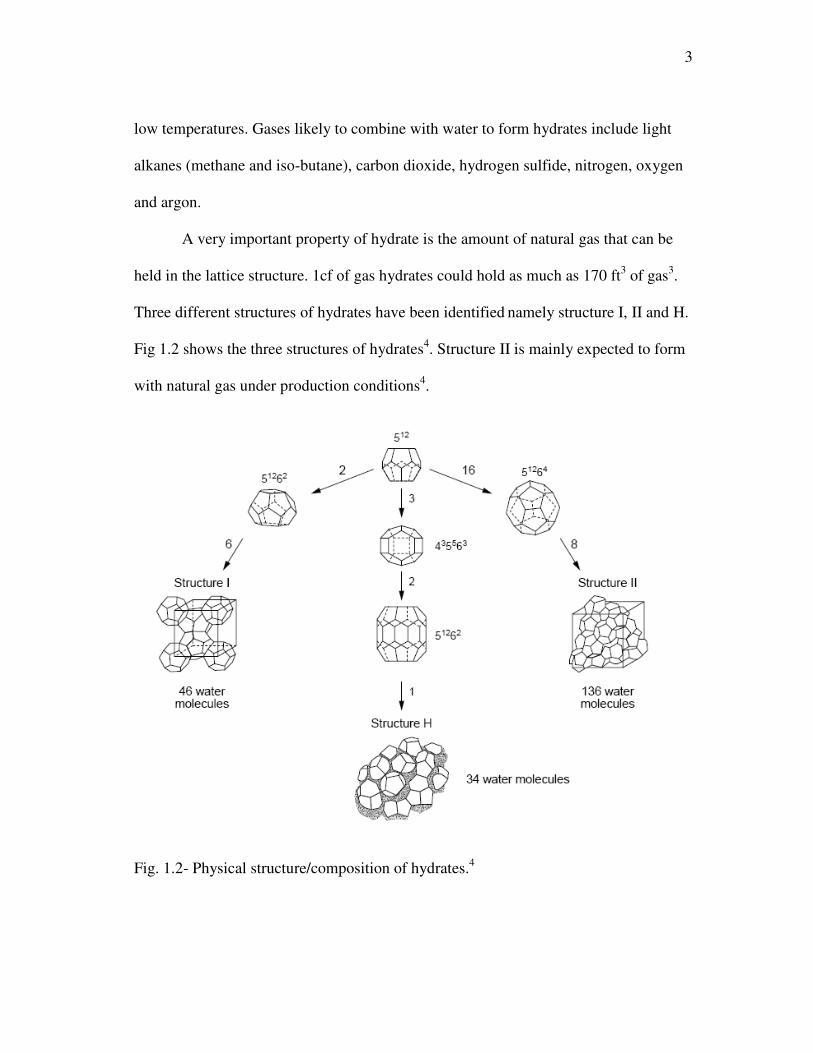
A very important property of hydrate is the amount of natural gas that can be
held in the lattice structure. 1cf of gas hydrates could hold as much as 170 ft3 of gas
3.
Three different structures of hydrates have been identified namely structure I, II and H.
Fig 1.2 shows the three structures of hydrates4. Structure II is mainly expected to form
with natural gas under production conditions4.
Fig. 1.2- Physical structure/composition of hydrates.4
4
1.2 Stability of Gas Hydrates
The conditions necessary for the stability of gas hydrates are moderately low
temperatures and moderately high pressures. These conditions could exist offshore in
shallow depths below the ocean floor and onshore beneath the permafrost. The
geothermal gradient of the earth increases the pressure requirement for the stability of
the hydrates at a much greater rate than that provided by the available increased pressure
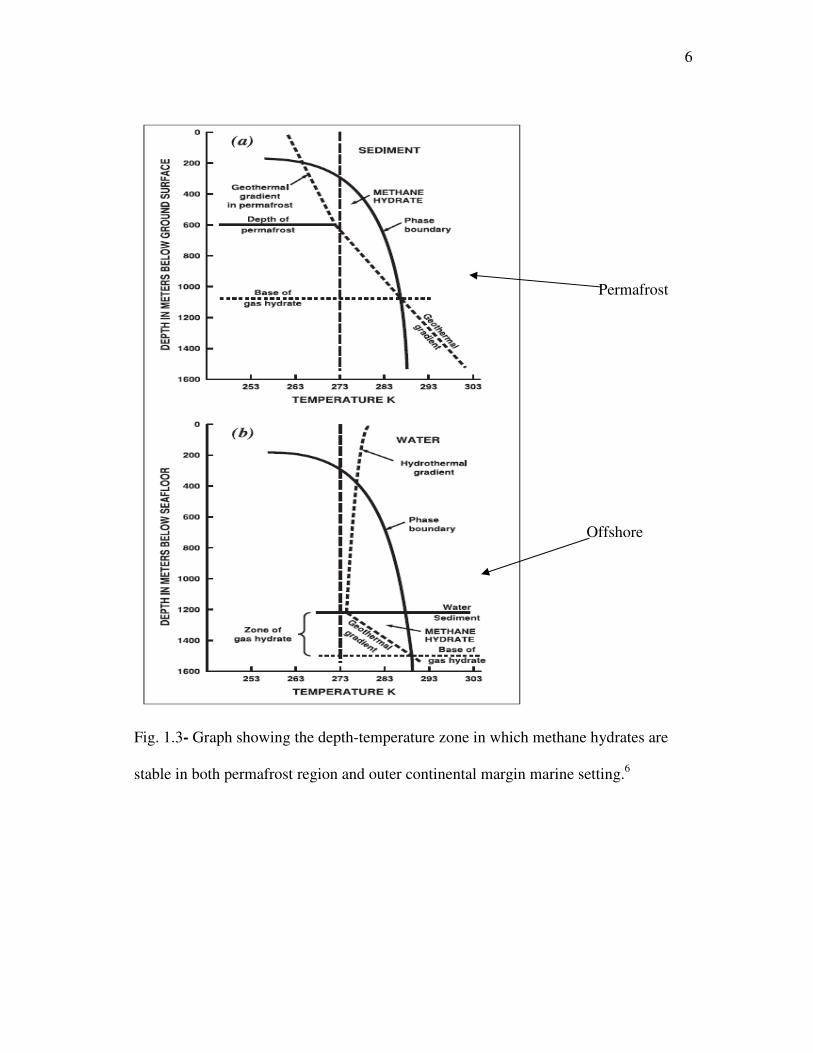
from the hydrostatic gradient. In oceanic conditions, temperatures are too warm and
pressures are too low for hydrates to form, but as we move down the water column,
temperature drops and an inflection in the temperature curve is reached (Fig 1.3). This
inflection is known as the main thermocline, which separates the warm surface waters
from the deeper cold waters. From the point where the temperature curve crosses the
phase boundary curve, downward temperatures are cool enough and pressures are high
enough to allow the methane hydrate to be stable in the ocean. There are certain depths
at which gas hydrates would be stable.
In permafrost regions, where surface temperatures are well below freezing
points, gas hydrates are present and stable at depths ranging from 1640 ft to 6560 ft,
while under offshore conditions, gas hydrates stability zones usually extend 328 ft to
1640 ft below the ocean floor4. The stability of gas hydrate offshore in specific places
5
has been seen to extend up to 6560 ft (Makogun, 1974) below the seafloor. These
hydrates are known as high temperature gas hydrate deposits. The gas hydrate stability
zone (GHSZ) is defined by the hydrate forming gas and by the temperature. The gas
pressure is usually equal to the external pressure which is equal to the sum of the
hydrostatic and lithostatic pressure5. The gas hydrate stability zone is known to have a
lower base, a point beyond which gas hydrates become unstable as the depth increases.
The precise location of this point under known pressure and temperature conditions vary
with a number of factors, the most important factor being gas chemistry. The various
temperature and pressure profile for the 3 known hydrate structure is shown in fig 1.4. In
places such as the Gulf of Mexico, at a pressure equivalent of 8200ft, the base GHSZ
will occur at about 21oC for pure methane hydrates, about 23
oC for a typical mixture
(methane 93%, ethane 4%, propane 1% and other higher hydrocarbon) and 28oC for a
possible mixture of methane 62%, ethane 9%, propane 23% and other hydrocarbons5.
These differences in the temperature cause major shifts in the depths to the base of the
GHSZ. Below the GHSZ, methane and water would exist independently and gas
hydrates would not be formed. This is shown in fig 1.3.
6
Fig. 1.3- Graph showing the depth-temperature zone in which methane hydrates are
stable in both permafrost region and outer continental margin marine setting.6
Offshore
Permafrost
7
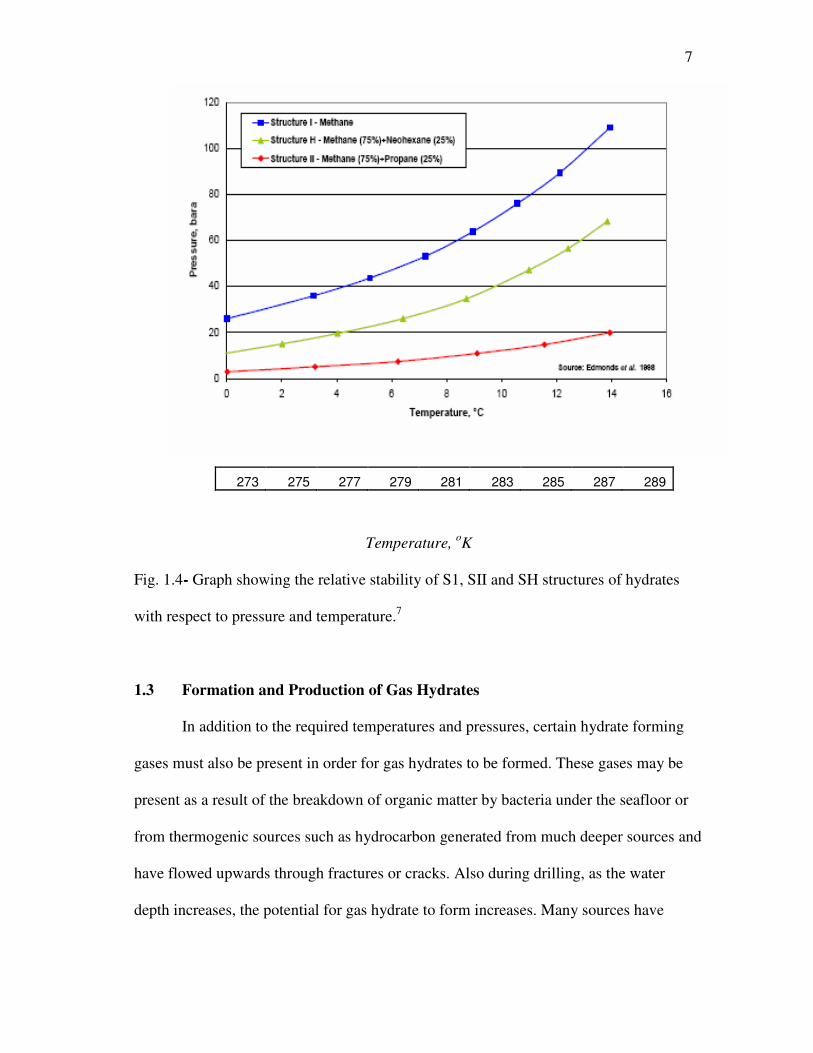
Temperature, oK
Fig. 1.4- Graph showing the relative stability of S1, SII and SH structures of hydrates
with respect to pressure and temperature.7
1.3 Formation and Production of Gas Hydrates
In addition to the required temperatures and pressures, certain hydrate forming
gases must also be present in order for gas hydrates to be formed. These gases may be
present as a result of the breakdown of organic matter by bacteria under the seafloor or
from thermogenic sources such as hydrocarbon generated from much deeper sources and
have flowed upwards through fractures or cracks. Also during drilling, as the water
depth increases, the potential for gas hydrate to form increases. Many sources have
273 275 277 279 281 283 285 287 289
8
suggested that the main source of naturally occurring hydrate is biogenic2. Methane
hydrate, which makes up most of the naturally occurring hydrates, is composed of
roughly 6 molecules of water for each molecule of methane. The decomposition reaction
can be given as follows:
(CH4.6H20) solid (CH4) gas + 6(H20) liquid
The energy generated from the hydrate gas dissociation is about 10 times the
energy required to dissociate the hydrate in typical reservoirs. The excess energy is what
is required in commercial quantity in the industry. In order to produce the gas from
hydrates sources, the following conditions must be met:
• The pressure and temperature of the hydrate must be brought outside the stability
zones
• The energy required for the endothermic reaction must be sustained
• A special means of transfer of the products of decomposition (gas) to the
production wells must be designed (to ensure gas hydrates are not formed within
the lines).
• There dissociation needs to be monitored in order to avoid seafloor collapse.
For gas hydrates to accumulate in the region of fluid discharge, two basic
mechanisms are known, firstly, hydrate can form from precipitation of water where a
saturated solution moves to a zone of lower temperature and secondly, hydrate can form
in static pore water in the hydrate formation zone by reaction with percolating free gas
that has migrated into its presence from hydraulically subjacent zones. Overcooling and
oversaturation of water by gas, relative to equilibrium values is required to initiate
9
hydrate formation and hydrate accumulation. The kinetically most favorable conditions
for hydrate formation and accumulation (i.e. the greatest possible oversaturation and
overcooling) occur in the uppermost part of the sedimentary cover and on the sea floor5.
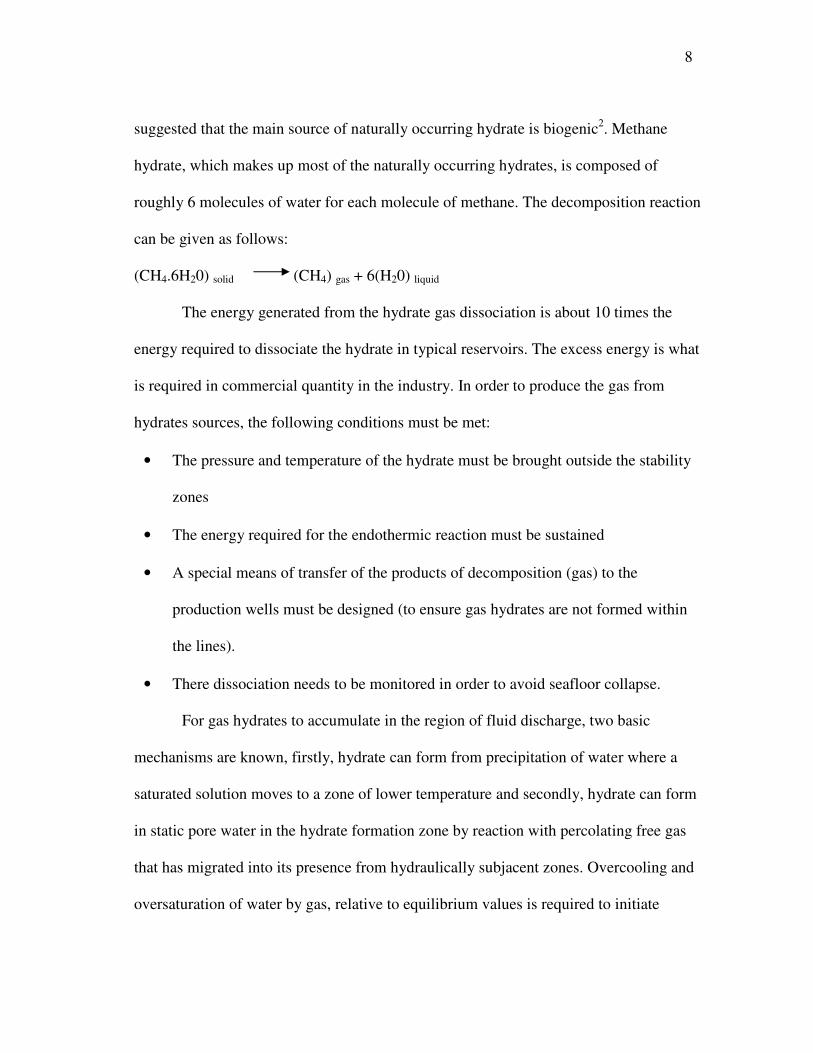
Figure 1.5 is an illustration of the possible configurations of hydrates8. In coarse grained
sediments, methane hydrates are formed as disseminated grains and pore fillings but in
finer silt/clay deposits, it commonly appears as nodules and veins8.
Fig. 1.5- Various morphological forms of natural gas hydrate occurrence.8
1.4 Location of Gas Hydrates
Most of the discovered hydrates have been with the aid of geophysical models. A
seismic signature known as the bottom simulating reflector (BSR) is often used to
determine the hydrate bearing location in marine environments. This technique relies
10
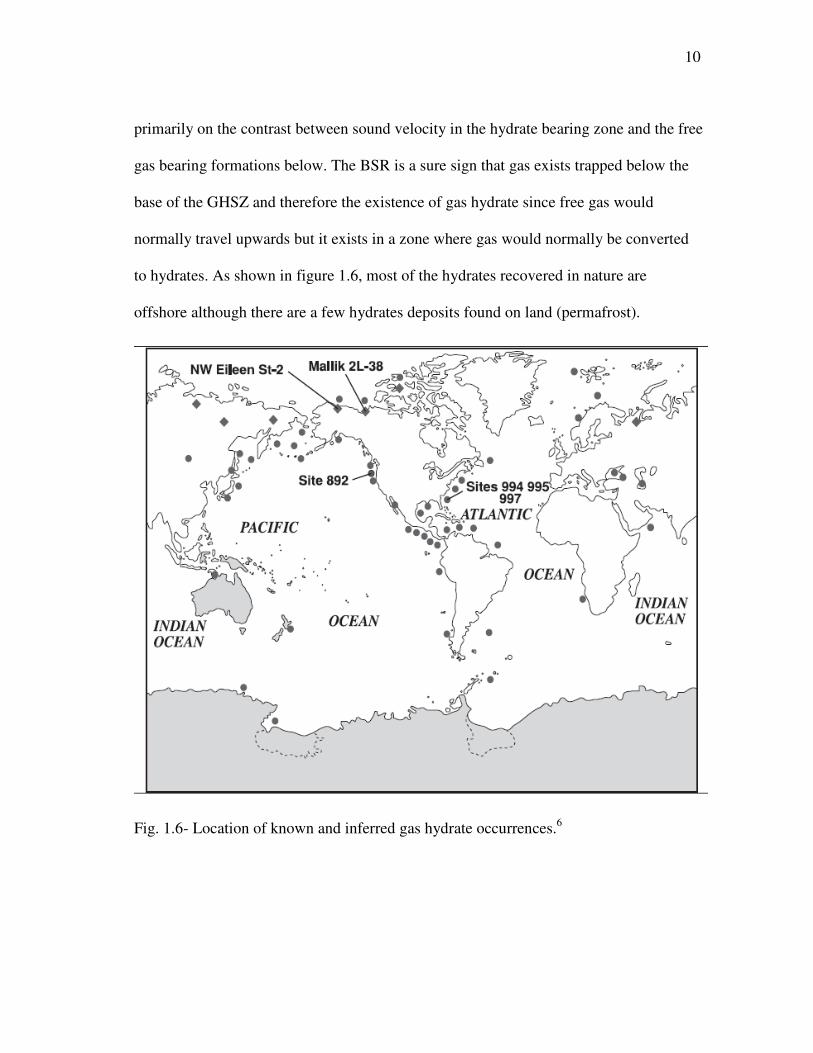
primarily on the contrast between sound velocity in the hydrate bearing zone and the free
gas bearing formations below. The BSR is a sure sign that gas exists trapped below the
base of the GHSZ and therefore the existence of gas hydrate since free gas would
normally travel upwards but it exists in a zone where gas would normally be converted
to hydrates. As shown in figure 1.6, most of the hydrates recovered in nature are
offshore although there are a few hydrates deposits found on land (permafrost).
Fig. 1.6- Location of known and inferred gas hydrate occurrences.6
11
CHAPTER II
DRILLING THROUGH GAS HYDRATES
2.1 Gas Hydrate Problems in the Industry
Drilling of deeper wells has increased greatly in the last 20 years. The potential
of gas hydrate formation has been recognized in a few of these wells. Drilling of an oil
or gas well can be described as a series of operations or drilling activities, each
performed to achieve a particular task. There are various problems encountered in the
course of a drilling operation through gas hydrate formation especially in deepwater or
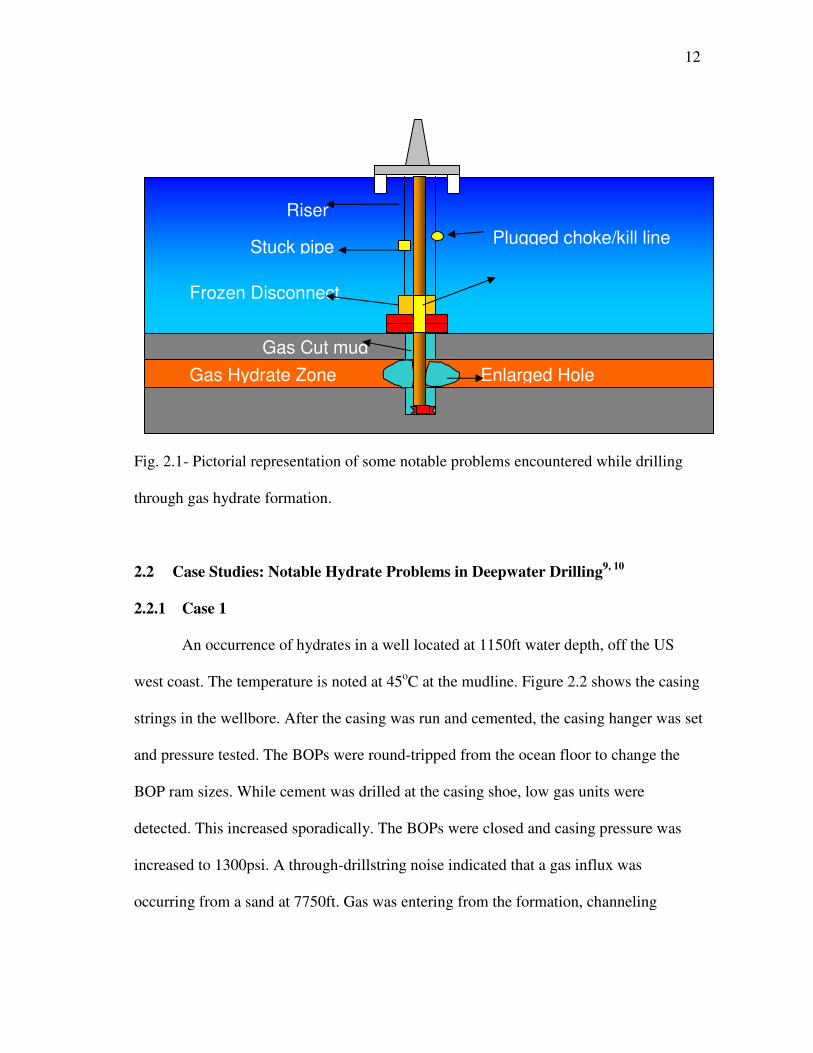
offshore. Some of the notable/possible problems encountered during drilling through gas
hydrate formation are shown pictorially in Fig 2.1 and explained below:
• Choke and Kill-line plugging: This causes difficulty in the use of the lines during
well circulation
• Plug formation at or below the blow out preventers (BOP): Well-pressure
monitoring below the BOPs becomes impossible or difficult
• Plug formation around the drillstring in the riser, BOPs or casing: Makes the
drillstring movement a problem
• Plug formation between the drillstring and BOPs: This causes problems in the full
closure of the BOPs when necessary
• Plug formation in the ram cavity of the BOPs: Causes difficulty in opening the
BOPs fully.
12
Fig. 2.1- Pictorial representation of some notable problems encountered while drilling
through gas hydrate formation.
2.2 Case Studies: Notable Hydrate Problems in Deepwater Drilling9, 10
2.2.1 Case 1
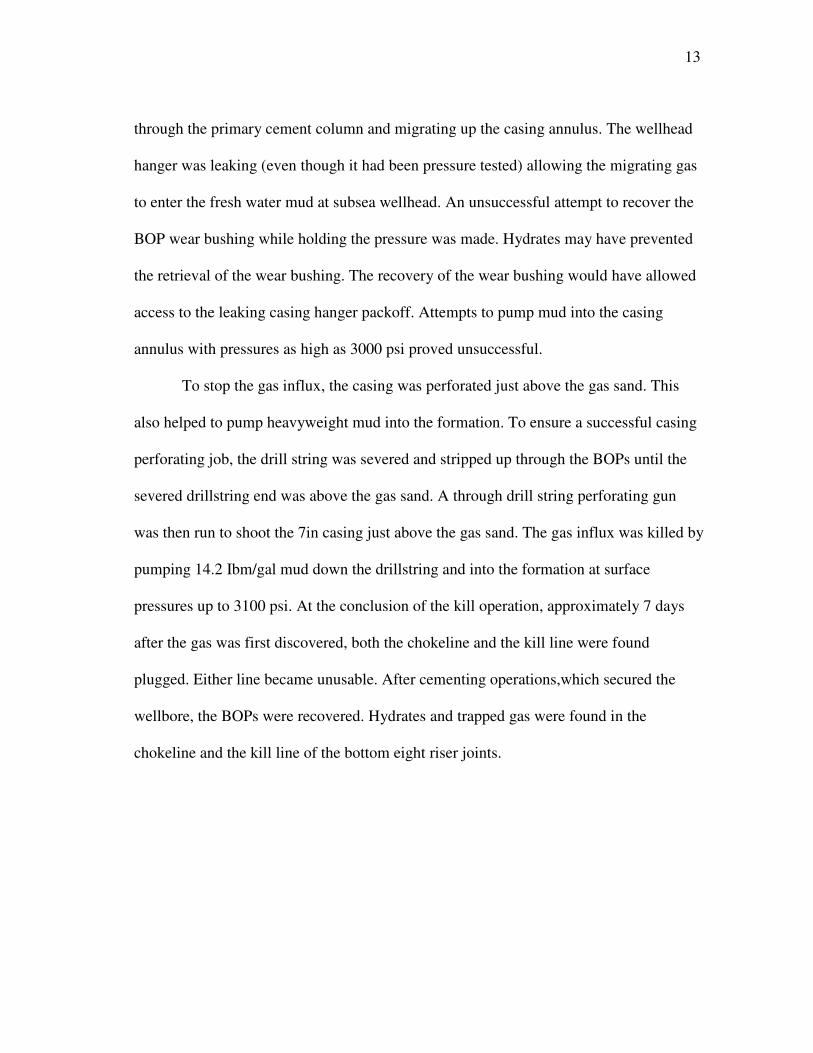
An occurrence of hydrates in a well located at 1150ft water depth, off the US
west coast. The temperature is noted at 45oC at the mudline. Figure 2.2 shows the casing
strings in the wellbore. After the casing was run and cemented, the casing hanger was set
and pressure tested. The BOPs were round-tripped from the ocean floor to change the
BOP ram sizes. While cement was drilled at the casing shoe, low gas units were
detected. This increased sporadically. The BOPs were closed and casing pressure was
increased to 1300psi. A through-drillstring noise indicated that a gas influx was
occurring from a sand at 7750ft. Gas was entering from the formation, channeling
Plugged choke/kill line
Riser
Stuck pipe
Frozen Disconnect
Gas Hydrate Zone Enlarged Hole
Gas Cut mud
13
through the primary cement column and migrating up the casing annulus. The wellhead
hanger was leaking (even though it had been pressure tested) allowing the migrating gas
to enter the fresh water mud at subsea wellhead. An unsuccessful attempt to recover the
BOP wear bushing while holding the pressure was made. Hydrates may have prevented
the retrieval of the wear bushing. The recovery of the wear bushing would have allowed
access to the leaking casing hanger packoff. Attempts to pump mud into the casing
annulus with pressures as high as 3000 psi proved unsuccessful.
To stop the gas influx, the casing was perforated just above the gas sand. This
also helped to pump heavyweight mud into the formation. To ensure a successful casing
perforating job, the drill string was severed and stripped up through the BOPs until the
severed drillstring end was above the gas sand. A through drill string perforating gun
was then run to shoot the 7in casing just above the gas sand. The gas influx was killed by
pumping 14.2 Ibm/gal mud down the drillstring and into the formation at surface
pressures up to 3100 psi. At the conclusion of the kill operation, approximately 7 days
after the gas was first discovered, both the chokeline and the kill line were found
plugged. Either line became unusable. After cementing operations,which secured the
wellbore, the BOPs were recovered. Hydrates and trapped gas were found in the
chokeline and the kill line of the bottom eight riser joints.
14
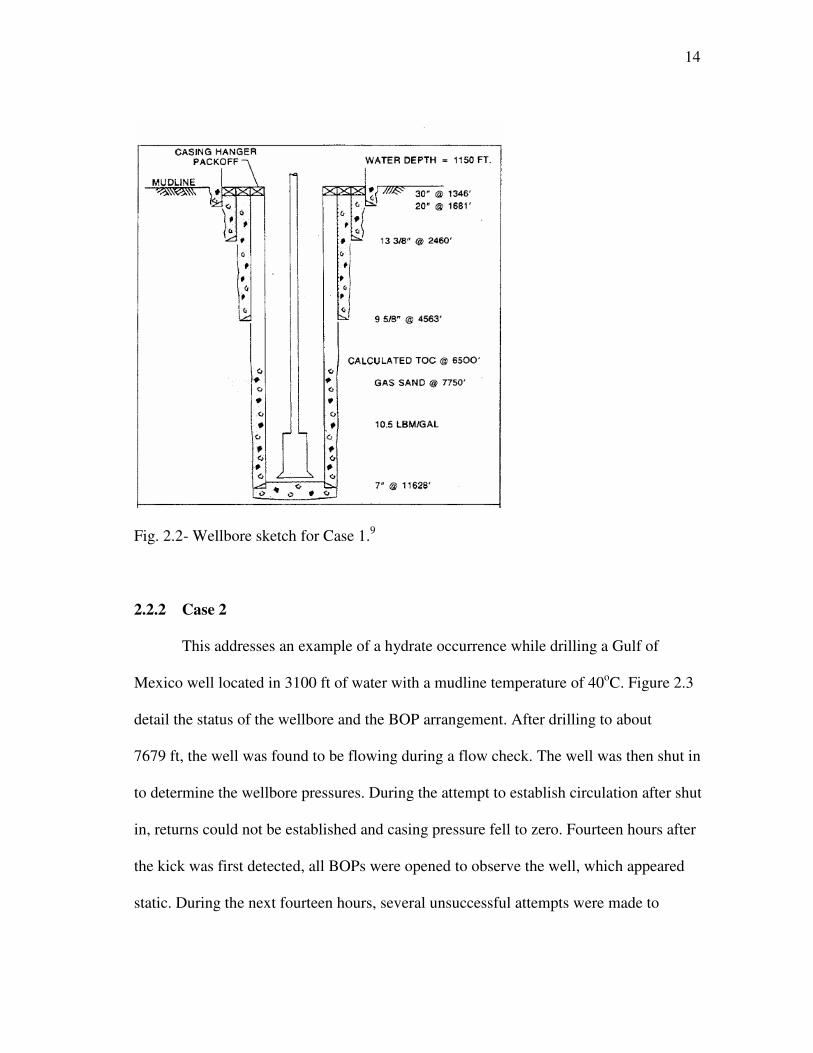
Fig. 2.2- Wellbore sketch for Case 1.9
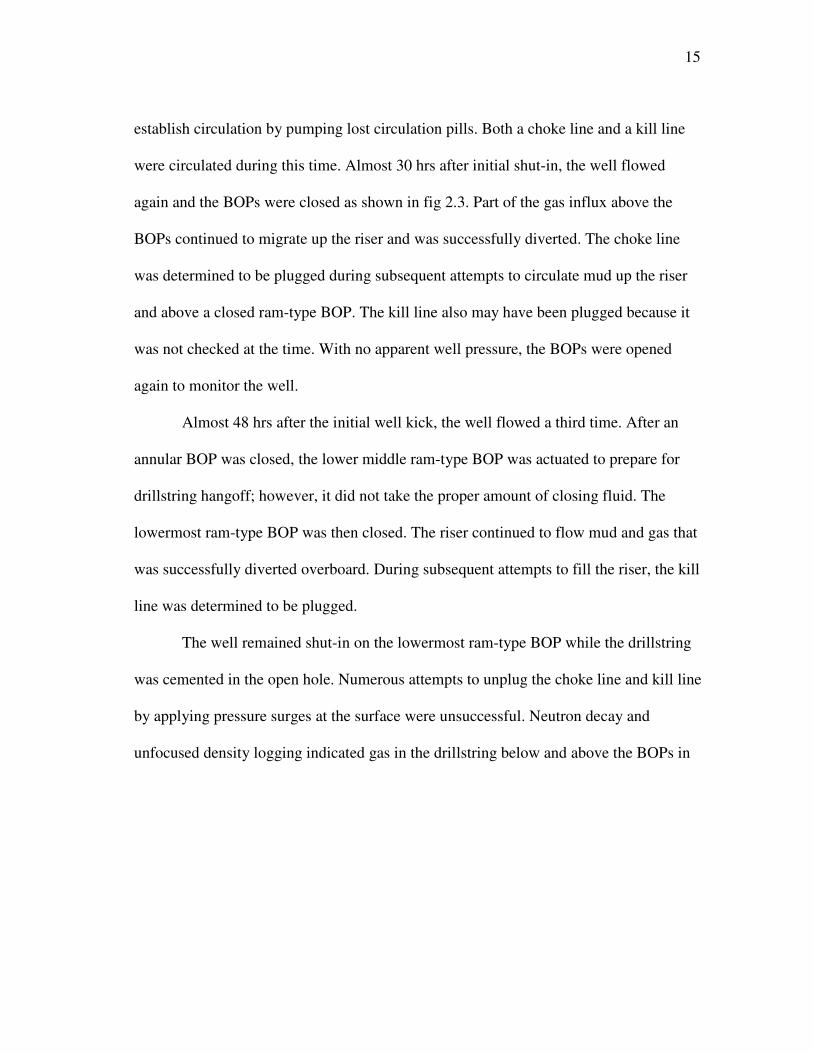
2.2.2 Case 2
This addresses an example of a hydrate occurrence while drilling a Gulf of
Mexico well located in 3100 ft of water with a mudline temperature of 40oC. Figure 2.3
detail the status of the wellbore and the BOP arrangement. After drilling to about
7679 ft, the well was found to be flowing during a flow check. The well was then shut in
to determine the wellbore pressures. During the attempt to establish circulation after shut
in, returns could not be established and casing pressure fell to zero. Fourteen hours after
the kick was first detected, all BOPs were opened to observe the well, which appeared
static. During the next fourteen hours, several unsuccessful attempts were made to
15
establish circulation by pumping lost circulation pills. Both a choke line and a kill line
were circulated during this time. Almost 30 hrs after initial shut-in, the well flowed
again and the BOPs were closed as shown in fig 2.3. Part of the gas influx above the
BOPs continued to migrate up the riser and was successfully diverted. The choke line
was determined to be plugged during subsequent attempts to circulate mud up the riser
and above a closed ram-type BOP. The kill line also may have been plugged because it
was not checked at the time. With no apparent well pressure, the BOPs were opened
again to monitor the well.
Almost 48 hrs after the initial well kick, the well flowed a third time. After an
annular BOP was closed, the lower middle ram-type BOP was actuated to prepare for
drillstring hangoff; however, it did not take the proper amount of closing fluid. The
lowermost ram-type BOP was then closed. The riser continued to flow mud and gas that
was successfully diverted overboard. During subsequent attempts to fill the riser, the kill
line was determined to be plugged.
The well remained shut-in on the lowermost ram-type BOP while the drillstring
was cemented in the open hole. Numerous attempts to unplug the choke line and kill line
by applying pressure surges at the surface were unsuccessful. Neutron decay and
unfocused density logging indicated gas in the drillstring below and above the BOPs in
16
the casing annulus. Sources of the gas in the annulus were from either gas migrating up
the annuli and accumulating or a slight leak in the wellhead casing hanger packoff.
Although neutron decay logging detected free gas in the wellbore, these logs can not
differentiate between hydrates and mud.
The method used to remove gas in the drillstring casing annulus was to perforate
the drillstring about 400 ft above the annulus gas/liquid contact. After coiled tubing was
run inside the drillstring, hot mud was circulated and the gas was allowed to migrate into
the coiled tubing annulus and was then circulated out of the well. Three sets of
successfully shallower perforations were required to remove the gas completely from the
annulus. After all ram-type BOPs were opened (some still did not open fully), the
drillstring was backed off at 5000 ft and recovered. After washing back to 5000 ft with
the drillstring, a cement plug was set in the casing. After a successful pressure test, the
well was secure and preparations were made to pull the BOP stack. During pulling of the
riser and BOPs, hydrates were recovered from the choke line and kill line of the bottom
riser joints. Testing of the BOP at the surface indicated that failure to open and close
completely was not due to mechanical problems in the BOP system.
17
Fig. 2.3- Wellbore sketch for Case 2.9
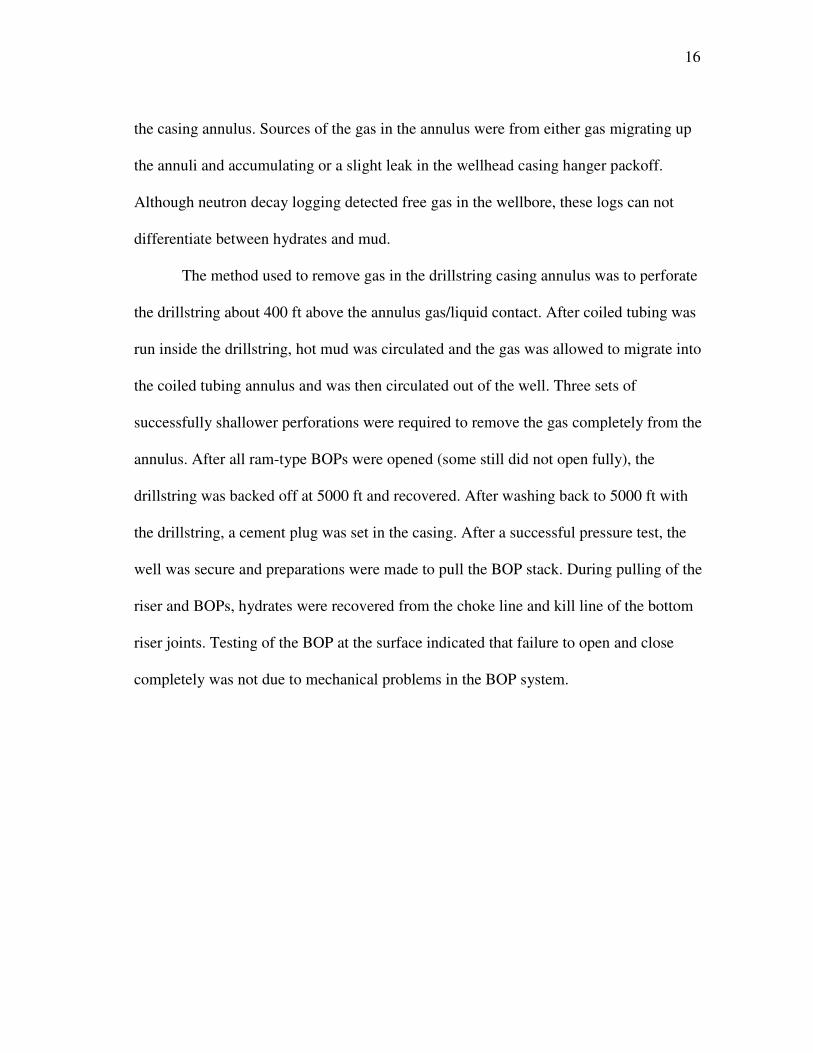
2.2.3 Case 310
This is the case of a gas hydrate buildup problem in a subsea christmas tree. The
problem was that of a typical Campos Basin subsea well (1971.78ft water depth, 8oC at
seabed) producing to a submarine production manifold on the seabed, at around
1049.87ft water depth, which was scheduled for an ordinary workover job. The goal of
this routine job was to retrieve a bad sub surface safety valve (SSSV) for ordinary
maintenance or replacement. It became impossible to retrieve the tree-cap by means of a
18
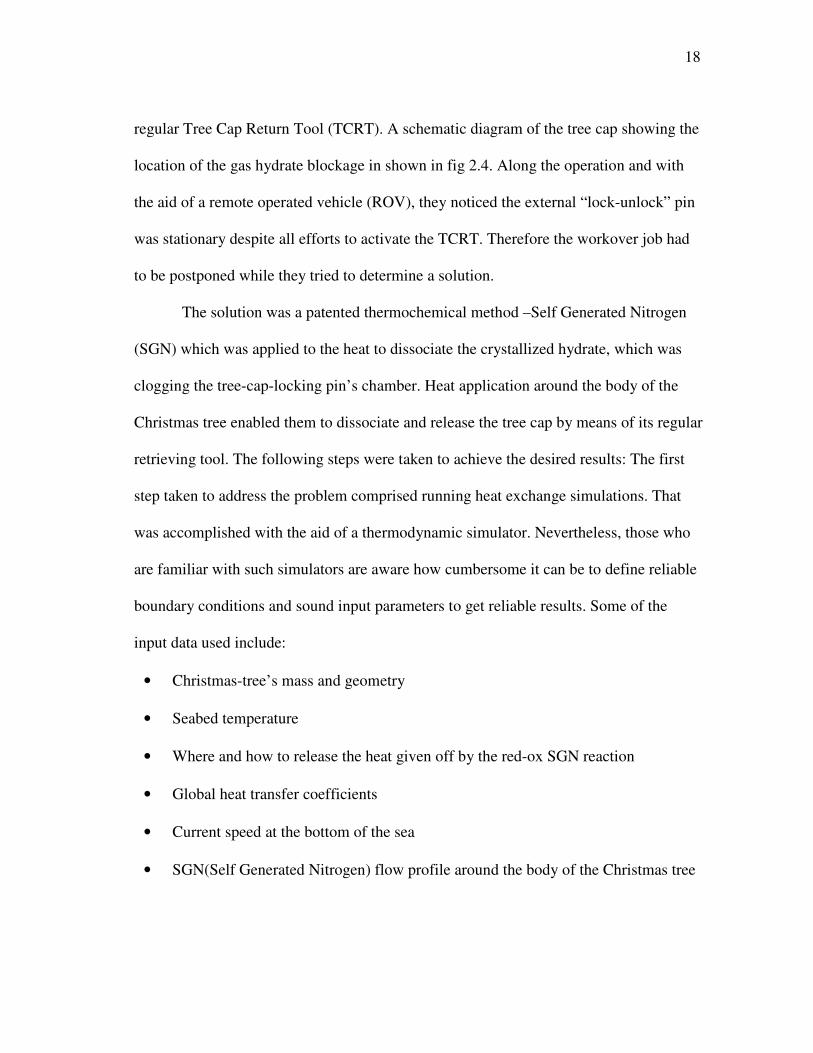
regular Tree Cap Return Tool (TCRT). A schematic diagram of the tree cap showing the
location of the gas hydrate blockage in shown in fig 2.4. Along the operation and with
the aid of a remote operated vehicle (ROV), they noticed the external “lock-unlock” pin
was stationary despite all efforts to activate the TCRT. Therefore the workover job had
to be postponed while they tried to determine a solution.
The solution was a patented thermochemical method –Self Generated Nitrogen
(SGN) which was applied to the heat to dissociate the crystallized hydrate, which was
clogging the tree-cap-locking pin’s chamber. Heat application around the body of the
Christmas tree enabled them to dissociate and release the tree cap by means of its regular
retrieving tool. The following steps were taken to achieve the desired results: The first
step taken to address the problem comprised running heat exchange simulations. That
was accomplished with the aid of a thermodynamic simulator. Nevertheless, those who
are familiar with such simulators are aware how cumbersome it can be to define reliable
boundary conditions and sound input parameters to get reliable results. Some of the
input data used include:
• Christmas-tree’s mass and geometry
• Seabed temperature
• Where and how to release the heat given off by the red-ox SGN reaction
• Global heat transfer coefficients
• Current speed at the bottom of the sea
• SGN(Self Generated Nitrogen) flow profile around the body of the Christmas tree
19
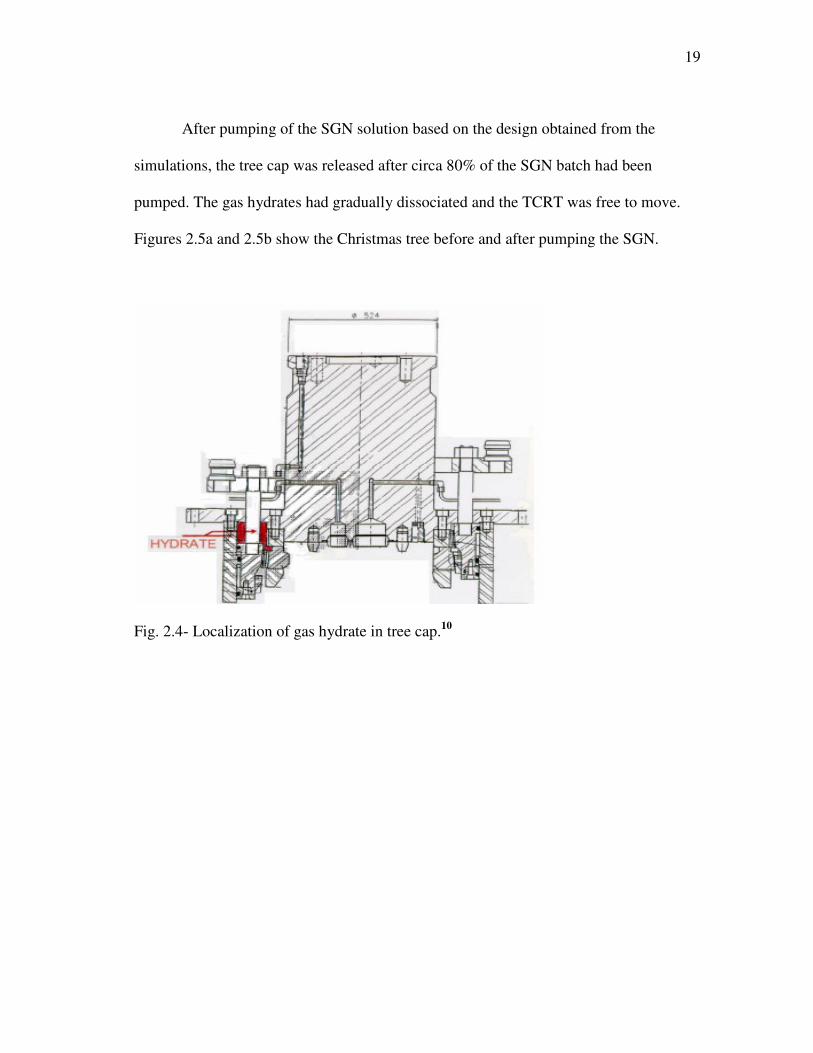
After pumping of the SGN solution based on the design obtained from the
simulations, the tree cap was released after circa 80% of the SGN batch had been
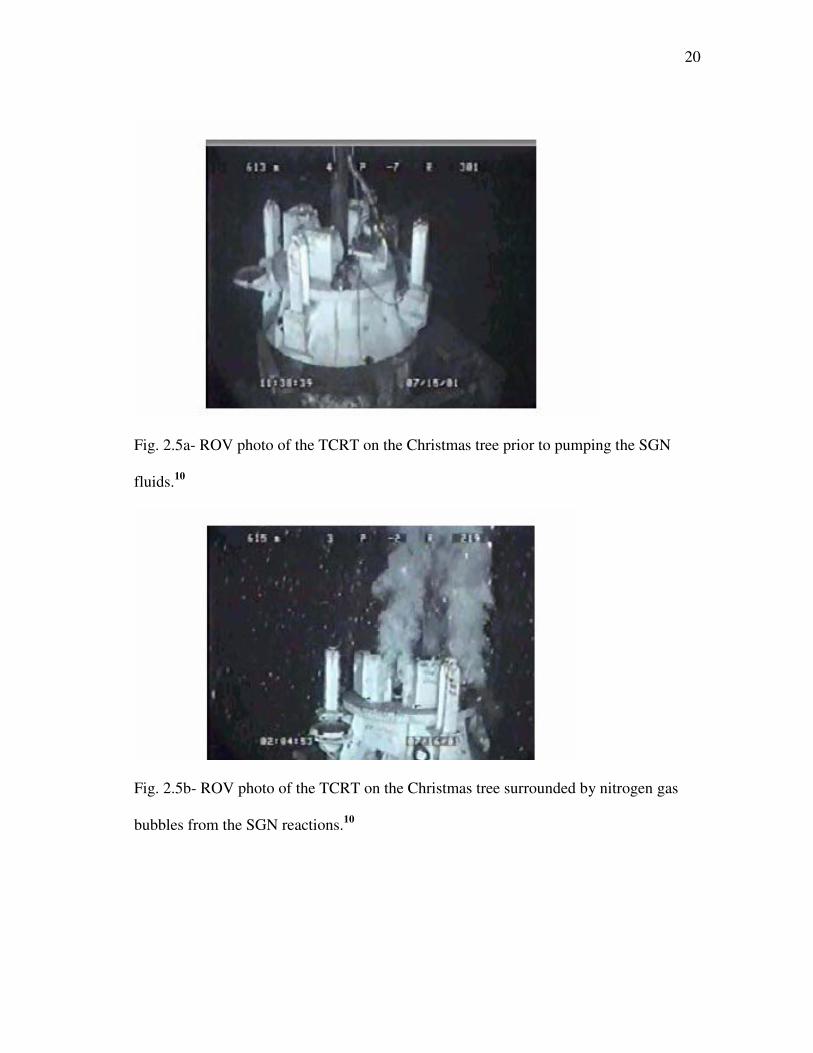
pumped. The gas hydrates had gradually dissociated and the TCRT was free to move.
Figures 2.5a and 2.5b show the Christmas tree before and after pumping the SGN.
Fig. 2.4- Localization of gas hydrate in tree cap.10
20
Fig. 2.5a- ROV photo of the TCRT on the Christmas tree prior to pumping the SGN
fluids.10
Fig. 2.5b- ROV photo of the TCRT on the Christmas tree surrounded by nitrogen gas
bubbles from the SGN reactions.10
21
2.3 New Drilling Solutions through Gas Hydrate Formations
There is a very good possibility of hydrates forming in the wellhead, BOPs,
choke line and kill line during a drilling operation, hence the importance of proper
assessment of the drilling conditions and environment before proceeding to deepwater or
offshore drilling. The important parameters needed for this assessment include
temperature, pressure conditions, gas compositions, drilling mud properties and fluid
phase compositions.
The temperature and pressure conditions for most drilling operations can be
predicted with respect to the depth. Many hours or days may elapse during which the
well will not be circulated, allowing the wellbore temperatures to approach static
gradients.
Some new technologies to consider in deepwater or offshore drilling may include11
:
• Managed Pressure Drilling (MPD): A process used to control the annular pressure
profile through out the wellbore. The objectives include ascertaining the downhole
pressure environment limits and to manage the annular hydraulic pressure profile.
• Slim and Insulated Marine Riser: Deep sea currents and the need to insulate the
riser, especially in temperate waters, indicate the applicability of the slim riser
deep-water drilling technology with a surface BOP. The increased velocity of
returns will allow the returns chilled by drilling into hydrates less time for heat
transfer to warm the returns, thus reducing dissociation within the riser itself.
Further, it is believe a 13-3/8 in marine riser may be less adversely affected by
22
underwater currents. Drilling with a chilled mud system to maintain bottom-hole
temperature (BHT) below 11oC should be sufficient to avoid any dissociation of
the hydrate or associated gas in the return riser.
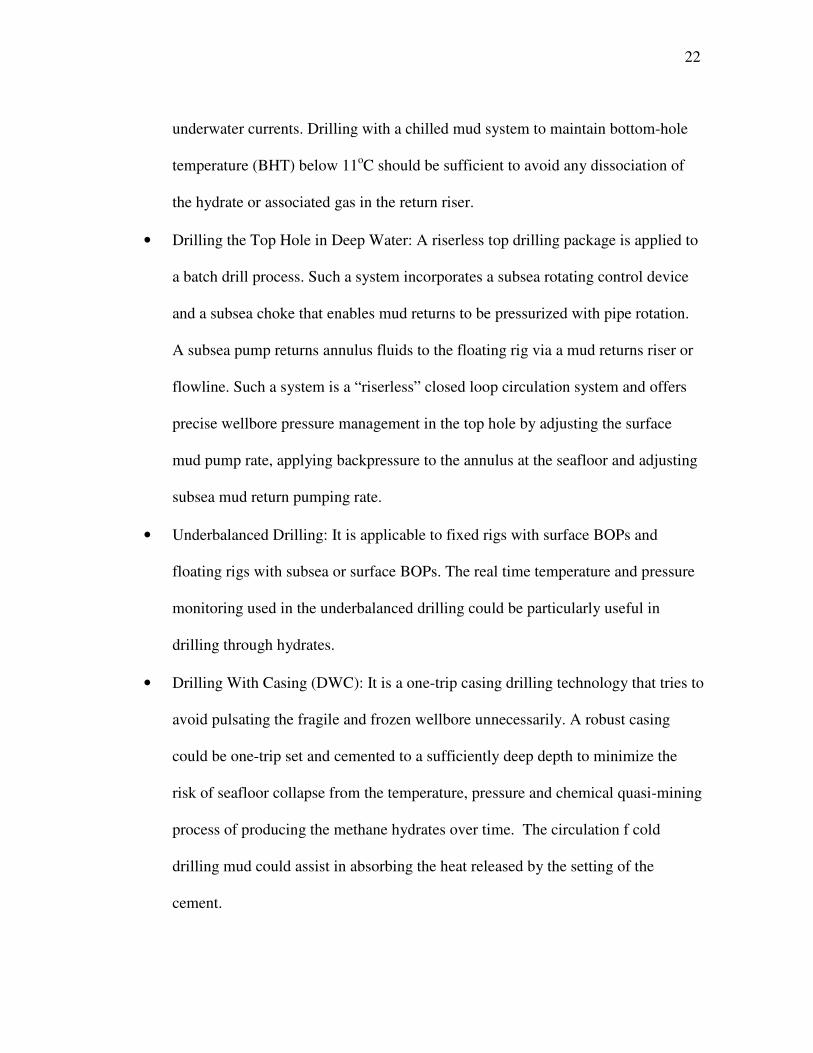
• Drilling the Top Hole in Deep Water: A riserless top drilling package is applied to
a batch drill process. Such a system incorporates a subsea rotating control device
and a subsea choke that enables mud returns to be pressurized with pipe rotation.
A subsea pump returns annulus fluids to the floating rig via a mud returns riser or
flowline. Such a system is a “riserless” closed loop circulation system and offers
precise wellbore pressure management in the top hole by adjusting the surface
mud pump rate, applying backpressure to the annulus at the seafloor and adjusting
subsea mud return pumping rate.
• Underbalanced Drilling: It is applicable to fixed rigs with surface BOPs and
floating rigs with subsea or surface BOPs. The real time temperature and pressure
monitoring used in the underbalanced drilling could be particularly useful in
drilling through hydrates.
• Drilling With Casing (DWC): It is a one-trip casing drilling technology that tries to
avoid pulsating the fragile and frozen wellbore unnecessarily. A robust casing
could be one-trip set and cemented to a sufficiently deep depth to minimize the
risk of seafloor collapse from the temperature, pressure and chemical quasi-mining
process of producing the methane hydrates over time. The circulation f cold
drilling mud could assist in absorbing the heat released by the setting of the
cement.
23
The presence of water is a necessary factor for the formation of hydrates. The
source of this water could be from two sources, drilling fluid or formation water
produced with gas influx. Produced formation water usually contains salt, which
provides some inhibition to hydrate formation. The degree of hydrate temperature
depression caused by the addition of salt to fresh water can be calculated with the
Hammerschidt equation.12
)100/(2335 MWMWdT −=
Where dT = temperature depression, Fahrenheit
M= Molar mass (g/mol)
W= weight percent inhibitor
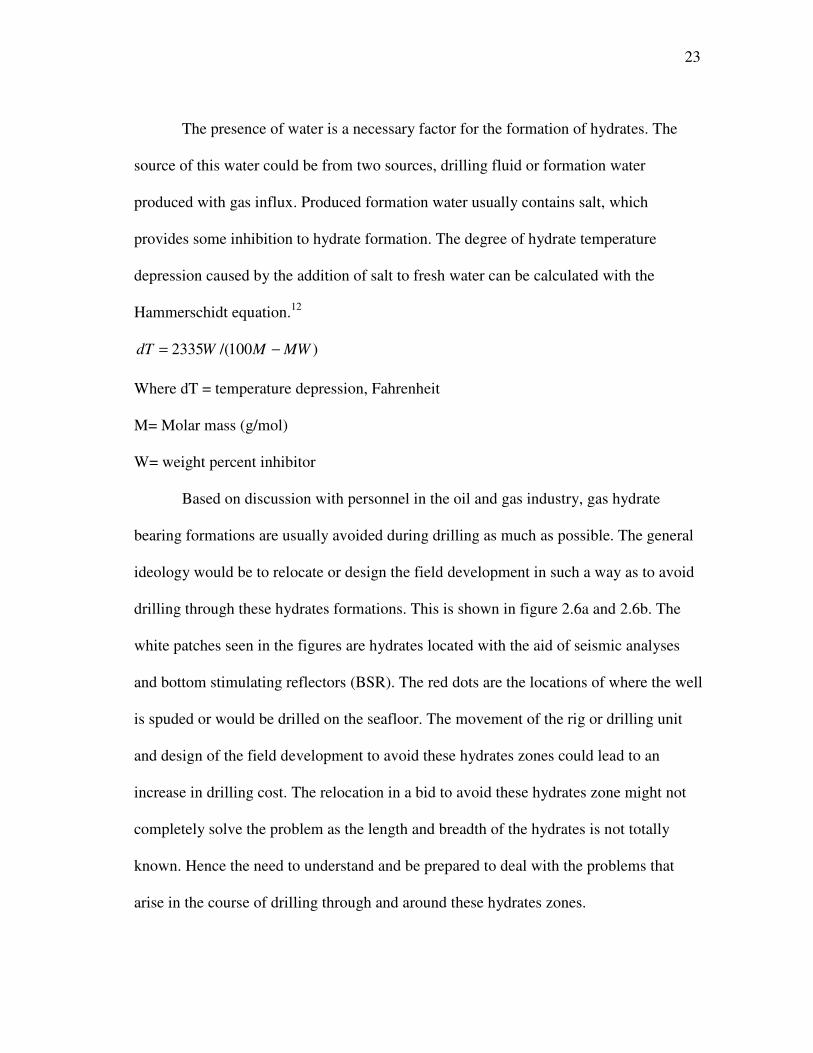
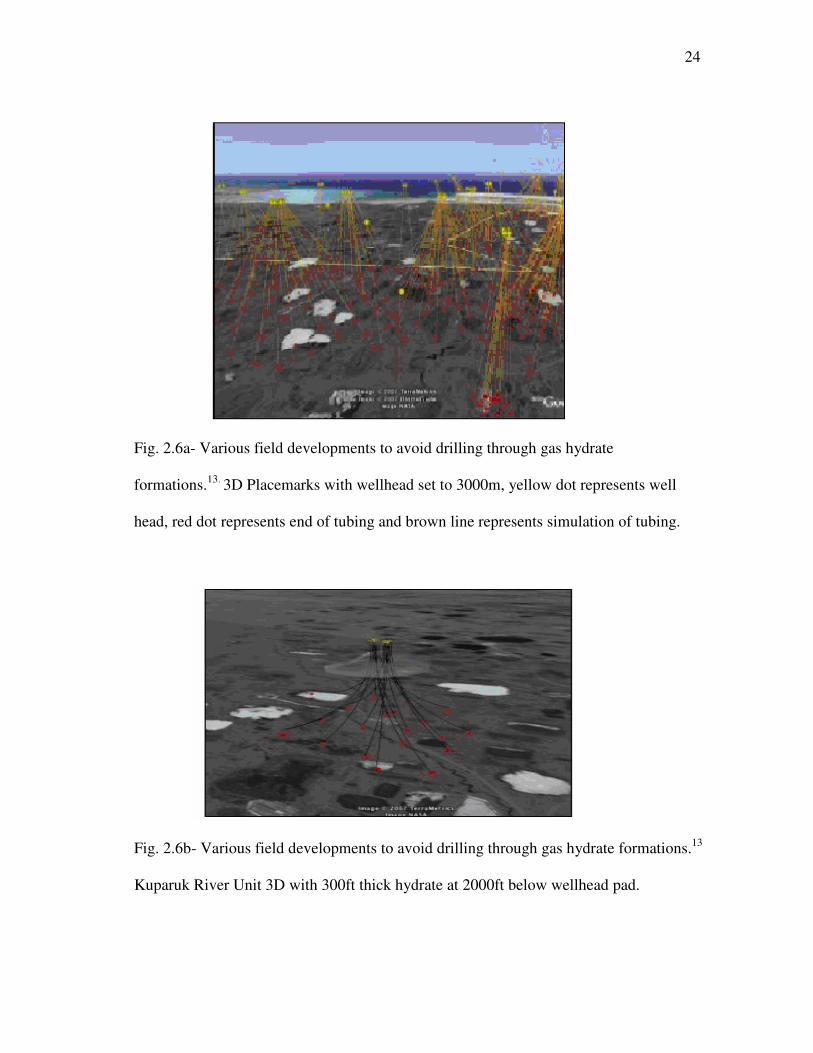
Based on discussion with personnel in the oil and gas industry, gas hydrate
bearing formations are usually avoided during drilling as much as possible. The general
ideology would be to relocate or design the field development in such a way as to avoid
drilling through these hydrates formations. This is shown in figure 2.6a and 2.6b. The
white patches seen in the figures are hydrates located with the aid of seismic analyses
and bottom stimulating reflectors (BSR). The red dots are the locations of where the well
is spuded or would be drilled on the seafloor. The movement of the rig or drilling unit
and design of the field development to avoid these hydrates zones could lead to an
increase in drilling cost. The relocation in a bid to avoid these hydrates zone might not
completely solve the problem as the length and breadth of the hydrates is not totally
known. Hence the need to understand and be prepared to deal with the problems that
arise in the course of drilling through and around these hydrates zones.
24
Fig. 2.6a- Various field developments to avoid drilling through gas hydrate
formations.13.
3D Placemarks with wellhead set to 3000m, yellow dot represents well
head, red dot represents end of tubing and brown line represents simulation of tubing.
Fig. 2.6b- Various field developments to avoid drilling through gas hydrate formations.13
Kuparuk River Unit 3D with 300ft thick hydrate at 2000ft below wellhead pad.
25
2.4 Research Objectives
Based on the extensive literature review, we have decided to focus on the
problems associated with wellbore stability with respect to drilling fluids, improving or
optimizing the rate of penetration (a very important cost determining factor in offshore
rigs), effect of various circulation rates on the 2 earlier mentioned parameters; drilling
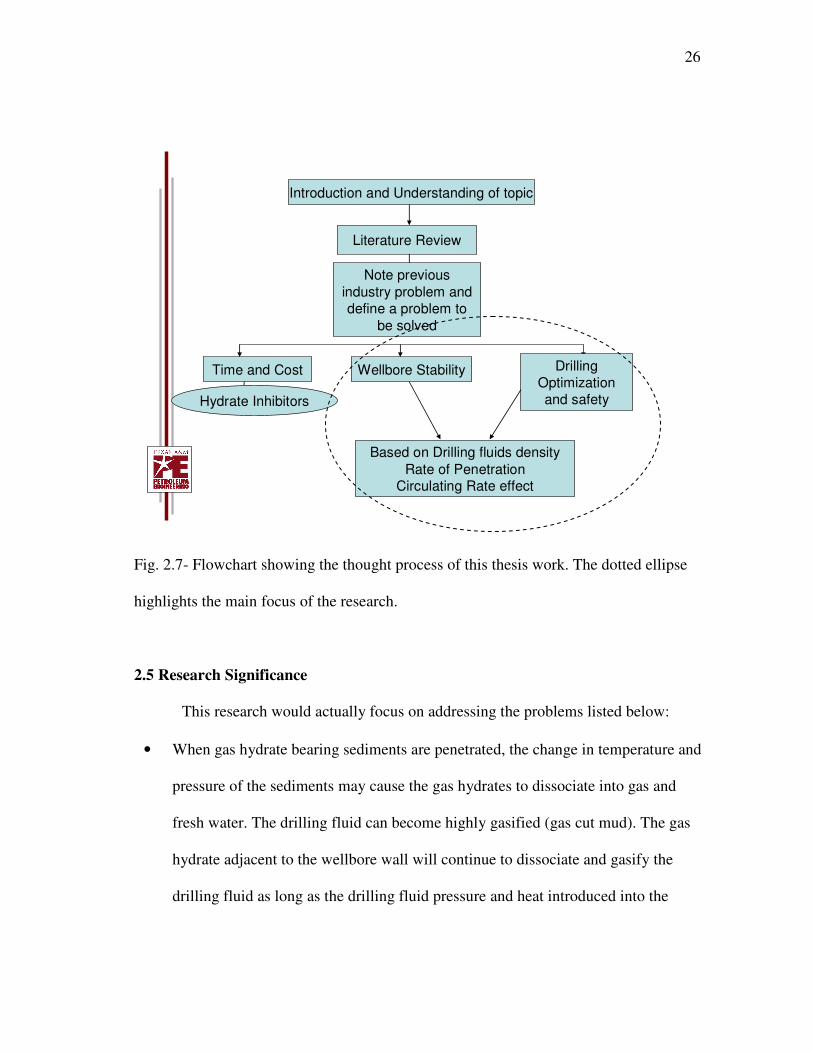
fluid properties and rate of penetration. The thought process for this research and thesis
work is presented in figure 2.7 in the form of a flow chart. This work assumes we are
dealing with a worst case scenario which is when the gas hydrate formation or zone is
made up of “massive” hydrate type (shown in figure 1.3). The hydrates are treated as
pure methane hydrates hence the gas properties applied are those for methane gas.
Saturation and porosity are also considered at the maximum possible level in order to
clearly show the worst case or the extreme safety effect. Most of the equations employed
in this analysis are from basic drilling engineering text. The equations and their
applications are presented later in the text.
26
Introduction and Understanding of topic
Literature Review
Note previous
industry problem and
define a problem to
be solved
Time and Cost Wellbore Stability Drilling
Optimization
and safety
Based on Drilling fluids density
Rate of PenetrationCirculating Rate effect
Hydrate Inhibitors
Fig. 2.7- Flowchart showing the thought process of this thesis work. The dotted ellipse
highlights the main focus of the research.
2.5 Research Significance
This research would actually focus on addressing the problems listed below:
• When gas hydrate bearing sediments are penetrated, the change in temperature and
pressure of the sediments may cause the gas hydrates to dissociate into gas and
fresh water. The drilling fluid can become highly gasified (gas cut mud). The gas
hydrate adjacent to the wellbore wall will continue to dissociate and gasify the
drilling fluid as long as the drilling fluid pressure and heat introduced into the
27
formation by the drilling operation results in the gas hydrates remaining outside
the stability zone. The gasification leads to lowering of the mud density i.e.
reduction of the drilling fluid pressure which may cause wellbore instability and
lead to hole enlargement and finally, wellbore collapse.
• When gas hydrates dissociate, the mechanical and physical properties of the
sediments/formation will change. The change in material properties associated
with dissociation includes increase in permeability, reduction in modulus and
weakening of the cementation provided by the hydrates. This strength reduction in
formation will also lead to wellbore instability.
• The initially mentioned changes in mud properties would also reduce the cleaning
property of the mud and hence may result in a tight hole due to the weakness of the
formation (as mentioned above). This could lead to packing off and stuck pipe.
28
CHAPTER III
DRILLING FLUIDS ADDITIVES AND CHARACTERISTICS FOR
GAS HYDRATE APPLICATIONS
The most common method of combating gas hydrate formation is to design fluids
which avoid the pressure and temperature conditions required for hydrate formation.
This can be done by adding specially designed additives to drilling fluids with known
characteristics in order to provide thermodynamic inhibition. As long as the fluid is used
under the specified conditions of pressure and temperature, formation of gas hydrates
should remain thermodynamically impossible or unlikely.
3.1 Selection Criteria for Drilling Fluids
The selection of a drilling fluid to suppress the formation of gas hydrates is
specifically useful in areas where gas hydrates are likely to be formed. Most of the other
requirements are more general and apply to various drilling operations. Here are some of
the primary factors to be considered in the selection of a high performance fluid for
ultimate performance during drilling:
• Wellbore stability
• Stuck pipe prevention
• Lost circulation mitigation and prevention
• Fluid and solids control management
• Environmental compliance
• Cost containment
• Waste management disposal
• Logging objectives
• Formation damage
• Gas hydrate suppression
29
Once a well is determined to be within the hydrate forming window, it is
advisable to apply hydrate inhibitors/suppressors into the drilling fluid. It is also possible
to drill to water depths of about 7500 ft without encountering gas hydrates or its
problems. This can be attributed to any of the following reasons; small or no gas kicks,
very short shut down periods, gas kick is of very low gravity gas (methane), effect of
metastability, presence of inhibitor that have been unaccounted for and finally good well
control procedures.
3.2 State of the Art Drilling Fluid Design
More deepwater wells are being drilling continuously in the industry and hence
the need for more improved drilling fluids to handle the various conditions. Newly
improved drilling fluids are designed to deal with the changing mud line temperatures
being experienced in the various deepwater regions. For example the Norwegian
deepwater has a mudline temperature of -2oC to -1
oC
14 which requires drilling fluid that
would prevent hydrate formation at this temperature and at the same time maintain most
drilling fluid properties (density, cleaning ability). The current practice in the deepwater
drilling industry to suppress hydrate formation temperature is by using saline drilling
fluids which is made by addition of salts or NaCl. About 20-23 wt% NaCl/polymer
drilling fluid systems are the most commonly used drilling fluids in deep water
drilling14
. Drilling with these systems has been successful in water depths up to 7500 ft
(7503.28 ft), such wells have been drilled in the Gulf of Mexico. The depths for these
wells range from 2000 ft – 7500 ft using mainly 20wt% NaCl and Partially Hydrolyzed
30
polyacrylamide (PHPA) based drilling fluid. This has been found very useful in the Gulf
of Mexico, but has not been too successful in the Norwegian deepwater due to the low
temperature mudline. At extreme low mudline temperatures, thermodynamic inhibitors
alone may be insufficient to deal with hydrate formation but the addition of both kinetic
inhibitors and thermodynamic inhibitors in deepwater drilling fluid design may win the
prize. Kinetic inhibitors are based on the effect of chemicals on the nucleation and
growth of natural gas hydrates which are time dependent and stochastic processes.
The use of high performance drilling mud could be a very good way to avoid the
formation of gas hydrates during drilling. As discussed earlier, the two documented
problems encountered while drilling, through gas hydrates i.e. blocking of BOP stacks
and choke and kill lines, could be avoided by using specially designed drilling fluids
(e.g. synthetic based mud SBM or High Performance Water Based Mud, HPWBM). Gas
migration in SBM is negligible, once the gas is absorbed or goes into solution, there
would be effectively little or no migration. This reduces the effect of gas migrating to the
BOPs or choke lines. The higher the drilling mud pressure, the more gas it would absorb.
Hydrates suppression could be achieved by addition of certain salts such as calcium
chloride or sodium chloride. Gas hydrate formation could also be suppressed by addition
of specifically built glycol for hydrate suppression purposes.
3.2.1 Effect of Polar and Surface Active Additives on Hydrate Formation14
Alcohols and glycols are well known hydrate thermodynamic inhibitors.
Surfactants and alcohol are known to decrease the surface tension of water. Lowering
the surface tension of water, increased the rate of gas diffusion in the bulk water and
31
hence and increase in hydrate formation. By dissolving the alcohols and glycols in
aqueous solution, hydrogen bonds are formed with the water molecules making it
difficult for the water molecules to migrate and bond with gas to form hydrates. On the
contrary, the effect of addition of glycols and alcohols on the kinetics of hydrate
formation is different. Results actually show that alcohols and glycols enhance the rate
of hydrate formation.14
One explanation for this result is that polar molecules act as
templates for nucleation when they exist at low concentration. The presence of drilling
fluid additives such as bentonite, barite, and lignite with their tremendous surface area
could provide a surface by which gas molecules could be adsorbed. This behavior could
cause the physical entrapment of gas in quantities larger than the amount of gas
dissolved in water. The adsorbed gas which is dispersed within the bulk water with the
solid particles is readily available for encapsulation in the hydrate structure.
3.2.2 Kinetic Inhibitors and Crystal Modifiers14
Kinetic inhibition of gas hydrates refers to the process by which the nucleation
and growth of hydrate crystals are altered by using a low concentration of mostly
polymeric and surfactant-based chemicals. The inhibitors may cause any of the
following effects:
• delay the appearance of the critical nuclei (kinetic inhibitor)
• slow the rate of hydrate formation (crystal modifier)
• prevent the agglomeration process (crystal modifier)
32
These chemicals do not disrupt the thermodynamic equilibrium of the hydrates.
The proposed mechanisms for the processes are surface adsorption on the face of the
growing crystals and steric stabilization. Generally, these chemicals have hydrophilic
groups in their structure which hydrogen bond to water molecules in the liquid water
and/or the hydrate crystal. Working with a high salinity drilling fluid, as in deepwater,
reduces the options in selecting a good kinetic inhibitor or crystal modifier. Another
challenge with working with the kinetic inhibitor is their surface activity.
3.2.3 New Design for Hydrate Fluid Inhibition
In the search for an improved gas hydrate inhibitor for drilling fluid applications,
characteristics that should be included are15
• Lowest possible density with maximum hydrate suppression
• Compatibility with most common drilling fluid components
• Compatibility with most salts to balance hydrates suppression and fluid density
• Provide shale inhibition for adequate borehole and drill cuttings stability
There have been two approaches to selection of additives for thermodynamic gas
hydrate control in water based muds – salts such as sodium chloride, sodium bromide
and calcium chloride or the addition of water soluble organics. Organic compounds such
as alcohol and glycol have also been used for many years to control gas hydrate
formation. However the use of organic compounds is not usually encouraged due to
undesirable health hazards and unacceptable physical properties. Although glycol and
polyglycol both possess good physical and environmental properties, their high density
makes it difficult to achieve the low density design required for formation fracture
33
gradients.15
The introduction of the gas hydrate pill formation can also be considered a
good way of reducing hydrate formation during drilling.15
These gas hydrate “pills” are
concentrated, highly-inhibitive formulations and can be placed in the BOP stack and
choke and kill lines. The pills are utilized when a gas kick is encountered during a
drilling operation or when the drilling location is abandoned during several hours due to
adverse weather or technical faults. By placing the pills in the choke or kill lines or the
BOP stack, the potential for gas hydrate formation is reduced. These fluid are usually
formulated to be much more hydrate suppressive than drilling fluids.
3.3 Dissociation of Gas Hydrates and Entry of Gas into Drilling Fluids
The dissociation of gas hydrates during drilling could be as a result of either
change in temperature or change in pressure. Two of the ways in which gas hydrates
dissociate are explained below:
• When a well is drilled through a gas hydrate bearing formation, the hydrates are
broken into pieces and carried up by drilling fluid. In the drilling fluid, the
hydrates are likely to dissociate into gas and water because the temperature and
pressure of the drilling fluid is outside the gas hydrate stability zone. The gas
enters the drilling fluid and alters its rheology (viscosity, density, cleaning power
and modulus). This could be very dangerous if not taken into consideration in the
mud design phase.
34
• After drilling through a gas hydrate bearing zone, the hydrate at the front or at the
edge of the hole are likely to start dissociating. This releases gas into the drilling
mud flowing through the annulus. The rate of dissociation of the gas at the front of
the hole is very important as it helps in calculating the amount of gas released into
the mud. This can be used in designing the mud weight to keep the gas locked
back in place until the casing is set.
Based on the depth of the hydrate bearing zone, the amount of hydrates drilled
and carried up the annulus can be analyzed. The volume of gas and water that would be
produced could be obtained from correlations1. The next part of this report would look at
the dissociation at the drilling front in order to determine the rate of dissociation of
hydrates at the drilling front and amount of gas released into the drilling fluid.
35
CHAPTER IV
DRILLING HYDRAULICS PROPERTIES/PARAMETERS
The process followed for this work is given below:
1. Study of gas hydrate properties and locations: This includes a literature survey of
the various types of hydrates, possible resource potential and volume, places
where cores have been recovered in order to determine the necessary in-situ
properties of the hydrates and places where hydrates are possible to exist (this
would assist in design or development of newer fields).
2. Understanding the dangers of gas hydrates with respect to drilling and
environmental issues: This includes the various drilling problems possible
offshore, most especially deep water drilling. Special focus is placed on problems
caused by gas hydrate bearing formations both during drilling through such
formations and drilling deeper below hydrates zone.
3. Selection of specific problems to be investigated based on industry problems and
presently available solutions: The problems being faced by the industry while
drilling in deep waters was analyzed and those specific to gas hydrates were
singled out. Present solutions being implemented by the industry were noted and
a look at a new solution to address some of the problems noted above.
4. Selection of drilling parameters to be analyzed: Although a number of drilling
parameters affect the final outcome of a drilling job, 3 very important parameters
36
were selected and investigated in the course of this work. The 3 parameters
include Rate of Penetration, Circulation Rate and Drilling fluid Weight.
5. Understanding and Discussion of results: A number of plots were generated
based on the parameters investigated for selected gas hydrate zone properties.
Although these properties are not universal, the process and relationship obtained
in this work could be applied to various gas hydrate fields all over the world.
Interpretation of the results in order to help solve part of the problems in the
industry is finally presented.
4.1 Drilling Fluids
Drilling fluids are primarily used to keep the hole-open while drilling. They
assist in transport of the cuttings from the drill bits to the surface. On a well control
basis, the drilling fluid assists in maintaining hydrostatic pressure exerted by the earth on
the bore hole. Some other notable functions of drilling fluids include cooling and
lubrication of the drill string and bit, provide a wall cake (this could be both
advantageous and disadvantageous), provide information about the well, prevent
corrosion (instantaneous) and provide data transmission for MWD tools. There are 3
major types drilling fluids:
1. Gaseous Fluids such as compressed air, foam and nitrogen
2. Water Based Fluids, either fresh water based or salt water based
3. Oil Based Fluids such as oil based, diesel based, refined diesel oils or synthetic
oil
37
4.1.1 Drilling Fluid Properties
There are some basic characteristics necessary for the design of a drilling fluid.
Some of them include:
1. Density: The density of a drilling fluid is a measure of weight of the fluid with
respect to a known volume. The weight of a drilling fluid is usually measured
with the use of a mud balance. The unit of measurement for a drilling fluid is
usually pounds per gallon (ppg).
2. Viscosity: This is a measure of the tendency of a fluid to flow. It can also be
described as the measure of the thickness of a fluid. The dynamic property is due
to the addition of inert solids (not reacting with water) to the drilling fluids
compositions. Viscosity could be measured in two ways. Funnel viscosity is
checked by using a Marsh Funnel and recording the time required for a quart of
the fluid to flow through the funnel. It is only a relative measure of viscosity. The
second means is by using a Rotational Viscometer and is normally performed by
the mud engineer. This unit of measure for this “plastic viscosity” is centipoise.
3. Yield point: This is another dynamic property of drilling fluids. Usually
performed by the mud engineer and its regarded as a measure of the dynamic
surface tension of the mud. Unit of measurement is pounds per 100 square feet.
Gel strength is relatively compared to the yield point but it measures the static
surface tension of the mud or how well it can suspend solids when not in motion.
4. Gas Solubility in Oil Based Muds: Drilling muds/fluids use either water or oil as
the primary liquid phase. When oil is used, special caution should be taken by the
38
crew members. There is always a possibility of gas solubility in oil based muds.
Natural gas would mostly go into solution in oil based muds at the drilling depths
where a gas zone is encountered. The inherent problem in this situation is noticed
when the mud is being circulated to the surface. Very near to the surface, the gas
is likely to reach the bubble point and there is a sudden release of gas from the
mud. This gas flash would cause a drastic increase in the outflow of mud to the
facility. In the case of specially designed mud, this could lead to a loss of huge
volumes of muds and possible destruction of wellhead/surface equipments. A
substantial loss of hydrostatic is also possible. This could enhance shallow water
flows or shallow gas kick.
Some of the functions of the drilling fluid in a drilling job include removal of
cuttings from the well, control formation pressures, maintaining wellbore stability and
cooling, lubricating and supporting the drill bit during assembly. Some other notable
functions include transmitting hydraulic energy to bit and tools, control corrosion (in
some cases), facilitate cementing and completions and minimize the impact on the
environment.
4.2 Rate of Penetration
The rate of penetration is the speed at which the drill bit can break the rock under
it and thereby producing an increase in depth in the desired direction. It is usually
recorded in feet per hour (ft/hr). The rate of penetration has a very profound effect on
39
cost per foot drilled. Some of the most notable variables that affect the rate of
penetration and presently being studied include
1. Bit type
2. Formation characteristics
3. Drilling fluid properties (circulation rate and density)
4. Bit operating conditions (bit weight and rotary speed)
5. Bit hydraulics (bit balling)
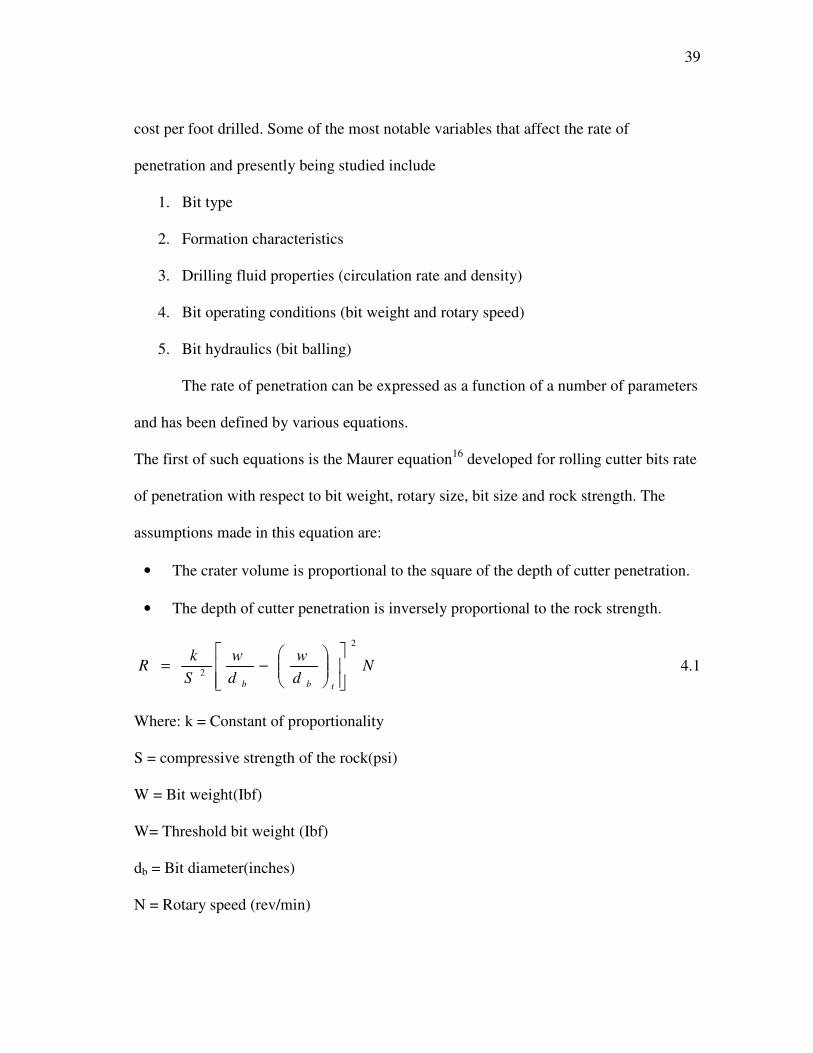
The rate of penetration can be expressed as a function of a number of parameters
and has been defined by various equations.
The first of such equations is the Maurer equation16
developed for rolling cutter bits rate
of penetration with respect to bit weight, rotary size, bit size and rock strength. The
assumptions made in this equation are:
• The crater volume is proportional to the square of the depth of cutter penetration.
• The depth of cutter penetration is inversely proportional to the rock strength.
Nd
w
d
w
S
kR
tbb
2
2
−= 4.1
Where: k = Constant of proportionality
S = compressive strength of the rock(psi)
W = Bit weight(Ibf)
W= Threshold bit weight (Ibf)
db = Bit diameter(inches)
N = Rotary speed (rev/min)
40
The above relationship assumes perfect hole cleaning and incomplete bit tooth
penetration. With respect to well control issues, the rate of drilled gas to volume of mud
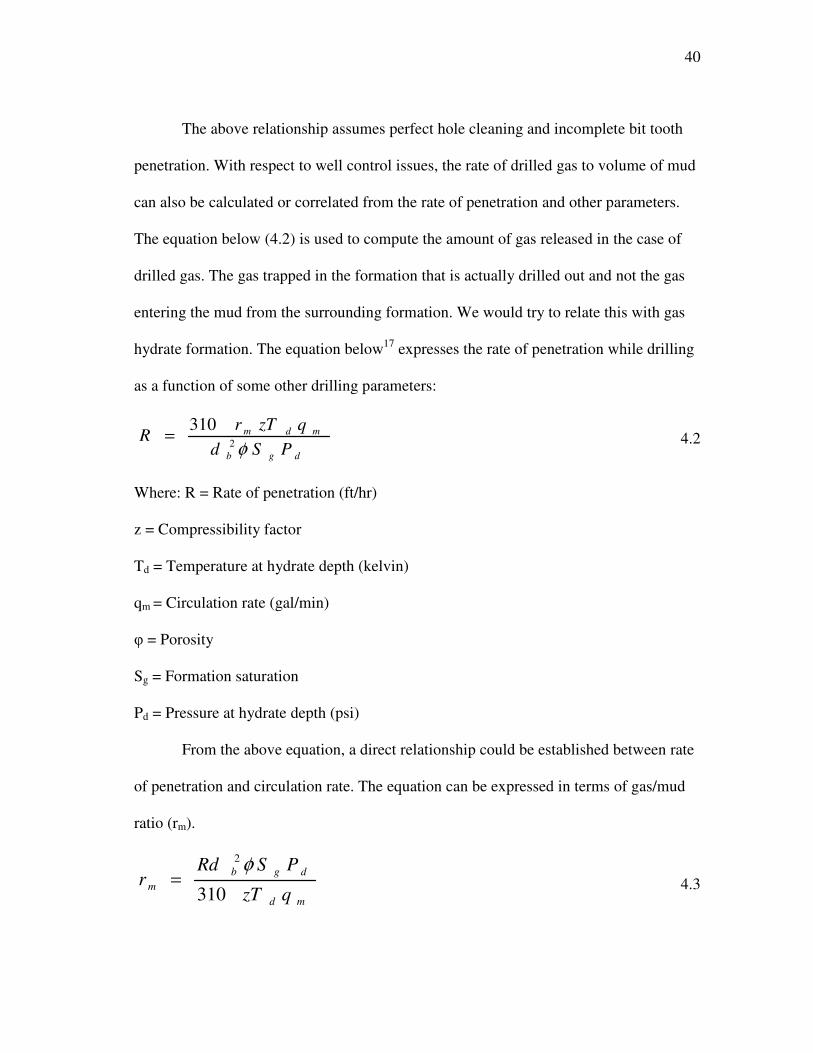
can also be calculated or correlated from the rate of penetration and other parameters.
The equation below (4.2) is used to compute the amount of gas released in the case of
drilled gas. The gas trapped in the formation that is actually drilled out and not the gas
entering the mud from the surrounding formation. We would try to relate this with gas
hydrate formation. The equation below17
expresses the rate of penetration while drilling
as a function of some other drilling parameters:
dgb
mdm
PSd
qzTrR
φ2
310= 4.2
Where: R = Rate of penetration (ft/hr)
z = Compressibility factor
Td = Temperature at hydrate depth (kelvin)
qm = Circulation rate (gal/min)
φ = Porosity
Sg = Formation saturation
Pd = Pressure at hydrate depth (psi)
From the above equation, a direct relationship could be established between rate
of penetration and circulation rate. The equation can be expressed in terms of gas/mud
ratio (rm).
md
dgb
mqzT
PSRdr
310
2 φ= 4.3
41
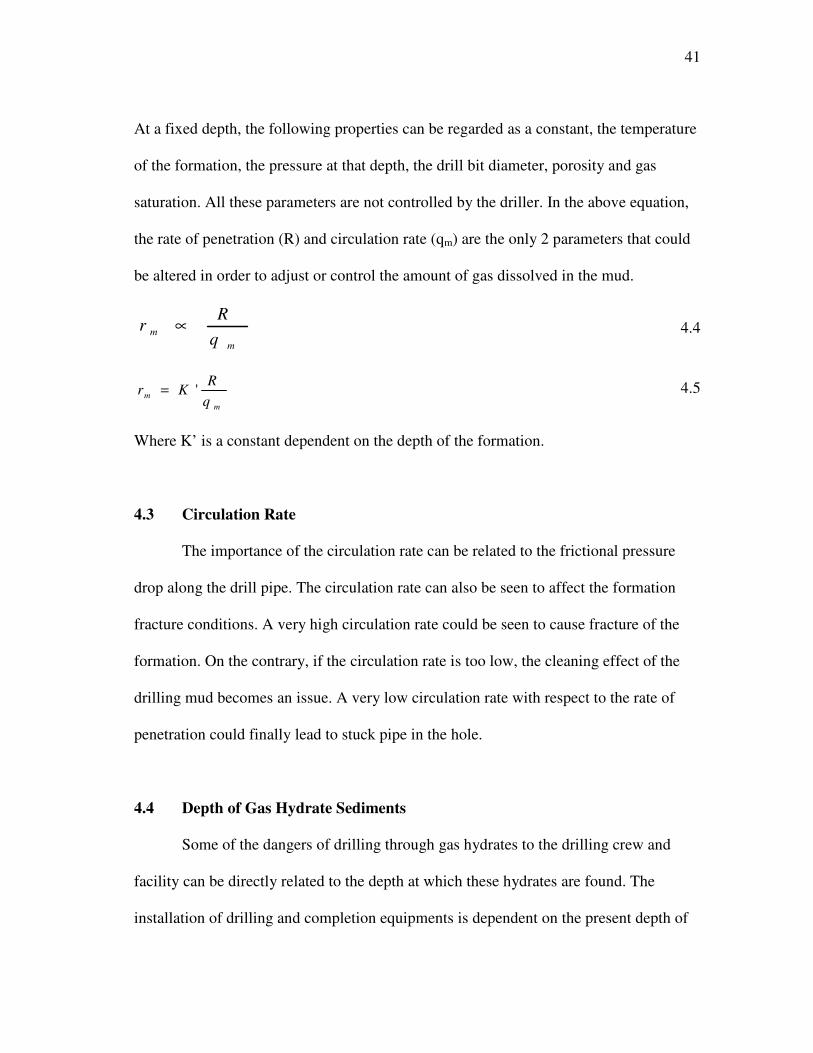
At a fixed depth, the following properties can be regarded as a constant, the temperature
of the formation, the pressure at that depth, the drill bit diameter, porosity and gas
saturation. All these parameters are not controlled by the driller. In the above equation,
the rate of penetration (R) and circulation rate (qm) are the only 2 parameters that could
be altered in order to adjust or control the amount of gas dissolved in the mud.
m
mq
Rr ∝ 4.4
m
mq
RKr '= 4.5
Where K’ is a constant dependent on the depth of the formation.
4.3 Circulation Rate
The importance of the circulation rate can be related to the frictional pressure
drop along the drill pipe. The circulation rate can also be seen to affect the formation
fracture conditions. A very high circulation rate could be seen to cause fracture of the
formation. On the contrary, if the circulation rate is too low, the cleaning effect of the
drilling mud becomes an issue. A very low circulation rate with respect to the rate of
penetration could finally lead to stuck pipe in the hole.
4.4 Depth of Gas Hydrate Sediments
Some of the dangers of drilling through gas hydrates to the drilling crew and
facility can be directly related to the depth at which these hydrates are found. The
installation of drilling and completion equipments is dependent on the present depth of
42
the drilling process. The most commonly encountered gas hydrates are found at about
800 ft to 2000 ft below mudline. At this depth, usually most well control equipment such
as blow out preventers, risers, choke and kill lines have not been installed. Hence the
danger facing the drill rig is usually restricted to the well bore stability in the region that
has been drilled and yet to be cased. These dangers could be as a result of gasification of
the drilling mud, shallow gas or water flows, stuck pipe and dissociation of the
surrounding formation gas hydrate. When the drill bits drill into the hydrates zone,
hydrates are broken up and based on the temperature of the drilling mud, a dissociation
of the hydrates is noticed. This dissociation produces water and gas which could be
either dissolved in the drilling fluid or carried to the surface as gas pockets when using
water based drilling fluids. In either case, the gas reduces the effective weight of the
mud in maintaining the hydrostatic of the drilled zone.
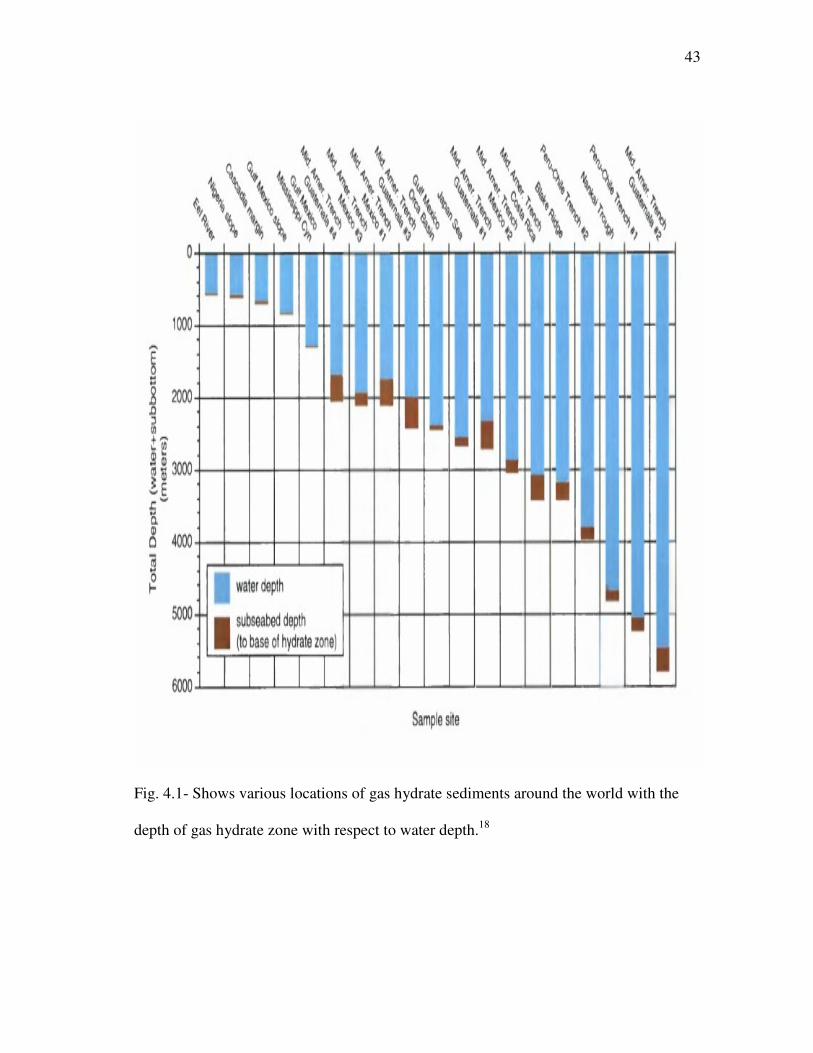
When gas hydrates are encountered at much deeper depths as shown in figure 4.1
and table 4.1, the dangers are more pronounce. At depths of 3000ft, the blow out
preventers (BOP) would likely have been installed. The choke and kill lines, risers and
surface control equipments become more prone to destruction. The volume of hydrates
drilled is proportional to the volume of gas produced and returned to the seafloor and
surface. The gas volume impacts a huge strain on the well control equipments and
should be minimized as much as possible.
43
Fig. 4.1- Shows various locations of gas hydrate sediments around the world with the
depth of gas hydrate zone with respect to water depth.18
44
The present drilling depth also influences the type of drilling fluid being used. At
much shallower depth, water based drilling fluid is usually being used. This is because
the returns are usually returned to the sea floor and for environmental reasons; they have
to be marine life friendly. It is also important to mention that since the drilling fluid is
not being reused, it is economically advantageous to use the relatively cheaper water
based drilling fluids (sea water). Once the blow out preventers have been installed and
the cuttings and mud are being returned to the surface via the riser, a much wider range
and flexibility for the selection of drilling fluid is possible. Although more specially
designed drilling fluids can be used, the Minerals Management Service (MMS) makes it
mandatory that oil based drilling fluid should not be used while drilling offshore. This is
mainly for environmental safety reasons. Due to the hazards of gas hydrates being
formed along the various equipments, specially designed drilling fluids are being
investigated. Presently, synthetic based drilling fluids are mostly used in offshore
operations. According to the MMS, synthetic based drilling fluids are a relatively new
class of drilling fluids that are particularly used for deepwater and deviated wells where
there is a possibility of drilling through hydratable shales or temperature and pressure
conditions of hydrates formations. Synthetic based drilling fluids were actually
developed to combine the technical advantages of oil based drilling fluids with the low
persistence and low toxicity of water based drilling fluids. It is produced by the
dispersing salt brine in a synthetic phase to form an emulsion. The other additives
include emulsifiers, barite, clay, lignite and lime. The type of emulsifiers usually
distinguishes types of SBF from each other. The solubility of gases in SBF could also
45
serve as a drilling danger. This could mask one of the most important kick detection
process, increase in drilling mud return at the surface.
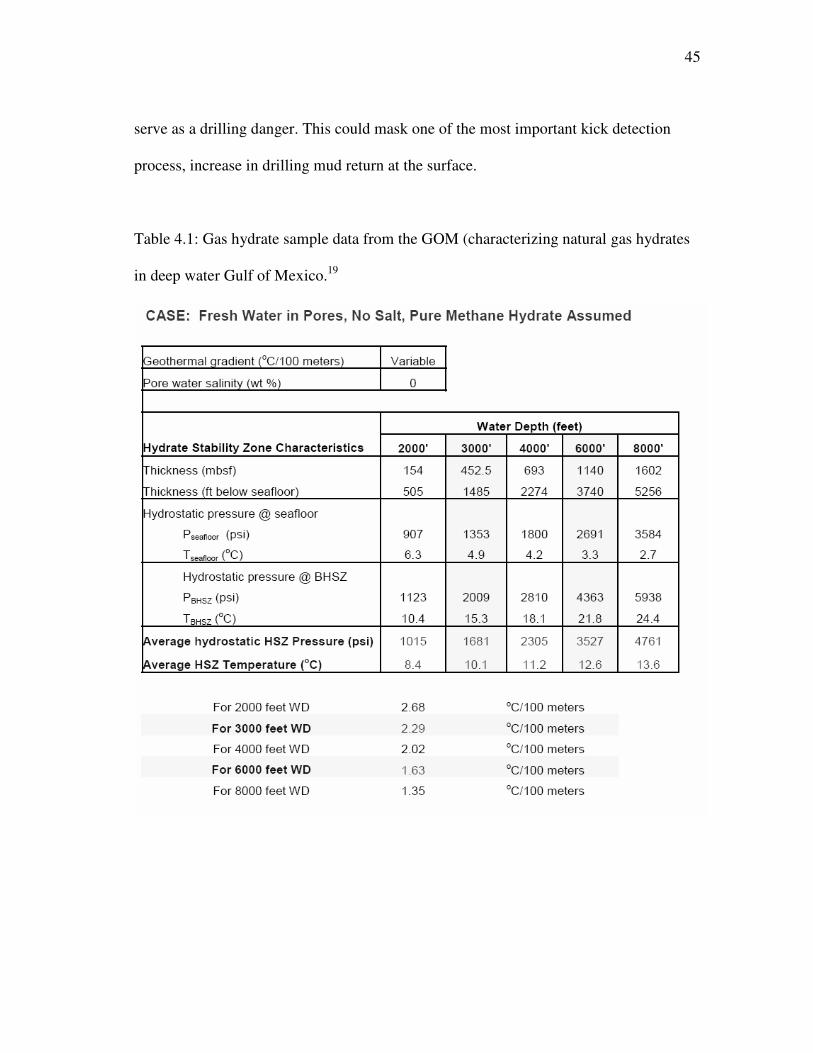
Table 4.1: Gas hydrate sample data from the GOM (characterizing natural gas hydrates
in deep water Gulf of Mexico.19
46
4.5 Drilling Hydraulics
In many drilling and completion operations, gas is usually introduced into the
wellbore either as a form of drilled gas, formation gas (kick) or from the surface. The
variation of pressure with depth in a static gas column is more complicated than in a
static liquid column. This is because the density of gas changes with pressure. The gas
behavior in a well can be explained using the real gas equation:
znRTpV = 4.6
Where: P = absolute pressure
V= gas volume
n= moles of gas
R= Universal gas constant
T= absolute temperature
z= gas deviation factor
The gas deviation factor is a measure how much the gas behavior deviates from
ideal gas. The equation 4.6 above could be rearranged in order to obtain the density of
the gas at various pressures and temperature conditions. This is given by:
zRT
pM=ρ 4.7
47
Changing consistent units to field units gives:
zT
pM
3.80=ρ 4.8
Where: ρ = density (ppg)
p = pressure (psi)
M = gas molecular weight
T = temperature (Rankine)
When the gas column is much larger or not highly pressured, then the depth of
the column should be taken into consideration when computing the density. The
following equation relates the change in depth with change in pressure.
dDzT
pMdp
3.80
052.0= 4.9
Where dD and dp are changes in depth and pressure respectively.
Assuming the variation of z is not too great, we can treat z as a constant. Separating
variables and solving yields the following equation:
zT
DDM
o
o
epp 1544
)( −
= 4.10
During drilling operations, the mud density could be altered due to the mixing of
drilled cuttings, formation fluids and drilled gas. The average density of an ideal mixture
of several components is given by:
48
∑∑
∑
∑
∑
=
=
=
=
= ===n
i
iin
i
i
n
i
ii
n
i
i
n
i
i
f
V
V
V
m
1
1
1
1
1 ρ
ρ
ρ 4.11
The above equation is used only if one gas is present in the mixture
Where: mi = mass of component
Vi = volume of component
ρi= density of component
fi = volume fraction of component
p
RTzN
p
RTzN
fv
v
i
+
=
1
4.12
The volume fraction becomes important when a gas phase is involved. For solids
and liquids, the volume component is constant throughout the mixture. When a gas
phase is involved, the depth affects the density which affects the volumes of gas present.
The impact becomes very huge at depth very close to the surface, where the pressure is
very low and so the gas volume is much higher based on equation 4.4. The impact of the
gas on the mud is quite significant at depths closer to the surface. The density of the mud
is greatly reduced as the depths get closer to the surface. The density of the mud returned
to the surface cannot be used to compute the necessary equivalent mud needed to stop or
address a kick. This could easily lead to fracture of the formation downhole.
49
For the above equations, the z factor was computed using the Dranchuk and Abou-
Kassem numerical model with various coefficients to fit the Standing and Katz data. The
equation is given by:
)()(
)()(1
,4
5
3
2
21
prrrpr
rprrpr
TCTC
TCTCz
ρρ
ρρ
+
−++= 4.13
The “reduced” density term ρr is obtained from the expression:
pr
pr
rzT
p27.0=ρ 4.14
The other coefficients of C(T,P) in the equation 4.13 are given by:
)721.0exp(
)/)(721.01(6134.0)(
)/1844.0/7361.0(1056.0)(
/1844.0/7361.05475.0)(
/05165.0/01569.0
/5339.0/07.13265.0)(
2
322
,4
2
3
2
2
54
3
1
r
prrrrpr
prprpr
prprpr
prpr
prprpr
TTC
TTTC
TTTC
TT
TTTC
ρ
ρρρ
−
+=
+−=
+−=
−+
−−=
4.15
Solving the Dranchuk and Abou-Kassem relation is an iterative process since the z-
factor depends on functions that contain the term. The Newton-Raphson iteration
technique has the form:
)(/)( '
1 zfzfzz ii −=+ 4.16
Where f(z) is a function of z and f’(z) is the first derivative of that function. The function
for the z factor is obtained from the following equation:
0),()(
)()(1)(
4
5
3
2
21=
+−
++−=
prrrpr
rprrpr
TCTC
TCTCzzf
ρρ
ρρ 4.17
50
And the derivative f’(z) is given by:
[ ]
)721.0exp(
)721.0(721.012268.1
/)(5
/)(2/)(1)(
)('
3
22
3
25
3
2
21
r
rr
pr
rrpr
rprrpr
zTzTC
zTCzTCz
zfzf
ρ
ρρρ
ρ
ρρ
−
−++−
++=∂
∂=
4.18
51
CHAPTER V
RESULTS AND DISCUSSION
In order to suggest a solution to the problems or dangers encountered while
drilling through gas hydrates, a graphical representation and analysis of the various
parameters mentioned earlier have been presented. When engineers drill through gas
bearing formations, the gas enters into the mud. This gas is known as drilled gas. In the
same way, the gas dissociated from hydrates zone was treated as drilled gas for the
purpose of this work. This assumption neglects the continuous dissociation of the
surrounding gas hydrates due to change in stability conditions of the hydrate zone in the
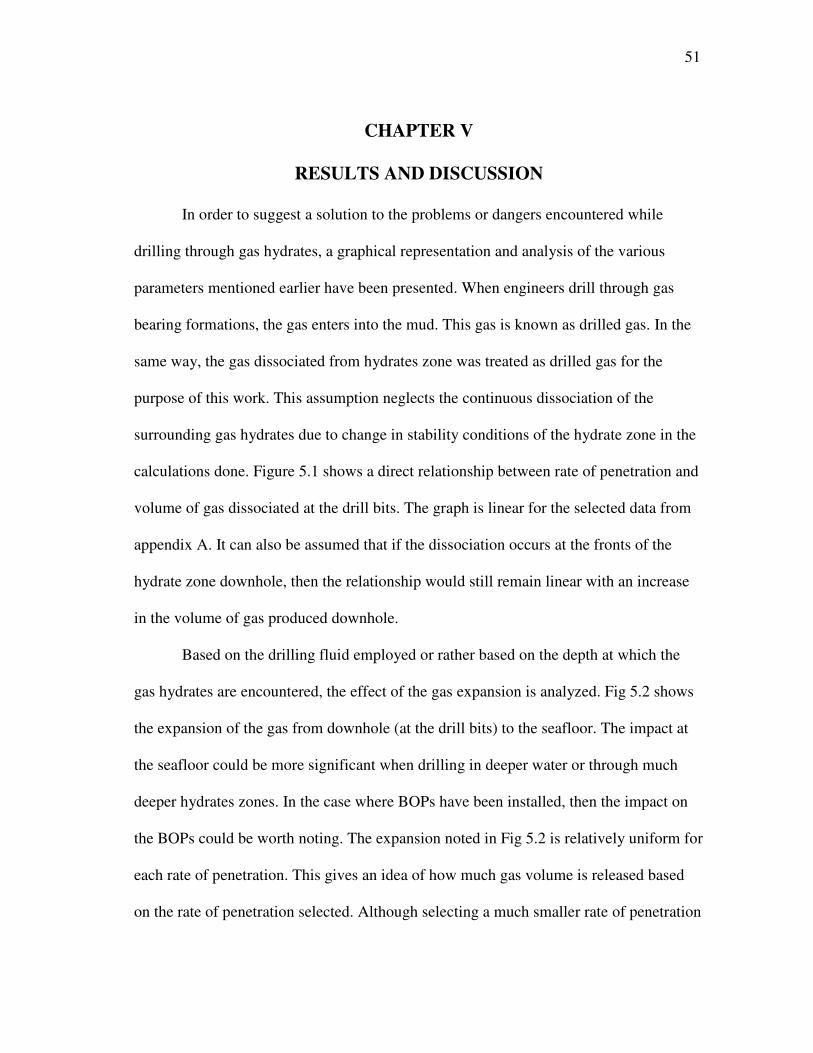
calculations done. Figure 5.1 shows a direct relationship between rate of penetration and
volume of gas dissociated at the drill bits. The graph is linear for the selected data from
appendix A. It can also be assumed that if the dissociation occurs at the fronts of the
hydrate zone downhole, then the relationship would still remain linear with an increase
in the volume of gas produced downhole.
Based on the drilling fluid employed or rather based on the depth at which the
gas hydrates are encountered, the effect of the gas expansion is analyzed. Fig 5.2 shows
the expansion of the gas from downhole (at the drill bits) to the seafloor. The impact at
the seafloor could be more significant when drilling in deeper water or through much
deeper hydrates zones. In the case where BOPs have been installed, then the impact on
the BOPs could be worth noting. The expansion noted in Fig 5.2 is relatively uniform for
each rate of penetration. This gives an idea of how much gas volume is released based
on the rate of penetration selected. Although selecting a much smaller rate of penetration
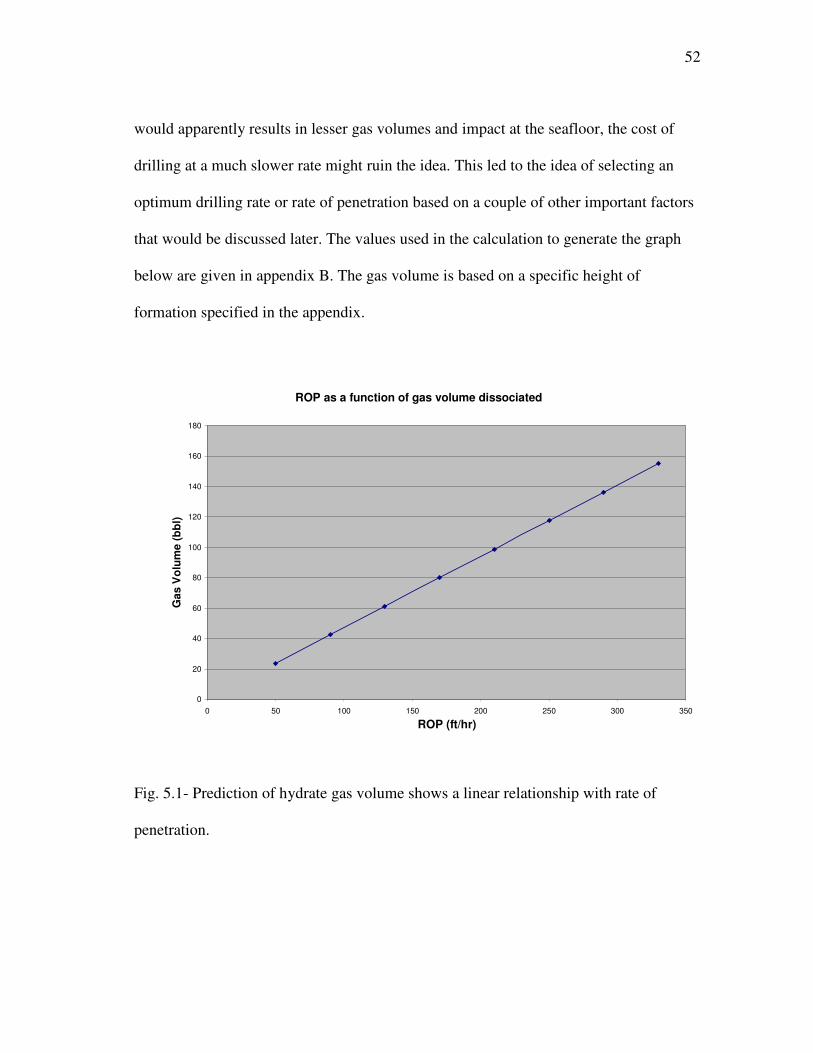
52
would apparently results in lesser gas volumes and impact at the seafloor, the cost of
drilling at a much slower rate might ruin the idea. This led to the idea of selecting an
optimum drilling rate or rate of penetration based on a couple of other important factors
that would be discussed later. The values used in the calculation to generate the graph
below are given in appendix B. The gas volume is based on a specific height of
formation specified in the appendix.
ROP as a function of gas volume dissociated
0
20
40
60
80
100
120
140
160
180
0 50 100 150 200 250 300 350
ROP (ft/hr)
Ga
s V
olu
me
(b
bl)
Fig. 5.1- Prediction of hydrate gas volume shows a linear relationship with rate of
penetration.
53
Vol of gas as a function of ROP for downhole and seafloor conditions
0
50
100
150
200
250
0 50 100 150 200 250 300 350
ROP (ft/hr)
Gas V
olu
me (
bb
l)
Downhole Vol Gas Vol at seabed
Fig. 5.2- Prediction of gas volume as a function of ROP for both downhole and seabed
conditions.
It is general knowledge that the volume of gas being held in gas hydrates is
enormous. This gas is compressed at high pressure and low temperatures to form
hydrates. In the form of hydrates, huge volumes of gas occupy relatively very small
space. Once drilled, the change in temperature and pressure are kept or maintained
outside the hydrates forming zone, the expansion is continuous from downhole to
surface or standard temperature and pressure conditions. As discussed earlier, while
drilling with a synthetic based mud, there is a very good possibility of gas dissolving in
the mud. The dissolved gas reduces the ability of the drilling engineer to recognize the
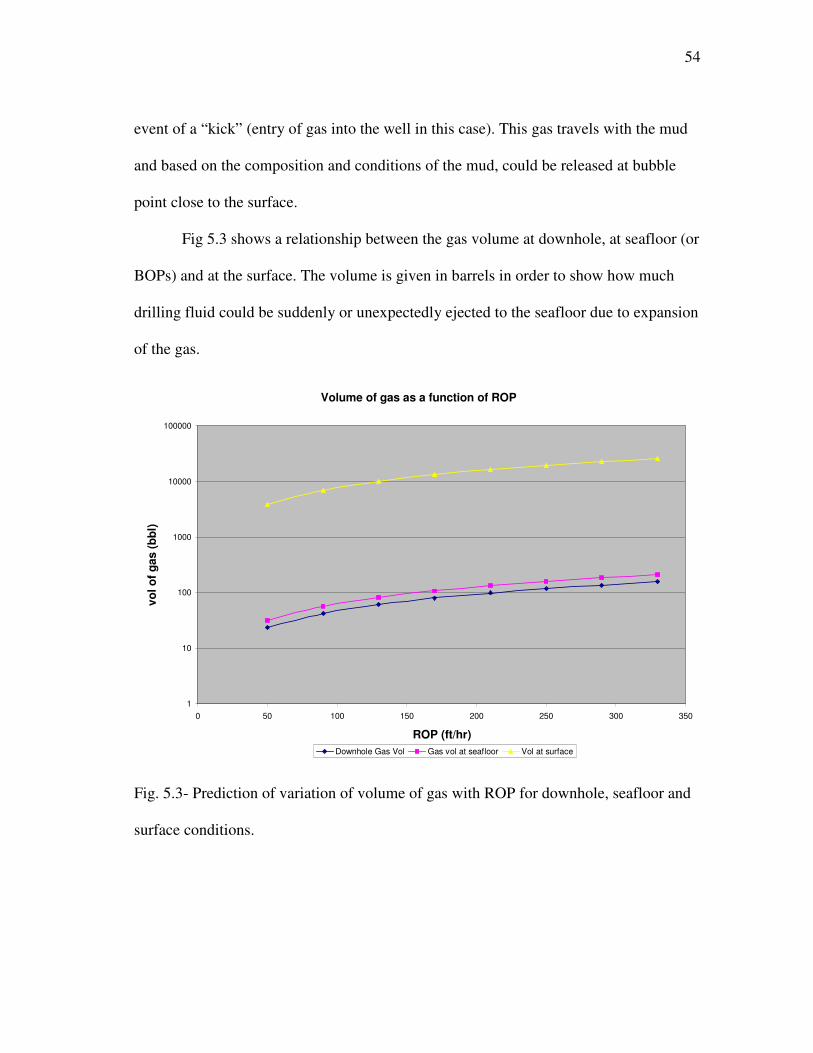
54
event of a “kick” (entry of gas into the well in this case). This gas travels with the mud
and based on the composition and conditions of the mud, could be released at bubble
point close to the surface.
Fig 5.3 shows a relationship between the gas volume at downhole, at seafloor (or
BOPs) and at the surface. The volume is given in barrels in order to show how much
drilling fluid could be suddenly or unexpectedly ejected to the seafloor due to expansion
of the gas.
Volume of gas as a function of ROP
1
10
100
1000
10000
100000
0 50 100 150 200 250 300 350
ROP (ft/hr)
vo
l o
f g
as (
bb
l)
Downhole Gas Vol Gas vol at seafloor Vol at surface
Fig. 5.3- Prediction of variation of volume of gas with ROP for downhole, seafloor and
surface conditions.
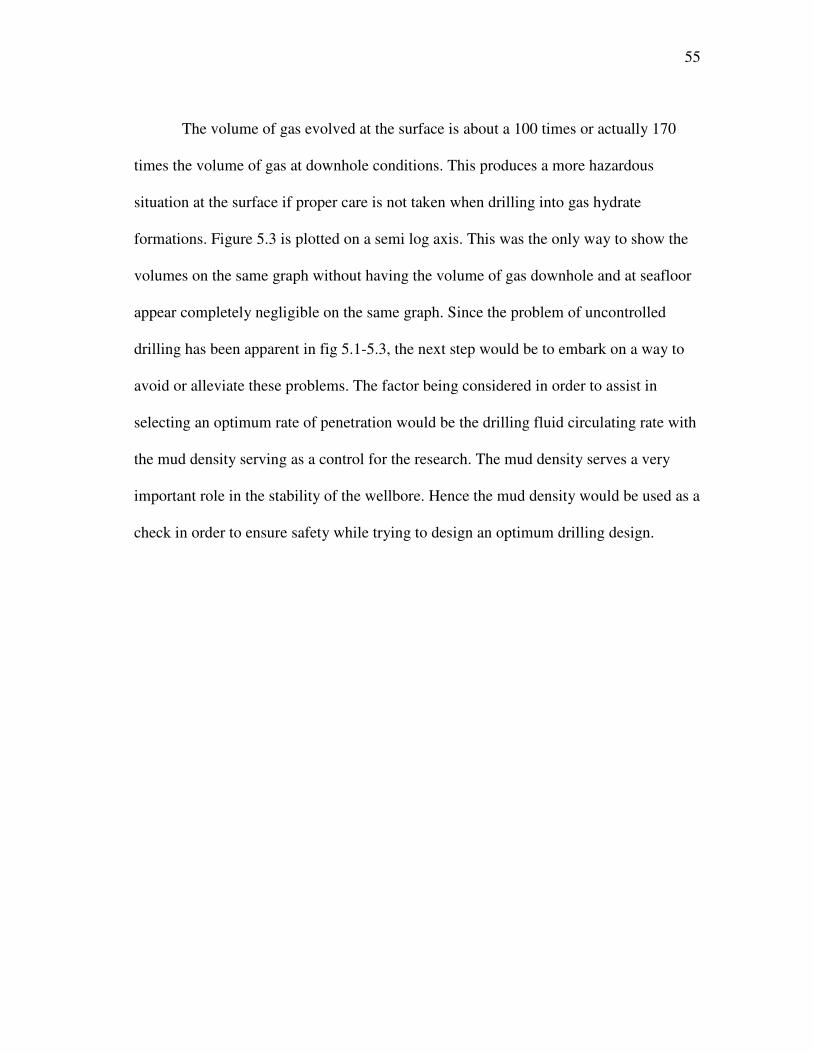
55
The volume of gas evolved at the surface is about a 100 times or actually 170
times the volume of gas at downhole conditions. This produces a more hazardous
situation at the surface if proper care is not taken when drilling into gas hydrate
formations. Figure 5.3 is plotted on a semi log axis. This was the only way to show the
volumes on the same graph without having the volume of gas downhole and at seafloor
appear completely negligible on the same graph. Since the problem of uncontrolled
drilling has been apparent in fig 5.1-5.3, the next step would be to embark on a way to
avoid or alleviate these problems. The factor being considered in order to assist in
selecting an optimum rate of penetration would be the drilling fluid circulating rate with
the mud density serving as a control for the research. The mud density serves a very
important role in the stability of the wellbore. Hence the mud density would be used as a
check in order to ensure safety while trying to design an optimum drilling design.
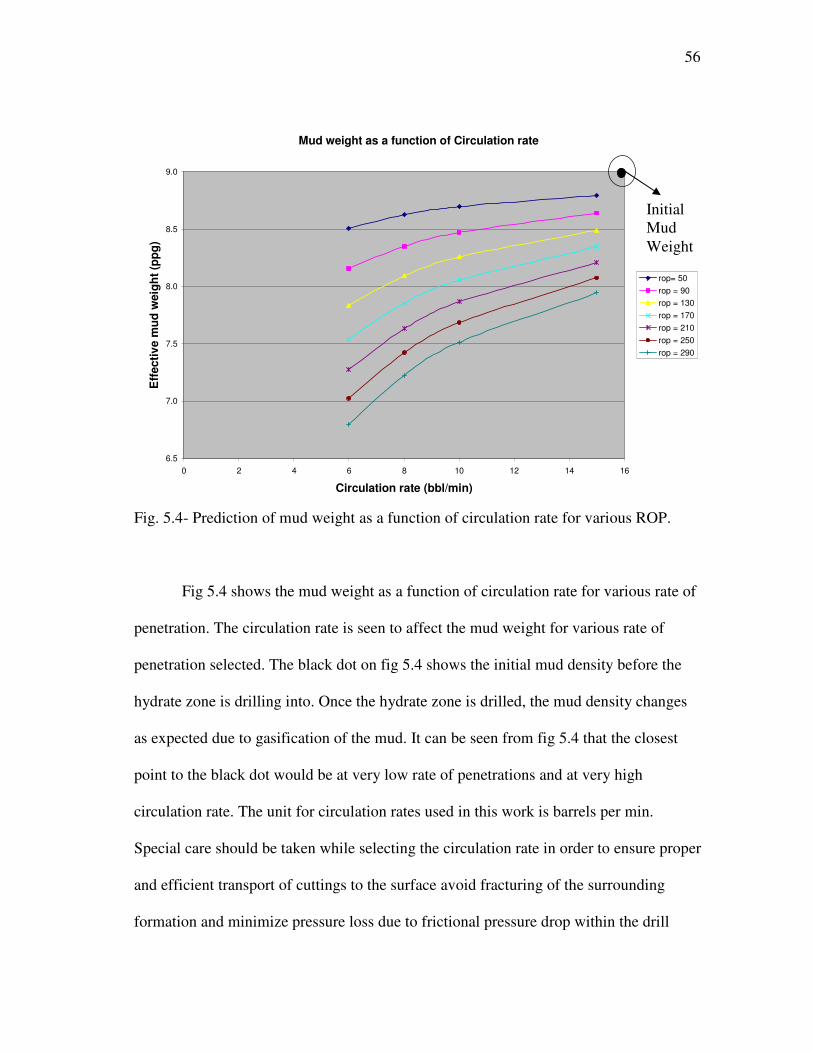
56
Mud weight as a function of Circulation rate
6.5
7.0
7.5
8.0
8.5
9.0
0 2 4 6 8 10 12 14 16
Circulation rate (bbl/min)
Eff
ecti
ve m
ud
weig
ht
(pp
g)
rop= 50
rop = 90
rop = 130
rop = 170
rop = 210
rop = 250
rop = 290
Fig. 5.4- Prediction of mud weight as a function of circulation rate for various ROP.
Fig 5.4 shows the mud weight as a function of circulation rate for various rate of
penetration. The circulation rate is seen to affect the mud weight for various rate of
penetration selected. The black dot on fig 5.4 shows the initial mud density before the
hydrate zone is drilling into. Once the hydrate zone is drilled, the mud density changes
as expected due to gasification of the mud. It can be seen from fig 5.4 that the closest
point to the black dot would be at very low rate of penetrations and at very high
circulation rate. The unit for circulation rates used in this work is barrels per min.
Special care should be taken while selecting the circulation rate in order to ensure proper
and efficient transport of cuttings to the surface avoid fracturing of the surrounding
formation and minimize pressure loss due to frictional pressure drop within the drill
Initial
Mud
Weight
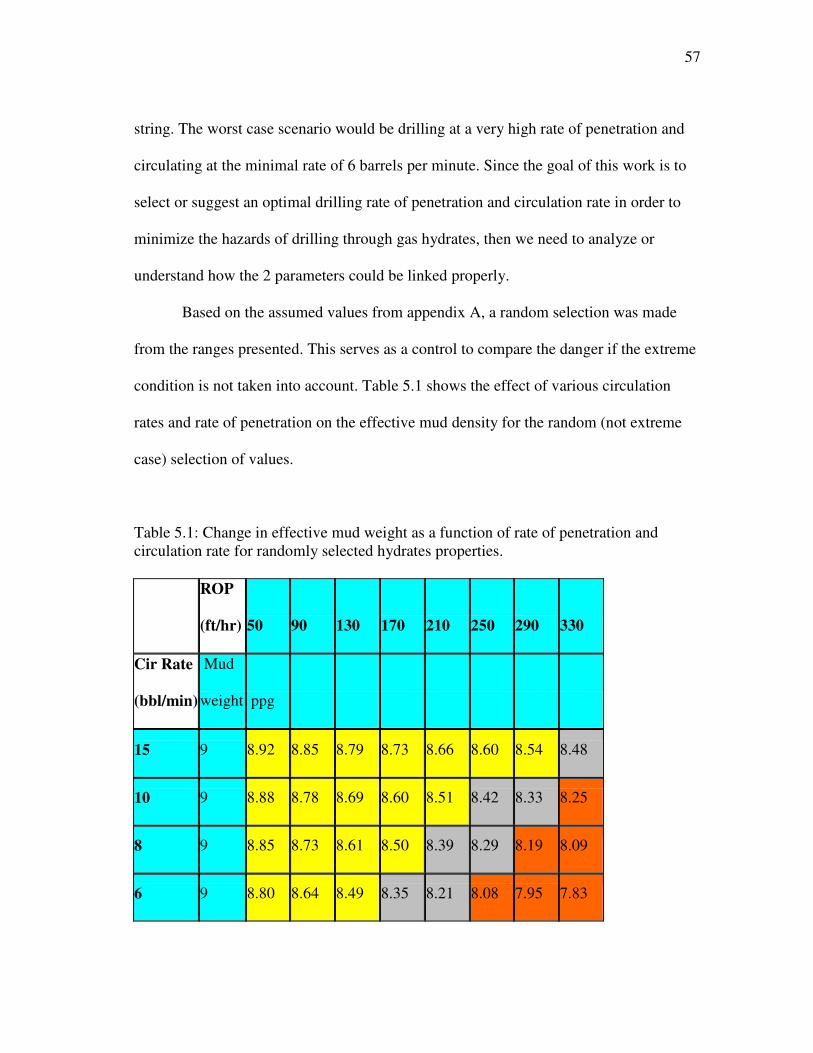
57
string. The worst case scenario would be drilling at a very high rate of penetration and
circulating at the minimal rate of 6 barrels per minute. Since the goal of this work is to
select or suggest an optimal drilling rate of penetration and circulation rate in order to
minimize the hazards of drilling through gas hydrates, then we need to analyze or
understand how the 2 parameters could be linked properly.
Based on the assumed values from appendix A, a random selection was made
from the ranges presented. This serves as a control to compare the danger if the extreme
condition is not taken into account. Table 5.1 shows the effect of various circulation
rates and rate of penetration on the effective mud density for the random (not extreme
case) selection of values.
Table 5.1: Change in effective mud weight as a function of rate of penetration and
circulation rate for randomly selected hydrates properties.
ROP
(ft/hr) 50 90 130 170 210 250 290 330
Cir Rate
(bbl/min)
Mud
weight ppg
15 9 8.92 8.85 8.79 8.73 8.66 8.60 8.54 8.48
10 9 8.88 8.78 8.69 8.60 8.51 8.42 8.33 8.25
8 9 8.85 8.73 8.61 8.50 8.39 8.29 8.19 8.09
6 9 8.80 8.64 8.49 8.35 8.21 8.08 7.95 7.83
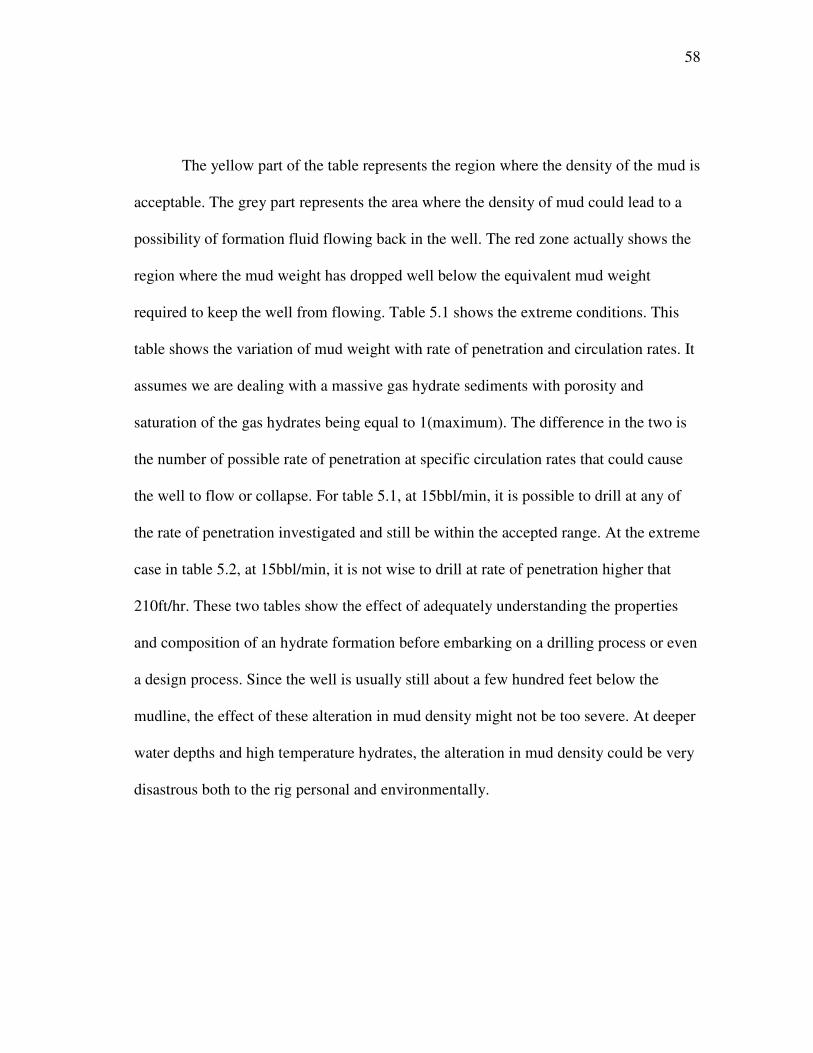
58
The yellow part of the table represents the region where the density of the mud is
acceptable. The grey part represents the area where the density of mud could lead to a
possibility of formation fluid flowing back in the well. The red zone actually shows the
region where the mud weight has dropped well below the equivalent mud weight
required to keep the well from flowing. Table 5.1 shows the extreme conditions. This
table shows the variation of mud weight with rate of penetration and circulation rates. It
assumes we are dealing with a massive gas hydrate sediments with porosity and
saturation of the gas hydrates being equal to 1(maximum). The difference in the two is
the number of possible rate of penetration at specific circulation rates that could cause
the well to flow or collapse. For table 5.1, at 15bbl/min, it is possible to drill at any of
the rate of penetration investigated and still be within the accepted range. At the extreme
case in table 5.2, at 15bbl/min, it is not wise to drill at rate of penetration higher that
210ft/hr. These two tables show the effect of adequately understanding the properties
and composition of an hydrate formation before embarking on a drilling process or even
a design process. Since the well is usually still about a few hundred feet below the
mudline, the effect of these alteration in mud density might not be too severe. At deeper
water depths and high temperature hydrates, the alteration in mud density could be very
disastrous both to the rig personal and environmentally.
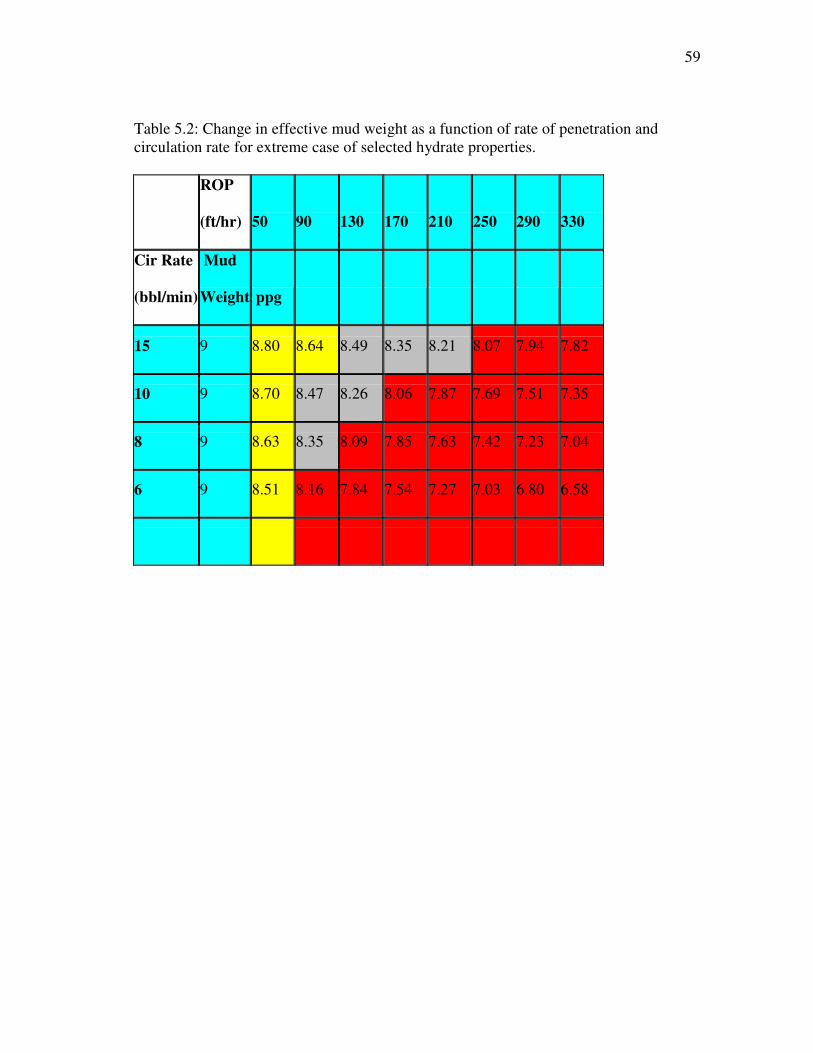
59
Table 5.2: Change in effective mud weight as a function of rate of penetration and
circulation rate for extreme case of selected hydrate properties.
ROP
(ft/hr) 50 90 130 170 210 250 290 330
Cir Rate
(bbl/min)
Mud
Weight ppg
15 9 8.80 8.64 8.49 8.35 8.21 8.07 7.94 7.82
10 9 8.70 8.47 8.26 8.06 7.87 7.69 7.51 7.35
8 9 8.63 8.35 8.09 7.85 7.63 7.42 7.23 7.04
6 9 8.51 8.16 7.84 7.54 7.27 7.03 6.80 6.58
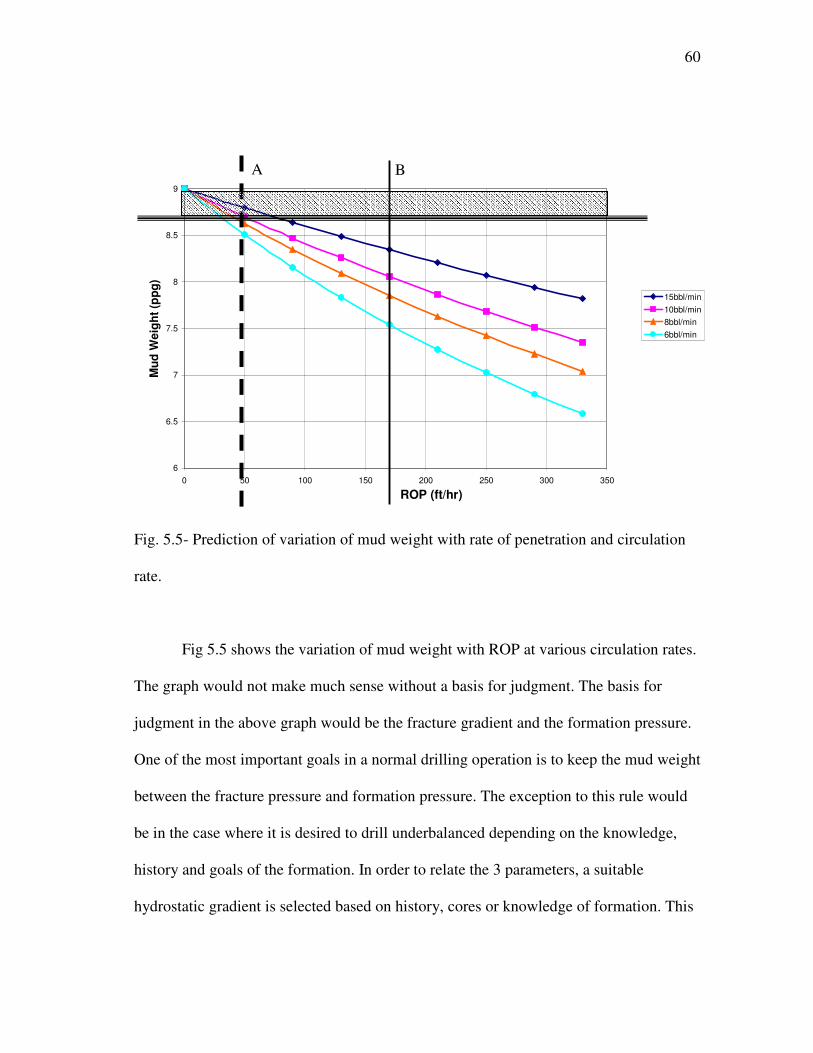
60
6
6.5
7
7.5
8
8.5
9
0 50 100 150 200 250 300 350
ROP (ft/hr)
Mu
d W
eig
ht
(pp
g)
15bbl/min
10bbl/min
8bbl/min
6bbl/min
Fig. 5.5- Prediction of variation of mud weight with rate of penetration and circulation
rate.
Fig 5.5 shows the variation of mud weight with ROP at various circulation rates.
The graph would not make much sense without a basis for judgment. The basis for
judgment in the above graph would be the fracture gradient and the formation pressure.
One of the most important goals in a normal drilling operation is to keep the mud weight
between the fracture pressure and formation pressure. The exception to this rule would
be in the case where it is desired to drill underbalanced depending on the knowledge,
history and goals of the formation. In order to relate the 3 parameters, a suitable
hydrostatic gradient is selected based on history, cores or knowledge of formation. This
A B
61
hydrostatic gradient is used in computing the required mud weight in order to keep the
formation safe. The required mud weight is shown on fig 5.5 with the horizontal dark
colored double line. In this case 8.72ppg is selected. The goal of the drilling team is to
drill and make sure the mud weight is always above 8.72ppg knowing very well it would
never exceed 9ppg due to the dissolution of the gas in the drill mud. According the
graph, only the shaded part of fig 5.5 matches this criterion hence the other 2 parameters
must be selected to match or fall within this area. This leaves us with only very few
possible rates of penetration and circulation rates for this particular example. The
maximum possible ROP would be about 70 ft/hr for the circulation rates investigated in
this work or in order to circulate at 15bbl/min. Since the ROP of penetration is directly
related to drilling time which constitutes a major cost of an offshore well, it is important
to try to maximize the ROP while keeping all other parameters within the safety limit of
the rig, its personnel and the environment in general.
Line A in fig 5.5 shows the maximum possible circulation rate and rate of
penetration for the equivalent mud weight selected (8.72ppg). At a rate of penetration of
60 ft/hr and circulation rate of 15bbl/min, the required mud weight could be achieved.
Line B shows the expected equivalent mud weight based on a randomly selected rate of
penetration. It can be seen from fig 5.5 that at a rate of penetration of 180ft/hr (line B),
the required mud weight could not be achieved at any of the circulation rate tested. A
reduction in either the rate of penetration or circulation rate, while keeping the other
parameter constant actually helps in increasing the mud weight.
62
CHAPTER VI
CONCLUSIONS AND RECOMMENDATIONS
6.1 Conclusions
Gas hydrates are crystalline or ice-like structures made up of water lattice and
guest gases. These crystalline structures are part of a group called clathrate. The
formation and stability of gas hydrates is favored at high pressure and low temperature.
The gases that combine with water to form hydrates include light alkanes (methane and
iso-butane), carbon dioxide, hydrogen sulfide, nitrogen, oxygen and argon. These
conditions and availability of gases are most common in deep offshore areas or
permafrost regions. Gas hydrates are usually a few hundred meters below the mudline
but could extend a thousand meters in depth. A very important property of hydrates is
the amount of natural gas that can be held in the lattice structure. 1ft3 of gas hydrate
could hold as much as 170ft3 of gas.
Based on the increasing need for energy, more wells are being drilled in areas of
deeper waters. These areas have provided cores which indicate the presence of gas
hydrate. The need to study and understand the properties of gas hydrate lies in a number
of factors. Gas hydrates contain an enormous amount of energy which is anticipated to
provide alternative sources of energy in the near future. The presence of gas hydrate in
deeper offshore areas emphasizes the need to deal with them as we try to harness the
hydrocarbon found beneath these hydrate zones. Recently, the effect of gas hydrate on
the environment and most specially on global warming has also brought the topic more
research consideration.
63
The industry solution has always been to avoid gas hydrate bearing zones while
drilling. This is in a bid to avoid the dangers associated with drilling through these
formations. Some of the notable problems include wellbore stability, gas cut mud, and
seafloor stability amongst others. Based on this research, we have been able to suggest
some possible ways of drilling through gas hydrate formations and avoiding some of the
afore-mentioned problems. Using the rate of penetration, circulation rate and effective
mud weight as a basis, various relationships were observed between the 3 parameters
mentioned. More parameters could be included in this analysis in order to improve the
effectiveness of the process or help modify the results obtained. Such parameters would
include drilling bit temperature, gas hydrate dissociation at the front of the well and
drilling mud composition and property. The cost of operating an offshore rig is very high
and so there is little or no room for errors. This further emphasizes the need to
completely understand the behavior and dangers associated with drilling through gas
hydrate formations. The depths at which the gas hydrate are encountered greatly affect
the type of drilling fluid to be used in drilling. Either the water based drilling fluid or the
synthetic based drilling fluid is used. Oil based fluid have been banned in most deep
water operations for safety reasons.
The rate of penetration in deep offshore wells greatly affects the total cost of a
drilling operation, hence the need to select an optimum and safe drilling rate. The rate of
penetration into a gas hydrate bearing formation is directly proportional to the amount of
gas produced (which can also be referred to as drilled gas). This amount of gas produced
64
per hour is a function of the height of formation drilled which is used in the computation
of the volume of gas.
The expansion of the gas based on temperature and pressure conditions from
downhole to seafloor and possibly surface facility, is significant. The amount of gas
produced due to dissociation of drilled hydrates at the bits is directly proportional to the
volumetric expansion of the gas as it moves up the annulus unto the seafloor or to the
surface. The lesser the volume of gas, the easier and less dangerous it is for the entire
drill team. A lower volume of gas actually puts less stress on the wellhead or sub sea
equipment.
The effect of the drilling fluid/mud circulation rate is felt in many stages of a
drilling operation. The circulation rate plays an important role in hole cleaning, frictional
pressure drop and in maintaining wellbore stability as seen in fig 5.4 and 5.5. As the rate
of penetration increases, for a specific circulation rate, more gas is produced and hence
the effective density of the mud is reduced. An economic and safety compromise could
be reached between the rate of penetration and circulation rate in order to achieve a
desired drilling fluid density. Based on the work done, it can be concluded that it is safer
to select the circulation rate first before the rate of penetration. By selecting the
circulation rate, based on the bottom hole pressure required, we can then set the rate of
penetration to the maximum safety level based on the calculated hydrostatics of the
annulus. This process allows us drill at the maximum possible rate of penetration having
taken into control the effect of circulation rate and expected mud. From the results
presented in the chapter V, by selecting 15bbl/min as the circulation rate (this does not
65
cause downhole damage based on calculations carried out), the maximum drilling rate to
keep the mud density within an acceptable limit would be 75ft/hr. Initially, the well
might have been moved in order to avoid the problems associated with the hydrates
zone, but with these type of analyses and calculations could shed more light on using the
controllable drilling parameters to deal with the anticipated problems.
6.2 Recommendations and Future Work
Based on the results and conclusions, a better understanding of the properties of
gas hydrates mixed with the available state of the art technology and knowledge of
drilling, could help solve some or most of the problems associated with drilling through
gas hydrate.
In future, a well documented core analysis from a known hydrate zone would
surely provide more accurate results. It could improve the accuracy of analyzing the
dangers attached to a particular field knowing very well that the dangers range from
place to place based on the types and structure of hydrates present or recovered in that
area.
The drill bit temperature has not been really included in the course of this work.
We have assumed instantaneous dissociation of the hydrates while drilling. Future work
should verify the dissociation rate of the drilled hydrates as that would affect the amount
of gas entering the drilling mud.
Finally, more work is needed in understanding the effect of dissociation of the
gas hydrate at the front or the edges of the drilled wellbore. This dissociation could
66
worsen the hydrostatic effect on the wellbore by adding more gas to the drilling fluid or
could actually lead to seafloor instability based on the temperature of the mud and
drilling bit temperature. It is very likely that the continuous understanding of gas hydrate
from a drilling perspective could actually improve the success in producing the
enormous resource trapped in these formations.
67
REFERENCES
1. Makogun, Y.F., Hydrates of Hydrocarbon, PennWell, Tulsa, Oklahoma. 1997
2. Pooladi-Darvish, M.: “Gas Production from Hydrate Reservoirs and Its
Modeling,” SPE paper 86827, Distinguished Author Series, June 2004
3. Dalmazzone, B., Herzhaft, B., Rousseau, L. and Le Parlouer, P.: “Prediction of
Gas Hydrate Formation with DSC Technique,” SPE paper 84315 presented at the
2003 SPE ATCE, Denver, Colorado, 5-8 October.
4. Sinquin, A., Palermo, T. and Peysson, Y.: “Rheological and Flow Properties of
Gas Hydrate Suspensions,” Oil and Gas Science and Technology Journal, (2004)
59 (1) : 41-57
5. Max, M.D. and Dillion W.P., Natural Gas Hydrates in Oceanic and Permafrost
Environments, Kluwer Academic Publishers, Netherlands, 2000.
6. Colett, T.S., “Natural Gas Hydrates: Resource of the Twenty-First Century,” US
Geological Survey, Denver Colorado, AAPG Memoir 74, pp 85-108.
7. Edmonds, B., Pickering, P.F., Moorwood, R.A.S., Szczepanski, R. and Watson,
M.J.: “Evaluating New Chemicals and Alternatives for Mitigating Hydrates in
Oil and Gas Production,” IIR Conference, Aberdeen, September 2001.
8. Thomas, C.P.: “Methane Hydrates: Major Energy Source for the Future or
Wishful Thinking?,” SPE paper 71452 presented at the 2001 SPE Annual
Technical Conference and Exhibition New Orleans, Louisiana, 30 September -3
October.
68
9. Barker, J.W. and Gomez, R.K.: “Formation of Hydrates during Deepwater
Drilling Operations,” SPE paper 16130 presented at the 1987 SPE/IADC Drilling
Conference, New Orleans, Louisiana, March 15-18.
10. Marques, L.C.C., Pedroso, C.A. and Neumann, L.F.: “Gas Hydrate Buildup
Problems in Subsea Christmas-Trees,” SPE paper 77572 presented at the SPE
ATCE, San Antonio, Texas, 29 September – 2 October 2002.
11. Hahhegan, P.E., Todd, R.J and Pritchard, D.M.: “MPD-Uniquely Applicable to
Methane Hydrate Drilling,” SPE paper 91560 presented at the 2004 SPE/IADC
Underbalanced Technology Conference and Exhibition, Houston, Texas, U.S.A.,
11- 12 October.
12. Hammerschimdt, E.G.: “ Preventing and Removing Gas Hydrate Formation in
Natural Gas Pipe Lines,” Oil and Gas Journal, (May 11, 1939) 66-72
13. North slope exploration plans shaping up program (Oct 2006)
www.petroleumnews.com/pntruncate/231213326.shtml
14. Ebeltoft, H., Yousif, M. and Soergard, E.: “Hydrate Control during Deep Water
Drilling: Overview and New Drilling Fluid Formulations,” SPE paper 68207
presented at the 1997 SPE ATCE, San Antonio, Texas, 5-8 October.
15. Halliday, W., Clapper, D. and Smalling, M.: “New Gas Hydrate Inhibitors for
Deep Water Drilling Fluids,” IADC/SPE paper 39316 presented at the 1998
IADC/SPE Conference, Dallas, Texas, 3-6 March.
16. Maurer, W.C.: “The Perfect Cleaning- Theory of Rotary Drilling,” Journal of
Petroleum Technology, (1962), 225, 1270-74
69
17. David Watson, Terry Brittenham, and Preston L. M Format., Advanced Well
Control, Society of Petroleum Engineers, (2003), 10
18. Booth, J.S., Rowe, M.M., and Fischer, K.M., Offshore Gas Hydrate Sample
Database with an Overview and Preliminary Analysis, U.S. Geological Survey
Open-File Report (1996), 96-272 (http://pubs.usgs.gov/of/1996/of96-
272/ch03s02.html)
19. Holditch, S. and Jones, E.: “Characterizing Natural Gas Hydrates in the Deep
Water Gulf of Mexico: Applications for Safe Exploration and Production
Activities Third Semi-Annual Report,” Chevron Texaco Exploration and
Production Technology Company, Houston, Texas, Oct 2002 to March 2003.
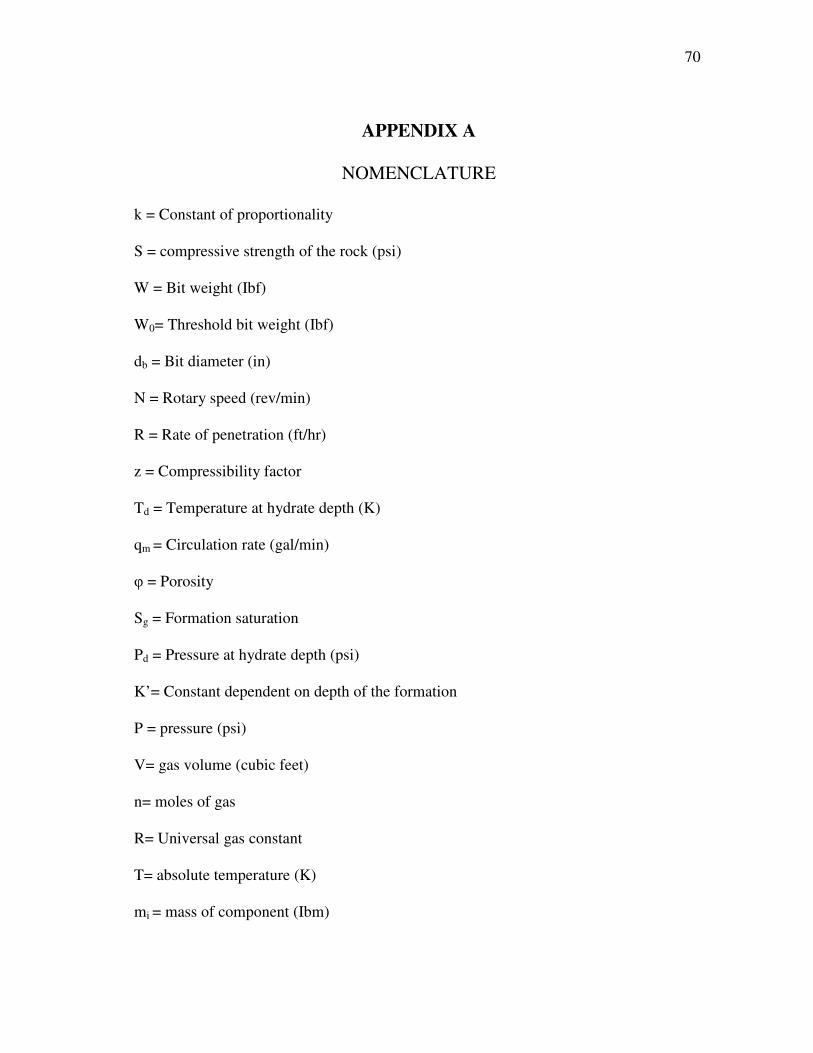
70
APPENDIX A
NOMENCLATURE
k = Constant of proportionality
S = compressive strength of the rock (psi)
W = Bit weight (Ibf)
W0= Threshold bit weight (Ibf)
db = Bit diameter (in)
N = Rotary speed (rev/min)
R = Rate of penetration (ft/hr)
z = Compressibility factor
Td = Temperature at hydrate depth (K)
qm = Circulation rate (gal/min)
φ = Porosity
Sg = Formation saturation
Pd = Pressure at hydrate depth (psi)
K’= Constant dependent on depth of the formation
P = pressure (psi)
V= gas volume (cubic feet)
n= moles of gas
R= Universal gas constant
T= absolute temperature (K)
mi = mass of component (Ibm)
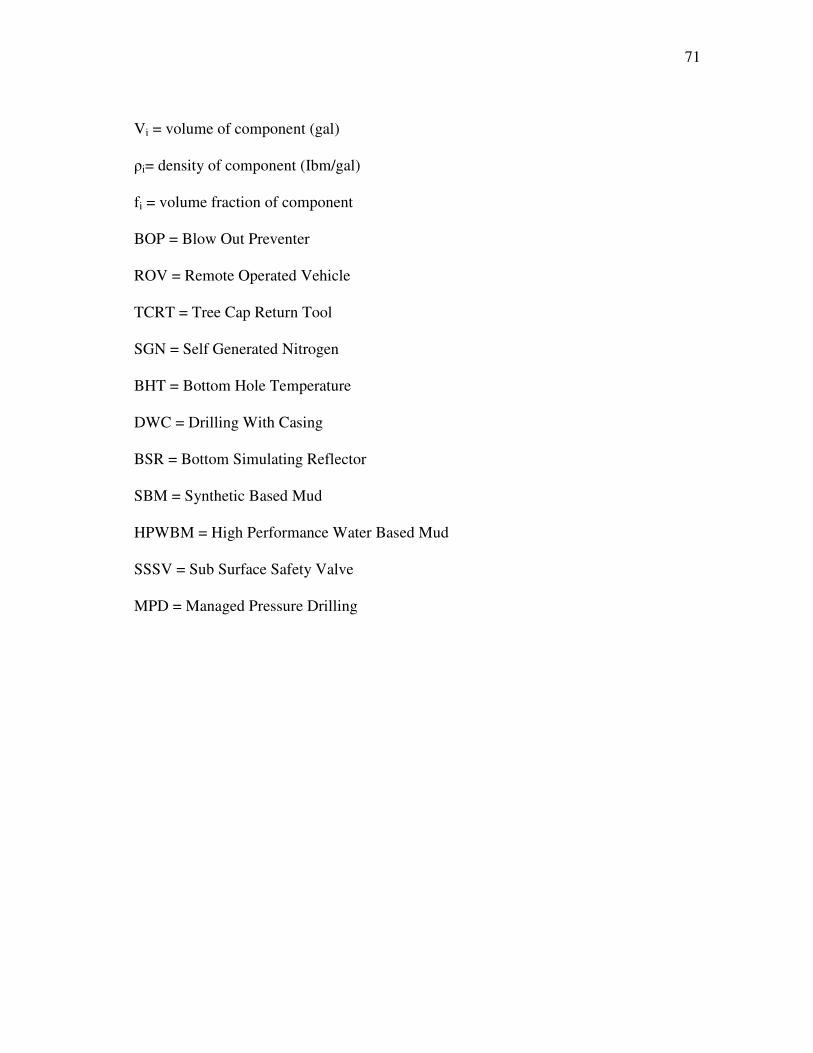
71
Vi = volume of component (gal)
ρi= density of component (Ibm/gal)
fi = volume fraction of component
BOP = Blow Out Preventer
ROV = Remote Operated Vehicle
TCRT = Tree Cap Return Tool
SGN = Self Generated Nitrogen
BHT = Bottom Hole Temperature
DWC = Drilling With Casing
BSR = Bottom Simulating Reflector
SBM = Synthetic Based Mud
HPWBM = High Performance Water Based Mud
SSSV = Sub Surface Safety Valve
MPD = Managed Pressure Drilling
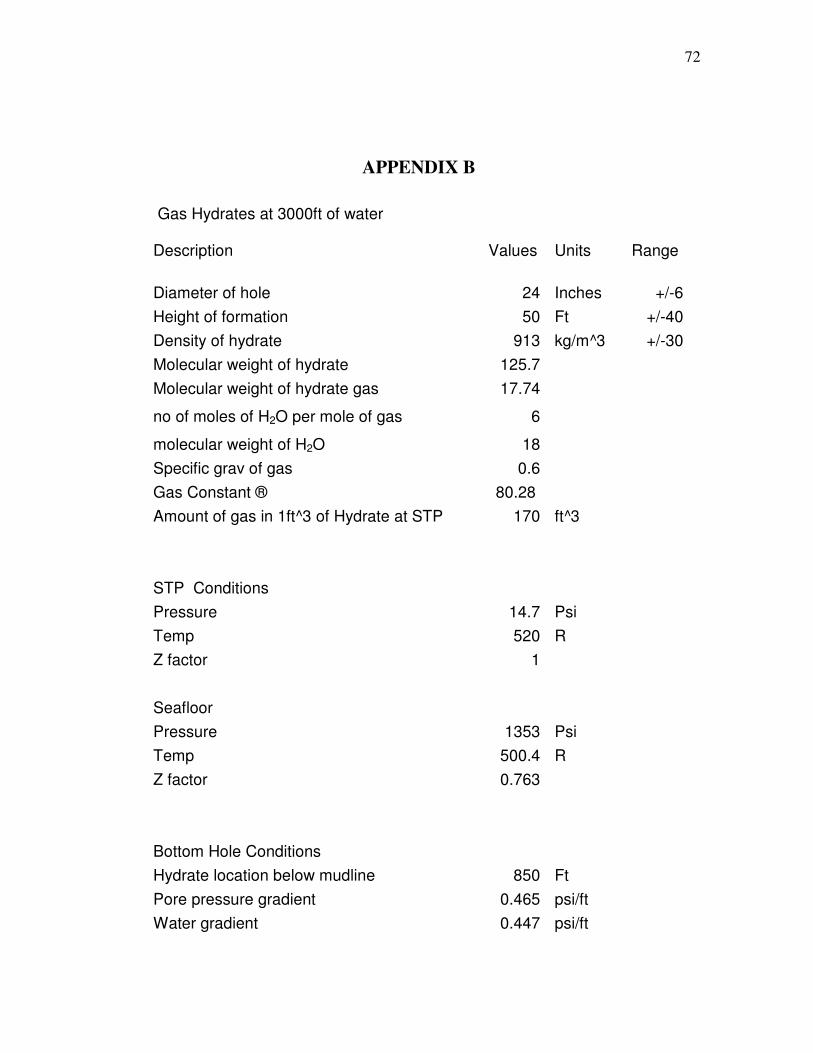
72
APPENDIX B
Gas Hydrates at 3000ft of water Description Values Units Range
Diameter of hole 24 Inches +/-6
Height of formation 50 Ft +/-40
Density of hydrate 913 kg/m^3 +/-30
Molecular weight of hydrate 125.7
Molecular weight of hydrate gas 17.74
no of moles of H2O per mole of gas 6
molecular weight of H2O 18
Specific grav of gas 0.6
Gas Constant ® 80.28
Amount of gas in 1ft^3 of Hydrate at STP 170 ft^3
STP Conditions
Pressure 14.7 Psi
Temp 520 R
Z factor 1
Seafloor
Pressure 1353 Psi
Temp 500.4 R
Z factor 0.763
Bottom Hole Conditions
Hydrate location below mudline 850 Ft
Pore pressure gradient 0.465 psi/ft
Water gradient 0.447 psi/ft
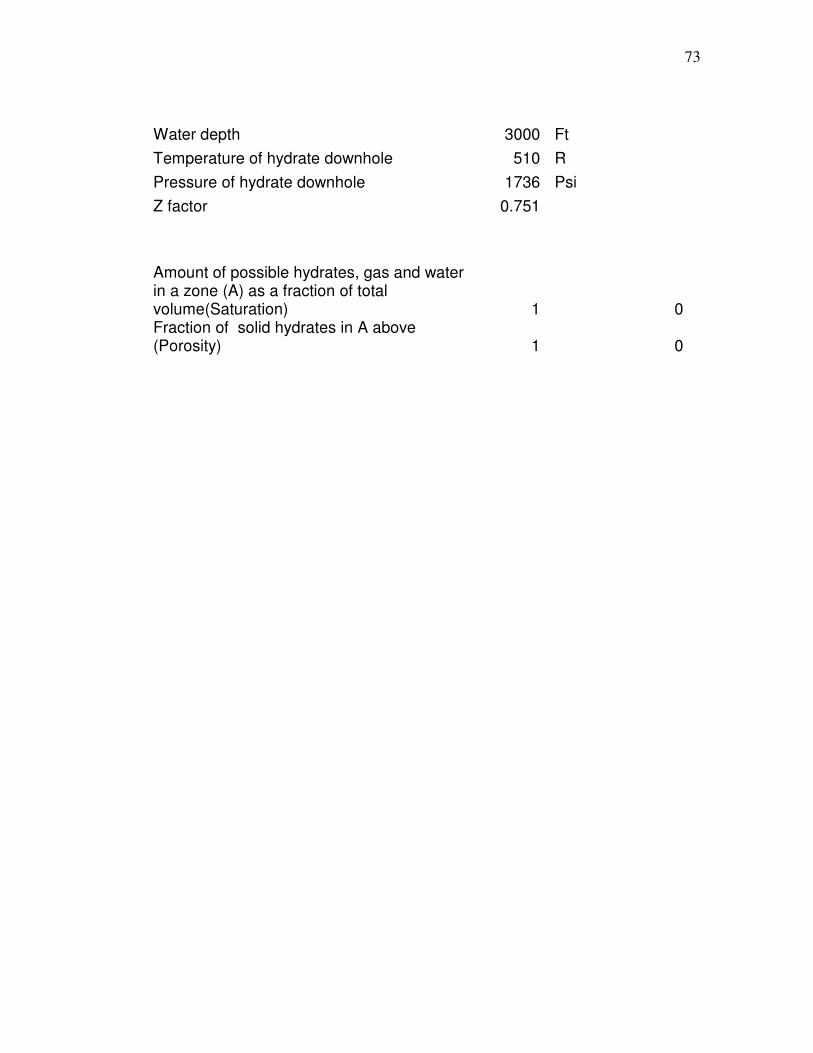
73
Water depth 3000 Ft
Temperature of hydrate downhole 510 R
Pressure of hydrate downhole 1736 Psi
Z factor 0.751
Amount of possible hydrates, gas and water in a zone (A) as a fraction of total volume(Saturation) 1 0 Fraction of solid hydrates in A above (Porosity) 1 0
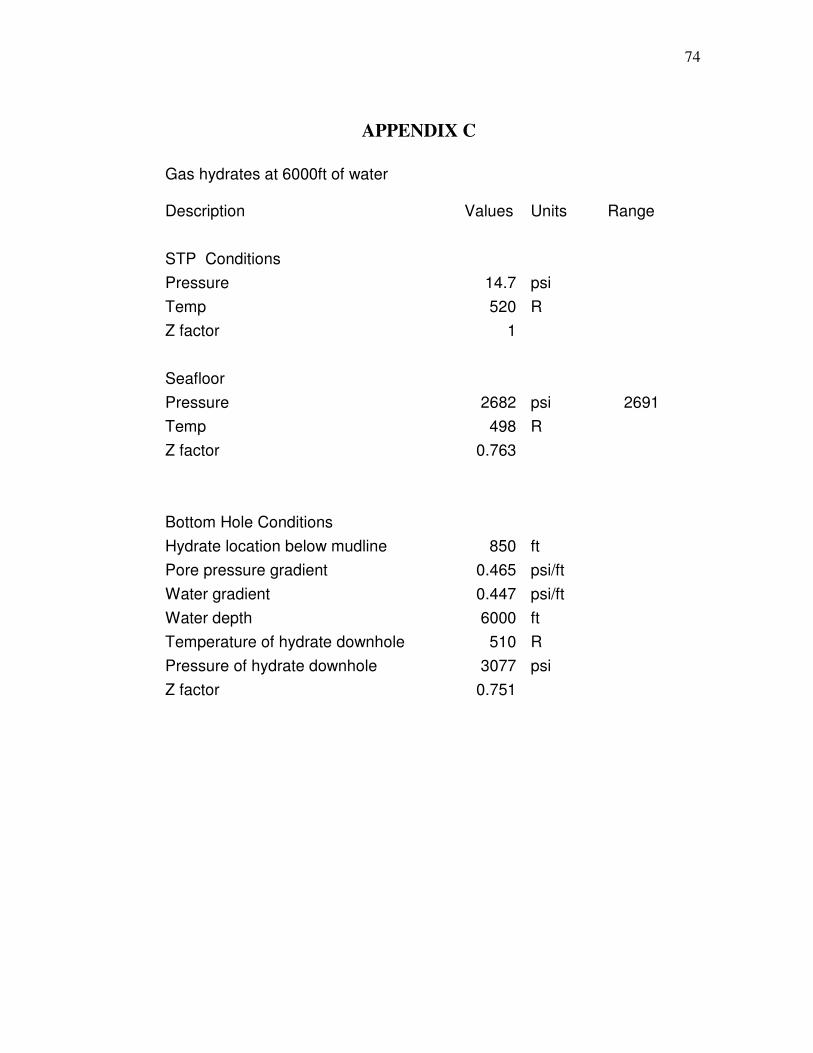
74
APPENDIX C
Gas hydrates at 6000ft of water Description Values Units Range
STP Conditions
Pressure 14.7 psi
Temp 520 R
Z factor 1
Seafloor
Pressure 2682 psi 2691
Temp 498 R
Z factor 0.763
Bottom Hole Conditions
Hydrate location below mudline 850 ft
Pore pressure gradient 0.465 psi/ft
Water gradient 0.447 psi/ft
Water depth 6000 ft
Temperature of hydrate downhole 510 R
Pressure of hydrate downhole 3077 psi
Z factor 0.751
75
VITA
Name: Afolabi Ayoola Amodu
Born: Lagos, Nigeria
Permanent Address: 4 Egunjobi Street
Shasha, Akowonjo
Lagos, Nigeria
Email: [email protected]
Education: M.S., Petroleum Engineering
Texas A&M University
USA, 2008
B.S., Chemical Engineering
University of Lagos
Nigeria, 2004
Under Member: Society of Petroleum Engineers
American Institute of Chemical Engineers