Embed Size (px)
Citation preview
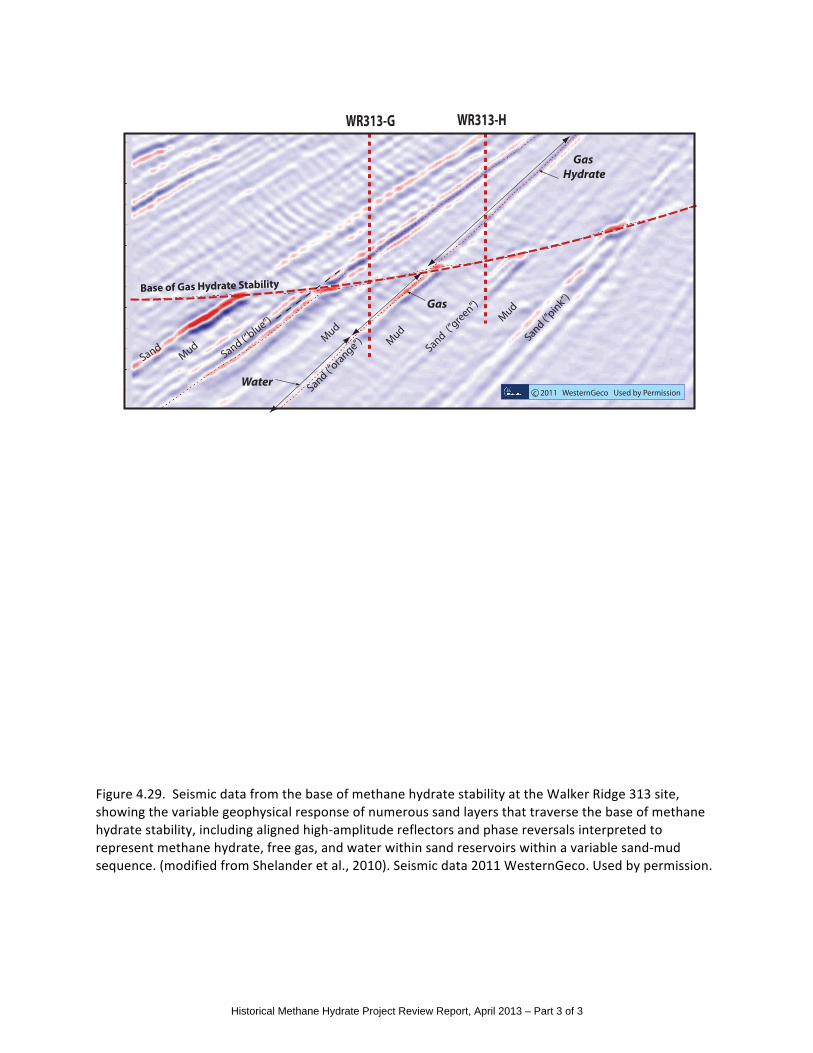
Figure 4.29. Seismic data from the base of methane hydrate stability at the Walker Ridge 313 site, showing the variable geophysical response of numerous sand layers that traverse the base of methane hydrate stability, including aligned high-‐amplitude reflectors and phase reversals interpreted to represent methane hydrate, free gas, and water within sand reservoirs within a variable sand-‐mud sequence. (modified from Shelander et al., 2010). Seismic data 2011 WesternGeco. Used by permission.
WR313-G WR313-H
Base of Gas Hydrate Stability
c 2011 WesternGeco Used by Permission
Sand (”pink”)
Mud
Mud Mud
Mud
Sand (”green”)
Sand (”orange”)
Sand (”blue”)
Sand
Gas
Water
Gas Hydrate
Historical Methane Hydrate Project Review Report, April 2013 – Part 3 of 3
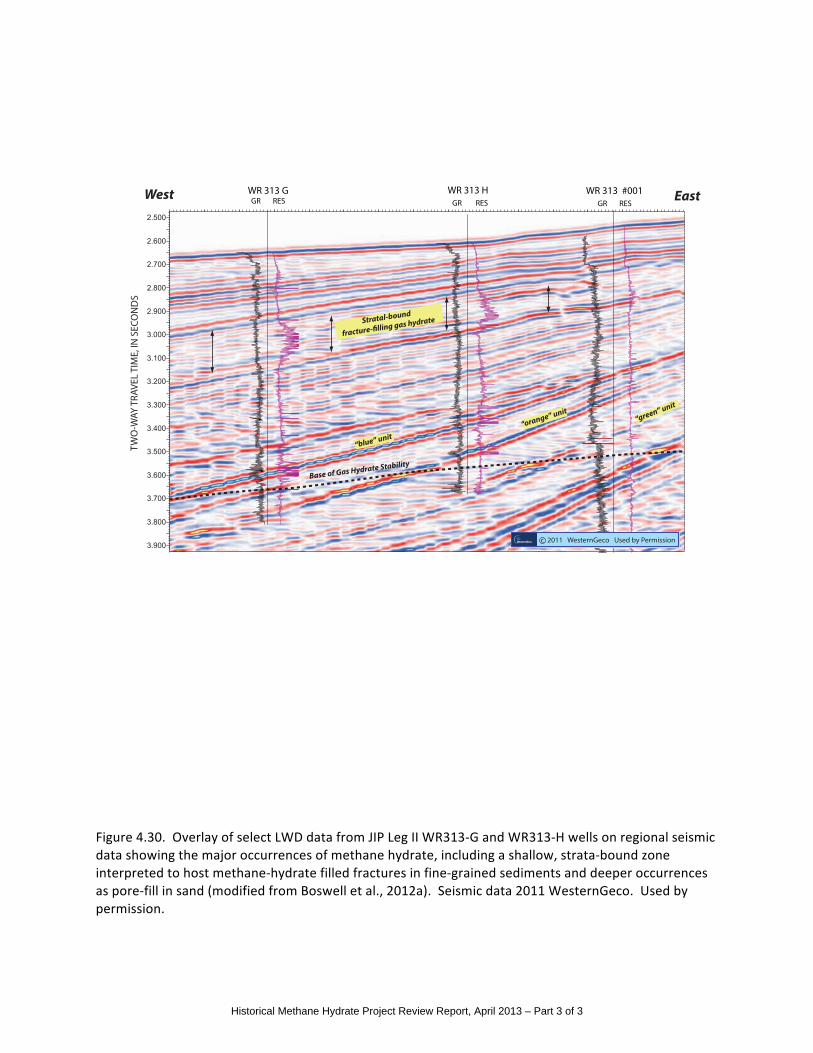
Figure 4.30. Overlay of select LWD data from JIP Leg II WR313-‐G and WR313-‐H wells on regional seismic data showing the major occurrences of methane hydrate, including a shallow, strata-‐bound zone interpreted to host methane-‐hydrate filled fractures in fine-‐grained sediments and deeper occurrences as pore-‐fill in sand (modified from Boswell et al., 2012a). Seismic data 2011 WesternGeco. Used by permission.
2.500
2.600
2.700
2.800
2.900
3.000
3.100
3.200
3.300
3.400
3.500
3.600
3.700
3.800
3.900
2.500
2.600
2.700
2.800
2.900
3.000
3.100
3.200
3.300
3.400
3.500
3.600
3.700
3.800
3.900
6186.09305.0
6198.09325.0
6210.09345.0
6229.09356.0
6249.09366.0
Line:Trace:
0 500 1000 1500 2000 2500 3000 3500 4000 4500 5000 5500 6000 6500 7000Offset:
WR313G WR313H WR313#12562 ft 2344 ft
2.500
2.600
2.700
2.800
2.900
3.000
3.100
3.200
3.300
3.400
3.500
3.600
3.700
3.800
3.900
WR 313 H GR RES
WR 313 GGR RES
WR 313 #001 GR RES
TWO
-WAY
TRA
VEL
TIM
E, IN
SEC
ON
DS
c 2011 WesternGeco Used by Permission
Stratal-bound
fracture-!lling gas hydrate
“blue” unit“orange” unit
“green” unit
Base of Gas Hydrate Stability
West East
Historical Methane Hydrate Project Review Report, April 2013 – Part 3 of 3
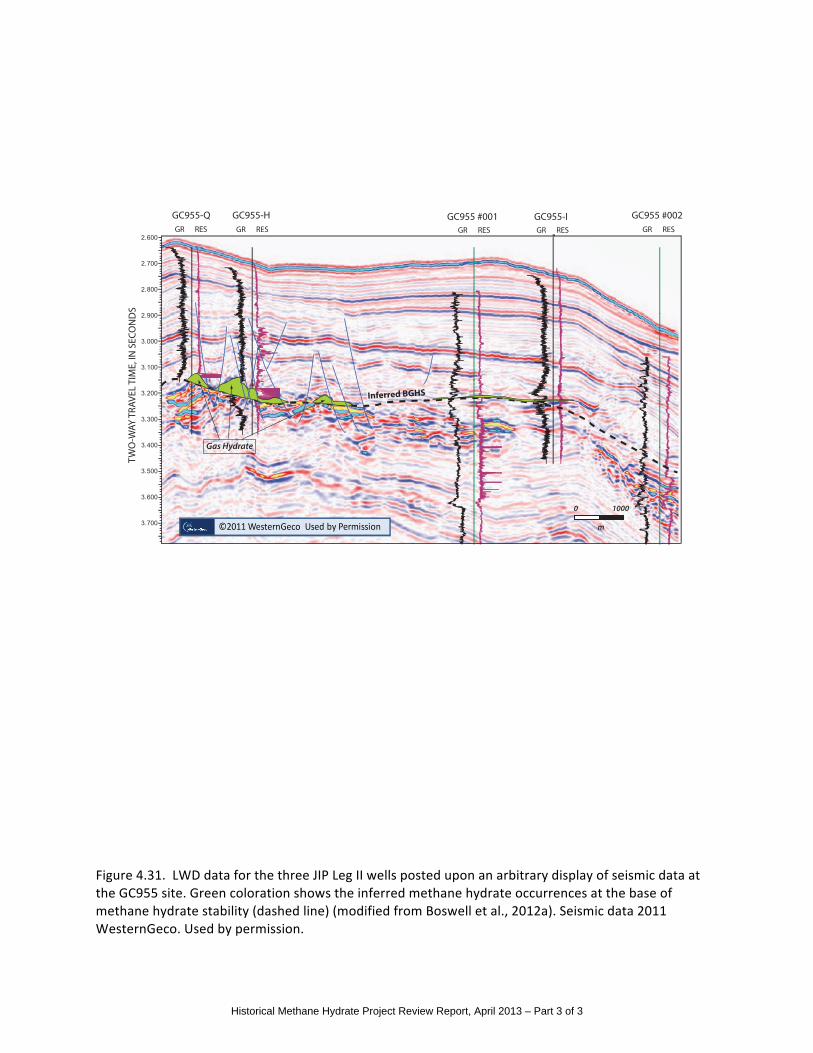
Figure 4.31. LWD data for the three JIP Leg II wells posted upon an arbitrary display of seismic data at the GC955 site. Green coloration shows the inferred methane hydrate occurrences at the base of methane hydrate stability (dashed line) (modified from Boswell et al., 2012a). Seismic data 2011 WesternGeco. Used by permission.
2.600
2.700
2.800
2.900
3.000
3.100
3.200
3.300
3.400
3.500
3.600
3.700 ©2011 WesternGeco Used by Permission
GC955-Q GC955-H GC955 #001 GC955-I GC955 #002GR RES GR RES GR RESGR RESGR RES
Inferred BGHS
Gas Hydrate
0 1000
m
TWO
-WAY
TRA
VEL
TIM
E, IN
SEC
ON
DS
Historical Methane Hydrate Project Review Report, April 2013 – Part 3 of 3

Figure 4.32. LWD data from the two wells drilled at the Alaminos Canyon 21 site posted over seismic data (modified from Boswell et al., 2012a). Seismic data 2011 WesternGeco. Used by permission.
2.0
2.1
2.2
2.3
2.4
2.5
2.6
2.7
2.8
AC21-A AC21-B
c 2011 WesternGeco Used by Permission
GR RESGR RES
minor disseminated gas hydrate in muds
base of gas hydrate stability
Target sand
mud-prone MTD
mud-prone MTD
TWO
-WAY TRAVEL TIM
E, IN SECO
ND
S
Historical Methane Hydrate Project Review Report, April 2013 – Part 3 of 3

Figure 4.33. Map of the Ulleung Basin off the southeast coast of the Republic of Korea depicting bathymetry, seismic data coverage and drill sites established during the First and Second Ulleung Basin Gas Hydrate Expedition (UBGH1 and UBGH2).
Historical Methane Hydrate Project Review Report, April 2013 – Part 3 of 3
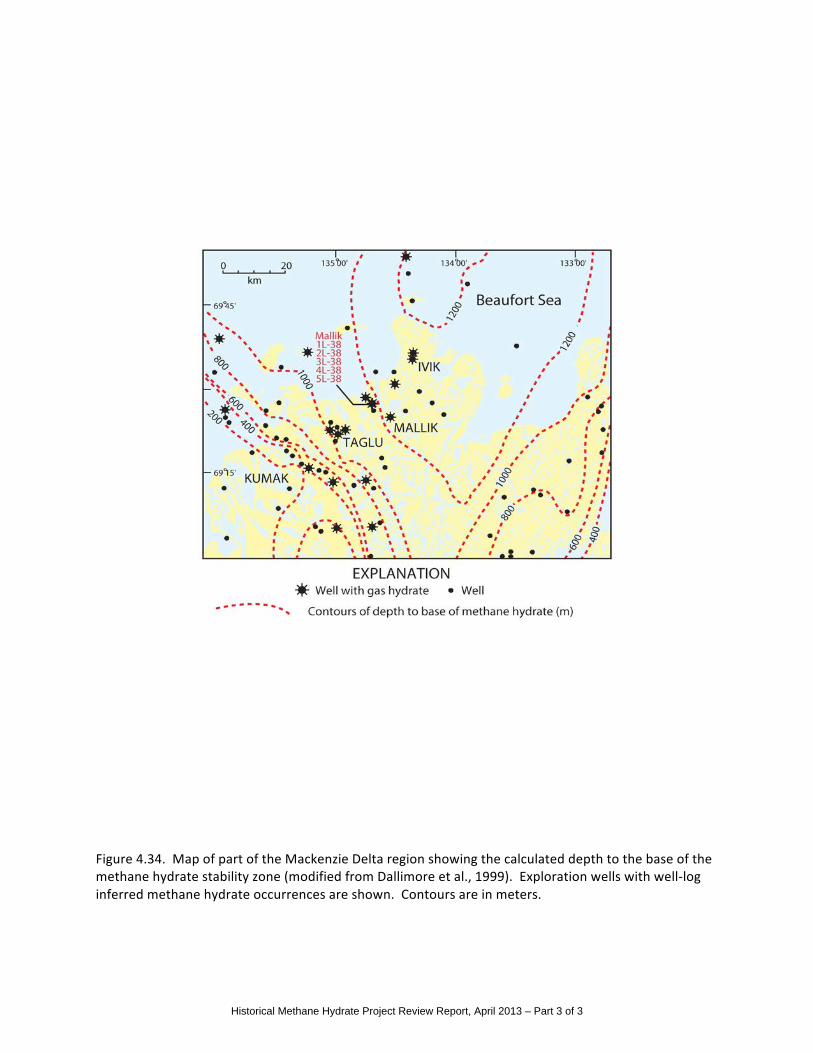
Figure 4.34. Map of part of the Mackenzie Delta region showing the calculated depth to the base of the methane hydrate stability zone (modified from Dallimore et al., 1999). Exploration wells with well-‐log inferred methane hydrate occurrences are shown. Contours are in meters.
Historical Methane Hydrate Project Review Report, April 2013 – Part 3 of 3

Figure 4.35. Fence diagram showing well-‐log-‐derived methane hydrate concentrations and natural gamma-‐ray logs for Imperial Oil Ltd. Mallik L-‐38, JAPEX/JNOC/GSC Mallik 2L-‐38, and JAPEX/JNOC/GSC et al. Mallik 5L-‐38 wells. The well locations are shown on the insert location map (Dallimore and Collett, 2005)
Historical Methane Hydrate Project Review Report, April 2013 – Part 3 of 3
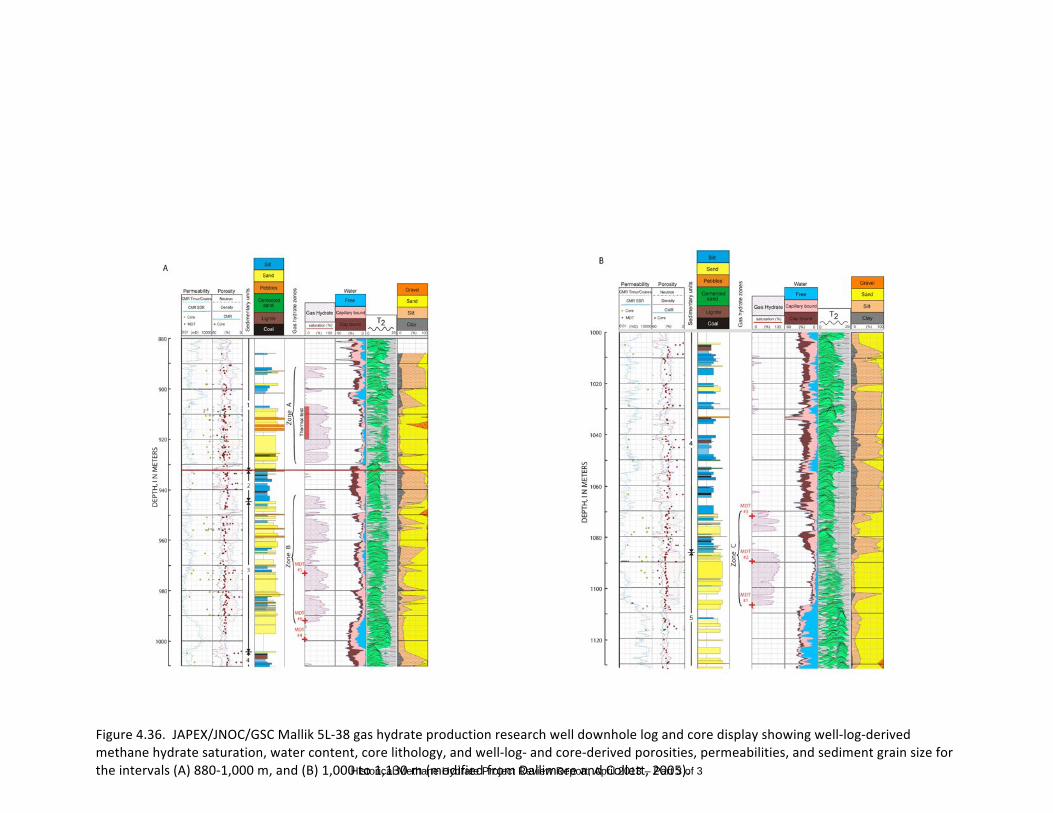
Figure 4.36. JAPEX/JNOC/GSC Mallik 5L-‐38 gas hydrate production research well downhole log and core display showing well-‐log-‐derived methane hydrate saturation, water content, core lithology, and well-‐log-‐ and core-‐derived porosities, permeabilities, and sediment grain size for the intervals (A) 880-‐1,000 m, and (B) 1,000 to 1,130 m (modified from Dallimore and Collett, 2005). Historical Methane Hydrate Project Review Report, April 2013 – Part 3 of 3
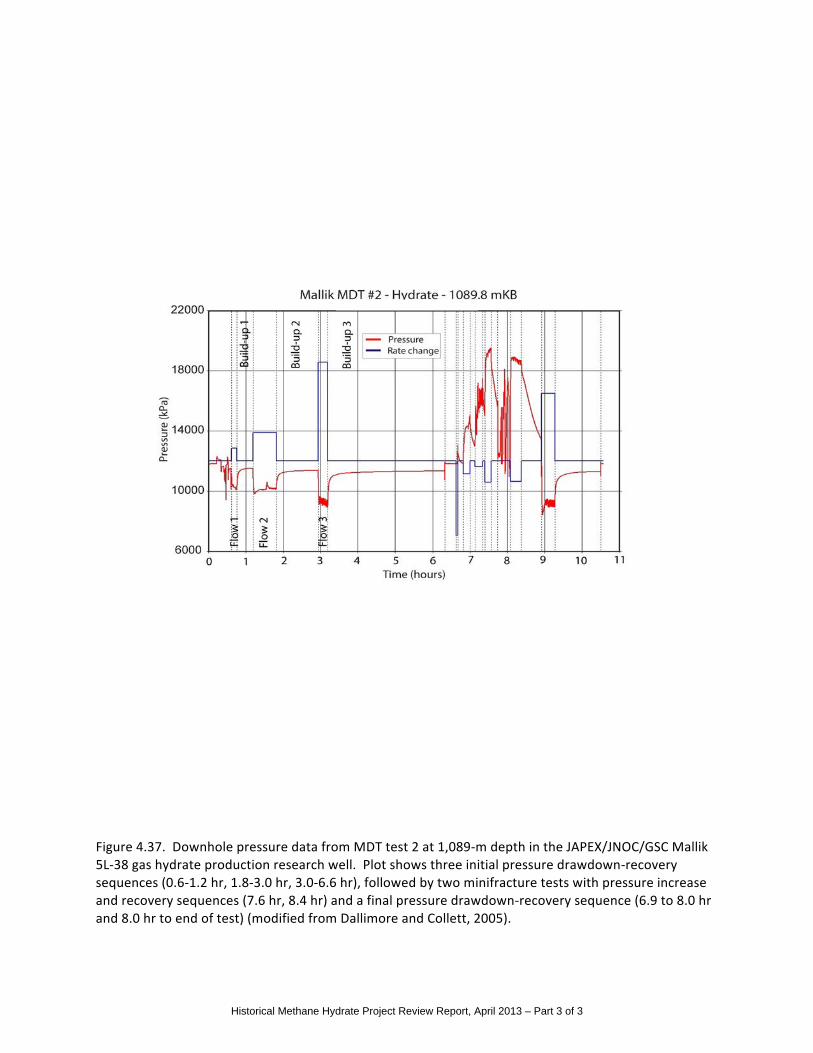
Figure 4.37. Downhole pressure data from MDT test 2 at 1,089-‐m depth in the JAPEX/JNOC/GSC Mallik 5L-‐38 gas hydrate production research well. Plot shows three initial pressure drawdown-‐recovery sequences (0.6-‐1.2 hr, 1.8-‐3.0 hr, 3.0-‐6.6 hr), followed by two minifracture tests with pressure increase and recovery sequences (7.6 hr, 8.4 hr) and a final pressure drawdown-‐recovery sequence (6.9 to 8.0 hr and 8.0 hr to end of test) (modified from Dallimore and Collett, 2005).
Historical Methane Hydrate Project Review Report, April 2013 – Part 3 of 3

Figure 4.38. (A) Schematic diagram showing the thermal-‐production test interval, depth 907 to 920 m, in the JAPEX/JNOC/GSC Mallik 5L-‐38 gas hydrate production research well. Downhole log montage shows well log-‐ and core-‐derived permeability and porosity data, lithology, and summary of cased-‐hole log interpretation. Also shown is the downhole configuration of the perforated interval, circulation tubing, and packer. (B) Results from the thermal-‐production tests, showing average hourly production rate and cumulative gas production (modified from Dallimore and Collett, 2005).
Historical Methane Hydrate Project Review Report, April 2013 – Part 3 of 3

Figure 4.39. Gas-‐production rates, cumulative gas production, and bottom-‐hole pressures during the winter 2008 production test of the Aurora/JOGMEC/NRCan Mallik 2L-‐38 gas hydrate production research well (data provided by the National Energy Board, Canada, 2008).
Historical Methane Hydrate Project Review Report, April 2013 – Part 3 of 3
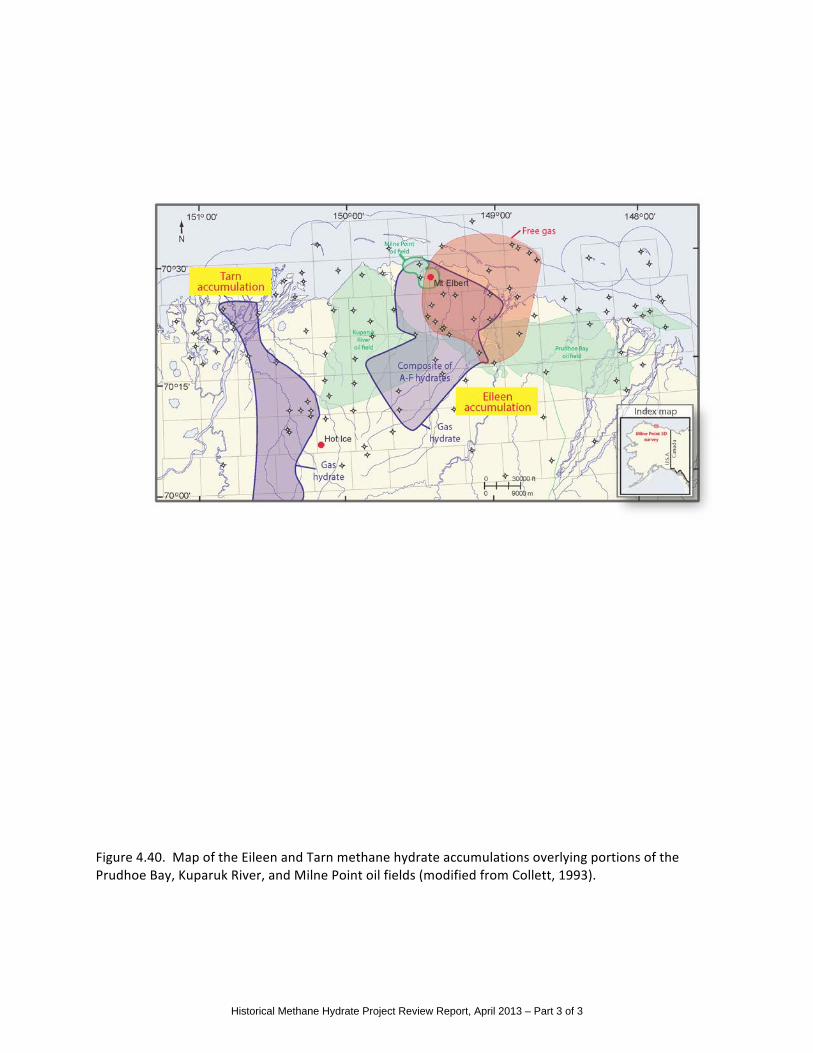
Figure 4.40. Map of the Eileen and Tarn methane hydrate accumulations overlying portions of the Prudhoe Bay, Kuparuk River, and Milne Point oil fields (modified from Collett, 1993).
Historical Methane Hydrate Project Review Report, April 2013 – Part 3 of 3
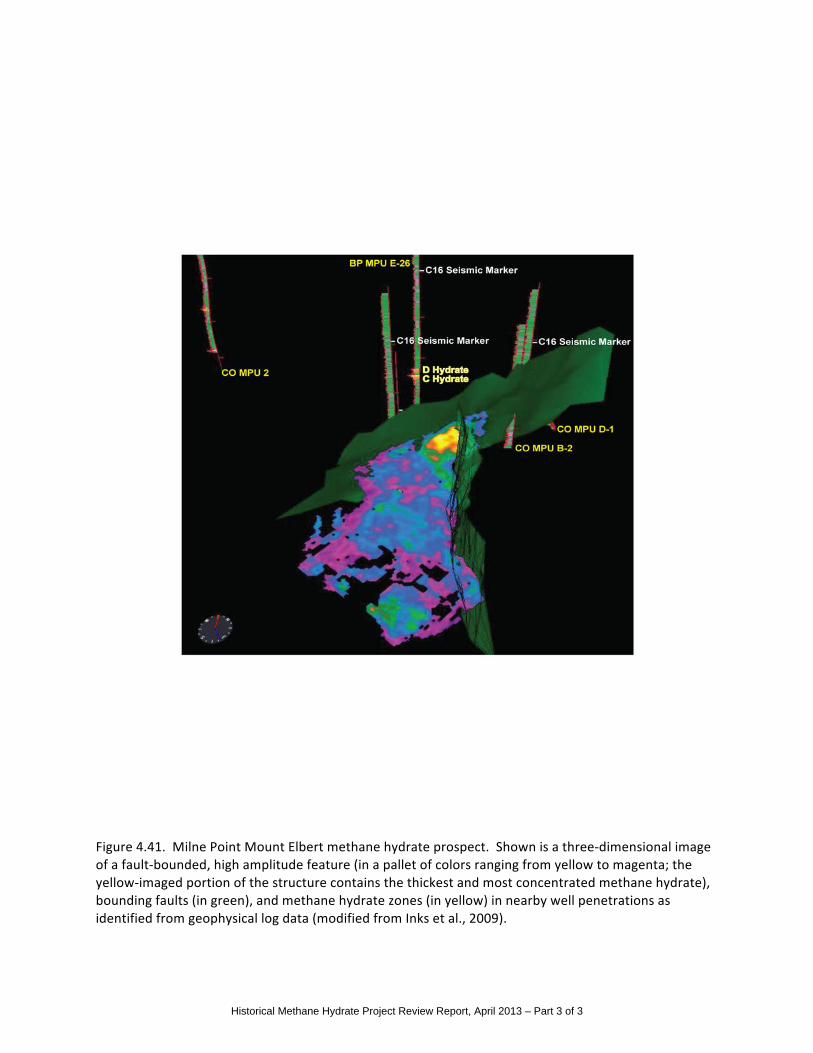
Figure 4.41. Milne Point Mount Elbert methane hydrate prospect. Shown is a three-‐dimensional image of a fault-‐bounded, high amplitude feature (in a pallet of colors ranging from yellow to magenta; the yellow-‐imaged portion of the structure contains the thickest and most concentrated methane hydrate), bounding faults (in green), and methane hydrate zones (in yellow) in nearby well penetrations as identified from geophysical log data (modified from Inks et al., 2009).
Historical Methane Hydrate Project Review Report, April 2013 – Part 3 of 3
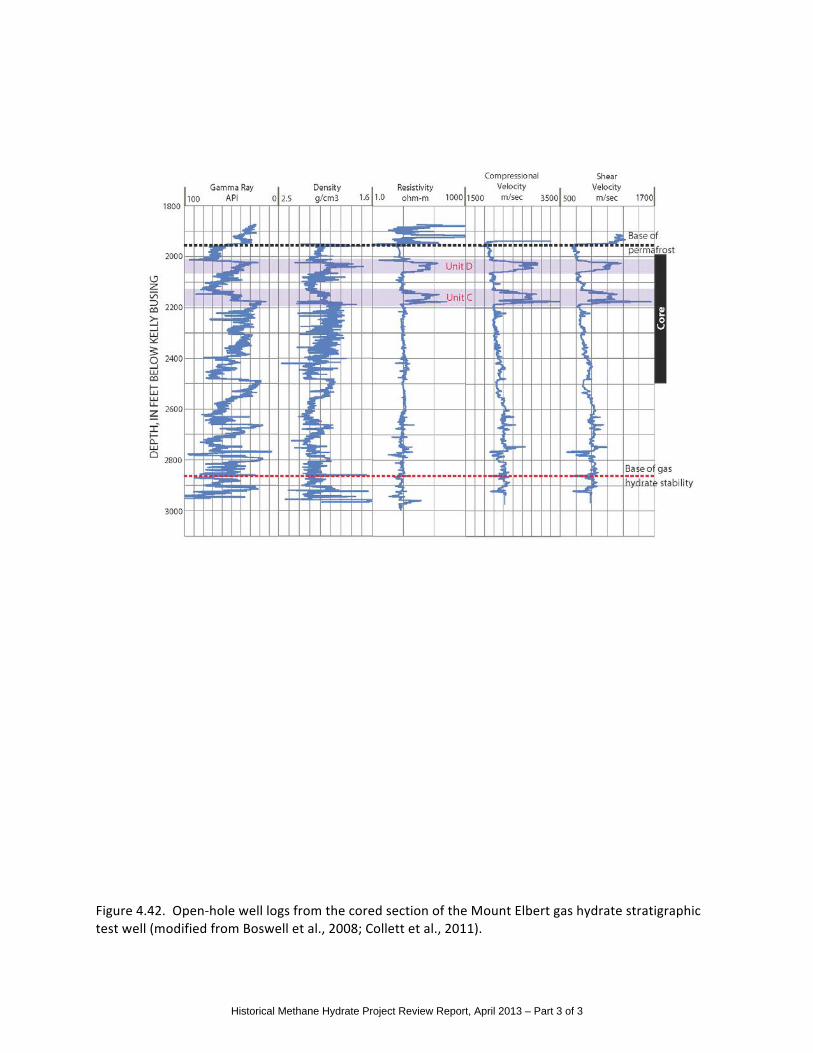
Figure 4.42. Open-‐hole well logs from the cored section of the Mount Elbert gas hydrate stratigraphic test well (modified from Boswell et al., 2008; Collett et al., 2011).
Historical Methane Hydrate Project Review Report, April 2013 – Part 3 of 3

Figure 4.43. Well-‐log derived methane hydrate saturations, density porosities, and sediment permeabilities for the two methane-‐hydrate-‐bearing intervals (Units C and D) cored in the Mount Elbert gas hydrate stratigraphic test well (modified from Boswell et al., 2008; Collett et al., 2011). The tested intervals (MDT Tests C1, C2, D1, and D2) are also shown.
Historical Methane Hydrate Project Review Report, April 2013 – Part 3 of 3
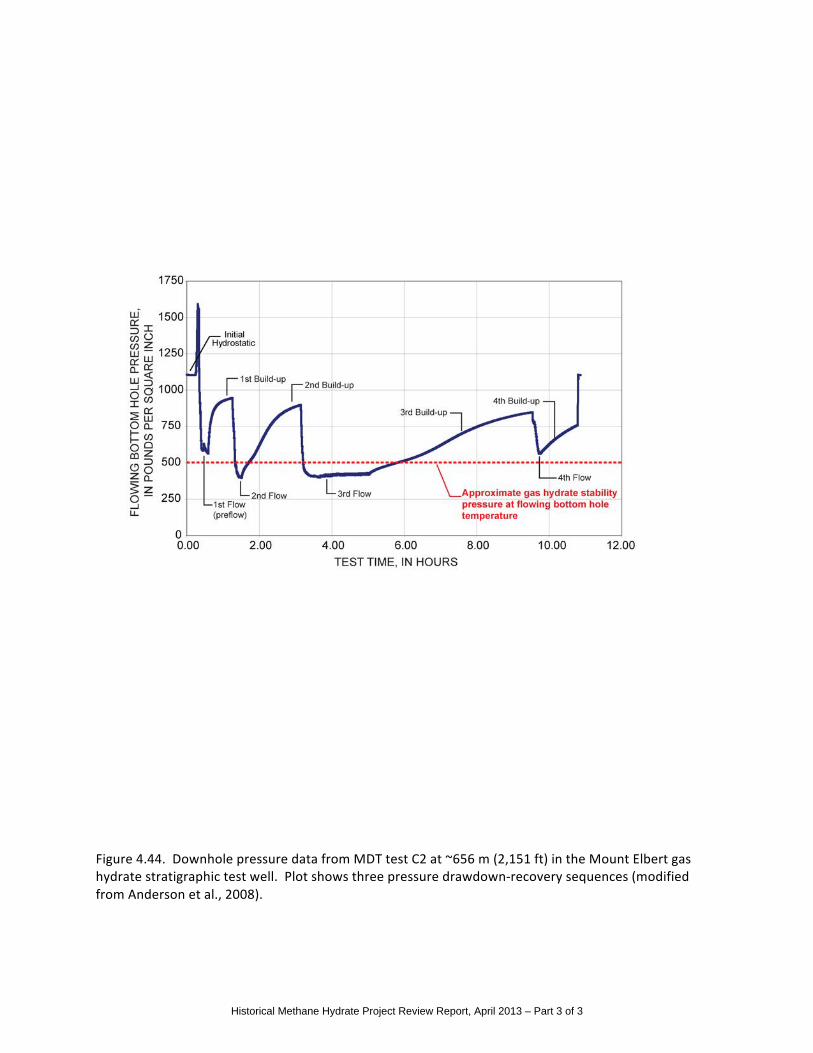
Figure 4.44. Downhole pressure data from MDT test C2 at ~656 m (2,151 ft) in the Mount Elbert gas hydrate stratigraphic test well. Plot shows three pressure drawdown-‐recovery sequences (modified from Anderson et al., 2008).
Historical Methane Hydrate Project Review Report, April 2013 – Part 3 of 3

Figure 4.45. Well log data from the Iġnik Sikumi #1 well (modified from Schoderbek, 2012).
Historical Methane Hydrate Project Review Report, April 2013 – Part 3 of 3

Figure 4.46. Iġnik Sikumi #1 wellbore schematic (modified from Schoderbek, 2012).
Historical Methane Hydrate Project Review Report, April 2013 – Part 3 of 3
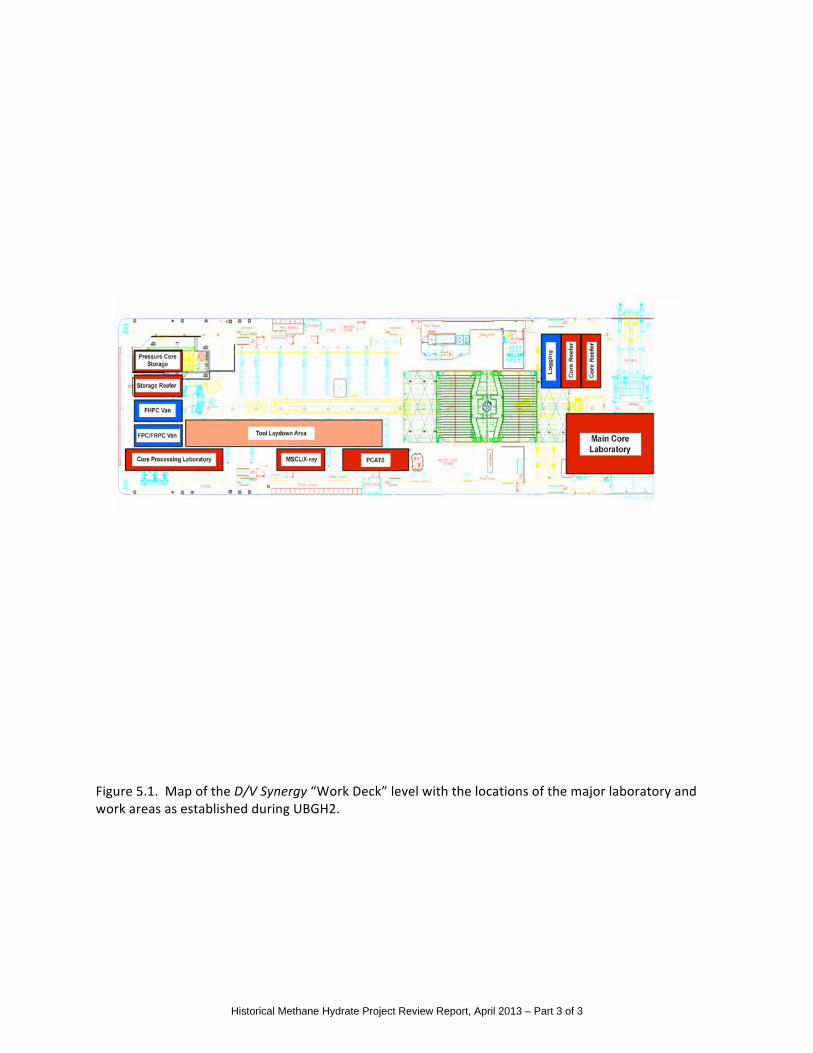
Figure 5.1. Map of the D/V Synergy “Work Deck” level with the locations of the major laboratory and work areas as established during UBGH2.
Historical Methane Hydrate Project Review Report, April 2013 – Part 3 of 3
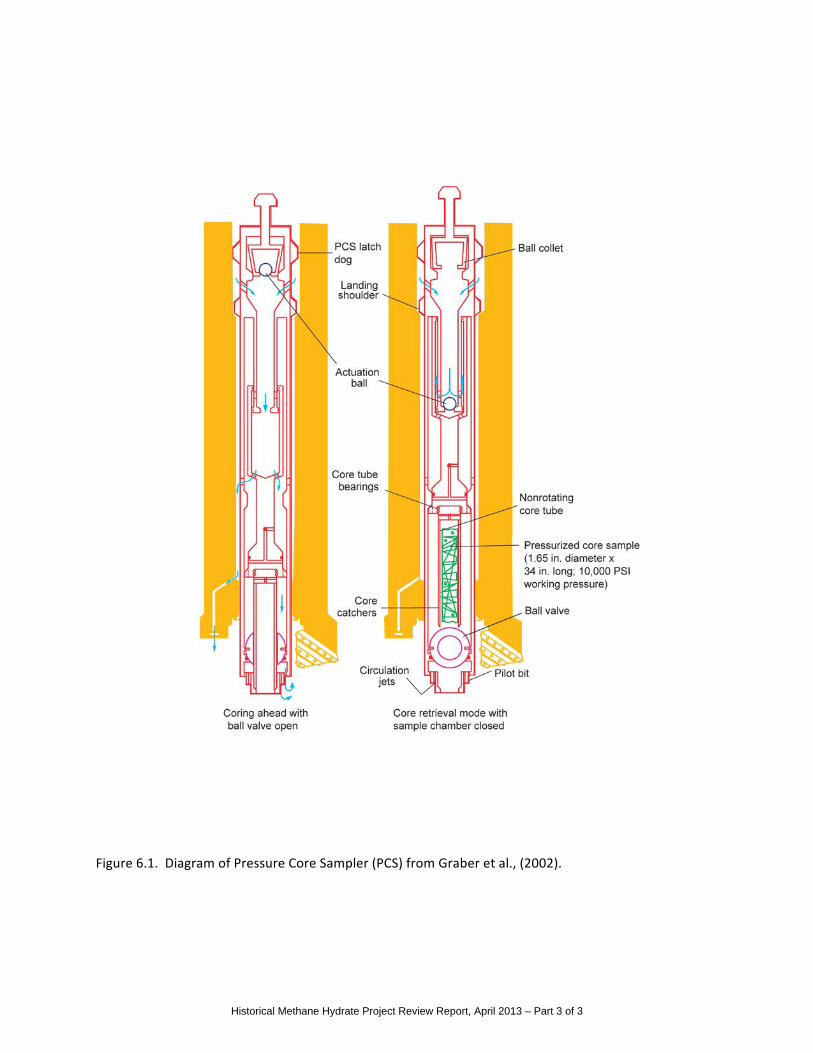
Figure 6.1. Diagram of Pressure Core Sampler (PCS) from Graber et al., (2002).
Historical Methane Hydrate Project Review Report, April 2013 – Part 3 of 3

Figure 6.2. Diagram of HYACE Rotary Corer (HRC) and Fugro Pressure Corer (FPC). The HRC is now named the Fugro Rotary Pressure Corer (FRPC).
Historical Methane Hydrate Project Review Report, April 2013 – Part 3 of 3

Figure 7.1. Wireline logging tool strings used during IODP Expedition 311.
Historical Methane Hydrate Project Review Report, April 2013 – Part 3 of 3
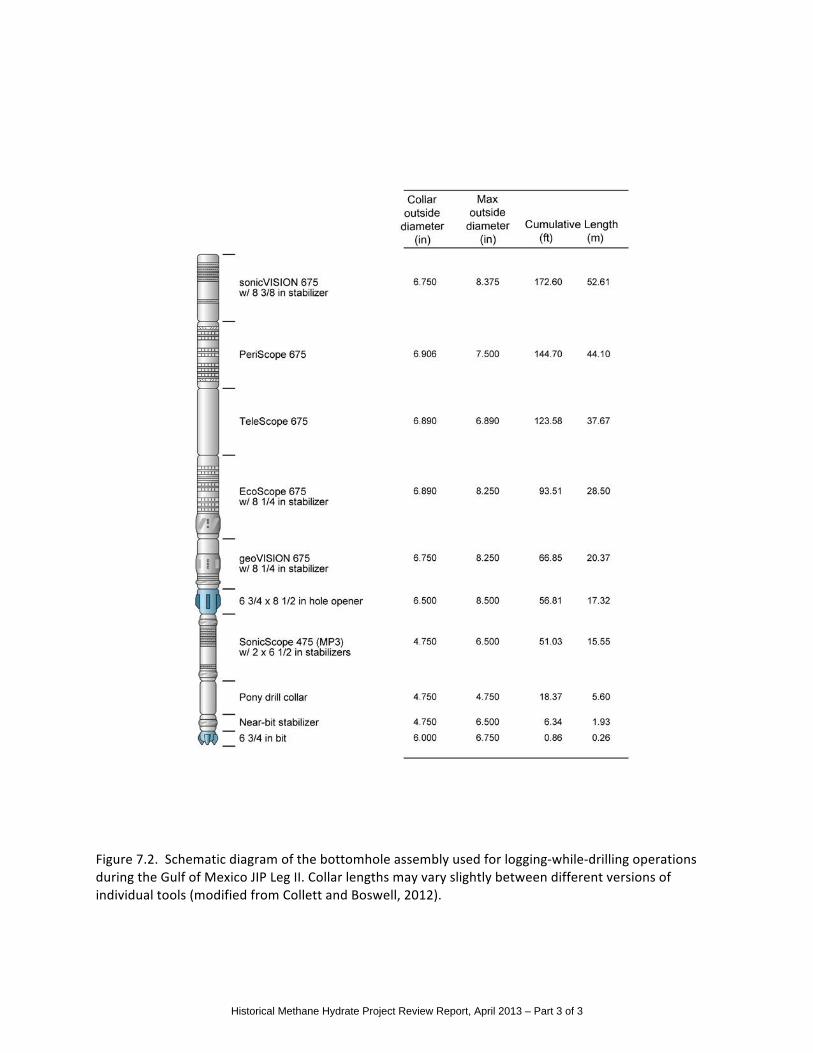
Figure 7.2. Schematic diagram of the bottomhole assembly used for logging-‐while-‐drilling operations during the Gulf of Mexico JIP Leg II. Collar lengths may vary slightly between different versions of individual tools (modified from Collett and Boswell, 2012).
Historical Methane Hydrate Project Review Report, April 2013 – Part 3 of 3
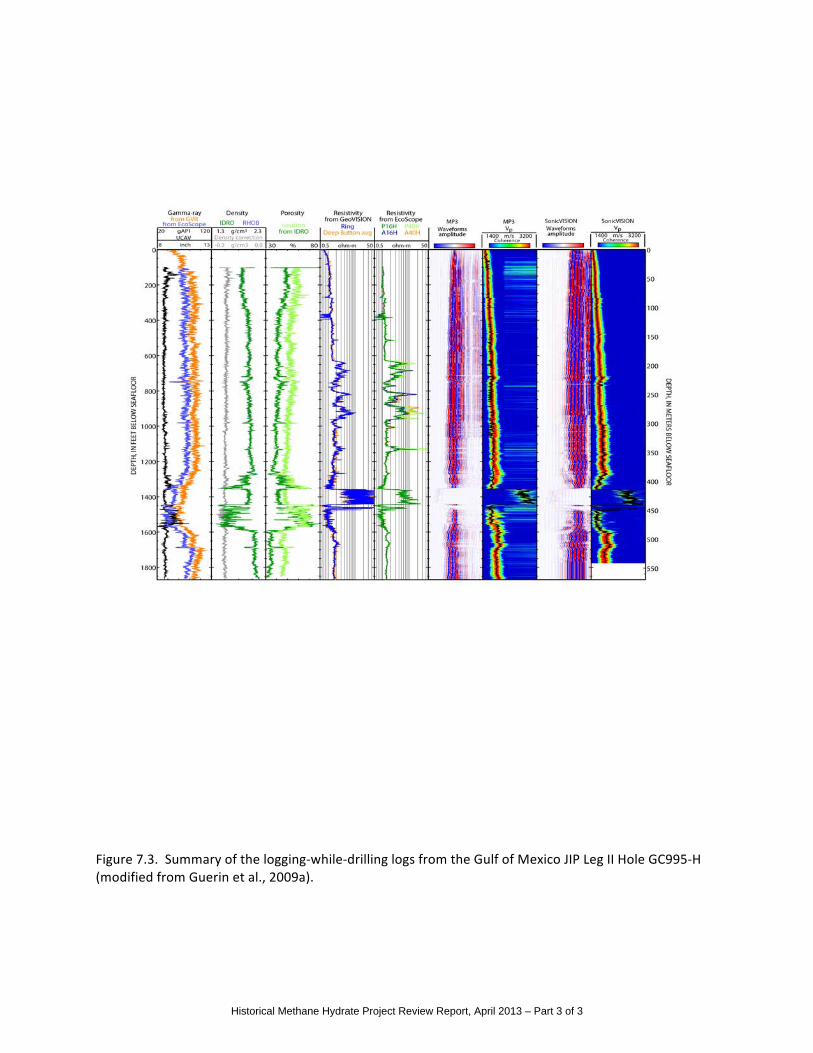
Figure 7.3. Summary of the logging-‐while-‐drilling logs from the Gulf of Mexico JIP Leg II Hole GC995-‐H (modified from Guerin et al., 2009a).
Historical Methane Hydrate Project Review Report, April 2013 – Part 3 of 3
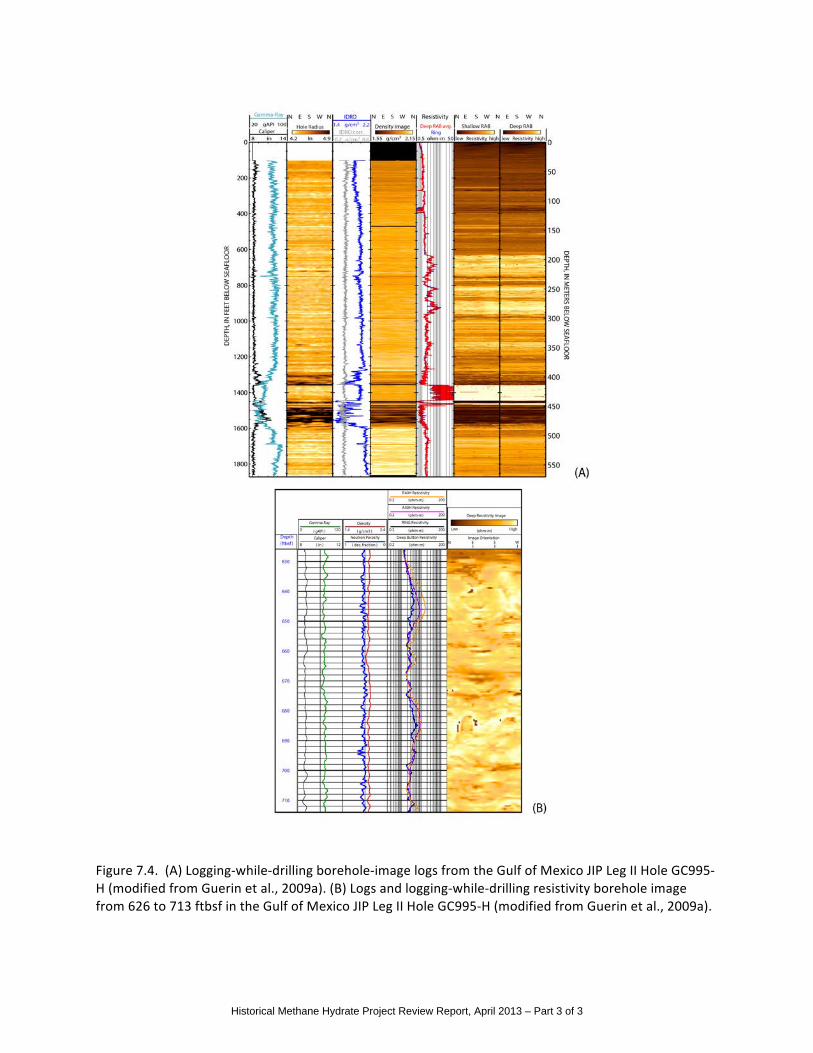
Figure 7.4. (A) Logging-‐while-‐drilling borehole-‐image logs from the Gulf of Mexico JIP Leg II Hole GC995-‐H (modified from Guerin et al., 2009a). (B) Logs and logging-‐while-‐drilling resistivity borehole image from 626 to 713 ftbsf in the Gulf of Mexico JIP Leg II Hole GC995-‐H (modified from Guerin et al., 2009a).
Historical Methane Hydrate Project Review Report, April 2013 – Part 3 of 3

Figure 9.1. Integrated Ocean Drilling Program (IODP) riser (D/V Chikyu) and riserless (JOIDES Resolution) drilling technologies.
Historical Methane Hydrate Project Review Report, April 2013 – Part 3 of 3
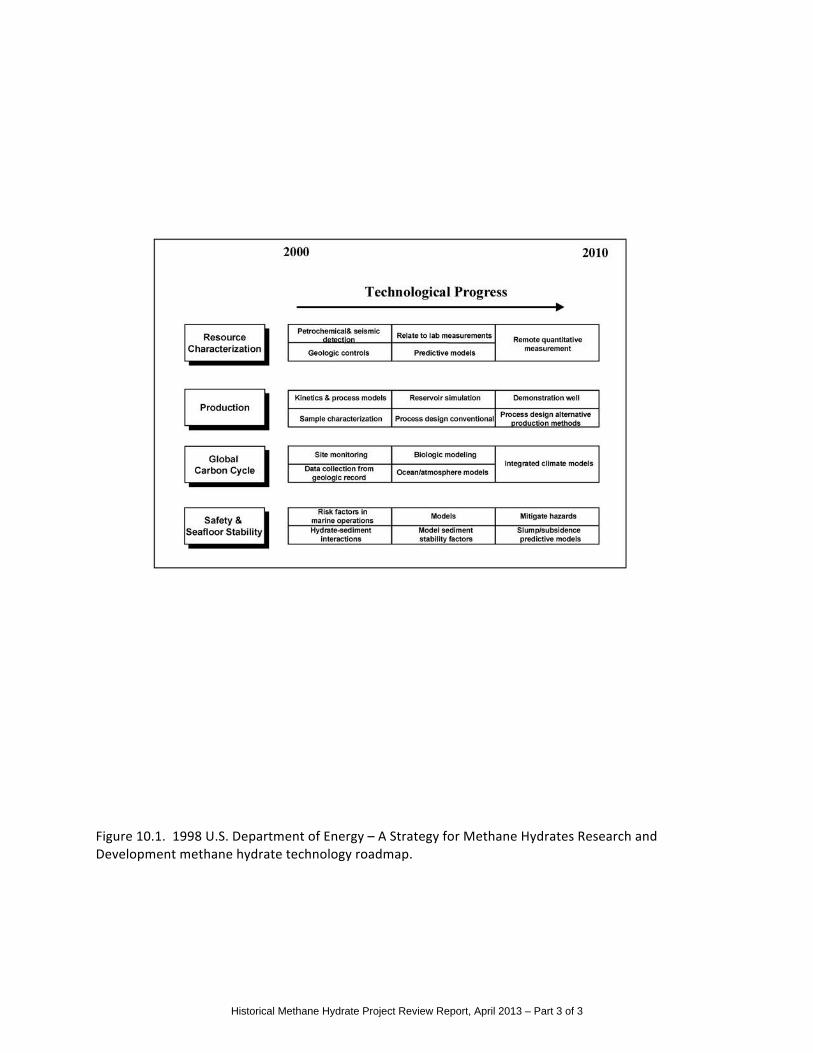
Figure 10.1. 1998 U.S. Department of Energy – A Strategy for Methane Hydrates Research and Development methane hydrate technology roadmap.
Historical Methane Hydrate Project Review Report, April 2013 – Part 3 of 3

Historical Methane Hydrate Project Review Report, April 2013 – Part 3 of 3
Historical Methane Hydrate Project Review Report, April 2013 – Part 3 of 3
Historical Methane Hydrate Project Review Report, April 2013 – Part 3 of 3

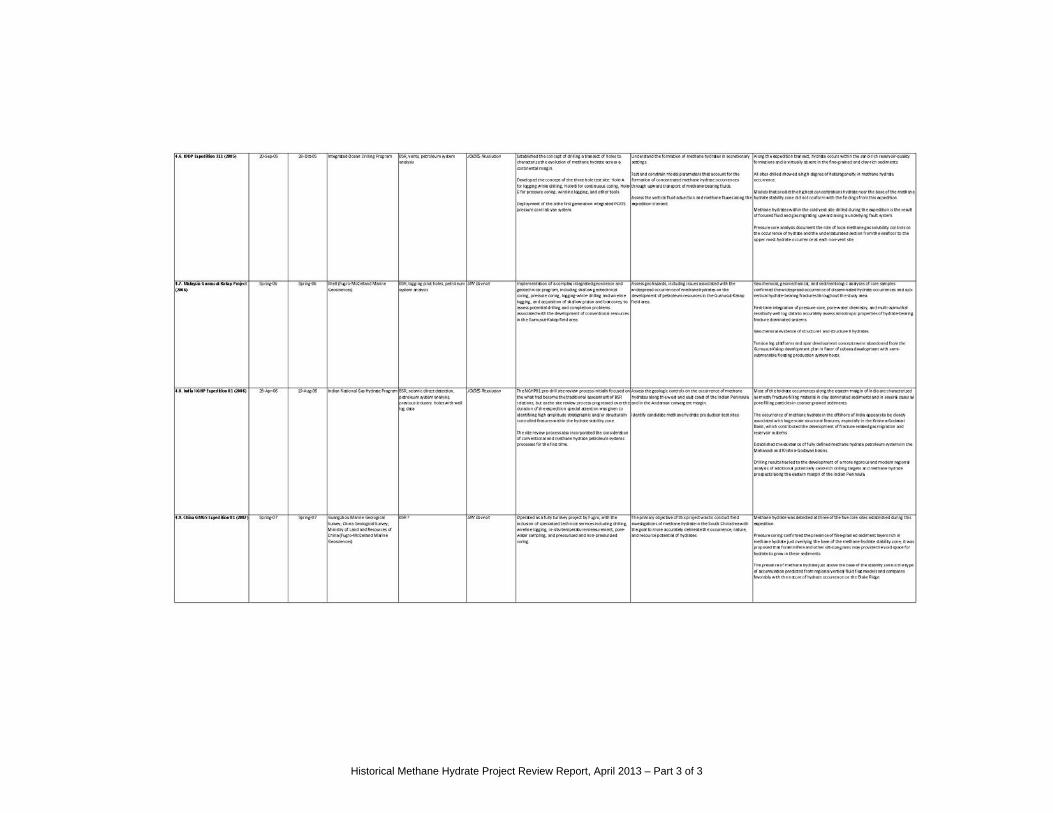
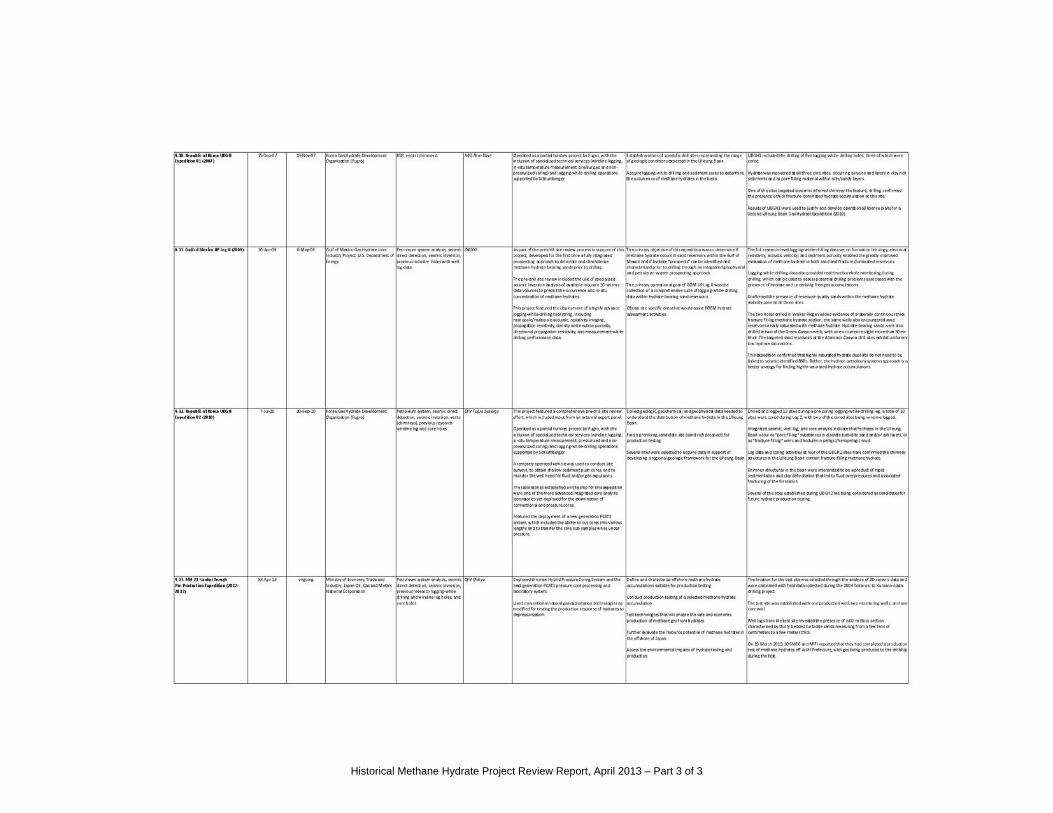
Table 4.1. Methane hydrate scientific and industry drilling programs, including a listing of 16 of the more significant methane hydrate research drilling expeditions. Information on each expedition includes the (1) report section and name of the expedition, (2) operational start date, (3) operational end date, (4) project management, (5) pre-‐drill site review considerations, (6) drilling vessel or contractor used to implement the program, (7) operational technical developments in the type of core systems, downhole logging tools, borehole instrumentation, and other technologies as deployed on each expedition, (8) primary operational/scientific objectives, and (7) primary operational/scientific results.
Historical Methane Hydrate Project Review Report, April 2013 – Part 3 of 3

Table 4.2. NGHP Expedition 01 site summary data, including listing of pre-‐expedition prospectus site designation, leg number, site number, water depth as determined by drilling or coring, depth to the base of methane hydrate stability zone, depth of the seismic identified bottom simulating reflector (BSR), dominant sediment type at each site as determined by coring or inferred from downhole log data, methane hydrate reservoir type as determined from various data sources, and predicted gas source. Uncertain values or assumptions have been queried with a question mark. Combination = silt/sand and fracture reservoirs (modified from Collett et al., 2008c).
Water Dpeth to base of BSR Dominent GasProspectus Site Depth Methane hydrate Depth Sediement Hydarte Gas SourceDesignation Leg Number (m) Stability Zone (mbsf) Type Reservoir
(mbsf) TypeKKGH01 1 NGHP-01-01 2663 360 no BSR Carbonate oozes None NoneKGGH03-A 2 NGHP-01-02 1058 NA 170 Clay/silt ? Combination ? Microbial?GDGH05-A 2 NGHP-01-03 1076 203 209 Clay with silt/sand beds Silt/Sand MicrobialKGGH01 2 NGHP-01-04 1081 NA 182 Clay/silt ? Combination ? Microbial?KGGH02-A 2 NGHP-01-05 945 130 ~125 Clay with silt/sand beds Combination MicrobialKGGH04 2 NGHP-01-06 1160 NA 210 Clay/silt ? Combination Microbial?KGGH06-A 2 NGHP-01-07 1285 198 188 Clay with silt/sand beds Combination MicrobialMNGH01-1-A 2 NGHP-01-08 1689 NA 257 Clay/silt ? Combination ? Microbial?MNGH-01-2 2 NGHP-01-09 1935 NA ~290 Clay/silt ? Combination ? Microbial?KGGH03-A (GD-3-1) 2 NGHP-01-10 1038 160 ~160 Clay/silt Fracture MicrobialGDGH12-A 2 NGHP-01-11 1007 NA 150 Clay/silt ? Combination Microbial?KGGH03-A (1st New Site) 3A NGHP-01-12 1038 NA ~160 Clay/silt Fracture MicrobialKGGH03-A (2nd New Site) 3A NGHP-01-13 1038 NA ~160 Clay/silt Fracture MicrobialGDGH14-A 3B NGHP-01-14 895 150 109 Clay with silt/sand beds Silt/Sand MicrobialGDGH11 3B NGHP-01-15 926 126 126 Clay with silt/sand beds Silt/Sand MicrobialStepout Site 3B NGHP-01-16 1253 178 170 Clay with silt/sand beds Silt/Sand MicrobialANGH01 4 NGHP-01-17 1344 620 ~608 Clay/silt with volcanic ash beds Silt/Ash Micro/ThermoMNGH-REL 5 4 NGHP-01-18 1374 210 ~210 Clay/silt Clay/silt? Micro/ThermoMNGH-Gap 4 NGHP-01-19 1422 220 205 Clay with silt/sand beds Silt/Sand Micro/ThermoKGGH05 4 NGHP-01-20 1146 NA ~220 Clay with silt/sand beds Silt/Sand MicrobialKGGH03-A (New FR1) 4 NGHP-01-21 1049 NA ~160 Clay/silt Fracture Microbial
(?) Uncertain values or assumptions have been quered with a question marksCombination = silt/sand and fracture reservoirs
NGHP Expedition 01 - Site Summary Data
Historical Methane Hydrate Project Review Report, April 2013 – Part 3 of 3

Shipboard Analytical Capabilities Geological Analyses of Core Samples Lithology, structures, fossils, etc. Microscopy X-‐ray diffraction mineralogy Stratigraphic correlation Heat flow analysis Physical Properties of Core Samples Digital imaging Moisture and density analysis Magnetic susceptibility Gamma ray attenuation bulk density Natural gamma radiation Resistivity Thermal conductivity Spectral reflectance Magnetostratigraphy and rock magnetism Acoustic velocity Sediment strength Chemistry and Microbiology Hydrocarbon and natural gas chromatography Organic constituent analysis Pyrolytic hydrocarbon content characterization CHNS analysis Total organic carbon analysis Coulometric carbonate analysis ICP-‐AES elemental analysis Ion analysis in aqueous samples and extracts Halogenated compound detection Microbiological microscopy Sample mass measurement Gas analysis Radioisotope van for sample preparation Formation Measurement Capabilities Formation temperature Formation pressure Curation, Data, and Publication Services Shore-‐based, secure, refrigerated core storage Shore-‐based analytical equipment Janus relational database Production of state-‐of-‐the-‐art publications since 1986
Table 5.1. Listing of on-‐board labs and lab equipment as deployed on the JOIDES Resolution.
Historical Methane Hydrate Project Review Report, April 2013 – Part 3 of 3
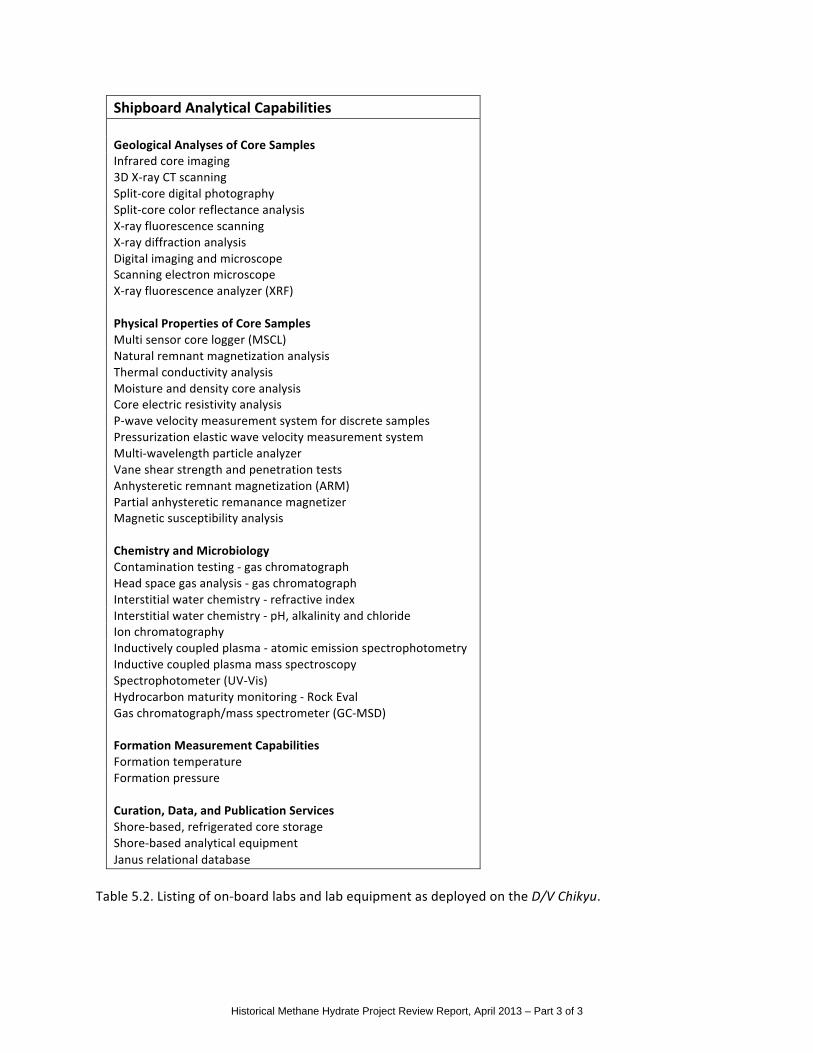
Shipboard Analytical Capabilities Geological Analyses of Core Samples Infrared core imaging 3D X-‐ray CT scanning Split-‐core digital photography Split-‐core color reflectance analysis X-‐ray fluorescence scanning X-‐ray diffraction analysis Digital imaging and microscope Scanning electron microscope X-‐ray fluorescence analyzer (XRF) Physical Properties of Core Samples Multi sensor core logger (MSCL) Natural remnant magnetization analysis Thermal conductivity analysis Moisture and density core analysis Core electric resistivity analysis P-‐wave velocity measurement system for discrete samples Pressurization elastic wave velocity measurement system Multi-‐wavelength particle analyzer Vane shear strength and penetration tests Anhysteretic remnant magnetization (ARM) Partial anhysteretic remanance magnetizer Magnetic susceptibility analysis Chemistry and Microbiology Contamination testing -‐ gas chromatograph Head space gas analysis -‐ gas chromatograph Interstitial water chemistry -‐ refractive index Interstitial water chemistry -‐ pH, alkalinity and chloride Ion chromatography Inductively coupled plasma -‐ atomic emission spectrophotometry Inductive coupled plasma mass spectroscopy Spectrophotometer (UV-‐Vis) Hydrocarbon maturity monitoring -‐ Rock Eval Gas chromatograph/mass spectrometer (GC-‐MSD) Formation Measurement Capabilities Formation temperature Formation pressure Curation, Data, and Publication Services Shore-‐based, refrigerated core storage Shore-‐based analytical equipment Janus relational database
Table 5.2. Listing of on-‐board labs and lab equipment as deployed on the D/V Chikyu.
Historical Methane Hydrate Project Review Report, April 2013 – Part 3 of 3

Core Processing Van: Geotek MSCL-‐IR infrared track with FLIR A40 camera Fluke Ti25 handheld IR camera Wykeham Farrance vane shear apparatus Brady label printer KIGAM GHOBS apparatus MSCL/X-‐ray lab: Geotek MSCL-‐XCT X-‐ray track with computed tomography Geotek MSCL-‐S multisensor whole-‐core track (gamma density, P-‐wave velocity, magnetic susceptibility, electrical resistivity) KIGAM thermal conductivity device Sedimentology lab: Geotek MSCL-‐CIS linescan core scanner Nikon LV100 petrographic microscope with digital image capture software Nikon SMZ745T stereomicroscope with digital image capture device Mastersizer 2000 laser particle sizer Fisherbrand Biofuge Primo centrifuge Innov-‐X Delta X-‐ray fluorescence spectrometer Ascent Opti ductless fume hood KIGAM split-‐core IR and visible cameras Physical properties lab: Geotek MSCL-‐XZ multisensor split core track (color spectrophotometry, magnetic susceptibility) Geotek seagoing balance with two Mettler-‐Toledo XS-‐205 analytical balances Quantachrome Pentapyc 5200e pycnometer ThermoFisher 6000 drying oven KIGAM split-‐core physical measurements Geochemistry/microbiology lab: Carver 3851 25-‐ton hydraulic press (3) Metrohm Titrando 888 & Grant LTC1 for automated alkalinity titration with temperature control Metrohm Dosimat 776 for chlorinity titration Dionex ICS-‐2100 ion chromatograph for major anions Teledyne-‐Leeman Prodigy inductively-‐coupled plasma optical emission spectrometer for cations Agilent MicroGC 3000 gas chromatograph for C1-‐C4 Bausch & Lomb Spec20+ spectrophotometer ThermoScientific Barnstead EasyPure deionized water system Yamato SM300 autoclave Mettler-‐Toledo SevenEasy pH meter Labcaire PCR6 laminar flow hood ThermoScientific Revco ultralow freezer Dundee Nitrogen Company HP10 nitrogen generator IN/US Triathler scintillation counter LBT chemical fume cupboard Brady label printer Core handling and storage: Geotek core splitter Brady label printer PCATS lab: Geotek PCATS pressure core handing and analysis system
Table 5.3. Listing of on-‐board labs and lab equipment as deployed on the D/V Fugro Synergy during UBGH2.
Historical Methane Hydrate Project Review Report, April 2013 – Part 3 of 3
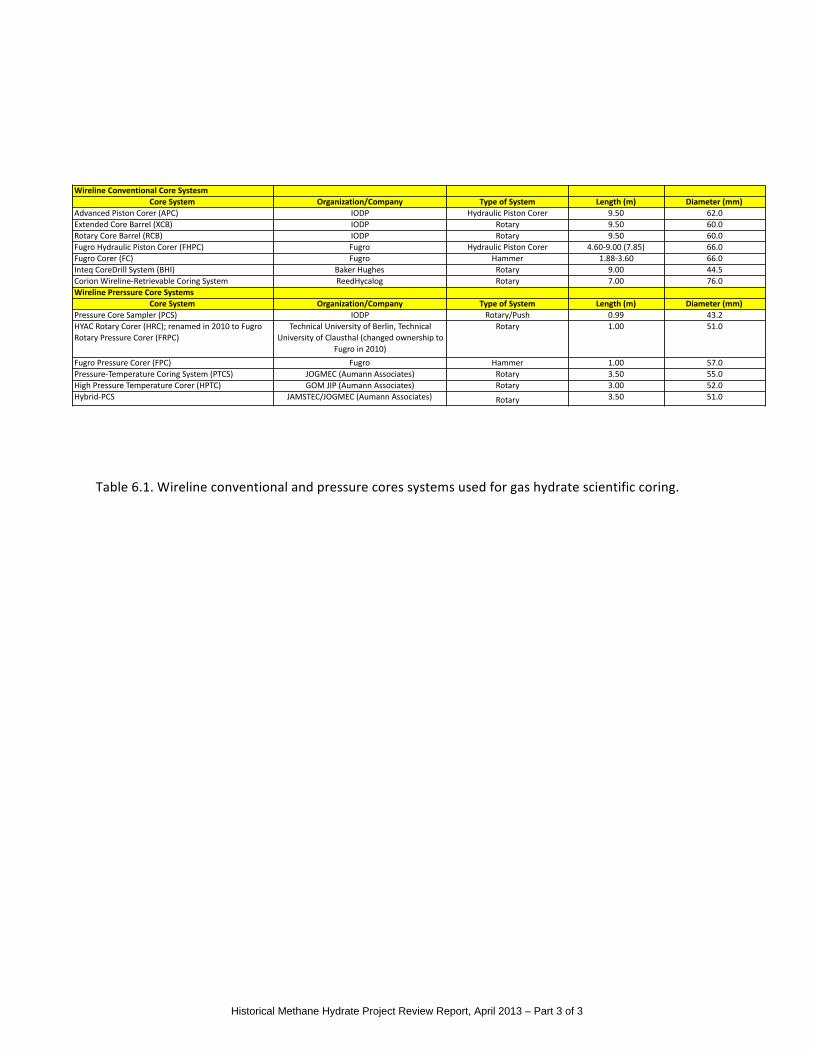
Table 6.1. Wireline conventional and pressure cores systems used for gas hydrate scientific coring.
Wireline'Conventional'Core'SystesmCore'System Organization/Company Type'of'System Length'(m) Diameter'(mm)
Advanced(Piston(Corer((APC) IODP Hydraulic(Piston(Corer 9.50 62.0Extended(Core(Barrel((XCB) IODP Rotary 9.50 60.0Rotary(Core(Barrel((RCB)( IODP Rotary 9.50 60.0Fugro(Hydraulic(Piston(Corer((FHPC)( Fugro Hydraulic(Piston(Corer 4.60G9.00((7.85) 66.0Fugro(Corer((FC)( Fugro Hammer 1.88G3.60 66.0Inteq(CoreDrill(System((BHI) Baker(Hughes Rotary 9.00 44.5Corion(WirelineGRetrievable(Coring(System ReedHycalog Rotary 7.00 76.0Wireline'Prerssure'Core'Systems
Core'System Organization/Company Type'of'System Length'(m) Diameter'(mm)Pressure(Core(Sampler((PCS) IODP Rotary/Push 0.99 43.2HYAC(Rotary(Corer((HRC);(renamed(in(2010(to(Fugro(Rotary(Pressure(Corer((FRPC)
Technical(University(of(Berlin,(Technical(University(of(Clausthal((changed(ownership(to(
Fugro(in(2010)
Rotary 1.00 51.0
Fugro(Pressure(Corer((FPC) Fugro Hammer 1.00 57.0PressureGTemperature(Coring(System((PTCS)( JOGMEC((Aumann(Associates) Rotary 3.50 55.0High(Pressure(Temperature(Corer((HPTC) GOM(JIP((Aumann(Associates) Rotary 3.00 52.0HybridGPCS( JAMSTEC/JOGMEC((Aumann(Associates) Rotary 3.50 51.0
Historical Methane Hydrate Project Review Report, April 2013 – Part 3 of 3

Tool Output Tool name/Explanation of output Unit Vertical resolution (cm)
Depth of investigation (cm)
APS
Accelerator Porosity Sonde
APLC Near array porosity (limestone calibrated) % 43
SIGF Formation capture cross section Capture unit
31
STOF Tool standoff (distance from borehole wall) inch
DIT
Dual Induction Tool
IDPH Deep induction resistivity m 246 122–158
IMPH Medium induction resistivity m 185 66–79
SFLU Spherically focused resistivity m 61 41
DSI
Dipole Sonic Imager
DTCO Compressional wave slowness µs/ft 107 ~10
DTSM Shear wave slowness µs/ft 107 ~10
DTST Stoneley wave slowness µs/ft 107 ~10
FMS
Formation MicroScanner
C1, C2 Orthogonal hole diameters inch
P1AZ Pad 1 azimuth Degree
Oriented resistivity images of borehole wall
0.5 2
GPIT
General Purpose Inclinometer Tool
DEVI Hole deviation Degree
HAZI Hole azimuth Degree
Fx, Fy, Fz
Earth's magnetic field (three orthogonal components)
Oersted
Ax, Ay, Az
Acceleration (three orthogonal components) m/s2
HLDT
Hostile Environment Litho-Density Tool
RHOB Bulk density (corrected) g/cm3 46
PEF Photoelectric effect b/e–
CALI Caliper (borehole diameter) inch
DRHO Bulk density correction g/cm3
HNGS
Hostile Environment Gamma Ray Sonde
HSGR Standard (total) gamma ray gAPI 51
HCGR Computed gamma ray (minus uranium contribution) gAPI 51
HFK Potassium wt% 51
HTHO Thorium ppm 51
HURA Uranium ppm 51
SGT Scintillation Gamma Ray Tool
ECGR Environmentally corrected gamma ray gAPI 46
TAP
Temperature/Acceleration/Pressure °C, m/s2, psi
WST
Well Seismic Tool
Table 7.1. Measurement acronyms and units, vertical resolutions and depths of investigation of the wireline logging tools used during IODP Expedition 311.
Historical Methane Hydrate Project Review Report, April 2013 – Part 3 of 3
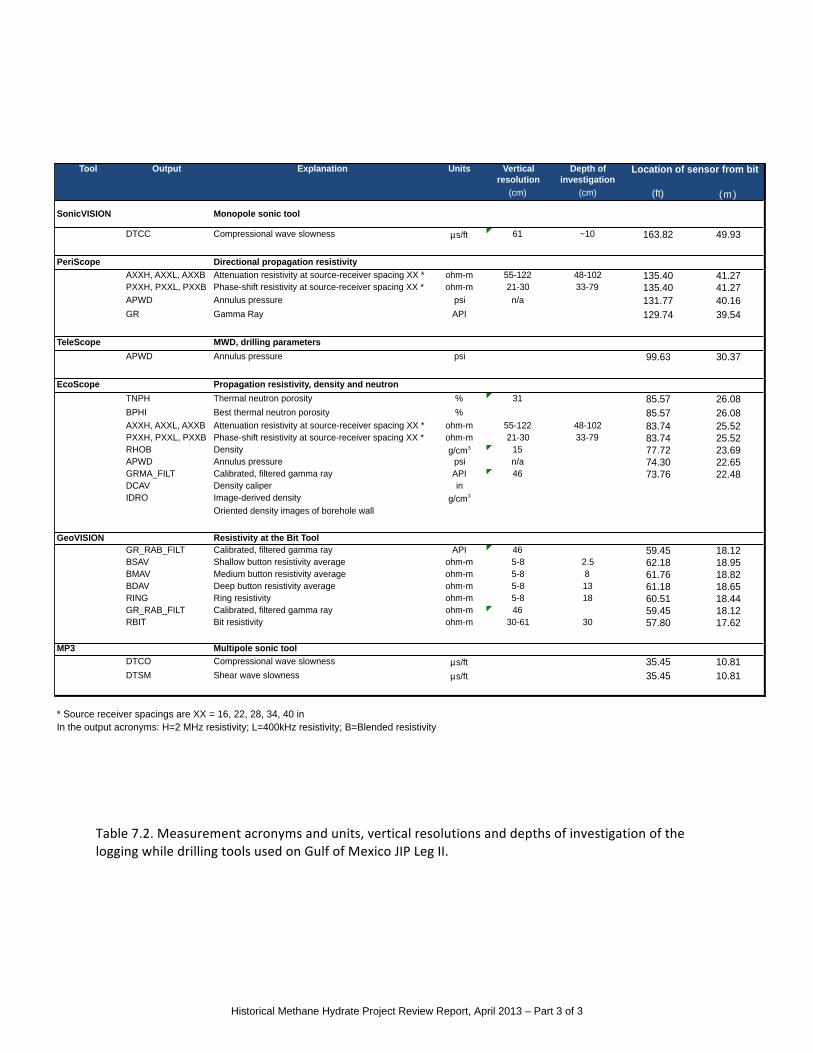
Table 7.2. Measurement acronyms and units, vertical resolutions and depths of investigation of the logging while drilling tools used on Gulf of Mexico JIP Leg II.
Tool Output Explanation Units Vertical resolution
Depth of investigation
(cm) (cm) (ft) (m)
SonicVISION Monopole sonic tool
DTCC Compressional wave slowness µs/ft 61 ~10 163.82 49.93
PeriScope Directional propagation resistivityAXXH, AXXL, AXXB Attenuation resistivity at source-receiver spacing XX * ohm-m 55-122 48-102 135.40 41.27PXXH, PXXL, PXXB Phase-shift resistivity at source-receiver spacing XX * ohm-m 21-30 33-79 135.40 41.27APWD Annulus pressure psi n/a 131.77 40.16GR Gamma Ray API 129.74 39.54
TeleScope MWD, drilling parametersAPWD Annulus pressure psi 99.63 30.37
EcoScope Propagation resistivity, density and neutronTNPH Thermal neutron porosity % 31 85.57 26.08BPHI Best thermal neutron porosity % 85.57 26.08AXXH, AXXL, AXXB Attenuation resistivity at source-receiver spacing XX * ohm-m 55-122 48-102 83.74 25.52PXXH, PXXL, PXXB Phase-shift resistivity at source-receiver spacing XX * ohm-m 21-30 33-79 83.74 25.52RHOB Density g/cm3 15 77.72 23.69APWD Annulus pressure psi n/a 74.30 22.65GRMA_FILT Calibrated, filtered gamma ray API 46 73.76 22.48DCAV Density caliper inIDRO Image-derived density g/cm3
Oriented density images of borehole wall
GeoVISION Resistivity at the Bit ToolGR_RAB_FILT Calibrated, filtered gamma ray API 46 59.45 18.12BSAV Shallow button resistivity average ohm-m 5-8 2.5 62.18 18.95BMAV Medium button resistivity average ohm-m 5-8 8 61.76 18.82BDAV Deep button resistivity average ohm-m 5-8 13 61.18 18.65RING Ring resistivity ohm-m 5-8 18 60.51 18.44GR_RAB_FILT Calibrated, filtered gamma ray ohm-m 46 59.45 18.12RBIT Bit resistivity ohm-m 30-61 30 57.80 17.62
MP3 Multipole sonic toolDTCO Compressional wave slowness µs/ft 35.45 10.81DTSM Shear wave slowness µs/ft 35.45 10.81
Location of sensor from bit
* Source receiver spacings are XX = 16, 22, 28, 34, 40 inIn the output acronyms: H=2 MHz resistivity; L=400kHz resistivity; B=Blended resistivity
Historical Methane Hydrate Project Review Report, April 2013 – Part 3 of 3

Table 10.1. 1999 U.S. Department of Energy – National Methane Hydrate Multi-‐Year R&D Program Plan that deals with methane hydrate resource characterization.
Historical Methane Hydrate Project Review Report, April 2013 – Part 3 of 3
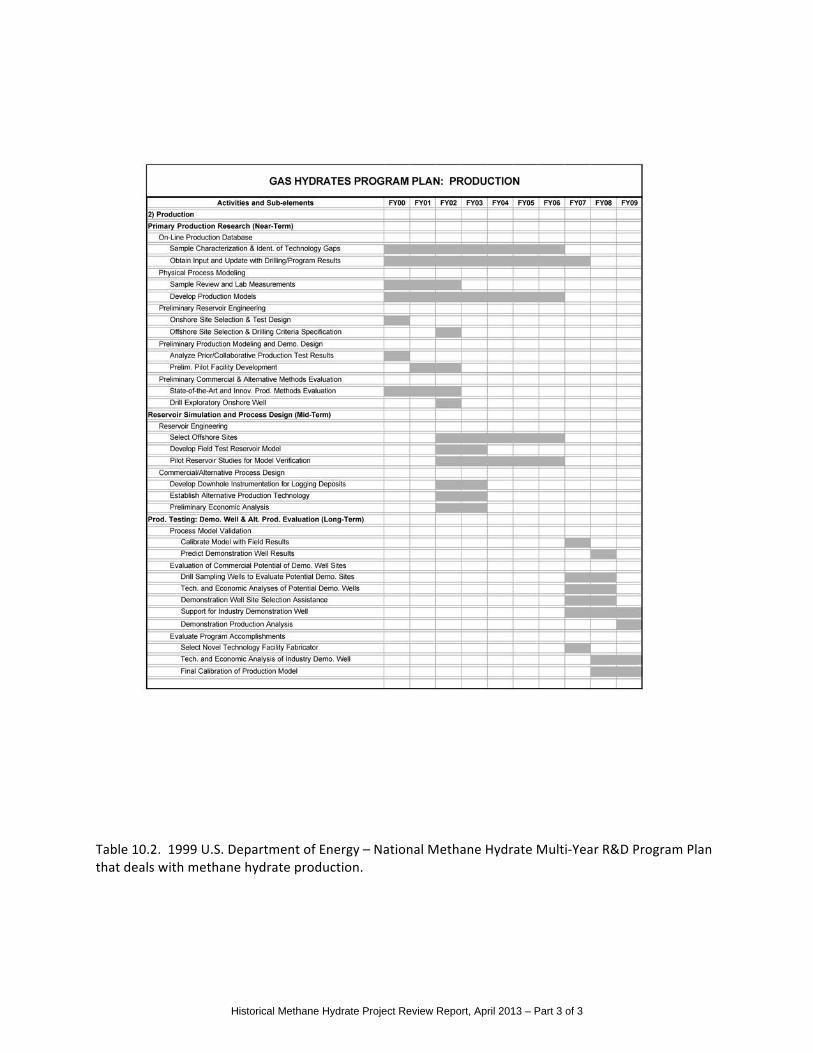
Table 10.2. 1999 U.S. Department of Energy – National Methane Hydrate Multi-‐Year R&D Program Plan that deals with methane hydrate production.
Historical Methane Hydrate Project Review Report, April 2013 – Part 3 of 3
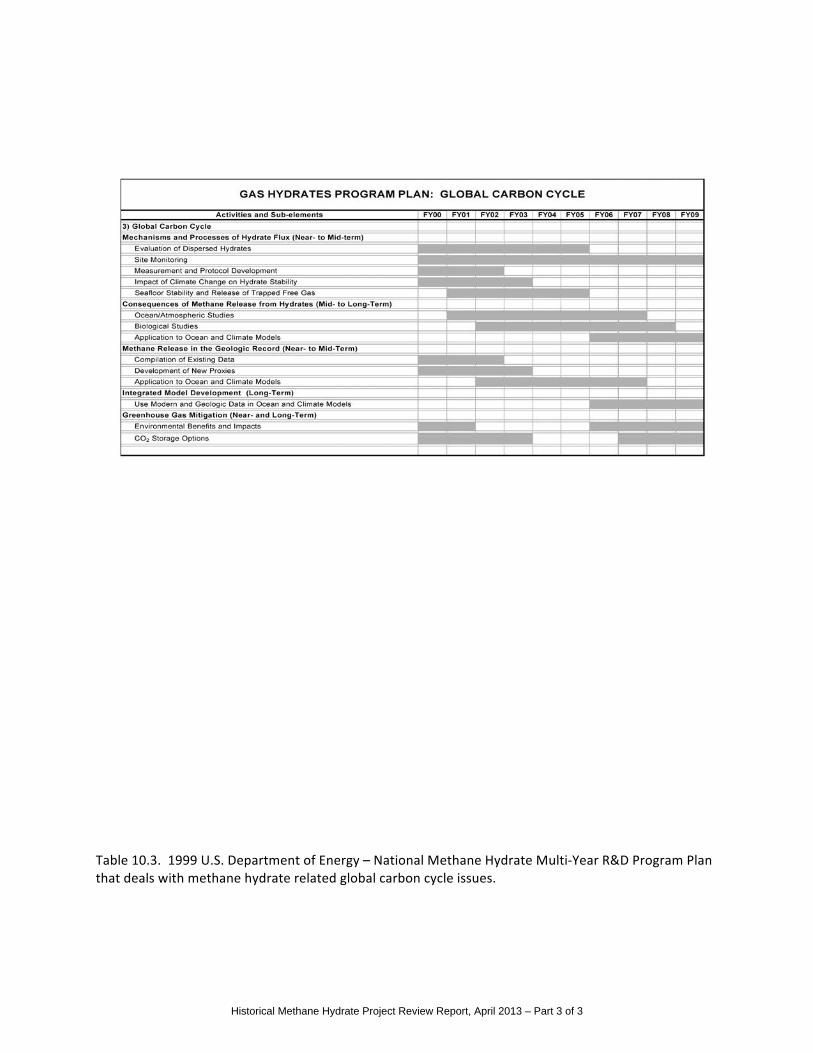
Table 10.3. 1999 U.S. Department of Energy – National Methane Hydrate Multi-‐Year R&D Program Plan that deals with methane hydrate related global carbon cycle issues.
Historical Methane Hydrate Project Review Report, April 2013 – Part 3 of 3

Table 10.4. 1999 U.S. Department of Energy – National Methane Hydrate Multi-‐Year R&D Program Plan that deals with methane hydrate related safety and seafloor stability issues.
Historical Methane Hydrate Project Review Report, April 2013 – Part 3 of 3


![Hydrate thermal dissociation behavior and dissociation enthalpies in methane … · mole basis, methane hydrate consists of 85.69(± 0.14)% water and 14.31(± 0.14)% methane [2]](https://img.pdfslide.us/doc/110x75/5fbd4df89eb682309316b186/hydrate-thermal-dissociation-behavior-and-dissociation-enthalpies-in-methane-mole.jpg)