Embed Size (px)
Citation preview

DredgedMaterialManagementPreliminaryAssessment
ColumbiaRiverFederalNavigationChannel,
RiverMile3to105.5
Columbia&LowerWillametteRiversProject
U.S.ArmyCorpsofEngineersPortlandDistrict
December2017

Thispageisintentionallyblank

ExecutiveSummaryThepurposeofthisPreliminaryAssessment(PA)istodocumentthecontinuedviabilityoftheLowerColumbiaRiverfederalnavigationchannel(FNC)anddeterminetheavailabilityofdredgedmaterialplacementsitecapacitysufficienttoaccommodate20yearsofmaintenancedredging.ContinuedmaintenanceiswarrantedbasedonthesignificanteconomicbenefitsoftheColumbia‐SnakeRiverNavigationSystem,whichprovidedefficientmovementofover61milliontonsofcargovaluedat$30billionin2014andisthethirdlargestgrainexportsystemintheworld.However,thereisashortageofcapacityformaterialdredgedfromthechannelandtherealestateeasementsandrightsofentryforexistingplacementsiteswillexpirebeforetheendofthenext20yearchannelOperationsandMaintenance(O&M)period.TheforecastedaverageannualdredgingneedtomaintaintheLowerColumbiaRiverFNCis6.5mcy(130mcytotalforthenext20years).Thirteenofthenineteenexistinguplandplacementsitesarealreadyfullorhavecapacityforjustoneortwomoreplacementevents.Manyoftheselimitedcapacitysitescouldbefullwithinthenextfiveyears.Additionally,stablein‐waterplacementlocations,whichtheCorpsdependsonfor70%ofdredgedmaterialplacement,arebecomingincreasinglylimitedbecausethosesuitablelocationsarefillingupandbecomingtooshallowfordredgingequipmenttoaccess.Hydraulicanalysisshouldbeusedtoimprovein‐waterplacementtechniquesandexpandoptions.Further,thisassessmentidentifiedchallengesrelatedtodredgeequipmentavailabilityandthepotentialneedforadditionaloralternativeequipment.ThereisalsoaneedtoevaluateandplanformaintenanceofexistingrivertrainingstructuresthatsupportchannelO&Mbecausetheirconditionswillaffectfuturedredgingplansandvolumes.Forthesereasons,anewDredgedMaterialManagementPlan(DMMP)mustbedevelopedtoidentifynewchannelmaintenanceandplacementalternativesandprovidesufficientdredgedmaterialcapacitytoaccommodate20yearsofforecastedmaintenanceoftheLowerColumbiaRiverFNC.

i
TableofContents
1 StudyAuthorityandPurpose.....................................................................................................................1
2 ScopeofAssessment......................................................................................................................................1
3 ProjectDescription.........................................................................................................................................2
ProjectHistory.........................................................................................................................................2
CurrentProject........................................................................................................................................3
4 Non‐FederalSponsors...................................................................................................................................6
5 LowerColumbiaRiverContext..................................................................................................................6
Introduction..............................................................................................................................................6
Hydrology,HydraulicsandTides....................................................................................................6
Morphology...............................................................................................................................................7
SedimentBudget.....................................................................................................................................8
ShoalFormation......................................................................................................................................9
Conclusion..............................................................................................................................................12
6 ChannelMaintenanceAssessment........................................................................................................13
Introduction...........................................................................................................................................13
Dredging..................................................................................................................................................13
RiverTrainingStructures................................................................................................................19
Assessmentofneedsforthenext20years..............................................................................22
7 DredgedMaterialPlacementAssessment.........................................................................................24
Introduction...........................................................................................................................................24
UplandPlacement...............................................................................................................................27
ShorelinePlacement...........................................................................................................................30
OpenWaterPlacement.....................................................................................................................32
RegionalSedimentManagement(RSM)....................................................................................36
Assessmentofneedsforthenext20years..............................................................................37
8 RealEstate.......................................................................................................................................................40
Non‐FederalSponsorResponsibilities.......................................................................................40
ExistingLands/Easements/Rights‐of‐Way..............................................................................40
Assessmentofneedsforthenext20years..............................................................................44

ii
9 EnvironmentalandGovernmentConsultationsandCompliance...........................................44
ExistingEnvironmentalCompliance...........................................................................................44
ExecutiveOrder13175,ConsultationandCoordinationwithIndianTribalGovernments.......................................................................................................................................................47
ConsistencyofExistingDocumentswithOngoingO&MActivities................................48
Assessmentofneedsforthenext20years..............................................................................48
10 EconomicAssessment............................................................................................................................49
EconomicBenefits...............................................................................................................................49
MaintenanceCosts..............................................................................................................................53
DeterminationthatContinuedMaintenanceisWarranted...............................................54
11 Findings........................................................................................................................................................54
12 Recommendation.....................................................................................................................................56
13 References...................................................................................................................................................57
1
1 StudyAuthorityandPurposeThisPreliminaryAssessment(PA)ispursuedundertheauthorityfortheColumbia&LowerWillametteRiversbelowVancouver,WAandPortland,OR(C&LW)Project.Overtime,thefederalnavigationchannel(FNC)hasbeenimprovedbyRiversandHarborsActs(RHA)of1878,1892,1902,1912,1930,and1962,andmostrecentlytheWaterResourcesDevelopmentAct(WRDA)of1999andConsolidatedAppropriationsActof2004.ThisPAhasbeenpreparedinaccordancewithU.S.ArmyCorpsofEngineers(Corps)EngineeringRegulationER1105‐2‐100AppendixE‐15ofthePlanningGuidanceNotebookdated22April2000.
Allfederallymaintainednavigationprojectsmustdemonstratethatthereissufficientdredgedmaterialplacementsitecapacityforaminimumof20years.BecausetheColumbiaRiverchannelservesmultipledeep‐waterportsasanintegratedsystemalonga103‐milelongprojectlength,reliableserviceoftheFNCispredicatedontheavailabilityoftheentirechanneltoprovideuninterruptedtransittofullyloadedvesselsdraftingtoauthorizedchanneldimensions.TheLowerColumbiaRiverportsandshipoperatorsdependonfullavailabilityofthepresentlyauthorizedFNCtorealizetheproject’sNationalEconomicDevelopmentbenefits.ThepurposeofthisPAistodocumentthecontinuedviabilityoftheprojectanddeterminetheavailabilityofdredgedmaterialplacementsitecapacitysufficienttoaccommodate20yearsofmaintenancedredging.Thisassessmentsuggeststhereisnotenoughcapacitytoaccommodatemaintenancedredgingforthenext20years,andtheassessmentthereforerecommendsadetailedDredgedMaterialManagementPlan(DMMP)studyandprovidesinformationnecessarytorecommenditsprioritizationintheCorpsPortlandDistricts’budgetaryprocess.
2 ScopeofAssessmentThisPAisformaintenanceofthemainColumbiaRiverFNCportionofC&LWProjectfromVancouver,Washington(RiverMile[RM]105.5)downstreamtotheMouthoftheColumbiaRiver(MCR)entrancechannelthePacificOcean(RM3).TheLowerWillametteRiver(PortlandHarbor)portionofC&LWProjecthasshallowerdepthsandareasoflimitedaccessibility,ahigherproportionoffinegrainedmaterial,shoalingrelatedtoextensiveportandbankinfrastructure,andenvironmentalrestrictionsthatrequireamaterialmanagementstrategywhichisdifferentfromthestrategyfortheColumbiaRiverchannel.Therefore,thisassessmentfocusesonthemainColumbiaRiverFNCanddoesnotrepresenttheLowerWillametteRiver,auxiliarychannelsorotherfeatureswhicharealsoauthorizedaspartoftheC&LWProject.Otherfederalandnon‐federaldredgingwithintherelatedgeographicareamayalsoaffectplacementcapacityfortheColumbiaRiverFNC,buttoalimitedextentbecausethevolumesareproportionallyless.
Project‐levelsummariesaresufficientforthisPA.TheDMMPwillstudyindividualreaches.
2
ThePAfirstsummarizesthehistoryandcurrentfeaturesoftheLowerColumbiaRiverFNCandchannelO&Mchallengesrelatedtothephysicalenvironment.Next,thePAreviewscurrentchannelO&Manddredgedmaterialplacementpractices,forecastsneedsforthenext20years,andrecommendstopicsforfurtherstudy.ThePAalsoassessesthestatusofexistingrealestateandenvironmentalcompliance,andfutureneedsandrecommendationsforimprovement.Lastly,thePAincludesaneconomicassessmentoftheproject.
3 ProjectDescription
ProjectHistoryTheRHAof1878authorizeda20ftdeepnavigationchannelintheColumbiaRiver.Theauthorizeddepthwasincreasedto25ftbytheRHAof1892andtheauthorizedwidthwassetat300ftbytheRiversandHarborsActof1902.
Theauthorizeddepthwasthenincreasedto30ftbytheRiversandHarborsActof1912.Priortoconstructionofthe30ftchannel,dredgingwaslimitedtoafewveryshallowreachesoftheriverwherethenaturalcontrollingdepthswereinthe12‐to15‐footrange.Whenthechanneldepthwasincreasedto30ft,therewassignificantincreasedshoalingassociatedwiththenewdepth.Maintenancedredgingwasincreasedandmanyhydrauliccontrolstructures(piledikes)werebuilttomaintaintheauthorizedchannel.
Theauthorizeddepthandwidthwereincreasedto35ftand500ft,respectively,bytheRiversandHarborsActof1930.Constructionoccurredfrom1930to1935.From1936to1957,channelalignmentadjustmentsweremadethataddedtothedredgingrequirements.Duringthisperiod,dredgingaveraged6.7millioncubicyards(mcy)peryear.By1958,thechannelalignmenthadstabilizedbutdredgingwasaugmentedtoincreasethedepthofadvancemaintenancedredgingfrom2to5ftbelowauthorizeddepthtoallowthechanneltoshoalforayearbetweendredgingeventsandstillprovideauthorizeddimensions.
Theauthorizeddepthwasincreasedto40ftandtheauthorizedwidthwasincreasedto600ftbytheRiversandHarborsActof1962.Constructiontookplaceinstagesbetween1964and1976.Thenavigationchannelgenerallyfollowedtheriver'sthalweg(thedeepestpartoftheriverchannel),andmostofthechannelwasnaturallydeeperthantherequired40ft.Shoalstendedtoforminchannelreacheswherethenaturaldepthwaslessthan40ft.From1976to1996,dredgingaveragedapproximately5.5mcyperyear(excludesemergencydredgingrelatedtothe1980eruptionofMountSt.Helens).
ThepreviousLowerColumbiaRiverDMMPwaspreparedin1998andbecamethebasisforthe2003ColumbiaRiverChannelImprovementProjectSupplementalIntegratedFeasibilityReportandEnvironmentalImpactStatement(SEIS)finalplanforconstructionandthefirst20yearsofmaintenanceofthe43‐footColumbiaRiverchannel.Thecurrent43‐footchannelwasauthorizedbytheWRDAof1999andConsolidatedAppropriationsAct

3
of2004.Constructionofthe43‐footchanneloccurredfrom2005to2010.TheplacementsitecapacitiesusedasthebasisfortheCRCIP2003SEISwerefromthe1998DMMP.Theseprojectedcapacitieswerenotreducedbythevolumeofdredgedmaterialplacedatthesitesfromongoingmaintenanceoftheexisting40‐footchannelduringtheperiodoftimebetweenthe1998DMMPandtheconstructionofthe43‐footchannel.Asaresult,whendredgedmaterialcontinuedtobeplacedinuplandsitesfrom1999‐2004,thissignificantlyreduceduplandsitecapacityavailableforconstructionandmaintenanceofthe43‐footchannelstartingin2005.Also,severaluplandsitesidentifiedintheCRCIP2003SEISwereeliminatedforvariousreasons,andremainingsiteswerenotusedasplannedduring43‐footchannelconstruction.Together,thesechangesresultinthelossofanestimated24mcyofuplandplacementcapacityforthelongtermmaintenanceofthe43‐footchannel.
TheCorpsdevelopedtheColumbiaRiverFederalNavigationChannelInterimOperations&Maintenance(O&M)Plan(interimO&MPlan)in2013forchannelmaintenancethrough2018.However,placementofdredgedmaterialundertheinterimO&MPlanislimitedtotheactualremainingcapacityandreducednumberofsuitablesitescomparedtowhatwasinitiallyselectedintheCRCIP2003SEIS.RefertotheinterimO&MPlanforadditionaldiscussion.
CurrentProject Constructionofthe43ftchannelwascompletedin2010andtheProjectisnowinO&Mphase.Thechannelismaintainedusingacombinationofdredgingandhydrauliccontrolstructures(suchaspiledikes).TheinterimO&MPlanprovidesguidanceforannualdredginganddredgedmaterialplacement.Advancedmaintenancedredging,thepracticeofexcavatingshoalstoadepthand/orwidthgreaterthantheauthorizednavigationchanneldimensionsforthepurposeofmaintainingtheauthorizeddimensionsforalongerperiodoftimebetweenmaintenancedredgingevents,iscurrentlyallowedupto5ftbelowauthorizeddepth(generally48ft)andupto100ftoutsidetheauthorizedchannelwidth.
TheLowerColumbiaRiverdeepdraftFNCevaluatedinthisPAisdefinedas:
Mainnavigationchannel,43ftdeepandgenerally600ftwide,fromtheMouthofColumbiaRiver,RM3toVancouver,WA,RM105.5.
Turningbasin43ftdeepatAstoria,OR,RM13. Turningbasin40ftdeepatLongview,WA,RM66.5. Turningbasin43ftdeepatKalama,WA,RM73.5. LowerTurningbasin43ftdeepatVancouver,WA,RM105.5. Navigationchannel43ftdeepand400ftwidefromtheColumbiaRiverRM102
extending1.5milesintolowerOregonSlough.

4
ColumbiaRivernavigationchannelreachesaredefinedasfollows: Table3‐1:NavigationChannelReacheswithinLowerColumbiaRiver
Reach #/ID
Reach Name Downstream RM* Limit
UpstreamRM Limit
Turning Basins
01/LDS Lower Desdemona 03+00 06+22 ‐
02/UDS Upper Desdemona 06+22 10+00 ‐
03/FLV Flavel Bar 10+00 13+30 RM 13, 43 ft
04/USN Upper Sands 13+30 17+28 ‐
05/TNG Tongue Point Crossing 17+28 21+20 ‐
06/MLN Miller Sands 21+20 25+15 ‐
07/PIL Pillar Rock Ranges 25+15 28+40 ‐
08/BKW Brookfield‐Welch 28+40 32+30 ‐
09/SKM Skamokawa Bar 32+30 36+31 ‐
10/PGT Puget Island 36+31 40+40 ‐
11/WAN Wauna Driscoll 40+40 44+30 ‐
12/WST Westport Bar 44+30 48+15 ‐
13/EUR Eureka Bar 48+15 51+45 ‐
14/GUL Gull Island Bar 51+45 55+30 ‐
15/STL Stella‐Fisher Bar 55+30 59+20 ‐
16/WLK Walker Island Bar 59+20 63+10 ‐
17/SLG Slaughters Bar 63+10 67+06 RM 66.5, 40 ft
18/LDB Lower Dobelbower Bar 67+06 69+50 ‐
19/UDB Upper Dobelbower Bar 69+50 72+40 ‐
20/KLM Kalama Bar 72+40 76+25 RM 73.5, 43 ft
21/LMT Lower Martin Island Bar 76+25 80+20 ‐
22/UMT Upper Martin Island Bar 80+20 83+42 ‐
23/STH St. Helens Bar 83+42 87+15 ‐
24/WAR Warrior Rock Bar 87+15 90+20 ‐
25/HEN Henrici Bar 90+20 94+05 ‐
26/WLW Willow Bar 94+05 97+40 ‐
27/MGN Morgan Bar 97+40 101+20 ‐
28/VBR Lower Vancouver Bar** 101+20 104+30 ‐
29/VTB Vancouver Turning Basin*** 104+30 105+28 RM 105, 43 ft
*RiverMiles(RM)arelabeledasRiverMileNumber+Hundredsoffeetupstream(e.g.RM3+25=2500feetupstreamofRiverMile3).Certainrivermilenumbersareintentionallysetatrecognizablefeaturesandasaresult,individualrivermilescanbedifferentlengths.Onaverage,rivermilesintheColumbiaRivermorecloselyapproximatethedistanceofastatutemilethananauticalmile.
**OregonSloughislocatedatRM102+00.
***VancouverTurningBasin(Upper)RM105+28to106+24ismaintainedtolessthanauthorizeddepth35ftbasedoncurrentuserneedsandisnotincludedinthisPA.
SeeoverviewmapinFigure3‐1.

5
Figure3‐1:LowerColumbiaRiverFNCReaches

6
4 Non‐FederalSponsorsThenon‐FederalsponsorsforthisprojectarethePortofPortland,OR;thePortofVancouver,WA;thePortofKalama,WA;thePortofLongview,WAandthePortofWoodland,WA.Thenon‐FederalsponsorsandU.S.ArmyCorpsofEngineers(Corps)enteredintotheProjectCooperationAgreement(PCA)forConstructionofImprovementsforEcosystemRestorationandNavigationontheColumbiaRiverportionoftheColumbia&LowerWillametteRiversFederalNavigationChannel,OregonandWashingtononJune23,2004.ThisPCAcontinuestoapplytoongoingchannelmaintenanceforaslongastheprojectremainsauthorized.
5 LowerColumbiaRiverContext
IntroductionTheColumbiaRiverisadynamicsystemthatposesanannualchallengeformaintenanceoftheFNCtotheauthorizeddepthof43ft.Thissectionprovidesimportantcontextfortheassessmentofpotentialimpedimentstocontinuedmaintenance.RefertotheColumbiaRiverFederalNavigationChannelInterimOperations&Maintenance(O&M)Planforadditionaldetail.Forpurposesofthisreport,theLowerColumbiaRiverisdefinedastheColumbiaRiverdownstreamofVancouver,Washington(RM105.5)totheMouthoftheColumbiaRiver(MCR)entrancechannelatthePacificOcean(RM3).
Hydrology,HydraulicsandTidesTheColumbiaRiverflows1,210milesfromCanadathroughtheStatesofWashingtonandOregontothePacificOcean,anddrainsanareaof259,000squaremiles(Hickson,1961).MajortributariesaretheSnakeandWillametteRivers.Theriverisregulatedbyaseriesofdams.BonnevilleDamisthefurthestdownstreamatRM145.ColumbiaRiverdischargesaredependentonweather,reservoiroperations,andoceantides.ThehighestflowsgenerallyoccurinMayorJuneasaresultofsustainedsnowmeltintheupperwatershedandthe2‐yrfloodpeakatTheDalles,Oregon(RM192)is360,000cubicftpersecond(cfs)withregulation.Lowflows,typicallyinthe100,000cfsrange,occurinSeptemberandOctober,afterthesnowmeltbutbeforethewinterrains(Eriksen,1989).
Thelowerriversub‐basins,thosewestoftheCascadeCrest,containonlyabout8‐percentofthetotalbasinarea,butcontribute24‐percentofthetotalriverflowbelowBonnevilleDam;thus,briefwinterfreshetscausedbyrunofffromrainfall,orrain‐on‐snowinthelowersub‐basinsmayoccurfromDecemberthroughMarch.Forexample,onFebruary11,1996themaximumdailyColumbiaRiverflowatTheDalleswas376,000cfs,andflowintotheColumbiaRiverfromtheWillametteRivertributaryatRM101wasnearly400,000cfs.

7
Thecombinedeffecttotaled865,000cfsatRM55oftheLowerColumbiaRiver(downstreamofLongview,WA)(Simenstadetal,1984).Overall,peakwaterlevelsintheLowerColumbiaRivergenerallyoccurinJanuaryandJune,andminimumlevelsoccurAugustthroughOctober(seeFigure5‐1).
Figure5‐1:RiverLevelatVancouver,WA
TidalinfluenceonriverineflowisgreatestinthereachesdownstreamofRM33andchieflyduringlowflowperiods.PartialflowreversalcanoccurasfarupstreamasRM90duringlowflowperiods(Eriksen,1989).Theverticalplaneofreferenceismeanlowerlowwater(MLLW)intheriverdownstreamofHarringtonPoint(RM22)andadoptedlowwater(ColumbiaRiverDatum[CRD])upstreamtoVancouver.Theauthorizednavigationchanneldepthis43feetbelowzerodatum.Zero(0)CRDroughlycorrespondstotheriverlevelatminimumoperatingdischargefromBonnevilleDam(70,000cfs).Averagetidalrangeisabout8ftatthemouthoftheColumbiaRiver(extremeis13ft)andabout3ftatlowriverstagesatVancouver.AnnualfreshetshavelittleeffectonriverlevelatthemouthoftheColumbiaRiver,butaverageabout12ftatVancouver(Headquarters,U.S.ArmyCorpsofEngineers,2014).
MorphologyTheestuaryis4‐5mileswideandextendsupstreamfromtherivermouthtoaboutRM25.UpstreamofRM25,themainriverchannelis1,700‐3,000ftwide,withminorbifurcations

8
aroundislands(bifurcationisaforkintheriverwhereitbranchesintomorethanonestreamofflow).Bendstendtobegradual,exceptwherebasaltcliffscontrolthealignment.
Thebedofthemainchanneliscomposedoffineandmediumsands(0.125‐0.500mm).Thenaturalriverbanksconsistof10to20ftofclay‐silt,overlyingmuchdeepersanddeposits.Sandybeachesoccuronlywheredredgedmaterialhasbeenplacedalongtheshore(Eriksen,1989).
SedimentBudget
5.4.1 SuspendedSedimentLargely,thedrainagebasin(ColumbiaPlateau)oftheColumbiaRiverconsistsofexposedbedrock,andregionsofrockoverlainwiththin,surficialsoildeposits.TheclimateoftheColumbiaPlateaurangesfromsemi‐aridtoarid.Asaresult,thesedimentyieldfromthebasinislow–thelowestofanymajordrainageinNorthAmerica.MostmeasurementsandestimatesofannualsuspendedsedimentloadpassingBonnevilleDamwereperformedbeforethespringfreshetwaseliminatedbyflowregulation,howevertheacceptedfigureforannualloadforthemodernperiod(post1969)is4.5to5.1mcy(VolumemeasurementswereconvertedfromMetricTons(Tonnes)toCubicYardsusingthefollowingformula,which
assumeswetsanddensity(notcompacted)at1,922kg/m3: , .
,
1.47 ).AftertheeruptionofStHelensin1980,theannualsuspendedsedimentload
measuredattheriverine‐estuaryboundarytemporarilyincreasedto27mcy(Sherwoodetal,1984).
Duringhighregulateddischarges,75to80percentofthesuspendedloadbyweightiscoarsesilt‐sizeandfiner(modalaverage=0.030mm(mediumsilt)).Priortoflowregulation,siltscomprised45‐50percentofthesuspendedload,andfine‐andvery‐finesandmadeupmostoftheremainingfractionofthesuspendedsedimentload.Mostofthisfinesedimentdoesnotdepositinthenavigationchannel,butinsteadsettlesoutinlowervelocityareasoftheriverorremainssuspendeduntilitreachesthePacificOcean(Beasleyeta,1986),(Karlin,1980),(Simenstadetal,1984).Since1980,sedimentfromMountSt.HelenshasincreasedthetotalannualsedimentloadsdownstreamoftheCowlitzRiver(RM68)butmostofthesedimenthasbeensmallerthanthatfoundinthebedoftheColumbiaRivernavigationchannel(Eriksen,1989).
5.4.2 BedMaterialandBedloadThebedmaterialoftheColumbiaRiverfromBonnevilleDam(RM145)downstreamtoRM15consistsofmediumsand,withsomefinersandfractions.FromRM15downstreamtoRM11,coarsesandrepresentsanincreasingfractionofthebedmaterialasmarinetransport(floodcirculation)increases.FromRM11downstreamtotheocean,asflood‐

9
inducedtransportdominates,thefractionofcoarsesandmayexceedthemediumsandfractiononthechannelbottom(Sherwoodetal,1984).
Verylittledataareavailableforthebedloadbudgetinboththeriverandestuary.However,researchershaveestimatedthefluvialsupplyofbedloadsedimentdownstreamofBonnevilleat500kcy/year(Haushildetal,1966)(VolumemeasurementswereconvertedfromMetricTons(Tonnes)toCubicYardsusingtheformulainSection5.4.1).
ShoalFormation
5.5.1 SandWaveShoalsSandwaves,giantripplesordunesofsandformedfrommaterialontheriverbed,havelongbeenrecognizedasashoalingproblemintheColumbiaRiver.Large,migratingsandwavesarethepredominantbedformoftheColumbiaRiverfromBonnevilleDam(RM145)downstreamtothemouth.BetweenBonnevilleDamandtheWillametteRiver(RM101);sandwavescover45%oftheColumbiaRiverchannelbottom;fromtheWillamettetotheCowlitzRiver(RM68),sandwavecoverageis80%;andfromtheCowlitztothemouth,coverageincreasesto86%(Whettenetal,1969).Mostofthetime,onlythepeaks(crests)ofsandwavesgrowshallowerthanauthorizedchanneldepthandrequiredredging.Dredgingtypicallyinvolvestheselectiveremovalofthecrestofeachindividualsandwave,whichisnotefficientforconventionaldredgingtechnologybecausethecrestsareseparatedbydeeperareasthatdonotrequiredredging(Levinetal,1992).Whilethevolumeofmaterialdredgedfromanindividualsandwaveshoalissmall,typicallylessthan10kcy;collectivelytheyarenumerousenoughtorepresentasignificantamountofthetotaldredgingvolume.
FromBonnevilleDamtoRM15intheestuary,bedforms(sandwaves)inthenavigationchannelareunidirectionalandmigratedownstream;fromRM14to11,bedformsaretidallyreversing;andfromRM11tothemouth,wheretransportisflood‐currentdominated,sandwavesmigrateupstream.Sandwavesmayformanywhereintheriverandestuarywhereflowvelocitiesapproachorexceed2feet/s.Therateofmigrationandsizeofsandwavesincreasewithhigherflowvelocities.Duringlowdischarges,migrationratesmaybe1‐2feet/day;athigherregulateddischarges,migrationratescanbe10to20timeshigher.Duringhighwinterfreshets(e.g.February1996),migrationratesofsandswaveswereestimatedtobeashighas200feet/daydownstreamoftheWillametteRiver(RM101).Migrationratesareanindicatoroftransportmode–atlowrates,sedimentmovesasbedload;athigherrates,bedmaterialistransportedinsuspension(i.e.bedmaterialload)(Hubelletal,1971),(Royetal,1979).SeesandwavesinFigures5‐2and5‐3.

10
Figure5‐2:Sandwavemovementandgrowthover3‐weekperiodatWillowBar(RM97).PointAshowsasandwavecrestmoving100ftdownstreamandPointBshowsasandwavecrestgrowing2ftshallower,creatingashoalaboveauthorizeddepth.ColumbiaRiverdischargefromBonnevilleDamduringthistimerangedfrom300to400kcfs.
Figure5‐3:Sandwavepeakformintermittentshoalingaboveauthorizeddepthof43ftshowninred.LocationisUpperMartinBar;surveydated4‐Oct‐2011.

11
5.5.2 CutlineShoalsCutlineshoalsformfromthecutlinetowardthechannelcenterandcanextendseveralthousandfeetalongthechannellengthparalleltoflow.Theseshoalsaremuchlargerinvolumethansandwaves(dredgingvolumestypicallyover100kcy)andoccurannuallyatthesamelocations,mainlydownstreamofLongview,WA(RM68).Theyareespeciallysevereinareasoftheriverthatwerelessthanauthorizeddepthpriortoconstructionoftheexistingchannel.Theseshoalsoccurontheinsideoflongbendsandonstraightriverreaches.SeecutlineshoalsinFigures5‐4and5‐5.Theprimarycauseisgravitypullingbedloaddownthesideslopesandintothenavigationchannel.Asrivercurrentsmovebedloaddownstreamoverareaswheretheriverbottomslopesdowntowardthechannel,gravitydeflectsthesedimentdowntowardthechannel.
Figure5‐4:Cutlineshoalformationfrombedloadmaterialmovingacrossandalongtheriverbottom.

12
Figure5‐5:Cutline,continuousshoalingformsaboveauthorizeddepthof43ftshowninred.LocationisSkamokawaBar;surveydated20‐Jul‐2011.
ConclusionTheColumbiaRiverisadynamicsystemthatposesanannualchallengeformaintenanceoftheFNCtotheauthorizeddepthof43ft.
Asdiscussedinthissection,theconvergenceofuniquehydrologyandmorphologycausessedimentbedloadtoformshoalinginthenavigationchannelduringpeakriverlevels,(latespring)whichareimmediatelyfollowedbythelowestriverlevels(latesummerandfall).Sincetheauthorizednavigationchanneldepthisrelativetozerodatum,iftheriseinriverlevel(verticalfeetabovezerodatum)isgreaterthanthedeposition(verticalfeet)ofshoalinginthechannel,shipswillhaveadequatewaterdepthtobeabletopassovertheshoal.However,ifthereisstillshoalinginthechannelabovetheauthorizeddepthwhenriverlevelsapproachzerodatum,shipswillberestricted.
TheColumbiaRiver’snaturalsequenceofpeakriverflowsandshoalingfollowedbylowestriverlevelsresultsinashort,criticalwindowofopportunity,lastingapproximatelytwomonthsfrommid‐Junetomid‐August,toremoveshoals.Duringthiscriticaltime,limiteddredgingequipmentthatissharedregionallymustbemobilizedtoremoveshoalingaboveauthorizedchanneldepthbeforethecombinationofshoalingandlowwaterlevelimpactsnavigationsafetyandefficiency.Advancedmaintenancedredgingatothertimesoftheyearisusedtoreducethevolumeofshoalingaboveauthorizeddepthtoamanageablelevel.

13
6 ChannelMaintenanceAssessment
IntroductionAnnualmaintenanceisperformedusingacombinationofdredgingandhydrauliccontrolstructures(suchaspiledikes).ThepurposeofthissectionistosummarizerecenthistoryandevaluatethecurrentconditionsofchannelmaintenanceintheColumbiaRiverFNCinordertobetterunderstandfuturemaintenanceneedsandhighlightpotentialimpedimentstocontinuedFNCoperationsandmaintenance.Thisassessmentconsidersthreetimeperiodsinordertoforecastneeds:1986‐2004(40ftFNCmaintenance),2005‐2010(43ftFNCconstruction),and2011‐2016(43ftFNCmaintenance).
Dredging
6.2.1 DredgingEquipmentThechannelisannuallymaintainedbythreehopperdredgesandonepipelinedredge.TwoofthehopperdredgesareownedbytheGovernment,theESSAYONSwhichisconsideredamediumsizeddredge,andtheYAQUINAwhichisasmallerdredge.Oneadditionalhopperdredgeisemployedthroughcontract.The30‐inchpipelinedredge,theOREGON,worksundercontractwiththePortofPortland.Clamshelldredges,whichremoveshoalsmechanicallyusingbucketsoperatedbyfloatingcranesonbarges,arebestsuitedformaterialthatcannotberemovedbyhydraulicdredgingorworkincloseproximitytostructureslikedocks,andsoarenotroutinelyneededforchannelO&M.PhotosofdredgingequipmentareshowninFigure6‐1.
Hopperdredgesaremobilevessels(ships)thatcanquicklymovebetweenshoalsandaredesignedtooperateinunprotectedseaconditions.Forthesereasons,hopperdredgesaremostefficientforremovalofsmallvolumesandwaveshoalsintheriverandlargercutlineshoalsintheestuary.Dredgedmaterialispumpedfromtheriverbottomintoatemporarystoragebasin(hopper)locatedinsidethedredge.Oncethehopperisfull,thedredgestopsdredging,transitstotheplacementlocation,andtypicallyplacesthematerialin‐waterbyopeningthebottomofthevesseltoreleasethematerialusingforceofgravity.Thein‐riverplacementlocationmustbedeepenoughforthedredgetosafelyaccessbasedonthevessel’sdraftbelowthewatersurface.TheESSAYONStypicallyneedsdepthsgreaterthan35feetandtheYAQUINAneedsdepthsgreaterthan20feet.Whenpossible,dredgesareassignedtoshoalsthatarelocatedclosesttoin‐riverplacementlocationsthatarebestsuitedtotheirlimitingdraft,tomaximizeproduction.Somecontracthoppersareequippedtohookuptoapipelineandpumpdredgedmaterialbackoutofthehoppertoplacementsitesonshore,buttheESSAYONSandYAQUINAdonothavethatcapability.Becauseittakesapproximatelytwiceaslongtoclearashoalwhenmaterialispumpedbackoutofahopperdredge(comparedwithin‐waterplacement),atasignificantlyhighercost,this

14
methodhasnotbeenusedforrecentchannelmaintenance.Becausehopperdredgesareself‐propelled,theyarenotphysicallylimitedtoplacementsitesnearadredgingarea;however,increasedhauldistancetranslatestoincreasedtimeandcostrequiredtoremoveashoal.
ThepipelinedredgeOREGONismostefficientforremovaloflargercutlineshoalswherethereisalargequantityofmaterialconcentratedwithinasmallarea,becausethedredgeisnotself‐propelledandistypicallyattachedtoonetotwomilesoffloatingpipelineduringoperation,soasignificanteffortisinvolvedtomovethedredgebetweenshoals.Materialispumpedfromtheshoaltotheplacementsitethroughthepipelineinonecontinuousaction,sothedistancebetweentheshoalandtheplacementlocationislimitedbythephysicallengthofpipelineavailable.Thispipelinedredgeshouldbeusedinmoreprotectedreachesoftheriverbecausethefloatingpipelineisnotdesignedtowithstandlargewavesorhighflowvelocitiesandcouldbreakapartunderthoseconditionsinthelowerestuary.Thepipelinedredgeisequippedtoplacematerialin‐wateroruplandatthesameproductionrate,bypumpingmaterialthroughthepipelineeitherbackintotheriverorontoshore.Forthisreason,thedredgeOREGONismoreefficientthanhopperdredgesforuplandandshorelineplacementofdredgedmaterialintheLowerColumbiaRiver.
TheCorpsPortlandDistrictleadsaregionaldredgingprogramontheWestCoastwithotherCorpsDistricts,anddredgingequipmentissharedbetweentheCorpsDistrictsthroughthisprogram.ThisregionalcollaborationisnecessarytocreateaneffectiveandfeasibledredgingplanthatoptimizesprojectfundingandresourcesavailablefromthelimitednationalhopperdredgingfleetofGovernmentandcontracthopperdredges.TheESSAYONSandYAQUINAarebasedontheWestCoastinPortlandDistrict.However,theworkavailableforcontracthopperdredgesislocatedontheEastandGulfcoastsoftheUnitedStates,withtheexceptionoftheannualWestCoastcontract,soeachyearonecontracthopperdredgemusttransitthroughthePanamaCanaltoandfromtheWestCoast(atanincreasingcost)inordertomeettheregionaldredgingprogramneeds.Thescheduleforthisregionaldredgingisestablishedthroughannualregionalplanningmeetings,andismeanttomeettheneedsofalltheCorpsDistrictsinvolved;however,therecouldbetimesthatdredgingisneededintheLowerColumbiaRiverFNC,butequipmentisnotreadilyavailablebecauseitisbeingusedtomeettheneedsofanotherCorpsDistrict.ThisDMMPwillconsiderequipmentavailabilityandproviderecommendationsbasedonlessonslearnedfromprioryearsofregionaldredgeplanning.
15
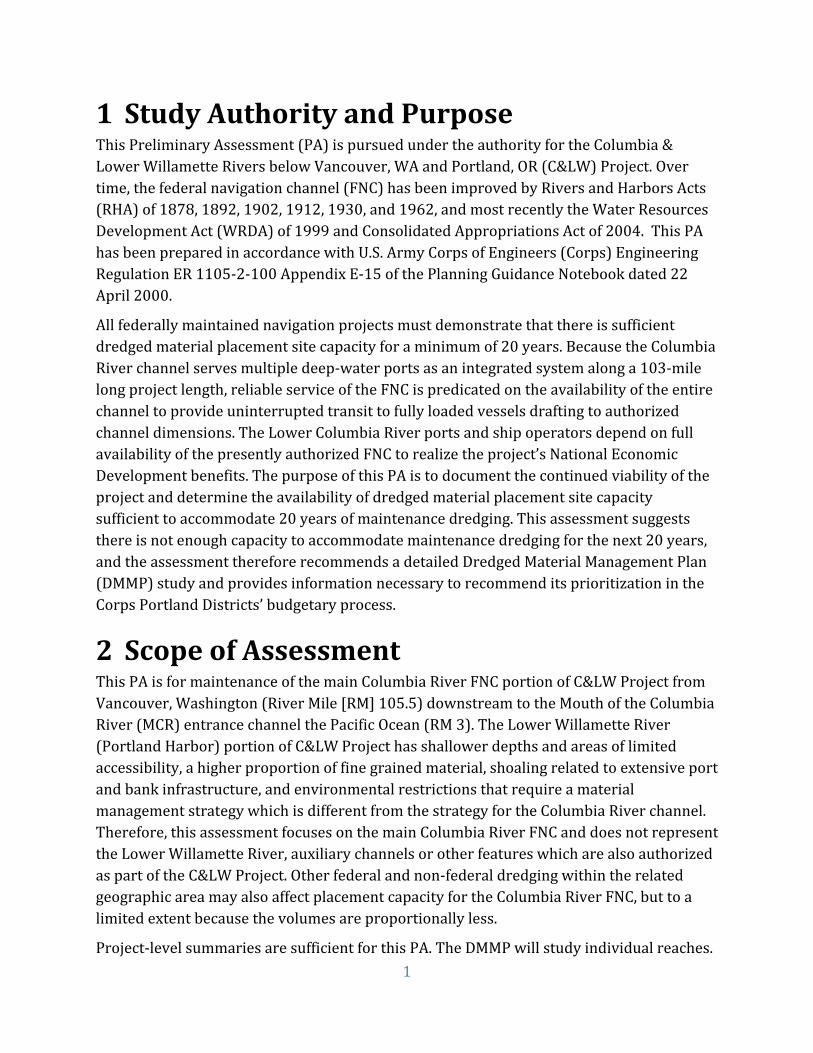
Figure6‐1:DredgingEquipmentonLowerColumbiaRiver.
6.2.2 Historicaldredgingevaluation
Figure6‐2showsannualO&MdredgingandConstruction(newwork)dredgingvolumesfortheperiod1986to2016.
Theannual40ftchannelO&Maveragefrom1986to2004was6.8mcy.Withunusuallyhighfloodyears1996‐1997removed,theaveragedropsto6.1mcy.Becausedredgingisoftenlimitedbyannualfundingconstraints,dredgingequipmentavailabilityorworkwindows,andnotalwaysrelatedtoshoalingconditionsordredgingneeds,thesedredgingvolumesmaynotaccuratelyrepresentthepastneedfordredging,onlytheamountsthatwereabletobedredged.
Duringconstructionofthe43ftdeepdraftchannelovera6‐yearperiodfrom2005to2010,theoretically,annualO&Mdredgingvolumesshouldhaveremainedconsistentwiththeannual40ftchannelaverageof6.8mcyandtotalColumbiaRiverdredgingshouldhaveincreasedbythevolumeofconstructionmaterial.Inactuality,annualO&Mdredgingvolumesdecreasedduringthistimetoanaverageof4.5mcy.Thereasonforthisisthatconstructionofthe43ftchanneltooksixyearsandduringthistimethechannelwasmaintainedasa40ftchannel,eveninareasthathadalreadybeendeepenedto43ft.Inotherwords,thefirstareasdeepenedto43ftwereallowedtoshoalbackto40ftwhilethe

16
remainderofthe43ftchannelwasconstructed.TheresultoflessO&MdredgingduringconstructionwasabacklogofO&Mdredgingneedattheendofconstructionin2010.
Eachyearshoalsthatareformedduringannualhighflowsmustbedredgedbeforethelowwaterseason,howeverwithlimitedequipmentresourcesavailable,ittakesmonthsforthedredgestoremovethelargeannualquantitiesofmaterial.Advancedmaintenancedredging(AMD)inthefallandspringisusedwhenpossibletoreducethevolumeofshoalingthatformsaboveauthorizeddepthtoamanageableleveltominimizeimpactstonavigation.Ideally,thechannelisdredgedannuallytoadvancedmaintenancedepthof48ftandwidthsof100ftoutsidetheFNCwhereneeded,andeachdredgeispairedwithshoalingandplacementoptionsthatmaximizeefficiency.
TheactualandplannedO&Mdredgingvolumesforthefirstyearafterconstruction(2011)appeartobeconsistent.However,theplannedO&Mvolumereflectsfulladvancedmaintenancedepth(48ft)alongtheentirechannellength,andtheactualquantitydredgedwasnotabletoachieveauthorizeddepth(43ft).CausesfortheincreasedshoalingvolumesincludethebacklogofO&Mdredgingneededafterchannelconstructionandhigh,sustainedriverflows,whichdestabilizedthenewchannelandcreatedsandsourcesalongthebanksoftheriver.TheactualO&Mdredgingthatwouldhavebeenneededin2011,thefirstyearafterconstruction,toachieveadvancedmaintenancedepthandwidthatcriticalshoalsinthe43ftchannelwouldhavebeenupwardsof12mcy,basedonchannelsurveyvolumes.Becauseoflimiteddredgeavailabilityandfunding,actualdredgingwaslessthan8mcyandasaresultadvancedmaintenancedepthwasnotachieved.
Withoutadvancedmaintenance,shoalsrapidlyre‐forminareasthathavebeendredged,whiledredgesarestillworkinginotherareastocleartheentirelengthofthe100‐milechannel.Inotherwords,shoalsre‐formfasterthandredgescanremovethemandthereisalwaysatleastoneshoalaboveauthorizeddepthinthechannel.Asaresult,situationsarisewhentheonlyavailableequipment(oftennotbestsuitedforthejob)issenttoaddressthehighestpriorityshoalinreal‐time.Thisreducestheefficiencyofdredgingoperationsandincreasesunitcosts.Consequently,thisimpactsrivertrafficbecauseifriverlevelsarenothighenough,commercialshipscannotpassovershoalsthatareshallowerthanauthorizeddepthandmustloadlesscargosotheydonotdraftasfarbelowthewatersurface.Theseshipdraftrestrictionsresultinadverseeconomicimpacts.Thiswasthecasein2011and2012,thefirst2yearsof43ftchannelO&Mandunusuallyhighriverflowandshoalingyears,whenasmuchas80%ofthevolumedredgedwasfromshoalingshallowerthanauthorizeddepth,notadvancedmaintenance,andtherewerecommercialshipdraftrestrictions70%ofthattime.
However,aftersufficientfundingwasprovidedfordredgingtoachieveadequateadvancedmaintenanceinfall2014,thesituationgreatlyimproved.Therewasbelowaveragepeakflowin2015andaveragepeakflowin2016,whichresultedinreducedshoalingvolumes

17
thatwerecloserto40ftchannelaverages.Additionally,becausetheinitialchannelconditionattheendof2014wasaconditionofgreateradvancedmaintenancedepth,whenshoalingdevelopedin2015and2016,mostofthevolumedevelopedbelowtheauthorizeddepthof43ftinsteadofformingrestrictingshoalsabove43ft.Dredgingin2016wasthereforeabletofocusonremovingmaterialasitaccumulatedinthedepthrangeof48ftto43ft,beforeitbecameshallowerthan43ft.AsaresultofbeingabletoachievethissustainedAMDinamajorityofthesystem’sreaches,channelconditionreportsshowedadecreaseinshoalingabovetheauthorizedchanneldepthincomparisontoprioryears.Consequently,therewerenoshipdraftrestrictionsin2016,thefirstfullyearwithoutrestrictionssincemaintenanceofthe43ftchannelbeganin2011.
Additionally,thedredgeassignmentshavebeenoptimizedusinglessonslearnedfromprioryearssothatby2016,eachdredgewasdirectedtoshoalsandplacementsitesthatbestfitthecapabilityofthatspecificdredge.Thecontracthopperdredgeconcentratedonlarger,lessdynamicshoalsbecausecontractdredgesaretypicallylessfamiliarwiththechallengesofremovingsandwaveshoalingandthereisagreatereffortforcontractadministration,acceptanceandpaymentforeachworkareaascomparedtotheGovernmentdredges.ThedredgeESSAYONSremovedtheremainingshiftingshoalsdownstreamofLongview,WAwherethereismorein‐riverplacementcapacityatgreaterdepthsandthemostmaneuverabledredgeYAQUINApickedupsandwavespotshoalsupstreamtoVancouver,WAwheretheriverbottomisshalloweroutsidethechannelandthereislimitedin‐riverplacementcapacityforlargerhopperdredges.DredgeOREGONassignmentswerealsooptimizedbyfocusingonlarge,cutlineshoalsincloseproximitytouplandorshorelineplacementsites,whichismostefficientforthepipelinedredge.Theannualregionalhopperdredgescheduleshavealsobeencraftedtoallowmoreflexibilitytoadjusttothepeakflowperiod,sosummerdredgingintheColumbiaRiverdoesnotoccurtooearly(whileshoalsarestillshifting)ortoolate(afterriverlevelsdrop).Thesedredgingpracticeswillcontinuetomaximizetheefficientuseofavailableequipment.

18
Figure6‐2:O&M+Construction(NewWork)DredgingQuantities(1986‐2016)
0
2,000,000
4,000,000
6,000,000
8,000,000
10,000,000
12,000,000
14,000,000
16,000,000
1986
1987
1988
1989
1990
1991
1992
1993
1994
1995
1996
1997
1998
1999
2000
2001
2002
2003
2004
2005
2006
2007
2008
2009
2010
2011
2012
2013
2014
2015
2016
ColumbiaRiverDredging(O&MandConstruction)CYbyYear:1986to2016
Actual 40‐ft Channel O&M (1986‐2004) = annual average 6,800,000 CY
Actual 43 ft Channel construction (2005‐2010) O&M plus New Work = annual average 7,600,000 CY
Actual 43 ft Channel construction (2005‐2010) O&M Only for comparison = annual average 4,500,000 CY
Actual 43‐ft Channel O&M (2011‐2016) = annual average 6,500,000 CY
Planned (CRCIP 2003 SEIS) 43‐ft Channel O&M (2011‐2016) for comparison = annual average 6,600,000 CY

19
6.2.3 ForecasteddredgingneedsThe2003ColumbiaRiverChannelImprovementProject(CRCIP)FinalSupplementalIntegratedFeasibilityReportandEnvironmentalImpactStatementpredictedthatanaverageof4.6mcywouldbedredgedannuallytomaintainthe43ftchannelovera20yearperiod(2011‐2030).Thisaveragedredgingneedwasbasedontwoassumptions:thatanannualaverageofnearly3mcy(63%)wouldbeplacedupland,andthattheremovalofdredgedmaterialfromtheriverwouldconsequentlydecreasethevolumeofshoaling(dredgingneed)overtime.Theremainingannualaverageof1.7mcy(37%)wouldbeplacedin‐water.
However,actualuplandandin‐waterplacementvolumesfor43ftchannelO&Mfrom2011‐2016arenotconsistentwithplanned(CRCIP2003SEIS)volumes.Actualuplandplacementvolumesaremuchless(annualaverageofonly0.75mcy;12%ofthematerialdredged)andactualin‐waterplacementvolumesaremuchgreater(annualaverageof5.2mcy;80%ofthematerialdredged).Instead,theactualplacementvolumesfor43ftchannelO&Mfrom2011‐2016areclosertotheactualplacementvolumesfor40ftchannelO&Mfrom1986‐2004,whenanannualaverageof1.1mcywasplacedupland(16%ofthematerialdredged)andanannualaverageof4.7mcywasplacedin‐water(69%ofthematerialdredged).
Becausefuturedredgingneedisbasedlargelyonthevolumeofmaterialremainingintheriversystem,itfollowsthatfuturedredgingneedsfor43ftchannelO&Mwouldbesimilartoannualaveragesfor40ftchannelO&M,insteadoftheCRCIP2003SEISprediction.Forthepurposesofthisassessment,theforecastedaverageannualdredgingneedforthenext20yearsisexpectedtobe6.5mcy(130mcytotal)andincludesallplacementoptions.Thisforecastisconsistentwiththehistoricsustainedaveragefor40ftchannelO&M(1986‐2004),thecurrentaveragefor43ftchannelO&M(2011‐2016),andsupportedbycurrentchannelconditionreports.TheseforecastednumbersincludeAMDthatwillhelpmaintainchannelstabilityandlimitfuturedraftrestrictions.
RiverTrainingStructures
6.3.1 PiledikesPiledikes(SeeFigure6‐3)arethemostcommonhydrauliccontrolstructureusedbytheCorpsPortlandDistrictintheColumbiaRiver.Piledikesaresemi‐permeablegroinsconsistingoftworows(riverine)orthreerows(estuary)ofuntreatedtimberpilingsdrivenon2½footcentersalternatelyplacedoneachsideofhorizontalspreaderpiles,whichareboltedinplace.Stoneisplacedalongthepiledikeandaroundtheouterendforprotectionfromscour.Atypicalpiledikeaveragesabout400ftwithhundredsofpilings.Piledikesystemsconsistofaseriesoftimberpiledikes,generallyspacedabout1200‐1500ftapartforoptimumfunctionalefficiency.Piledikestypicallyrunperpendiculartothedirectionofflowandareanchoredintoashoreline.Piledikesfunctiontoslowtheflowofwateratthe

20
edgesofthechannel,therebyacceleratingitintothecenterofthechannel.Piledikesareusedtocontrolchannelalignmentfornavigation,reducecross‐sectionalareaandfocusflowintothenavigationchanneltohelpmaintainauthorizeddepthsbynaturalscouringaction,providebankprotectionbyreducingbankerosion,andprovidestableareasfordredgedmaterialplacement(AECOM,2011).
Piledikeconstructionbeganin1885,butmostpiledikeswerebuiltbetween1917and1939.Thelastsignificantpiledikeadditionswerebuiltduringconstructionofthe40ftchannelinthe1960'stofurtherconstrictflowandreduceerosionatdredgedmaterialplacementsites.Thepiledikesystemsprotectmanymillionsofcubicyardsofdredgedmaterialfromerosion.Thepiledikesystemsweredesignedtofunctioninafluvialregimethathaschangedsignificantlysincetheirinitialconstructionwiththeadditionofflowregulationactionsinthesystem.Theauthorizedchanneldepthshavealsochangedovertimefrom35ftin1935to40ftin1962andmostrecentlythecurrent43ftauthorizeddepthasachievedin2010.Thesechangesmayproducehydrauliceffectsthatexceedthecapacityofthepresentpiledikestofunctionasintended.
Figure6‐3:TypicalPileDikeStructureinLowerColumbiaRiver

21
Ofthe236piledikesconstructedbytheCorpsintheColumbiaRiver,201arewithinthisstudyarea.Ofthe201piledikesintheLowerColumbiaRiver,76areconsideredtobeinpoorstructuralcondition,and12piledikeswereeithernotfoundorareinastateofsubstantialdeterioration(AECOM,2011).Therearesignsoffunctionalfailuresuchasincreasedbankerosionandshiftingchannelalignmentinsomelocations.Ifthesestructuresarenotrepairedpriortolosingfunctionality,thedredgingneedisexpectedtoincrease.Functionalpiledikesarecriticalforcontinuednavigationchannelmaintenance.TheDMMPwillsupportprioritized,programmaticpiledikerepaireffortsbydetermininghowtheserepairsfitintotheoverallplanforthenext20yearsofchannelmaintenance.Thepiledikesareassumedtohaveacurrentlevelofreducedfunction,andtheassumptionoffuturepiledikerepairswillguidehowtheDMMPistodevelopalong‐termchannelmaintenancestrategy.The2011analysisofpiledikesalsoidentifiedpotentialopportunitiesforhabitatimprovementsuchasplacingdredgedmaterialaroundexistingpiledikestoimprovehabitatdiversity.
6.3.2 DredgedmaterialfillDredgedmaterialhasalsobeenusedintentionallytomaintainthenavigationchannelbyreducingrivercross‐section(placingfillinshallowwaternearthebankswhichincreasesvelocitiesinthenavigationchanneltocreatenaturalscouringaction)andtocontrol
22
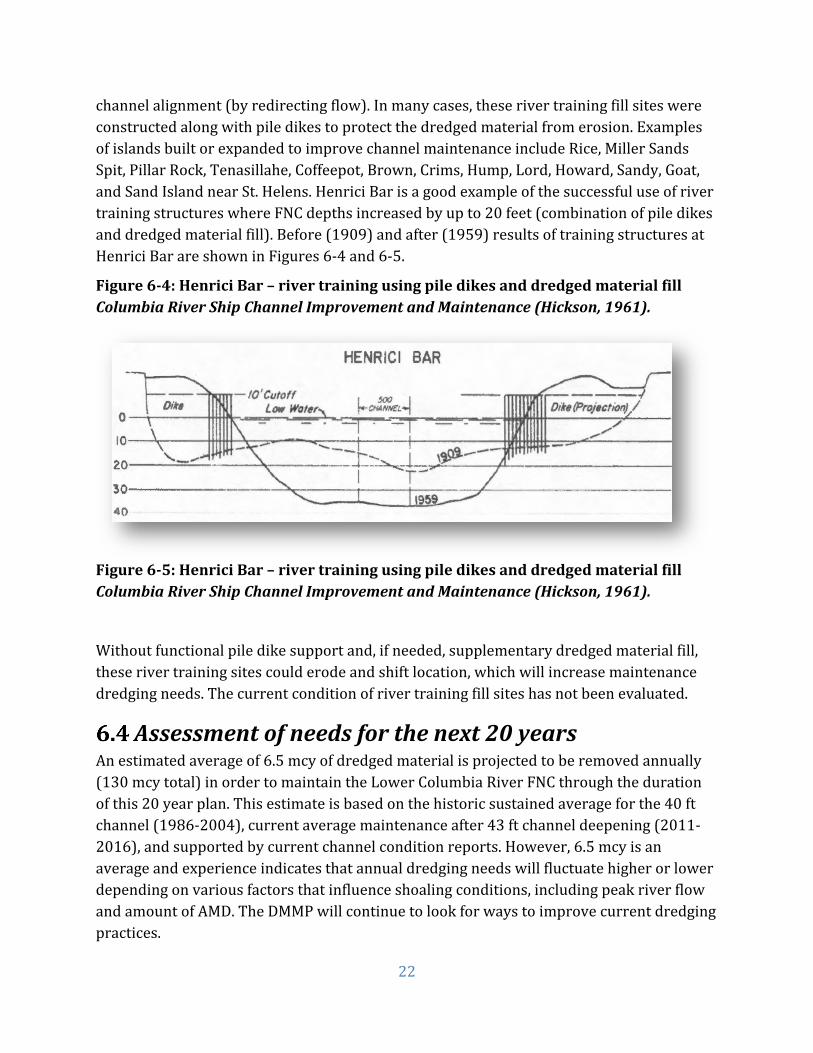
channelalignment(byredirectingflow).Inmanycases,theserivertrainingfillsiteswereconstructedalongwithpiledikestoprotectthedredgedmaterialfromerosion.ExamplesofislandsbuiltorexpandedtoimprovechannelmaintenanceincludeRice,MillerSandsSpit,PillarRock,Tenasillahe,Coffeepot,Brown,Crims,Hump,Lord,Howard,Sandy,Goat,andSandIslandnearSt.Helens.HenriciBarisagoodexampleofthesuccessfuluseofrivertrainingstructureswhereFNCdepthsincreasedbyupto20feet(combinationofpiledikesanddredgedmaterialfill).Before(1909)andafter(1959)resultsoftrainingstructuresatHenriciBarareshowninFigures6‐4and6‐5.
Figure6‐4:HenriciBar–rivertrainingusingpiledikesanddredgedmaterialfillColumbiaRiverShipChannelImprovementandMaintenance(Hickson,1961).
Figure6‐5:HenriciBar–rivertrainingusingpiledikesanddredgedmaterialfillColumbiaRiverShipChannelImprovementandMaintenance(Hickson,1961).
Withoutfunctionalpiledikesupportand,ifneeded,supplementarydredgedmaterialfill,theserivertrainingsitescoulderodeandshiftlocation,whichwillincreasemaintenancedredgingneeds.Thecurrentconditionofrivertrainingfillsiteshasnotbeenevaluated.
Assessmentofneedsforthenext20yearsAnestimatedaverageof6.5mcyofdredgedmaterialisprojectedtoberemovedannually(130mcytotal)inordertomaintaintheLowerColumbiaRiverFNCthroughthedurationofthis20yearplan.Thisestimateisbasedonthehistoricsustainedaverageforthe40ftchannel(1986‐2004),currentaveragemaintenanceafter43ftchanneldeepening(2011‐2016),andsupportedbycurrentchannelconditionreports.However,6.5mcyisanaverageandexperienceindicatesthatannualdredgingneedswillfluctuatehigherorlowerdependingonvariousfactorsthatinfluenceshoalingconditions,includingpeakriverflowandamountofAMD.TheDMMPwillcontinuetolookforwaystoimprovecurrentdredgingpractices.

23
SandwavesareachronicshoalingproblemfortheColumbiaRiverandalternativetechniquesforaddressingsandwaveshoalingneedtobefurtherinvestigated.Sandwavedredgingisinefficient,evenforhopperdredges,andbecausesandwavesmoveandgrowcontinuously,itwouldbeusefultohaveaccesstoadditionaldredgingequipmentdesignedspecificallytoclearsandwaveshoalsmoreefficientlyortoclearsandwaveshoalswhentheotherdredgesarenotimmediatelyavailable.Thelackofdredgingrequiredbetweenthewaves(wherematerialisbelowauthorizedandAMDdepth)createsinefficientdredging.The2013ValueEngineeringStudy:ProgrammaticProjectDredging‐VariousCorpsPortlandDistrictLocationsrecommendsuseofatowanddragbeamforlevelingsandwavesintheColumbiaRiver.Theideaisthatthetowanddragbeamwouldsupplementexistingdredgingequipmenttoclearshoalingfasterandmoreefficiently.However,thistechniquehasnotbeenpreviouslyappliedtocoursegrainedsandwavesintheColumbiaRiver.FurtherliteratureresearchandanalysisisneededtodetermineifthismethodisphysicallycapableofandcosteffectiveforclearingsandwaveshoalingtoauthorizeddepthintheLowerColumbiaRiverFNC,andtounderstandtheenvironmentalimpacts.Ademonstrationprojectmaybewarranteddependingontheoutcomeoftheresearchandanalysis.
Piledikesystemsthroughouttheprojectareawillneedtobeeitherrepairedorreplacedduringthe20‐yearDMMPperiodinordertomaintainfunctionundercurrentconditions.Dredgedmaterialmayneedtobeaddedtoexistingrivertrainingfillsitestorestoreerodedareasinordertomaintainfunction.Thecurrentinventoryandconditionofrivertrainingfillsitesmustfirstbedetermined.
The2013ValueEngineeringStudyalsorecommendsstudyingchannelmodifications,additionalhydrauliccontrolstructureopportunities,andotherengineeringpracticesasidentifiedthroughplanformationtoalterflow,preventsandwaveformation,andimproveoverallchannelconditions.

24
7 DredgedMaterialPlacementAssessment
IntroductionMaterialplacementmethodsandlocationsarestrategicallybalancedtominimizefutureshoalingandColumbiaRiverFNCO&Mdredgingneedswhilealsomaintaininganavailablesedimentbudgetfortheriversystemecology.Otherfactorsthatdeterminehowmaterialisplacedincludetheproximityofplacementlocationstodredgingareasanddredgeequipmentcapabilitiesandlimitations(forinstance,thepipelineDredgeOREGONisbestequippedforuplandplacementbutifthereisnotanuplandplacementsitewithinphysicalpipelinelengthofthedredgingarea,in‐waterplacementistheonlyoption).Managementofdredgedmaterialisalsodependentongeographicandtemporalvariabilityofshoaldevelopment.ThematerialbeingdredgedfromtheLowerColumbiaRiverFNCiscleansand,whichallowsforacombinationofupland,shoreline(beach),andopenwaterdredgedmaterialplacementmethodstobeused(seeFigure7‐1).
Uplandandshorelineplacementareasarewelldefined(seeFigure7‐2),whilelocationsforin‐waterplacementintheColumbiaRivervarydependingontheconditionofthechanneleachyear.Inmostcases,whendredgedmaterialisplacedin‐wateritisnotintendedtobemovedagainbydredges.Instead,asdeeperareasintheriverarefilledwithdredgedmaterialovertime,newdeepareasareformedelsewhereasaresultofnaturalriverprocesses.However,insomecaseswhereshoalsarelocatedtoofarfromanuplandsitefordirectplacement,dredgedmaterialmaybetemporarilyplacedin‐waternearbytoclearshoalingquicklyandthenrehandledbyanotherdredgetotheuplandsite.Nearthoseuplandsites,adredgecreatesatemporarysumpwhichisadeeperareaoftheriverbottomoutsideofthemainchannelfortemporaryin‐waterplacementofdredgedmaterialandstoragebeforethatplacedmaterialispumped(rehandled)intotheuplandsite.Placementatdesignatedoceansitesisalsoallowedandmaybeneededinthefuturetoensureabalancedapproachtochannelmaintenanceascapacitiesofothersiteschangeovertime.UtilizationoftheoceanplacementsitesformaterialfromtheLowerColumbiaRiverFNCislessefficientandmoreexpensivebecausematerialmustbetransportedasignificantdistancefromthedredginglocationouttothedesignatedoceansites.
Theremaybemorethanoneplacementoptionforagivendredgingevent.Placementsiteselectionconsiderationsincludedredgeequipmentcapabilities,distancefromthedredginglocation,cost,remainingsitecapacities,competingplacementneedsofotherdredgingeventsthatareongoingorplanned,andhowitwillcontributetooverallprojectstrategies.
ThepurposeofthissectionistosummarizeandevaluatetherecenthistoryandcurrentconditionofdredgedmaterialplacementcapacityintheColumbiaRiverFNCtounderstandanylargersystemconstraintsondredgingandplacementandassesspotentialimpedimentstocontinuedFNCoperationsandmaintenance.

25
Figure7‐1:RecentDredgedMaterialPlacementbyMethod(2014‐2016)
72% ‐ 5.6 mcy 69% ‐ 3.9 mcy80% ‐ 4.4 mcy
9% ‐ 0.7 mcy 14% ‐ 0.8 mcy
8% ‐ 0.7 mcy
19% ‐ 1.5 mcy 17% ‐ 1 mcy12% ‐ 0.5 mcy
0%
10%
20%
30%
40%
50%
60%
70%
80%
90%
100%
2014 ‐ 7.8 mcy 2015 ‐ 5.7 mcy 2016 ‐ 5.6 mcy
Recent Dredged Material Placement by Method
In‐Water Shoreline Upland

26
Figure7‐2:LowerColumbiaRiverUplandandShoreline(Beach)PlacementAreas
27
UplandPlacement
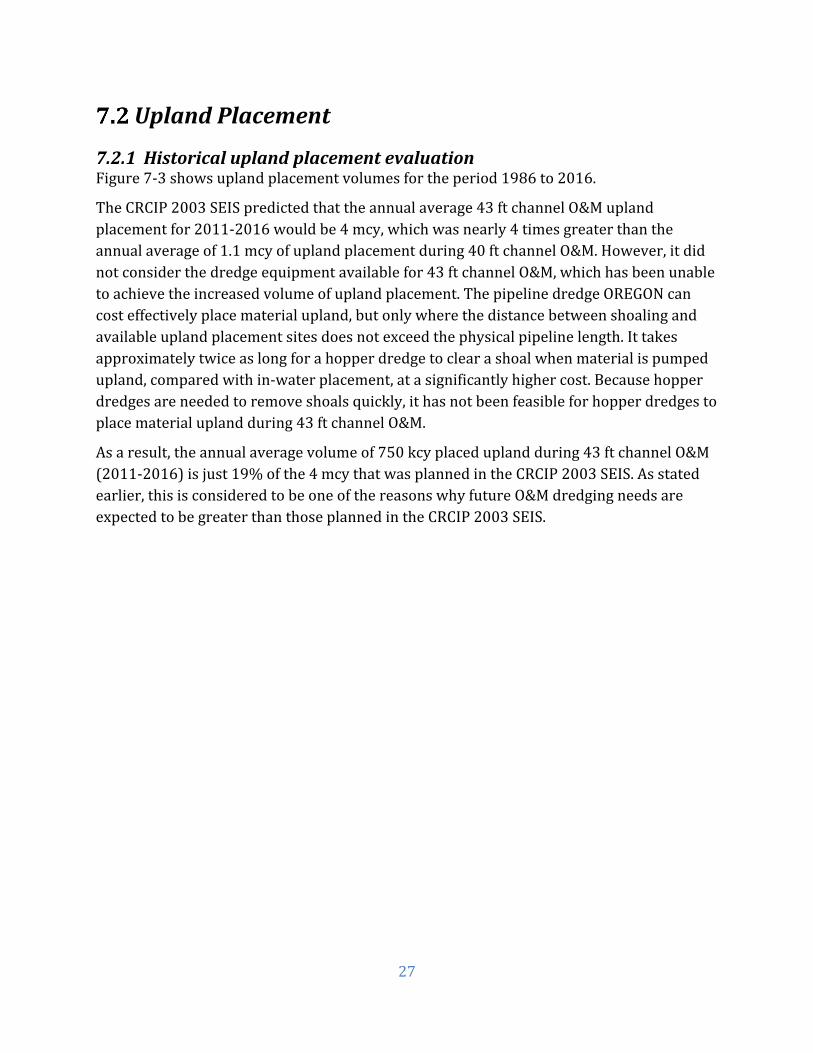
7.2.1 HistoricaluplandplacementevaluationFigure7‐3showsuplandplacementvolumesfortheperiod1986to2016.
TheCRCIP2003SEISpredictedthattheannualaverage43ftchannelO&Muplandplacementfor2011‐2016wouldbe4mcy,whichwasnearly4timesgreaterthantheannualaverageof1.1mcyofuplandplacementduring40ftchannelO&M.However,itdidnotconsiderthedredgeequipmentavailablefor43ftchannelO&M,whichhasbeenunabletoachievetheincreasedvolumeofuplandplacement.ThepipelinedredgeOREGONcancosteffectivelyplacematerialupland,butonlywherethedistancebetweenshoalingandavailableuplandplacementsitesdoesnotexceedthephysicalpipelinelength.Ittakesapproximatelytwiceaslongforahopperdredgetoclearashoalwhenmaterialispumpedupland,comparedwithin‐waterplacement,atasignificantlyhighercost.Becausehopperdredgesareneededtoremoveshoalsquickly,ithasnotbeenfeasibleforhopperdredgestoplacematerialuplandduring43ftchannelO&M.
Asaresult,theannualaveragevolumeof750kcyplaceduplandduring43ftchannelO&M(2011‐2016)isjust19%ofthe4mcythatwasplannedintheCRCIP2003SEIS.Asstatedearlier,thisisconsideredtobeoneofthereasonswhyfutureO&MdredgingneedsareexpectedtobegreaterthanthoseplannedintheCRCIP2003SEIS.

28
Figure7‐3:UplandPlacementQuantities(1986‐2016)
Note:Nouplandplacementoccurredin1988,1989or2003.
0
500,000
1,000,000
1,500,000
2,000,000
2,500,000
3,000,000
3,500,000
4,000,000
4,500,000
5,000,000
1986
1987
1988
1989
1990
1991
1992
1993
1994
1995
1996
1997
1998
1999
2000
2001
2002
2003
2004
2005
2006
2007
2008
2009
2010
2011
2012
2013
2014
2015
2016
ColumbiaRiverUplandPlacementCYbyYear:1986to2016
Actual 40‐ft Channel O&M (1986‐2004) = annual average 1,100,000 CY
Actual 43 ft Channel construction (2005‐2010) O&M plus New Work = annual average 2,000,000 CY
Actual 43‐ft Channel O&M (2011‐2016) = annual average 750,000 CY
Planned (CRCIP 2003 SEIS) 43‐ft Channel O&M (2011‐2016) for comparison = annual average 4,000,000 CY

29
7.2.2 ForecasteduplandplacementneedsOverthenext20years,approximately6.5mcyofmaterialisexpectedtobedredgedfromtheLowerColumbiaRiverFNCannually,butuplandplacementcapacityisonlyneededforaportionofthistotal.AssuminguplandplacementwillcontinuetobeachievedsolelybythepipelinedredgeOREGON,anestimated1‐2mcyofmaterialcouldbeplacedatuplandsiteseachyear.Thelowernumberintherangeisbasedon43‐ftChannelO&Myears2013‐2016,whenanaverageof1mcyofdredgedmaterialwasplacedupland,andthe40ftchannelO&Maverageof1.1mcy(1986‐2004).ThehighernumberintherangeispossibleifagreaterpercentageofthetotalannualdredgingvolumeofthedredgeOREGONwasplacedupland.Therefore,inordertocontinuethestrategyofbalanceddredgedmaterialplacementforthis20yearperiod,if1‐2mcyofmaterialcouldbeplaceduplandeachyear,anestimated20‐40mcyoftotaluplandcapacityisneeded.Additionalrehandlesumpsmaybeneededaswell,forthoseuplandsiteswherethedistancetothenearestshoalexceedsthephysicalpipelinelengthofthedredgeOREGON.
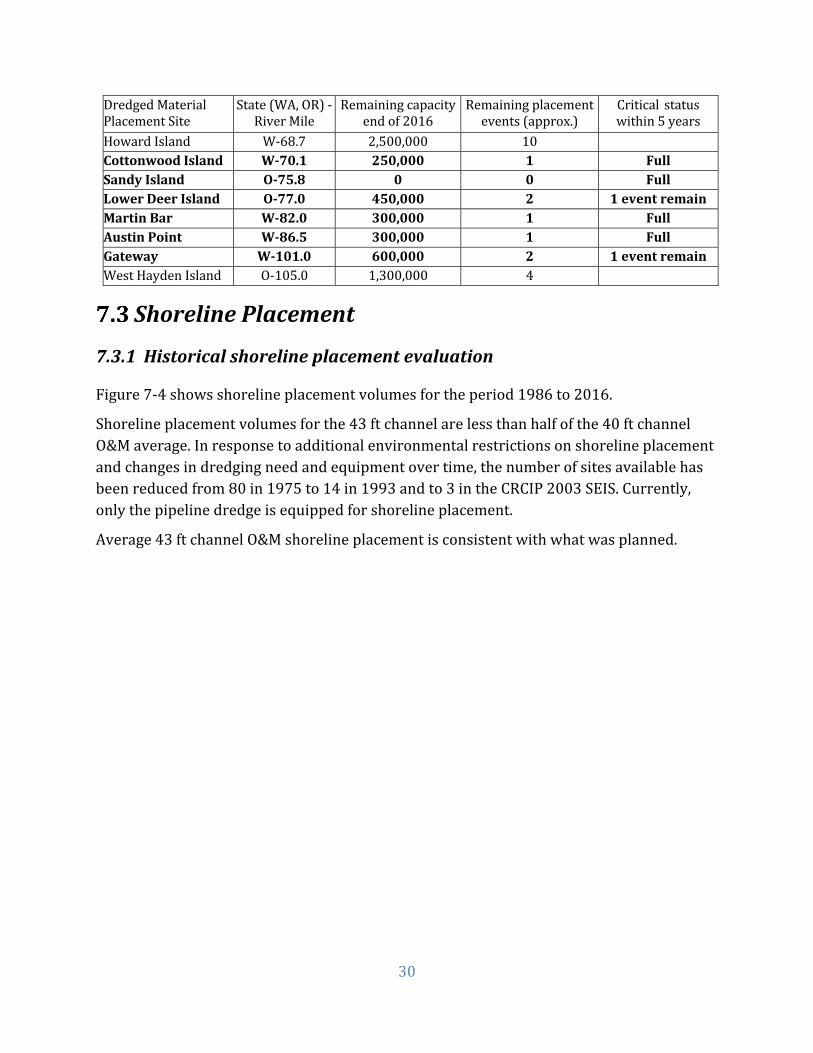
7.2.3 RemaininguplandplacementcapacityTheestimatedcapacityremainingatexistinguplandplacementsitesafter2016is16.75mcy(seeTable7‐1).Additionally,thirteenofthenineteensitesarealreadyfullorhavecapacityforjustoneortwomoreplacementevents.Manyoftheselimitedcapacitysitescouldbefullwithinthenextfiveyearsandthemajorityofsitesareexpectedtobecomeunusableoncefilled.Therearecurrentlysandresaleoperationsatfivesitesthatcouldrestorecapacityovertime;however,becauseresaleoperationsarenotunderthefederalgovernment’scontrol,thecontinuationandpredictabilityoffutureoperationsarenotcalculable.ItisalsoimportantthatuplandcapacitymustbedistributedwhereneededthroughouttheentiretyoftheLowerColumbiaRiverFNC(RM3toRM105.5)overthis20yearperiod.
Table7‐1:UplandPlacementCapacity(ColumbiaRiverFederalNavigationChannelInterimOperations&Maintenance(O&M)Plan,revisedtoreflectactualplacement2014‐2016)
DredgedMaterialPlacementSite
State(WA,OR)‐RiverMile
Remainingcapacityendof2016
Remainingplacementevents(approx.)
Critical statuswithin5years
RiceIsland W‐21.0 2,550,000 8 PillarRockIsland O‐27.2 2,000,000 5 WelchIsland O‐34.0 400,000 2 FullTenasillaheIsland O‐38.3 300,000 1 FullJamesRiver O‐42.9 1,350,000 4 PugetIsland W‐44.0 2,200,000 5 BrownIsland W‐46.3 700,000 2 FullCrimsIsland O‐57.0 550,000 2 1eventremainHumpIsland W‐59.7 600,000 2 1eventremainLordIsland O‐63.5 400,000 2 1eventremainDibbleePoint O‐64.8 0 0 Full
30
DredgedMaterialPlacementSite
State(WA,OR)‐RiverMile
Remainingcapacityendof2016
Remainingplacementevents(approx.)
Critical statuswithin5years
HowardIsland W‐68.7 2,500,000 10 CottonwoodIsland W‐70.1 250,000 1 FullSandyIsland O‐75.8 0 0 FullLowerDeerIsland O‐77.0 450,000 2 1eventremainMartinBar W‐82.0 300,000 1 FullAustinPoint W‐86.5 300,000 1 FullGateway W‐101.0 600,000 2 1eventremainWestHaydenIsland O‐105.0 1,300,000 4
ShorelinePlacement
7.3.1 Historicalshorelineplacementevaluation
Figure7‐4showsshorelineplacementvolumesfortheperiod1986to2016.
Shorelineplacementvolumesforthe43ftchannelarelessthanhalfofthe40ftchannelO&Maverage.Inresponsetoadditionalenvironmentalrestrictionsonshorelineplacementandchangesindredgingneedandequipmentovertime,thenumberofsitesavailablehasbeenreducedfrom80in1975to14in1993andto3intheCRCIP2003SEIS.Currently,onlythepipelinedredgeisequippedforshorelineplacement.
Average43ftchannelO&Mshorelineplacementisconsistentwithwhatwasplanned.

31
Figure7‐4:ShorelinePlacementQuantities(1986‐2016)
Note:Noshorelineplacementoccurredin1986,1987,2001or2003.
0
500,000
1,000,000
1,500,000
2,000,000
2,500,000
3,000,000
3,500,000
4,000,000
4,500,000
1986
1987
1988
1989
1990
1991
1992
1993
1994
1995
1996
1997
1998
1999
2000
2001
2002
2003
2004
2005
2006
2007
2008
2009
2010
2011
2012
2013
2014
2015
2016
ColumbiaRiverShorelinePlacementCYbyYear:1986to2016
Actual 40‐ft Channel O&M (1986‐2004) = annual average 1,000,000 CY
Actual 43 ft Channel construction (2005‐2010) O&M plus New Work = annual average 400,000 CY
Actual 43‐ft Channel O&M (2011‐2016) = annual average 550,000 CY
Planned (CRCIP 2003 SEIS) 43‐ft Channel O&M (2011‐2016) for comparison = annual average 450,000 CY

32
7.3.2 ForecastedshorelineplacementneedsTherecurringneedfordredgingatshoalsadjacenttoexistingshorelineplacementsitesisexpectedtocontinueatfrequenciesandquantitiesthatareconsistentwithrecentyears.However,additionalshorelineplacementcouldbeusedasrivertrainingfilltoimprovechannelmaintenanceandbalancebetweenplacementmethods.Inordertomaintainandpossiblyincreasethecurrentshorelineplacementamounts;theDMMPneedstoidentifylocationsthroughoutthesystemthatcanaccommodate500kcyto1mcyofdredgedmaterialor10‐20mcyoverthenext20years.
7.3.3 RemainingshorelineplacementcapacityTherecurringcapacity(timingandvolume)restoredbynaturalerosionofexistingshorelineplacementsites(andsandresaleoperationsatSkamokawa‐VistaPark)isgenerallywellbalancedwiththeneedfordredgingatshoalsadjacenttothosesites.Thistrendisexpectedtocontinueoverthenext20years.Inotherwords,theexistingsitesarebeingfullyutilizedandthereisnocapacityfordredgedmaterialfromadditionalshoalsthatwouldotherwisebeplaceduplandorin‐water.TheprimaryshorelineplacementsitesarelistedinTable7‐2,althoughshorelineplacementisalsopermittedtorestoreerodeduplandareasneededforcapacityatRiceIsland(W‐21.0)andPillarRockIsland(O‐27.2).
Table7‐2:ShorelinePlacement Sites
DredgedMaterialPlacementSite RiverMile
MillerSands O‐23.5Skamokawa‐VistaPark W‐33.4SandIsland O‐86.2
OpenWaterPlacement
7.4.1 HistoricalopenwaterplacementevaluationTherearetwotypesofopenwaterplacement:in‐waterplacementintheColumbiaRiverandatdesignatedoceandisposalsites.MostmaterialdredgedfromtheFNCduringtheperiodfrom1986to2016hasbeenplacedbackintotheriver.Thissectionfocusesondredgedmaterialthatisplacedbackintotheriver,remainsintheriver,andissubjectedtonaturalriverineprocessesovertime.Oceandisposalwasusedbrieflyduringconstructionofthe43ftchannel,buthasnotyetbeenusedformaterialdredgedfor43ftchannelO&Mbecausetheotherplacementmethodscombinedhavehadsufficientcapacityandaremoreefficientandlesscostlythanlonghaulsouttosea.
Figure7‐5showsin‐waterplacementvolumesfortheperiod1986to2016.

33
Theannualaveragevolumeofdredgedmaterialplacedin‐waterduring40ftchannelO&Mfrom1986to2004was4.7mcy.TheCRCIP2003SEISpredictedthattheannualaverage43ftchannelO&Min‐waterplacementfor2011‐2016wouldbe2.2mcy,lessthanhalfofthehistorical40ftchannelO&Mvolume.ThereasonforthedifferenceisthattheCRCIP2003SEISplannedforagreaterpercentageofdredgedmaterialtobeplaceduplandinsteadofin‐water.However,itdidnotconsiderthedredgeequipmentavailablefor43ftchannelO&M,whichhasbeenunabletoachievetheincreasedvolumeofuplandplacement.Instead,theactualaverageannualin‐waterplacementvolumefor43ftchannelO&Mduringtheyears2011‐2013wasabout6mcy.Mostrecently,during2014‐2016,theaverageannualin‐waterplacementvolumefor43ftchannelO&Mwas4.7mcy,whichisthesameasthehistoricalaveragefor40ftchannelO&M.
Locationsforin‐waterplacementmustbeselectedcarefullytominimizeshoalingofplacedmaterialbacktothechannel,whereitwillneedtobedredgedagain.In‐waterplacementsitesarenotdesignatedpermanentlybutinsteadchosenforeachdredgingeventbasedondepthsfromrecentsurveysoftheriverbottomoutsidethenavigationchannel.During40ftchannelO&M,materialwasgenerallyplacedinthenearestflow‐laneareainandadjacenttothechannelatdepthsof35‐65ft,tomaximizedredgingefficiency.Itwasacceptableforplacedmaterialtoaccumulateinthechannelaslongasitdidnotbecomeshallowerthantheadvancedmaintenancedepthof45ftsoitwouldnotgrowtoshoalingabovetheauthorizedchanneldepthof40ft.Nowthatthechannelismaintainedto43ftwithadvancedmaintenanceto48ft,placingmaterialwhereitcouldaccumulateto45ftinthechannelconflictswithadvancedmaintenanceneedsandisnolongeracceptablesothereislesscapacityintheriverforin‐waterplacement.Also,increasedshoalingwasobservedatcertainlocationsdownstreamofin‐waterplacementsitesusedforinitial43ftchannelO&M,raisingconcernsabouttheefficiencyoftheoveralldredginganddredgedmaterialplacementapproach.
In‐waterplacementoptionsarealsolimiteddependingondredgeequipment.AllmaterialdredgedbyhopperdredgesforO&Mofthe43ftchanneltodatehasbeenplacedin‐waterindepthsgreaterthan20ft.Thesmallesthopperdredge(YAQUINA)cansafelyaccessdepthsasshallowas20ft,butlargerhopperdredgescanonlysafelyaccessdepthsgreaterthan30or35ft.Thepipelinedredgealsoplacesmaterialin‐wateratcertainshoalswhereotherplacementoptions(uplandorshoreline)arenotavailable.Adownspoutisusedsothedischargefromthepipelinedredgeisgreaterthan20ftbelowthesurfaceofthewater,generallyinareaswheretheriverbottomisgreaterthan30to35ftdeep.
Toaddressthesein‐waterplacementcapacitychallenges,CorpsPortlandDistricthydraulicengineerswereaddedtothetechnicalteamin2012toconsultonin‐waterplacementlocationsandoperations.Ahydrodynamicmodelwasusedtoexaminecurrentsanddepthsandselectsitesandplacementmethodstominimizeand/ordelaythereturnofplacedmaterialtothechannel.Thefindingsofthateffortjustifiedhaulingmaterialmuchfarther

34
downstream(vs.ashorthaulupstream)atmorethanonecriticalshoalandchangedin‐waterplacementpracticesatseveralreachesfromplacingalargeamountofmaterialinasingle,erosive,deepwatersitetoplacingmaterialinthinlayersoverseveral,stable,shallowerwatersites.
Recently,someareastraditionallyusedforin‐waterplacementhavebecomeinformalshipanchorageareas.Thishasrestrictedtheuseofthoseareasforin‐waterplacementintwoways:first,dredgescannotaccesstheareawhenthereisashipatanchorandsecond,dredgedmaterialaccumulationislimitedtothewaterdepthneededforshipstoanchorsothereislesscapacityforin‐waterplacement.

35
Figure7‐5:In‐WaterPlacementQuantities(1986‐2016
0
1,000,000
2,000,000
3,000,000
4,000,000
5,000,000
6,000,000
7,000,000
8,000,000
9,000,000
1986
1987
1988
1989
1990
1991
1992
1993
1994
1995
1996
1997
1998
1999
2000
2001
2002
2003
2004
2005
2006
2007
2008
2009
2010
2011
2012
2013
2014
2015
2016
ColumbiaRiverIn‐WaterPlacementCYbyYear:1986to2016
Actual 40‐ft Channel O&M (1986‐2004) = annual average 4,700,000 CY
Actual 43 ft Channel construction (2005‐2010) O&M plus New Work = annual average 4,600,000 CY
Actual 43‐ft Channel O&M (2011‐2016) = annual average 5,200,000 CY
Planned (CRCIP 2003 SEIS) 43‐ft Channel O&M (2011‐2016) for comparison = annual average 2,200,000 CY

36
7.4.2 ForecastedopenwaterplacementneedsOpenwaterplacementmethodisexpectedtocontinuetobeusedforallofthematerialdredgedbyhopperdredgesbecauseoftheirequipmentcapabilitylimitationsandlowcostforin‐waterplacement.Itisthereforeassumedthattheneedforopenwaterplacementwillcontinueatthecurrentrate(consistentwithhistoricalaverage)of4‐5mcyor80‐100mcyforthenext20years.Evenwiththeadditionalhydraulicanalysistooptimizein‐waterplacementsites,thesustainedvolumeofin‐waterplacementwillstillaffectshoalinginthechannelovertime.Thebestwaytominimizeshoalingisthroughinformedandstrategicdecisionmaking.TheCorpsPortlandDistrictneedstoupdatetheirhydraulic,sedimenttransport(mobilebed)andparticletrackingmodelsinordertodeterminethebestin‐waterplacementpracticesmovingforward.TheCorpswillalsoseekincreasedadaptabilityforenvironmentalcoordinationtogainaccesstosuitablelocationswherein‐waterplacementofdredgedmaterialcanoccurinwaterdepthsoflessthan20ft.Thiswouldprovideforincreasedin‐waterandshorelineplacementvolumecapacitywhileenablingtheenhancementofrivermorphologywithintheLowerColumbiaRiver.
7.4.3 RemainingopenwaterplacementcapacityItischallengingtoquantifyremainingin‐waterplacementcapacityintheColumbiaRiverbecauseitvariesdependingontheconditionofthechanneleachyear(asdeeperareasarefilledwithdredgedmaterial,newdeepareasareformedelsewhereasaresultofnaturalriverprocesses).However,therearestrongindicationsthatin‐watercapacityforthe43ftchannelisbecomingincreasinglylimited.Thefirstindicationisthatbecauseofdredgedmaterialaccumulation,manyoftheideal,stablein‐waterplacementareasusedfor43ftchannelO&Marenowtooshallowforlargerhopperdredges.Conditionsurveysin2016didnotshownewideal,stableareasformingelsewheretoreplacethosethatarenowtooshallow.Instead,dredgedmaterialfromlargerhopperdredgeswillincreasinglybeplacedinlocationsthatarelessstablesoplacedmaterialismorelikelytobetransportedbackintothechannelasfutureshoaling.Also,insomelocations,materialplacedin‐waterisalreadyshoalingbackintothechannel,whichsuggeststhatthosesiteshavereachedcapacityandrendersthemunsuitableforfutureplacement.
Oceandisposalsites,availableformaterialdredgeddownstreamofRM30,areassumedtohave14mcyofcapacityremaining(2mcyusedfor43ftchannelconstructionofthe16mcyplannedforconstructionandfirst20yearsofmaintenanceinthe1999CRCIPFeasibility/EIS&interimO&MPlan).
RegionalSedimentManagement(RSM)AnothergoaloffuturechannelmaintenanceplanningintheCorpsPortlandDistrictistocontinueutilizingandbuildinguponRegionalSedimentManagement(RSM)‐informeddecisionmaking.RSMisasystemsapproachtodeliberatelymanagesedimentsinamannerthatmaximizesnaturalandeconomicefficienciestocontributetosustainablewater

37
resourceprojects,environments,andcommunities.WithinanRSMframework,sedimentisviewedasanaturalresourcetobeconservedwithinthesystemthatsedimentisactive.RSMfosterssustainablebalancebetweenprojectsandnaturalsystemprocesses:Theobjectiveistoreduceprojectcostsandachievegreaterbenefits.RSMbroadensthe“planninghorizon”forprojectsbyconsideringtheextendedtime‐spacescaleasdefinedbynaturalsedimentprocesses.WithinaDMMP,RSMcanlinkdredging(anddredgedmaterialplacement)projectswithina“Region”andrequiresfullcollaborationamongagencies,levelsofgovernment,andstakeholders.RSMprovidesopportunitiestoimproveenvironmentalhabitatwhileoptimizingtheuseofsediments.
In‐waterplacementandshorelineplacementstrategiesareessentialformaintainingtheriver'smorphology.Thepresentrivermorphology(sedimentshoals,islands,andriverbanks)actstostabilizethethalweg,provideasustainableFNC,andprovideforecologicalsubstrate.In‐waterplacementandshorelineplacementstrategieswereusedprominentlyinthepasttodevelopthepresentLowerColumbiaRivermorphologythatenableddevelopmentoftheFNC.ThesestrategieswillneedtobeusedinasimilarmannertosustaintheFNCintothefuture,astheFNChasbeenrecentlydeepened.Over‐relianceonuplandplacementcannegativelyaffecttheLowerColumbiaRivermorphology,whichcouldjeopardizeFNCsustainabilityandtheenvironment.
Assessmentofneedsforthenext20yearsThe40ftchannelO&Mandplansfor43ftchannelConstructionandO&Mconsidereduplandplacementtobebeneficialbecauseitremovesmaterialfromthesystemsoitisnolongerasourceforshoaling.However,subsequentresearchbyDavidJay,ProfessorPh.D.inPhysicalOceanographyatPortlandStateUniversity,suggeststhatlong‐termuplandplacementmayactuallycontributetolowerwaterlevelsfornavigation(Jay,2013).Forinstance,thelossofsedimentfromuplandplacementcouldresultindeeperriverbottomconditionsbetweenriverbanks;then,inconcept,assumingthesamequantityofriverflowcrosssectionalarea,theactualcrosssectionofwaterwouldshiftlowerintothedeeperriverbottomconditions,whichwouldconsequentlylowerthewatersurfacelevel.Uplandplacementneedstobefurtherinvestigatedtodeterminewhatthelong‐termplanshouldbe.
Thisassessmentassumesanestimatedannualaverageof1‐2mcyofuplandplacementoverthedurationofthis20yearplan(totalestimated20‐40mcyofuplandcapacity).Thisvolumeisintendedtoprovideabalancingstrategyformaintainingin‐waterplacementcapacityoverthelengthoftheplan.Tomeetthisneed,anestimated10‐20newuplandplacementsitesshouldbeidentifiedwithintheLowerColumbiaRiverprojectarea.Basedonlessonslearnedfrompastchannelmaintenanceplansandpractices,theCorpswillseekmultipleuplandplacementopportunitieswithinthemostcommonlydredgedreachesoftheLowerColumbiaRiver.

38
Inadditiontoidentifyingnewuplandplacementsites,theplanwilllooktoextendthelifeofcurrentuplandsitesthatarereachingcapacity.Thiscanbedonethroughsandremovaloperationsorbyexpandingthesizeofcurrentuplandsiteswithinthesystem.TheteamwillalsoperformadvancedvolumeanalysisoncurrentuplandsitesusingLIDARdatatogetmoreprecisecapacitycalculations.
TheDMMPshouldcalculatethesustainablerateofuplandplacementthatcanberealized(perriverreach),withoutnegativelyaffectingtheLowerColumbiaRiversedimentbudgetormorphology.Also,theplanneedstodevelopavisionforwhattherivermorphologyneedstobeinthefutureandhowtosustainthatmorphologyusingdredgedsediment,andtrainingstructureswhereneeded.TheLowerColumbiaRivermorphologyvisionisdirectlyassociatedwithRSM,andisexemplifiedinDr.DavidA.Jay’s2013presentationTheTrajectoryoftheLowerColumbiaRiverandEstuary,1850‐2013.
Additionalshorelineplacementsitesareneededtoprovidecapacityforthe10‐20mcyofdredgedmaterialthatisestimatedforthe20yeardurationofthisplan.Shorelineplacementisneededtosupporterodinguplandsitesandprovideplacementcapacitywhereuplandandin‐watersitesmaynotbeavailable.Shorelineplacementmayalsobeusedforrivertrainingtoimprovechannelmaintenance.
Improvementofin‐waterplacementtechniquesusinghydraulicanalysisisessentialtoproperlyaccommodatethe80‐100mcyofdredgedmaterialthatisprojectedtobeplacedin‐waterthroughoutthe20yeardurationofthisplan.DuringdevelopmentofthisDMMP,AdH(AdaptiveHydraulic)shallow‐waterhydrodynamicmodelandAdHsedimenttransportmoduleshouldbeusedtoanalyzepastin‐waterplacementpracticesandtomakerecommendationsmovingforward.
Astraditionalin‐waterplacementcapacitybecomesmorelimited,increaseduseoftemporaryin‐waterdredgedmaterialrehandlesites(foreventualuplandorshorelineplacement)shouldbeconsidered,i.e.sumps.Also,thereisadditional(untapped)capacityforshallowwaterplacementthatisnotbeingutilizedbycurrentdredgedmaterialplacementpracticesintherangeofdepthsbetweenshorelineplacementandin‐waterplacementdepthsof20ftorgreater.Modificationstodredgeequipmentandenvironmentalcompliancewouldberequiredtoplacematerialin‐wateratdepthsshallowerthan20ft.
Theplanshouldseektodefinesustainablethresholdsfortheratesatwhichin‐waterplacementsitescanbeexpectedtocontributetofutureFNCshoaling;basedontheneedtobalanceRSMconceptswiththeneedtoprovidereliabledeepdraftnavigationwithintheLowerColumbiaRiverFNC.Thequantityofdredgedmaterialplacedin‐waterthatisallowedtocontributetoFNCshoalingoverspecifiedperiodsoftime(1year,2years,etc.)shouldbecalculatedanddefinedwithineachmajormorphology‐hydrauliczone.

39
Considerationsincludecostanddredgeequipmentavailabilitytoremovetheforecastedvolumeofshoaling.
Inresponsetorecentincreasesinanchorageareasthatrestrictin‐waterplacementcapacity,theplanshouldresearchfuturetrendsinanchorageareasrequiredbychannelusers,aswellashowanchoragesanddredgedmaterialplacementwillco‐existoverthedurationoftheplan.
Onealternativetolongerhauldistancestoreachdeeperareasthatarefartherfromthedredginglocationcouldbehopperdredgelightloadingtoaccessshallowerwaterdepthsthatareclosertothedredgearea.Theplanshouldincludeastrategytooptimizein‐waterplacementbyconsideringthistrade‐off,whichcouldleadtomoreefficientandeffectivechannelmaintenancepractices.
Placementatdesignatedoceansitesisalsoallowedandmaybeneededinthefuturetoensureabalancedapproachtochannelmaintenanceascapacitiesofothersiteschangeovertime.Theplanmustconsideradditionaltimerequiredforlonghaulstooceansites.
ThemostcriticalconsiderationisthatdredgeequipmentavailabletotheprojectmustbeabletoimplementthestrategiesselectedundertheDMMPforupland,beachnourishment,andin‐waterplacementinorderforthemtobefeasible.TheteamwillneedtodetermineifitiswithinscopetoevaluatealternativedredgeequipmentaspartoftheDMMP.Also,thehopperdredgingfleetisagingandtherewilllikelybechangesduringthe20‐yearperiod.TheplanmustthereforeoptimizeandinformthecurrentandfuturedredgingfleetavailableforLowerColumbiaRiverFNCO&M.

40
8 RealEstate
Non‐FederalSponsorResponsibilitiesTheNon‐FederalSponsorsareresponsibleforacquiringalllands,easements,orrights‐of‐wayfordredgedmaterialplacementsitesthattheCorpsdeterminestoberequiredforProjectO&M,andshallperformorensureperformanceofallrelocationsthattheCorpsdeterminestobenecessary(ref:PCAArticleII,C).Further,theyareresponsibleforensuringthattheselands,easements,andrights‐of‐wayareretainedinpublicownershiporcontrolforusescompatiblewithauthorizedProjectpurposesforaslongasitremainsauthorized(ref:PCAArticleIII,A).Itisimportanttonotethatthedateofissuanceandexpirationofaneasementandaright‐of‐waycandifferfromeachotherforasingleproperty.
ExistingLands/Easements/Rights‐of‐WayThecurrentrealestatestatusislistedbyplacementsiteinTable8‐1,RealEstateSummary.Withtheexceptionofopenwaterareas,allexistingsiteshaverightsofentryfordredgedmaterialplacementthatwillexpirebeforetheendofthenext20yearchannelO&Mperiod.ThroughNavigationalServitude,thegovernmentmayutilizeopenwaterplacementareas.NavigationalServitudeisdescribedinER405‐1‐12(1May1998).“ThenavigationservitudeisthedominantrightoftheGovernmentundertheCommerceClauseoftheU.S.Constitution(U.S.Const.ArticleI,Section8,Clause3)touse,controlandregulatethenavigablewatersoftheUnitedStatesandthesubmergedlandsthereunderforvariouscommercerelatedpurposesincludingnavigationandfloodcontrol.Intidalareas,theservitudeextendstoalllandsbelowthemeanhighwatermark.Innon‐tidalareas,theservitudeextendstoalllandswithinthebedandbanksofanavigablestreamthatliebelowtheordinaryhighwatermark(OHWM)*.”
*OrdinaryHighWaterMark(OHWM)isdefinedat33CFR328.3(e)"Thetermordinaryhighwatermarkmeansthatlineontheshoreestablishedbythefluctuationsofwaterandindicatedbyphysicalcharacteristicssuchasclear,naturallineimpressedonthebank,shelving,changesinthecharacterofsoil,destructionofterrestrialvegetation,thepresenceoflitteranddebris,orotherappropriatemeansthatconsiderthecharacteristicsofthesurroundingareas.Provided,thatinanyareawheretheordinaryhighwatermarkcannotbefound,theordinaryhighwatermarkadjoiningsaltwatershallbethelineofmeanhigherhightideandtheordinaryhighwatermarkadjoiningfreshwatershallbethelineofmeanhighwater."
RefertotheColumbiaRiverFederalNavigationChannelInterimOperations&Maintenance(O&M)Planfordetailedinformationaboutrequirementsandresponsibilitiesforexistingeasementsandcoordinationrelatedtositeavailabilityandmaterialremovalprocedures.

41
Table8‐1:RealEstateSummary
Placement Site Name
WA or OR State side of Navigation Channel and River Mile Designation
State property is physically
located within
Property Name (if multiple)
Ownership Status
Easement from Owner Right of Entry to the Corps
Date Granted
Date Expires Acres Date
Issued Date
Expires
Remaining Years
(December 2016)
Rice Island W-21.0
OR - OR DSL 25 year easement 2/17/2005 2/17/2030 226.7 6/28/2006 2/16/2030 13
WA - WA DNR 30 year easement 10/26/2007 10/26/2037 37.3 10/27/2009 12/31/2037 21
Miller Sands O-23.5 OR - OR DSL 25 year easement 11/17/2005 11/17/2030 116.48 6/28/2006 11/16/2030 14
Pillar Rock Island O-27.2 OR - OR DSL 25 year
easement 2/17/2005 11/17/2030 51.59 6/28/2006 2/16/2030 13
Skamokawa - Vista Park W-33.4 WA - Port of
Wahkiakum II 20 year
easement 4/7/2016 4/6/2036 15.07 4/7/2016 4/6/2036 19
Welch Island O-34.0 OR - OR DSL 25 year easement 11/17/2005 11/17/2030 40.66 6/28/2006 11/16/2030 17
Tenasillahe Island O-38.3 OR - OR DSL 25 year
easement 2/17/2005 2/17/2030 40.57 6/28/2006 2/16/2030 13
James River O-42.9 OR - GP Consumer Products
20 year easement 10/17/2007 10/17/2027 53 10/17/2007 10/17/2027 11

42
Placement Site Name
WA or OR State side of Navigation Channel and River Mile Designation
State property is physically
located within
Property Name (if multiple)
Ownership Status
Easement from Owner Right of Entry to the Corps
Date Granted
Date Expires Acres Date
Issued Date
Expires
Remaining Years
(December 2016)
Puget Island W-44.0 WA
Vik Vik - - - 86.91 TBD - 0
Weeks Washington Ports Fee Title - - 5.86 3/25/2005 3/25/2025 8
Bacon Washington Ports Fee Title - - 0.59 12/23/2010 12/23/2030 14
Mickelson Washington Ports Fee Title - - 0.38 12/23/2010 12/23/2030 14
Whitney Washington Ports Fee Title - - 0.93 12/23/2010 12/23/2030 14
Schmuland Washington Ports Fee Title - - 1.28 3/25/2005 3/25/2025 8
Brown Island W-46.3 WA - WA DNR 30 year easement 10/26/2007 10/26/2037 102.1 8/14/2009 12/31/2037 11
Crims Island O-57.0 OR - OR DSL 25 year easement 2/17/2005 2/17/2030 58.82 6/28/2006 2/16/2030 13
Hump Island W-59.7 WA - WA DNR 30 year easement 10/26/2007 10/26/2037 64.57 8/14/2009 12/31/2037 11
Lord Island Upstream O-63.5 OR - OR DSL 25 year
easement 2/17/2005 2/17/2030 46 6/28/2006 2/16/2030 13
Dibblee Point
(Rainier Industrial)
O-64.8 OR - OR DSL 25 year easement 2/17/2005 2/17/2030 51.49 6/28/2006 2/16/2030 13

43
Placement Site Name
WA or OR State side of Navigation Channel and River Mile Designation
State property is physically
located within
Property Name (if multiple)
Ownership Status
Easement from Owner Right of Entry to the Corps
Date Granted
Date Expires Acres Date
Issued Date
Expires
Remaining Years
(December 2016)
Howard Island W-68.7 WA
Davis Washington Ports Fee Title - - 107.36 5/9/2013 5/9/2033 16
WA DNR WA DNR 30 year easement 10/26/2007 10/26/2037 153 5/4/2009 12/31/2037 21
Cottonwood Island W-70.1 WA - Washington
Ports Fee Title - - 654.17 8/15/2007 8/15/2027 11
Sandy Island O-75.8 OR - OR DSL 25 year easement 2/17/2005 2/17/2030 31.85 6/28/2006 2/16/2030 13
Lower Deer Island O-77.0 OR - OR DSL 25 year
easement 5/25/2005 5/25/2030 24.32 5/19/2006 5/24/2030 13
Martin Bar W-82.0 WA - Port of Woodland Fee Title - - 32 3/11/2005 3/11/2025 8
Sand Island O-86.2 OR - OR DSL 25 year easement 2/17/2005 2/17/2030 28.3 6/28/2006 2/16/2030 13
Austin Point W-86.5 WA - Port of Woodland Fee Title - - 26 3/11/2005 3/11/2025 8
Gateway W-101.0 WA - Port of Vancouver Fee Title - - 40 9/13/2005 9/13/2025 8
West Hayden Island
O-105.0 OR - Port of Portland Fee Title - - 116.3 3/9/2005 3/9/2025 8
Open-Water Placement*
Entire Project Area (O, W – 3-105.5)
OR and WA - OR DSL and
WA DNR NA NA NA NA NA NA NA

44
Assessmentofneedsforthenext20yearsAsdescribedabove,newsiteswillberequiredwithinthenext20yearstoprovidesufficientdredgedmaterialplacementcapacityforcontinuedchannelmaintenance.ThetimerequiredfortheNon‐FederalSponsorstoacquirelands,easements,andrights‐of‐wayisnotdefiniteandvariesbysite.Recently,theprocesstoacquiresomesiteeasementshastakenmanyyears.Therefore,thisDMMPmustallowreasonabletimefornewrealestateacquisitionsbasedonpreviousexperience.Additionally,challengessuchas:returnwateraccess,industrialdevelopments,sitecontamination,anddistancefromdredgingareas,preventedtheacquisitionofsitesaftertheywereselected,shouldbetakenintoaccountduringthedevelopmentoftheDMMP.Onemethodtohedgeagainstunforeseenobstaclestobringingnewplacementsitesonlinewouldincludeidentifyingadditional(substitute)siteoptionsifaprimarysitecannotbereasonablyacquired.TheDMMPshouldincludeaplanforrealestaterightsneededtoconductpiledikemaintenance.
9 EnvironmentalandGovernmentConsultationsandCompliance
ExistingEnvironmentalComplianceThissectionprovidesasummaryofexistingcompliancedocumentationforongoingProjectO&Mactivities.
CorpsProjectO&MactivitiesmustcomplywiththerequirementsofFederalenvironmentallawsandregulations.Thiscomplianceincludesevaluatingandminimizingprojecteffectsonphysical,biologicalandculturalresourcesandconsultingwithregulatoryagenciestoobtainapprovalsforprojectactions.Dredgedsedimentqualityisroutinelyevaluatedtomeetthecompliancerequirementsofmultipleenvironmentallawsandregulations.
AlistofexistingcompliancedocumentationpreparedorobtainedbytheCorpsforCorpsProjectO&MactivitiesisshowninTable9‐1,ExistingEnvironmentalComplianceSummary.ThesecompliancedocumentsareroutinelyrenewedbytheCorpsasneededtomaintaincompliance.

45
Table9‐1:ExistingEnvironmentalComplianceSummary.
Requirement Agency Compliance Document Date Issued Date Expires
Remaining Years (As of December
2016)
National Environmental Policy Act (NEPA)
Corps
Integrated Feasibility Report for Channel Improvements and Environmental Impact Statement (EIS)
Aug-1999 N/A N/A
Columbia River Channel Improvement Project Final Supplemental Integrated Feasibility Report and Environmental Impact Statement (SEIS)
Jan-2003 N/A N/A
Columbia River Navigation Improvement Project Record of Decision (ROD) 1/9/2004 N/A N/A
Columbia River Channel Improvement Project Supplemental Evaluation Aug-2008 N/A N/A
Caspian Tern Management to Reduce Predation of Juvenile Salmonids in the Columbia River Estuary Final Environmental Impact Statement
Jan-2005 N/A N/A
Caspian Tern Management to Reduce Predation of Juvenile Salmonids in the Columbia River Estuary Record of Decision
11/27/2006 N/A N/A
Columbia River Federal Navigation Channel Operations and Maintenance Dredging and Dredged Material Placement Network Update –Environmental Assessment
6/10/2014 N/A N/A
Columbia River Federal Navigation Channel Operations and Maintenance Dredging and Dredged Material Placement Network Update – Environmental Assessment
9/8/2015 N/A N/A
Fish and Wildlife Coordination Act
U.S. Fish & Wildlife Service
USFWS Fish and Wildlife Coordination Act Report and Corps responses to the recommendations are located in Exhibit C of Integrated Feasibility Report for Channel Improvements and Environmental Impact Statement (EIS)
Aug-1999 N/A N/A

46
Requirement Agency Compliance Document Date Issued Date Expires
Remaining Years (As of December
2016)
Endangered Species Act (ESA)
NOAA - National Marine Fisheries Service (NMFS)
Biological Opinion and Magnuson-Stevens Fishery Conservation and Management Act Essential Fish Habitat Response Columbia River Navigation Channel Operations and Maintenance No. 2011/02095
7/11/2012 N/A N/A
U.S. Fish & Wildlife Service
Biological Assessment Columbia River Channel Operations and Maintenance with letter of concurrence for “may affect but is not likely to adversely affect”
9/29/2010 N/A N/A
Biological Opinion Corps Nav Channel Dredging 2014 (Streaked Horned Lark) 6/6/2014 12/31/2018 2
Clean Water Act Section 401
State of Washington, Department of Ecology (DOE)
Water Quality Certification for Columbia River Operation and Maintenance Dredging between River Miles 3.0 to 145 and Amendments
2/19/2013; 8/14/2012; 4/29/2014; 7/15/2015
2/18/2018 1
State of Oregon, Department of Environmental Quality (DEQ)
Water Quality Certification for Columbia River Channel Improvement Project (CRCIP) and Columbia River Operations and Maintenance Dredging (O&M) and Amendment
5/19/2014; 9/3/2015 5/19/2024 7
Clean Water Act Section 404
Corps
Section 404(b)(1) Evaluation is Exhibit E of Columbia River Channel Improvement Project Final Supplemental Integrated Feasibility Report and Environmental Impact Statement
Jan-2003 N/A N/A
Coastal Zone Management Act
Corps
Coastal Zone Consistency Determination is Exhibit F of Columbia River Channel Improvement Project Final Supplemental Integrated Feasibility Report and Environmental Impact Statement
Jan-2003 N/A N/A
State of Washington, Department of Ecology (DOE)
Coastal Zone Management Consistency – Conditional Concurrence for Columbia River Channel Improvement Project
6/23/2003 N/A N/A
O&M Letter 4/18/2011 N/A N/A State of Oregon Department of Land Conservation and Development (DLCD)
Coastal Zone Management Decision for Deepening of Columbia River Federal Navigation Channel
6/23/2003 N/A N/A
O&M Letter 6/1/2007 N/A N/A

47
National Historic Preservation Act Section 106 Cultural Resources
Corps Corps Portland District Dredge Program Inadvertent Discovery Plan N/A N/A N/A
Oregon State Historic Preservation Office (SHPO)
Consultation Ongoing N/A N/A N/A
State of Washington Department of Archaeology & Historic Preservation
Consultation Ongoing N/A N/A N/A
National Pollutant Discharge Elimination System (NPDES)
Environmental Protection Agency (EPA)
Dredged Material is Exempt - 40 CFR 122.3(b) N/A N/A N/A
Migratory Bird Treaty Act Bald and Golden Eagle Protection Act
Corps Corps Portland District Dredge Program Migratory Bird Treaty Act and Bald and Golden Eagle Protection Act Guidance
N/A N/A N/A
Sediment Evaluation
Corps Lower Columbia River Federal Navigation Channel RM 3 to 106.5 Sediment Quality Evaluation Report
4/21/2017 Mar-2026 10
Portland Sediment Evaluation Team (PSET)
Portland Sediment Evaluation Team Level 2 dredged material suitability determination 7/5/2017 Mar-2026 10
InadditiontoCorpsProjectO&Mactivities,itisimportanttorecognizethattherearealsoNon‐FederalSponsoractivitiesconnectedtoProjectO&M.TheNon‐FederalSponsorsare“solelyresponsiblefortheoperationandmaintenance”ofdredgedmaterialplacementsitesspecificallylistedinArticleVIII,Subparagraph1.A.1ofthePCA.Inotherwords,theNon‐FederalSponsorsareresponsibleforpreparingthosesitestoreceivedredgedmaterialfromO&MoftheFNC(i.e.constructingcontainmentberms)andforsecuringallnecessarypermitsandapprovalsfortheiractivities.TheNon‐FederalSponsorshaveobtainedcompliancedocumentsfortheiractivitiesconnectedtoongoingProjectO&M.Currently,site‐specificpermitsareissuedtotheNon‐FederalSponsorsforshortdurationsandareroutinelyrenewedasneededtomaintaincompliance.
ExecutiveOrder13175,ConsultationandCoordinationwithIndianTribalGovernments
FederalagenciesshallestablishregularandmeaningfulconsultationandcollaborationwithtribalofficialsinthedevelopmentofFederalpoliciesthathavetribalimplications,andstrengthentheUnitedStatesgovernment‐to‐governmentrelationshipswithIndiantribes.Government‐to‐governmentcoordinationforculturalandnaturalresourceswasmost

48
recentlycoordinatedbytheCorpsvialettercorrespondence(3December2013)withtheConfederatedTribesandBandsoftheYakamaNation,theCowlitzIndianTribe,theConfederatedTribesofGrandRonde,theConfederatedTribesofSiletzIndiansofOregon,theConfederatedTribesoftheUmatillaIndianReservation,theNezPerceTribe,andtheConfederatedTribesoftheWarmSprings.Noresponseswerereceivedfromthetribes.
ConsistencyofExistingDocumentswithOngoingO&MActivities
TheexistingenvironmentalcompliancedocumentationiscompleteandconsistentwithcurrentO&Mdredginganddredgedmaterialplacementactivities.Newand/orextendedauthorizations,certificationsandclearancesareroutinelyobtainedbytheresponsiblepartypriortothestartofthedredgingseasonortheexpirationdateofexistingdocuments,whichevercomesfirst.BestmanagementpracticeshavebeenestablishedandtheenvironmentalconsequencesofongoingColumbiaRivernavigationchannelmaintenancedredginganddredgedmaterialplacementaregenerallywellunderstood.However,thereisnotenvironmentalcomplianceinplacetoallowforcontinuingmaintenanceofpiledikes.
Assessmentofneedsforthenext20yearsAsdiscussedabove,newsiteswillberequiredwithinthenext20yearstoprovidesufficientdredgedmaterialplacementcapacityforcontinuedchannelmaintenance.Structuralmeasurestoreducedredgingrequirementsorchangestomaintenancepracticesmayalsobeneededinordertomaintainareliablenavigationchanneloverthistimeperiod.Consultationswithresourceagencieswillberequiredandexistingenvironmentalcompliancedocumentationwillneedtobeupdatedaccordingly.TheColumbiaRiverisanaturallydynamicsystemandpreviousexperienceteachesusthatchannelmaintenancemustcontinuallyadapttochangingconditions.Ifactionsaretooprescriptive,frequentmodificationsarerequired,whichgreatlyincreasestheworkloadsofCorpsandresourceagencies.Instead,programmaticenvironmentalcoordinationwithintentionalflexibilityisstronglyrecommendedforthenextDMMPandpermitsassociatedwiththeproject.
TheremayalsobeopportunitiestoincreasebeneficialuseofdredgedmaterialforESA‐listedspeciessuchassalmonandstreakedhornedlarksthrucooperationwithresourceagencies.Also,analysistoidentifyadditionalshorelineplacementsitesisrecommendedbecauseoftheenvironmentalandchannelmaintenancebenefitsofshorelineplacement.Ideasrequiringfurtherevaluationinclude:placingdredgedmaterialtoreduceshipwakebeachstrandingofjuvenilesalmonathighrisksites,workingwiththestatesofOregonandWashingtontopromotethesaleofsandfromdredgedmaterialplacementsites,andcontinuingthepracticeofremovingdredgedmaterialtorenewsparsely‐vegetatedhabitatforstreakedhornedlarks.Addingnewplacementsitesandremovingmaterialfrom

49
placementsitesprovidesadditionalcapacityformaintenancedredging,andmaterialsalesgenerateroyaltiesfortheStatesofOregonandWashington.
TherelativedeclineinabundanceofPacificlamprey,anaquaticspeciesvaluedbyColumbiaRiverBasintribes,iscurrentlybeingstudied.TheeffectsofColumbiaRivernavigationchannelmaintenanceonlampreywillbeevaluated.TheCorpsisanactiveparticipantintheLampreyWorkingGroup,whichisamulti‐stakeholdergroupthatdevelopsbestmanagementpracticesforminimizingadverseimpactsonlampreyandistaskedwithdevelopingstrategiestosustainlampreypopulationsthroughouttheregion.
Fullenvironmentalcompliancemustbecompletedfortheactionofmaintainingpiledikes.
10 EconomicAssessment
EconomicBenefitsTheColumbiaRiverFNChasasteadyhistoryofprovidingregionalandnationaleconomicbenefits,whichincreaseovertime.In1907,morethan1.7milliontonsofcommoditieswereshippedon1,220ocean‐goingvesselsfromPortland,ORviatheColumbiaRiverwhichatthattimehadanauthorizednavigationchanneldepthof25ft.Thecargoesofthesevesselsincluded175millionftoflumberand18millionbushelsofwheat,flourincluded.Duringthisperiod,Portlandbecameanationalleaderasawheatandflourshippingport,leadingGalvestonandNewYorkatsometimes(Lyman,1909).In1962(channeldepth35ft),exportstotaledabout4.7milliontonsandimportswerenearly1milliontons.Grainsaccountedfornearlythree‐fourthsofallexports(WaterborneCommerceStatisticsfortheColumbiaandLowerWillametteRiverin1962).Afterchannelimprovementto40‐ftdepth,fromtheperiodof1987to1997,10to15milliontonsofwheatwasexportedannually,inadditionto5.5milliontonsofcorn(onaverage)andothercommoditiesincludingbarley,alumina,andcontainers(ColumbiaRiverChannelImprovementStudy–FinalIntegratedFeasibilityReport&EnvironmentalImpactStatement,1999).
In2014,the43ftdeepLowerColumbiaRiverFNCwasusedtotransportover61milliontonsofcargovaluedat$30billion,whichisanincreaseoverthe5‐yearaverage(2010thru2014)of56milliontonsworth$26billion.Vesselsdraftingthefullauthorizedchanneldepthof43ftcarriedapproximately13milliontonsofexportshipmentsworthnearly$5billionin2014.TonnageamountsrefertoCorpsWaterborneCommerceStatisticsCenter(WCSC)datafortheColumbia&LowerWillametteRiversbelowVancouver,WAandPortland,ORWaterwayasprocessedbytheCorpsChannelPortfolioTool(CPT).CargovaluesareestimatedbytheCPTbasedontheWCSCtonnageamountsmultipliedbynationalaveragecommodityunitprice($perton)dataderivedfromUSATradeOnline(https://usatrade.census.gov/).

50
TheColumbiaRiveristhenation'slargestwheatexportgatewayandthethirdlargestgrainexportcorridorintheworld(2014wheatexporttonnagebyproject,WCSCdatafortheColumbia&LowerWillametteRiversbelowVancouver,WAandPortland,ORWaterwayasprocessedbytheCorpsCPT;andOverviewofWheatMovementontheColumbiaRiverReportpreparedAugust17,2016basedonfiveyearaveragesdata(2011‐2015)byU.S.WheatAssociates;http://www.pnwa.net/wp‐content/uploads/PNWA_Handout.pdf).
TheColumbiaRiverFNC,asconstructedtochanneldepthof43ft,continuestoprovidesignificantregionalandnationaleconomicbenefits.Basedonrecentcapitalinvestmentsbychannelusers,thesebenefitsareexpectedtoremainstrongoverthenext20years.
MajorRecentandPlannedInvestmentsbychannelusers
AJune2015reportbythePortofPortlandandthePacificNorthwestWaterwaysAssociationentitled,“ImpactsofChannelDeepeningontheColumbiaRiver,”detailssomeofthemajorregionalinvestmentsthatweremadepossiblebythedeepeningoftheLowerColumbiaRiverFNCfrom40to43ft.Anexcerptfromthereportstates,“CompletionofthedeepeningoftheColumbiaRivershippingchannelin2010openedafloodgateofinvestmentsatterminalsandportsalongtheriver.Accordingtoaportrepresentative,thedeepeningandtheinvestmentsthatfollowedprovidesshippingandcommodityfirmswithcertainty—certaintythatports,terminalsandvesselscanmanagethemixofcommoditiesandtonnagethattoday’sglobaleconomyrequires.Firmshaveconfidencethatshipmentswon’tfacebacklogsatportsduetocapacityconstraints.Shipmentsmoveefficiently.Firmsalsospendlesstimemonitoring,planning,anddevelopingcontingencyshippingplans.”
Thereportgoesontodetailsomeofthoseinvestments:Table10‐1liststheinvestmentsinthestudyconductedbythePortofPortlandandPacificNorthwestWaterwaysAssociation.Itreferencesthefactthatprivateandpublicentitiesinvested$370millioninthePortlandHarbor,and$1billionatterminalsandportsalongtheColumbiaRiver,since2010.Thetablebelowdepictsinvestmentsplannedalongtheriveramountto$4.65billion.
Investmentscompletedtodateinclude:
▪ ThefirstnewgrainterminalbuiltintheU.S.in25years(atthePortofLongview)
▪ExpansionofthelargestexportgrainterminalontheWestCoastoftheU.S.
▪ ThefirstnewgrainbargeontheColumbiaRiversince2011
▪ Thelargestdry‐dockontheWestCoast(atVigor)
Maintainingtheshippingchannelto43ftwillhelpensurethecontinuedgrowthincargomovementandrelatedeconomicactivitythathasoccurredsincethedeepening.

51
Table10‐1:CurrentandPlannedPortInvestmentsalongtheColumbiaRiversince2010,ImpactsofChannelDeepeningontheColumbiaRiver,PortofPortlandandPacificNorthwestWaterwaysAssociation,2015.
Current and Planned Port Investments along the Columbia River since 2010
Current Investments Port Project Investment Amount Description
Longview Export Grain Terminal (2012) $230 million New grain terminal
Kalama Temco LLC (2015) $100 million Increase capacity (grain)
Kalama Port of Kalama (2014‐15) $7 million Rail upgrades at Port
Kalama Kalama Export Grain (2011) $36 million Increase storage capacity
Vancouver United Grain Corp. (2012) $80 million Enlarge storage and
handling capacity
Vancouver West Vancouver Freight Rail
Access (2015)
$228 million Rail expansion, new loop
track and road improvement
Vancouver Tidewater Barge Lines
(2015)
$30 million Three new tugboats
Portland Columbia Grain (2015) $44 million Upgraded grain storage and
handling
Portland Kinder Morgan Bulk
Terminal (2013)
$10 million New ship loading facilities
Portland International Raw Materials
(2014)
$2 million Improvements to rail and
storage tanks
Portland LD Commodities (2014) $21 million Expanded grain storage and
moving facilities
Port Project Investment Amount Description
Portland Vigor Industrial (2014) $50 million Largest drydock in the US
Portland Rivergate Road and Rail
Improvements (2012)
$82 million Improve road and rail access
and capacity
Portland Canpotex – Portland Bulk
Terminal (2013)
$140 million Increase efficiency of
shiploading
Portland Shaver Transportation
(2014)
$21 million New barge, new tug and
new engines
Sub Total Current $1.08 Billion

52
Proposed Investments Longview Millennium Bulk Terminal
(2018)
$600 million New coal terminal
Longview Millennium Bulk Terminal
(2018)
$25 million Smelter removal and
environmental cleanup for
new bulk terminal
Kalama NW Works (2017‐18) $1.8 billion New methanol plant
St. Helens Port Westward Global – Columbia Pacific Bio
Refinery (2018)
$80 million Increased storage and rail
improvements
St. Helens Port Westward NW Works (2017‐18) $1.8 billion New methanol plant
St. Helens Port Westward Ambre energy (2018) $242 million Coal transport
Vancouver Vancouver Energy (2018) $100 million Rail improvements and
loading facilities
Sub Total Proposed $4.65 Billion
Total Current and Proposed since 2010 $5.73 Billion
Vesselsloadedtofullauthorizeddepthuseentirenavigationchannelprojectarea
Theentirenavigationchannellength,fromRM3toRM105.5atthePortofVancouver,isutilizedbyvesselsloadedtothefullauthorizedchanneldepthof43ft.AsreferencedaboveinTable10‐1,thePortofVancouverhasthreecurrentprojectsandoneplannedprojectequatingtoatleast$438Mininvestments.Inparticular,the$80McapitalinvestmenttoenlargegrainstorageandhandlingintheUnitedGrainCorporationprojectdemonstratestheneedforcontinuedmaintenancefortheentiretyoftheprojectarea.InthePortofPortlandandPacificNorthwestWaterwaysAssociation’sreport(referencedabove),theUnitedGrainCorporationprojectisdetailedasfollows:“Withtheir$80millioninvestmenttoexpandtheirgrainterminal,UnitedGrainCorporationnowhasthelargestexportgrainterminalontheWestCoast,andthesecondtallestgrainstructureintheworld.Thedevelopmentstartedin2008‐2009,anticipatingthechanneldeepeningcompletionandlargershipswithdeeperdraftscallingonColumbiaRiverports.LikeothergrainterminalsalongtheColumbiaRiver,UnitedGrainCorporation’sexpansionincludedaddingstorageandtransportcapabilitiesforgrainsnewtothismarket—cornandsoybeans—alongwiththeirtraditionalwheatproduct.”TheinformationquotedabovecomesfrominterviewswiththeUnitedGrainCorporationandPortofVancouverinMarch2015(ImpactsofChannelDeepeningontheColumbiaRiver,PortofPortlandandPacificNorthwestWaterwaysAssociation,2015),andclearlysupportsthefactthattheproject’ssuccessisdependentonloadeddeepdraftvesselshavingaccesstotheupperreachesoftheLowerColumbiaRiverFNC.

53
In2015,thePortofVancouverexported5,540,913metrictonsofcargo,a3.9%increasefrom2014.Ofthatexportcargo,4.56millionmetrictonsconsistedofgrainproducts(wheat,soybeans,andcorn),a6.9%increasefrom2014.ThePortofVancouveralsoreportedarecordyearforimportsin2015at1,416,308millionmetrictons,a12.1%increasefrom2014(http://www.portvanusa.com/community/year‐in‐review/).Asmadeevidentbytheseinvestmentsandutilization,maintenanceofthefullextentofthe43‐footnavigationchanneliscrucialtotheeconomicstrengthoftheregionandnation.
MaintenanceCostsTheaverageannualcosttomaintaintheColumbiaRiverFNCforthepastfivefiscalyearsisaround$40million(seeTable10‐2).
Table10‐2:FederalFundsObligatedforColumbia&LowerWillametteRiversProject
FiscalYear FederalFundsObligated*
2012 $36.8million
2013 $37.5million
2014 $38.6million
2015 $47.0million
2016 $43.3million**
*doesnotincludecostsforGovernmentdredgemooringsfacilityclean‐upbecauseitwasnotcosttomaintainFNC**doesnotincludeC&LW$2.2millionGovernmentdredgeaccountpaymentbecauseitwasnotcosttomaintainFNC
ThecostsfromFY12toFY16areacombinationofdredgingandmaintenanceofexistingplacementsites.However,theannualcostisexpectedtoincreaseincomingyearstoaddressdeferredmaintenanceofpiledikestructuresusedtomaintaintheColumbiaRiverFNCaswellastheFederalcosttopreparenewplacementsites.Aroughorderofmagnitudeestimateforthisincreasedannualcostis$5to$10million.ThisestimateisbasedontheestimatedaveragecostperpiledikeforrepairstotheCottonwoodIslandpiledikesystem(over$1millioncalculatedfromthecostestimateintheMajorMaintenanceReportdated2017)andatotalneedforrepairstoover140piledikes(StructuralandHydraulicAnalysisofColumbiaRiverPileDikesReportdated2011).Thisestimateassumesthatrepairstomostpiledikeswillproceedaccordingtopriorityatanannuallevelofeffortthatisbelowthebudgetarythresholdformajormaintenanceactions(mostrecently$6.2millionasdefinedinEngineeringCircular11‐2‐214dated31March2017),sothismaintenancecostwillcontinueforatleastthenext20years.Thisalsoassumesthatmostifnotallpiledikesystemsintheprojectareawillneedtobereplacedorrepairedinordertomaintainfunctionundercurrentconditions.Therefore,forcomparisonwiththeeconomicbenefitsdetailedabove,thetotalannualcosttomaintaintheColumbiaRiverFNCisaround$50M.

54
DeterminationthatContinuedMaintenanceisWarranted
AnalysisoftheeconomicbenefitandcostindicatorsshowsthatcontinuingO&MoftheColumbiaRiverFNCbetweenRM3and105.5iswarranted.Annualeconomicbenefitsconclusivelyoutweighannualprojectmaintenancecosts.Additionaleconomicanalysisisnotnecessary.
11 FindingsThepreliminaryassessmentofeconomicbenefitsandcostsprovesthatcontinuedmaintenanceoftheLowerColumbiaRiverFNCiswarranted;however,adredgedmaterialmanagementstudyandDMMPisneededtoaddresskeyprojectinformationgapsandchallenges.
Themostcriticalconsiderationisthedredgeequipmentavailabletotheproject.Existingdredgeequipmentavailabilityisuncertain,especiallythelimitednationalhopperdredgingfleetofGovernmentandcontracthopperdredges,andadditionaloralternativedredgingequipmentshouldbeconsidered.SandwavesareachronicshoalingproblemfortheColumbiaRiver;however,sandwavedredgingisinefficientfortheexistingdredgeequipmentandalternativetechniquesforaddressingsandwaveshoalingshouldbefurtherinvestigated.TheteamwillneedtodetermineifitiswithinscopetoevaluatealternativedredgeequipmentaspartoftheDMMP.Also,thehopperdredgingfleetisagingandtherewilllikelybechangesduringthe20‐yearperiod.TheplanmustthereforeoptimizeandinformthecurrentandfuturedredgingfleetavailableforLowerColumbiaRiverFNCO&M.
Forthepurposesofthisassessment,theforecastedaverageannualdredgingneedforthenext20yearsisexpectedtobe6.5mcy(130mcytotal).However,thisvolumedependsonmanychannelO&Mvariablesthataffectshoaling,suchasrivertrainingstructures.Aninventory,condition,andplanforexistingrivertrainingstructuresneedstobedeveloped.
Differentplacementmethodsalsoaffectfutureshoaling.Thesustainablerateofuplandandin‐waterplacementneedstobedeterminedtosupportregionalsedimentmanagement.
Thirteenofthenineteenexistinguplandplacementsitesarealreadyfullorhavecapacityforjustoneortwomoreplacementevents.Manyoftheselimitedcapacitysitescouldbefullwithinthenextfiveyears.AmajorityoftheuplandplacementsitesreachingcapacityarelocatedbetweenRMs34and86.5,whichwillresultincriticalchannelmaintenancechallengesincludingsignificantcostincreasestoplacedredgedmaterialinotherlocations,unlessnewalternativesareidentified.Overthenext20yearperiod,theprojectedneedforuplandplacementisupto40mcyandtheremainingcapacityafter2016isjust16.75mcy,adifferenceof23.25mcyadditionalcapacityneeded.

55
Althoughthecapacityforin‐waterplacementinthisdynamicrivercannotbereasonablyquantified,therearestrongindicationsthatcapacityisbecomingincreasinglylimited.Thoseindicationsinclude:stablein‐waterplacementlocations,whichareusedfor70%ofdredgedmaterialplacement,arebecomingdepth‐limitedbecauseofdredgedmaterialaccumulationandsomepastsitesappeartobecausingshoalinginthechannelwhichmakesthemunsuitableforfutureplacement.Improvementofin‐waterplacementtechniquesusinghydraulicanalysisisessentialtoproperlyaccommodatethe80‐100mcyofdredgedmaterialthatisprojectedtobeplacedin‐waterthroughoutthe20yeardurationofthisplan.Anotheroptionistheincreaseduseoftemporaryin‐waterdredgedmaterialrehandlesites(sumps).Table11‐1providesestimatedvolumesfordifferentdredgedmaterialplacementmethodsforthenext20yearsofchannelO&M.Forthepurposesofthisassessment,theestimateassumestheplacementmethodallocationisconsistentwithcurrentpractices.
Table11‐1:EstimatedDredgedMaterialPlacementVolumeforNext20Years
PlacementMethod EstimatedVolume(CY)
Upland 20to40mcy
Shoreline 10to20mcy
In‐Water(River) 80to100mcy
Ocean Unknownifneeded
Lastly,thereareenvironmentalcomplianceandrealestateneeds.AlthoughtheexistingenvironmentalcompliancedocumentationiscompleteandconsistentwithcurrentO&Mactivitiesfordredginganddredgedmaterialplacement,additionalcomplianceisneededforpiledikemaintenance.Therealestaterightsforexistingplacementsiteswillexpirebeforetheendofthenext20yearchannelO&Mperiod.


57
13 References
AECOMforPortlandDistrict,U.S.ArmyCorpsofEngineers.2011.StructuralandHydraulicAnalysisoftheColumbiaRiverPileDikes.
AdamJ.HeinemanandJudithRichardson.1968.SoThatShipsMayPass:Historical,Structural,andOperationalDevelopmentofNavigation–LowerColumbiaandWillametteRivers.
BeasleyT.M.;Jennings,C.D.;andD.A.McCullough;1986.SedimentAccumulationRatesintheLowerColumbiaRiver;J.Environ.Radioactivity,103‐‐123.
DavidA.Jay,ProfessorPh.D.inPhysicalOceanography,PortlandStateUniversity,March2013.TheTrajectoryoftheLowerColumbiaRiverandEstuary,1850‐2013.
Eriksen,Karl.W,PortlandDistrict,U.S.ArmyCorpsofEngineers,Portland,Oregon.1989.ColumbiaRiverShoalingAnalysis.
Haushild,W.L.;Perkins,R.W.;Stevens,H.H.;DempsterG.R.;Glenn,J.L.1966.RadionuclidetransportinthePascotoVancouver,WashingtonreachoftheColumbiaRiverJuly1962toSeptember1963.
Headquarters,U.S.ArmyCorpsofEngineers,Washington,D.C.2014.U.S.ArmyCorpsofEngineersAnnualReport.
Hickson,RobertE.1961.ColumbiaRiverShipChannelImprovementandMaintenance.
Hubbell,D.W.;GlennJ.L.;Stevens,H.H.Jr.1971.StudiesofsedimenttransportintheColumbiaRiverEstuary.Proceedings1971TechnicalConferenceonEstuaries,ofthePacificNorthwest.Proc.Circ.42,Eng.ExperimentStation.Corvallis:OregonStateUniversity.

58
Karlin.R.;1980.SedimentsourcesandclaymineraldistributionsofftheOregoncoast.J.Sed.Pet.,543‐60.
Levin,DouglasR.,W.JeffLillycrop,andAlexander,MichaelP.WaterwaysExperimentStation,U.S.ArmyCorpsofEngineers.September1992.TechnicalReportHL‐90‐17SandWaves:Report1SandWaveShoalinginNavigationChannels.
Lyman,WilliamD.1909.TheColumbiaRiver:ItsHistory,ItsMyths,ItsScenery,ItsCommerce.
PortofPortland.November1991.GuidetoNavigationontheLowerColumbia.
PortofPortland.2011.ColumbiaRiverReflections.AMemoirbyOgdenBeeman.
PortofPortlandandPacificNorthwestWaterwaysAssociation.June2015.ImpactsofChannelDeepeningontheColumbiaRiver.
PortlandDistrict,U.S.ArmyCorpsofEngineers,Portland,Oregon.June1998.ColumbiaandLowerWillametteRiverFederalNavigationChannel,FinalIntegratedDredgedMaterialManagementPlanandSupplementalEnvironmentalImpactStatement.
PortlandDistrict,U.S.ArmyCorpsofEngineers,Portland,Oregon.August1999.IntegratedFeasibilityReportforChannelImprovementsandEnvironmentalImpactStatement,Columbia&LowerWillametteRiverFederalNavigationChannel.
PortlandDistrict,U.S.ArmyCorpsofEngineers,Portland,Oregon.January2003.TheColumbiaRiverChannelImprovementStudy–FinalSupplementalIntegratedFeasibilityReport&EnvironmentalImpactStatement.
PortlandDistrict,U.S.ArmyCorpsofEngineers,Portland,Oregon.30September2013.ColumbiaRiverFederalNavigationChannelInterimOperations&Maintenance(O&M)Plan.

59
PortlandDistrict,U.S.ArmyCorpsofEngineers,Portland,Oregon.1986‐2016.USACEDredgingandPlacementRecords.
Roy,E.H.;Creager,J.S.;Walter,S.R.;Borgeld,J.C.1979.AninvestigationtodeterminethebedloadandsuspendedsedimenttransportovertheoutertidaldeltaandmonitorthesedimentaryenvironmentofsitesEandDnearthemouthoftheColumbiaRiver.
Sherwood,C.R.,J.S.Creacher,E.H.Roy,G.GelfenbaumandT.Dempsey;1984.SedimentaryprocessesandenvironmentsintheColumbiaRiverEstuary.ColumbiaRiverEstuaryDataDevelopmentProgram,ColumbiaRiverEstuaryStudyTaskforce,Astoria,Oregon317pp.
Simenstad,C.A.,D.A.Jay,C.D.McIntyre,C.Sherwood,andL.Small,1984.ThedynamicsoftheColumbiaRiverEstuaryecosystem,CREST,Astoria,Oregon,695pp.,twovolumes.
U.S.ArmyCorpsofEngineers,U.S.EnvironmentalProtectionAgency,WashingtonDepartmentofEcology,WashingtonDepartmentofNaturalResources,OregonDepartmentofEnvironmentalQuality,IdahoDepartmentofEnvironmentalQuality,NationalMarineFisheriesService,andU.S.FishandWildlifeService.2016.SedimentEvaluationFrameworkforthePacificNorthwest.PublishedJuly2016,bytheU.S.ArmyCorpsofEngineers,NorthwesternDivision,172pp+Appendices.
Whetten,J.T.;Kelley,J.C.;Hanson,L.G.;1969.CharacteristicsofColumbiaRiversedimentandsedimenttransport.J.Sed.Pet.39:1149‐1166.