Embed Size (px)
Citation preview
Today’s Lecture
• Interpre+ng sta+s+cal results – a process linked to study design.
• Randomized experiment vs. observa+onal data
• Sta+s+cal measure of uncertainty • Chance mechanism – understanding whether a chance mechanism was used and for what purpose, e.g. sample selec+on, group alloca+on, etc.
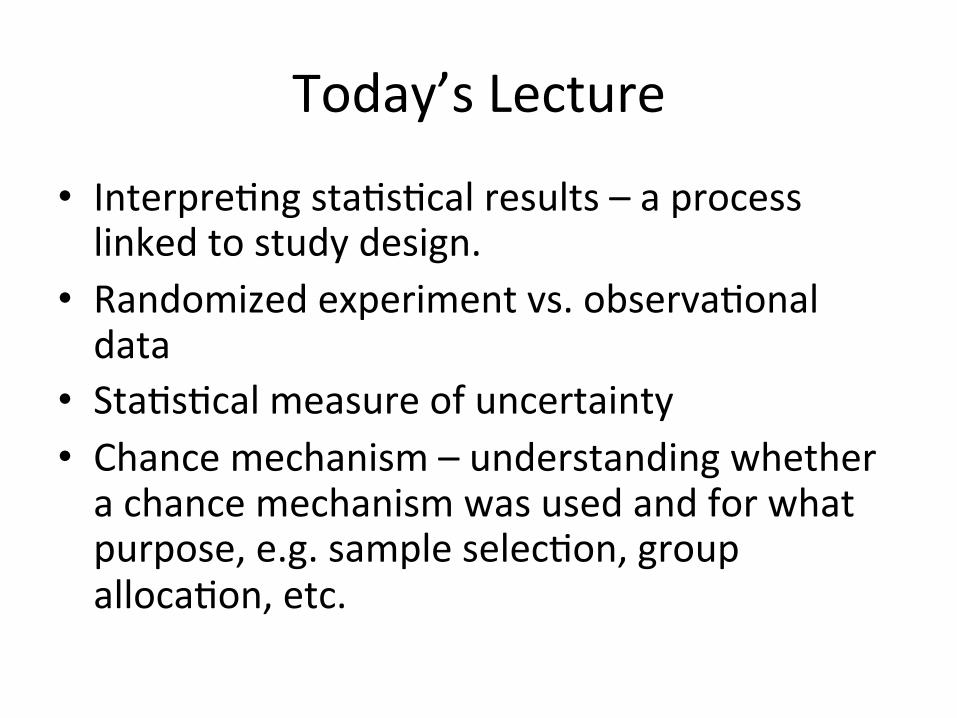
Mo+va+on and Crea+vity Instruc(ons: Please rank the following list of reasons for
wri(ng, in order of personal importance to you. • You get a lot pleasure out of reading something good that you have wriKen.
• You enjoy the opportunity for self expression. • You achieve new insights through your wri+ng. • You derive sa+sfac+on from expressing yourself clearly and eloquently.
• You feel relaxed when wri+ng. • You like to play with words. • You enjoy becoming involved with ideas, characters, events, and images in your wri+ng.

Mo+va+on and Crea+vity Instruc(ons: Please rank the following list of reasons for
wri(ng, in order of personal importance to you. • You realize that, with the introduc+on of dozens of magazines
every year, the market for free-‐lance wri+ng in constantly expanding.
• You want you wri+ng teachers to be favourably impressed with your wri+ng talent.
• You have heard of cases where one bestselling novel or collec+on of poems has made the author financially secure.
• You enjoy public recogni+on of your work. • You know that many of the best jobs available require good wri+ng
skills. • You that wri+ng ability is one of the major criteria for acceptance
into graduate school. • Your teachers and parents have encouraged you to go into wri+ng.
Intrinsic group
12.0 20.5
12.0 20.6
12.9 21.3
13.6 21.6
16.6 22.1
17.2 22.2
17.5 22.6
18.2 23.1
19.1 24.0
19.3 24.3
19.8 26.7
20.3 29.7
Extrinsic group
5.0 17.4
5.4 17.5
6.1 18.5
10.9 18.7
11.8 18.7
12.0 19.2
12.3 19.5
14.8 20.7
15.0 21.2
16.8 22.1
17.2 24.0
17.2
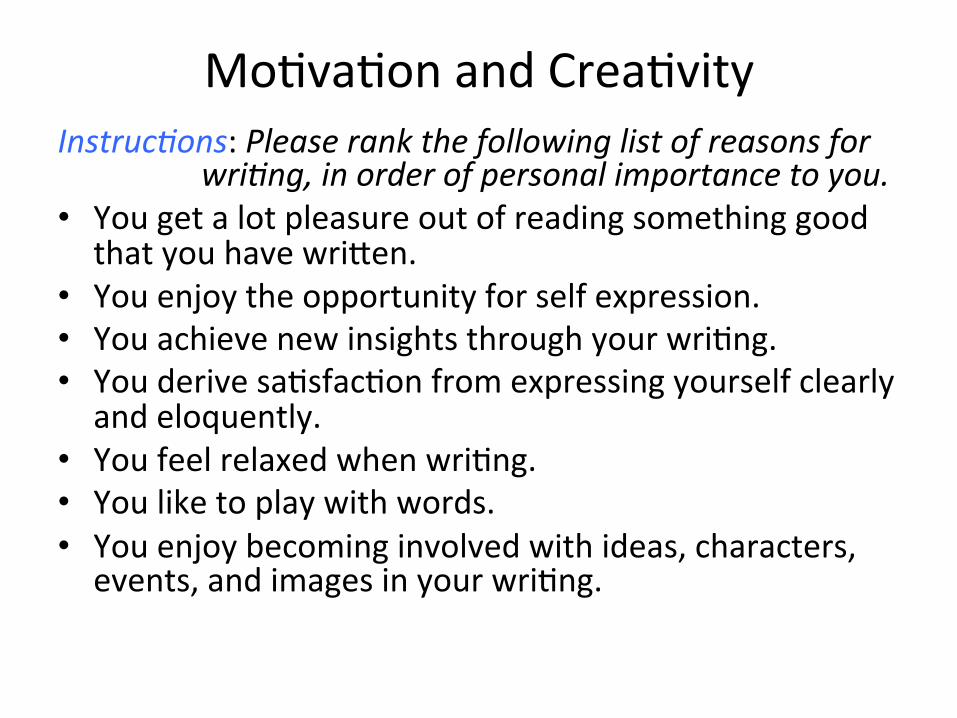
Sample size: 24 23 Average: 19.88 15.74
Standard devia(on: 4.44 5.25

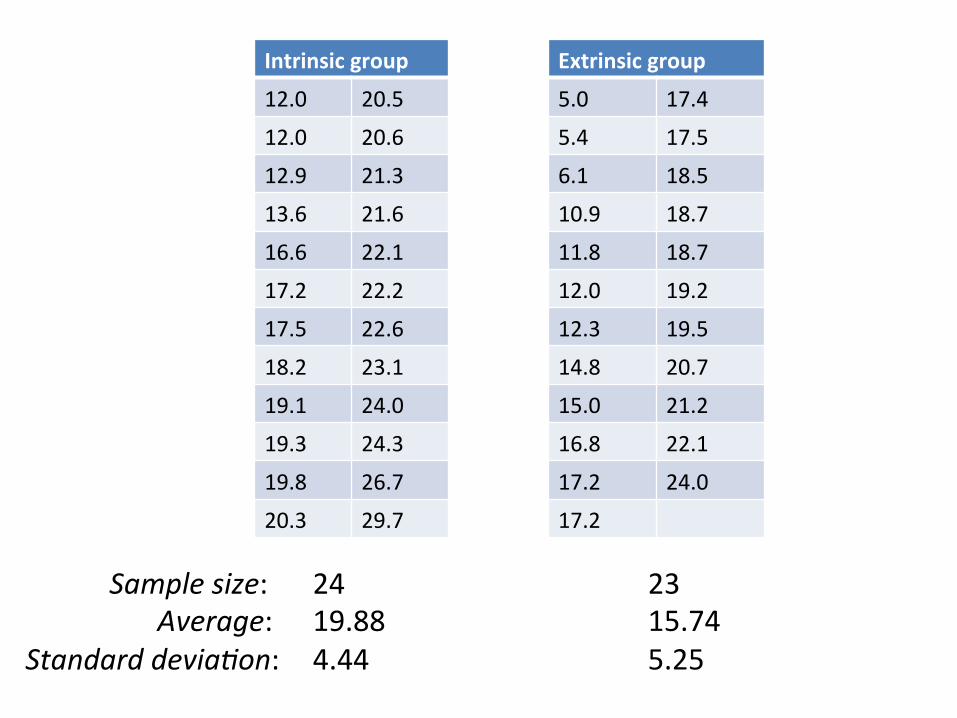
Star1ng salaries for 32 male and 61 female clerical hires at a bank
Males Females 4,620 5,700 6,000 3,900 4,500 4,800
5,220 5,400
5,640
5,040 6,000 6,000 4,020 4,620 4,800
5,220 5,400
5,700
5,100 6,000 6,000 4,290 4,800 4,980 5,280 5,400
5,700
5,100 6,000 6,300 4,380 4,800
5,100 5,280 5,400
5,700
5,220 6,000 6,600 4,380
4,800
5,100
5,280 5,400
5,700
5,400 6,000 6,600 4,380
4,800
5,100
5,400 5,400
5,700
5,400 6,000 6,600 4,380
4,800
5,100
5,400
5,400
6,000
5,400 6,000 6,840 4,380
4,800
5,100
5,400
5,520 6,000
5,400 6,000 6,900 4,440 4,800
5,100
5,400
5,520 6,120
5,400 6,000 6,900 4,500 4,800
5,160 5,400
5,580 6,300
6,000 8,100 6,300
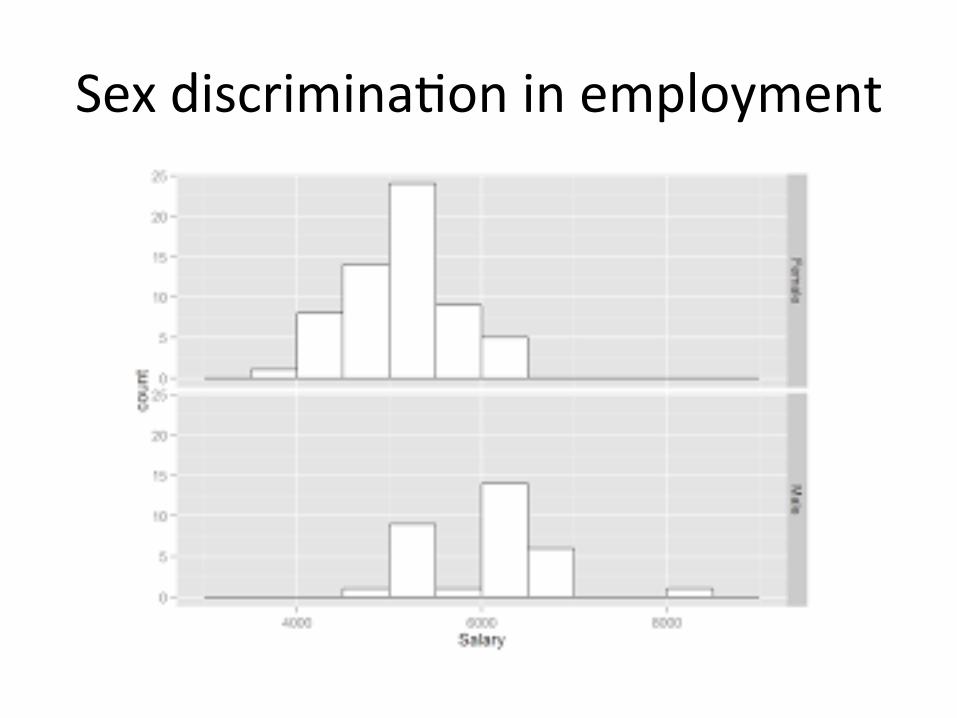
Sex discrimina+on in employment

Randomized experiment vs. observa+onal study
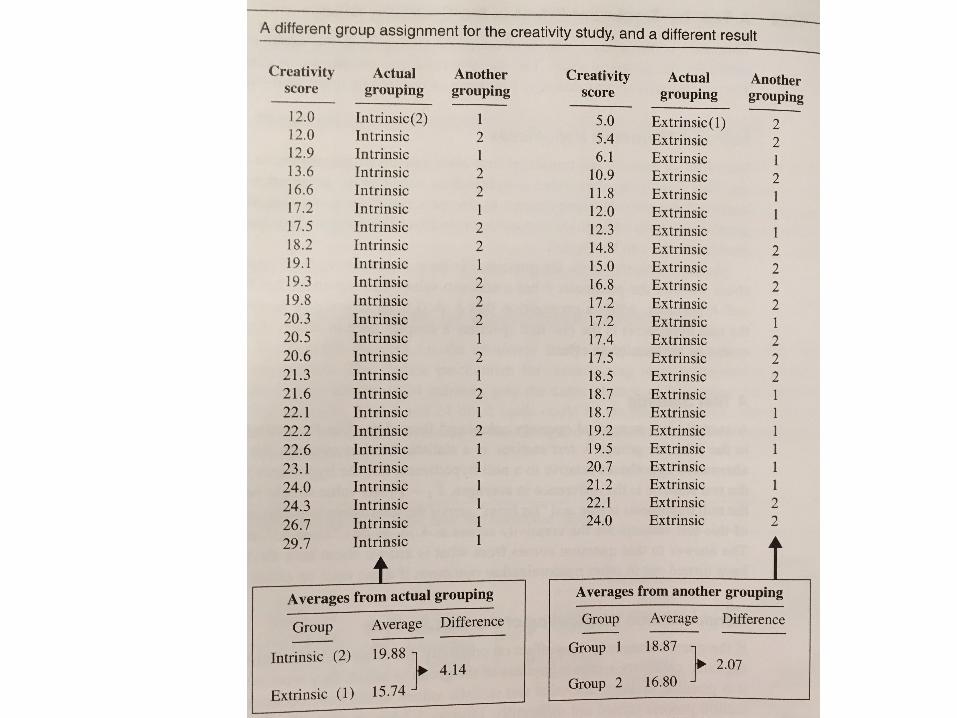
Crea(vity study – randomized experiment and so we infer that difference in crea+vity was caused by difference in mo+va+onal ques+onnaire. Because subjects were not selected randomly from any popula+on, extending this inference to any other group is specula+ve. Sex discrimina(on in employment – observa(onal study so although there is evidence that males received larger salaries than females, the data cannot address whether the difference is due to sex discrimina+on.

Causal Inference
• Randomized experiment – inves+gator controls assignment of experimental units to groups and uses a chance mechanism to make assignments.
• Observa(onal study – group status of subjects established beyond control of inves+gator. Sta(s(cal inferences of cause and effect
rela(onships can be drawn from randomized experiments but not from observa(onal studies.
Do we need observa+onal studies?
• Establishing causa(on is not always the goal, e.g. sickle-‐cell anaemia is more common among African and Mediterranean popula+on than in North-‐European popula+on.
• Analysis of observa(onal data may lend evidence toward causal theories and suggest the direc(on of future research, e.g. further studies to establish the cause of sickle-‐cell anaemia.

Inference to popula+ons
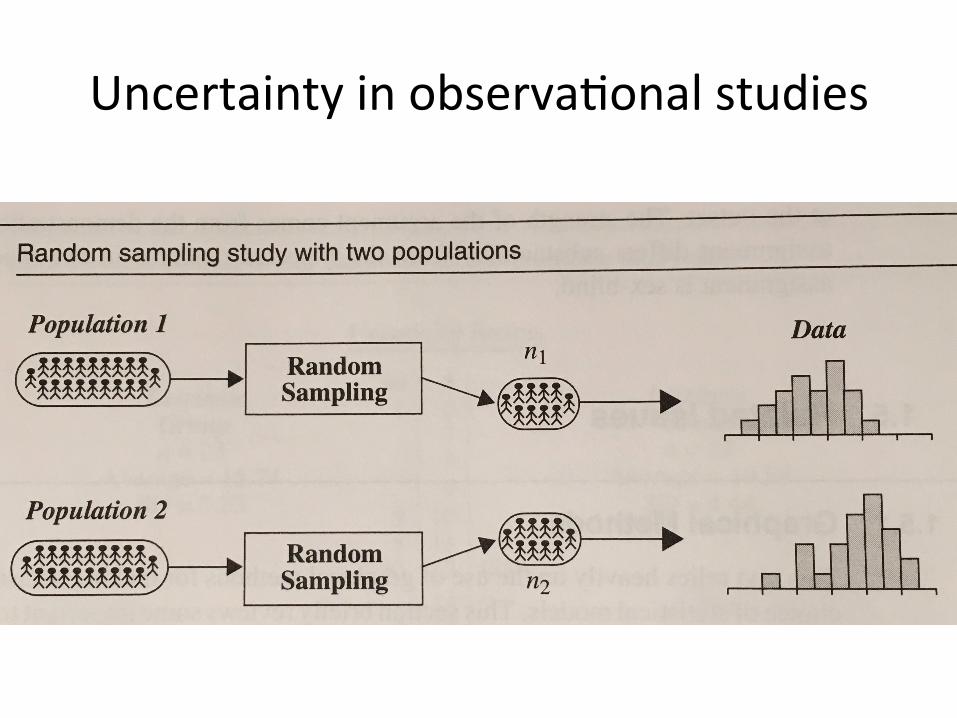
• Inference to popula+ons can be drawn from random sampling studies.
• Random sampl ing ensures that a l l subpopula+ons are represented in the sample in roughly the same mix as in the overall popula+on.
• A typical method for choosing a random sample is by loFery.
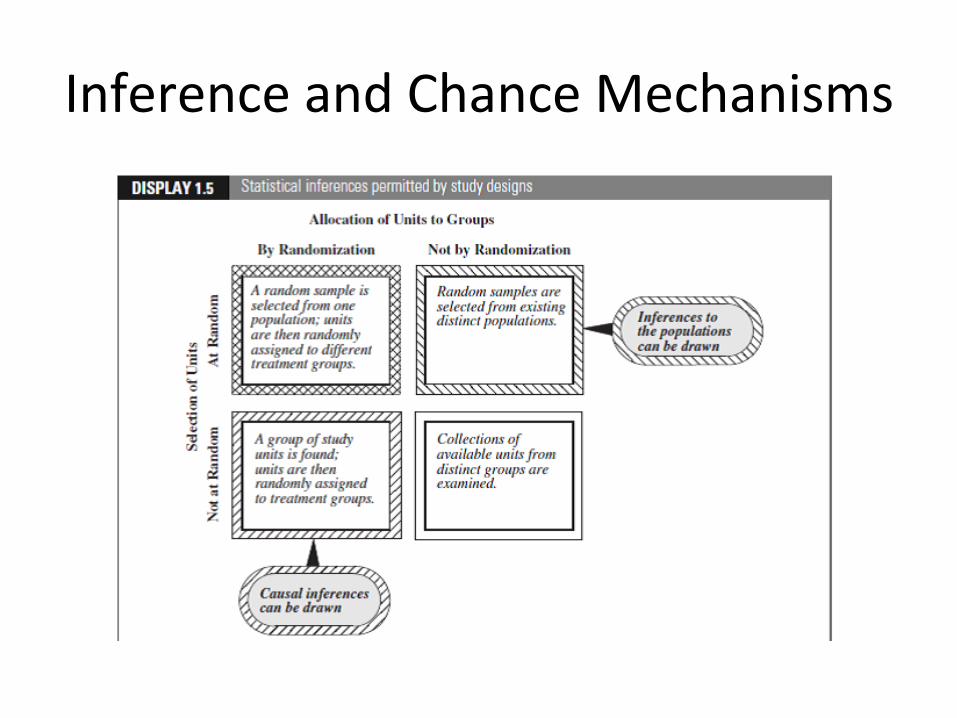
Inference and Chance Mechanisms
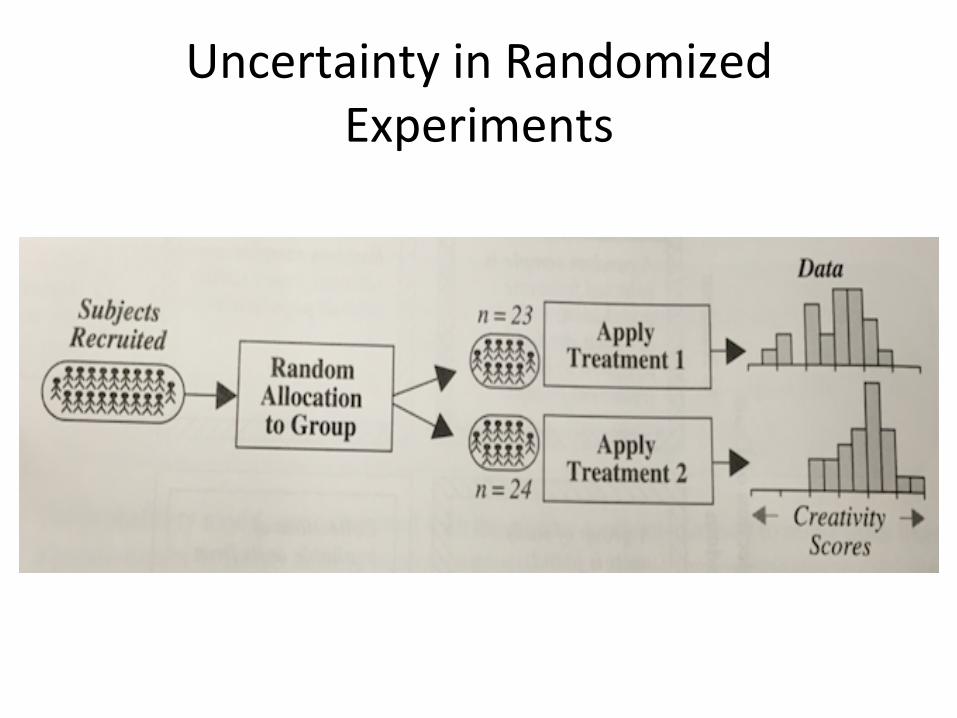
Uncertainty in Randomized Experiments
Null Hypothesis
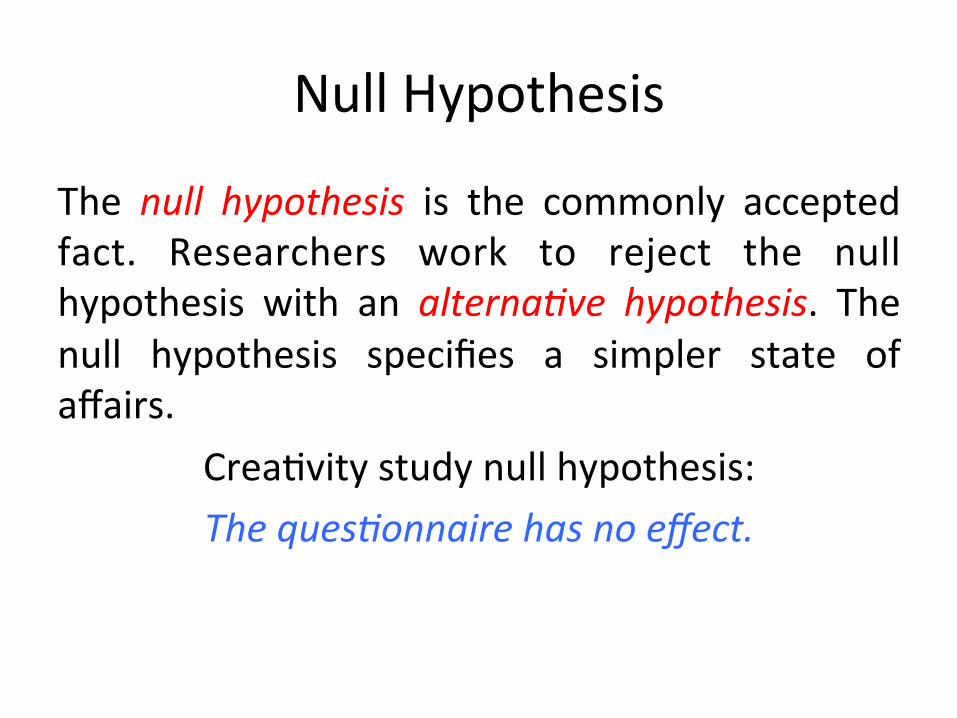
The null hypothesis is the commonly accepted fact. Researchers work to reject the null hypothesis with an alterna(ve hypothesis. The null hypothesis specifies a simpler state of affairs.
Crea+vity study null hypothesis: The ques(onnaire has no effect.
p-‐value
In randomized experiment the p-‐value is the probability that randomiza+on alone leads to a test sta+s+c as extreme or more extreme than the one observed. The smaller the p-‐value, the more unlikely it is that the chance assignment is responsible for discrepancy between groups, and the greater the evidence that the null hypothesis is incorrect.
p-‐value
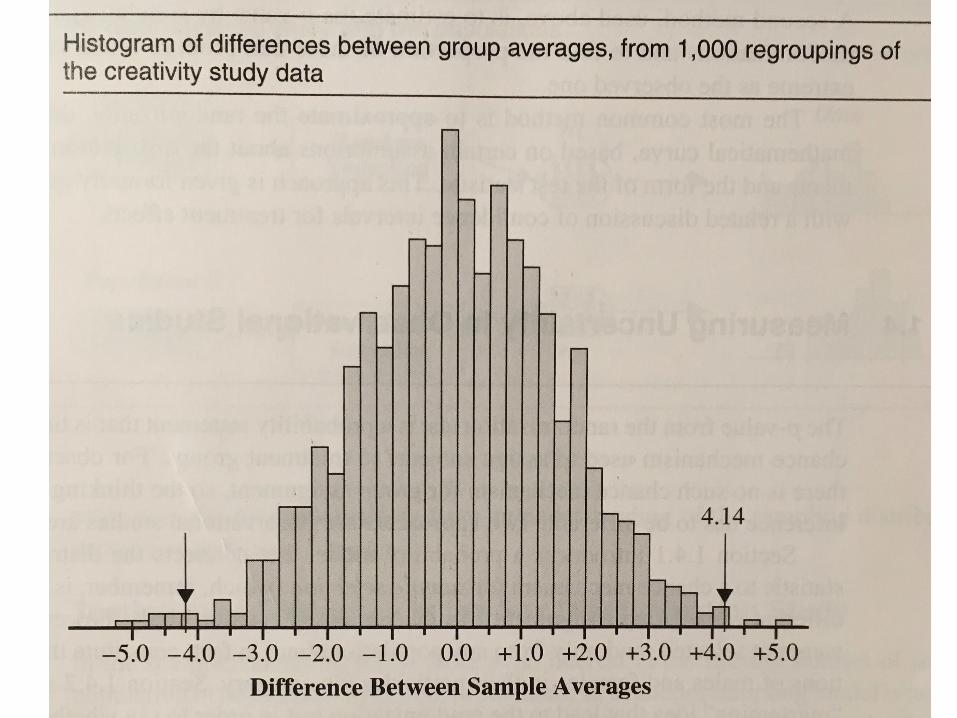
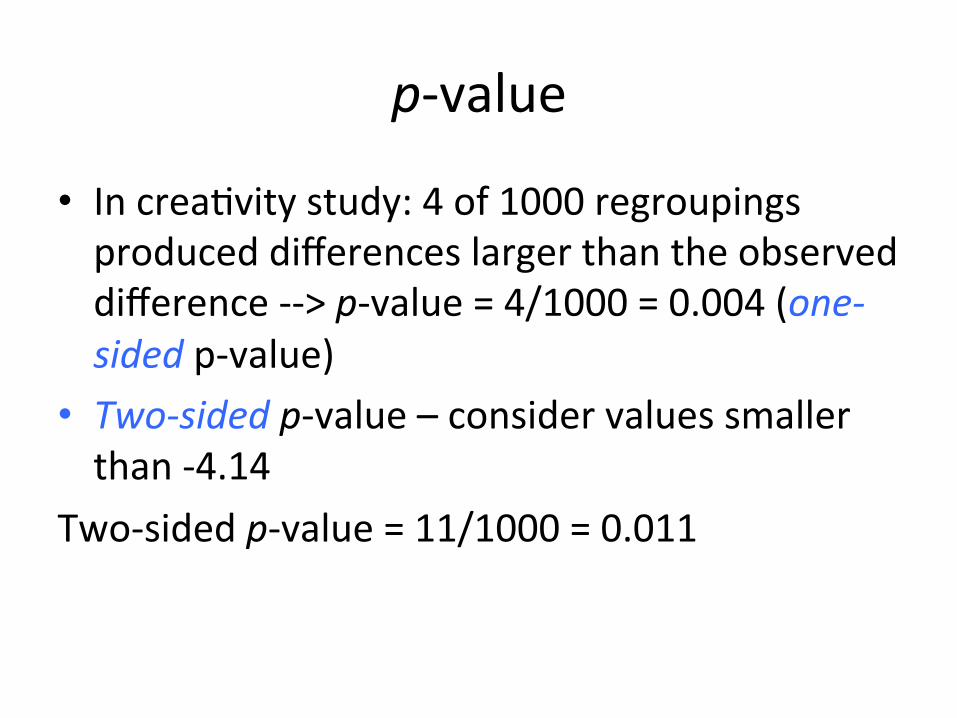
• In crea+vity study: 4 of 1000 regroupings produced differences larger than the observed difference -‐-‐> p-‐value = 4/1000 = 0.004 (one-‐sided p-‐value)
• Two-‐sided p-‐value – consider values smaller than -‐4.14
Two-‐sided p-‐value = 11/1000 = 0.011

Compu+ng p-‐values
• Enumera+on of all possible regroupings of the data.
• Simula+ng a large number of randomiza+ons and finding propor+on of these that produce a test sta+s+c at least as extreme as the observed one.
• Approximate the randomiza+on distribu+on with a mathema+cal curve.
Uncertainty in observa+onal studies
Permuta+on distribu+on
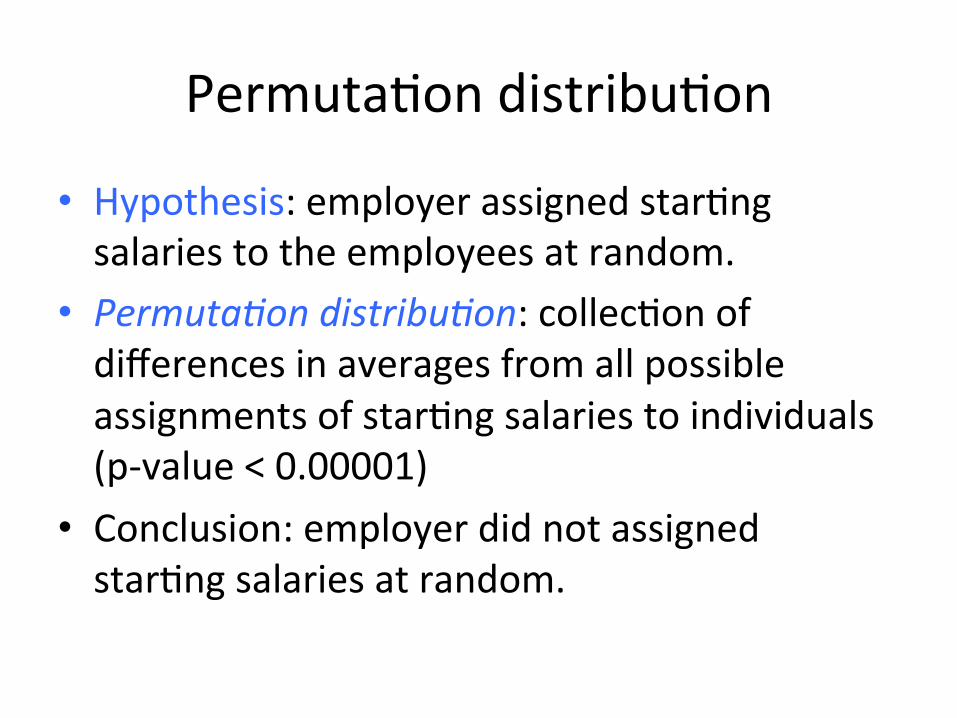
• Hypothesis: employer assigned star+ng salaries to the employees at random.
• Permuta(on distribu(on: collec+on of differences in averages from all possible assignments of star+ng salaries to individuals (p-‐value < 0.00001)
• Conclusion: employer did not assigned star+ng salaries at random.