Embed Size (px)
Citation preview

Chapter 6
Activity, Age and Color
The goals for this project as previously stated are to determine:
� How does the character of photospheric activity change with age?
� How does the character of photospheric activity depend on spectral type?
� How is the photospheric activity in uenced by the binary nature of stars?
� Can we determine rotation periods for any stars, based on their activity?
� Can we see any long term trends in the data analogous to the solar cycle?
The activity of stars on the binary sequence was discussed in the previous chapter,
so I will not address the subject here. In this section, I will be considering the Phase II
data for the nightly timescales and the combined Phase I and Phase II data for the yearly
timescales, unless stated otherwise.
6.1 Activity vs. Age
The clusters observed in this project range from 1.6 to 7 Gyr. As discussed in x 1.3.1, theactivity of stars should decline with age as the stars spin down.

207
Cluster Age % # Median Median
(Gyr) Active, Active, Av, Av,
Nightly Nightly Active Main Seq.
(mmag) (mmag)
NGC 7789 1.6 12% 16 � 4 19.5 6.3
NGC 6819 2.5 4% 9 � 3 12.6 7.7
M67 4.0 28% 15 � 4 18.3 10.8
NGC 188 7.0 0% 0 ... 8.2
Table 6.1: Summary of the nightly activity of the cluster stars as a function of age. The
uncertainties in the numbers of active stars is the square root of the number.
Cluster Age % # Median Median
(Gyr) Active, Active, Av, Av,
Yearly Yearly Active Main Seq.(mmag) (mmag)
NGC 7789 1.6 12% 51 � 7 7.9 5.4
NGC 6819 2.5 19% 99 � 10 16.5 12.4
M67 4.0 3% 2 � 1 4.1* 5.3NGC 188 7.0 3% 5 � 2 8.5 6.0
Table 6.2: Summary of the annual activity of the cluster stars as a function of age. The
uncertainties in the numbers of active stars is the square root of the number. * : A mean
was taken for the activity index of the annual data for M67 since only two stars were
active.
The percentage of active stars and the median activity index for those stars are listed
for each cluster in Tables 6.1 and 6.2. The nightly and yearly timescales are both included.
On the nightly timescale NGC 7789 and M67 have a relatively large fraction of active stars,
but NGC 6819 and NGC 188 have a much smaller fraction of active stars. On the yearly
timescale, the two younger clusters have a larger fraction of active stars than the older
clusters.
NGC 6819 had only sixteen nights of observations in Phase II, spread over three
months, which is the fewest number of observations of any of the clusters in Phase II.
The short timescale of the observations may be a�ecting the search for activity on the
rotational timescale: over the course of a few months, the amount of activity on the stars
may not have changed much.
208
To test whether the short time span of the NGC 6819 observations would a�ect the
fraction of active stars found, I removed the �rst seven nights of observations for NGC 7789
so that the data for NGC 7789 now had the same number of nights of observations over
approximately the same number of months. When I repeated the analysis for NGC 7789,
I found that only seven of 132 (5%) main sequence stars were active. This percentage of
active stars is much lower than was found for the full data set, and it is very similar to
the percentage of active stars in NGC 6819.
If the time span of the observations a�ects the fraction of active stars found, does M67
have a high fraction of active stars only because it had the most nights of observations
in Phase II? I re-analyzed the data for M67, using only sixteen nights of observations
spanning approximately three months. In this case, I found 12% of the 26 main sequence
stars to be active. This is a = lower percentage that were found to be active using the full
data set (28%), but still higher than in NGC 6819 or the reduced data set for NGC 7789.
Thus, the timescale of the observations does not wholly determine the percentage of active
stars found on the rotational timescale.
There is another possible explanation for the lower percentage of active stars in
NGC 6819, although it is less likely considering the analysis of the timescale above:
NGC 6819 may be in the Vaughan-Preston gap. As discussed in x 1.3.1, the Vaughan-Preston gap falls between branches of di�erent types of chromospheric activity; various
researchers (e.g., Soon, Baliunas & Zhang (1993), Brandenberg, Saar & Turpin (1998))
have speculated that stars evolve from the active branch through the gap to the inactive
branch because of a change in the magnetic dynamo. The age at which stars transit
the gap is 2 - 3 Gyr (Brandenberg, Saar & Turpin 1998). The main sequence stars in
NGC 6819 may be undergoing a reorganization of the magnetic dynamo and currently
have low levels of activity.
The data set for NGC 7789 reduced to the same number of nights as NGC 6819 results
in NGC 7789 having nearly the same percentage of active stars as NGC 6819 (5% and

209
4%, respectively). The equivalent-length data set for M67 has 12% active main sequence
stars. Since one would expect the younger stars to be more active than the older stars
in M67, perhaps both NGC 7789 and NGC 6819 are currently in the Vaughan-Preston
gap. M67 has reached the inactive branch on the older side of the gap and the stars have
settled into their new dynamo states, although they are more active than has commonly
been thought prior to observations by Stassun et al. (2002).
The activity indices for the active stars on the nightly timescale (Table 6.1) are similar
in the three clusters with active stars. The Sun's \activity index" would be approximately
the amplitude of its brightness changes due to the passage of sunspots across its disk,
which is approximately 2 mmag. The active stars analyzed here have activity indices six
to ten times larger. The median activity indices for the main sequence stars in each cluster
are three to �ve times larger than the Sun's.
The activity indices for active stars on the yearly timescale (Table 6.2 for all the
clusters except NGC 6819 are noticeably smaller than the activity indices on the nightly
timescale. The Sun's activity index on this timescale would be approximately 1 mmag;
the activity indices of the active stars are four to sixteen times larger. The activity indices
of the main sequence population are �ve to twelve times larger than the Sun's. However,
as the discussion in x 1.4 of models by Unruh et al. (2000) indicated, the inclinations of
the individual stars will a�ect the amplitudes of the long-term cycles by a factor of three
or more; if these stars were all observed with their poles perpendicular to the line of sight,
the activity indices could be reduced to levels much closer to the amplitude of the Sun's
solar cycle variability.
6.1.1 General Activity Level
In x 4.2.1, Figure 4.9, I plotted V versus B nightly mean magnitudes and V versus R
nightly mean magnitudes for main sequence and active stars in NGC 7789. Then I plotted
histograms of those distributions along the direction of the best �t line and perpendicular

210
to the best �t line, which can be seen in Figure 4.12. The histograms perpendicular
to the best �t line represent the noise in the nightly mean magnitude data, and the
histograms along the best �t line are the convolution of the actual activity amplitudes
and the noise; the results are in Table 4.4. I assumed that the distributions were Gaussian
and deconvolved the noise from the combination of signal and noise. I repeated this
procedure for the other clusters (see Figures 4.9, 4.10, 4.13, 4.14, 4.15, and Table 4.4).
Table 6.3 lists the FWHMs for the active and main sequence stars in each of the
clusters, determined from the deconvolution of the Gaussian noise from the signal and
noise distribution of the �V vs. �B and �V vs. �R plots. The relationship between
the FWHM and the RMS dictates that the FWHMs be approximatelyp2 larger than
the activity indices for the main sequence stars; the activity indices in Tables 6.1 and 6.2
con�rm that this is roughly the case.
The FWHMs of the active stars are all much larger than those of the main sequence
stars, as would be expected. The FWHMs of the active stars in NGC 6819 are smaller than
those of NGC 7789 and M67. This is re ected also in the median activity indices on the
nightly timescale in Table 6.1. The decreased activity index and FWHMs for NGC 6819
are why most of the cluster stars had signi�cance indices less than three and therefore
why the cluster has a much lower percentage of active stars than NGC 7789 and M67 on
the nightly timescale.
The FWHMs for the main sequence stars in the three younger clusters are all quite
similar for the �V vs. �B distributions, approximately 11 mmag. The FWHMs for
the �V vs. �R increase slightly with age. The FWHMs for the main sequence stars
in NGC 188 are considerably smaller, especially in the �V vs. �R population. The
FWHMs for the main sequence stars in the three younger clusters are also considerably
larger than the error FWHMs (see Table 4.4). This implies that many, if not most, of
the main sequence stars in the young clusters are active on the rotational timescale {
their amplitudes are simply too small to be detected individually here. As photometric

211
techniques improve, many of these stars will be found to be \active" in the sense I have
de�ned here: brightness uctuations signi�cantly larger than the measurement errors and
correlated between di�erent wavelengths; however, the amplitudes may be very small,
even smaller than the Sun's variability.
At what point is the amplitude of variability too small to be considered to be caused
by stellar activity? At the level of micromagnitudes, stars will vary in brightness due
to acoustic oscillations, although these uctuations are on the timescale of minutes and
should average out over the course of a night. Even so, as photometric precisions improve
to enable astronomers to uncover uctuations at amplitudes of less than 0.1%, virtually
all late-type stars will be found to be active. As more and more stars are classi�ed as
active, the stars will need to be categorized not by whether or not they are active, but by
the amplitude of the variability.
Cluster Age FWHM FWHM FWHM FWHM
(Gyr) �V vs �B, �V vs �B, �V vs �R, �V vs �R,Active Main Seq. Active Main Seq.
(mmag) (mmag) (mmag) (mmag)
NGC 7789 1.6 64.79 14.54 49.54 11.15NGC 6819 2.5 31.68 14.19 36.41 12.64
M67 4.0 57.33 17.05 64.30 16.78
NGC 188 7.0 ... 11.38 ... 6.60
Table 6.3: The Gaussian FWHMs for the nightly mean di�erential magnitudes for the
active and main sequence stars in each cluster, calculated as described in x 4.2.1.
6.1.2 Ensemble Error
The ensemble error was determined by �nding the o�set between �rms and �mean, as �rst
explained in x 3.3.1. I attributed this error to both intrinsic variability in the ensemble
stars and possibly unknown calibration errors. The decrease in the ensemble errors from
the Phase I to the Phase II analysis demonstrates the improvement in the photometry.
The decrease is especially apparent in NGC 6819, which is crowded, and NGC 188, which

212
was underexposed in Phase I. The decrease in the ensemble error is purely due to the
reduction of photometric noise by improved observing techniques and calibration; it is
unlikely that all the stars in the clusters would have been observed in less-active states
during Phase II.
Cluster Age �ens �ens(Gyr) Phase I Phase II
(mmag) (mmag)
NGC 7789 1.6 3.0 2.5
NGC 6819 2.5 6.0 1.5
M67 4.0 2.5 2.0
NGC 188 7.0 4.0 1.5
Table 6.4: The ensemble error compared to the age of the clusters.
Since the ensemble error is largely caused by the variance of the brightness of the
ensemble stars, it should be related to the activity indices; speci�cally, the ensemble error
should be roughlyp11 smaller than the activity indices (Tables 6.1 and 6.2), since the
minimum number of ensemble stars was eleven. The relative sizes of the ensemble error
follow the proportion of active stars: the ensemble errors for NGC 7789 and M67 are
somewhat larger and those for NGC 6819 and NGC 188 are smaller.
6.1.3 �v, Av, and �AvDistributions
How do the distributions of the signi�cance index, the activity index, and the error in the
activity index vary with V magnitude? First I will present the distributions for the Phase
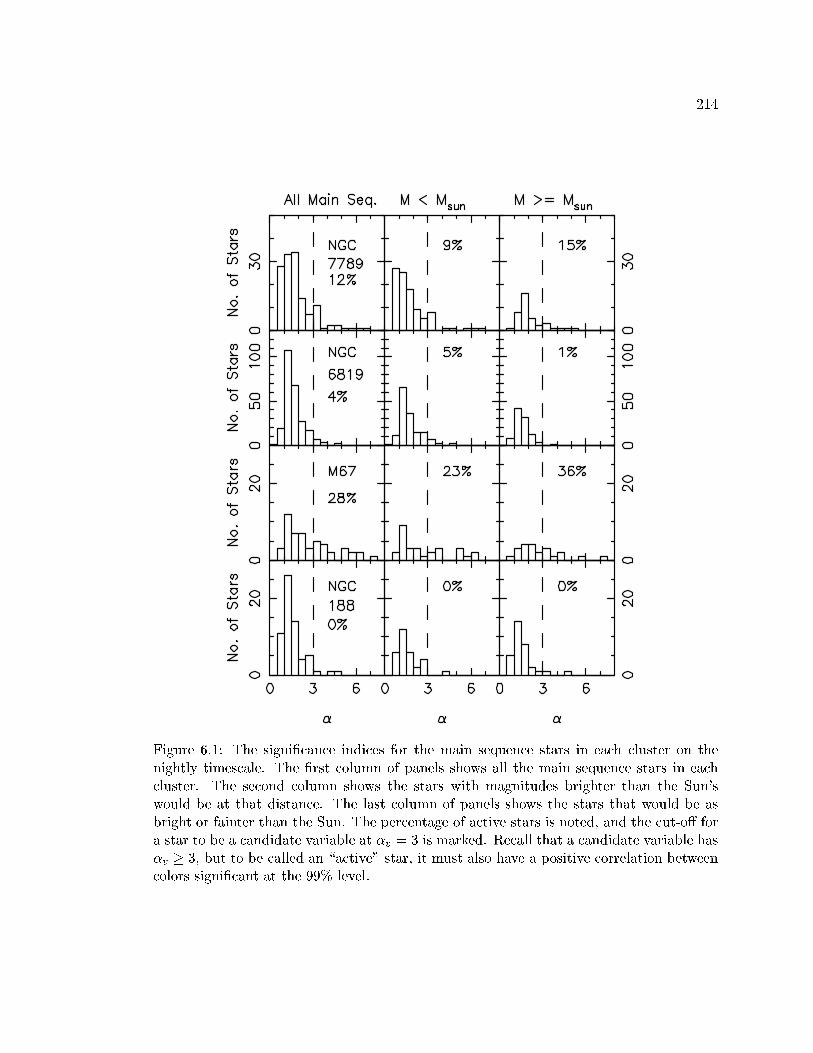
II data on the nightly timescale. Figure 6.1 shows histograms of the signi�cance as a
function of magnitude for the main sequence stars, and then divides the stars into groups
brighter and fainter than the Sun would be at the distance of each cluster. (One must keep
in mind that the value of the signi�cance index is not the only criterion for determining
if a star is active; the correlation coeÆcient between colors must also be positive and
signi�cant at a 99% level.) The percentage of active stars (using the additional correlation
coeÆcient test) in each panel is noted. All of the clusters show peaks in the signi�cance

213
index at �v � 1, which is not unexpected, since one would hope that for most of the stars,
the photometric uctuations are evenly matched by the photometric errors. There is a
signi�cant tail on each peak leading to higher values of the signi�cance index. This peak at
unity is obvious again in the panels for the stars brighter than the Sun; the distribution for
NGC 7789 also shows many stars falling just under �v � 1. For stars fainter (or as faint)
as the Sun, the peak is present, except for in the M67, which show a very large spread in
signi�cance indices. NGC 7789, NGC 6819, and NGC 188 show similar distributions for
each population of stars. The signi�cance indices in M67 are more dispersed.
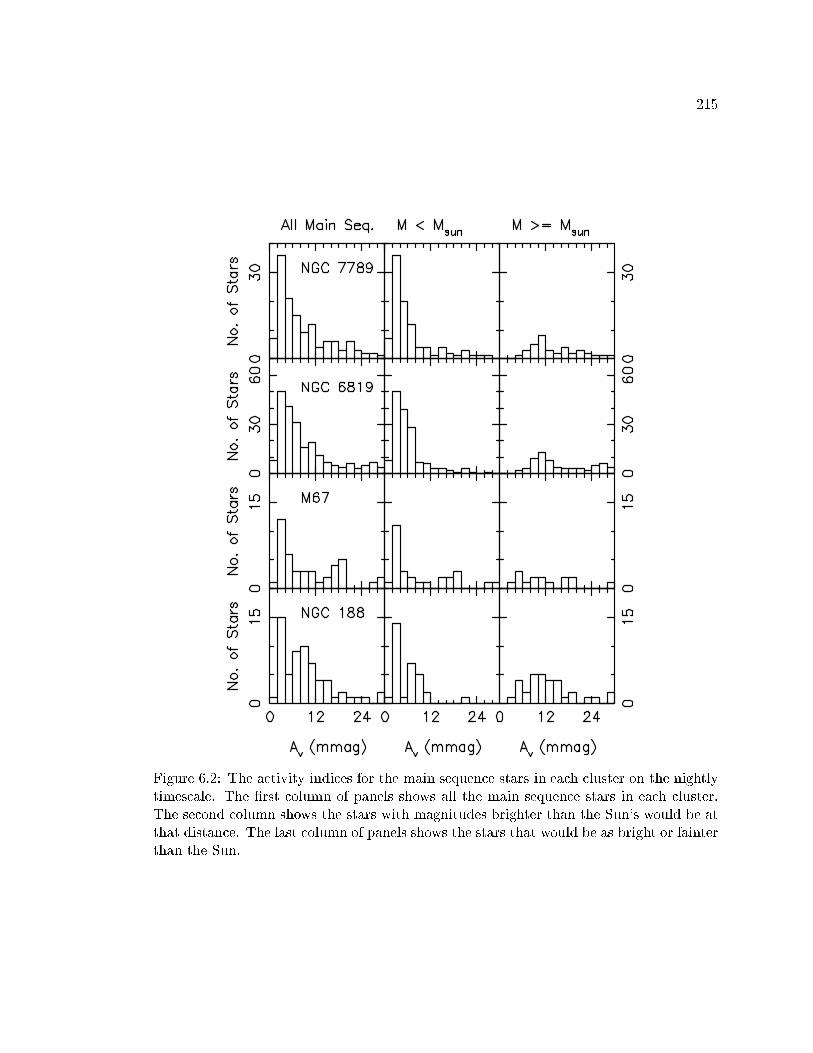
Figure 6.2 shows the activity index as a function of magnitude for each of the clusters,
with the stars again split into groups brighter and fainter than the Sun. These distributions
di�er from the signi�cance index. Each cluster has a peak between 2 and 4 mmag; recall
that the ensemble error for each cluster is approximately 2 mmag, so these peaks are
likely due to photometric noise. However, the distributions appear bimodal. Separating
the stars brighter and fainter than the Sun shows a small peak at Av � 12 mmag for
NGC 7789 and NGC 6819 for the stars fainter than the Sun. For these clusters, the stars
brighter than the Sun appear to have a single peak at approximately 3 mmag. The M67
stars have a second peak at approximately 18 to 20 mmag. The stars in this peak are split
between those brighter and fainter than the Sun. The distribution of activity indices in
NGC 188 also has two peaks, the second one at 8 - 10 mmag. This peak is evident in both
the stars brighter and fainter than the Sun, although it has shifted slightly lower for the
brighter stars and somewhat higher for the fainter stars. Is the high activity index peak
a real consequence of the stars' uctuations? If the peak is caused by noisy photometry,
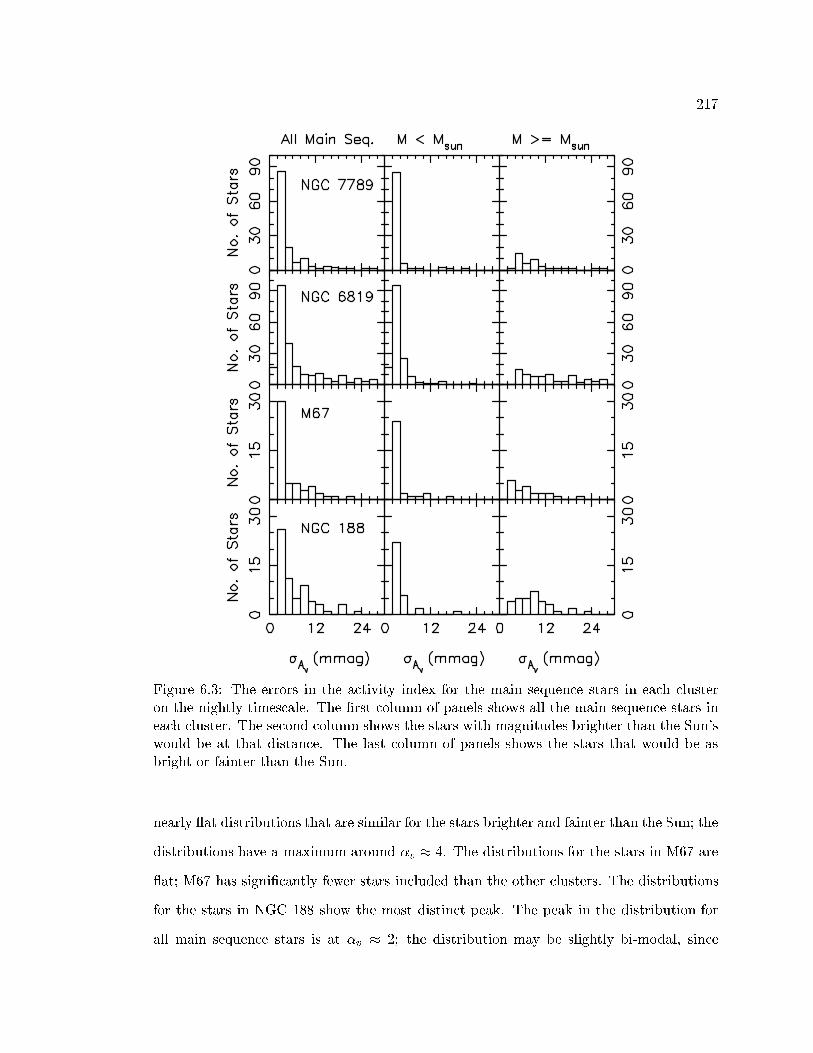
one would expect the error distribution to mirror the peak. The distribution of the error
in the activity index is shown in Figure 6.3.
The distribution of the error in the activity index is similar to that of the activity
index, except that it is not as strongly bi-modal. All of the distributions show large
peaks at 2 - 4 mmag, especially in the distribution for brighter stars. This is where the
214
Figure 6.1: The signi�cance indices for the main sequence stars in each cluster on the
nightly timescale. The �rst column of panels shows all the main sequence stars in each
cluster. The second column shows the stars with magnitudes brighter than the Sun's
would be at that distance. The last column of panels shows the stars that would be as
bright or fainter than the Sun. The percentage of active stars is noted, and the cut-o� for
a star to be a candidate variable at �v = 3 is marked. Recall that a candidate variable has
�v � 3, but to be called an \active" star, it must also have a positive correlation betweencolors signi�cant at the 99% level.
215
Figure 6.2: The activity indices for the main sequence stars in each cluster on the nightly
timescale. The �rst column of panels shows all the main sequence stars in each cluster.
The second column shows the stars with magnitudes brighter than the Sun's would be at
that distance. The last column of panels shows the stars that would be as bright or fainter
than the Sun.
216
ensemble error dominates the distribution, preventing any stars from having lower errors.
The distributions fall o� rapidly after these peaks. Are there analogous high-error peaks
for the high activity index peaks? The faint stars in NGC 7789 and NGC 6819 have a
at distribution of errors ranging from approximately 4 - 30 mmag. The faint stars in
M67 have a distribution slightly higher on the low end, but tailing o� to approximately
24 mmag. Only the faint stars in NGC 188 have a peak in the errors in about the same
location as the peak in the activity index. It is not clear why the errors in NGC 188
are noticeably higher than those in the other clusters, since the �eld was sparse and the
images were well-exposed.
Now I present similar plots for the active stars in the Phase II nightly data. NGC 188
had no active stars, so it is not included. Figure 6.4 shows the distributions of the sig-
ni�cance index. In this plot, the stars obviously must have �v � 3, since that was one
criterion for choosing them. However, in each of the clusters many of the stars have signif-
icance indices that fall just above this cut-o�. After this bin, the distribution attens out.
The small number of stars makes it diÆcult to assess the behavior of the distributions.
A more severe signi�cance index criterion in the determination of active stars would have
considerably decreased the number of active stars.
Figure 6.5 shows the distribution of the activity index for the active stars. This
distribution appears at for each of the clusters and each population. Figure 6.6 shows
the distribution of the error in the activity index. These distributions peak at about
3 mmag for each cluster. The distribution in M67 has a tail to higher errors; it is diÆcult
to tell if this tail exists for the younger clusters because there are so few active stars.
I present the distributions of the signi�cance index, the activity index, and the error in
the activity index for the data on the yearly timescale. Figure 6.7 shows the distribution of
the signi�cance index for main sequence stars. These stars are again split into populations
brighter than and fainter than the Sun. These distributions are much atter than those
on the nightly timescale. There is no peak at �v � 1. NGC 7789 and NGC 6819 show
217
Figure 6.3: The errors in the activity index for the main sequence stars in each cluster
on the nightly timescale. The �rst column of panels shows all the main sequence stars in
each cluster. The second column shows the stars with magnitudes brighter than the Sun's
would be at that distance. The last column of panels shows the stars that would be as
bright or fainter than the Sun.
nearly at distributions that are similar for the stars brighter and fainter than the Sun; the
distributions have a maximum around �v � 4. The distributions for the stars in M67 are
at; M67 has signi�cantly fewer stars included than the other clusters. The distributions
for the stars in NGC 188 show the most distinct peak. The peak in the distribution for
all main sequence stars is at �v � 2; the distribution may be slightly bi-modal, since

218
Figure 6.4: The signi�cance indices for the active stars in each cluster on the nightly
timescale. The �rst column of panels shows all the active stars in each cluster. The
second column shows the stars with magnitudes brighter than the Sun's would be at that
distance. The last column of panels shows the stars that would be as bright or fainter
than the Sun.
the distribution for the stars brighter than the Sun peaks about about three, but the
distribution for the stars fainter than the Sun peaks lower, at 1.5 - 2.
The distributions of the activity index are shown in Figure 6.8. These distributions
are markedly di�erent from those of the signi�cance index. Each of the clusters has a
peak in the distribution for the plots of all main sequence stars. For NGC 7789 and M67,
that peak is at approximately 2.5 mmag. For NGC 188 it is at nearly 5 mmag, and for
NGC 6819, it is approximately 7 mmag. For the three younger clusters, the peaks are
clearly attributable to the stars brighter than the Sun, whose distributions show the same

219
Figure 6.5: The activity indices for the active stars in each cluster on the nightly timescale.
The �rst column of panels shows all the active stars in each cluster. The second column
shows the stars with magnitudes brighter than the Sun's would be at that distance. The
last column of panels shows the stars that would be as bright or fainter than the Sun.
peaks. These clusters also have at distributions of the activity index for the stars fainter
than the Sun. However, both the bright stars and faint stars in NGC 188 show peaks in
the activity index distribution; the peak is at a slightly higher value for the fainter stars
than the brighter stars.
The stars fainter than the Sun in the three younger clusters (NGC 7789, NGC 6819,
and M67) show very di�erent ranges of activity indices than the stars brighter than the
Sun in the same cluster. While this might be attributable to errors, this seems unlikely
since the faint stars in NGC 188 do not show the same behavior. The stars brighter than
the Sun in all four clusters, as well as the stars fainter than the Sun in NGC 188, exhibit

220
Figure 6.6: The errors in the activity index for the active stars in each cluster on the
nightly timescale. The �rst column of panels shows all the active stars in each cluster.
The second column shows the stars with magnitudes brighter than the Sun's would be at
that distance. The last column of panels shows the stars that would be as bright or fainter
than the Sun.
primarily low-levels of activity on the yearly timescale. The fainter stars in the three
young clusters show a much wider range of activity.
The distribution of the errors in the activity index on the yearly timescale are shown
in Figure 6.9. The distributions are all quite similar. All clusters except NGC 6819 have
peaks below 2.5 mmag for their entire main sequence populations as well as for the stars
brighter than the Sun. The distributions of errors in NGC 6819 is similar, but is shifted
to slightly higher values so that it peaks at about 4 mmag. The stars fainter than the
Sun all show a broader distribution of errors, still strongly biased toward lower values.

221
Figure 6.7: The signi�cance indices for the main sequence stars in each cluster on the
yearly timescale. The �rst column of panels shows all the main sequence stars in each
cluster. The second column shows the stars with magnitudes brighter than the Sun's
would be at that distance. The last column of panels shows the stars that would be as
bright or fainter than the Sun. The percentage of active stars is noted, and the cut-o� for
a star to be a candidate variable at �v = 3 is marked. Recall that a candidate variable has
�v � 3, but to be called an \active" star, it must also have a positive correlation betweencolors signi�cant at the 99% level.

222
Figure 6.8: The activity indices for the main sequence stars in each cluster on the yearly
timescale. The �rst column of panels shows all the main sequence stars in each cluster.
The second column shows the stars with magnitudes brighter than the Sun's would be at
that distance. The last column of panels shows the stars that would be as bright or fainter
than the Sun.
NGC 6819 has higher errors due to its crowded �eld.
I next present similar plots for the stars that are active on the yearly timescale. M67
only has two active stars on this timescale, so it is not included. NGC 188 has �ve active
stars and is included in the plots. The distribution of signi�cance indices for NGC 7789 is
at for all populations. The distribution for the main sequence stars in NGC 6819 peaks at

223
Figure 6.9: The errors in the activity index for the main sequence stars in each cluster
on the yearly timescale. The �rst column of panels shows all the main sequence stars in
each cluster. The second column shows the stars with magnitudes brighter than the Sun's
would be at that distance. The last column of panels shows the stars that would be as
bright or fainter than the Sun.
approximately seven; this peak is seen again in the distribution for stars brighter than the
Sun. The distribution for stars fainter than the Sun is at. The distribution for NGC 188
is too sparse to comment upon, except to note that one star with a high signi�cance index
falls o� the plot.
Figure 6.11 shows the distribution of activity indices for the active stars in these three
224
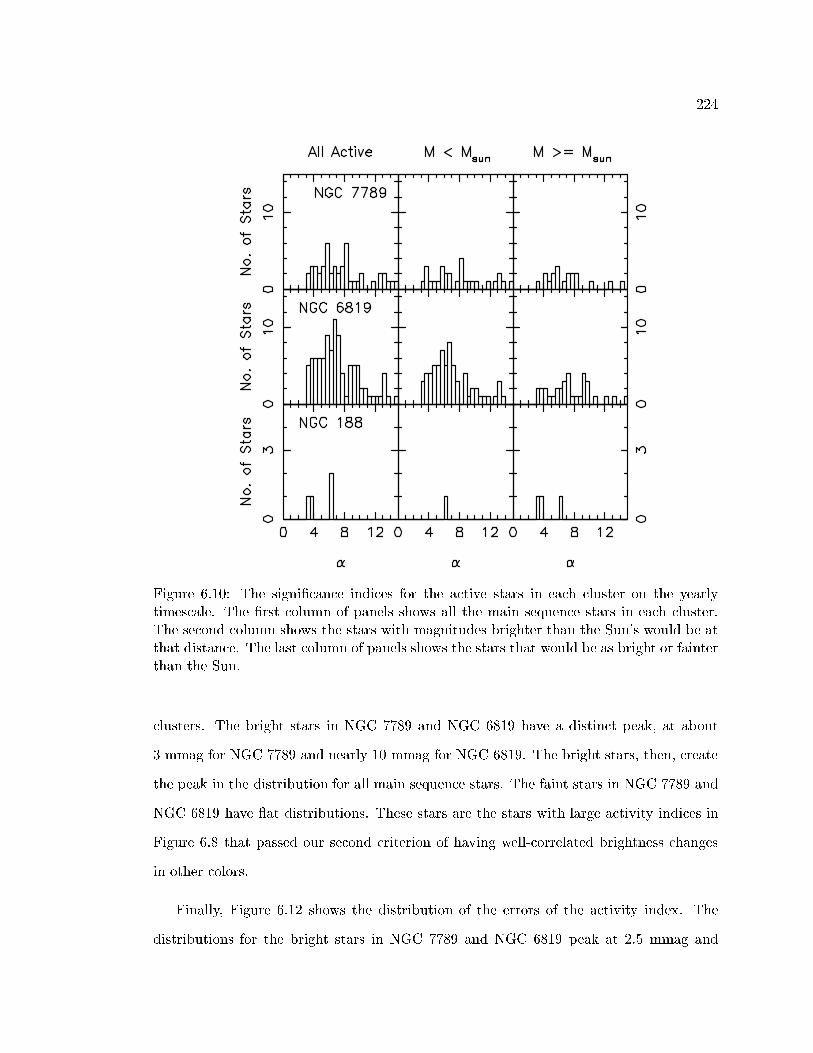
Figure 6.10: The signi�cance indices for the active stars in each cluster on the yearly
timescale. The �rst column of panels shows all the main sequence stars in each cluster.
The second column shows the stars with magnitudes brighter than the Sun's would be at
that distance. The last column of panels shows the stars that would be as bright or fainter
than the Sun.
clusters. The bright stars in NGC 7789 and NGC 6819 have a distinct peak, at about
3 mmag for NGC 7789 and nearly 10 mmag for NGC 6819. The bright stars, then, create
the peak in the distribution for all main sequence stars. The faint stars in NGC 7789 and
NGC 6819 have at distributions. These stars are the stars with large activity indices in
Figure 6.8 that passed our second criterion of having well-correlated brightness changes
in other colors.
Finally, Figure 6.12 shows the distribution of the errors of the activity index. The
distributions for the bright stars in NGC 7789 and NGC 6819 peak at 2.5 mmag and

225
Figure 6.11: The activity indices for the active stars in each cluster on the yearly timescale.
The �rst column of panels shows all the main sequence stars in each cluster. The second
column shows the stars with magnitudes brighter than the Sun's would be at that distance.
The last column of panels shows the stars that would be as bright or fainter than the Sun.
below. The faint stars have a atter distribution, which tails o� toward higher values for
NGC 6819. All of the active stars in NGC 188 have errors below 5 mmag.
I have presented the distributions of the signi�cance index, the activity index, and
the error in the activity index for the main sequence and active stars on both the nightly
and yearly timescales. On both timescales, the stars fainter than the Sun in NGC 7789,
NGC 6819, and possibly M67, show a much larger range of activity index with a much
higher average value. The faint stars in NGC 188 on the nightly timescale show similar
behavior; however, their errors are also much higher than those in the younger clusters,
which seems to cancel the e�ect. The faint stars in NGC 188 on the yearly timescale do

226
Figure 6.12: The error in the activity indices for the active stars in each cluster on the
yearly timescale. The �rst column of panels shows all the main sequence stars in each
cluster. The second column shows the stars with magnitudes brighter than the Sun's
would be at that distance. The last column of panels shows the stars that would be as
bright or fainter than the Sun.
not show the wider range of behavior.
In each of the analyses presented thus far, the most distinctive result is that NGC 188
is much less active than the other clusters. It lacks active stars on the nightly timescale.
The FWHMs of the distributions of the nightly mean di�erential magnitudes in each color
are much smaller for NGC 188. The histograms of the distributions of the signi�cance
indices, activity indices, and the errors all indicate that NGC 188 is much less active. The
three younger clusters have comparable levels of activity, given the di�erences in the time
span of the Phase II observations; the level of activity does not appear to decline with
227
age in these clusters. In particular, the stars in M67 seem more active than those in the
younger clusters on the nightly timescale, but less active on the yearly timescale.
6.2 Activity vs. Color
6.2.1 Correlation Between Activity Indices in Di�erent Colors
One of my criteria for selecting active stars was that the variability in di�erent colors
should be correlated. However, I did not require that the uctuations have the same
relative amplitude, only that the star increased or decreased in brightness through each
�lter simultaneously. Now I look at the activity indices calculated for the data through
each �lter to see if there are any correlations. The activity index was only calculated for
a star for a speci�c color if the star had at least �ve nights of observations through that
�lter. Figures 6.13 and 6.14 show the Av plotted versus Ab and Ar for the main sequence
stars and for the active stars, respectively.
The �gures show that the activity indices are indeed correlated between the colors, for
both the main sequence stars and the active stars. The correlation is obvious even at very
low values of the activity index, especially for the active stars. Lines were �t to the data
using least-squares �tting, and the slopes and �2� for each �t are listed in Table 6.5. The
high �2� indicates that the �ts are not highly signi�cant. For NGC 7789 and M67, the V-B
slopes are much larger than the V-R slopes, for both the active and main sequence stars.
For NGC 6819 and NGC 188, the slopes are less disparate between the colors. It should
be noted, however, that the activity indices for each color could be correlated if random,
unrelated uctuations occurred in each color on any of the nights used in the analysis.
These �gures therefore only serve as con�rmation of the expected correlation.
For the active stars, the V-B slopes are greater than unity, as I showed would be
expected due to stellar activity consisting of starspots or faculae in x 1.4. Similar behaviorwas noted in Str�omgren photometry of Mt. Wilson HK Project �eld stars (Lockwood, Ski�
& Radick 1997). Also, the slopes for V-B are much larger than the V-R slopes for the three

228
Figure 6.13: Av vs Ab and Av vs Ar for the main sequence stars in each cluster on the
nightly timescale. The slopes for the �tted lines can be found in Table 6.5.
younger clusters. The V-R slopes are less than unity for the active stars in NGC 7789
and M67, but greater than one for NGC 6819, although this is likely due to one star with
large activity indices.
I have examined the correlation between the activity indices of di�erent colors for the
annual data as well. The activity index was only calculated for the data through a speci�c
�lter if there were at least �ve seasons of observations through the �lter. This severely
limited the data. NGC 7789 and NGC 6819 had only suÆcient B and V data for the
229
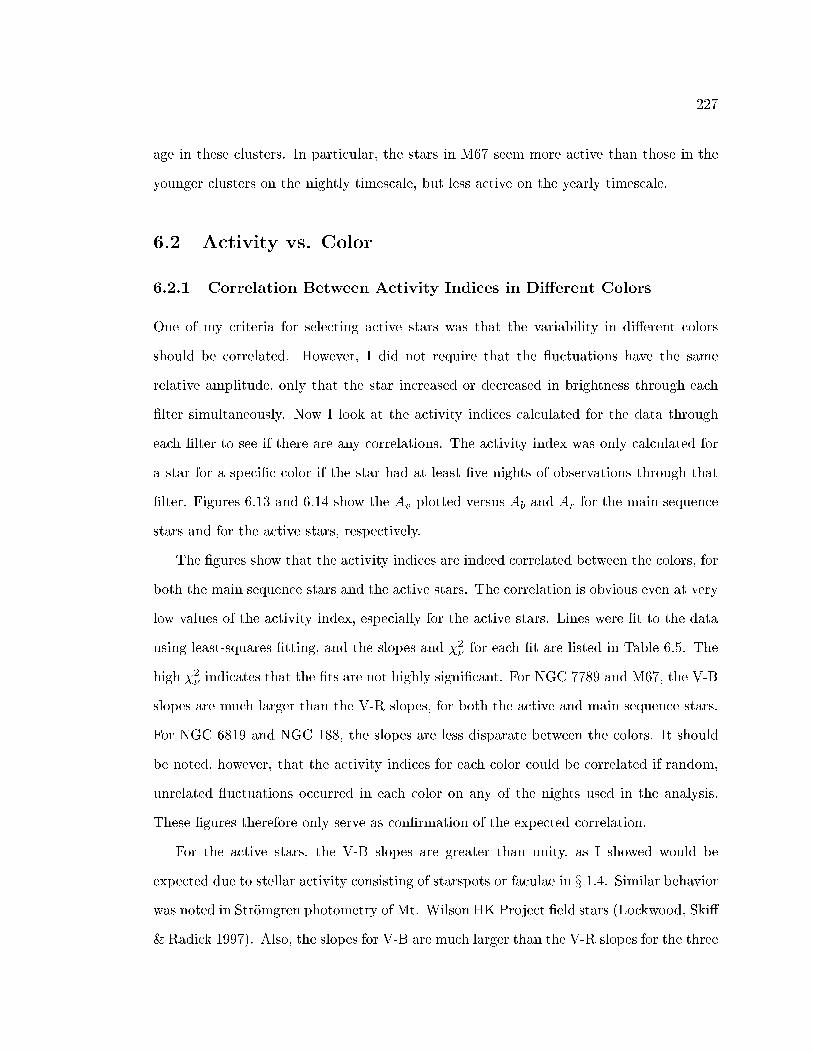
Figure 6.14: Av vs Ab and Av vs Ar for the active stars in each cluster on the nightly
timescale. The slopes for the �tted lines can be found in Table 6.5.
analysis. M67 had only suÆcient V and R data. NGC 188 had suÆcient B, V, and R
data. The activity indices are plotted in Figures 6.15 and 6.16 for the main sequence stars
and the active stars, respectively. The lines were �t by the least squares method and the
slopes and other �t results can be found in Table 6.6. As with the nightly data, the �ts
are not very signi�cant. The slope for NGC 7789 is obviously lowered by the inclusion of
a few outlying points.
The correlation between activity indices of di�erent colors is again obvious in the main
sequence data, but there is more scatter than in the nightly data, especially among the
NGC 188 stars. It is not clear whether the larger scatter is because of the real consequences
of the long-term variability in the stars or from the inclusion of the noisier Phase I data.

230
Cluster Age Plot Slope �2� # Points
(Gyr)
NGC 7789 1.6 Av vs Ab, Main Seq. 0.75 � 0.08 87 136
Av vs Ar, Main Seq. 0.47 � 0.03 14 136
Av vs Ab, Active 1.31 � 0.40 75 14 (15)
Av vs Ar, Active 0.66 � 0.28 35 14 (15)
NGC 6819 2.5 Av vs Ab, Main Seq. 0.96 � 0.03 58 249
Av vs Ar, Main Seq. 0.84 � 0.03 49 249
Av vs Ab, Active 1.54 � 0.08 54 9
Av vs Ar, Active 1.10 � 0.05 22 9
M67 4.0 Av vs Ab, Main Seq. 1.23 � 0.13 560 53
Av vs Ar, Main Seq. 0.49 � 0.04 63 53
Av vs Ab, Active 1.10 � 0.31 1600 15
Av vs Ar, Active 0.36 � 0.07 92 15
NGC 188 7.0 Av vs Ab, Main Seq. 0.47 � 0.08 15 62
Av vs Ar, Main Seq. 0.45 � 0.10 27 62
Table 6.5: Results of the line �ts to the data in Figures 6.13 and 6.14 for all clusters onthe nightly timescale. The lines were �t using the least squares method. The The last
column is the number of data points plotted in each panel of the �gure. The outlying
point at Av � 80 mmag for the NGC 7789 active stars was not included in the �t for the
active stars.
The active stars in NGC 7789 and NGC 6819 show a very strong correlation. Since only
�ve stars are active in NGC 188 it is not clear if the correlation is signi�cant; this is
con�rmation of the lack of activity in this cluster.
The B-V slopes for stars in NGC 7789 and NGC 6819 are again equal to or greater
than unity for both the main sequence and active stars. However, the B-V slopes for stars
in NGC 188 are less than one. The V-R slope for stars in M67 is much less than unity for
both the main sequence and active stars. A line was not �t to the active stars in NGC 188
since only �ve stars were active.
6.2.2 Distribution of �v, Av, and �Avby Spectral Type
As discussed in the Introduction, the amplitude of stellar activity should increase with
later spectral types and decrease with age. The thicker convection zones of later type
stars provide a stronger magnetic �eld, which in turn ampli�es the production of active
231
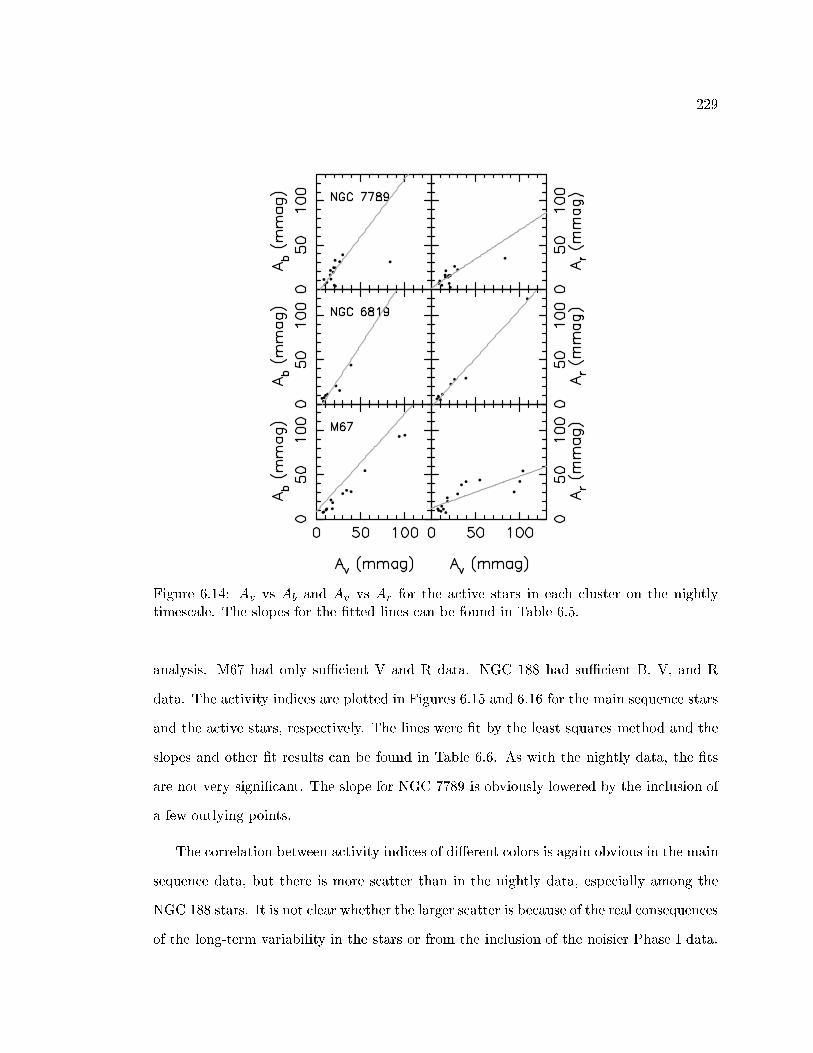
Figure 6.15: Av vs Ab and Av vs Ar for the main sequence stars in each cluster on the
yearly timescale. The slopes for the �tted lines can be found in Table 6.6. The activity
index was only calculated for a color if the star has at least three seasons of observations
through that �lter. NGC 7789 and NGC 6819 only have suÆcient B and V data. M67
only has suÆcient V and R data.
regions. However, as stars age, they spin down gradually, which decreases the vigor of
the magnetic dynamo. Can these e�ects be seen in the clusters studied here? Using the
reddening for each cluster (Table 2.1), I have split the active stars in each cluster into
spectral types.
The distribution of active stars on the rotational (nightly) timescale can be seen in

232
Figure 6.16: Av vs Ab and Av vs Ar for the active stars in each cluster on the yearly
timescale. The slopes for the �tted lines can be found in Table 6.6. The activity index
was only calculated for a color if the star has at least three seasons of observations through
that �lter. NGC 7789 and NGC 6819 only have suÆcient B and V data. M67 only had
one active star with suÆcient V and R data, so it was not plotted.
Figure 6.17. NGC 188 has no active stars at this timescale, so it is not included. Activity
due to rotation is found over a wide range of spectral types for each cluster. Late-G and
K stars in NGC 7789 do not show rotational activity, even though they were observed.
Few stars in NGC 6819 are rotationally active, and those few are primarily late-F. As
mentioned previously, the observations of NGC 6819 were spread over only three months,
which could have arti�cially altered the level of activity seen; the stars may not have had
enough time to change their activity states signi�cantly. M67 has a high fraction of active
stars, but far fewer stars were observed in the cluster, so this may be an e�ect of small

233
Cluster Age Plot Slope �2� # Points
(Gyr)
NGC 7789 1.6 Av vs Ab, Main Seq. 1.01 � 0.03 590 170
Av vs Ab, Active 0.95 � 0.16 210 48
NGC 6819 2.5 Av vs Ab, Main Seq. 0.83 � 0.08 100 361
Av vs Ab, Active 0.98 � 0.04 250 97
M67 4.0 Av vs Ar, Main Seq. 0.82 � 0.08 52 40
NGC 188 7.0 Av vs Ab, Main Seq. 0.23 � 0.07 57 61
Av vs Ar, Main Seq. 0.60 � 0.09 110 61
Table 6.6: Results of the line �ts to the data in Figure 6.15 for all clusters on the yearly
timescale. The lines were �t using the least squares method, which yields the slope and
the �2� of the �t. The last column is the number of data points plotted in each panel of
the �gure. The activity index was only calculated for the �lters through which a star had
at least �ve seasons of observations.
number statistics.
The late-F bin has relatively high fractions of active stars for each of the clusters;
observations of other star populations have noted the on-set of variability at this spectral
type (e.g., Lockwood, Ski� & Radick (1997), Radick, Ski� & Lockwood (1990), Radick
et al. (1987)). More interestingly, a relatively large fraction of active A and early-F type
stars were seen in NGC 7789 and a small number of active early-F type stars in NGC 6819.
Since stars of these types have little to no convective layer, they are not expected to show
variability due to stellar activity phenomenon. However, Stassun et al. (2002) observed
variability in stars of these spectral types in M67, at a level of 16 mmag. The A and early-
F stars observed in the clusters are at the main sequence turn-o�. Stars at the turn-o�
are undergoing structural changes that could have some photometric consequences.
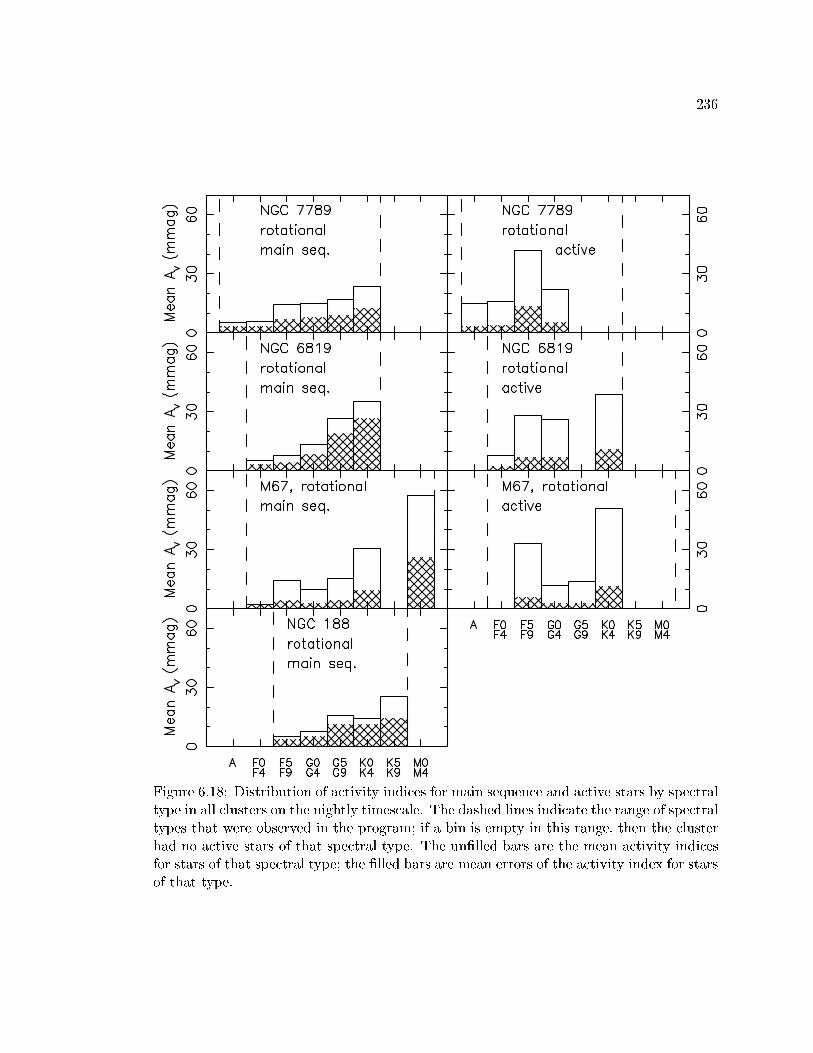
Figure 6.18 shows the distributions of activity indices and errors in the activity index
by spectral type. The un�lled bars are the mean activity indices in each spectral type
bin, and the cross-hatched bars are the mean errors in the activity index. The left panels
show all of the main sequence stars. The right panels show all the active stars. For the
main sequence stars the activity index generally increases with spectral type as would
be expected. The errors in the activity index also increase with spectral type. For the

234
Figure 6.17: Distribution of active stars by spectral type in all clusters on the nightly
timescale. The un�lled bars are the number of stars observed falling in the indicated
spectral type; the cross-hatched bars are the number of active stars of that type. The
percentage of active stars is noted above each bin.
active stars, the activity index is roughly at across the spectral types. The errors are
signi�cantly larger for the main sequence stars than the active stars.
The A and early F-type active stars have activity indices of 10 - 15 mmag, which is
surprisingly high considering the fact that these stars are usually considered non-variable.
The main sequence A and early F stars have activity indices of about 8 mmag. Nearby
�eld stars of these types have been found to be constant at the level of a few millimagni-
tudes (Lockwood, Ski� & Radick 1997), well below the level of the activity indices here.

235
Although Stassun et al. (2002) found variability in stars of these spectral types in M67,
those observations only had a time base suÆcient to analyze the rotational timescale.
The mean activity index for the early G active stars decreases from approximately
25 mmag in NGC 7789 and NGC 6819 to about 12 mmag in M67. In the main sequence
stars, the activity index is about 18 mmag in NGC 7789 and falls to about 9 mmag in
NGC 188. The Sun's rotational variability is about six times smaller than the active stars
in NGC 188, and about four times smaller than the main sequence stars in NGC 188.
Now I consider the distribution of activity by spectral type on the annual timescale.
The distribution of the percentage of active stars on the annual timescale can be seen in
Figure 6.19. NGC 7789 and NGC 6819 have active stars over the entire range of spectral
types observed in the clusters. As on the rotational timescale, a relatively large fraction
of A and early F stars are active in these two clusters. M67 only has two active stars, and
both fall in the late F spectral type. The �ve active stars in NGC 188 fall in the G and
K types.
Figure 6.20 shows the distributions of activity indices and errors in the activity index
by spectral type for the yearly data. The un�lled bars are the mean activity indices in each
spectral type bin, and the cross-hatched bars are the mean errors in the activity index.
The left panels show all of the main sequence stars. The right panels show all the active
stars. As in the rotational data, the activity index generally increases with spectral type.
The errors also increase with spectral type, although the errors are not as large relative
to the activity index as they were in the rotational data. This is partly because I did not
include an ensemble error in the calculation of the error in the activity index.
The increase in the activity index is much more gradual for the main sequence stars in
NGC 7789 and NGC 188 than it is for NGC 6819 and M67. The activity indices increase
more rapidly with spectral type for the active stars in NGC 6819 than in NGC 7789 as well.
M67 only has two active stars, which are both late F. The �ve active stars in NGC 188
show increasing activity indices with spectral type.
236
Figure 6.18: Distribution of activity indices for main sequence and active stars by spectral
type in all clusters on the nightly timescale. The dashed lines indicate the range of spectral
types that were observed in the program; if a bin is empty in this range, then the cluster
had no active stars of that spectral type. The un�lled bars are the mean activity indices
for stars of that spectral type; the �lled bars are mean errors of the activity index for stars
of that type.

237
Figure 6.19: Distribution of active stars by spectral type in all clusters on the annual
timescale. The un�lled bars are the number of stars observed falling in the indicated
spectral type; the cross-hatched bars are the number of active stars of that type. The
percentage of active stars is noted above each bin.
238
The A and early F-type active stars have activity indices of 4 - 8 mmag in NGC 7789
and nearly 20 mmag in NGC 6819. The activity indices of these stars on the main sequence
are similar. These values of the activity index are comparable to those of the activity index
for the same spectral type on the rotational timescale.
6.3 Comparison to Other Solar-Type Stars
In Chapter 1, I reviewed the amplitudes of activity measured through the V �lter for other
solar-type stars (Figure 1.1). Now I can add the mean activity indices for the G stars in
clusters studied here. The activity indices are an RMS value of the variability; if we have
sampled the full range of variability in a star, then the RMS of the uctuations will be an
underestimate of the amplitude. The sparseness of the data leave me with little choice,
however, so I have added the activity indices as amplitudes in the plot. The non-detection
of rotational activity for NGC 188 was plotted using the ensemble error (1.5 mmag) as an
upper limit. The non-detection of annual activity for G stars in M67 was plotted using
the average error of the activity index for G stars as an upper limit. Figure 6.21 shows
the resulting distribution of activity with age. The averages for the clusters studied here
are marked with triangles; the error bars are the mean errors in the activity indices. The
references for the other data points are listed in Tables 1.1 and 1.2. On the rotational
timescale, the average activity indices for NGC 7789, NGC 6819, and M67 �t in well with
the activity levels of the other stars. An upper envelope of activity that decreases with
age is evident. A similar envelope is seen in the yearly data.
The addition of the mean activity indices for the clusters studied here to the annual
activity plot doubles the number of measurements of long-term activity for solar-type
stars older than 1 Gyr. The mean activity index for NGC 6819 is much higher than any
of the others, even considering the error bars. The cause of the very high activity index
is unknown.
How do these activity levels on the rotational and yearly timescales �t in with the

239
Figure 6.20: Distribution of activity indices for main sequence and active stars by spectral
type in all clusters on the yearly timescale. The dashed lines indicate the range of spectral
types that were observed in the program; if a bin is empty in this range, then the cluster
had no active stars of that spectral type. The un�lled bars are the mean activity indices
for stars of that spectral type; the �lled bars are mean errors of the activity index for stars
of that type.

240
Figure 6.21: Age versus activity amplitudes on the rotational and yearly timescales for
clusters studied here and other solar type stars. The clusters studied here are marked
with triangles. The errorbars are the mean errors in the activity indices for the G stars.
On the rotational timescale, NGC 188 is given as an upper limit of 1.5 mmag; on the
yearly timescale, M67 is given as an upper limit of 1.1 mmag. The references for the other
observations are listed in Tables 1.1 and 1.2.
expected relation that the activity is proportional to t�1=2, where t is the age of the stars,
as �rst proposed by Skumanich (1972)? This relation was determined by the rotational
activity of stars; it is not clear whether it is or should be applicable to the yearly variability
caused by stellar activity. I have �t a power law of the form:
�V = btp; (6.1)
where �V is the amplitude of the activity in millimagnitudes, t is the age of the star in
years, and b and p are the quantities to be �t. In the usual procedure the logarithm is
taken of the data so that a line may be �t. The results of the least square �ts can be seen
in the log-log plots in Figure 6.22, and the �t results are listed in Table 6.7.

241
Figure 6.22: The lines are least square �ts to the log of the ages of the stars versus the
log of the amplitude of activity in mmags. Error bars are shown on the activity indices
determined for the program clusters. NGC 188 is shown as an upper limit on the rotational
timescale, and M67 is shown as an upper limit on the yearly timescale.
The �t to the rotational data has a slope of �0:40 � 0:11, close to the canonical
value of �0:50. The �t has a correlation coeÆcient of 0:73, which has greater than 99%
signi�cance. If I include the non-detection of rotational variability in NGC 188 as an
amplitude of 1.5 mmag (equal to the ensemble error for NGC 188) at that age, then the
slope becomes �0:48 � 0:12; this �t also has greater than 99% signi�cance. Thirty-four
G stars were observed at least �ve nights in NGC 188 during Phase II, but none were
active; the mean activity index of stars of this type was over 10 mmag, indicating that I
should have been able to detect the variability if it was present. Therefore, including the
non-detection is justi�ed.
The �t to the annual data has a slope of �0:88 � 0:26, somewhat similar to the
Skumanich relation. The correlation coeÆcient for the �t is 0:75, which is 99% signi�cant.

242
Data Set p b r �2� # Points Signi�cance
rotational -0.40 � 0.11 104:85�0:99 0.73 0.11 13 99% signi�cant
rotational, -0.48 � 0.12 105:47�1:03 0.76 0.14 14 99% signi�cant
nondetection
annual -0.88 � 0.26 109:26�2:33 0.75 0.18 11 99% signi�cant
annual, -1.01 � 0.26 1010:37�2:37 0.77 0.21 12 99% signi�cant
nondetection
Table 6.7: Results of the least square �ts to the activity amplitude versus age. The �ts
listed �rst for the rotational and annual data are shown in Figure 6.22. The second �ts
listed include the non-detection of rotational variability for G stars in NGC 188 and thenon-detection of annual variability for G stars in M67.
Including the non-detection of variability on this timescale for M67, using the error in
the activity index for the G stars (1.4 mmag), alters the slope to �1:01 � 0:26 and the
correlation coeÆcient to 0:77, which is signi�cant at the 99% level. Thirteen G stars
were observed in M67 and were not found to be variable on the long term timescale. Also,
almost no stars of any type were found to be active, which indicates that the non-detection
for the G stars is not a uke. This power law is not as similar to the Skumanich relation,
although since Skumanich's original relation was based on measurements of chromospheric
activity on the rotational timescale, it may not be applicable on the long-term timescale.
Some comments must be made about these �ts. I have included data from the literature
which were originally obtained using di�erent observing techniques, equipment, and data
analysis. The data points on the rotational plot and a few points on the yearly plot
are averages of amplitudes of the active stars found in each population. However, the
detection thresholds for each analysis are not the same, so some points may be higher
because of a relatively high detection threshold so that only the most active stars were
discovered. Many of the data points on the yearly plot represent observations of single
stars; it is possible that these stars are not typical of other stars of the same age. Finally,
I have included the Sun's observed amplitudes in the �ts, despite the fact that I would
not be able to detect activity at the level of the Sun's activity in this project.
The activity indices for the G stars on the rotational timescale mesh well with the
243
amplitudes for other solar-type stars in the literature. A �t to the amplitudes as a function
of age including the data for the three young clusters yields a slope of �0:4� 0:11, similar
to the Skumanich relation. Including the non-detection of activity in NGC 188 alters
the �t to match the Skumanich relation even more closely, with a slope of �0:48 � 0:12.
The activity indices for G stars on the annual timescale doubles the number of known
measurements for stars older than 1 Gyr. With the inclusion of the non-detection of
activity in M67, a power law of �1:01 � 0:26 is found to a �t of the amplitudes as a
function of age, which is much steeper than the Skumanich relation.
6.4 Rotation Periods
The Phase II data were too sparse to be able to detect any rotation periods for the stars
in any of the clusters. I analyzed the power spectra of the nightly mean magnitude data
for the main sequence stars in the same manner as for the Phase I data (see x 3.3.3), butfound no sensible periods for any of the stars. This result is not unexpected, because of
the combination of the stars' expected rotation periods and the evolution of the active
regions on the stars. As discussed in x 1.4, the rotation periods should range from about
12 days in NGC 7789 to over 30 days in NGC 188. Our Phase II data would generally
have few data points during one rotation period, when the active regions are not likely to
change signi�cantly. However, during the time between the observing runs, perhaps four
to six weeks, the active regions will probably have evolved enough to have signi�cantly
altered the lightcurves for the stars so that the phase or amplitude has changed. More
closely-spaced observations are needed to determine rotation periods for these stars.
6.5 Long Term Trends
The �nal goal of the project was to determine if any long term trends reminiscent of the
solar cycle could be seen in the data. As was seen in many of the individual lightcurves

244
plotted in previous chapters, a substantial minority of stars display long term trends that
are well-correlated among di�erent colors. The amplitude of the Sun's long term variability
is very small, but that is apparently not true for all solar-type stars.


![6819 BT Freestyle 7110 [1]](https://img.pdfslide.us/doc/110x75/61937a87410d5970372554ae/6819-bt-freestyle-7110-1.jpg)