Embed Size (px)
Citation preview
DRAFT
Sedflume Consolidation Analysis
Passaic River, New Jersey
Prepared for:
Hydroqual, Inc.
and
U.S. Environmental Protection Agency
Prepared by:
Sea Engineering, Inc.
200 Washington Street, Suite 210
Santa Cruz, CA 95060
Tel: (831) 421-0871
Fax: (831) 421-0875
DRAFT Sedflume Consolidation Report
Passaic River, New Jersey
Sea Engineering, Inc.
1
Executive Summary Sea Engineering, Inc. (SEI) conducted a Sedflume analysis on four consolidation cores
created from sediment at Passaic River Site, New Jersey. The primary goal of this work
was to characterize the consolidation characteristics of sediment at the Passaic River Site.
The Sedflume analysis determines sediment erosion rates, critical shear stress, particle
size and bulk density. The following is a brief description of the four consolidation
cores.
• Core P1D was a 1 day consolidation core. The core consisted of fluidic gray silt
surface layer over gray silt. Very fine organic material (including leaves, small
sticks and shells) was observed at the surface and throughout core. Mean grain
size is 22.42 µm (silt).
• Core P7D was a 7 day consolidation core. The core consisted gray silt. Very fine
organic material (including leaves, small sticks and shells) were present at the
surface. Organic material was observed down core. Mean grain size was 23.22
µm (silt).
• Core P17D was a 17 day consolidation core. The core consisted of layer of light
gray silt, over gray silt with pockets of black sediment. Very fine material
(including leaves, roots, small sticks and shells) was observed at the surface and
throughout core. Gas bubbles were also observed down core. At 5 cm an anoxic
decay odor was detected that remained down core. The mean grain size was
24.09 µm (silt).
• Core P28D was a 28 day consolidation core. The core consisted of consisted of a
layer of light gray silt over gray silt with pockets of black sediment. Very fine
organic material (including leaves, small sticks, and shells) was observed at the
surface and throughout core. Gas bubbles were also observed down core. At 5
cm an anoxic decay odor was detected that remained down core. The mean grain
size was 25.22 µm (silt).
DRAFT Sedflume Consolidation Report
Passaic River, New Jersey
Sea Engineering, Inc.
2
Introduction
Sea Engineering, Inc. (SEI) conducted a Sedflume analysis for HydroQual on four
consolidation cores created from sediment at Passaic River Site, New Jersey. The
primary goal of this work was to characterize the consolidation characteristics of
sediment at the Passaic River Site. Surface sediment was collected at a location that has
been identified as depositional for fine material in the Lower Passaic River (LPR). The
material was mixed together (i.e. composited) and reconstructed into four laboratory
Sedflume cores. The four reconstructed cores will be evaluated to determine the effects
of consolidation on erosion rates and sediment density over time. A core from the batch
was tested in the Sedflume at 1-day, 7-days, 17-days, and 28-days to determine the
effects of consolidation on the stored sediments. The Sedflume analysis determines
sediment erosion rates, critical shear stress, particle size and bulk density. In addition,
each core was sub-sampled at vertical intervals to determine sediment bulk density and
particle size distribution. Critical shear stresses were determined through two
interpolation techniques for each vertical interval sampled. The following report outlines
the procedures used in the Sedflume analysis, presents the Sedflume data, and provides a
description of the results.
Experimental Procedures
A detailed description of Sedflume and its application are given in McNeil et al (1996)
and Roberts et al (1998). The following section provides a general description of the
Sedflume analysis conducted for this study.
Description of Sedflume
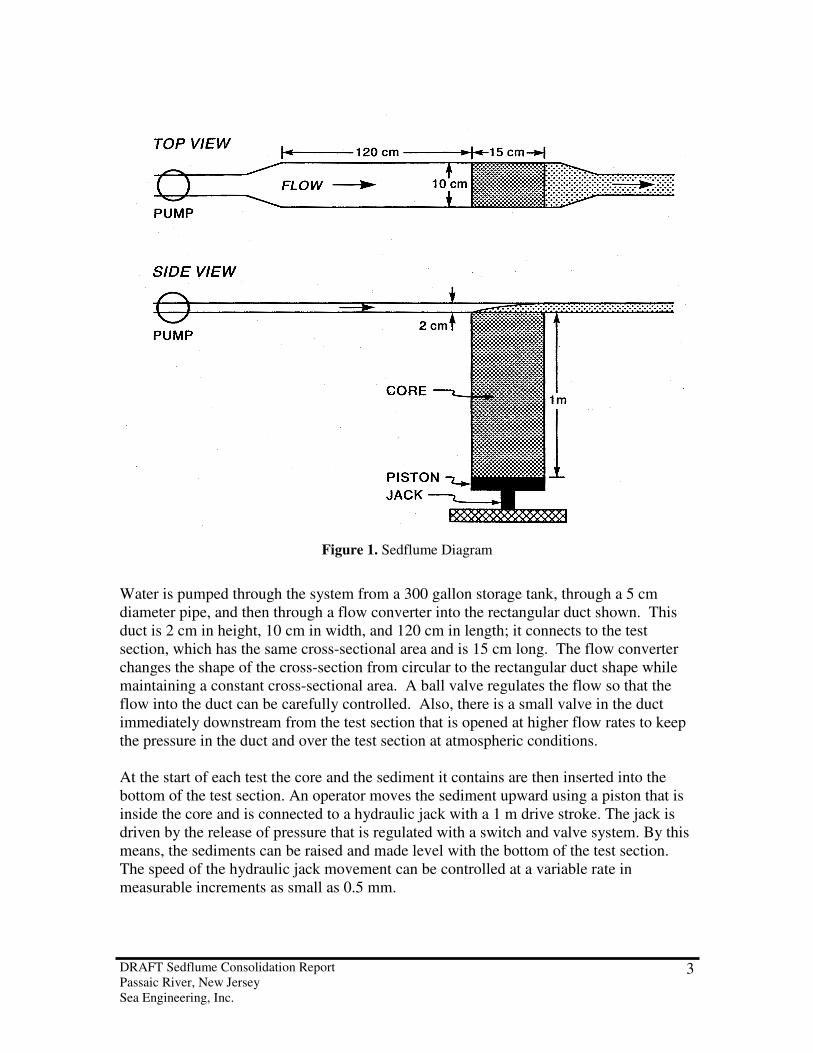
Sedflume is shown in Figure 1 and is essentially a straight flume that has a test section
with an open bottom through which a rectangular cross-section core containing sediment
can be inserted. The main components of the flume are the core; the test section; an inlet
section for uniform, fully-developed, turbulent flow; a flow exit section; a water storage
tank; and a pump to force water through the system. The coring tube, test section, inlet
section, and exit section are made of clear acrylic so that the sediment-water interactions
can be observed. The coring barrel has a rectangular cross-section, 10 cm by 15 cm, and
can be up to 1 m in length.
DRAFT Sedflume Consolidation Report
Passaic River, New Jersey
Sea Engineering, Inc.
3
Figure 1. Sedflume Diagram
Water is pumped through the system from a 300 gallon storage tank, through a 5 cm
diameter pipe, and then through a flow converter into the rectangular duct shown. This
duct is 2 cm in height, 10 cm in width, and 120 cm in length; it connects to the test
section, which has the same cross-sectional area and is 15 cm long. The flow converter
changes the shape of the cross-section from circular to the rectangular duct shape while
maintaining a constant cross-sectional area. A ball valve regulates the flow so that the
flow into the duct can be carefully controlled. Also, there is a small valve in the duct
immediately downstream from the test section that is opened at higher flow rates to keep
the pressure in the duct and over the test section at atmospheric conditions.
At the start of each test the core and the sediment it contains are then inserted into the
bottom of the test section. An operator moves the sediment upward using a piston that is
inside the core and is connected to a hydraulic jack with a 1 m drive stroke. The jack is
driven by the release of pressure that is regulated with a switch and valve system. By this
means, the sediments can be raised and made level with the bottom of the test section.
The speed of the hydraulic jack movement can be controlled at a variable rate in
measurable increments as small as 0.5 mm.
DRAFT Sedflume Consolidation Report
Passaic River, New Jersey
Sea Engineering, Inc.
4
Water is forced through the duct and the test section over the surface of the sediments.
The shear produced by this flow causes the sediments to erode. As the sediments in the
core erode, they are continually moved upward by the operator so that the sediment-water
interface remains level with the bottom of the test and inlet sections. The erosion rate is
recorded as the upward movement of the sediments in the coring tube over time.
Sedflume Core Preparation
In situ sediment collection was done by Malcolm Pirnie, Inc. Fifteen gallons of
sediment were collected from the top 15 cm of the sediment bed. These sediments were
shipped in buckets to the SEI Santa Cruz, Ca laboratory. The sediments were composited
with water in the SEI laboratory and poured into 4 prepared core barrels. Sediment cores
of 40 - 50 cm in length were reconstructed by this method. Cores were immediately
visually inspected for length and quality. Approved cores were capped and stored in the
laboratory for 1, 7, 17, or 28 days depending on the test to be performed on that core. Dr.
Craig Jones was responsible for corrective action regarding sample method requirements.
All physical bulk properties for each sediment mixture remain constant except for bulk
density. Particle size was sampled in each core to ensure no significant variation among
cores. Bulk density as a function of depth was measured periodically during the test and
cores were tested in the Sedflume for erosion rates over a range of shear stresses.
Measurements of Sediment Erosion Rates
The procedure for measuring the erosion rates of the sediments as a function of shear
stress and depth were as follows. The sediment core was inserted into the Sedflume test
section using the hydraulic jack until the sediment surface was even with the bottom of
the Sedflume channel. A measurement was made of the core length. The flume was then
run at a specific flow rate corresponding to a particular shear stress (McNeil et al., 1996).
Erosion rates are obtained by measuring the core length at different time intervals, taking
the difference between each successive measurement, and dividing by the time interval as
shown in Equation 1:
T
zE
∆= (1)
E = Erosion rate
∆z = Amount of sediment eroded
T = Time
In order to measure erosion rates at several different shear stresses using only one core,
the following procedure was used. Starting at a low shear stress, the flume was run
sequentially at higher shear stresses with each succeeding shear stress being twice the
previous one. Generally about four shear stresses are run sequentially. Each shear stress
was run until at least 1 to 2 mm but no more than 2 cm were eroded for that shear stress.
The time interval was recorded for each run with a stopwatch. The flow was then
increased to the next shear stress, and so on until the highest shear stress was run. This
cycle was repeated until all of the sediment had eroded from the core. If after three
cycles a particular shear stress showed a rate of erosion less than 10-4
cm/s, it was
DRAFT Sedflume Consolidation Report
Passaic River, New Jersey
Sea Engineering, Inc.
5
dropped from the cycle; if after many cycles the erosion rates decreased significantly, a
higher shear stress was included in the cycle.
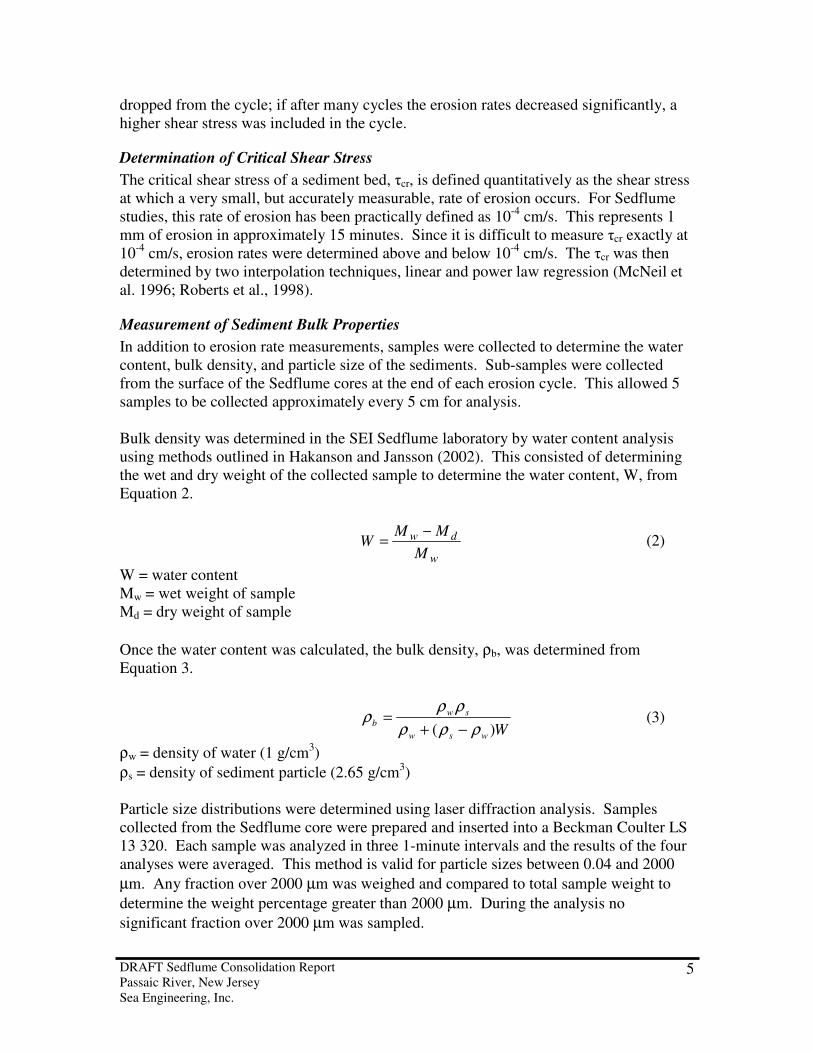
Determination of Critical Shear Stress
The critical shear stress of a sediment bed, τcr, is defined quantitatively as the shear stress
at which a very small, but accurately measurable, rate of erosion occurs. For Sedflume
studies, this rate of erosion has been practically defined as 10-4
cm/s. This represents 1
mm of erosion in approximately 15 minutes. Since it is difficult to measure τcr exactly at
10-4
cm/s, erosion rates were determined above and below 10-4
cm/s. The τcr was then
determined by two interpolation techniques, linear and power law regression (McNeil et
al. 1996; Roberts et al., 1998).
Measurement of Sediment Bulk Properties
In addition to erosion rate measurements, samples were collected to determine the water
content, bulk density, and particle size of the sediments. Sub-samples were collected
from the surface of the Sedflume cores at the end of each erosion cycle. This allowed 5
samples to be collected approximately every 5 cm for analysis.
Bulk density was determined in the SEI Sedflume laboratory by water content analysis
using methods outlined in Hakanson and Jansson (2002). This consisted of determining
the wet and dry weight of the collected sample to determine the water content, W, from
Equation 2.
w
dw
M
MMW
−= (2)
W = water content
Mw = wet weight of sample
Md = dry weight of sample
Once the water content was calculated, the bulk density, ρb, was determined from
Equation 3.
Wwsw
sw
b)( ρρρ
ρρρ
−+= (3)
ρw = density of water (1 g/cm3)
ρs = density of sediment particle (2.65 g/cm3)
Particle size distributions were determined using laser diffraction analysis. Samples
collected from the Sedflume core were prepared and inserted into a Beckman Coulter LS
13 320. Each sample was analyzed in three 1-minute intervals and the results of the four
analyses were averaged. This method is valid for particle sizes between 0.04 and 2000
µm. Any fraction over 2000 µm was weighed and compared to total sample weight to
determine the weight percentage greater than 2000 µm. During the analysis no
significant fraction over 2000 µm was sampled.

DRAFT Sedflume Consolidation Report
Passaic River, New Jersey
Sea Engineering, Inc.
6
Table 1 summarizes all measurements conducted during the Sedflume analysis.
Table 1. Parameters measured and computed for the Passaic River Site.
Measurement Definition Units Detection Limit Bulk Density, ρb
(wet/dry weight) W
wsw
sw
b)( ρρρ
ρρρ
−+=
g/cm3
Same as water
content
Water Content
w
dw
M
MMW
−=
unit less 0.1g in sample
weight ranging from
10 to 50 g
Particle Size
Distribution
Distribution of particle sizes by
volume percentage using laser
diffraction
µm 0.04 µm – 2000 µm
Erosion Rate E = ∆z/T cm/s ∆z > 0.5mm
T > 15s
Critical Shear Stress
τcr
Shear stress when erosion rate
equals 10-4
cm/s
N/m2 0 to 10.0 N/m
2
This value is
interpolated as
described in the text.
W = water content
Mw = wet weight of sample
Md = dry weight of sample
∆z = amount of sediment eroded
T = time
ρw = density of water (1 g/cm3)
ρs = density of sediment (2.65 g/cm3)
DRAFT Sedflume Consolidation Report
Passaic River, New Jersey
Sea Engineering, Inc.
7
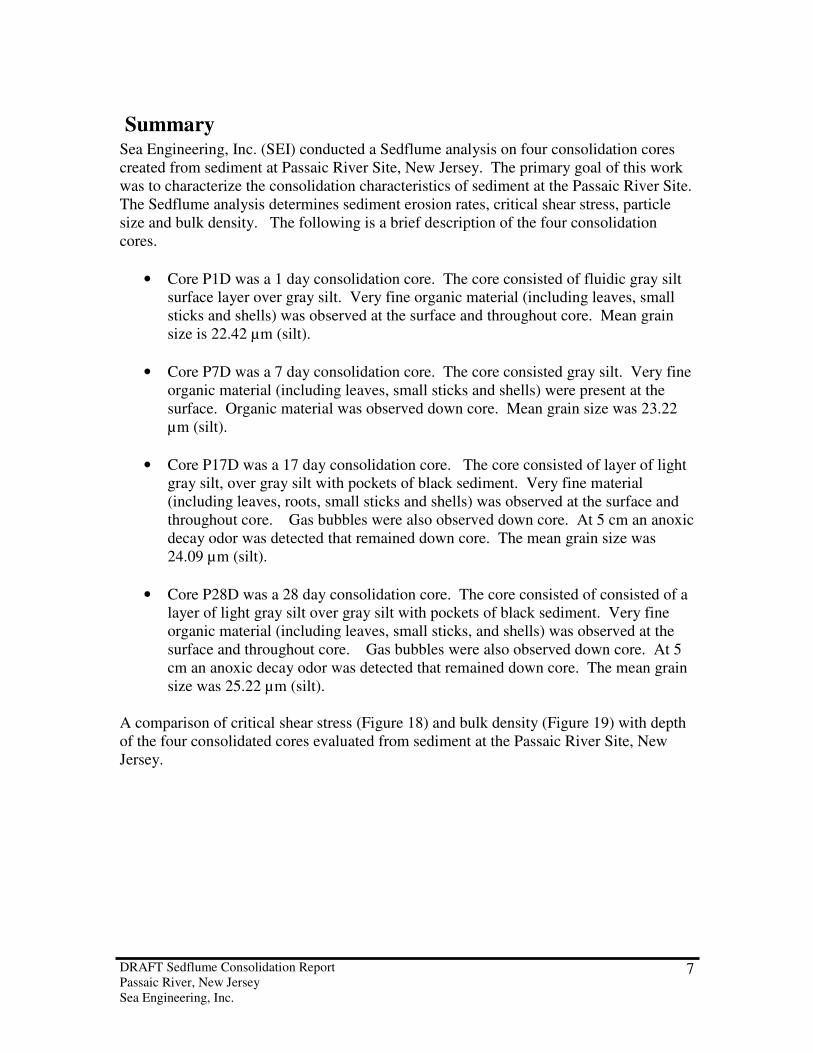
Summary Sea Engineering, Inc. (SEI) conducted a Sedflume analysis on four consolidation cores
created from sediment at Passaic River Site, New Jersey. The primary goal of this work
was to characterize the consolidation characteristics of sediment at the Passaic River Site.
The Sedflume analysis determines sediment erosion rates, critical shear stress, particle
size and bulk density. The following is a brief description of the four consolidation
cores.
• Core P1D was a 1 day consolidation core. The core consisted of fluidic gray silt
surface layer over gray silt. Very fine organic material (including leaves, small
sticks and shells) was observed at the surface and throughout core. Mean grain
size is 22.42 µm (silt).
• Core P7D was a 7 day consolidation core. The core consisted gray silt. Very fine
organic material (including leaves, small sticks and shells) were present at the
surface. Organic material was observed down core. Mean grain size was 23.22
µm (silt).
• Core P17D was a 17 day consolidation core. The core consisted of layer of light
gray silt, over gray silt with pockets of black sediment. Very fine material
(including leaves, roots, small sticks and shells) was observed at the surface and
throughout core. Gas bubbles were also observed down core. At 5 cm an anoxic
decay odor was detected that remained down core. The mean grain size was
24.09 µm (silt).
• Core P28D was a 28 day consolidation core. The core consisted of consisted of a
layer of light gray silt over gray silt with pockets of black sediment. Very fine
organic material (including leaves, small sticks, and shells) was observed at the
surface and throughout core. Gas bubbles were also observed down core. At 5
cm an anoxic decay odor was detected that remained down core. The mean grain
size was 25.22 µm (silt).
A comparison of critical shear stress (Figure 18) and bulk density (Figure 19) with depth
of the four consolidated cores evaluated from sediment at the Passaic River Site, New
Jersey.

DRAFT Sedflume Consolidation Report
Passaic River, New Jersey
Sea Engineering, Inc.
8
Figure2. Critical shear stress with depth comparison of four consolidation cores.
Figure 3. Bulk density with depth comparison of four consolidation cores.
DRAFT Sedflume Consolidation Report
Passaic River, New Jersey
Sea Engineering, Inc.
9
References
Hakanson, L., and M. Jansson, 2002, Principles of Lake Sedimentology. Blackburn Press,
Caldwell, New Jersey, USA.
Jepsen, R., J. Roberts, and W. Lick, 1997, Effects of bulk density on sediment erosion
rates, Water, Air and Soil Pollution, 99:21-31.
McNeil, J., C. Taylor, and W. Lick, 1996, Measurements of erosion of undisturbed
bottom sediments with depth, J. Hydr. Engr., 122(6):316-324.
Roberts, J., R. Jepsen, D. Gotthard, and W. Lick, 1998, Effects of particle size and
bulk density on erosion of quartz particles, J. Hydr. Engrg., 124(12):1261
1267.
DRAFT Sedflume Consolidation Report
Passaic River, New Jersey
Sea Engineering, Inc.
10
Appendix A – Particle Size Distributions

Beckman Coulter LS Particle Size Analyzer
Passaic River Consolidation Core16 Dec 2008
File name: C:\Documents and Settings\Lisa\My Documents\Projects\ConsolidationPassaic_Sedflume\ConsolidationPassaic_ParticleSize\P1D-1__720.$avP1D-1__720.$av
File ID: P1D-1Operator: IsraelComment 2: SampleOptical model: Fraunhofer.rf780zLS 13 320 SW Aqueous Liquid Module
Run length: 60 secondsPump speed: 80Average of 3 files:C:\LS13320\Projects\ConsolidationPassaic\P1D-1__718.$lsC:\LS13320\Projects\ConsolidationPassaic\P1D-1__719.$lsC:\LS13320\Projects\ConsolidationPassaic\P1D-1__720.$ls
Volume Statistics (Arithmetic) P1D-1__720.$av
Calculations from 0.375 µm to 2000 µm
Volume: 100%Mean: 70.96 µmMedian: 22.92 µmMean/Median ratio: 3.096Mode: 34.59 µm
S.D.: 129.6 µmVariance: 16803 µm2
C.V.: 183%Skewness: 3.420 Right skewedKurtosis: 13.34 Leptokurtic
<10%3.099 µm
<25%8.125 µm
<50%22.92 µm
<75%66.38 µm
<90%179.0 µm
Differential Volume (Average) (2 S.D.)
2000100060040020010060402010864210.60.4Particle Diameter (µm)
3
2.5
2
1.5
1
0.5
0
Vol
ume
(%)
Beckman Coulter LS Particle Size Analyzer
Passaic River Consolidation Core16 Dec 2008
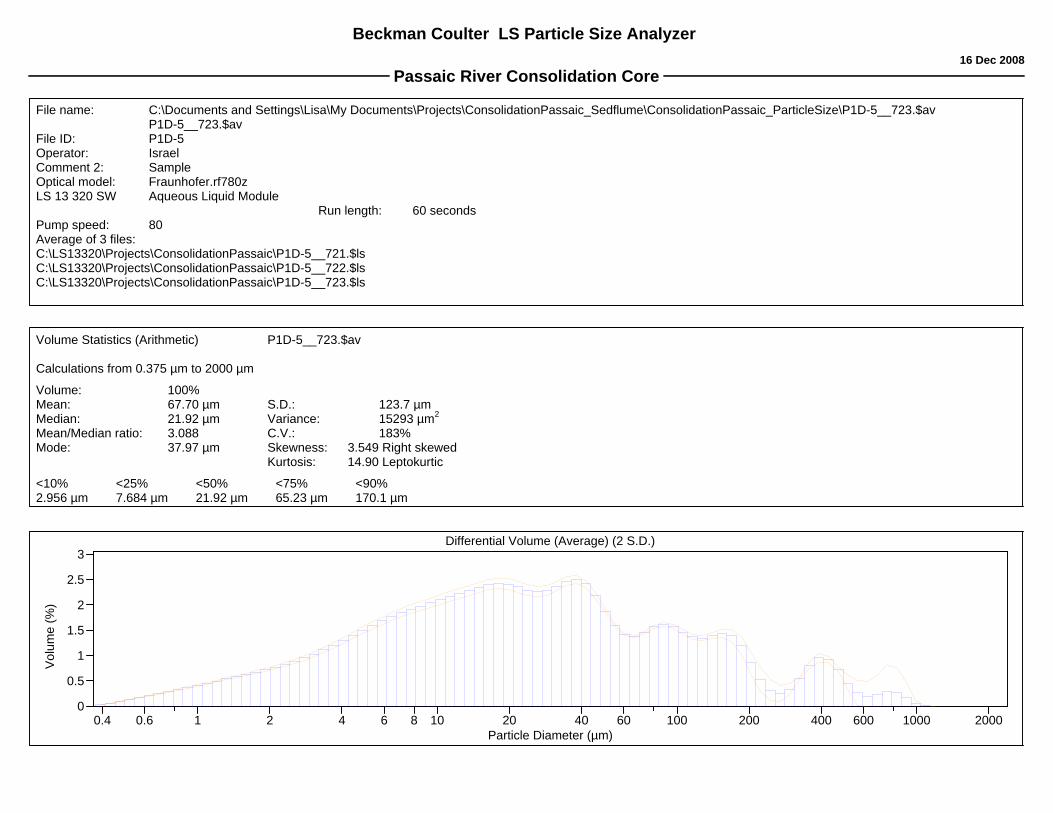
File name: C:\Documents and Settings\Lisa\My Documents\Projects\ConsolidationPassaic_Sedflume\ConsolidationPassaic_ParticleSize\P1D-5__723.$avP1D-5__723.$av
File ID: P1D-5Operator: IsraelComment 2: SampleOptical model: Fraunhofer.rf780zLS 13 320 SW Aqueous Liquid Module
Run length: 60 secondsPump speed: 80Average of 3 files:C:\LS13320\Projects\ConsolidationPassaic\P1D-5__721.$lsC:\LS13320\Projects\ConsolidationPassaic\P1D-5__722.$lsC:\LS13320\Projects\ConsolidationPassaic\P1D-5__723.$ls
Volume Statistics (Arithmetic) P1D-5__723.$av
Calculations from 0.375 µm to 2000 µm
Volume: 100%Mean: 67.70 µmMedian: 21.92 µmMean/Median ratio: 3.088Mode: 37.97 µm
S.D.: 123.7 µmVariance: 15293 µm2
C.V.: 183%Skewness: 3.549 Right skewedKurtosis: 14.90 Leptokurtic
<10%2.956 µm
<25%7.684 µm
<50%21.92 µm
<75%65.23 µm
<90%170.1 µm
Differential Volume (Average) (2 S.D.)
2000100060040020010060402010864210.60.4Particle Diameter (µm)
3
2.5
2
1.5
1
0.5
0
Vol
ume
(%)

Beckman Coulter LS Particle Size Analyzer
Passaic River Consolidation Core16 Dec 2008
File name: C:\Documents and Settings\Lisa\My Documents\Projects\ConsolidationPassaic_Sedflume\ConsolidationPassaic_ParticleSize\P7D-1__726.$avP7D-1__726.$av
File ID: P7D-1Operator: IsraelComment 2: SampleOptical model: Fraunhofer.rf780zLS 13 320 SW Aqueous Liquid Module
Run length: 60 secondsPump speed: 80Average of 3 files:C:\LS13320\Projects\ConsolidationPassaic\P7D-1__724.$lsC:\LS13320\Projects\ConsolidationPassaic\P7D-1__725.$lsC:\LS13320\Projects\ConsolidationPassaic\P7D-1__726.$ls
Volume Statistics (Arithmetic) P7D-1__726.$av
Calculations from 0.375 µm to 2000 µm
Volume: 100%Mean: 58.61 µmMedian: 24.77 µmMean/Median ratio: 2.366Mode: 37.97 µm
S.D.: 89.14 µmVariance: 7945 µm2
C.V.: 152%Skewness: 2.838 Right skewedKurtosis: 8.784 Leptokurtic
<10%3.232 µm
<25%8.825 µm
<50%24.77 µm
<75%65.49 µm
<90%153.1 µm
Differential Volume (Average) (2 S.D.)
2000100060040020010060402010864210.60.4Particle Diameter (µm)
3
2.5
2
1.5
1
0.5
0
Vol
ume
(%)

Beckman Coulter LS Particle Size Analyzer
Passaic River Consolidation Core16 Dec 2008
File name: C:\Documents and Settings\Lisa\My Documents\Projects\ConsolidationPassaic_Sedflume\ConsolidationPassaic_ParticleSize\P7D-5__729.$avP7D-5__729.$av
File ID: P7D-5Operator: IsraelComment 2: SampleOptical model: Fraunhofer.rf780zLS 13 320 SW Aqueous Liquid Module
Run length: 60 secondsPump speed: 80Average of 3 files:C:\LS13320\Projects\ConsolidationPassaic\P7D-5__727.$lsC:\LS13320\Projects\ConsolidationPassaic\P7D-5__728.$lsC:\LS13320\Projects\ConsolidationPassaic\P7D-5__729.$ls
Volume Statistics (Arithmetic) P7D-5__729.$av
Calculations from 0.375 µm to 2000 µm
Volume: 100%Mean: 66.77 µmMedian: 21.67 µmMean/Median ratio: 3.081Mode: 18.00 µm
S.D.: 116.4 µmVariance: 13554 µm2
C.V.: 174%Skewness: 3.285 Right skewedKurtosis: 12.98 Leptokurtic
<10%2.842 µm
<25%7.450 µm
<50%21.67 µm
<75%67.80 µm
<90%174.8 µm
Differential Volume (Average) (2 S.D.)
2000100060040020010060402010864210.60.4Particle Diameter (µm)
2.5
2
1.5
1
0.5
0
Vol
ume
(%)
Beckman Coulter LS Particle Size Analyzer
Passaic River Consolidation Core16 Dec 2008
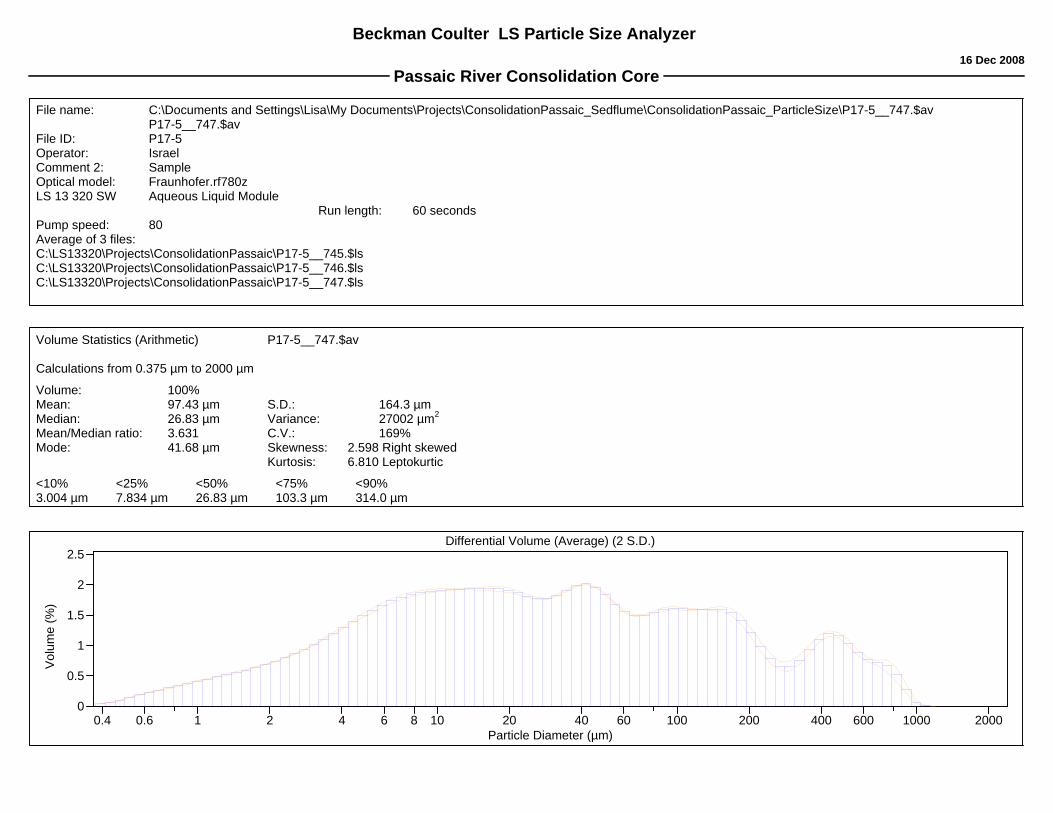
File name: C:\Documents and Settings\Lisa\My Documents\Projects\ConsolidationPassaic_Sedflume\ConsolidationPassaic_ParticleSize\P17-5__747.$avP17-5__747.$av
File ID: P17-5Operator: IsraelComment 2: SampleOptical model: Fraunhofer.rf780zLS 13 320 SW Aqueous Liquid Module
Run length: 60 secondsPump speed: 80Average of 3 files:C:\LS13320\Projects\ConsolidationPassaic\P17-5__745.$lsC:\LS13320\Projects\ConsolidationPassaic\P17-5__746.$lsC:\LS13320\Projects\ConsolidationPassaic\P17-5__747.$ls
Volume Statistics (Arithmetic) P17-5__747.$av
Calculations from 0.375 µm to 2000 µm
Volume: 100%Mean: 97.43 µmMedian: 26.83 µmMean/Median ratio: 3.631Mode: 41.68 µm
S.D.: 164.3 µmVariance: 27002 µm2
C.V.: 169%Skewness: 2.598 Right skewedKurtosis: 6.810 Leptokurtic
<10%3.004 µm
<25%7.834 µm
<50%26.83 µm
<75%103.3 µm
<90%314.0 µm
Differential Volume (Average) (2 S.D.)
2000100060040020010060402010864210.60.4Particle Diameter (µm)
2.5
2
1.5
1
0.5
0
Vol
ume
(%)

Beckman Coulter LS Particle Size Analyzer
Passaic River Consolidation Core16 Dec 2008
File name: C:\Documents and Settings\Lisa\My Documents\Projects\ConsolidationPassaic_Sedflume\ConsolidationPassaic_ParticleSize\P17D-1__732.$avP17D-1__732.$av
File ID: P17D-1Operator: IsraelComment 2: SampleOptical model: Fraunhofer.rf780zLS 13 320 SW Aqueous Liquid Module
Run length: 60 secondsPump speed: 80Average of 3 files:C:\LS13320\Projects\ConsolidationPassaic\P17D-1__730.$lsC:\LS13320\Projects\ConsolidationPassaic\P17D-1__731.$lsC:\LS13320\Projects\ConsolidationPassaic\P17D-1__732.$ls
Volume Statistics (Arithmetic) P17D-1__732.$av
Calculations from 0.375 µm to 2000 µm
Volume: 100%Mean: 65.02 µmMedian: 21.35 µmMean/Median ratio: 3.046Mode: 37.97 µm
S.D.: 106.4 µmVariance: 11329 µm2
C.V.: 164%Skewness: 2.901 Right skewedKurtosis: 9.829 Leptokurtic
<10%2.525 µm
<25%6.489 µm
<50%21.35 µm
<75%73.34 µm
<90%174.7 µm
Differential Volume (Average) (2 S.D.)
2000100060040020010060402010864210.60.4Particle Diameter (µm)
2.5
2
1.5
1
0.5
0
Vol
ume
(%)

Beckman Coulter LS Particle Size Analyzer
Passaic River Consolidation Core16 Dec 2008
File name: C:\Documents and Settings\Lisa\My Documents\Projects\ConsolidationPassaic_Sedflume\ConsolidationPassaic_ParticleSize\P28D-1__759.$avP28D-1__759.$av
File ID: P28D-1Operator: ANDESComment 2: SampleOptical model: Fraunhofer.rf780zLS 13 320 SW Aqueous Liquid Module
Run length: 60 secondsPump speed: 80Average of 3 files:C:\LS13320\Projects\ConsolidationPassaic\P28D-1__757.$lsC:\LS13320\Projects\ConsolidationPassaic\P28D-1__758.$lsC:\LS13320\Projects\ConsolidationPassaic\P28D-1__759.$ls
Volume Statistics (Arithmetic) P28D-1__759.$av
Calculations from 0.375 µm to 2000 µm
Volume: 100%Mean: 63.14 µmMedian: 22.09 µmMean/Median ratio: 2.859Mode: 41.68 µm
S.D.: 96.51 µmVariance: 9315 µm2
C.V.: 153%Skewness: 2.550 Right skewedKurtosis: 6.904 Leptokurtic
<10%2.745 µm
<25%6.974 µm
<50%22.09 µm
<75%76.06 µm
<90%177.6 µm
Differential Volume (Average) (2 S.D.)
2000100060040020010060402010864210.60.4Particle Diameter (µm)
2.5
2
1.5
1
0.5
0
Vol
ume
(%)
Beckman Coulter LS Particle Size Analyzer
Passaic River Consolidation Core16 Dec 2008
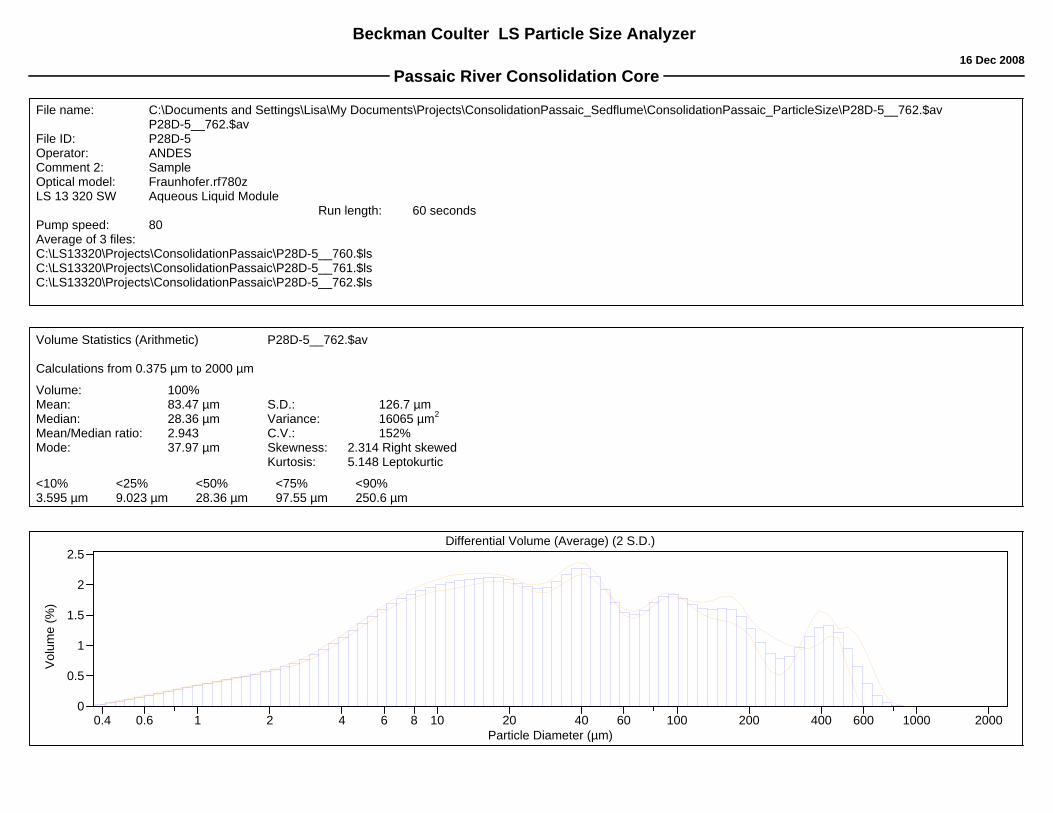
File name: C:\Documents and Settings\Lisa\My Documents\Projects\ConsolidationPassaic_Sedflume\ConsolidationPassaic_ParticleSize\P28D-5__762.$avP28D-5__762.$av
File ID: P28D-5Operator: ANDESComment 2: SampleOptical model: Fraunhofer.rf780zLS 13 320 SW Aqueous Liquid Module
Run length: 60 secondsPump speed: 80Average of 3 files:C:\LS13320\Projects\ConsolidationPassaic\P28D-5__760.$lsC:\LS13320\Projects\ConsolidationPassaic\P28D-5__761.$lsC:\LS13320\Projects\ConsolidationPassaic\P28D-5__762.$ls
Volume Statistics (Arithmetic) P28D-5__762.$av
Calculations from 0.375 µm to 2000 µm
Volume: 100%Mean: 83.47 µmMedian: 28.36 µmMean/Median ratio: 2.943Mode: 37.97 µm
S.D.: 126.7 µmVariance: 16065 µm2
C.V.: 152%Skewness: 2.314 Right skewedKurtosis: 5.148 Leptokurtic
<10%3.595 µm
<25%9.023 µm
<50%28.36 µm
<75%97.55 µm
<90%250.6 µm
Differential Volume (Average) (2 S.D.)
2000100060040020010060402010864210.60.4Particle Diameter (µm)
2.5
2
1.5
1
0.5
0
Vol
ume
(%)