Embed Size (px)
Citation preview
Draft Manual
2019 Local Capacity Area Technical
Study
October 2017
Version
Prepared by:
California Independent System Operator
2019 LCR Manual
CMMicsa – 10/19/2017 2
2019 Local Capacity Area Technical Study Manual Table of Contents
INTRODUCTION ....................................................................................................................................................... 3
STUDY OBJECTIVES ............................................................................................................................................... 4
TECHNICAL STUDY ASSESSMENT AND REQUIRED CAPACITY SUMMARY ......................................... 5
Preface ....................................................................................................................................................................... 5
BASE CASE INPUT ASSUMPTIONS ...................................................................................................................... 6
Transmission System Configuration: ......................................................................................................................... 6 Generation Modeled:.................................................................................................................................................. 6 Load Forecast: ........................................................................................................................................................... 6
METHODOLOGY ...................................................................................................................................................... 7
Maximize Import Capability into the Local Area: ........................................................................................................ 7 Maintaining Path Flows: ............................................................................................................................................. 7 QF/Nuclear/State/Federal Units: ................................................................................................................................ 8 Units Owned or Under Long-term Contracts with LSEs: ............................................................................................ 8 Maintaining Deliverability of Generation as well as Import Allocations Relied upon by RA: ....................................... 8 Load Pocket Boundary: .............................................................................................................................................. 8 ISO Statutory Obligation Regarding Safe Operation: ................................................................................................. 9 Other considerations: ................................................................................................................................................. 9 Local Capacity Criteria to be studied ......................................................................................................................... 9
1. Power Flow Assessment: .............................................................................................................................................. 11 2. Post Transient Flow Assessment: ................................................................................................................................. 12 3. Stability Assessment: .................................................................................................................................................... 12
Definition of Terms ................................................................................................................................................... 13
STUDIES BY PERFORMANCE LEVEL ............................................................................................................... 15
Performance Level P0 – Normal conditions: ............................................................................................................ 15 Performance Level P1&P3 – Single and Generator out followed by another Contingency Conditions: ................... 16 Performance Level P7 – Any Two Adjacent Circuits on Common Structure Conditions: ......................................... 17 Performance Level P6 – Any Two Single contingencies (non-P3) with System Readjustment Conditions: ............. 17 Protect against voltage collapse for Performance Level P1 followed by P7 Conditions: .......................................... 18 Total Area LCR Requirement: .................................................................................................................................. 19
SERVICE RELIABILITY ........................................................................................................................................ 19
2019 LCR Manual
CMMicsa – 10/19/2017 3
Introduction
The Local Capacity Technical Study (“Technical Study” or “LCT Study”) is intended to determine the minimum capacity needed in each identified transmission constrained “load pocket” or Local Capacity Area to ensure reliable grid operations. The existence of Local Capacity Requirements (LCR) precedes restructuring of the California electric system in 1998. Prior to restructuring, the investor-owned utilities operated integrated systems where conscious trade-offs were made between investing in transmission and generation. As a result, some areas where planned in a manner that consciously relied on local generation to supplement transmission capacity into the local area to satisfy demand and reliability requirements. Electric restructuring itself did not change the topology of the electric system and the physical need for local generation. Rather, it changed the means of access to such resources. The investor-owned utilities no longer owned much of the local generation, having been directed to divest a significant portion of their generation assets (so as to prevent the exercise of generation market power by the incumbent utilities). Consequently, prior to ISO start-up, it was determined that the ISO needed to have certain resources available to meet local reliability needs, and thus directly contracted with Reliability Must-Run or “RMR” generation for such purposes.
Over time, it has become more and more apparent that ISO should only be engaged in a rather small number of contracts in order to maintain the reliability of the grid and that the vast majority of the units needed to reliably serve local area load should be procured by Load Serving Entities (LSE). The adoption by the State of Resource Adequacy (RA) requirements facilitates this transition. The Technical Study works is intended to work in conjunction with resource adequacy requirements to ensure that the ISO has access to sufficient local generation to ensure reliability standards are satisfied.
There are several components of the reliability standards underlying the Technical Study. Consistent with the mandatory nature of the NERC Planning Standards, the ISO is under a statutory obligation to ensure efficient use and reliable operation of the transmission grid consistent with achievement of the NERC Planning Standards.1 The ISO is further under an obligation, pursuant to its FERC-approved Transmission Control Agreement, to secure compliance with all “Applicable Reliability Criteria.” Applicable Reliability Criteria consists of the NERC Planning Standards as well as Local Reliability Criteria, which reflect Reliability Criteria unique to the transmission systems of each Participating Transmission Owners (“PTOs”). Pursuant to its tariff authority, the ISO, in consultation with the PTOs and other stakeholders, has adopted ISO Grid Planning Standards intended to, among other things, interpret NERC Planning Standards and identify circumstances in which the ISO should apply standards more stringent than those adopted by NERC. Together, these pre-established criteria form Reliability Criteria to be followed in order to maintain desired performance of the ISO Controlled Grid under Contingency and steady state conditions. The NERC Planning Standards define reliability on interconnected bulk electric systems using the terms “adequacy” and “security.” “Adequacy” is the ability of the electric systems to supply the aggregate electrical demand and energy requirements of their customers at all times, taking into account physical characteristics of the transmission system such as transmission ratings and scheduled and reasonably expected unscheduled outages of system elements. “Security” is the ability of the electric systems to withstand sudden disturbances such as electric short circuits or unanticipated loss of system elements. The NERC Planning Standards are organized by Performance Categories. For instance, one category could require that the grid operator not only ensure grid integrity is maintained under certain adverse system conditions, e.g., security, but also that all customers continue to receive electric supply to meet demand, e.g., adequacy. In that case, grid reliability and service reliability would overlap.
1 Pub. Utilities Code § 345

2019 LCR Manual
CMMicsa – 10/19/2017 4
The study process includes a number of opportunities for stakeholder input. This input is incorporated into the next phase of studies.
Study Objectives
Similar to studies performed for 2006-2018, the purpose of the 2019 Local Capacity Technical Study (“Technical Study” or “LCT Study”) is to identify specific areas within the ISO Controlled Grid that have local reliability needs and to determine the minimum generation capacity (MW) that would be required to satisfy these local reliability requirements, while enforcing generation deliverability status and Maximum Import Capability for all common mode contingencies (Category P0, P1, P7).

2019 LCR Manual
CMMicsa – 10/19/2017 5
Technical Study Assessment and Required Capacity Summary
Preface
The technical analysis the ISO performed for the 2018 calendar year to determine the local reliability requirements evaluated ten local areas within the ISO Controlled Grid where operational history has shown that local reliability issues exist. Seven of these areas (Humboldt, North Coast/North Bay, Greater Bay, Sierra, Stockton, Fresno and Kern) are in PG&E’s service area; two (LA Basin and Big Creek/Ventura) are in SCE service area and one (San Diego) in SDG&E service area. A number of these areas are further subdivided as needed into sub-areas. A map of the areas is shown in Figure 1 below.
Figure 1 – Local Capacity Area Map
SONGS
Imperial Valley
Adelanto
Miguel
Devers
Valley
Serrano
Mira Loma
Lugo
Victorville
Rinaldi
Toluca
Midway
Gates
Los Banos
Sylmar
To Intermountain
To Celilo
Malin
Captain Jack
Tesla
Metcalf
Moss
Landing
Tracy
Vaca
Dixon
Table Mountain
Round Mountain
Olinda
McCall
Panoche
Morro Bay
Helms
Vincent
Hunters
Point
Potrero
Pittsburgh
Kings River
Contra Costa
USA
Gregg
Bellota
Newark
Diablo
Canyon
Pardee
Lakeville
Tulucay
Gould
Eagle Rk
Mesa
MEXICO
Cotton
wood
Delta
TrinityHumboldt
Palermo
Colgate
Rio Oso
Atlantic
Gold Hill
Brighton
Humboldt
Bay
Geysers
Kern
Encina
Talega
Escondido
Mission
(Path 44)
McCullough
El Dorado
Mohave
Palo Verde
Laguna Bell
Wheeler
Ridge
Humboldt
North Coast/North Bay
Greater Bay Area
Sierra
Stockton
Greater Fresno
Kern
LA Basin
San Diego
Santiago
Stanilaus
Donnells
WEST EAST
Big Creek/Ventura
Sylmar
2019 LCR Manual
CMMicsa – 10/19/2017 6
Base Case Input Assumptions
Transmission System Configuration:
The existing transmission system shall be modeled, including all projects operational on or before June 1, 2019 and all other feasible operational solutions brought forth by the PTOs and as agreed to by the ISO.
The majority of local areas peak in the summer time. In order to be consistent with past practices for base case development the ISO will model all transmission projects operational on or before June 1. Exemption: Humboldt area peaks in the winter and therefore only projects up to January 1, 2019 are included.
Generation Modeled:
All existing generation resources shall be modeled (less announced retirements) and shall also include all new generation projects that will be on-line and commercial on or before June 1, 2019. For new generation data should be available from the CEC web site: http://www.energy.ca.gov/sitingcases/all_projects.html or through the ISO interconnection process if no CEC license is required. Generation resources shall be dispatch up to the latest available net qualifying capacity or historical output values (if NQC not available) for purposes of the 2019 Technical Study.
The majority of local areas peak in the summer time. In order to be consistent with past practices for base case development, the ISO will model all generation projects operational on or before June 1, 2019. One exemption is the Humboldt area, that peaks in the winter and therefore only new generation up to January 1, 2019 should be included in that area.
If the new generation resources account for a significant portion of the LCR needs, then the possibility exists that the ISO cannot manage the transmission system in the first few months of the year without additional (existing) generation (beyond the minimum contracted amount – required after June 1) being made available to the ISO. As such, the ISO may be required to augment the quantity of capacity available in the first few months.
Load Forecast:
Consistent with the ISO transmission planning process, the ISO will utilize the latest information available from the California Energy Commission for the Technical Study. As per the ISO Transmission Planning Standards for local area assessments the 1-in-10 summer peak load will be used in the analysis for each of the local capacity areas. As indicated above the Humboldt area peaks in the winter and as such the winter peak will be used for the Humboldt local capacity area assessment.
The CEC Energy and Demand forecast currently states the following with respect to the impact of PV at the time of the CEC forecast peak load.
“At some point, continued growth in PV adoption will likely reduce demand for utility-generated power at traditional peak hours to the point where the hour of peak utility demand is pushed back to later in the day. This means that future PV peak impacts could decline significantly as system performance drops in the later hours. This possibility has not been incorporated into the demand forecast through CED 2015, since staff has not yet developed models to forecast hourly loads in the long term. Staff expects to develop this

2019 LCR Manual
CMMicsa – 10/19/2017 7
capability for the 2017 Integrated Energy Policy Report (2017 IEPR), and such an adjustment to PV peak impacts could significantly affect future peak forecasts.”2
The ISO will use the CEC energy and demand forecast for the base scenario analysis. If not directly included in the CEC forecast, the ISO will conduct additional scenarios on a case by case basis regarding the peak shift issue discussed above consistent with the ISO transmission planning process and compliance comply with the NERC TPL-001-4 mandatory reliability standard. These additional scenarios will be considered on a case by case basis to avoid lowering existing or historical reliability levels when assessing the local areas, and in particular areas at risk of generation retirement, until such time as the peak shift issue discussed above has been addressed in future CEC load forecasts. At this time, only southern California’s combined LA Basin and San Diego areas have been identified as necessitating this additional scenario analysis, based on 2018 analysis. The ISO will continue to work with the CEC on the hourly load forecast issue during the development of the 2017 IEPR and the 2018 IEPR Update.
Methodology
Maximize Import Capability into the Local Area:
Import capability into the local area shall be maximized, thus minimizing the generation required in the local area to meet reliability requirements. In other words, after the most stringent contingencies have been taken, the limiting element should be loaded at 100% of its applicable rating for constraints driven by equipment loading limits. Also, the voltage and/or reactive margin should be at their respective minimum allowable levels, after the most restrictive contingencies have been taken, for voltage and/or reactive margin driven constraints.
It is possible that the LSEs will comply in purchasing the minimum capacity requirement from units that are less effective (or that do not solve all the area constraints). If this should happen, the ISO would be forced to augment the local capacity available to it to satisfy the reliability criteria. The ISO will seek to minimize this exposure by publishing data to facilitate more effective LSE procurement, such as single or multiple effectiveness factors for resources in local areas or sub-areas where excess capacity exists.
Maintaining Path Flows:
Path flows shall be maintained below all established path ratings into the local areas, including 500 kV elements. For clarification, given the existing transmission system configuration, the only 500 kV paths that flows directly into a local area and, therefore, considered in the LCT Study is the South of Lugo transfer path flowing into the LA Basin.
Paths that do not directly flow into a local area, but influence the local area LCR need, should be set at or below the established path rating such that it assures the path operator that it can sustain any flow on this path at peak time for this local area. Currently the only known path that influences but does not flow directly into a local area is Path 15. Based on previous LCT studies the maximum flow of 1275 MW N-S yields the highest amount of LCR needs for the Greater Fresno and this assumption assures that at Fresno peak time the ISO can support any Path 15 flow.
2 CEC California Energy Demand 2016-2026, Revised Electricity Forecast Volume1: Statewide Electricity Demand and Energy Efficiency,
January 2016, http://docketpublic.energy.ca.gov/PublicDocuments/15-IEPR-03/TN207439_20160115T152221_California_Energy_Demand_20162026_Revised_Electricity_Forecast.pdf, Page 37.
2019 LCR Manual
CMMicsa – 10/19/2017 8
QF/Nuclear/State/Federal Units:
Regulatory Must-take and similarly situated units like QF/Nuclear/State/Federal resources shall be modeled on-line at Net Qualifying Capacity (“NQC”) or historical output values (if NQC not available) for purposes of the 2019 Technical Study.
Units Owned or Under Long-term Contracts with LSEs:
Units owned or under long-term contracts with LSEs shall be modeled on-line at NQC or historical output values (if NQC not available) for purposes of the 2019 LCR Study. This information may be provided by LSEs.
Maintaining Deliverability of Generation as well as Import Allocations Relied upon by RA:
Generation and import capability, relied upon in the RA program, deliverability status shall be maintained for all common mode contingencies (including all single contingencies as well as double circuit tower line and same right-of-way contingencies). The import capability utilized shall be the Maximum Import Capability calculated by the ISO for import assignment purposes. This value reflects the maximum deliverable quantity across each branch group.
The Maximum Import Capability has been demonstrated to be deliverable during high peak load conditions, while complying with reliability criteria. Also, all generators been demonstrated to be fully deliverable to the aggregate of load and therefore have established NQCs. For the Technical Study, the Maximum Import Capability and generation deliverability must be maintained to avoid the need to reduce the import flows across branch groups and deliverability of certain generators. The last approach is to be avoided because, in addition to market participant equitability issues, for the most part there will be rather large decreases in import allocations and generation deliverability for rather small decreases in local area LCR needs. After a single contingency during the “System Readjustment” all generating units as well as imports can be reduced (up to a limit – see system readjustment) in order to protect for the next most limiting contingency.
Load Pocket Boundary:
The 2019 Technical Study shall be produced based on load pockets defined by a fixed boundary.
It is preferred that the requirement for the Technical Study should be reasonably stable over time to encourage longer-term contracting by LSEs. Transmission configurations as well as unit and load effectiveness factors change every year due to new transmission projects added to the grid. As such, the only way to have a stable area is to define it as a fix boundary based on past experience of known constraints into any one area. The area definition is subject to change only if new major transmission and/or generation projects significantly change the local area constraints.
There may be some units or loads located outside the local area boundary that may help reduce one or more of the constraints within the local area, but nevertheless not qualify as a Local Capacity Area Resource. However, in the great majority of cases, units and load outside the defined local area are less valuable in that they either do not mitigate the binding constraint or do not help to reduce flows on the majority of other potential constraints resulting from other less severe contingencies when compared to resources located within the local area. During the validation of local procurement, the ISO will use all units procured by all LSEs, regardless of location, in order to see if any further procurement is needed to satisfy Reliability Criteria.
2019 LCR Manual
CMMicsa – 10/19/2017 9
ISO Statutory Obligation Regarding Safe Operation:
The ISO must maintain the system in a safe operating mode at all times. This obligation translates into respecting the Reliability Criteria at all times. For example, during normal operating conditions (8760 hours per year), the ISO must protect for all single contingencies (P1) and common mode double line outages (P7). As a further example, after a single contingency, the ISO must readjust the system in order to be able to support the loss of the next most stringent contingency (P3 and P6).
Other considerations:
For southern California’s combined LA Basin and San Diego areas, the ISO relied on the following assessments in the 2018 LCR studies and intends to continue to do so for the 2019 LCR study due to ongoing concerns related to Aliso Canyon gas storage outage constraint and the behind the meter PV peak shift affecting local area loads:
1. Aliso Canyon Gas Storage Outage - The Aliso Canyon gas storage facility, in addition to gas transmission pipelines, provides gas to customers in the LA Basin, including seventeen gas-fired generating facilities in the ISO and LADWP Balancing Authority Areas. Limited use or unavailability of Aliso Canyon would directly affect delivery of gas to generating facilities located in the western area of the LA Basin during summer peak load conditions. In April 2016, the Reliability Task Force, consisting of the CEC, CPUC, ISO, and LADWP with participation from SoCal Gas Company completed the Aliso Canyon Risk Assessment Technical Report (http://www.energy.ca.gov/2016_energypolicy/documents/2016-04- 08_joint_agency_workshop/Aliso_Canyon_Risk_Assessment_Technical_Report.pdf) quantifying the potential impacts to electric generation under various gas curtailment scenarios with the Aliso Canyon gas storage outage constraint for the summer 2016 time frame. Studies may be performed similar to the Joint Agency Task Force technical assessment for summer 2019.
2. PV Peak Shift – If not already included in the CEC forecast; the ISO will continue to perform additional assessments of the reliability impacts when loads continue to remain high as forecasted by the CEC but without the contribution of solar photovoltaic distributed generation at an early evening hour (i.e., 6:00 p.m.).
Because the ISO needs to plan and operate the transmission system under any and all credible scenarios, the most stringent (higher) requirement will be used among the credible studied scenarios based on circumstances at the end of April when final LCR report is released. While rare errata and changes may be permitted before the LCR allocations are released to LSEs in mid-July.
Local Capacity Criteria to be studied
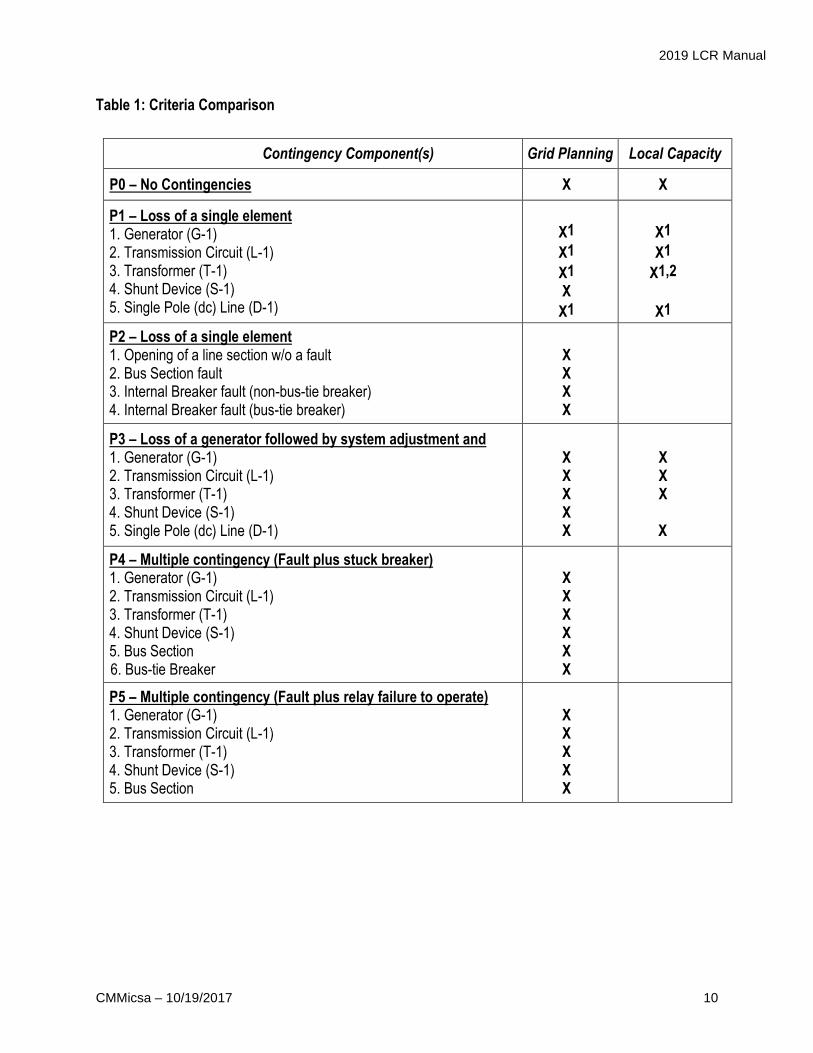
The following table provides a comparison of system planning criteria, based on the NERC performance standards, used in the study:
2019 LCR Manual
CMMicsa – 10/19/2017 10
Table 1: Criteria Comparison
Contingency Component(s) Grid Planning Local Capacity
P0 – No Contingencies X X
P1 – Loss of a single element 1. Generator (G-1) 2. Transmission Circuit (L-1) 3. Transformer (T-1) 4. Shunt Device (S-1) 5. Single Pole (dc) Line (D-1)
X1
X1
X1
X X1
X1
X1
X1,2
X1
P2 – Loss of a single element 1. Opening of a line section w/o a fault 2. Bus Section fault 3. Internal Breaker fault (non-bus-tie breaker) 4. Internal Breaker fault (bus-tie breaker)
X X X
X
P3 – Loss of a generator followed by system adjustment and 1. Generator (G-1) 2. Transmission Circuit (L-1) 3. Transformer (T-1) 4. Shunt Device (S-1) 5. Single Pole (dc) Line (D-1)
X X X
X X
X X X
X
P4 – Multiple contingency (Fault plus stuck breaker) 1. Generator (G-1) 2. Transmission Circuit (L-1) 3. Transformer (T-1) 4. Shunt Device (S-1) 5. Bus Section 6. Bus-tie Breaker
X X X
X X
X
P5 – Multiple contingency (Fault plus relay failure to operate) 1. Generator (G-1) 2. Transmission Circuit (L-1) 3. Transformer (T-1) 4. Shunt Device (S-1) 5. Bus Section
X X X
X X
2019 LCR Manual
CMMicsa – 10/19/2017 11
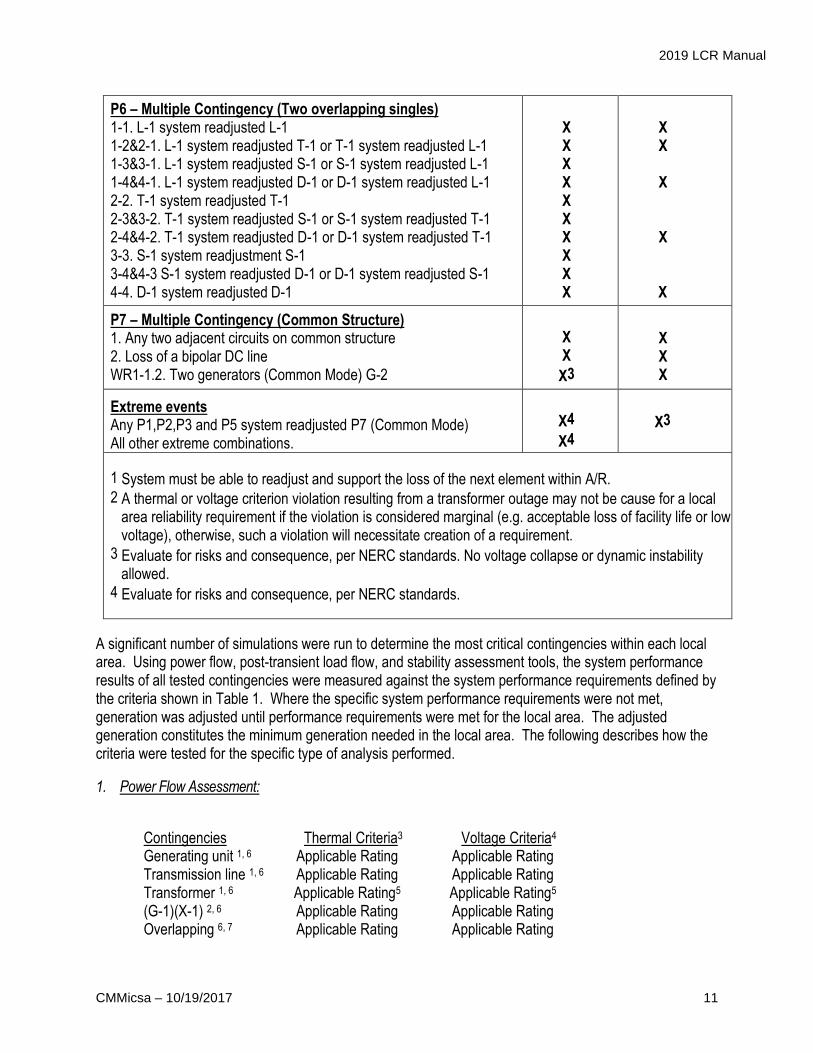
P6 – Multiple Contingency (Two overlapping singles) 1-1. L-1 system readjusted L-1 1-2&2-1. L-1 system readjusted T-1 or T-1 system readjusted L-1 1-3&3-1. L-1 system readjusted S-1 or S-1 system readjusted L-1 1-4&4-1. L-1 system readjusted D-1 or D-1 system readjusted L-1 2-2. T-1 system readjusted T-1 2-3&3-2. T-1 system readjusted S-1 or S-1 system readjusted T-1 2-4&4-2. T-1 system readjusted D-1 or D-1 system readjusted T-1 3-3. S-1 system readjustment S-1 3-4&4-3 S-1 system readjusted D-1 or D-1 system readjusted S-1 4-4. D-1 system readjusted D-1
X X X X X X X X X X
X X
X
X
X
P7 – Multiple Contingency (Common Structure) 1. Any two adjacent circuits on common structure 2. Loss of a bipolar DC line WR1-1.2. Two generators (Common Mode) G-2
X X
X3
X X X
Extreme events Any P1,P2,P3 and P5 system readjusted P7 (Common Mode) All other extreme combinations.
X4
X4
X3
1 System must be able to readjust and support the loss of the next element within A/R. 2 A thermal or voltage criterion violation resulting from a transformer outage may not be cause for a local
area reliability requirement if the violation is considered marginal (e.g. acceptable loss of facility life or low voltage), otherwise, such a violation will necessitate creation of a requirement.
3 Evaluate for risks and consequence, per NERC standards. No voltage collapse or dynamic instability allowed.
4 Evaluate for risks and consequence, per NERC standards.
A significant number of simulations were run to determine the most critical contingencies within each local area. Using power flow, post-transient load flow, and stability assessment tools, the system performance results of all tested contingencies were measured against the system performance requirements defined by the criteria shown in Table 1. Where the specific system performance requirements were not met, generation was adjusted until performance requirements were met for the local area. The adjusted generation constitutes the minimum generation needed in the local area. The following describes how the criteria were tested for the specific type of analysis performed.
1. Power Flow Assessment:
Contingencies Thermal Criteria3 Voltage Criteria4 Generating unit 1, 6 Applicable Rating Applicable Rating Transmission line 1, 6 Applicable Rating Applicable Rating Transformer 1, 6 Applicable Rating5 Applicable Rating5 (G-1)(X-1) 2, 6 Applicable Rating Applicable Rating Overlapping 6, 7 Applicable Rating Applicable Rating
2019 LCR Manual
CMMicsa – 10/19/2017 12
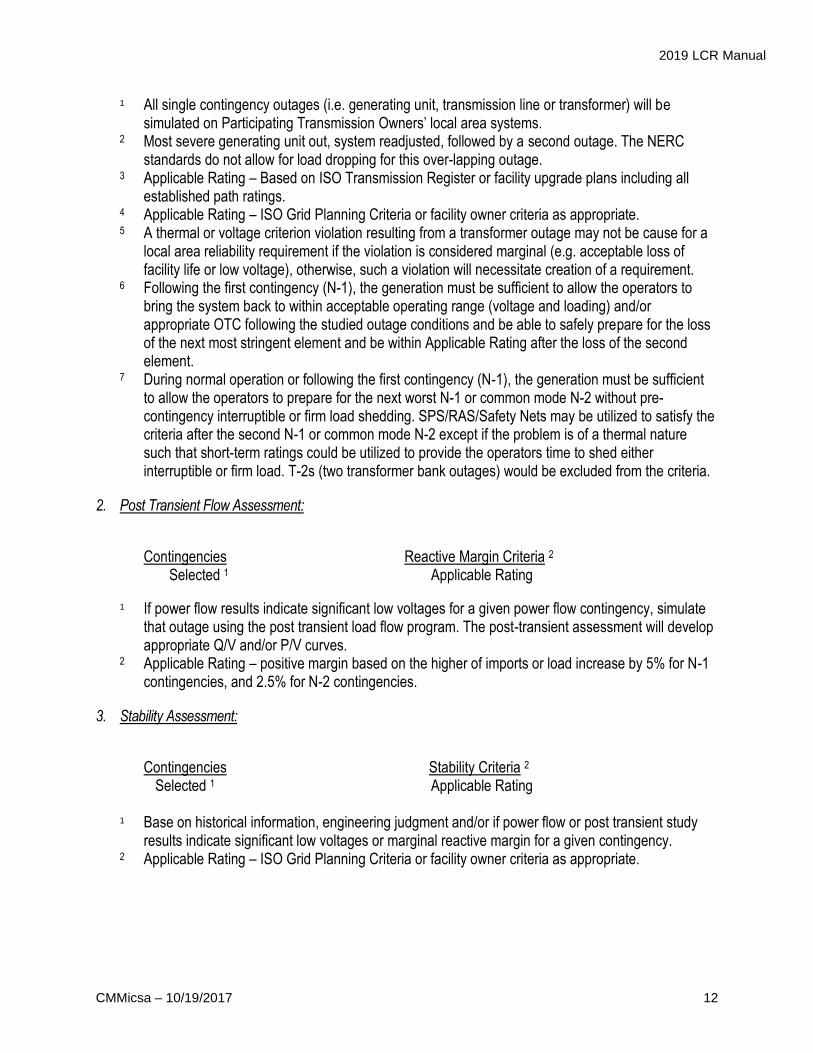
1 All single contingency outages (i.e. generating unit, transmission line or transformer) will be simulated on Participating Transmission Owners’ local area systems.
2 Most severe generating unit out, system readjusted, followed by a second outage. The NERC standards do not allow for load dropping for this over-lapping outage.
3 Applicable Rating – Based on ISO Transmission Register or facility upgrade plans including all established path ratings.
4 Applicable Rating – ISO Grid Planning Criteria or facility owner criteria as appropriate. 5 A thermal or voltage criterion violation resulting from a transformer outage may not be cause for a
local area reliability requirement if the violation is considered marginal (e.g. acceptable loss of facility life or low voltage), otherwise, such a violation will necessitate creation of a requirement.
6 Following the first contingency (N-1), the generation must be sufficient to allow the operators to bring the system back to within acceptable operating range (voltage and loading) and/or appropriate OTC following the studied outage conditions and be able to safely prepare for the loss of the next most stringent element and be within Applicable Rating after the loss of the second element.
7 During normal operation or following the first contingency (N-1), the generation must be sufficient to allow the operators to prepare for the next worst N-1 or common mode N-2 without pre-contingency interruptible or firm load shedding. SPS/RAS/Safety Nets may be utilized to satisfy the criteria after the second N-1 or common mode N-2 except if the problem is of a thermal nature such that short-term ratings could be utilized to provide the operators time to shed either interruptible or firm load. T-2s (two transformer bank outages) would be excluded from the criteria.
2. Post Transient Flow Assessment:
Contingencies Reactive Margin Criteria 2 Selected 1 Applicable Rating
1 If power flow results indicate significant low voltages for a given power flow contingency, simulate
that outage using the post transient load flow program. The post-transient assessment will develop appropriate Q/V and/or P/V curves.
2 Applicable Rating – positive margin based on the higher of imports or load increase by 5% for N-1 contingencies, and 2.5% for N-2 contingencies.
3. Stability Assessment:
Contingencies Stability Criteria 2
Selected 1 Applicable Rating
1 Base on historical information, engineering judgment and/or if power flow or post transient study results indicate significant low voltages or marginal reactive margin for a given contingency.
2 Applicable Rating – ISO Grid Planning Criteria or facility owner criteria as appropriate.
2019 LCR Manual
CMMicsa – 10/19/2017 13
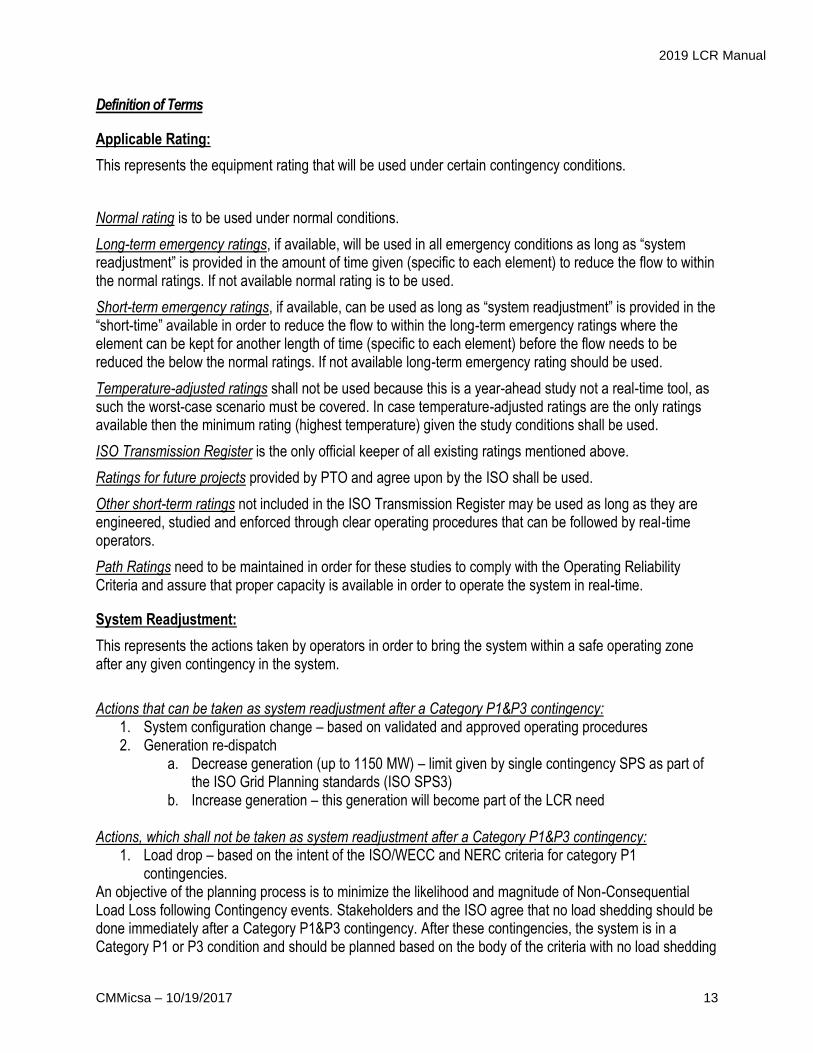
Definition of Terms
Applicable Rating:
This represents the equipment rating that will be used under certain contingency conditions.
Normal rating is to be used under normal conditions.
Long-term emergency ratings, if available, will be used in all emergency conditions as long as “system readjustment” is provided in the amount of time given (specific to each element) to reduce the flow to within the normal ratings. If not available normal rating is to be used.
Short-term emergency ratings, if available, can be used as long as “system readjustment” is provided in the “short-time” available in order to reduce the flow to within the long-term emergency ratings where the element can be kept for another length of time (specific to each element) before the flow needs to be reduced the below the normal ratings. If not available long-term emergency rating should be used.
Temperature-adjusted ratings shall not be used because this is a year-ahead study not a real-time tool, as such the worst-case scenario must be covered. In case temperature-adjusted ratings are the only ratings available then the minimum rating (highest temperature) given the study conditions shall be used.
ISO Transmission Register is the only official keeper of all existing ratings mentioned above.
Ratings for future projects provided by PTO and agree upon by the ISO shall be used.
Other short-term ratings not included in the ISO Transmission Register may be used as long as they are engineered, studied and enforced through clear operating procedures that can be followed by real-time operators.
Path Ratings need to be maintained in order for these studies to comply with the Operating Reliability Criteria and assure that proper capacity is available in order to operate the system in real-time.
System Readjustment:
This represents the actions taken by operators in order to bring the system within a safe operating zone after any given contingency in the system.
Actions that can be taken as system readjustment after a Category P1&P3 contingency:
1. System configuration change – based on validated and approved operating procedures 2. Generation re-dispatch
a. Decrease generation (up to 1150 MW) – limit given by single contingency SPS as part of the ISO Grid Planning standards (ISO SPS3)
b. Increase generation – this generation will become part of the LCR need Actions, which shall not be taken as system readjustment after a Category P1&P3 contingency:
1. Load drop – based on the intent of the ISO/WECC and NERC criteria for category P1 contingencies.
An objective of the planning process is to minimize the likelihood and magnitude of Non-Consequential Load Loss following Contingency events. Stakeholders and the ISO agree that no load shedding should be done immediately after a Category P1&P3 contingency. After these contingencies, the system is in a Category P1 or P3 condition and should be planned based on the body of the criteria with no load shedding

2019 LCR Manual
CMMicsa – 10/19/2017 14
even if capable of occurring immediately or within 15-30 minutes after the first contingency. It follows that load shedding may not be utilized as part of the system readjustment period – in order to protect for the next most limiting contingency. Therefore, if there are available resources in the local area, such resources should be used during the manual adjustment period (and included in the LCR need) before resorting to shedding firm load.
Firm load shedding is allowed in a planned and controlled manner after the second contingency in Category P6 events and immediately after Category P7 events.
This interpretation tends to guarantee that firm load shedding is used to address Category P1&P3 conditions only under the limited circumstances where no other resource or validated operational measure is available. A contrary interpretation would constitute a departure from existing practice and degrade current service expectations by increasing load’s exposure to service interruptions.
Time allowed for manual readjustment:
The time allowed for manual readjustment is the amount of time required for the operator to take all actions necessary to prepare the system for the next contingency. The time should not be more than thirty (30) minutes.
The CAISO Planning Standards also impose this manual readjustment requirement. As a parameter of the Local Capacity Technical Study, the CAISO must assume that as the system operator the CAISO will have sufficient time to:
(1) make an informed assessment of system conditions after a contingency has occurred;
(2) identify available resources and make prudent decisions about the most effective system redispatch;
(3) manually readjust the system within safe operating limits after a first contingency to be prepared for the next contingency; and
(4) allow sufficient time for resources to ramp and respond according to the operator’s redispatch instructions. This all must be accomplished within 30 minutes.
Local capacity resources can meet this requirement by either (1) responding with sufficient speed, allowing the operator the necessary time to assess and redispatch resources to effectively reposition the system within 30 minutes after the first contingency, or (2) have sufficient energy available for frequent dispatch on a pre-contingency basis to ensure the operator can meet minimum online commitment constraints or reposition the system within 30 minutes after the first contingency occurs. Accordingly, when evaluating resources that satisfy the requirements of the CAISO Local Capacity Technical Study, the CAISO assumes that local capacity resources need to be available in no longer than 20 minutes so the CAISO and demand response providers have a reasonable opportunity to perform their respective and necessary tasks and enable the CAISO to reposition the system within the 30 minutes in accordance with applicable reliability criteria.
The Executive Appeals Committee (Committee) of the CAISO convened on April 22, 2016 to consider the appeals to
Proposed Revision Request (PRR) 854 to the CAISO’s business practice manual for reliability requirements. The decision by the Committee defers implementation of PRR 854. As a result, the proposed amendment to the business practice manual was not implemented. The Committee reserved the right to adopt the PRR, with any necessary modifications, at the conclusion of the stakeholder process to address pre-contingency dispatch requirements for slower responding resources. While this stakeholder process is underway, the
2019 LCR Manual
CMMicsa – 10/19/2017 15
Committee’s decision was that the CAISO will continue to conduct its Local Capacity Technical Study as required by Section 40.3.1.1 of its tariff, but the CAISO will use its discretion not to exercise its Capacity Procurement Mechanism authority to address annual resource deficiencies that are directly attributable to a discrepancy between a local regulatory authority’s resource adequacy counting rules for demand response resources and CAISO’s Local Capacity Technical Study. Instead, prior to the conclusion of the stakeholder process addressing pre-Contingency dispatch resources, the ISO will rely upon existing slower acting resources in the Local Capacity Technical Study assuming these resources have sufficient availability to provide pre-Contingency dispatch necessary to resolve Contingencies in the applicable 30-minute timeframe.
Special Protection Schemes:
All known SPS shall all be used. New SPS must be verified and approved by the ISO and comply with the new SPS guideline described in the ISO Grid Planning Standards.
Effectiveness Factor:
Effectiveness factors are determined relative to the limiting equipment after applying the contingency(s). The ISO methodology for establishing the effectiveness factor of an individual unit increases the output of the tested unit and decreases (same amount) from all the other on-line units in the ISO Control Area (except the designated system swing). The amount of the “other” units’ decreases is based on their Pgen multiplied by the ratio of the total P increase versus total Pgen for all on-line units in the control area.
Pump model:
During the Technical Study, pumps should be modeled as firm loads up to the maximum of CEC coincident peak load forecast for these pumps or the firm transmission service (if available).
Due to weather and environmental changes, it is somewhat unpredictable, in the year ahead timeframe, how much pump is needed and at what level a year ahead of time, as such the pump owner should have its firm transmission right service (where it exists), reserved even if this would exceed CEC load forecast. Coordinate with pump owner for further details.
Studies by Performance Level
Performance Level P0 – Normal conditions:
1. Set the base case based on the existing input assumptions.
2. Based on the particular local area studied, schedule all imports (with influence on the local area) at the level of Maximum Import Capability for the particular branch groups plus any increase due to new capability that may be related to new transmission projects. This step is done in order to protect the deliverability of imports to the aggregate of load.
3. Screen the local area for highest flows due to normal flow pattern. Find one or more elements (or approved path ratings) that could be normally overloaded if not enough generation is maintained in the local area.
4. For the most stringent element (s), find all units that aggravate the constraint (suggestion – stop at the 5% effectiveness factor or 5% flow on the line whichever comes last). Make sure all these units are on-line at their deliverable output – check deliverability studies for consistency. This is done in
2019 LCR Manual
CMMicsa – 10/19/2017 16
order to maintain the deliverability of units (otherwise if they sign contracts with LSE they could become undeliverable).
5. Go back to the units within the local area that help reduce the flow on the most limiting element. Turn on these units (most effective unit first within each category – after you finish one category move to the most effective unit in the next category and so on) in the following order until the equipment is at the 100% of normal rating:
a. QF/Nuclear/State/Federal units
b. Units under known existing long-term contracts with LSEs
c. Other market units without long-term contracts
6. Add the output of all units that reduce the flow. This is the Category P0 requirement. Keep this so that it can be compared with category P1&P3 and P6&P7 requirements. It will only be used if higher than Category P1&P3 or P6&P7 requirements.
7. Repeat this for any sub area if required.
Performance Level P1&P3 – Single and Generator out followed by another Contingency Conditions:
1. Set the base case based on the existing input assumptions. (You can start with the base case used for category P0 study).
2. Based on the particular local area studied, schedule all imports (with influence on the local area) at the Maximum Import Capability for the particular branch groups with influence plus any increase due to new allocations that may be related to new transmission projects. – This step is done in order to protect the deliverability of imports to the aggregate of load.
3. Screen the area for highest emergency flows due to P1&P3 contingency conditions. Find one or more elements (or approved path ratings) that could be overloaded based on their emergency ratings (under these contingency conditions) if not enough generation is maintained in the area.
4. For the most stringent element(s), find all units that aggravate the constraint (suggestion – stop at the 5% effectiveness factor or 5% flow on the line whichever comes last). Make sure all these units are on-line at their deliverable output – check deliverability studies for consistency. This is done in order to maintain the deliverability of all units deemed so (otherwise if they sign contracts with LSE they could become undeliverable).
5. Go back to the units within the area that help reduce the flow on the most limiting element. Turn on these units (most effective unit first within each category – after you finish one category move to the most effective unit in the next category and so on) in the following order until the equipment is at the 100% of emergency rating:
a. QF/Nuclear/State/Federal units
b. Units under known existing long-term contracts with LSEs
c. Other market units without long-term contracts
6. Add the output of all units that reduce the flow. This is the Category P1&P3 requirement. Keep this so that it can be compared with category P0 and P6&P7 requirements. It will only be used if higher than Category P0 or P6&P7 requirements.
7. Repeat this for any sub area if required.
2019 LCR Manual
CMMicsa – 10/19/2017 17
Performance Level P7 – Any Two Adjacent Circuits on Common Structure Conditions:
1. Set the base case based on the existing input assumptions. (You can start with the base case used for category P0 study).
2. Based on the particular local area studied, schedule all imports (with influence on the local area) at the Maximum Import Capability for the particular branch groups plus any increase due to new allocations that may be related to new transmission projects. – This step is done in order to protect the deliverability of imports to the aggregate of load.
3. Screen the area for highest emergency flows due to P7 and WR1-1.2 double contingency conditions. Find one or more elements (or approved path ratings) that could be overloaded based on their emergency ratings (under double contingency conditions) if not enough generation is maintained in the area. (Use all known automatic [including firm load shedding special protection schemes] or manual operating procedures that help reduce the flow on the most limiting element.)
4. For the most stringent element(s), find all units that aggravate the constraint (suggestion – stop at the 5% effectiveness factor or 5% flow on the line whichever comes last). Make sure all these units are on-line at their deliverable output – check deliverability studies for consistency. This is done in order to maintain the deliverability of all units deemed so (otherwise if they sign contracts with LSE they could become undeliverable).
5. Go back to the units within the area that help reduce the flow on the most limiting element. Turn on these units (most effective unit first within each category – after you finish one category move to the most effective unit in the next category and so on) in the following order until the equipment is at the 100% of emergency rating:
a. QF/Nuclear/State/Federal units
b. Units under known existing long-term contracts with LSEs
c. Other market units without long-term contracts
6. Add the output of all units that reduce the flow. This will be the Category P7 and WR1-1.2 requirement. Keep this so that it can be compared with category P6 requirements. It will only be used if higher than other category P6 requirements.
7. Repeat this for any sub area if required.
Performance Level P6 – Any Two Single contingencies (non-P3) with System Readjustment Conditions:
1. Start with the base cases set for category P1 study.
2. Screen the area for highest emergency flows due to all applicable double contingency conditions. Find one or more elements (or approved path ratings) that could be overloaded based on their emergency ratings (under double contingency conditions) if not enough generation is maintained in the area. (Use all known automatic [including firm load shedding special protection schemes] or manual operating procedures that help reduce the flow on the most limiting element.)
3. For the most stringent element (s) find all units that aggravate the constraint (suggestion – stop at the 5% effectiveness factor or 5% flow on the line whichever comes last).
4. After the first contingency, do the following system readjustment before taking the next worst contingency:
a. System configuration change – based on validated and approved operating procedures
b. Decrease generation from units that aggravate the constraint (deliverability is not protected for this P6 category). Stop decreasing a certain generator when:
2019 LCR Manual
CMMicsa – 10/19/2017 18
i. Another known flow limit in the system has been reached.
ii. Total generation decrease reaches 1150 MW – limit given by single contingency SPS as part of the ISO Grid Planning standards (ISO SPS3).
c. Increase generation from units that help reduce the flow on the most stringent element – this generation will become part of the LCR need (read next bullet).
5. Go back to the units within the area that help reduce the flow on the most limiting element. Turn on these units (most effective unit first within each category – after you finish one category move to the most effective unit in the next category and so on) in the following order until the equipment is at the 100% of emergency rating:
a. QF/Nuclear/State/Federal units
b. Units under known existing long-term contracts with LSEs
c. Other market units without long-term contracts
6. Add the output of all units that reduce the flow. This will be the Category P6 requirement. Keep this so that it can be compared with category P7 requirements. It will only be used if higher than other Category P7 requirements.
7. Repeat this for any sub area if required.
Protect against voltage collapse for Performance Level P1 followed by P7 Conditions:
1. Start with the base cases set for category P1 study.
2. Screen the area for voltage collapse only based on applicable single contingencies followed by P7 (double circuit tower line outages) contingency conditions if not enough generation is maintained in the area. (Use all known automatic [including firm load shedding] special protection schemes and/or operating procedures that help avoid voltage collapse.)
3. For the most stringent element (s) find all units that aggravate the constraint (suggestion – stop at the 5% effectiveness factor or 5% flow on the line whichever comes last).
4. After the first contingency, do the following system readjustment before taking the next worst P7 contingency:
a. System configuration change – based on validated and approved operating procedures
b. Decrease generation from units that aggravate the constraint only. Stop decreasing a certain generator when:
i. Another known flow limit in the system has been reached.
ii. Total generation decrease reaches 1150 MW – limit given by single contingency SPS as part of the ISO Grid Planning standards (ISO SPS3).
c. Increase generation from units that help maintain voltage stability – this generation will become part of the LCR need (read next bullet).
5. Go back to the units within the area that help eliminate the voltage collapse situation. Turn on these units up to their NQC (most effective unit first within each category – after you finish one category move to the most effective unit in the next category and so on) in the following order until the voltage collapse situation has been eliminated:
a. QF/Nuclear/State/Federal units
b. Units under known existing long-term contracts with LSEs
c. Other market units without long-term contracts
2019 LCR Manual
CMMicsa – 10/19/2017 19
6. Add the output of all units that help maintain the voltage stability in the local area. This will be the Category P1 + P7 requirement. Keep this so that it can be compared with category P6&P7 requirements. It will only be used if higher than Category P6&P7 requirements.
7. Repeat this for any sub area if required.
Total Area LCR Requirement:
For any given area or sub area compare the requirement for Category P0, P1&P3 and P6&P7&P1+P7. The most stringent one will dictate that area LCR need.
General helpful tips:
If the area of study has one or more sub areas, then start with the smallest and/or most easy (radial) sub areas. All the units required in order to meet the sub area requirements should be turned on and accounted as part of the bigger sub area or entire area requirements (if they help reduce the flow on the most stringent element.)
If these units (those needed in a sub area) aggravate other sub area requirements, then be very careful during system re-dispatch so that the decrease of this generation does not cause problems in the previous sub area.
Service Reliability
This is a service reliability level that reflects generation capacity that is needed to readjust the system to prepare for the loss of a second transmission element (N-1-1) using generation capacity after considering all reasonable and feasible operating solutions (involving customer load interruption) developed and approved by the ISO, in consultation with the PTOs. Under this option, there is no expected load interruption to end-use customers as the ISO operators prepare for the second contingency. However, the customer load may be interrupted after the second contingency occurs.