Embed Size (px)
Citation preview
DRAFT Climate and Hydrology Datasets for Use in the River Management Joint Operating Committee (RMJOC) Agencies’ Longer-Term Planning Studies
Part IV – Summary
U.S. Department of the Interior
Bureau of Reclamation Pacific Northwest Regional Office
Boise, Idaho Technical Service Center
Denver, Colorado
U.S. Army Corps of Engineers
Northwestern Division Portland District Portland, Oregon
Bonneville Power Administration Portland, Oregon
June 2011

Photographs on front cover: American Falls Dam on the Snake River, Idaho, operated by the Bureau of Reclamation; The Dalles Dam on the Columbia River, Oregon, operated by the U.S. Corps of Engineers; and Bonneville Lock and Dam on the Columbia River, Oregon, operated by the U.S. Corps of Engineers.

DRAFT Climate and Hydrology Datasets for Use in the River Management Joint Operating Committee (RMJOC) Agencies’ Longer-Term Planning Studies
Part IV – Summary
U.S. Department of the Interior
Bureau of Reclamation Pacific Northwest Regional Office
Boise, Idaho Technical Service Center
Denver, Colorado
U.S. Army Corps of Engineers
Northwestern Division Portland District Portland, Oregon
Bonneville Power Administration Portland, Oregon
June 2011

Acknowledgements
RMJOC Sponsors:
• Patrick McGrane, Bureau of Reclamation, Pacific Northwest Region
• Rick Pendergrass, Bonneville Power Administration
• Jim Barton, U.S. Army Corps of Engineers, Northwestern Division
RMJOC Agencies’ Comments and Contributions from:
• Bureau of Reclamation, Pacific Northwest Region: Patrick McGrane, Toni Turner, Chris Lynch, Ted Day, Jennifer Johnson, Sharon Parkinson, Bob Lounsbury, Carol Kjar, and Lori Postlethwait
• Bureau of Reclamation, Technical Service Center: Levi Brekke, Tom Pruitt, and Nancy Parker
• Bonneville Power Administration: Rick Pendergrass, Brian Kuepper, Eric Nelson, Nancy Stephan, Bruce Glabau, Tony White, and Daniel Hua
• U.S. Army Corps of Engineers: Jim Barton, Peter Brooks, Malar Annamalai, Keith Duffy, Joel Fenolio, Patricia Low, Kristian Mickelson, John McCoskery, Seshagirirao Vaddey, William Proctor, and Randal Wortman
Additional Comments and Contributions from:
• Northwest Power and Conservation Council
• Columbia River Inter-Tribal Fish Commission
• BC-Hydro
• U.S. Fish & Wildlife Service
• National Oceanic and Atmospheric Administration, National Marine Fisheries Service
• University of Washington Climate Impacts Group
• Oregon Climate Change Research Institute
• Natural Resources Conservation Service

June 2011 – DRAFT Part IV: Summary i
Table of Contents 1.0 Introduction ........................................................................................................ 1
2.0 Summary of Part I: Future Climate and Hydrology Datasets ........................... 4
2.1 Future Climate Change Scenarios Selection ...................................................... 7
2.1.1 Hybrid-Delta Scenarios .......................................................................... 9
2.1.2 Transient Scenarios .............................................................................. 10
2.2 Projected Future Climate Conditions ............................................................... 10
2.2.1 Temperature and Precipitation ............................................................. 11
2.3 Runoff under Future Climate Scenarios ........................................................... 15
2.3.1 Hydrologic Modeling and Bias Correction .......................................... 15
2.3.2 Annual Runoff under HD Climate Change Scenarios ......................... 16
2.3.3 Monthly Runoff under HD Climate Change Scenarios ....................... 16
2.3.4 Annual Runoff under Transient Climate scenarios .............................. 17
2.4 Water Supply Forecasts under Future Climate Scenarios ................................ 18
3.0 Summary of Part II Report: Reclamation Operations in the Yakima, Deschutes, and Snake River Basins ................................................................. 20
3.1 Approach .......................................................................................................... 21
3.2 Yakima River Basin ......................................................................................... 22
3.2.1 Inflow ................................................................................................... 23
3.2.2 End-of-Month Storage ......................................................................... 24
3.2.3 Flow and Surface Water Delivered ...................................................... 25
3.2.4 Forecasting ........................................................................................... 26
3.3 Deschutes River Subbasin ................................................................................ 27
3.3.1 Inflow ................................................................................................... 29
3.3.2 End-of-Month Storage at Major Reservoirs......................................... 30
3.3.3 Flow ..................................................................................................... 30
3.3.4 Surface Water Delivered ...................................................................... 31
3.3.5 ESA for Resident Species and Other Environmental Objectives ............................................................................................ 32
3.3.6 Forecasting ........................................................................................... 33
3.4 Snake River Subbasin ....................................................................................... 33
3.4.1 Inflow ................................................................................................... 34
ii DRAFT Part IV: Summary – June 2011
3.4.2 End-of-Month Storage ......................................................................... 35
3.4.3 Flow ..................................................................................................... 37
3.4.4 Surface Water Delivered ...................................................................... 38
3.4.5 ESA for Resident Species and Other Environmental Objectives ............................................................................................ 40
3.4.6 Forecasting ........................................................................................... 40
4.0 Summary of Part III Report: USACE Columbia Basin Flood Control and BPA Hydropower Operations ...................................................... 41
4.1 Approach .......................................................................................................... 41
4.2 Key Findings .................................................................................................... 42
4.2.1 Flood Control ....................................................................................... 42
4.2.2 Columbia River Reservoir Assessment ............................................... 44
5.0 Uncertainties .................................................................................................... 48
6.0 Potential Next Steps ......................................................................................... 51
6.1 Additional Studies ............................................................................................ 51
7.0 Ongoing Studies With Climate Change Considerations .................................. 54
7.1 West-Wide Climate Risk Assessment .............................................................. 54
7.2 Columbia River Treaty 2014/2024 Review Program....................................... 54
8.0 Lessons Learned ............................................................................................... 56
8.1 Models .............................................................................................................. 56
8.2 Resources ......................................................................................................... 56
9.0 Literature Cited ................................................................................................ 57
List of Figures Figure 1. Flow chart illustrating the role of climate in long-range operations assessments. ...... 2Figure 2. Flow chart on how future climate and hydrology were defined for this assessment. 3Figure 3. River subbasins included in this study ....................................................................... 5Figure 4. Observed historical climate over the Columbia River Basin for Water Years 1916-2006 ............................................................................................................................................. 6Figure 5. Observed mean-annual daily maximum temperature in the Columbia River Basin, 1916-2006. ................................................................................................................................ 11Figure 6. Changes in average annual daily maximum temperature across the Columbia River Basin for HD 2020s and 2040s scenarios relative to the observed historical conditions ......... 12Figure 7. Observed mean-annual precipitation in the Columbia River Basin, 1916-2006. ..... 13
June 2011 – DRAFT Part IV: Summary iii
Figure 8. Changes in average annual precipitation across the Columbia River Basin for HD 2020s and 2040s scenarios relative to the observed historical conditions ............................... 14Figure 9. Selected University of Washington CIG HB2860 Transient climate scenarios describing Columbia River Basin average climate conditions. ............................................... 15Figure 10. Yakima River basin runoff under historical and transient climate scenarios: running 10-year mean-annuals. ................................................................................................ 18Figure 11. Locations of Reclamation projects and major subbasins in the Pacific Northwest that were the focus of this study. .............................................................................................. 21Figure 12. Yakima River subbasin–median monthly system inflow, historical and HD climates. ................................................................................................................................... 24Figure 13. Yakima River subbasin – median monthly system storage, historical and HD climates. ................................................................................................................................... 25Figure 14. Yakima River subbasin – median monthly total diversions above Parker, historical and HD climates. ...................................................................................................................... 26Figure 15. Yakima River subbasin – change in median monthly total diversions above Parker, HD 2040s climates relative to historical, simulated using perfect and imperfect water supply forecasts. ................................................................................................................................... 27Figure 16. Monthly median and change in monthly median inflow from VIC simulated inflow for the HD 2020 and HD 2040 climate change projections above Lake Billy Chinook on the Deschutes River. ............................................................................................................ 29Figure 17. Change in monthly period-median storage for the HD 2040 projections for all reservoirs storage on the Deschutes River. .............................................................................. 30Figure 18. Flow in total and change in total (from VIC historical) monthly period-medians at USGS Gage 14076500 on the Deschutes River. ...................................................................... 31Figure 19. Total and change in monthly-period medians (from VIC historical) of surface water delivered above Lake Billy Chinook. ............................................................................. 32Figure 20. Total and change in period-median monthly inflows from VIC simulated historical above Brownlee Reservoir in the upper Snake River subbasin. .............................................. 35Figure 21. Total and change in monthly period-median (from VIC simulated historical) end-of-month storage above Brownlee Reservoir in the Snake River subbasin. ............................ 36Figure 22. Total and change in total (compared to VIC simulated historical) monthly period-medians flow in at Brownlee Reservoir on the Snake River. .................................................. 38Figure 23. Total and change in surface water delivered above Brownlee Reservoir in the HD 2020 and HD 2040 scenarios. .................................................................................................. 39Figure 24. April 30 flood control elevations for Dworshak Dam in the HD 2020s and 2000 Level scenarios (the higher the elevation, the less space is required to capture floods). ......... 43Figure 25. April 30 flood control elevations for Libby Dam in the HD 2020s and 2000 Level scenarios. .................................................................................................................................. 43

iv DRAFT Part IV: Summary – June 2011
Figure 26. Six HD 2040 scenarios flow volumes over various periods at The Dalles Dam as percentages of the Base Case 70-year 2000 Level Modified Flow volume over the same periods. ...................................................................................................................................... 45Figure 27. McNary Dam average monthly discharge change for Base Case and HD climate change scenarios. ...................................................................................................................... 46Figure 28. Federal hydropower generation impacts with to climate change scenarios. .......... 47
Appendix
Climate and Hydrology Datasets for use in the RMJOC Agencies’ Longer-Term Planning Studies: Part I Report – Future Climate and Hydrology Datasets
Climate and Hydrology Datasets for use in the RMJOC Agencies’ Longer-Term Planning Studies: Part II Report – Reservoir Operations Assessment – Reclamation Tributary Basins
Climate and Hydrology Datasets for use in the RMJOC Agencies’ Longer-Term Planning Studies: Part III Report – Reservoir Operations Assessment – Columbia Basin Flood Control and Hydropower

1.0 Introduction
June 2011 – DRAFT Part IV: Summary 1
1.0 INTRODUCTION 1
The Bureau of Reclamation (Reclamation), U.S. Army Corps of Engineers (USACE), and 2 Bonneville Power Administration (BPA) pooled resources and collaborated on the adoption of 3 an array of climate change and hydrology datasets and modeling efforts in support of their 4 longer-term1
• U.S. Fish and Wildlife Service 8
planning activities in the Columbia River Basin. This collaboration also 5 included input from the following stakeholder agencies so that their perspectives could be 6 incorporated during the scoping and application of methods featured in this analysis: 7
• National Oceanic and Atmospheric Administration, National Marine Fisheries Service 9
• Northwest Power and Conservation Council 10
• British Columbia-Hydro 11
• University of Washington Climate Impacts Group 12
• Oregon Climate Change Research Institute 13
• Oregon State University 14
• Natural Resources Conservation Service 15
• Columbia River Inter-Tribal Fish Commission 16
The RMJOC agencies hosted a series of technical workshops during the course of the study 17 where the preliminary results and upcoming methodologies were discussed. Feedback was 18 gathered from the stakeholders during those workshops and incorporated as part of the study. 19
This effort was led by the River Management Joint Operating Committee (RMJOC), a forum 20 of water managers, hydrologists, and power schedulers from Reclamation, USACE, and BPA. 21 The RMJOC meets regularly and evaluates operational and/or infrastructure actions that may 22 impact Federal dam operations in the Pacific Northwest. Studying the benefits and effects of 23 these actions requires making assumptions about future hydrology and water supplies, future 24 water demands, and operational constraints that would affect system operations and 25 management of water supplies. 26
Traditionally historical climate data has been used when evaluating proposed actions; 27 however, there is growing evidence that the global and regional climate system is changing 28 and is expected to continue changing (IPCC 2007). The RMJOC agencies’ management of 29 system facilities necessitates incorporating future climate change projection information into 30 longer-term assessments. 31
1 “Longer-term” refers to 10 years or more in the future.

1.0 Introduction
2 DRAFT Part IV: Summary – June 2011
This study focuses on how climate change could impact hydrology and water supplies, and 32 how supply-related impacts may affect the facility operations conducted by the three RMJOC 33 agencies (Figure 1). Climate change effects on water demands and operating constraints are 34 being assessed in ongoing research and potential follow-up collaboration. 35
36 Figure 1. Flow chart illustrating the role of climate in long-range operations assessments. 37
This study, called Climate and Hydrology Datasets for use in the RMJOC Agencies’ Longer-38 Term Planning Studies (Figure 2) has produced the following reports: 39
• Part I Report – Future Climate and Hydrology Datasets (completed December 2010) 40
• Part II Report – Reservoir Operations Assessment – Reclamation Tributary Basins 41 (completed January 2011) 42
• Part III Report – Reservoir Operations Assessment – Columbia Basin Flood Control 43 and Hydropower (completed June 2011) 44
• Part IV Report – Summary Report (this report) 45

1.0 Introduction
June 2011 – DRAFT Part IV: Summary 3
46 Figure 2. Flow chart on how future climate and hydrology were defined for this assessment. 47
The Part I Report focused on RMJOC’s adoption of future climate and hydrology data from 48 the University of Washington’s Climate Impacts Group (CIG), the evaluation of those data, 49 and the development of the associated water supply forecast series to reflect future hydrologic 50 and climate conditions.2
2 The term “Columbia-Snake River Basin” found in the Part I and Part II Reports was changed to “Columbia River Basin” in the Part III and Part IV Reports.
The Part II Report focused on Reclamation’s simulation models of 51 project operations in the Yakima, Deschutes, and Snake River subbasins (the subbasins in the 52 study area with existing long-term functional reservoir models) and presented the results of 53 the operational analyses conducted using the future climate and hydrology datasets described 54 in the Part I Report. The Part III Report, which used output from the analyses completed for 55 the Part II Report, took the existing flood control storage reservation diagrams in combination 56 with projected future runoff and assessed the impacts of climate change on the Federal 57 Columbia River Power System using BPA’s power model. The Part I, II and III reports can 58 be found in the appendix to this report. This Part IV Report summarizes the completed 59 analyses and results from the more technical Parts I through III. The results are not meant to 60 be construed as findings on future operational vulnerabilities that depend on stresses other 61 than climate. Potential alternative future operations strategies that might offset such impacts 62 were not considered for this study. 63
2.0 Summary of Part I: Future Climate and Hydrology Datasets
4 DRAFT Part IV: Summary – June 2011
2.0 SUMMARY OF PART I: FUTURE CLIMATE AND 64
HYDROLOGY DATASETS 65
The Part I report is the foundational document that contained a review of the recent studies 66 focusing on past or future climate change over the Columbia River Basin and the implications 67 for hydrology, water resources, and environmental resources. Historical climate trends over 68 the Columbia River Basin were shown, indicating the presence and degree of climate change 69 that appears to have occurred. Available future climate and hydrology data over the 70 Columbia River Basin was surveyed for use in this RMJOC effort and an explanation of why 71 this effort ultimately focused on using the University of Washington CIG House Bill 2860 72 (HB2860) information was given (see Section 2.1). 73
The University of Washington CIG HB2860 climate and hydrology data was further distilled, 74 leading to the selection of a smaller subset of future climate and hydrology scenarios for use 75 in RMJOC long-range assessments. The RMJOC future climate and hydrology scenarios 76 represent a reasonable range of future conditions throughout the Columbia River Basin and 77 reflect corrections for hydrology model biases (or error tendencies). A methodology was 78 developed for estimating future water supply forecasts in the context of future climate and 79 hydrology conditions, followed by application of this scheme in scenario development. 80
The Part I Report focused on the major subbasins in the Columbia River Basin (Figure 3). A 81 review of this information at a basin-average scale shows that temperatures and precipitation 82 have increased throughout the Columbia River Basin (Figure 4). 83

2.0 Summary of Part I: Future Climate and Hydrology Datasets
June 2011 – DRAFT Part IV: Summary 5
84 Figure 3. River subbasins included in this study: Columbia River at Chief Joseph Dam (CHIEF), 85 Kootenay River (CORRA), The Dalles (DALLE), North Fork Clearwater River (DWORS), Ice Harbor 86 (ICEHA), Columbia River at Mica Dam (MICAA), Snake River (OXBOW), Columbia River at Priest 87 Rapids Dam (PRIRIE), Revelstoke (REVEL), Flathead River (WANET), Willamette River (WILPO), and 88 Yakima River (YAPAR). 89

2.0 Summary of Part I: Future Climate and Hydrology Datasets
6 DRAFT Part IV: Summary – June 2011
90 Figure 4. Observed historical climate over the Columbia River Basin for Water Years 1916-2006: 91 Columbia River at Chief Joseph Dam (CHIEF), Kootenay River (CORRA), The Dalles (DALLE), North 92 Fork Clearwater River (DWORS), Ice Harbor (ICEHA), Columbia River at Mica Dam (MICAA), Snake 93 River (OXBOW), Columbia River at Priest Rapids Dam (PRIRIE), Revelstoke (REVEL), Flathead River 94 (WANET), Willamette River (WILPO), and Yakima River (YAPAR). 95

2.0 Summary of Part I: Future Climate and Hydrology Datasets
June 2011 – DRAFT Part IV: Summary 7
Assessments on climate change science and summaries of contemporary climate projections 96 have been conducted by international, national, State, and private organizations. In general, 97 the results show that many components of the historical climate system are now changing, 98 including the temperatures of the atmosphere, land, and oceans; the extent of sea ice and 99 mountain glaciers; sea levels; the distribution of precipitation; and the length of seasons. 100 Numerous studies have been conducted on the potential consequences of climate change for 101 water resources in the Columbia River Basin. In general, these studies found that between 102 1970 and 1998, temperatures in the western United States increased (Cayan et al. 2001) and 103 snowpack and snowfall ratios decreased from 1948 to 2001 (Knowles et al. 2007). Almost all 104 climate change studies have indicated that, in general, temperatures are expected to continue 105 to increase above historical levels. 106
Future trends in precipitation are less conclusive than future temperature trends in the Pacific 107 Northwest. Projected changes in the mean annual precipitation averaged over all models are 108 small, but some models projected an enhanced seasonal precipitation cycle with changes 109 toward wetter autumns and winters and drier summers. These climate changes will impact 110 hydrology, particularly regional snowpacks and runoff seasonality (Elsner et al. 2010), which 111 in turn will influence water resources management. Peak flows will occur earlier in the year, 112 possibly necessitating earlier drawdowns3
2.1 Future Climate Change Scenarios Selection 117
of the reservoirs. Balancing the changes in the 113 peak flow timing with water needs during the summer months when there are warmer 114 temperatures and reduced flows may require changes in the operational procedures of the 115 projects. 116
The RMJOC considered several general circulation models (GCMs)4 and emission forcings5
3 Drawdowns are defined as releasing water from reservoirs to lower the water surface levels and decrease the volume of water in the reservoirs, often done in anticipation of high inflows.
118 to generate climate change projections for use in this study (see the Part I Report for details). 119
4 General Circulation Models are mathematical models of the atmosphere around our rotating planet. These complex computer programs account for the fluid motions, thermodynamics, chemistry, ocean current influences, water vapor, and other physical components that determine the earth’s climates.
5 Forcings are changes in the earth’s atmosphere caused by natural or anthropogenic events that alter the amount of solar energy reaching the planet’s surface. Changes in the atmosphere caused by greenhouse gases cause the lower atmosphere and surface of the earth to heat up. Estimates are then made by scientists about the level of emissions anticipated in the future based on natural and anthropogenic behavior and ranges are developed for use in the General Circulation Models.

2.0 Summary of Part I: Future Climate and Hydrology Datasets
8 DRAFT Part IV: Summary – June 2011
Climate projections were spatially downscaled6
The RMJOC technical team conducted watershed simulation modeling analyses to translate 128 the University of Washington CIG HB2860 downscaled climate projections into Columbia 129 River Basin hydrologic runoff at select locations. To manage the amount of future climate 130 and hydrology information for long-range assessments, RMJOC selected a small subset of the 131 University of Washington CIG HB2860 scenarios that reflected a range of climate change 132 estimates over the Columbia River Basin during the early 21st century (2019-2039 or “2020s”) 133 and the middle 21st century (2030-2059 or “2040s”), as well as time-evolving estimates that 134 reflected the possible future period 1950 through 2099. These scenarios featured the most 135 spatially downscaled future climate characterized over the Columbia River Basin while 136 representing a broad range of climate change projections. More significantly, the scenarios 137 contained simulated Columbia River Basin hydrology under these future climate conditions. 138
for the Pacific Northwest region. Such 120 downscaled climate projections served as the foundation for the future climate and hydrologic 121 scenarios obtained from the University of Washington CIG. In 2006, the Washington State 122 Legislature passed HB2860 authorizing the development of a Columbia River Water Supply 123 Inventory that must be updated every 5 years. Washington Department of Ecology and the 124 University of Washington CIG worked together to downscale climate projections for the 125 development of climate and hydrologic modeling programs specific to the Columbia River 126 Basin. 127
A range of scenarios7
• Scenarios concerning greenhouse gas emissions that influence future global and 141 Pacific Northwest climate 142
framing the central estimate (the 50th percentile estimate) for both 139 future periods (2020s and 2040s) was also selected, for example: 140
• Scenarios of future Pacific Northwest climate that influence Columbia River Basin 143 hydrologic analyses 144
• Scenarios of future Columbia River Basin natural runoff that influence future RMJOC 145 operations 146
For future climate and hydrology scenarios over the Pacific Northwest, the University of 147 Washington CIG developed several types of scenario information, two of which were 148 considered in this effort: Hybrid Delta scenarios and Transient scenarios. For the Hybrid-149 Delta assessment of the impacts on operations, a 30-year simulated historical climate change 150
6 Spatial downscaling is the process of taking global climate model output and translating it to a smaller spatial scale that is more meaningful for analyzing local and regional climate conditions.
7 The term scenario refers to an assumption about future conditions. The combinations of climate change scenario influences and the simulated climate responses to them are called climate projections.

2.0 Summary of Part I: Future Climate and Hydrology Datasets
June 2011 – DRAFT Part IV: Summary 9
was used to compare to two projected future climate conditions. For the Transient scenario, a 151 time-evolving period from 1950 to 2099 was used. This study focused only on supply-related 152 changes. No changes to metrics such as demands or flood control curves8
2.1.1 Hybrid-Delta Scenarios 156
were made. As a 153 result, a future assessment on how changing these and other metrics due to climate change 154 should be considered in the future. 155
The Hybrid-Delta (HD) scenarios reflect changes in climate from a simulated historical period 157 to a projected future period. To keep the amount of future climate and hydrology information 158 manageable for RMJOC long-range assessments, a small subset of HB2860 scenarios was 159 selected for use. The subset was chosen so that it reflected central climate change estimates 160 (50 percentile) over the Columbia River Basin during the early 21st century (2010-2039, or 161 “2020s”) and middle 21st century (2030-2059, or “2040s”) as well as a range of climate 162 change possibilities framing the central estimate for both future periods (e.g., the 10 and 90 163 percentiles in addition to the 50 percentile). This type of scenario is useful in exploring how 164 reservoir operations would respond to climate changes because the frequency information 165 from the reference climate remains closely tied to the historical weather and hydrology 166 conditions (i.e., reoccurrence of relatively wet or dry, or warm or cool, conditions). 167
Selection of the HD scenarios for the 2020s and 2040s was made by defining the following 168 parameters based on perspectives gathered from RMJOC agencies and the stakeholders: 169
• Climate change metrics: the 30-year metrics of average annual temperature and 170 precipitation 171
• Climate change location: the spatially averaged change over the entire Columbia 172 River Basin (rather than changes by individual subbasin) 173
• Climate range of change represented: the span included the central (or 50th 174 percentile) and the 10th to 90th percentile changes among the HB2860 climate and 175 hydrology data at the Columbia River Basin scale 176
This selection approach was applied independently to the separate HB2860 pools of 2020s 177 and 2040s scenarios, which led to five scenarios selected for RMJOC purposes which were 178 qualitatively named: 179
8 Flood control curves define the maximum reservoir pool surface elevations to maintain the balance between flood control and water supply objectives for each storage reservoir.

2.0 Summary of Part I: Future Climate and Hydrology Datasets
10 DRAFT Part IV: Summary – June 2011
• Central (C) 180
• More warming and wetter (MW/W) 181
• Less warming and wetter (LW/W) 182
• More warming and drier (MW/D) 183
• Less warming and drier (LW/D) 184
A sixth scenario was included in the set to reflect minimal change (MC), roughly targeting 185 less warming and central precipitation change over the Columbia River Basin. Annual 186 change information for each of these scenarios and the other HB2860 candidate scenarios is 187 given in the Part I Report in the appendix. 188
2.1.2 Transient Scenarios 189
The Transient scenarios reflect time-evolving climate conditions through historical and future 190 periods. The twelve HD scenarios described above (six for the 2020s and six for the 2040s) 191 were built from nine global projections and six of the nine projections were subjected to 192 Transient analysis. The Transient scenarios are useful for adaptation planning for the timing 193 and onset of the climate change impacts. 194
Assessment of the impacts of these scenarios was analyzed by using an ensemble of all six 195 Transient projections and tracking the ensemble change through time. The Transient 196 scenarios group represented what the climate and hydrologic possibilities might be during the 197 projection at any point in time from the past to the future (i.e., 1950 through 2099). Assessing 198 the Transient scenarios ensemble was meant to portray a range of climatic possibilities 199 through time and the median of the group suggested a central tendency of a given climatic 200 condition. The ranges in the group suggested the changes in climate variability and prediction 201 uncertainty through time. More information for about each of these Transient scenarios is 202 given in the Part I Report in the appendix. 203
2.2 Projected Future Climate Conditions 204
While the six scenarios were qualitatively labeled as C, MW/W, LW/W, MW/D, LW/D, and 205 MC, there were complex differences in how the scenarios were actually represented in the 206 Columbia River Basin that varied geographically and monthly. To illustrate these differences, 207 temperature and precipitation changes in the future relative to historical conditions are 208 described in the following section. An inventory of the datasets used in this effort may be 209 found in the Part I Report. 210

2.0 Summary of Part I: Future Climate and Hydrology Datasets
June 2011 – DRAFT Part IV: Summary 11
2.2.1 Temperature and Precipitation 211
Historical mean annual daily maximum temperature is shown in Figure 5 and changes relative 212 to that historical temperature are shown in Figure 6. While warming has consistently 213 occurred in the Columbia River Basin, some areas have experienced more change than others. 214 When comparing future mean annual daily maximum temperature changes to historical 215 conditions for both the 2020s and 2040s, scenario-specific maps show that increments of 216 warming vary spatially over the basin. 217
Mean annual daily minimum temperatures changes reflect similar geographic complexities as 218 observed in the mean annual maximum temperature. The comparison of those changes and 219 the month-to-month variability in future temperatures (both minimum and maximum) when 220 compared to historical conditions are not shown here, but are presented in Part I. 221
222 Figure 5. Observed mean-annual daily maximum temperature in the Columbia River Basin, 1916-2006. 223

2.0 Summary of Part I: Future Climate and Hydrology Datasets
12 DRAFT Part IV: Summary – June 2011
224
225 Figure 6. Changes in average annual daily maximum temperature across the Columbia River Basin for 226 HD 2020s and 2040s scenarios relative to the observed historical conditions. The scale of increased 227 temperature change ranges from 0°C to 5°C (white to red, respectively). 228

2.0 Summary of Part I: Future Climate and Hydrology Datasets
June 2011 – DRAFT Part IV: Summary 13
Figure 7 shows the historical mean annual precipitation from 1916 to 2006 and Figure 8 229 shows the changes in mean annual precipitation relative to that historical precipitation. While 230 observed precipitation has increased across the Columbia River Basin, areas along the 231 Cascade Mountains in Oregon and in southern Canada have experienced the largest increase. 232 When compared to future conditions, the Snake River subbasin (OXBOW in Figure 3) is 233 shown to have an increase in precipitation regardless of climate change scenario with the 234 exception of the 2020 MW/D and 2040 LW/D scenarios. So while the range of climate 235 scenarios met the criteria at the Columbia River Basin scale, when viewed at a smaller 236 geographic scale (such as the Snake River subbasin), the intended patterns of climate 237 variability were not necessarily met. Additional information about the changes in month-to-238 month mean annual precipitation is provided in the Part I Report in the appendix. 239
240 Figure 7. Observed mean-annual precipitation in the Columbia River Basin, 1916-2006. 241
242

2.0 Summary of Part I: Future Climate and Hydrology Datasets
14 DRAFT Part IV: Summary – June 2011
243
244 Figure 8. Changes in average annual precipitation (%) across the Columbia River Basin for HD 2020s and 245 2040s scenarios relative to the observed historical conditions. The scale of change ranges from a 20 246 percent decrease to no change to a 20 percent increase (red to white to blue, respectively). 247

2.0 Summary of Part I: Future Climate and Hydrology Datasets
June 2011 – DRAFT Part IV: Summary 15
The group of Transient climate scenarios tells a collective story though time. The temperature 248 conditions generated by these scenarios suggest that the median of the mean daily maximum 249 and minimum temperatures in the Columbia River Basin should continue to gradually 250 increase throughout the 21st century (solid black lines in the left and center graphs of Figure 251 9). In contrast, the median of precipitation conditions (solid black line in right graph of 252 Figure 9) appears to trend slightly toward wetter conditions, but with the trend being less 253 pronounced relative to the range of possibilities through time. The range of variation is much 254 greater in the precipitation plot (the blue lines in the right graph of Figure 9) than in the 255 temperature plots (green and red lines in the left and center graphs of Figure 9). 256
257 Figure 9. Selected University of Washington CIG HB2860 Transient climate scenarios describing 258 Columbia River Basin average climate conditions. 259
2.3 Runoff under Future Climate Scenarios 260
2.3.1 Hydrologic Modeling and Bias Correction 261
The hydrologic conditions for the Columbia River Basin were simulated by the University of 262 Washington CIG using the Variable Infiltration Capacity (VIC) hydrologic model. The VIC 263 model simulates how watershed hydrologic processes (e.g., evaporation, snowpack, 264

2.0 Summary of Part I: Future Climate and Hydrology Datasets
16 DRAFT Part IV: Summary – June 2011
snowmelt, and runoff) will physically respond to changes in climate over the Columbia River 265 Basin. The University of Washington CIG calibrated the Columbia River Basin VIC 266 hydrologic model by the adjusting the model’s soil parameters to reproduce historical 267 monthly and annual runoff from the major Columbia River subbasins shown in Figure 3. 268
For each scenario, a daily gridded time series of four weather variables were prepared and 269 used to force VIC simulations: precipitation, minimum temperature, maximum temperature, 270 and wind speed. VIC outputs include various conditions relevant to the surface water 271 balance: potential evapotranspiration, actual evapotranspiration, soil moisture, snow water 272 equivalent, and runoff. 273
The Columbia River Basin VIC hydrologic model had varying degrees of success in 274 reproducing historical runoff under historical weather conditions, depending on the location in 275 the Columbia River Basin (see the Part I Report for a full description of the VIC model and its 276 limitations). More success was seen at calibration locations; less success was seen at many 277 other runoff locations that are relevant to the RMJOC operations analyses (e.g., inflow 278 locations to specific system reservoirs). A procedure was used to account for the VIC 279 simulated runoff error tendencies, or biases, so that the simulated runoff variability under the 280 historical climate scenario was consistent with system inflow variability in the RMJOC 281 agencies’ historical operations assessments. These same adjustments were applied to the VIC 282 simulated runoff under future climates scenarios. Application of these adjustments to each 283 HD and Transient VIC scenario yielded datasets of bias-corrected natural runoff at the major 284 system inflow locations used in RMJOC operations analyses (Part II and III reports). 285
2.3.2 Annual Runoff under HD Climate Change Scenarios 286
For subbasins in the Columbia River Basin, the trend from historical to future average annual 287 runoff was found to generally follow the same trend as the average annual precipitation 288 (Figure 8). Monthly runoff patterns are expected to change in the future relative to historical 289 conditions, with warming leading to increased winter-spring runoff and reduced summer 290 runoff. These seasonality changes are due to increased winter rainfall and reduced snowpack, 291 which reduce the snowmelt volume through the summer. Scenario precipitation trends varied 292 geographically within the Columbia River Basin; however, absent any precipitation change, 293 warmer conditions led to increases in evapotranspiration and a reduction in runoff in these 294 scenarios (Figure 6). 295
2.3.3 Monthly Runoff under HD Climate Change Scenarios 296
For most of the locations assessed, projected future monthly runoff patterns differed from the 297 historical patterns with increased runoff during winter to early spring and reduced runoff 298 during late spring to summer, stemming primarily from warming that increased winter rainfall 299 instead of snowfall and increased snowmelt rates. Increased winter rainfall led to more winter 300

2.0 Summary of Part I: Future Climate and Hydrology Datasets
June 2011 – DRAFT Part IV: Summary 17
runoff, less winter snowpack accumulation, and subsequently reduced snowmelt to support 301 the spring-summer runoff in some locations. The degree to which this phenomenon occurred 302 varied by the historical temperature conditions and by the amount of future warming. This 303 generally means that such a transition in runoff seasonality occurs earlier in the 21st century 304 for the western subbasins (e.g., Yakima River subbasin and the Cascade Mountains) when 305 compared to the eastern and northern subbasins (e.g., upper Snake and upper Columbia River 306 subbasins). Given that warming increases as the 21st century progresses, these effects may 307 become more pronounced with time. 308
2.3.4 Annual Runoff under Transient Climate scenarios 309
The six Transient runoff scenarios suggested that for most subbasins, any trend in annual 310 runoff through time was subtle when compared to the range of runoff possibilities in any 311 given year. This subtlety was emphasized when the scenarios were viewed in a selected 10- 312 or 30-year timeframe. 313
Using the Transient information was beneficial because it was used to understand decadal to 314 multi-decadal variability within climate projections. Because the HD scenarios were 315 developed from 30-year periods selected out of the climate projections, the decadal to multi-316 decadal climate variability occurring in the 30-year timeframes affected the interpretation of 317 the Transient scenarios. The HD scenarios were intended to be interpreted as “climate 318 change” possibilities and not multi-decadal variability. It is possible that some of the HD 319 scenarios were selected in part because of the time periods chosen (2020s or 2040s) and the 320 climatic departure from the trend happening within the climate projections during these 321 periods. 322
For example, Figure 10 shows the Yakima Transient scenario smoothed through time using 323 the 10-year moving mean. The 30-year period centered on the 2040s HD scenario was from 324 2030 to 2059. The 2040s LW/D HD scenario in Figure 10 was sampled from the same 325 climate projection that underlies the Transient scenario labeled “echo-g” (see legend and 326 caption on Figure 10). The “echo g” projection shows that during the decade around the 327 2050s, the runoff had a large dip relating to relatively dry conditions during this period in this 328 climate projection. Thus it is fair to question whether the LW/D 2040s HD scenario is truly 329 climate change or the result of sampling of decadal climate variability from the “echo g” 330 projection during this period. This question is explored further in Report II on Operations 331 Portrayal under Transient climate scenarios. In most cases, the LW/D 2040s HD scenario 332 reflected the driest conditions. 333

2.0 Summary of Part I: Future Climate and Hydrology Datasets
18 DRAFT Part IV: Summary – June 2011
334 Figure 10. Yakima River basin runoff under historical and transient climate scenarios: running 10-year 335 mean-annual. The graph represents the different GCMs that were used in the modeling activities (color 336 lines), the Transient ensemble median (dotted black line), and the historical conditions (solid black line). 337 The Part I Report contains details on these modeling results. 338
2.4 Water Supply Forecasts under Future Climate 339
Scenarios 340
Traditional seasonal water supply forecasting is imperfect and based on snowpack 341 monitoring. Seasonal warming diminishes the snowpack over time which gradually 342 diminishes the value of using snowpack to predict seasonal water supply. Potentially losing 343 snowpack as a water supply predictor is important because long-range operations simulations 344 use snowpack in water supply forecasts. However, it was not certain whether characterizing 345 future climate impacts on water supply forecasts was critical for simulating future operations, 346 relative to characterizing changes in natural runoff and system inflows. To get a clearer 347 understanding, the operations analyses were conducted using two types of water supply 348 forecasts: “perfect” which is simply a look-ahead sum of inflows in future months and 349 “imperfect” resembling real-world use of prior season precipitation and snow at the time of 350 forecasting to predict seasonal runoff volumes during coming months. This dual type of 351

2.0 Summary of Part I: Future Climate and Hydrology Datasets
June 2011 – DRAFT Part IV: Summary 19
water supply forecasting was conducted only for the historical and HD climate scenarios. For 352 the Transient scenarios, only the perfect forecast was used. For imperfect forecasts, a process 353 was applied on a scenario-specific basis (historical or HD) and for a large menu of forecast 354 situations9
The water supply forecast models developed under historical climate scenarios generally 360 reflected historical conditions, although they were not as accurate as the models that are 361 currently used by various forecast providers in the Columbia River Basin (e.g., Natural 362 Resources Conservation Service, National Weather Service Northwest River Forecast Center, 363 BC-Hydro, Reclamation Pacific Northwest Region). Nevertheless, the resultant models 364 provided reasonable projections under the historical climate scenarios for the operations 365 assessments (Report Parts II and III). 366
collectively featured in the RMJOC agencies’ long-range operations models. For 355 each forecast situation, a water supply forecast model was developed within the context of 356 each climate scenario (historical or HD) and designed to be similar to real-world forecast 357 models in that it related seasonal precipitation to date (October to current date) and snowpack 358 near the time of the forecast to seasonal runoff volume during a subsequent forecast period. 359
Comparisons of the water supply forecasts estimated under historical and future HD climates 367 broadly suggested that forecast skill, or the ability of the forecast to accurately predict future 368 water supplies, should diminish for most locations as warming causes the snowpack to 369 diminish. For the 2020s and 2040s HD time frames, decreased forecast skills seem primarily 370 confined to early and late forecasts (e.g., January and February forecasts of spring-summer 371 runoff or June and July forecasts of remainder-of-summer runoff). Forecast skill reductions 372 varied by location, with some basins experiencing very little reduction (e.g., Columbia River 373 at Keenleyside Dam, Columbia River at Mica Dam, and Snake River near Heise) and others 374 experiencing more significant reduction (e.g., Deschutes River above Crescent Lake, North 375 Fork Clearwater at Dworshak Dam, and Yakima River at Parker). 376
Any conclusions drawn from these results are limited given that this study did not 377 exhaustively explore alternative predictors that might be used in the future to replace the 378 predictive value currently offered by snowpack monitoring and there were no explorations of 379 new snowpack monitoring sites at higher elevations. Nevertheless, like the historical forecast 380 series previously mentioned, the future forecast series were viewed to be reasonable 381 depictions of potentially impacted water supply forecasting under future hydrology and 382 climate conditions. As such, they were viewed to be suitable for use in the operations 383 assessments that followed. 384
9 A forecast situation is defined by its subbasin, the timing of the forecast (e.g., January 1), and the forecast period (e.g., April to July).

3.0 Summary of Part II Report: Reclamation Operations in the Yakima, Deschutes, and Snake River Basins
20 DRAFT Part IV: Summary – June 2011
3.0 SUMMARY OF PART II REPORT: RECLAMATION 385
OPERATIONS IN THE YAKIMA, DESCHUTES, AND 386
SNAKE RIVER BASINS 387
The Part II report included a summary of the framework in which future hydrology scenarios 388 were incorporated into Reclamation’s long-range operations assessments within the Yakima, 389 Deschutes, and Snake River subbasins. Also, a description of the reservoir system models 390 used to simulate operations in these basins and the subsequent detailed results can be found in 391 Part II. An assessment of modeled simulated operations under historical, HD, and Transient 392 climate scenarios was conducted to characterize the general climate change implications for 393 future operations, to understand how the implications vary across the HD climate scenarios of 394 a given future period, and to determine how the implications vary (if at all) when assessed 395 under HD or Transient conditions. 396
Reclamation operates projects in a number of tributary subbasins in the Columbia River Basin 397 (Figure 11). Future RMJOC climate and hydrology scenarios were developed to study how 398 climate change may affect project operations in the Yakima, Deschutes, and Snake River 399 subbasins. These three subbasins already had fully functioning operations models that were 400 available for immediate use in the analysis of climate change impacts. 401

3.0 Summary of Part II Report: Reclamation Operations in the Yakima, Deschutes, and Snake River Basins
June 2011 – DRAFT Part IV: Summary 21
402 Figure 11. Locations of Reclamation projects and major subbasins in the Pacific Northwest that were the 403 focus of this study. 404
In the following subsections, a brief summary of the metrics evaluated in each subbasin is 405 provided with example graphics depicting the general results. These results are described in 406 detail in the Part II Report which can be found in the Appendix. 407
3.1 Approach 408
The Yakima River Subbasin Planning Model simulated system operations on a daily basis 409 whereas the Deschutes and Snake River Subbasin Planning Models featured simulations of 410 monthly system operations. For each subbasin, a common menu of 32 simulations was 411 conducted: 412

3.0 Summary of Part II Report: Reclamation Operations in the Yakima, Deschutes, and Snake River Basins
22 DRAFT Part IV: Summary – June 2011
• (1-13) historical, HD 2020s, and HD 2040s climates under perfect water supply 413 forecasts 414
• (14-26) historical, HD 2020s, and HD 2040s climates under imperfect water supply 415 forecasts 416
• (27-32) transient climates under perfect water supply forecasts 417
Operations analysis in each subbasin was conducted using the 2010 level water demands and 418 operating criteria. Additional modeling was completed on the Snake and Deschutes River 419 subbasins using only naturalized flows10
3.2 Yakima River Basin 425
and results reported. Results were presented in 420 several areas, including reservoir system inflows; instream flow at specific gages; ESA flow 421 targets and other environmental objectives; surface water deliveries; flow augmentation on the 422 Snake River; and end-of-month reservoir storage. A brief summary of some of these metrics 423 in each subbasin follows. 424
The Yakima River flows southeasterly for about 215 miles from its headwaters in the 426 Cascades east of Seattle, Washington to its confluence with the Columbia River near 427 Richland, Washington. The Yakima River system (Figure 11) includes the following storage 428 reservoirs owned and operated by Reclamation: Keechelus, Kachess, and Cle Elum dams and 429 reservoirs on the upper Yakima River and Bumping and Rimrock dams and reservoirs on the 430 Naches River. These projects provide most of the physical operations capabilities needed to 431 store and release water to meet irrigation demands, flood control needs, and instream fish 432 flow requirements. The irrigable lands eligible for service under the Reclamation’s Yakima 433 Project total about 465,000 acres. 434
For the Yakima River subbasin, the operations impacts assessment focused on potential 435 changes in water supply and system inflows occurring in the future climate scenarios. Across 436 all of the scenarios, the modeling results generally showed a season-specific impact on water 437 supply, with increased cool-season (November through March) inflow and decreased warm-438 season (April through September) inflow. The degree of the impact varied with the climate 439 change scenario. Season-specific changes in system inflows affected the assessment of the 440 total water supply available during the months of March through September and generally led 441 toward a reduction of the total water supply available as warm-season inflows decreased. 442 This change in the total water supply available affected the operating decisions related to river 443
10 Naturalized flows are defined as the flow volume if there were no demands (e.g., irrigation diversions) and no regulation of flows (e.g., reservoirs) in the river. Modified flows are defined for Reclamation subbasins as the flow volume with demands and flows regulated by reservoirs.
3.0 Summary of Part II Report: Reclamation Operations in the Yakima, Deschutes, and Snake River Basins
June 2011 – DRAFT Part IV: Summary 23
flow targets, water demand prorationing, and storage targets, resulting in a reduction of water 444 supply available for delivery to junior water users in the system. 445
Although the variability in operations was similar between scenarios, the operation protocols 446 were shifted according to the type of climate change (e.g., a shift towards reduced storage 447 conditions for scenarios that involve drier conditions). For scenarios involving drier 448 conditions, not only would typical delivery and storage conditions be reduced, but delivery 449 and storage conditions during drought years would also be reduced relative to historical 450 climate conditions. 451
Differences between the forecasting methods (i.e., perfect versus imperfect) were also 452 evaluated. While it was expected that a future decline of snowpack due to increased 453 temperatures would occur (thus reducing the effectiveness of snowpack as a predictor of 454 inflow), the differences in the results between the two methods were negligible. 455
Based on the comparison of HD and Transient operations results, the portrayal of typical 456 operational conditions was similar under both operations types when the Transient results 457 were viewed from a median perspective and assessed during periods associated with HD 458 climates. The Transient results differed from the HD climates in that they also characterized 459 the trend in operating conditions in a time-evolving fashion through the years that occur 460 before and after a given HD scenario. 461
3.2.1 Inflow 462
Water supply conditions were found to have season-specific impacts under the HD climates, 463 generally featuring increased cool-season inflow (during November through March) and 464 decreased warm season inflow (during April through September) (Figure 12). Season-465 specific changes in the system inflow affected the assessment of total water supply available 466 during the months of March through September, which affected operating decisions related to 467 river flow targets, water demand prorationing, and storage targets. For example, results show 468 that the reductions in the total water supply available from March through September led to 469 reduced flow targets on the Yakima River at Parker, particularly during the months of April 470 and May. Reductions in regulated flow targets and reductions in system inflows (above 471 upstream reservoirs and from local tributaries) led to corresponding changes in regulated 472 flows. 473

3.0 Summary of Part II Report: Reclamation Operations in the Yakima, Deschutes, and Snake River Basins
24 DRAFT Part IV: Summary – June 2011
474 Figure 12. Yakima River subbasin – median monthly system inflow, historical and HD climates. 475
3.2.2 End-of-Month Storage 476
The increase in cool-season system inflow and reductions in the total water supply available 477 from March through September led to an increase in typical cool-season storage, a decrease in 478 storage during the warm-season, and a decline in end-of-season storage, an indication of less 479 manageable water in the subbasin. Figure 13 depicts storage volume changes in five major 480 reservoirs on the Yakima River. For scenarios involving drier conditions, not only would 481 typical end-of-month storage volume be reduced, but drought year storage conditions would 482 also be reduced relative to historical climate volume. 483

3.0 Summary of Part II Report: Reclamation Operations in the Yakima, Deschutes, and Snake River Basins
June 2011 – DRAFT Part IV: Summary 25
484 Figure 13. Yakima River subbasin – median monthly system storage, historical and HD climates. 485
3.2.3 Flow and Surface Water Delivered 486
Concerning flows and surface water deliveries, the study results varied considerably across 487 the HD climates during both periods (2020s and 2040s), where the degree of change generally 488 depended on the type of HD climate change (e.g., less warm-season flow or delivery 489 reduction for the wetter HD climates, and more delivery reduction for the drier climates). For 490 scenarios involving drier conditions, the typical delivery conditions would be reduced, but 491 drought year delivery conditions would also be reduced relative to historical climate 492 conditions. Surface water deliveries above the Parker gauge reflect these conditions (Figure 493 14). 494

3.0 Summary of Part II Report: Reclamation Operations in the Yakima, Deschutes, and Snake River Basins
26 DRAFT Part IV: Summary – June 2011
495 Figure 14. Yakima River subbasin – median monthly total diversions above Parker, historical and HD 496 climates. 497
3.2.4 Forecasting 498
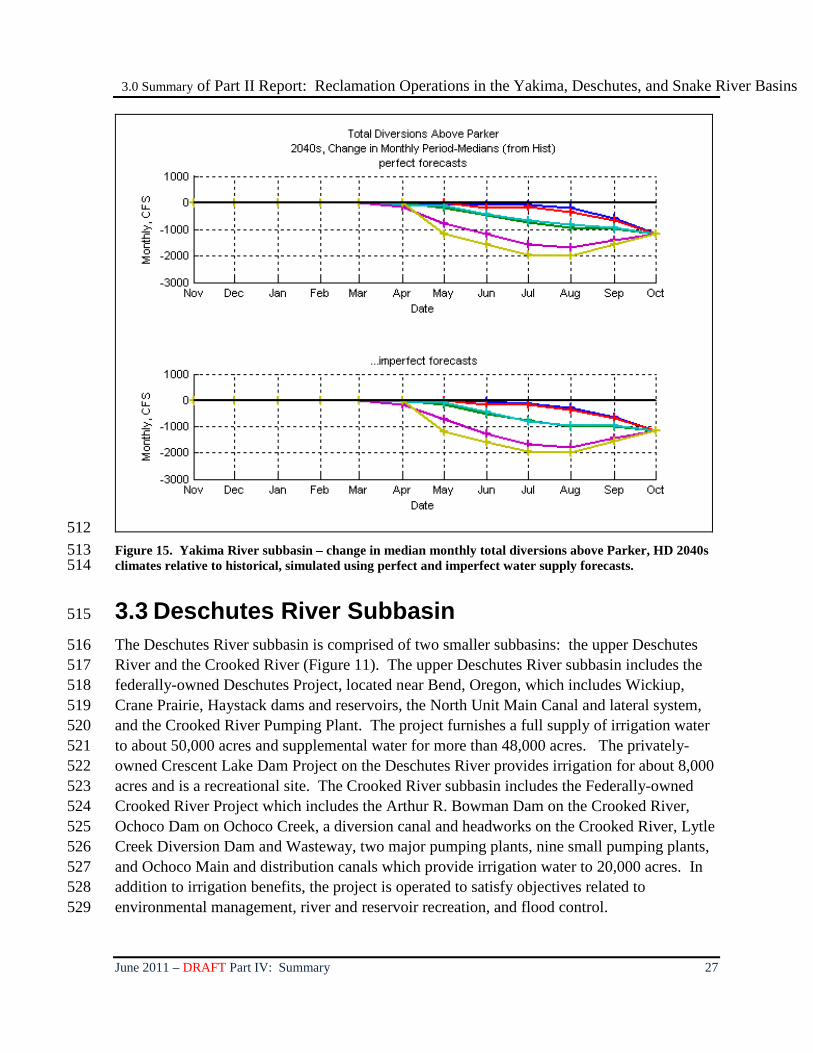
It appeared that Yakima River operations portrayal under the HD climates was not very 499 sensitive to the use of perfect or imperfect forecasts in the operations simulations (Figure 15). 500 The degree of climate change featured in the HD 2020s and HD 2040s climates may not have 501 been substantial enough to diminish snowpack to the point of causing enough impact on the 502 Yakima subbasin seasonal-runoff volume forecasting, total water supply available, and 503 dependent operational decisions (at least during the period of March through May when the 504 forecasts quality under HD 2020s and 2040s climates remains similar to historical). The 505 Yakima River subbasin features simulated operational targets and decisions that can vary 506 through time with varying forecasts as time goes on. This gives the system a built-in 507 incremental ability to adjust as cumulative inflow and remainder-of-year forecast inflow 508 conditions update through a given water year. As a result, it did not appear to be critical that 509 the use of RMJOC climate/hydrology scenarios for Yakima River subbasin operations studies 510 also include the use of the imperfect water supply forecasts developed for these scenarios. 511
3.0 Summary of Part II Report: Reclamation Operations in the Yakima, Deschutes, and Snake River Basins
June 2011 – DRAFT Part IV: Summary 27
512 Figure 15. Yakima River subbasin – change in median monthly total diversions above Parker, HD 2040s 513 climates relative to historical, simulated using perfect and imperfect water supply forecasts. 514
3.3 Deschutes River Subbasin 515
The Deschutes River subbasin is comprised of two smaller subbasins: the upper Deschutes 516 River and the Crooked River (Figure 11). The upper Deschutes River subbasin includes the 517 federally-owned Deschutes Project, located near Bend, Oregon, which includes Wickiup, 518 Crane Prairie, Haystack dams and reservoirs, the North Unit Main Canal and lateral system, 519 and the Crooked River Pumping Plant. The project furnishes a full supply of irrigation water 520 to about 50,000 acres and supplemental water for more than 48,000 acres. The privately-521 owned Crescent Lake Dam Project on the Deschutes River provides irrigation for about 8,000 522 acres and is a recreational site. The Crooked River subbasin includes the Federally-owned 523 Crooked River Project which includes the Arthur R. Bowman Dam on the Crooked River, 524 Ochoco Dam on Ochoco Creek, a diversion canal and headworks on the Crooked River, Lytle 525 Creek Diversion Dam and Wasteway, two major pumping plants, nine small pumping plants, 526 and Ochoco Main and distribution canals which provide irrigation water to 20,000 acres. In 527 addition to irrigation benefits, the project is operated to satisfy objectives related to 528 environmental management, river and reservoir recreation, and flood control. 529
3.0 Summary of Part II Report: Reclamation Operations in the Yakima, Deschutes, and Snake River Basins
28 DRAFT Part IV: Summary – June 2011
In the Deschutes River Basin, the six HD 2020 scenarios, the six HD 2040 scenarios, and the 530 historical conditions were simulated using the modified flow models. The naturalized flow 531 model was used to compare simulated historical conditions developed by the VIC model to 532 Reclamation’s naturalized flows. The overall pattern for the Deschutes River subbasin was 533 earlier and higher runoff volumes than historical conditions, although these results were less 534 dramatic in the HD 2020s scenarios than in the HD 2040s scenarios. In the dry climate 535 projections, decreases in inflow, end-of-month storage, and flow in the channel at specific 536 gage locations which would result in surface delivery reductions were predicted for the 537 Crooked River in the HD 2040 scenario. In regard to flows, end-of-month storage, inflow to 538 reservoirs, surface water delivered, and Endangered Species Act (ESA) objectives, the 539 Crooked River system was projected to have greater variances from historical conditions than 540 the variations projected for the upper Deschutes River subbasin. The change in available 541 water supply occurred because of the shift to an earlier timing of peak flow runoff and a 542 decrease in late summer instream flows. Reservoirs would release water earlier and be relied 543 upon more heavily in the summer and late fall. These projected changes would create greater 544 water supply concerns for irrigators with natural flow water rights than those with storage 545 water rights. 546
Because the reservoir model is based on monthly input as opposed to daily input, the ESA 547 objectives were analyzed using a surrogate monthly approach rather than the daily objectives 548 as outlined in the 2010 Supplemental Federal Columbia River Power System Biological 549 Opinion (Biological Opinion) (NOAA Fisheries Service 2010). In general, minimum flows 550 are required at certain locations on the Crooked River and on the Deschutes River; if those 551 flows are not met, outflows from Prineville Reservoir on the Crooked River are required to 552 meet minimum flows. Based on this surrogate approach, occurrences of not meeting the 553 average flow requirements for October (the only month evaluated) increased in dry 554 projections and decreased in the wetter projections as expected. However, in the extremely 555 dry conditions of the HD 2040 scenarios, there were two projected occurrences when the 556 Prineville Reservoir did not have a sufficient water volume to supplement the Crooked River 557 flow. Because these values were developed using monthly averages, they do not relate 558 directly to the 7-day moving average requirement in the Biological Opinion, but may be 559 indicative of trends that could occur in extremely dry or drought periods in the Deschutes 560 River subbasin. 561
While the HD scenarios predicted larger variations in the metrics evaluated, the Transient 562 scenarios indicated that over time, most of those metrics would have relatively low rates of 563 change when viewed through the 150-year time window. The differences between the 564 forecast method chosen (i.e., perfect vs. imperfect) were negligible. 565

3.0 Summary of Part II Report: Reclamation Operations in the Yakima, Deschutes, and Snake River Basins
June 2011 – DRAFT Part IV: Summary 29
3.3.1 Inflow 566
Inflow to Crane Prairie, Wickiup, and Crescent reservoirs (cumulative inflow for all three 567 reservoirs), to Prineville and Ochoco reservoirs (cumulative), and in the entire Deschutes 568 River subbasin at Lake Billy Chinook was evaluated (Figure 16 depicts the total system 569 inflow changes). In the HD climates, total inflow (monthly median) into Lake Billy Chinook 570 and into the three reservoirs on the upper Deschutes River increased above historical 571 conditions. In addition, the peak of the total inflow (monthly median) magnitude shifted at 572 least 1 month earlier in the year when compared to historical inflow. A slight increase in 573 inflow was predicted to the Crooked River reservoirs, but no shift in peak inflow timing was 574 observed. Inflows tended to be higher in magnitude earlier in the year and lower during the 575 summer and fall when compared to the historical conditions overall. In the HD 2040 576 climates, these results were more exaggerated due to the large variation in temperature and 577 precipitation in the climate models used as described above. 578
In the Transient scenario, the ensemble median reservoir inflow of all six climate change 579 projections decreased slightly over time and then stabilized into the 22nd century. 580
581 Figure 16. Monthly median (top plates) and change in monthly median inflow from VIC simulated inflow 582 (bottom plates) for the HD 2020 and HD 2040 climate change projections above Lake Billy Chinook on the 583 Deschutes River. 584

3.0 Summary of Part II Report: Reclamation Operations in the Yakima, Deschutes, and Snake River Basins
30 DRAFT Part IV: Summary – June 2011
3.3.2 End-of-Month Storage at Major Reservoirs 585
End-of-month storage was evaluated for the Prineville and Ochoco reservoirs on the Crooked 586 River, for Wickiup, Crescent, and Crane Prairie reservoirs on the upper Deschutes River, and 587 in total at Lake Billy Chinook on the Deschutes River was evaluated (Figure 17 depicts the 588 total system changes). The ability to refill the reservoirs each year in both HD scenarios was 589 higher than historical refill levels from October through March or April because future winter 590 precipitation comes in the form of rain, but reservoirs draft deeper during the summer months 591 to meet demands. In extremely dry climates, the drafts that were required during the summer 592 and fall were so significant that refill the following year was not possible. In the Transient 593 climates, a decreasing trend in storage was predicted overall. 594
595 Figure 17. Change in monthly period-median storage for the HD 2040 projections for all reservoirs 596 storage on the Deschutes River. 597
3.3.3 Flow 598
River flow was evaluated at two locations: on the Crooked River upstream of its confluence 599 with the Deschutes River and upstream of Lake Billy Chinook on the Deschutes River (Figure 600 18). Generally, flow on the Crooked River upstream of its confluence increased in the wetter 601 climates and decreased in the neutral or dry climates. The driest climates had the most severe 602

3.0 Summary of Part II Report: Reclamation Operations in the Yakima, Deschutes, and Snake River Basins
June 2011 – DRAFT Part IV: Summary 31
decrease in flow in April each year in both HD scenarios. On the Deschutes River, this 603 pattern was not observed. Generally, the Deschutes River upstream of Lake Billy Chinook 604 was shown to have an increase in flow above historical in all of the climates for almost the 605 entire year. Because of the influence of ground water in the Deschutes River subbasin, it 606 likely contributed to flow volumes reported. 607
608 Figure 18. Flow in total and change in total (from VIC historical) monthly period-medians at USGS Gage 609 14076500 (DCCO) on the Deschutes River. 610
3.3.4 Surface Water Delivered 611
Surface water delivered was summed for all demands on the Crooked River, the upper 612 Deschutes River and in the total system (Figure 19 depicts the total system changes). In the 613 HD 2020 climates, the most significant decreases in delivery were in only the driest climates 614 in May and June, but by the end of the summer, deliveries had generally rebounded to 615 historical levels. In the HD 2040s, the surface water delivered was less than historical 616 deliveries for the entire irrigation season. The change in supply occurred because of the shift 617 to an earlier timing of peak flow runoff and a decrease in late summer instream flows. 618

3.0 Summary of Part II Report: Reclamation Operations in the Yakima, Deschutes, and Snake River Basins
32 DRAFT Part IV: Summary – June 2011
Reservoirs began drafting11 earlier and were relied upon more heavily in the summer and late 619 fall. Predicted changes appeared to create greater water supply concerns for those with 620 natural flow water rights when compared to those with storage water rights because of the 621 availability of stored reservoir water for those with storage water rights. 622
623 Figure 19. Total and change in monthly-period medians (from VIC historical) of surface water delivered 624 above Lake Billy Chinook. 625
3.3.5 ESA for Resident Species and Other Environmental Objectives 626
In the Deschutes River subbasin, there are three ESA objectives (detailed in the 2005 627 Biological Opinion). Each requires certain flow volumes to be met on a 7-day moving 628 average basis from October through mid-November of each year. Because the Deschutes 629 Planning Model operates on a monthly time-step,12
11 Drafts are defined as the water that is removed or the act of removing water from a reservoir by releasing water to lower the water surface level (elevation) of the reservoir. For the purpose of flood control, drafting of the reservoir makes space available in the reservoir to capture winter rain events or spring snowmelt.
a surrogate approach was developed to 630 evaluate the potential impacts of climate change on these daily requirements. This approach 631
12 A time step is the amount of time that conditions are assumed to be constant.

3.0 Summary of Part II Report: Reclamation Operations in the Yakima, Deschutes, and Snake River Basins
June 2011 – DRAFT Part IV: Summary 33
evaluated the monthly equivalent of the ESA requirements for the month of October only (as 632 opposed to October and part of November). Based on this surrogate approach, occurrences of 633 not meeting monthly average flow requirements increased in dry projections and decreased in 634 the wetter projections as could be expected. However, in the extremely dry conditions in the 635 HD 2040 scenario, there were two occurrences when no water was available in the reservoir 636 to supplement channel flow. This surrogate approach may be indicative of trends that may 637 occur in extremely dry or drought periods in the Deschutes River subbasin. 638
3.3.6 Forecasting 639
As warming continues, snowpack will diminish. It was believed that a decrease in snowpack 640 would result in decreased accuracy in predicting runoff and that in turn would result in a 641 change in the quality of water management decisions. This cause-and-effect relationship was 642 not observed in this study because model output was relatively insensitive to whether a 643 perfect or imperfect forecast mode was used. As reported in the Part II Report, forecasting 644 quality done as part of the Deschutes River subbasin analysis was poor, but was consistent 645 with real-time reservoir operations. Because very few reservoir operating decisions are made 646 based on forecasts alone, it was not surprising that the model output was not significantly 647 different between either forecasting modes. 648
3.4 Snake River Subbasin 649
The Snake River subbasin above Brownlee Reservoir has numerous Reclamation projects, 650 both large and small, including Minidoka, Palisades, Ririe, Boise, and Payette. The Minidoka 651 Project furnishes irrigation water from five reservoirs that have a combined active storage 652 capacity of more than 3 million acre-feet. The project consists of Minidoka Dam and 653 Powerplant and Lake Walcott, Jackson Lake Dam and Jackson Lake, American Falls Dam 654 and Reservoir, Island Park Dam and Reservoir, Grassy Lake Dam and Grassy Lake, two 655 diversion dams, canals, laterals, drains, and 177 water supply wells. In addition to irrigation 656 benefits, the project is also operated to satisfy objectives related to environmental 657 management, recreation, hydroelectric power generation, and flood control. Reclamation’s 658 projects in the upper Snake River are generally operated as a unified storage system. 659
The Palisades project principally features Palisades Dam Reservoir and Powerplant on the 660 South Fork of the Snake River that has an active capacity of 1.2 million acre-feet. The project 661 provides a supplemental water supply to about 650,000 acres of irrigated land and the 662 176,600-kilowatt hydroelectric powerplant furnishes energy needed in the upper valley to 663 serve irrigation pumping units, municipalities, rural cooperatives, and other power users. In 664 addition to providing needed holdover storage, the project is operated for flood control and 665 hydropower generation. 666

3.0 Summary of Part II Report: Reclamation Operations in the Yakima, Deschutes, and Snake River Basins
34 DRAFT Part IV: Summary – June 2011
The Boise Project includes the Boise and Payette rivers, both major tributaries to the Snake 667 River. The system of reservoirs is operated primarily for irrigation, flood control, recreation, 668 and Endangered Species Act (ESA) issues. Reclamation’s reservoirs in the Boise River 669 subbasin are operated as unified storage systems as are those in the Payette River subbasin. 670 The Boise Project features five storage dams impounding about 1.8 million acre-feet of water, 671 two diversion dams, three powerplants, seven pumping plants, canals, laterals, and drains and 672 furnishes a full irrigation water supply to about 224,000 acres and a supplemental supply to 673 about 173,000 acres in southwestern Idaho and eastern Oregon. In addition to irrigation 674 benefits, the project is also operated to satisfy objectives related to environmental 675 management, recreation, hydroelectric power generation and flood control. The Payette 676 Division includes the Deadwood and Cascade dams and reservoirs. From these projects, 677 60,000 acres receive a full water supply and 61,000 acres receive a supplemental supply. 678
In the Snake River subbasin, the six HD 2020 scenarios, the six HD 2040 scenarios, and the 679 historical conditions were simulated using the modified flow models. As with the Deschutes, 680 the naturalized flow model was used to compare simulated historical natural flows generated 681 by the VIC model and those naturalized flows generated by Reclamation. Future climate 682 projections used in this study were selected at a Columbia River system scale to represent the 683 10, 50, and 90 percentile changes relative to historical conditions. However, this approach 684 inadvertently resulted in primarily wetter climate change projections at a Snake River 685 subbasin scale when compared to historical temperatures and precipitation amounts. As a 686 result, most of the climate projections indicated increased inflow to major reservoirs in the 687 late spring/early summer, higher reservoir elevations in spring, and increases in spring flows. 688 In the late summer/early fall, most drier climate projections indicated lower reservoir 689 elevations and a decrease in irrigation season flows with impacts on surface water deliveries. 690 A wider range of potential climate change projections should be considered in future work at 691 the subbasin level. 692
3.4.1 Inflow 693
Inflow volumes to major reservoirs were summed in the upper Snake River above Brownlee 694 Reservoir included Jackson, Palisades, Island Park, Grassy Lake, Ririe, American Falls, and 695 Minidoka reservoirs. Major reservoirs on the Boise River include Anderson, Arrowrock, and 696 Lucky Peak and on the Payette River reservoirs included Payette Lake, Cascade, and 697 Deadwood. 698
Inflow hydrology experienced a shift in either peak flow timing, volume, or both in all of the 699 major reservoir groups. In flow volume to the reservoirs above Brownlee Reservoir increased 700 in all of the climate scenarios from January to April or May and decreased in the summer to 701 fall seasons (Figure 20). A shift of one month in the timing of the peak inflow of the wettest 702 climate simulations was observed in the inflow to reservoirs on the upper Snake River above 703

3.0 Summary of Part II Report: Reclamation Operations in the Yakima, Deschutes, and Snake River Basins
June 2011 – DRAFT Part IV: Summary 35
Brownlee Reservoir. A similar change in the pattern of inflow volume was observed in the 704 Boise River, but no shift in the timing of peak of the inflow occurred in any of the climates. 705 The Payette River reservoirs had moderate increases in inflow early in the calendar year and 706 the lowest inflow volume occurred in June in all climates. No shift in the timing of the peak 707 inflow was evident in the Payette River subbasin. 708
709 Figure 20. Total (top panel) and change in period-median monthly inflows (bottom panel) from VIC 710 simulated historical above Brownlee Reservoir in the upper Snake River subbasin. 711
3.4.2 End-of-Month Storage 712
End-of-month storage13
13 End-of-month storage is the remaining volume of water in each reservoir or system of reservoirs after water releases have been made based on inflow, irrigation demands, flood control, and current operational constraints.
values are presented as a cumulative reservoir volume above the 713 reporting point (i.e., Boise River, Payette River, Snake River above Minidoka, Snake River 714 above Milner, and Snake River above Brownlee). The resultant value is a cumulative amount 715 of total storage volume of the reservoirs in that system, not an individual reservoir. 716

3.0 Summary of Part II Report: Reclamation Operations in the Yakima, Deschutes, and Snake River Basins
36 DRAFT Part IV: Summary – June 2011
The increase in inflow volume that was observed in 2020 and 2040 HD scenarios for most of 717 the 12 climate change projections resulted in a shift in the timing of the peak end-of-month 718 storage to earlier in the year at most reporting points in the Snake River subbasin. End-of-719 month storage in reservoirs above Brownlee Reservoir reflected an increase in storage 720 through May or June and then a decrease in end-of-month storage during the irrigation season 721 through September when compared to historical storage (Figure 21). In the driest climate in 722 either the HD 2020s or HD 2040s, end-of month storage volume was less than historical 723 storage at the end of the water year and did not fully reach refill until January or February of 724 the following year. This pattern was indicative of a greater need for stored water during the 725 high demand summer season. 726
727 Figure 21. Total and change in monthly period-median (from VIC simulated historical) end-of-month 728 storage above Brownlee Reservoir in the Snake River subbasin. 729
On the Boise River (not shown), the end-of month storage volumes followed similar patterns 730 as on the upper Snake River. During dry years, a 10 to 15 percent decrease in volume was 731 observed for late summer and fall. The drafts required to meet demands during irrigation 732 season made refill the following year a challenge in the driest projections. The timing of the 733 monthly peak did not appear to shift to earlier in the year, but it should be noted that with a 734 monthly time-step model, a shift in timing by days or weeks would not be evident. While the 735
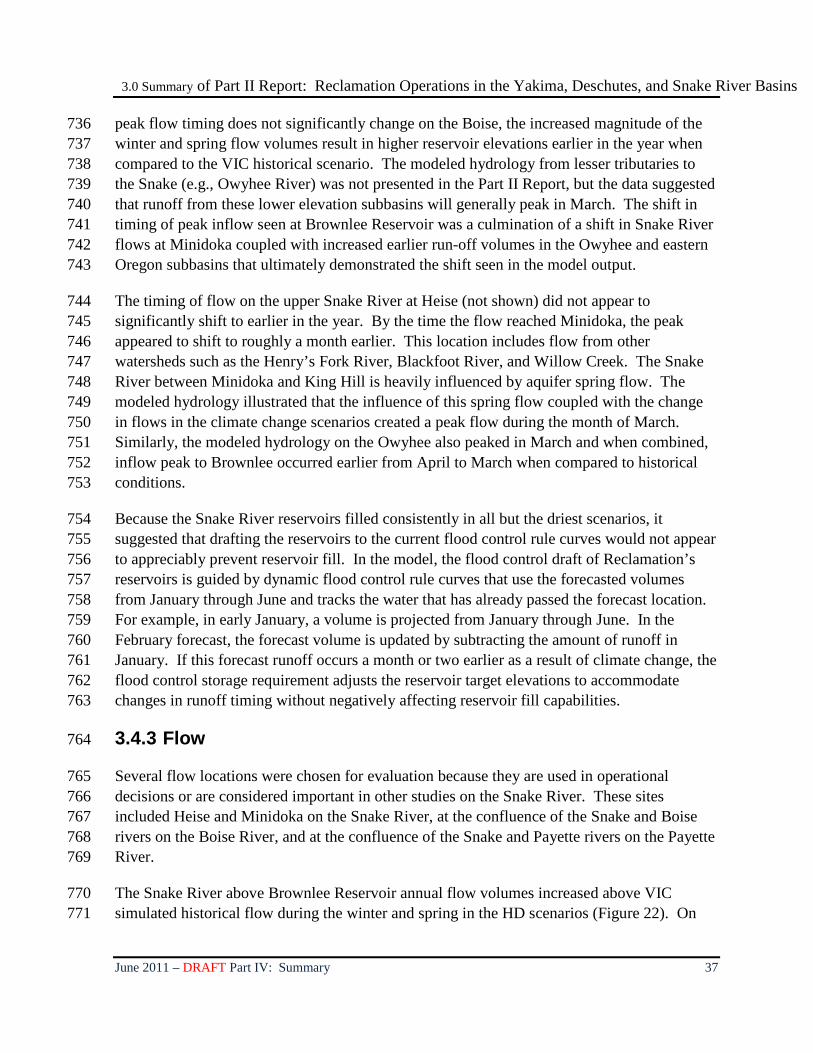
3.0 Summary of Part II Report: Reclamation Operations in the Yakima, Deschutes, and Snake River Basins
June 2011 – DRAFT Part IV: Summary 37
peak flow timing does not significantly change on the Boise, the increased magnitude of the 736 winter and spring flow volumes result in higher reservoir elevations earlier in the year when 737 compared to the VIC historical scenario. The modeled hydrology from lesser tributaries to 738 the Snake (e.g., Owyhee River) was not presented in the Part II Report, but the data suggested 739 that runoff from these lower elevation subbasins will generally peak in March. The shift in 740 timing of peak inflow seen at Brownlee Reservoir was a culmination of a shift in Snake River 741 flows at Minidoka coupled with increased earlier run-off volumes in the Owyhee and eastern 742 Oregon subbasins that ultimately demonstrated the shift seen in the model output. 743
The timing of flow on the upper Snake River at Heise (not shown) did not appear to 744 significantly shift to earlier in the year. By the time the flow reached Minidoka, the peak 745 appeared to shift to roughly a month earlier. This location includes flow from other 746 watersheds such as the Henry’s Fork River, Blackfoot River, and Willow Creek. The Snake 747 River between Minidoka and King Hill is heavily influenced by aquifer spring flow. The 748 modeled hydrology illustrated that the influence of this spring flow coupled with the change 749 in flows in the climate change scenarios created a peak flow during the month of March. 750 Similarly, the modeled hydrology on the Owyhee also peaked in March and when combined, 751 inflow peak to Brownlee occurred earlier from April to March when compared to historical 752 conditions. 753
Because the Snake River reservoirs filled consistently in all but the driest scenarios, it 754 suggested that drafting the reservoirs to the current flood control rule curves would not appear 755 to appreciably prevent reservoir fill. In the model, the flood control draft of Reclamation’s 756 reservoirs is guided by dynamic flood control rule curves that use the forecasted volumes 757 from January through June and tracks the water that has already passed the forecast location. 758 For example, in early January, a volume is projected from January through June. In the 759 February forecast, the forecast volume is updated by subtracting the amount of runoff in 760 January. If this forecast runoff occurs a month or two earlier as a result of climate change, the 761 flood control storage requirement adjusts the reservoir target elevations to accommodate 762 changes in runoff timing without negatively affecting reservoir fill capabilities. 763
3.4.3 Flow 764
Several flow locations were chosen for evaluation because they are used in operational 765 decisions or are considered important in other studies on the Snake River. These sites 766 included Heise and Minidoka on the Snake River, at the confluence of the Snake and Boise 767 rivers on the Boise River, and at the confluence of the Snake and Payette rivers on the Payette 768 River. 769
The Snake River above Brownlee Reservoir annual flow volumes increased above VIC 770 simulated historical flow during the winter and spring in the HD scenarios (Figure 22). On 771

3.0 Summary of Part II Report: Reclamation Operations in the Yakima, Deschutes, and Snake River Basins
38 DRAFT Part IV: Summary – June 2011
the Snake River at Heise flow location, which is further upstream in the watershed, flow was 772 shown to increase during winter and spring in all but the driest projections in both HD 2020 773 and HD 2040 (except MW/D). Only the MW/W climate projection in the HD 2040 scenario 774 peak flow timing was observed to shift to earlier in the year by one month. Flow on the 775 Snake River at Minidoka Reservoir also had larger volumes of flow in the winter and spring 776 with a shift in the timing of that peak flow. Current spring return patterns peak in March, 777 influencing the Snake River flow at King Hill. The Boise River at the confluence with the 778 Snake River was shown to have increased flows in winter and spring, but no change in the 779 timing of the peak. Peak flow on the Payette River at the confluence with the Snake River, 780 was generally shown to both shift in timing and increase in volume in both HD scenarios and 781 most climate change projections. 782
783 Figure 22. Total and change in total (compared to VIC simulated historical) monthly period-medians flow 784 in at Brownlee Reservoir on the Snake River. 785
3.4.4 Surface Water Delivered 786
Surface water delivered (natural flow and storage water) was cumulatively summed as was 787 done in the end-of-month storage metric. The amount of surface water delivered above 788 Brownlee Reservoir decreased slightly (Figure 22). A decrease in surface water delivery 789 occurred in the latter part of the irrigation season above Brownlee Reservoir on the upper 790 Snake River, most of which occurred above Milner. On the Payette and Boise rivers, 791 deliveries were generally unaffected in most climates except the driest in the HD 2040 792

3.0 Summary of Part II Report: Reclamation Operations in the Yakima, Deschutes, and Snake River Basins
June 2011 – DRAFT Part IV: Summary 39
scenario. 793
794 Figure 23. Total and change in surface water delivered above Brownlee Reservoir in the HD 2020 and HD 795 2040 scenarios. 796
The most significant decrease in surface water delivered was observed in the driest climates in 797 both HD scenarios on all river systems presented. For irrigators, this study suggests that there 798 will be a shift in use of irrigation water from natural flow to storage water to meet demands 799 under the drier future conditions. While winter flow increases and is stored, the lower 800 summer flows causes more reliance on that stored water in August and September. This 801 apparent shift has benefits and downsides to various facets of managing the Snake River 802 subbasin for all the needs and constraints imposed under the current level of development. 803 Implications to the ground water aquifers and river interaction were not analyzed and 804 addressed in this analysis. 805
It should also be noted that the driest climate used in this analysis was minimally dry when 806 compared to historical conditions. Additional GCMs that indicate larger decreases in 807 precipitation in the Snake River subbasin should be evaluated to fully understand the range of 808 potential impacts due to climate change. 809
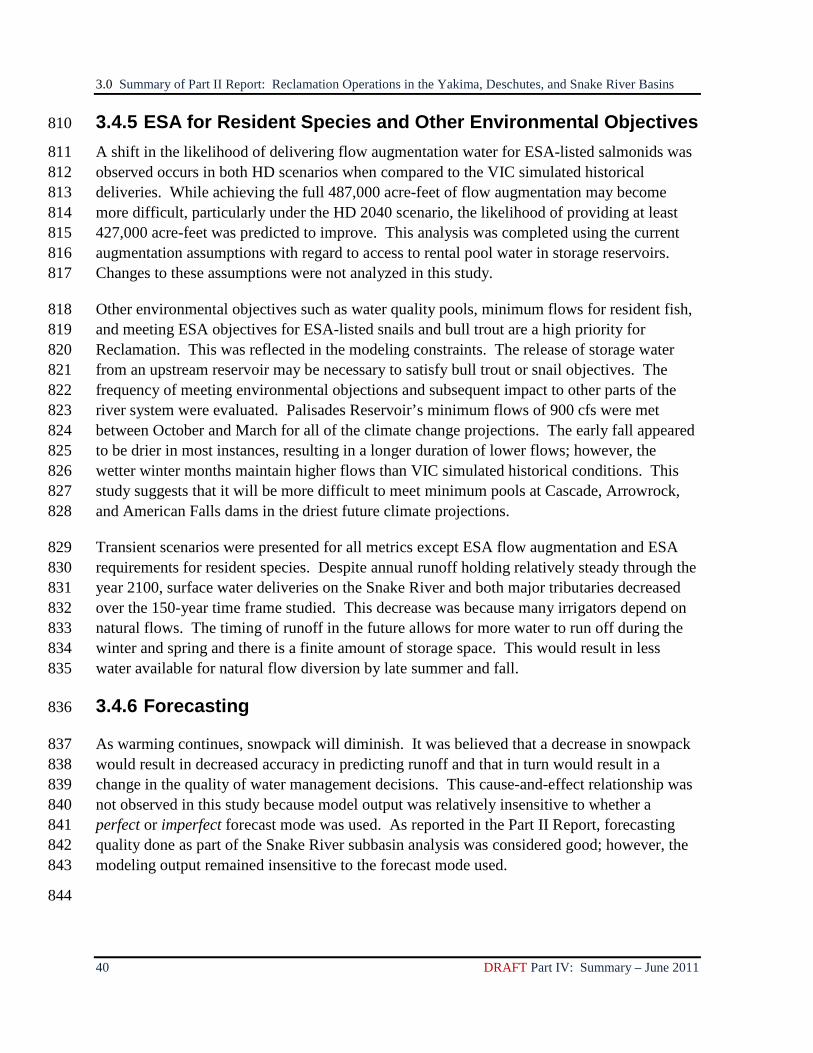
3.0 Summary of Part II Report: Reclamation Operations in the Yakima, Deschutes, and Snake River Basins
40 DRAFT Part IV: Summary – June 2011
3.4.5 ESA for Resident Species and Other Environmental Objectives 810
A shift in the likelihood of delivering flow augmentation water for ESA-listed salmonids was 811 observed occurs in both HD scenarios when compared to the VIC simulated historical 812 deliveries. While achieving the full 487,000 acre-feet of flow augmentation may become 813 more difficult, particularly under the HD 2040 scenario, the likelihood of providing at least 814 427,000 acre-feet was predicted to improve. This analysis was completed using the current 815 augmentation assumptions with regard to access to rental pool water in storage reservoirs. 816 Changes to these assumptions were not analyzed in this study. 817
Other environmental objectives such as water quality pools, minimum flows for resident fish, 818 and meeting ESA objectives for ESA-listed snails and bull trout are a high priority for 819 Reclamation. This was reflected in the modeling constraints. The release of storage water 820 from an upstream reservoir may be necessary to satisfy bull trout or snail objectives. The 821 frequency of meeting environmental objections and subsequent impact to other parts of the 822 river system were evaluated. Palisades Reservoir’s minimum flows of 900 cfs were met 823 between October and March for all of the climate change projections. The early fall appeared 824 to be drier in most instances, resulting in a longer duration of lower flows; however, the 825 wetter winter months maintain higher flows than VIC simulated historical conditions. This 826 study suggests that it will be more difficult to meet minimum pools at Cascade, Arrowrock, 827 and American Falls dams in the driest future climate projections. 828
Transient scenarios were presented for all metrics except ESA flow augmentation and ESA 829 requirements for resident species. Despite annual runoff holding relatively steady through the 830 year 2100, surface water deliveries on the Snake River and both major tributaries decreased 831 over the 150-year time frame studied. This decrease was because many irrigators depend on 832 natural flows. The timing of runoff in the future allows for more water to run off during the 833 winter and spring and there is a finite amount of storage space. This would result in less 834 water available for natural flow diversion by late summer and fall. 835
3.4.6 Forecasting 836
As warming continues, snowpack will diminish. It was believed that a decrease in snowpack 837 would result in decreased accuracy in predicting runoff and that in turn would result in a 838 change in the quality of water management decisions. This cause-and-effect relationship was 839 not observed in this study because model output was relatively insensitive to whether a 840 perfect or imperfect forecast mode was used. As reported in the Part II Report, forecasting 841 quality done as part of the Snake River subbasin analysis was considered good; however, the 842 modeling output remained insensitive to the forecast mode used. 843
844
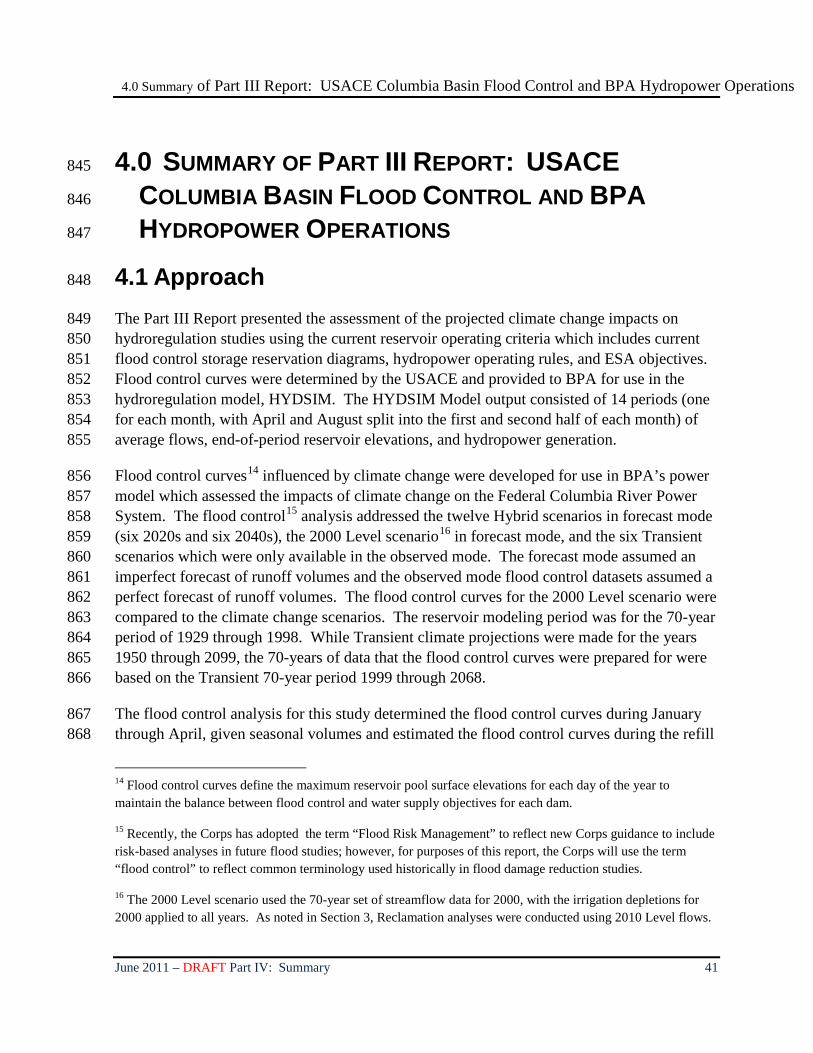
4.0 Summary of Part III Report: USACE Columbia Basin Flood Control and BPA Hydropower Operations
June 2011 – DRAFT Part IV: Summary 41
4.0 SUMMARY OF PART III REPORT: USACE 845
COLUMBIA BASIN FLOOD CONTROL AND BPA 846
HYDROPOWER OPERATIONS 847
4.1 Approach 848
The Part III Report presented the assessment of the projected climate change impacts on 849 hydroregulation studies using the current reservoir operating criteria which includes current 850 flood control storage reservation diagrams, hydropower operating rules, and ESA objectives. 851 Flood control curves were determined by the USACE and provided to BPA for use in the 852 hydroregulation model, HYDSIM. The HYDSIM Model output consisted of 14 periods (one 853 for each month, with April and August split into the first and second half of each month) of 854 average flows, end-of-period reservoir elevations, and hydropower generation. 855
Flood control curves14 influenced by climate change were developed for use in BPA’s power 856 model which assessed the impacts of climate change on the Federal Columbia River Power 857 System. The flood control15 analysis addressed the twelve Hybrid scenarios in forecast mode 858 (six 2020s and six 2040s), the 2000 Level scenario16
The flood control analysis for this study determined the flood control curves during January 867 through April, given seasonal volumes and estimated the flood control curves during the refill 868
in forecast mode, and the six Transient 859 scenarios which were only available in the observed mode. The forecast mode assumed an 860 imperfect forecast of runoff volumes and the observed mode flood control datasets assumed a 861 perfect forecast of runoff volumes. The flood control curves for the 2000 Level scenario were 862 compared to the climate change scenarios. The reservoir modeling period was for the 70-year 863 period of 1929 through 1998. While Transient climate projections were made for the years 864 1950 through 2099, the 70-years of data that the flood control curves were prepared for were 865 based on the Transient 70-year period 1999 through 2068. 866
14 Flood control curves define the maximum reservoir pool surface elevations for each day of the year to maintain the balance between flood control and water supply objectives for each dam.
15 Recently, the Corps has adopted the term “Flood Risk Management” to reflect new Corps guidance to include risk-based analyses in future flood studies; however, for purposes of this report, the Corps will use the term “flood control” to reflect common terminology used historically in flood damage reduction studies.
16 The 2000 Level scenario used the 70-year set of streamflow data for 2000, with the irrigation depletions for 2000 applied to all years. As noted in Section 3, Reclamation analyses were conducted using 2010 Level flows.

4.0 Summary of Part III Report: USACE Columbia Basin Flood Control and BPA Hydropower Operations
42 DRAFT Part IV: Summary – June 2011
period of May through July. Flood control analyses usually require daily streamflow data for 869 system flood control modeling (regulations) to determine flood control refill operations that 870 meet ESA objectives at The Dalles, but due to time limitations, daily modeling was not 871 performed. From a probabilistic or risk perspective, analyses were not developed of how 872 existing procedures meet system flood flow objectives with climate change hydrology; 873 however, the drawdown curves developed from this study are a good representation of climate 874 change impacts during drawdown given the current flood control procedures. 875
The reservoir operations assessment was performed by first establishing two Base Case 876 scenarios, one for comparison with the HD scenarios and one for comparison with the 877 Transient scenarios, assuming current level operations and fishery constraints. The HD Base 878 Case assumed forecasted volumes in developing the flood control curves and the Transient 879 Base Case assumed observed volumes (perfect foresight) in the determination of the flood 880 control curves. A total of eighteen climate change scenarios (six HD 2020s scenarios, six HD 881 2040s scenarios, and six Transient scenarios) with their respective climate changes in water 882 supply were modeled and compared to the two Base Case scenarios. The model results 883 identified the climate change impacts to reservoir elevations, outflows, spill outflows, and 884 Federal and regional hydropower generation. The comparisons of the climate change 885 scenarios to the Base Case scenarios showing the impacts of climate change on the power 886 system can be found in the Part III Report in the appendix. 887
4.2 Key Findings 888
4.2.1 Flood Control 889
In general, while climate change projections indicate increased annual average runoff 890 volumes in the Columbia River Basin, higher winter flows and earlier spring snowmelt also 891 indicate slightly less runoff from April through August. The impact to flood control curves, 892 the highest reservoir elevations at which the projects may operate, is dependent upon the 893 subbasin’s climate response, where the project is located in the subbasin, and the climate 894 change scenario. For example, in nearly all of the HD scenarios, the May through September 895 volume of runoff at Hungry Horse Reservoir and the April through July runoff at Dworshak 896 Reservoir are significantly less with climate change scenarios than under historical conditions, 897 resulting in average higher flood control upper curves for each month January through April. 898 To demonstrate this concept, Figure 24 shows the April 30 average and median upper curve 899 elevations for Dworshak Reservoir for each HD 2020 scenario. The top and bottom of the 900 boxes are the 25 percent and 75 percent exceedances, respectively. The dashes at the top and 901 bottom of the vertical lines are the maximum and minimum elevations for that scenario. For 902 other projects such as Libby and Brownlee reservoirs, about half the HD scenarios resulted in 903 average higher curves and half resulted in average lower curves as shown in Figure 25. 904
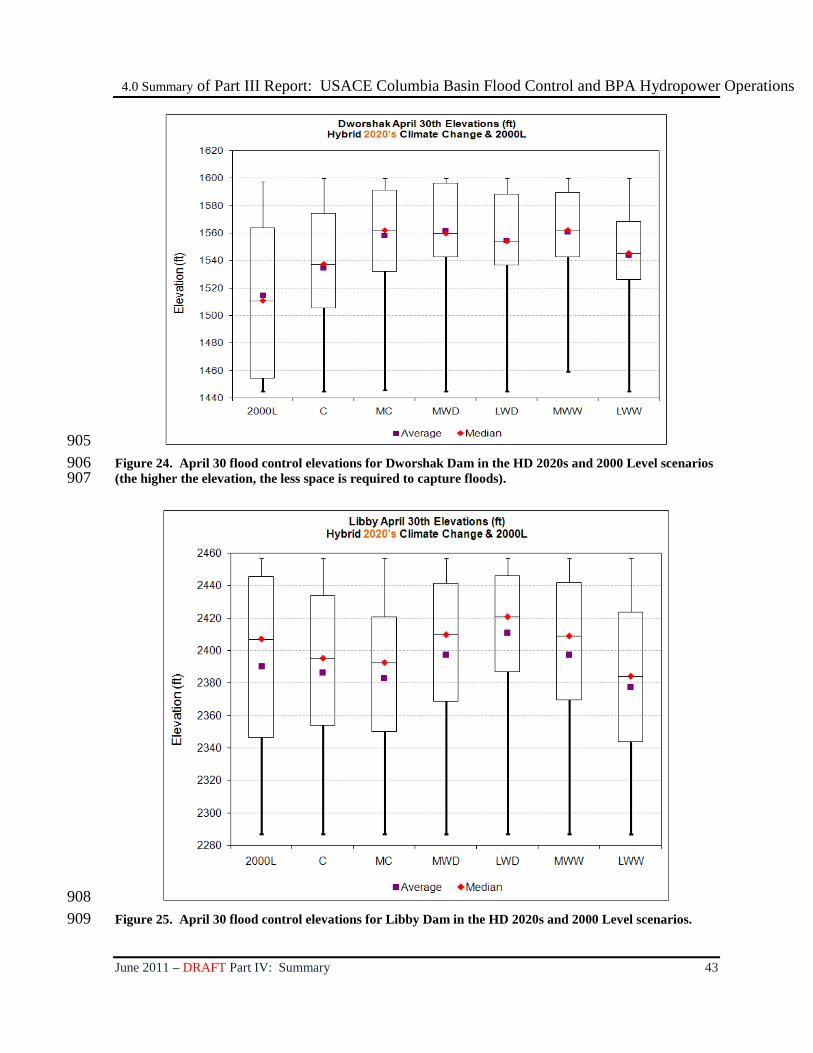
4.0 Summary of Part III Report: USACE Columbia Basin Flood Control and BPA Hydropower Operations
June 2011 – DRAFT Part IV: Summary 43
905 Figure 24. April 30 flood control elevations for Dworshak Dam in the HD 2020s and 2000 Level scenarios 906 (the higher the elevation, the less space is required to capture floods). 907
908 Figure 25. April 30 flood control elevations for Libby Dam in the HD 2020s and 2000 Level scenarios. 909

4.0 Summary of Part III Report: USACE Columbia Basin Flood Control and BPA Hydropower Operations
44 DRAFT Part IV: Summary – June 2011
The current flood control procedures may need to change in response to climate changes. For 910 system flood control, the timing of the average monthly peak flow will shift from June to 911 May, the runoff period will shift from an April through August runoff period to a March 912 through July runoff period and the runoff volume will increase. Earlier maximum reservoir 913 drafts at flood control projects may be needed to create space in order to capture the earlier 914 runoff. Winter flood control procedures may need to change to accommodate an increase in 915 the number of rain-driven events and rain-on-snow events for both system flood control as 916 measured at The Dalles and local flood control downstream of projects on the headwaters of 917 tributaries. For example, for local flood control at Dworshak Dam, winter inflows were 918 projected to be larger and may occur earlier so the reservoir may need to draft deeper and 919 earlier to contain these winter events. In addition, climate changes can impact local runoff 920 characteristics, potentially requiring new forecast procedures. Also conflicts can arise in 921 between releasing water for drafting the reservoirs for capturing spring snowmelt versus 922 storing water for managing winter time flood events. Finally, earlier draft and refill of the 923 projects could have late spring and summer impacts, such as lower river flows for fisheries 924 objectives. 925
Transient climate change scenario trends show that spring runoff volumes decreased, resulting 926 in higher flood control curves (i.e., lower space requirements) for all projects. 927
4.2.2 Columbia River Reservoir Assessment 928
The change in the runoff volume is the single characteristic of all the climate change scenarios 929 that most impacts the projects on the Columbia River and its tributaries. Section 2.3.2 930 describes the seasonal shifting of the natural streamflow runoff in the HD climate change 931 scenarios. These climate scenarios reflect higher streamflows during the January through 932 April timeframe and lower streamflows during the summer months of June through August, 933 relative to the Base Case 70-year 2000 Level Modified Flow dataset. As an example, Figure 934 26 illustrates various seasonal volumes for the HD 2040 scenarios at The Dalles Dam as 935 compared to the Base Case. The runoff volumes during the January through April timeframe 936 in the climate change scenarios vary from 120 percent to 185 percent (excluding the dry 937 LW/D scenario) relative to the Base Case. The summer volume runoff varies from 65 percent 938 to 95 percent relative to the Base Case. 939

4.0 Summary of Part III Report: USACE Columbia Basin Flood Control and BPA Hydropower Operations
June 2011 – DRAFT Part IV: Summary 45
2040 Climate Change Scenarios: % of Modified Flow Volumes at TDA70 year averages
0%
20%
40%
60%
80%
100%
120%
140%
160%
180%
200%
2040 LW/D 2040 MW/D 2040 MC 2040 C 2040 LW/W 2040 MW/W
% o
f 200
0 Le
vel V
olum
es
Jan-Mar % of 2000L Jan-Apr % of 2000L Jan-Jul % of 2000L May-Jul % of 2000LApr-Aug % of 2000L Jun-Aug % of 2000L W.Y. % of 2000L
940 Figure 26. Six HD 2040 scenarios flow volumes over various periods at The Dalles Dam (TDA) as 941 percentages of the Base Case 70-year 2000 Level Modified Flow volume over the same periods. 942
This change of runoff patterns with higher winter flows and lower summer flows results in a 943 change in the regulated outflows from the projects. The increase in the January through April 944 outflows results in higher hydropower generation during this period and an increase in the 945 frequency of forced spills at most of the projects. Figure 27 shows the change in average 946 outflows at McNary Dam relative to the Base Case for the HD 2040s scenarios. The reduced 947 outflows during July and August are particularly problematic from both a flow and power 948 perspective. The change in runoff patterns at McNary Dam could also impact the ability to 949 meet Biological Opinion objectives during the summer. The ability to meet the fishery 950 objectives could be reduced due to the lower average discharge available (as shown in Figure 951 26). However, based on the uncertainties in climate change forecasts, the full extent of 952 potential impacts would require further review and assessment. Hydropower production is 953 also reduced at the same time as increased temperatures caused by climate change trigger the 954 demand for greater summer power loads. 955

4.0 Summary of Part III Report: USACE Columbia Basin Flood Control and BPA Hydropower Operations
46 DRAFT Part IV: Summary – June 2011
Change in Average Discharge at McNary
-50000
-40000
-30000
-20000
-10000
0
10000
20000
30000
40000
50000
Oct Nov Dec Jan Feb Mar Apr I Apr II May Jun Jul Aug I Aug II Sep
Qd
(cfs
)
2020s minus Base 2040s minus Base 956
Figure 27. McNary Dam average monthly discharge change for Base Case and HD climate change 957 scenarios. 958
Some of the projects, such as Hungry Horse Dam and Libby Dam, had challenges in 959 maintaining flood control objectives during the wetter climate change scenarios. When 960 comparing the Base Case to some scenarios, the increase in winter runoff as a result of more 961 precipitation falling as rain rather than snow resulted in the reservoirs filling more quickly and 962 at a greater frequency. This characteristic led to a number of periods when project outflows 963 were significantly higher during the late spring period because the reservoirs refilled to full 964 pool too quickly during the peak runoff periods in the modeling simulations, and different 965 refill procedures and changes to the storage reservation diagrams maybe required. 966
Comparisons of hydropower generation values among three climate change scenarios (C, 967 MW/W, and LW/W) and the Base Case are shown in Figure 28 for the Federal Columbia 968 River Power System. The trend is similar to the project outflows, namely higher generation 969 during the winter and early spring months, but reduced generation during the late summer 970 period. This trend increases in the 2040s relative to the 2020s. The generation impacts 971 during the month of June, and to some extent May, due to climate change were not as 972 significant as the rest of the year because the peak of the natural runoff occurs during this 2-973 month period. In most scenarios, the natural flows are high enough to operate the projects at 974 or near maximum turbine capacity. The additional flows are manifested in generally higher 975 spill amounts during this 2-month period. 976
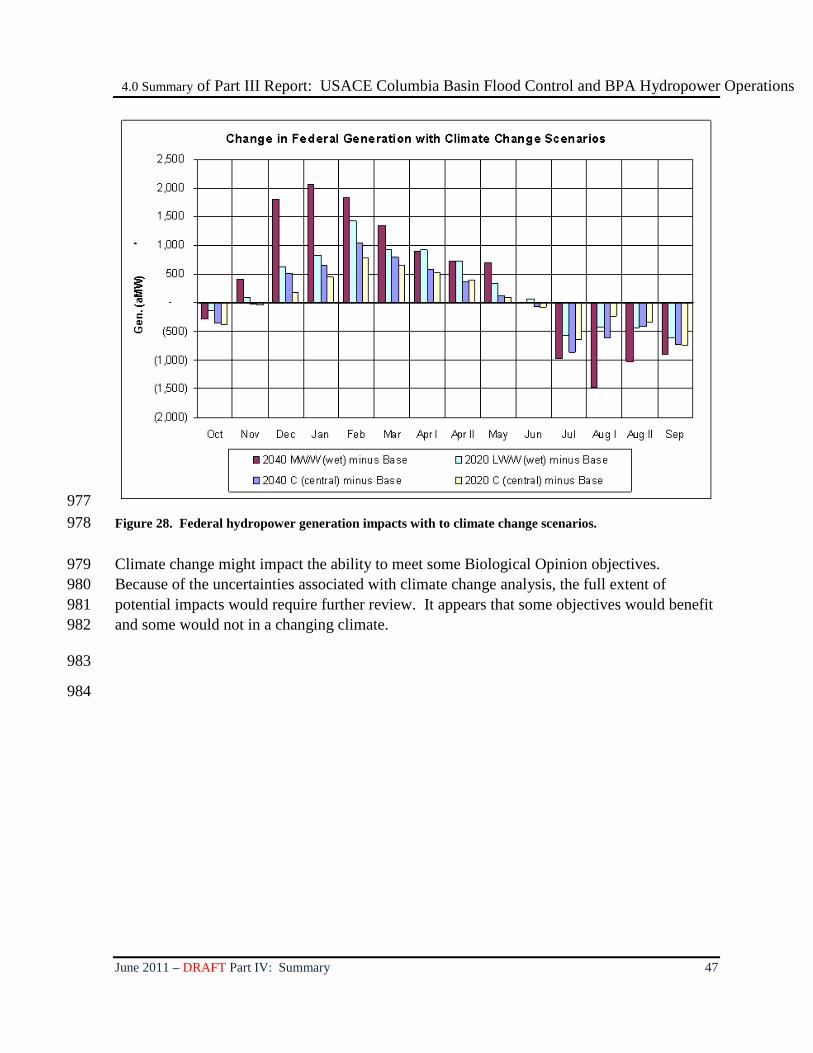
4.0 Summary of Part III Report: USACE Columbia Basin Flood Control and BPA Hydropower Operations
June 2011 – DRAFT Part IV: Summary 47
977 Figure 28. Federal hydropower generation impacts with to climate change scenarios. 978
Climate change might impact the ability to meet some Biological Opinion objectives. 979 Because of the uncertainties associated with climate change analysis, the full extent of 980 potential impacts would require further review. It appears that some objectives would benefit 981 and some would not in a changing climate. 982
983
984
5.0 Uncertainties
48 DRAFT Part IV: Summary – June 2011
5.0 UNCERTAINTIES 985
The selection of future climate and hydrology scenarios for RMJOC long-range assessments 986 reflect the best available datasets and data development methodologies; however, there were a 987 number of analytical uncertainties associated with developing such scenarios, including those 988 in the following areas: 989
• Global climate forcings: Although the study considered climate projections 990 representing a range of future greenhouse gas emission paths, the uncertainties 991 associated with these pathways were not explored in this analysis. Considerable 992 uncertainty also remains associated with natural forcings, with the cooling influence of 993 aerosols being regarded as the most uncertain on a global scale (IPCC 2007). 994
• Global climate simulation: There are still uncertainties in our understanding of the 995 physical processes that affect climate, how to simulate those processes in climate 996 models (e.g., atmospheric circulation, clouds, ocean circulation, deep ocean heat 997 uptake, ice sheet dynamics, sea levels, land cover effects from water cycles, and 998 vegetative and other biological changes), and how to do so in a mathematically 999 efficient manner given computational limitations. 1000
• Climate projection bias-correction: This study is framed by the University of 1001 Washington CIG efforts recognizing that the General Circulation Models may 1002 simulate climate in a way that is biased toward being too wet, too dry, too warm, or 1003 too cool. The University of Washington CIG identified and accounted for these 1004 tendencies, issuing bias-corrected climate projections data prior to their use in defining 1005 the HD and Transient climate and hydrology scenarios that framed this study. Bias-1006 correction of climate projections data introduces uncertainty in characterizing future 1007 climate and associated responses in runoff, water supply, and operations. 1008
• Climate projection spatial downscaling: This study used projections that were 1009 empirically downscaled, using spatial disaggregation on a monthly timeframe. 1010 Although this technique has been used to support numerous water resources impacts 1011 studies (e.g., Payne et al. 2004, Maurer and Duffy 2005, Maurer 2007, Anderson et al. 1012 2008, LCRA/SAWS 2008, Reclamation 2008, Reclamation 2009), uncertainties 1013 remain about the limitations of empirical downscaling methodologies. 1014
• Generating weather sequences consistent with climate projections: This study uses 1015 two different techniques to generate weather sequences for hydrologic modeling that 1016 reflect observed historical climate variability blended with projections about changes 1017

5.0 Uncertainties
June 2011 – DRAFT Part IV: Summary 49
in monthly conditions. The choice of a weather generation technique depends on the 1018 aspects of climate change that are being targeted in a given study. Preference among 1019 available techniques remains to be established. 1020
• Generation of natural runoff data: This study utilized several different reference data 1021 to generate the final bias-corrected hydrologic data used in the hydroregulation 1022 models. Naturalized runoff data used in Reclamation subbasins at monthly intervals 1023 was combined with 2000 Level Modified Flow data at 14-period intervals for the rest 1024 of the Columbia River Basin. Though the differences maybe minor when considering 1025 flood and reservoir regulation impacts, they may be more significant for different 1026 study objectives that consider ecosystem function. 1027
• Natural runoff response: This study analyzed natural runoff response to changes in 1028 precipitation and temperature while the other watershed features such as vegetation 1029 and evapotranspiration remained constant. The models used in this study represented 1030 the relationship between weather and runoff as affected by historical land cover. If 1031 climate changes alter vegetation patterns, the runoff models would need to be 1032 recalibrated to reflect the changed conditions. 1033
• Generating water supply forecasts under future climate and runoff conditions: This 1034 study focused on relationships between seasonal precipitation prior to the forecast, 1035 snow water equivalent at the time of the forecast, seasonal runoff volume after the 1036 time of the forecast, and how these relationships are impacted by climate change. Soil 1037 moisture is of interest heading into each water year since it indicates the degree to 1038 which the soil moisture deficit and infiltration volume may affect snowmelt runoff 1039 during spring and summer. Autumn streamflow is sometimes referenced as a proxy 1040 for autumn soil moisture conditions in forecasting. Also of interest are atmospheric 1041 and/or ocean conditions that correlate with subsequent seasonal basin weather 1042 conditions. 1043
• Under a warming climate, snowpack is expected to diminish and thereby offer 1044 diminishing predictive information for forecasting spring-summer runoff volume. 1045 Uncertainties in the forecast seasonal volumes and the timing of the runoff in late 1046 spring and early summer are the major factors in being able to control flood flows at 1047 the desired levels. With less predictability in volume runoff and rain events, projects 1048 may need to operate more conservatively to account for this uncertainty. 1049
• The limitation of this effort with respect to flood control is that, from a probabilistic or 1050 risk perspective, there is uncertainty of how adequate existing procedures that 1051 determine the flood control curves during the reservoir draft period of January through 1052 April and during refill in May through July would be at meeting system flood flow 1053
5.0 Uncertainties
50 DRAFT Part IV: Summary – June 2011
objectives with climate change hydrology. To analyze how existing flood control 1054 procedures perform using climate change hydrology, flood regulation studies using 1055 daily streamflows are required. With the tools currently available, regulation studies 1056 are performed one year at a time, results are examined, and the regulation is adjusted 1057 as needed to meet the flood flow objective at The Dalles Dam. A new tool is being 1058 developed to automate this process and is planned to be used in future climate change 1059 studies. 1060
1061

6.0 Potential Next Steps
June 2011 – DRAFT Part IV: Summary 51
6.0 POTENTIAL NEXT STEPS 1062
The scope of this study is complete and the information will be used in future analyses of the 1063 individual RMJOC agencies. BPA and the USACE plan to build on this information for the 1064 Columbia River Treaty 2014/2024 review. Reclamation will use this information in its West-1065 Wide Climate Risk Assessments and other studies. 1066
This study represents the first Federal agency coordinated study using the current level of 1067 climate change information and data. The next steps generally fall under three categories: 1068 monitoring, evaluation, and additional studies. For monitoring, historical records and present 1069 conditions will be reassessed to see if the transition towards future climate change scenario 1070 characteristics is underway. This will help establish a timeline for applying the evaluations 1071 and reviewing our current water and river management procedures. 1072
For evaluation, agencies would seek to understand what the climate change data signifies and 1073 its limitations. Climate change scenarios other than those selected for this study should be 1074 evaluated and assessed. Methods for downscaling General Circulation Modeling, which is 1075 based on monthly data, to produce daily streamflow data are being investigated and may be 1076 improved. Bias-correction methods to account for hydrologic model biases are being 1077 analyzed and may be improved as well. Information about Canadian glacial snowmelt was 1078 not available at the onset of this study, but may be included in future studies. 1079
In addition, agencies may explore alternative processes to achieve objectives for water supply, 1080 aquatic species, power, and flood control under a new set of climate change rules. The 1081 evaluation phase will also incorporate newer climate change information as it becomes 1082 available and develop the data and tools to better facilitate climate change data development 1083 and updates. It is expected that the evolution of technology and science of climate change, 1084 particularly in the Pacific Northwest region, will result in more confidence in the results and 1085 in planning processes that are more consistent with the nature of climate change as it is 1086 projected to unfold in the Columbia River Basin. 1087
6.1 Additional Studies 1088
This study examined the potential impacts of water supply changes due to climate change on 1089 existing operations of the projects under the jurisdiction of the three participating RMJOC 1090 agencies. Because of this initial work, additional studies or areas for further examination 1091 have been identified for future assessments. This list is not exhaustive, but is representative 1092 of future efforts that should be considered: 1093

6.0 Potential Next Steps
52 DRAFT Part IV: Summary – June 2011
• Water demands: As flow timing, frequency, and duration patterns change, changes to 1094 current flood operations, diversion practices, carryover volumes, reservoir outflows, 1095 and other factors may need to be reconsidered. Because this study was conducted to 1096 understand how changes in water supply may affect operations, additional work 1097 should be completed to understand changes in water demands, flood control 1098 operations, and other variables. 1099
• Magnitude and duration of the impacts of climate change (e.g., prorationing, flow 1100 augmentation, and ESA objectives) 1101
• Frequency of spillway use 1102
• Operational changes (flood control curves, operating rule curves): In some locations, 1103 Reclamation uses dynamic flood control curves; however, in those locations where 1104 fixed flood control curves are present in models, the modeling should be updated to 1105 allow for additional analyses of dynamic flood control curves. 1106
• Results from this study should be compared to those done previously by other entities 1107 and comparisons reported, including other types of General Circulation Models used 1108 in the studies to achieve a comprehensive understanding of the similarities and 1109 differences. 1110
• Flow data from these studies should be combined with General Circulation Model 1111 temperature data to conduct water quality studies and the effect of a changing climate 1112 on aquatic ecosystems. In the Secure Water Act, ecosystem resiliency is a major 1113 parameter to be evaluated and monitored and as such, should be given attention in 1114 future work. 1115
• The Crooked River subbasin should be studied in greater detail. Only one VIC 1116 location was used to develop flows on this tributary to the Deschutes River so adding 1117 more VIC inflow location nodes in the model to improve calibration would be helpful. 1118 Also, conducting the climate flow development process with a more appropriate 1119 hydrologic model than the VIC model for capturing groundwater-dominated systems, 1120 or coupling groundwater/surface water models, could improve flow results. 1121 Groundwater influence below Opal Springs should be addressed. 1122
• The upper Deschutes River and the middle Snake River have a significant influence 1123 from groundwater and the groundwater/surface water interaction should be studied. 1124
• In the calibration process, University of Washington CIG uses bias-correction 1125 techniques to adjust hydrologic model output to better reflect historical naturalized 1126 flows. It is unknown how bias correction affects future simulations results. Model 1127

6.0 Potential Next Steps
June 2011 – DRAFT Part IV: Summary 53
runs characterized by excellent calibration should be compared to those that are 1128 heavily dependent on bias correction. 1129
• Future efforts could focus on climate change impacts on fisheries and environmental 1130 conditions, which could translate into impacts on environmental water demands found 1131 in reservoir systems management. 1132
• With respect to flood control, tools and procedures to enable daily data modeling 1133 should be developed to identify areas of concern to guide future paths. Flood control 1134 modeling could be performed to determine peak regulated flows with existing 1135 procedures. A comparison of the regulated flow frequency curves with the historical 1136 flows could assess the effectiveness of current procedures with climate change flows. 1137 Daily modeling can help assess if earlier spring peak flows are problematic with the 1138 current methods. The resulting peak flows during the winter events should also be 1139 analyzed. If it is determined that climate change has an undesired effect on the 1140 regulated exceedance frequency of peak flows (i.e., the exceedance frequency of flows 1141 at levels that cause flood damages), flood operations may need to be changed to 1142 reduce undesired impacts. However, this assessment is dependent on the development 1143 of regionally accepted methods and processes that create climate change daily flows 1144 and forecasts for input to reservoir models. 1145
• The datasets produced under this study will be used to provide climate change 1146 scenario analysis for longer-term hydropower studies and fishery related studies, 1147 including future Biological Opinion studies, ESA and fisheries related studies, and 1148 hydropower system asset planning studies. 1149
• As new climate change data becomes available and new technology evolves, it is 1150 anticipated that the processes and insights gained in this study will be repeated with 1151 new data to better understand climate change impacts and risks to the hydropower 1152 system. 1153
1154
1155

7.0 Ongoing Studies With Climate Change Considerations
54 DRAFT Part IV: Summary – June 2011
7.0 ONGOING STUDIES WITH CLIMATE CHANGE 1156
CONSIDERATIONS 1157
7.1 West-Wide Climate Risk Assessment 1158
In 2009, Public Law 111-11, named the Secure Water Act, was passed by Congress requiring 1159 several Federal agencies to determine risks to water supplies (e.g., groundwater, snowpack, 1160 flow) due to climate change and to understand what the impacts of those supply changes 1161 would be on matters such as ecosystems, operations, demands, and other water concerns. 1162 Section 9503 required Reclamation to complete this work within 2 years from the date the law 1163 was enacted and to implement this effort, the West Wide Climate Risk Assessment team was 1164 formed. In compliance with Section 9503, Reclamation submitted its first comprehensive 1165 assessment report in March 2011, quantifying supply changes in the future and qualitatively 1166 documenting what those changes may mean to the major areas identified in the law. This 1167 series of assessment reports is the first required, with subsequent updates due every 5 years. 1168
In addition to Section 9503, Section 9505 of the Secure Water Act calls for the Federal Power 1169 Marketing Administrations (PMAs) to assess the effects of climate change on water supplies 1170 required for hydropower generation at Federal water projects. This Hydroelectric Power 1171 Assessment will include an assessment by the four PMAs: Bonneville Power Administration, 1172 Southeastern Power Administration, Southwestern Power Administration, and Western Area 1173 Power Administration. This assessment is expected to be completed in the fall 2011. 1174
7.2 Columbia River Treaty 2014/2024 Review 1175
Program 1176
The Columbia River Treaty (Treaty) was signed by the United States and Canada in 1961 and 1177 implemented in 1964. The Treaty doubled water storage capacity on the Columbia River 1178 system with the construction of three large storage projects in Canada (Duncan, Keenleyside, 1179 and Mica) and Libby Dam in the United States. Through a coordinated operation, these 1180 Treaty projects have provided billions of dollars (U.S.) of flood damage reduction and power 1181 benefits shared equally in both Canada and the United States. 1182
Although the Treaty has no expiration date, beginning in 2024 and thereafter, either country 1183 has the option to terminate most of the provisions of the Treaty with 10 years written advance 1184 notice. In addition, the Canadian-assured storage provisions for flood control purchased in 1185

7.0 Ongoing Studies With Climate Change Considerations
June 2011 – DRAFT Part IV: Summary 55
1964 expire in 2024, resulting in potentially significant changes in the management of flood 1186 risk in the Columbia River Basin. After 2024, the Treaty calls for a shift to an operation 1187 under which the United States calls upon Canada for assistance. Due to this change in the 1188 Treaty, the USACE and BPA are taking the necessary steps to address the impacts of this 1189 change and determine the future of the Treaty or possible Treaty negotiations. Given the 1190 importance of these issues, the U.S. Entity17
To arrive at an informed recommendation for the future of the Treaty, the U.S. Entity 1194 (supported by the USACE and BPA), the sovereign review team (comprised of States, Tribes, 1195 and agencies directly affected by the Columbia River Basin), and stakeholders are 1196 undertaking a series of studies to collect critical information to support this recommendation. 1197 Collectively, this effort is called the “Columbia River Treaty 2014/2024 Review” (CRT 1198 Review). Since these important issues pertain to the year 2024 and beyond, climate change is 1199 very germane to this effort and therefore, an important element of this work. The data and 1200 lessons learned from this RMJOC study will be utilized in the CRT Review to evaluate the 1201 Treaty issues and decisions as they pertain to flood risk management, hydropower production, 1202 ecosystem functions, and other river uses. 1203
has embarked on a multi-year effort to 1191 understand the implications of these issues. The U.S. Entity will make a recommendation to 1192 the U.S. Department of State about the future of the Treaty by September 2013. 1193
1204
1205
17 The U.S. Entity, composed of the Administrator of the Bonneville Power Administration and the Division Engineer of the Northwestern Division of the U.S. Army Corps of Engineers, is charged with implementing the Columbia River Treaty in the United States.

8.0 Lessons Learned
56 DRAFT Part IV: Summary – June 2011
8.0 LESSONS LEARNED 1206
8.1 Models 1207
Models are used in various stages of climate change analysis work. Global Circulation 1208 Models generate temperature and precipitation data (among other parameters) that are used as 1209 input to hydrologic models that ultimately generate flows in rivers at specific locations. The 1210 flow data is then used to understand hydraulic changes, impacts on reservoir operations, or the 1211 ability to divert water at specific times of the year. The locations of points used to calibrate 1212 flows need to be considered carefully. Location selection can affect the way models work and 1213 the ease of maintaining mass balance, calibrating efforts, checking results, and other 1214 parameters. More VIC inflow locations in each subbasin, selected at locations that help to 1215 improve mass balancing, would have been very helpful in this analysis. 1216
VIC historical time series data does not necessarily match Reclamation historical time series 1217 data or patterns, particularly in the smaller, upstream subbasins. Bias correction (Part I 1218 Report) can cause large swings in adjacent time increments, causing model instability. This 1219 requires additional work to ensure that sites in the upper watersheds of each subbasin for 1220 closer analyses before that data can be used for additional work. 1221
8.2 Resources 1222
Funding to complete studies of this type could be extensive. Staffing levels require a wide 1223 range of expertise including experts in hydrology and other sciences, computer programming, 1224 computer modeling (all types), automation, engineering, and other scientific fields. High-1225 speed computers are needed to manage data and complete model simulations. 1226
The selection of climate projections should be considered at a subbasin scale (e.g., Snake, 1227 Deschutes, and Yakima rivers) in addition to a larger basin scale (e.g., Columbia River Basin 1228 scale in this case). 1229
It may be best to use all of the available GCMs and emission scenarios as input to a 1230 hydrologic model as opposed to selecting a subset in the future. If automation of the entire 1231 process continues to improve, use of more modeling may provide a better suite of results. 1232
The current operating criteria that use specific months to define forecast periods for the 1233 different reservoirs should be considered for adjustment. Maintaining sets of rules based on 1234 the same seasonal periods (as present is no longer realistic when streamflow timing shifts are 1235 predicted to occur. 1236
1237

9.0 Literature Cited
June 2011 – DRAFT Part IV: Summary 57
9.0 LITERATURE CITED 1238
Parenthetical Reference
Bibliographic Citation
Anderson et al. 2008 Anderson, J., F. Chung, M. Anderson, L. Brekke, D. Easton, M. Ejeta, R. Peterson, and R. Snyder. 2008. “Progress on Incorporating Climate Change into Management of California’s Water Resources.” Climatic Change, Springer, Netherlands, 89, Supplement 1, 91–108.
Cayan et al. 2001 Cayan, D.R., S.A. Kammerdiener, M.D. Dettinger, J.M. Caprio, and D.H. Peterson. 2001. “Changes in the Onset of Spring in the Western United States.” Bulletin of the American Meteorology Society 82(3): 399–415.
Elsner et al. 2010 Elsner MM, L. Cuo, N. Voisin, J.S. Deems, A.F. Hamlet, J.A. Vano, K.E.B. Mickelson, S.Y. Lee, D.P. Lettenmaier. 2010. “Implications of 21st Century climate change for the hydrology of Washington State.” Climatic Change. DOI:10.1007/s10584-010-9855-0.
IPCC 2007 Intergovernmental Panel on Climate Change. 2007. Climate Change 2007: The Physical Science Basis. Contribution of Working Group I to the Fourth Assessment Report of the Intergovernmental Panel on Climate Change. Solomon, S., D. Qin, M. Manning, Z. Chen, M. Marquis, K.B. Averyt, M. Tignor, and H.L. Miller (Eds.). Cambridge University Press, Cambridge, United Kingdom and New York, NY, USA, 996 pp. Available at http://www.ipcc.ch/ipccreports/ar4-wg1.htm .
Knowles et al. 2007 Knowles, N., M. Dettinger, and D. Cayan. 2007. Trends in Snowfall Versus Rainfall for the Western United States, 1949–2001. Prepared for California Energy Commission Public Interest Energy Research Program. Project Report CEC-500-2007-032.

9.0 Literature Cited
58 DRAFT Part IV: Summary – June 2011
Parenthetical Reference
Bibliographic Citation
LCRA SAWS 2008 Lower Colorado River Authority San Antonio Water System. 2008. Climate Change Study, Report on Evaluation Methods and Climate Scenarios. Prepared by CH2M-Hill, 103 pp, available at: http://www.lcra.org/library/media/public/docs/lswp/findings/Climate_Change_TM.pdf .
Maurer and Duffy 2005 Maurer, E.P. and P.B. Duffy. 2005. “Uncertainty in projections of streamflow changes due to climate change in California.” Geophysical Research Letters DOI 10.1029/2004GL021462.
Maurer et al. 2007 Maurer, E. P., L. Brekke, T. Pruitt, and P. B. Duffy. 2007. Fine-resolution Climate Projections Enhance Regional Climate Change Impact Studies. Eos Trans. American Geophysical Union, 88(47), pp. 504.
NOAA Fisheries Service 2010
National Marine Fisheries Service, Supplemental Consultation on Remand for Operation of the Federal Columbia River Power System, 11 Bureau of Reclamation Projects in the Columbia Basin and ESA Section 10(a)(1)(A) Permit for Juvenile Fish Transportation Program, May 20, 2010, F/NWR/2010/02096.
Payne et al. 2004 Payne, J.T., A.W. Wood, A.F. Hamlet, R.N. Palmer, and D.P. Lettenmaier. 2004. “Mitigating the effects of climate change on the water resources of the Columbia River basin.” Climatic Change, 62(1-3):233–256.
Reclamation 2009 Bureau of Reclamation. 2009. “Sensitivity of Future Central Valley Project and State Water Project Operations to Potential Climate Change and Associated Sea Level Rise,” attachment to Appendix I in Second Administrative Draft Program EIS/EIR - San Joaquin River Restoration Program. U.S. Department of the Interior, Bureau of Reclamation, Mid-Pacific Region, Regional Office, Sacramento, California. 110 pp.

9.0 Literature Cited
June 2011 – DRAFT Part IV: Summary 59
Parenthetical Reference
Bibliographic Citation
Reclamation 2008 Bureau of Reclamation. 2008. “Sensitivity of Future CVP/SWP Operations to Potential Climate Change and Associated Sea Level Rise,” Appendix R in Biological Assessment on the Continued Long-term Operations of the Central Valley Project and the State Water Project. Prepared by the U.S. Department of the Interior, Bureau of Reclamation, Mid-Pacific Region, Central Valley Operations Office, Sacramento, California. August 2008. 134 pp.
1239 1240

9.0 Literature Cited
60 DRAFT Part IV: Summary – June 2011
1241

Appendix

ST


![4.9 Hydrology and Water Quality - La Entrada … · ... \CLA1201A\Draft EIR for circulation\4.9 Hydrology and Water Quality.doc ... [EIR]), Draft Water Supply Assessment ... water](https://img.pdfslide.us/doc/110x75/5b88cdcf7f8b9a851a8c1210/49-hydrology-and-water-quality-la-entrada-cla1201adraft-eir-for-circulation49.jpg)