Embed Size (px)
Citation preview
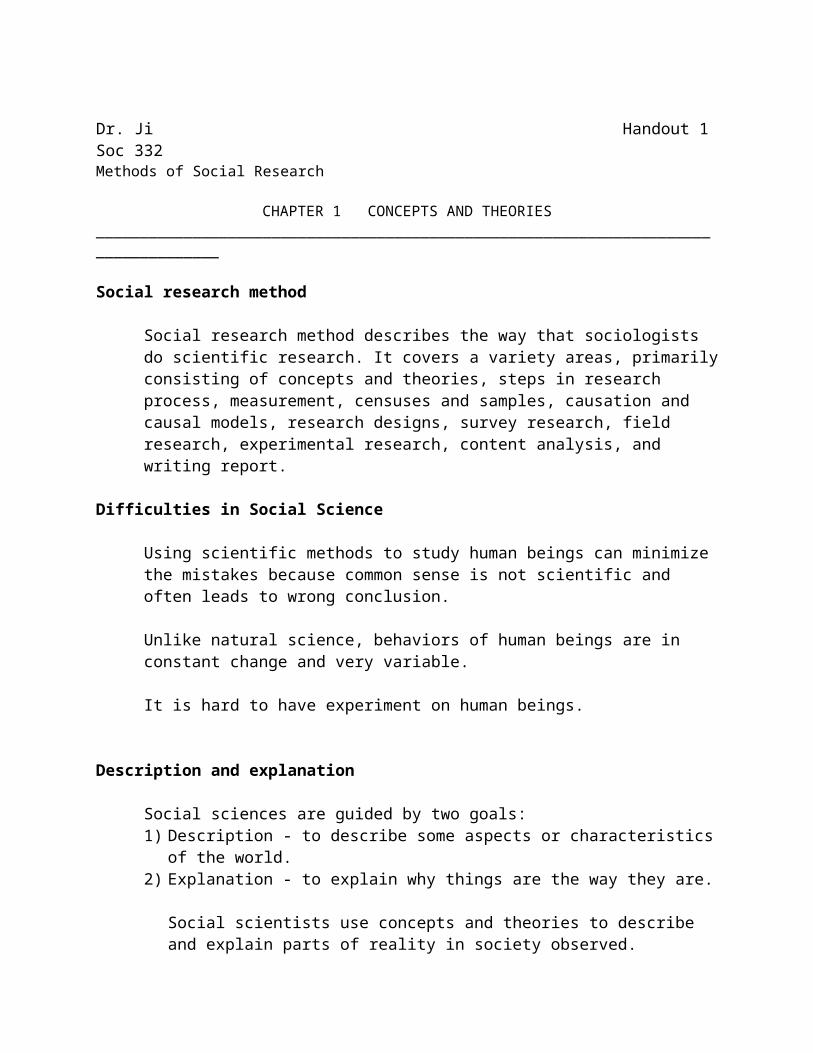
Dr. Ji Handout 1Soc 332 Methods of Social Research
CHAPTER 1 CONCEPTS AND THEORIES____________________________________________________________________________________
Social research method
Social research method describes the way that sociologists do scientific research. It covers a variety areas, primarily consisting of concepts and theories, steps in research process, measurement, censuses and samples, causation and causal models, research designs, survey research, field research, experimental research, content analysis, and writing report.
Difficulties in Social Science
Using scientific methods to study human beings can minimize the mistakes because common sense is not scientific and often leads to wrong conclusion.
Unlike natural science, behaviors of human beings are in constant change and very variable.
It is hard to have experiment on human beings.
Description and explanation
Social sciences are guided by two goals: 1) Description - to describe some aspects or characteristics of the world. 2) Explanation - to explain why things are the way they are.
Social scientists use concepts and theories to describe and explain parts of reality in society observed.
ConceptsA building block of science. They are abstract terms that identify a class of things to be alike (such as “animals,” referring to a huge class of numerous and various animals.)Concept must be clear and apply to all possible members of that class.
1 Parsimony (Abstract)The law of parsimony reads as follows: Theories always attempt to explain the most with the least. That is, to explain as much as possible with a theory that is as simple as possible. The more abstract the concepts, the better the concepts.

2 UtilityThe search for good concepts cannot be guided by truth because definitions are neither true nor false. Scientific definitions are regarded as names that are simply assigned to something. Therefore, the ultimate test of concepts lies in their utility, namely, their usefulness in constructing efficient theories.
3 Clear boundariesEfficient concepts must have clear boundaries that eliminate ambiguity about what a concept includes and does not.
School performance Marital qualityReligiosity Racial discrimination
Are these concepts are clear or intertwined or overlapped?
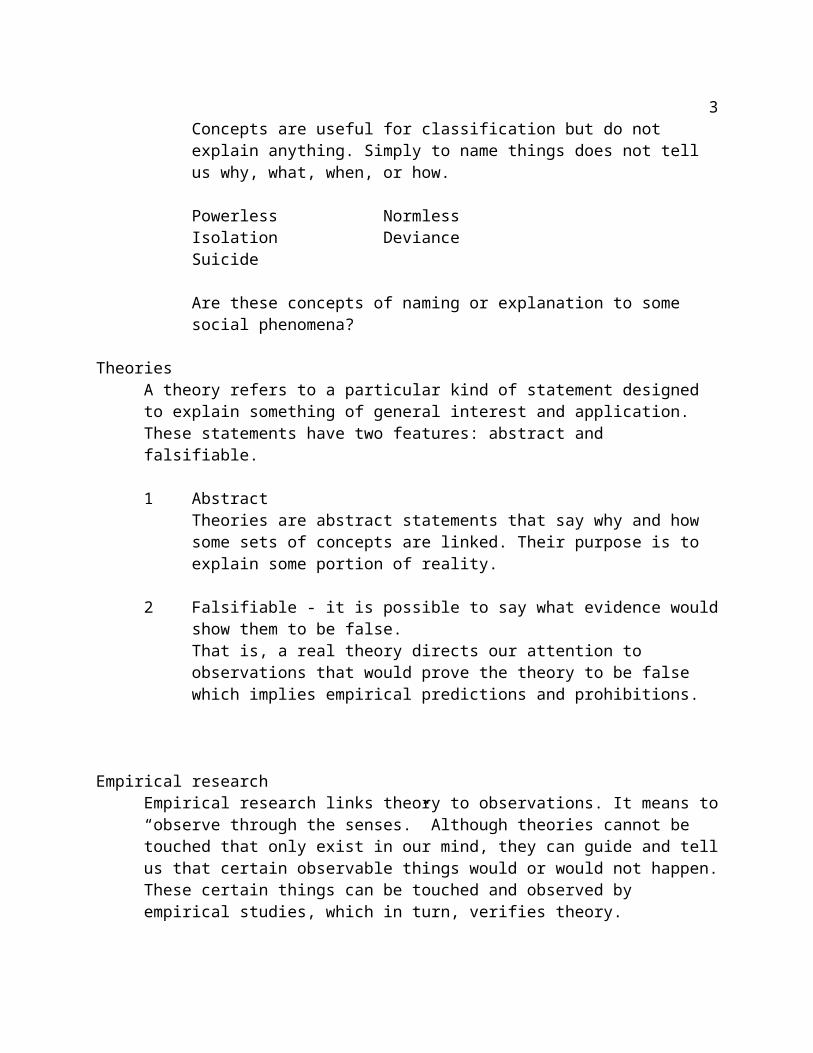
4 Naming is not explainingConcepts are useful for classification but do not explain anything. Simply to name things does not tell us why, what, when, or how.
Powerless NormlessIsolation DevianceSuicide
Are these concepts of naming or explanation to some social phenomena?
TheoriesA theory refers to a particular kind of statement designed to explain something of general interest and application. These statements have two features: abstract and falsifiable.
1 AbstractTheories are abstract statements that say why and how some sets of concepts are linked. Their purpose is to explain some portion of reality.
2 Falsifiable - it is possible to say what evidence would show them to be false.That is, a real theory directs our attention to observations that would prove the theory to be false which implies empirical predictions and prohibitions.
Empirical researchEmpirical research links theory to observations. It means to “observe through the senses.” Although theories cannot be touched that only exist in our mind, they can guide and tell us that certain observable things would or would not happen. These certain things can be touched and observed by empirical studies, which in turn, verifies theory.
2
Concepts and Indicators
ConceptsConcepts are the abstract terms that identify a class of “things” to be regarded as being alike. Concepts cannot be observed. Only the specific instances of concepts can be observed.
Social class, for example, is a concept that refers to a group of people who are alike in terms of prestige and wealth.
OccupationEducationIncome
IndicatorAn indicator is an observable measure of a concept.
Income, for example, is an indicator to measure social class.Number of prays a week, is an indicator of religiosity.GAP is an indicator of school performance.
Theories and hypotheses
A theoryA theory is an abstract statement about reality.A logical deductive-inductive system of concepts, definitions, and propositions, which states a relationship between two or more selected aspects of phenomena and from which testable hypothesis can be derived. Theories in sociology are intended to be descriptive, explanatory, and predictive of phenomena of interest to discipline and to its individual practitioners.
Sources of theories1 from our imaginations and observations. 2 desire to explain something motivate theories3 research results formulate theories and modify theories
The wheel of scienceDealing with the relationship between a theory and the empirical research.
There are two different modes of reasoning, deduction and induction. The former is commonly utilized for description while the latter is often used for exploration research.
3
1 Deduction logic (tui-lun)- from abstract to concreteFrom theory to hypothesisFrom hypothesis to observation
From general to specificFrom known principle to an unknown but observable conclusion
Major premise: Conservatives oppose abortion.Minor premise: Edward is a conservative.Conclusion: Edward opposes abortion.
2 Induction logic (gui-na)- from concrete to abstractFrom observation to empirical generalizationFrom empirical generalization to a theory
From the specific to the generalFrom a set of observations to a general conclusionFrom a general conclusion to a principle
Observation: Bill, Mary, Tom, Robert, Peterson are from Wisconsin.They all have Catholic as their religion.
Conclusion: People from Wisconsin are primarily Catholic.
CorrelationCorrelation means “to vary in unison” or “to go together.” That is, when one variable changes, the other one will change accordingly, or vise versa.
Correlations can be positive or negative. A positive correlation exists when two variables move in the same direction. A negative correlation exists when one variable moves in one direction while the other variable goes in the opposite direction.
HypothesisA hypothesis is an expected but unconfirmed relationship between two or more variables under study. While a theory specifies a relationship among concepts, a hypothesis specifies a relationship to be observed among indicators.
ExampleA theory Social class defines one’s attitudes and behavior – abstract and hard to
observe.A hypothesis People with higher education are more likely to have higher income –
4
observable and testable.
The Null HypothesisA null hypothesis states that a relationship between two variables is unrelated. Null hypotheses are always stated in the form denying the prediction derived from the theory. Because whether to reject or to accept the predicted relationship, one will never be sure to prove the theory. The finding of a test may support the theory while the finding of another test may deny the theory. Hence we commit either Type I or Type II error.
In comparison, a research hypothesis states that a predicted relationship between two variables is related. A research hypothesis assumes the statement of a relationship that is in the direction derived from a theory.
Type I error - when a null hypothesis is rejected, one commits Type I error.Type II error - when one fails to reject a null hypothesis, one commits Type II error.
Exploratory ResearchEngagement in speculative research that make systematic observations of uncharted or little known phenomena in order to get an initial sense of what is going on.
Pure, Applied, and Evaluation Research
Pure researchThe primary motive is directed by the desire to increase knowledge without regard for practical application. Such research usually involves theory testing, to refine or extend a theory.
Applied researchThe primary purpose is to serve practical needs. Applied research may or may not involve theory testing (most does not).
Evaluation researchIt is to assess the effectiveness of a program, policy, product, or procedure, and is usually commissioned by government agencies, business, or organizations such as schools, churches, or hospitals. This study may have an immediate practical payoff for a specific program but may add little or nothing to the stock of fundamental knowledge.
Dr. Ji Handout 2Soc 332 Spring 2002
CHAPTER 2 STEPS IN THE SOCIAL SCIENTIFIC PROCESS____________________________________________________________________________________
5
Step 1 Selecting a Topic
What is a valid sociological topic? On the macro level, one may want to know such broad matters such the military, race relations, and multinational corporations. On the micro level, one studies such individualistic matters as how people interact on street corners, how people decorate their homes at Christmas, or college students’ dating patterns, etc. Any topic in social environment will be a valid topic.
What do you want to know more about?
Following one’s curiosityFollowing one’s drive of interestsBased on available fundingConsider the availability of data source
Topic
Maternal Influence and Children’s Marital QualityParental Educational Attainment and Children’s Performance at SchoolParents Have Influence on ChildrenReligiosity and Law Abiding
Step 2 Formulating A Research Question / Defining the Problem
Specify exactly what you want to learn about the topic.The goal is to develop research questions for empirical investigationA research question needs to be transformed into a statement
- a preliminary to the formulation of a hypothesis
Example: (Do) Parents’ marital behaviors influence their adult children’s marital quality (?)
(Do) Parents’ socioeconomic status influence their children’s performance in school (?)
Research questions are not research hypothesesResearch questions include some conceptsResearch hypotheses need to be operationalized indicatorsConcepts need to be clearly defined prior to formulation of hypothesesAppropriate indicators of the concepts must be selected and defined for hypotheses
Example: What are the parental marital behaviors?What is adult children’s marital quality?What is the parents’ socioeconomic status?
6
What do you mean about children’s school performance?
Step 3 Defining the Concepts
Many different concepts used by researchersSome are generally understood while others are notSocioeconomic status - education, income, occupationReligious beliefs - Protestant, Catholic, Jewish, Others, NoneSocial class - based on income, or education, or prestige, or wealth, or power
Many competing definitions and one has to make the selections
Marital quality - marital happiness, relationships, togetherness, satisfaction,
Develop new concepts Family violence - wife abuse, child abuse, elderly abuse, husband abuse?
Maltreatment, malnutrition, throwing objects, battering, spanking, hitting, killing, murders, rapes, etc.
Step 4 Operationalizing the Concepts
Operationalizing the Concepts by appropriate indicators the process of developing effective and feasible indicators of the concepts“Marital quality,” “religiosity,” “powerless,” “isolation,” “school performance,”
Marital quality“Marital satisfaction between husbands and wives”
Social stratificationSlavery system, Caste system, Estate system, Class systemClass system-power, prestige, propertyProperty - income, wealth
ReligiosityNumber of prays/day/week, frequency to church, regularity to church, perception of God as Mom, Dad, good deeds to people/ride/donation, etc.
School performanceGAP, attendance, rewards, presentations, papers published, leadership,
Use standard indicatorsConcepts IndicatorsEducation attainment - years of school, degrees earned, <HS, HS, Col, G, Phd, Elderly - 65 -74, the young old; 75-84, the old; 85+, the oldest oldDemographic characteristics - age, sex, race, marital status,
7
Develop new indicatorsSocial networks - relatives, neighborhood, community, friends, colleagues, Family ties - parents, siblings, grandchildren, relatives, neighborhood, etc.
Use the best possible indicatorsMost surveys provide sets of questionnaire items already defined.
Step 5 Formulating the Hypothesis
Transforming research questions into testable hypotheses
HypothesisThe expected but unconfirmed relationships between variables under study
Hypothesis I Higher the marital satisfaction for parents, higher the marital satisfaction for children (MQ)
Hypothesis II Marital relationships between fathers and mothers will influence children’s marital relationships (MQ)
Hypothesis III When fathers have higher educational attainment, children’s GPA scores are also likely to be higher (Edc)
Step 6 Making the Observations
Hypotheses direct our attention to the specified behavior of each indicator
By direct observation - collecting data, interviewing people, participation,
By looking at data set, questionnaires, etc.
Step 7 Analyzing the Data
Make data analysis through appropriate statistical methods to check out the hypothesesChoosing a appropriate methodRecoding variablesHandling missing dataMaking statistical analysis
Step 8 Assessing the Results
Are hypotheses supported or rejected by the results?
8
If supported, write report for publication
If not supported or rejected, retrace all steps to find errors, Is the hypothesis consistent with the theory?Are concepts properly defined?Do indicators measure the concepts?Are these the correct units of analysis?Were data properly collected?Was the analysis done correctly?
Find problems by oneselfPublishing the paper to let others find problem for you
Step 9 Publishing the Results
All sciences are public activities and social activities
Written words are precise and have enduring record
Publications link past research to present and present to future
Publications stimulate effort for replication
Step 10 Replication Research
Replication ResearchBy repeating previous research to check on the resultsUsing different set of units of analysis, indicators, time, place – human beings are more variable/changeable.
e.g. Religious commitment causes young people to be law abiding which is found in Richmond, and California; the finding is confirmed in Oregon; but findings in Atlanta and Utah denied; Eventually, findings in Arizona again verified the previous finding. Conclusion: Religions do reduce delinquency except under special circumstances.
Replication reveals flukes (by luck) that may occur leading to false findings
Replication helps to weed out research that is careless, incompetent, or dishonest.
Dr. Ji Handout 3Soc 332 Spring 2002
9
CHAPTER 3 MEASUREMENT______________________________________________________________________________
Variables
Constants Characteristics or aspects of things being studied do not change. Constants take the same values constantly. Constants cannot explain variables. Constants that do not change cannot cause things to change. The speed of light, for example, is a constant.
Variables Characteristic or aspects that take different values among the things being studied and thus can vary.
Dependent variable - presumed effect of an independent variableIndependent variable- presumed cause of the dependent variable
Other variables: control variable, intervening variable, suppressor variable, antecedent variable, etc.
Levels of MeasurementMeasurement is the assignment of numbers or labels to units of analysis to represent variable categories. The various meanings of these numbers are what is meant by the levels of measurement.
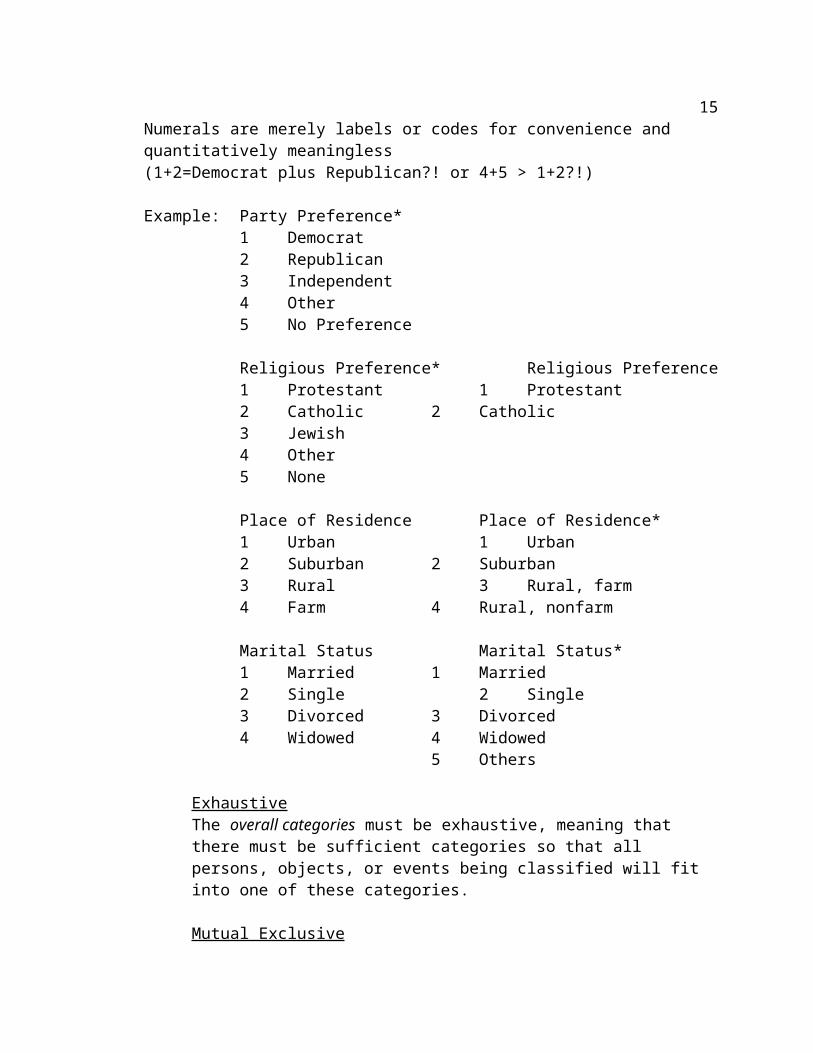
Nominal/CategoricalCases are sorted into two or more categories (gender, race, religion, place of residence, party preference).Lowest level of measurementCategories are mutually exclusive and exhaustiveNumerals are merely labels or codes for convenience and quantitatively meaningless(1+2=Democrat plus Republican?! or 4+5 > 1+2?!)
Example: Party Preference*1 Democrat2 Republican3 Independent4 Other5 No Preference
Religious Preference* Religious Preference1 Protestant 1 Protestant2 Catholic 2 Catholic3 Jewish4 Other5 None
10
Place of Residence Place of Residence*1 Urban 1 Urban2 Suburban 2 Suburban3 Rural 3 Rural, farm4 Farm 4 Rural, nonfarm
Marital Status Marital Status*1 Married 1 Married2 Single 2 Single3 Divorced 3 Divorced4 Widowed 4 Widowed
5 Others
ExhaustiveThe overall categories must be exhaustive, meaning that there must be sufficient categories so that all persons, objects, or events being classified will fit into one of these categories.
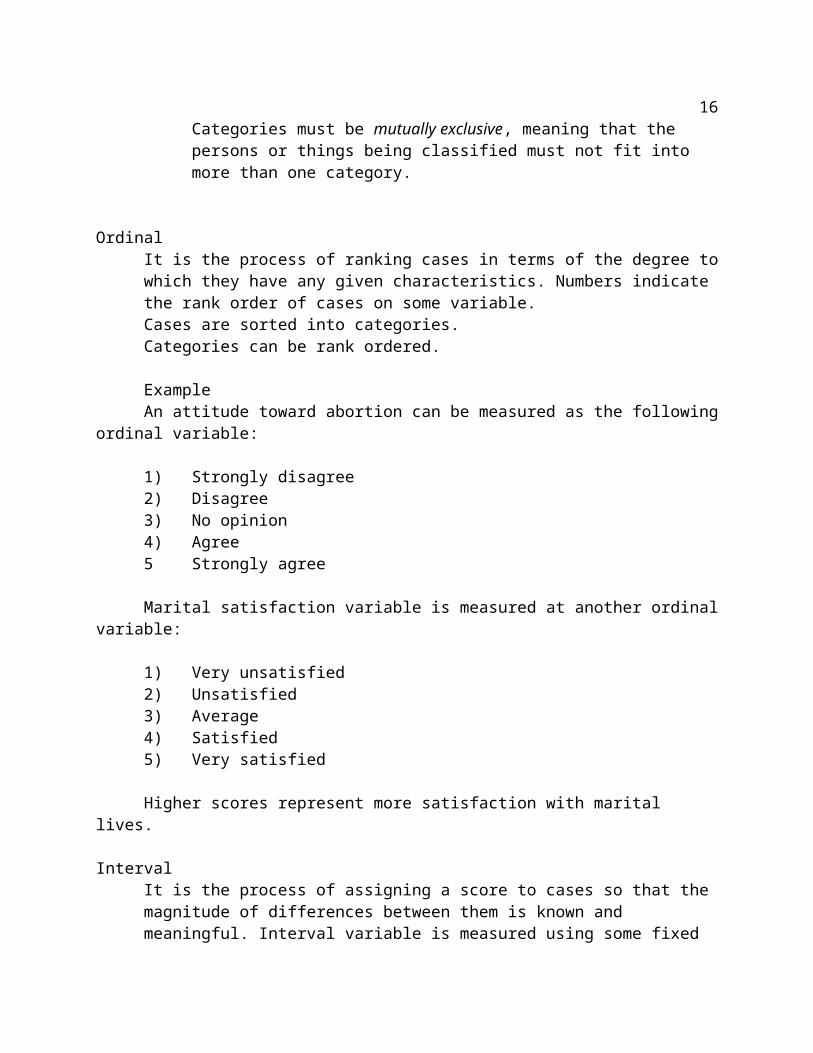
Mutual ExclusiveCategories must be mutually exclusive, meaning that the persons or things being classified must not fit into more than one category.
OrdinalIt is the process of ranking cases in terms of the degree to which they have any given characteristics. Numbers indicate the rank order of cases on some variable. Cases are sorted into categories.Categories can be rank ordered.
ExampleAn attitude toward abortion can be measured as the following ordinal variable:
1) Strongly disagree2) Disagree3) No opinion4) Agree5 Strongly agree
Marital satisfaction variable is measured at another ordinal variable:
1) Very unsatisfied2) Unsatisfied3) Average4) Satisfied
11
5) Very satisfied
Higher scores represent more satisfaction with marital lives.
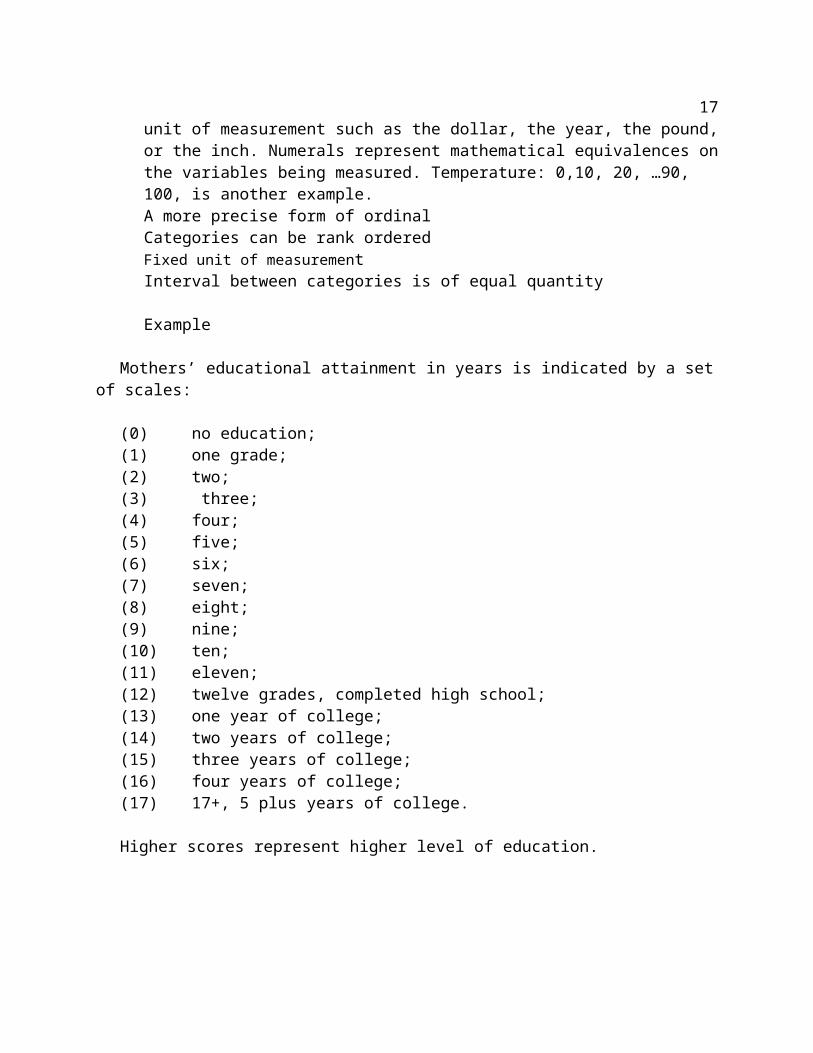
IntervalIt is the process of assigning a score to cases so that the magnitude of differences between them is known and meaningful. Interval variable is measured using some fixed unit of measurement such as the dollar, the year, the pound, or the inch. Numerals represent mathematical equivalences on the variables being measured. Temperature: 0,10, 20, …90, 100, is another example.A more precise form of ordinalCategories can be rank orderedFixed unit of measurementInterval between categories is of equal quantity
Example
Mothers’ educational attainment in years is indicated by a set of scales:
(0) no education; (1) one grade; (2) two; (3) three; (4) four; (5) five; (6) six; (7) seven; (8) eight; (9) nine; (10) ten; (11) eleven; (12) twelve grades, completed high school; (13) one year of college; (14) two years of college;(15) three years of college; (16) four years of college; (17) 17+, 5 plus years of college.
Higher scores represent higher level of education.
12
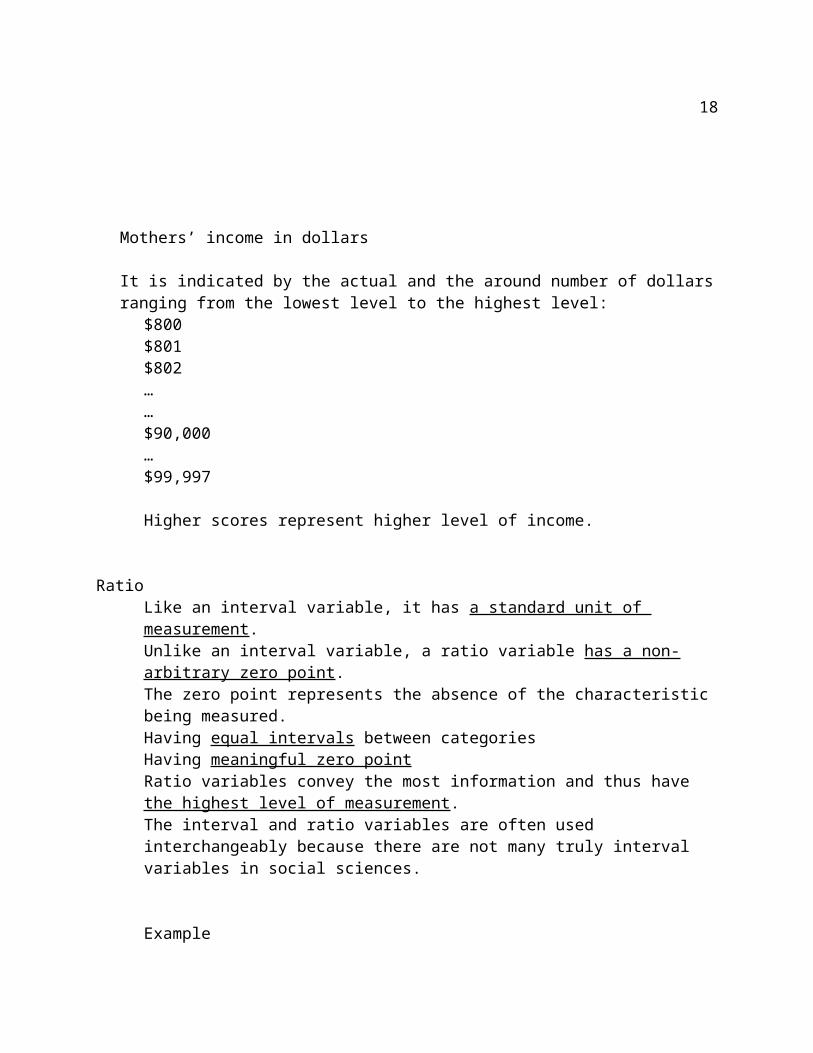
Mothers’ income in dollars
It is indicated by the actual and the around number of dollars ranging from the lowest level to the highest level:
$800$801$802……$90,000…$99,997
Higher scores represent higher level of income.
RatioLike an interval variable, it has a standard unit of measurement.Unlike an interval variable, a ratio variable has a non-arbitrary zero point.The zero point represents the absence of the characteristic being measured. Having equal intervals between categoriesHaving meaningful zero pointRatio variables convey the most information and thus have the highest level of measurement. The interval and ratio variables are often used interchangeably because there are not many truly interval variables in social sciences.
Example
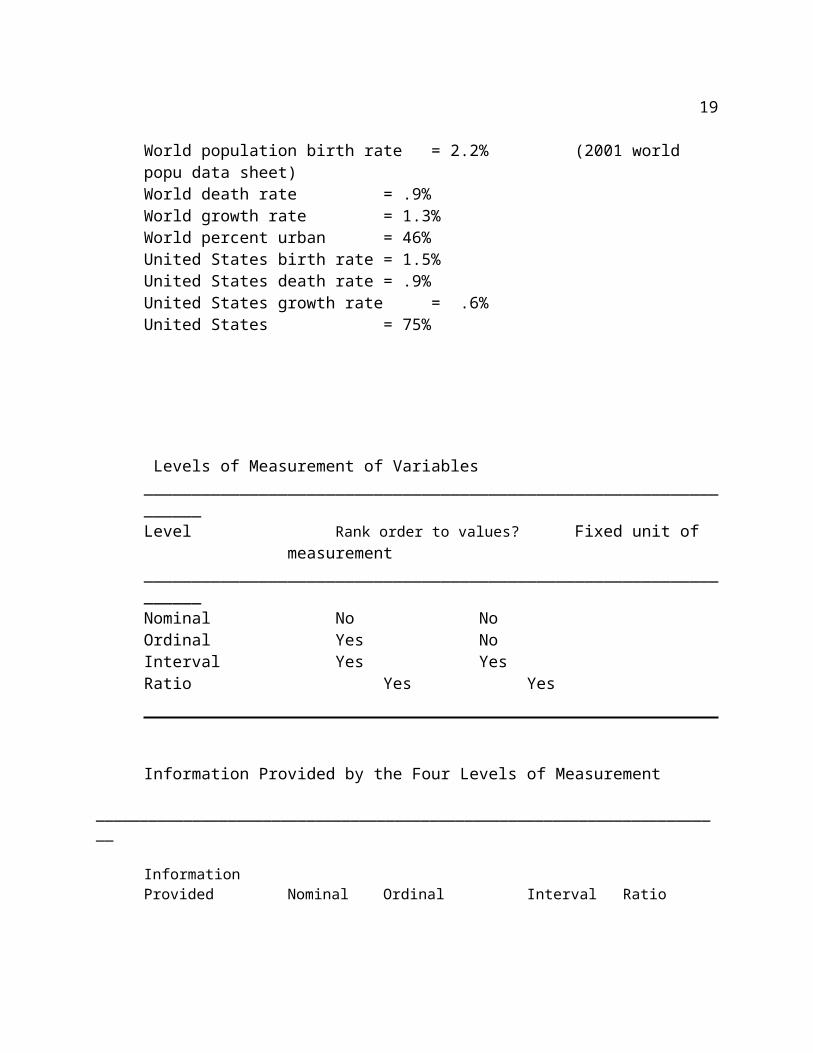
World population birth rate = 2.2% (2001 world popu data sheet)World death rate = .9%World growth rate = 1.3%World percent urban = 46%United States birth rate = 1.5%United States death rate = .9%United States growth rate = .6%United States = 75%
13
Levels of Measurement of Variables__________________________________________________________________Level Rank order to values? Fixed unit of measurement__________________________________________________________________Nominal No NoOrdinal Yes NoInterval Yes YesRatio Yes Yes
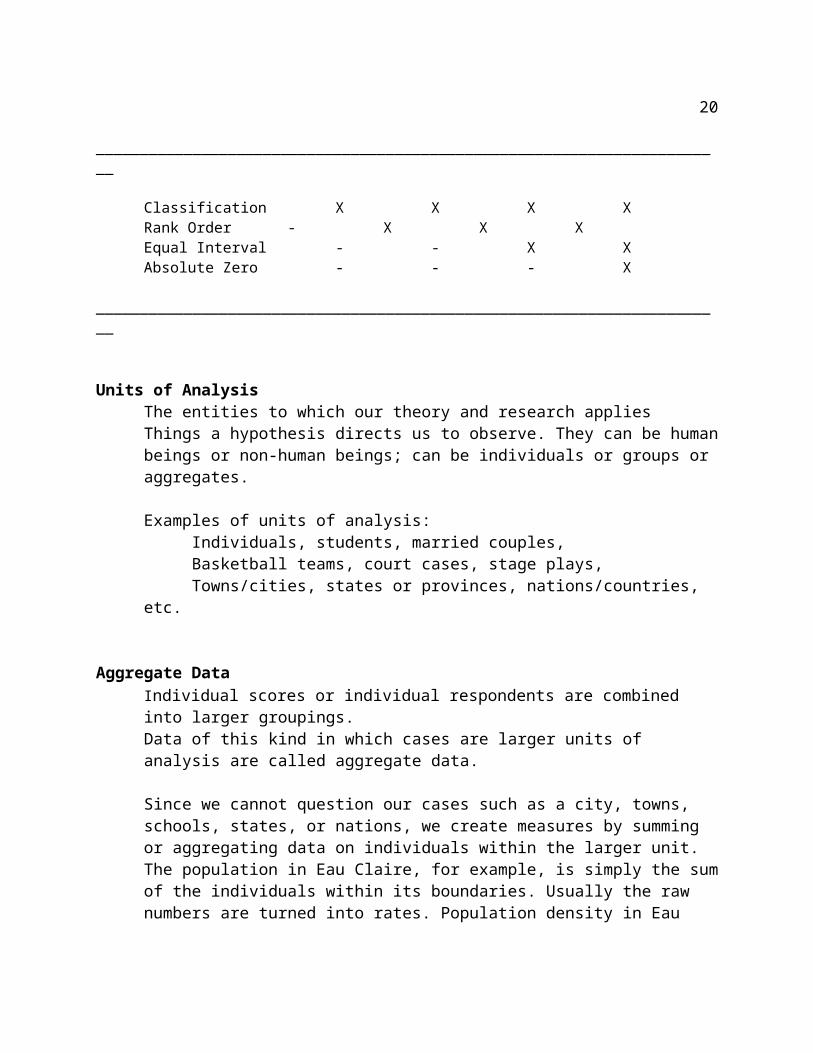
Information Provided by the Four Levels of Measurement________________________________________________________________________
InformationProvided Nominal Ordinal Interval Ratio________________________________________________________________________
Classification X X X XRank Order - X X XEqual Interval - - X XAbsolute Zero - - - X________________________________________________________________________
Units of AnalysisThe entities to which our theory and research appliesThings a hypothesis directs us to observe. They can be human beings or non-human beings; can be individuals or groups or aggregates.
Examples of units of analysis:Individuals, students, married couples, Basketball teams, court cases, stage plays, Towns/cities, states or provinces, nations/countries, etc.
Aggregate DataIndividual scores or individual respondents are combined into larger groupings. Data of this kind in which cases are larger units of analysis are called aggregate data.
Since we cannot question our cases such as a city, towns, schools, states, or nations, we create measures by summing or aggregating data on individuals within the larger unit. The population in Eau Claire, for example, is simply the sum of the individuals within its boundaries. Usually the raw numbers are turned into rates. Population density in Eau Claire, for example, is the ratio between population and land areas per square mile.
14
Examples for more aggregate data are birth rate, death rate, migration rate, murder rate, employment rate, dependency ratio, infant mortality rate, divorce rate, marriage rate, urbanization rate, etc.
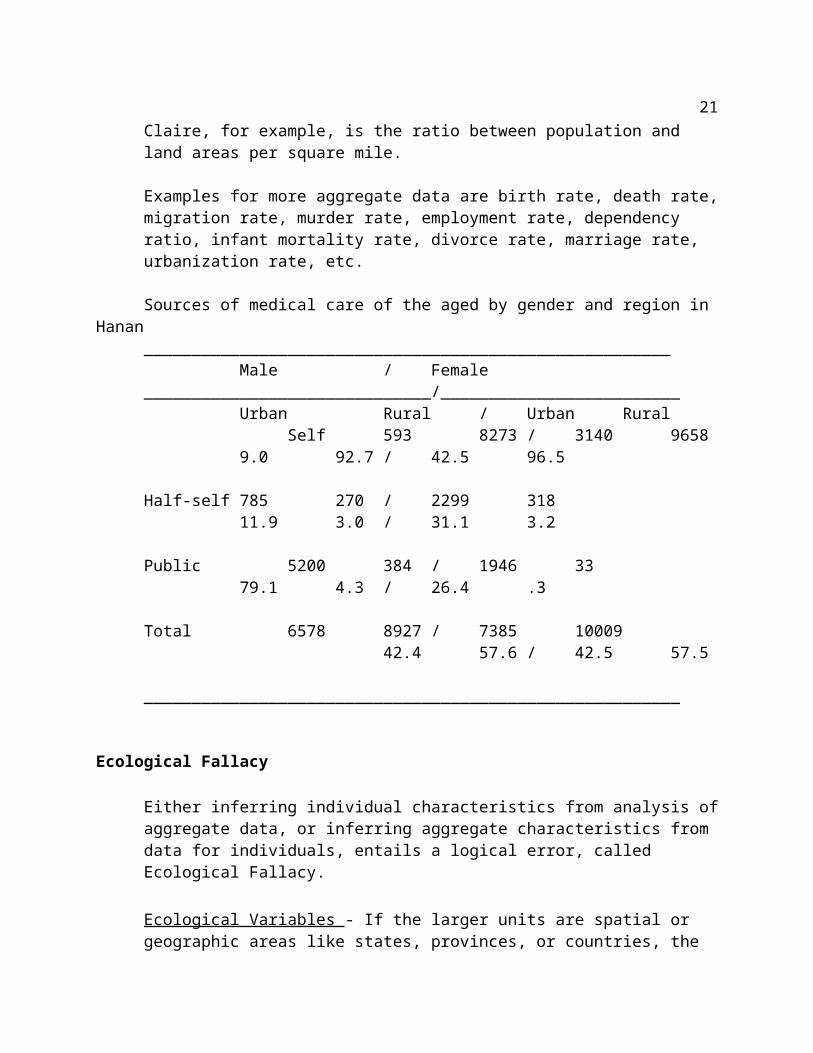
Sources of medical care of the aged by gender and region in Hanan_______________________________________________________
Male / Female______________________________/_________________________
Urban Rural / Urban Rural Self593 8273 / 3140 9658
9.0 92.7 / 42.5 96.5
Half-self 785 270 / 2299 31811.9 3.0 / 31.1 3.2
Public 5200 384 / 1946 3379.1 4.3 / 26.4 .3
Total 6578 8927 / 7385 1000942.4 57.6 / 42.5 57.5
________________________________________________________
Ecological Fallacy
Either inferring individual characteristics from analysis of aggregate data, or inferring aggregate characteristics from data for individuals, entails a logical error, called Ecological Fallacy.
Ecological Variables - If the larger units are spatial or geographic areas like states, provinces, or countries, the aggregate data are ecological data and their variables are ecological variables. Examples are murder rate, percent urban, average income, and percent Hispanic in the 50 states.
The quality of Measures
ReliabilityA variable is reliable if it is consistent - if repeated observations give similar results. Reliability deals with consistency.
The extent to which the measurement of instrument procedures produces consistent and stable results on repeated trials.
15
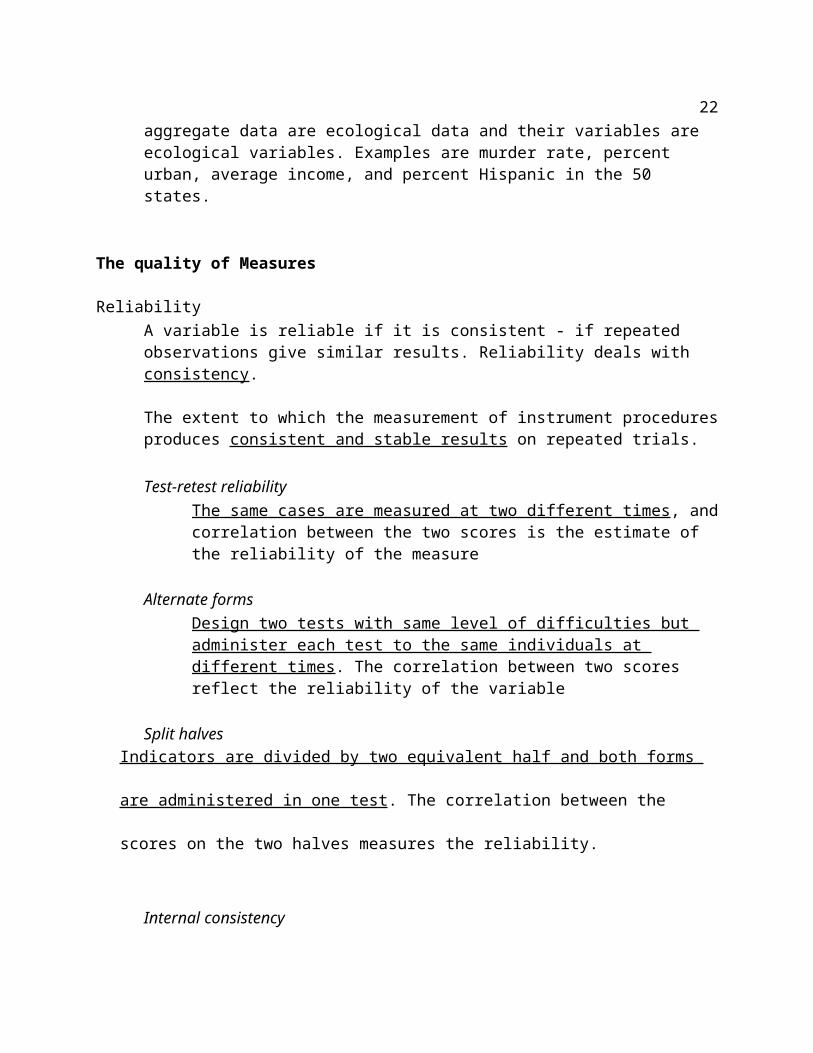
Test-retest reliabilityThe same cases are measured at two different times, and correlation between the two scores is the estimate of the reliability of the measure
Alternate formsDesign two tests with same level of difficulties but administer each test to the same individuals at different times. The correlation between two scores reflect the reliability of the variable
Split halvesIndicators are divided by two equivalent half and both forms are administered in one test.
The correlation between the scores on the two halves measures the reliability.
Internal consistencya) Internal consistency seeks to determine if all of the items in a test are measuring the same
thing. b) Each indicator is assumed to be a good measure of the same target concept. c)
Cronbach’s alpha (α) is the mostly used approach. d) The value of alpha ranges from 0 - 1.
“0” means not reliable; “1” means perfectly reliable; e) α = .7 is accepted as sufficiently
reliable for use.
Example: Children’s Gender Role Belief (CGRB)
12013 Most of the important decisions in the life of the family should be made by the man of the house.
12014 When there children I the family, parents should stay together even if they don’t get along.
12015 It is perfectly all right for women to be very active in clubs, politics, and other outside activities before the children are grown up.
12016 There is some work that is men’s and some that is women’s and they should not be doing each other’s.
12017 A wife should not expect her husband to help around the house after he comes home from a hard days work.
12018 A working mother can establish as warm and secure a relationship with her children as a mother who does not work.
12019 It is much better for everyone if the man earns the main living and the woman takes care of the home and family.
12020 Women are much happier if they stay at home and take care of their children.
16
12021 It is more important for a wife to help her husband’s career than to have one herself.
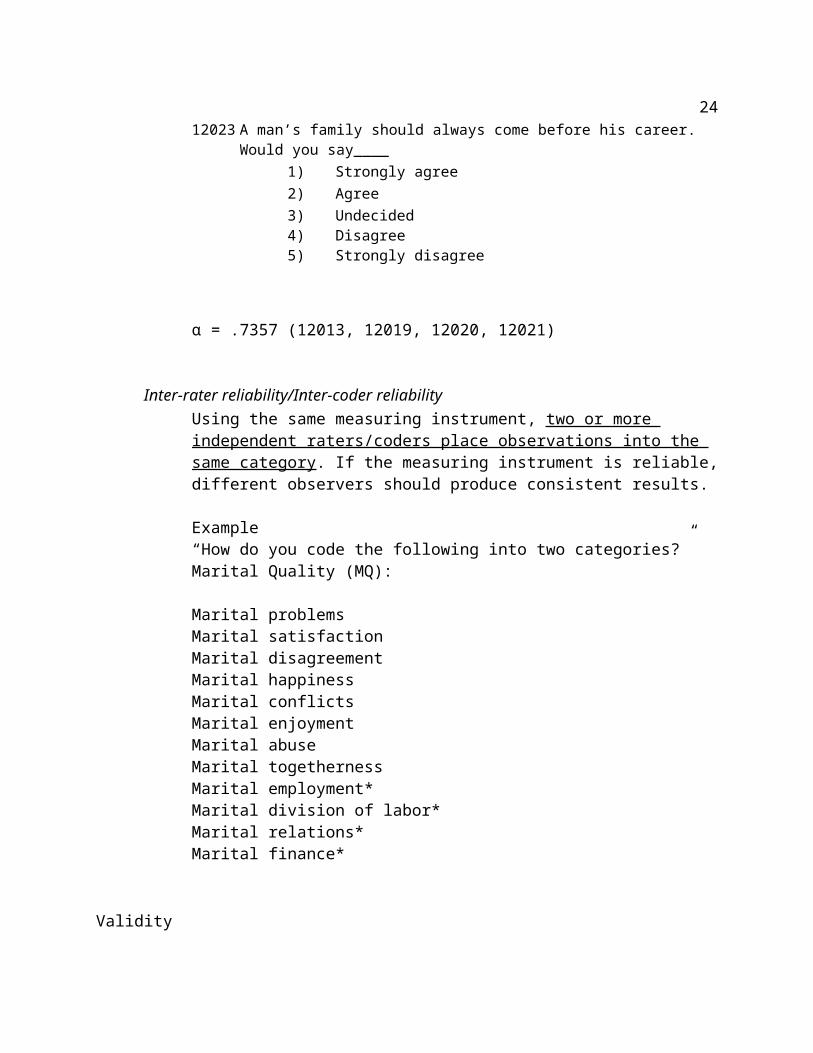
12023 A man’s family should always come before his career. Would you say____
1) Strongly agree2) Agree3) Undecided4) Disagree5) Strongly disagree
α = .7357 (12013, 12019, 12020, 12021)
Inter-rater reliability/Inter-coder reliabilityUsing the same measuring instrument, two or more independent raters/coders place observations into the same category. If the measuring instrument is reliable, different observers should produce consistent results.
Example“How do you code the following into two categories?”Marital Quality (MQ):
Marital problemsMarital satisfactionMarital disagreementMarital happinessMarital conflictsMarital enjoymentMarital abuseMarital togethernessMarital employment*Marital division of labor*Marital relations*Marital finance*
ValidityThe degree to which the empirical indicators measure what it purports to measure.The extent to which the indicators measure what you intend to measure.
Face validityThe variable obviously measures the concept judging based on the face of it.
“How old are you?”
17
“ When were you born?”Are questions obviously a valid measure for measuring the age of the respondent.
Convergent validityIndicators of the same concept should be highly and positively correlated with one another. Indicators that represent the same concept should converge on a single, underlying, empirical base.
What are your test scores in math, physics, chemistry, biology, statistics, and computer science?
Are these scores are correlated to each other?Are they valid measures to measure your GPA and/or IQ?
Criterion validityValidity is established by determining how strongly the measure is correlated with a criterion variable that is external to the measurement instrument. It is to compare an indicator with a criterion one that is known as valid.
Education, Income, and Occupation are widely accepted criteria variables to measure one’s socioeconomic status (SES).
Can I use Education as a variable to measure class status? Can I use Income as a variable to measure prestige? Can I use Occupation as a variable to measure power?
Construct validityThis validity is rooted in its ability of the measure to work in theory. Validity of a measure is established by seeing if it meets the underlying assumptions. In other words, the validity of a measure is assessed through its relationship to other measures consistent with theoretical derived hypotheses.
Research Questions:Do fathers impact their children’s temperament?Do children’s occupation resemble their parents?
The validity of the measures is established by whether or not these measures are consistent with the theories: The Resource Theory, Socialization Theory, and The Theory of Intergenerational Effect.
Cross-case comparability
18
Valid measures must be comparable across cases. That is, questions must be understood the same way by all respondents. If the same question is understood differently and responded differently, meaningful comparisons are hard to make. (This is especially difficult when being used across nations).
“Please tell me in round numbers about the amount of income you received last year including your family incomes.”
$0, 1, 100, 1000, 10, 000, 20,000, … to $ 99,000.
Does the income include spouse’s income, children’s, other income like property, stocks, etc?
If understood differently, then how could one make comparisons meaningfully by gathering this kind of data?
A Variety of Measures
Survey questions and indexes
Survey questionsSurveys are the most common method for obtaining information in social science. Survey questions not only ask characteristics of the respondents but also questions about opinions and attitudes and self-reports of behavior such as drinking, shopping, reading, voting, attending church, etc. They meet the specific purpose of researchers.
IndexesA number of similar questions that are designed to measure the same concept can be combined together known as an index. This index is based the assumption that more measures of the same thing will yield more sensitive measurements.
ScalesScales and indexes are often used interchangeably.Both provide a rank ordering of respondents along a continuum representing the traits of the target of measurement; both rely on multiple indicators of the traits to form composite measures. True scales weight the importance and intensity of the indicators used in the construction of the scales (Guttman).
An index and a 6-point scale to measure Religious Fundamentalism:An index of Religious Fundamentalism:a) Religion is a very important part of life
19
b) After I do something wrong, I fear God’s punishmentc) People who are evil in this world will suffer in Helld) Gods knows everything a person does wronge) In the end, God punishes those who have sinned
Each item was scored on a 6-point scale:1= strongly agree2= agree3=somewhat agree4=somewhat disagree5=disagree6=strongly disagree
Measures based on observations (Detailed in Chapter 10)Measures based on actual recorded observation of the phenomenon of interests. Observation provides both verbal and nonverbal behavior. Observation can yield many measurements in other modes of research.
Rates and other aggregate measuresWhen units of analysis are aggregates such as towns, schools, states, or nations, we apply measures by summing or aggregating data on individuals within the larger units.
RatesA rate is a proportion or ratio and is created by dividing one variable by another variable. Rates create a common basis for comparison across aggregate units. Rates are standardized measures because they express and compare differences between scores out of 100. They relate number of cases occurring to a 100.
Coding content to get measuresWhen units of analysis are not humans or aggregates of humans such as newspapers, movies, songs, or stories, they require a coder to make judgments about how cases should be categorized. To get measures, most researchers use content analysis.
Content analysisA technique of transforming non-quantitative verbal, visual, or textual material into quantitative data to which standard statistical analysis technique can be applied. UWEC Campus 001Chippewa Valley 002Wisconsin Daily 003US Today 004Washington Post 005… …
20
200
Dr. Ji Handout 4Soc 332 Spring 2002
CHAPTER 4 CENSUSES AND SAMPLES______________________________________________________________________________
To learn basic concepts about census and samples To explain how sampling works To know the bases of random sampling
Census
The total process of collecting, compiling, and publishing demographic, economic, and social data pertaining, at a specified time or times, to all persons in a country or delimited territory (UN).
A census is an official count of the population and recording of certain information about each person in a country.
Data are collected from all cases or units in the relevant set.
Early censuses
Egypt, Babylonia, China, India, and Rome Large-scale counts were registered as early as 5 B.C but not real-sense census. Caesar Augustus, the Emperor of Rome, ordered that a census be taken of his empire.
Everyone was required to return to his ancestral home (based on Bible). To establish how many people and households there were within the territory under the
ruler’s control and how much tax would be expected to pay. To report the number of persons in every household and to list their significant
possessions
Modern Census
Starting from late18 th and early 19 th century
Sweden is the first European nation to have census 1749Denmark and several Italian states (before uniting of Italy) 1700sThe United States 1790 England 1801
21
Lebanon 1932India 1881 China 1953
78% of world’s population was enumerated by censuses 1953-196481% of countries have or are planning to take census 1995-2004
Census of the United States
1 First census was conducted in 17902 A census is taken since 1790 for every 10 years (22 times)3 The first 100 year-censuses were taken by US marshals4 The Census Bureau took the job since 19025 The information asked is from simple to complex- from age, free or slave, name,
aged 16 year older, white male or females, and other persons, to basic demographic and housing characteristics, to all other information such as sex, racial, ethnic, year of birth, marital status, nationality origin, literacy, death, suicide and murder, income, net worth, occupation, and place of birth, etc.
6 Who is included in the census? Two ways: de facto population – which counts people wherever they are found on the census day; de jure population – which counts people where they legally belong to regardless whether they were there on the day of the census.
7 The United States adopts the method in between de facto and de jure, and includes people in the census on the basis of Usual Residence, which is roughly defined as the place where a person usually sleeps. College students may be counted at the college rather than counted at their parents’ houses.
Purpose of census
1 The government wants to know the accounts of taxpayers, laborers, and solders.2 To study population process, change, and to make planning.
Population
Refers to all members of a nation. It is not limited to human beings. In statistics, a population refers to all units constituting
a set which is delimited (ding-jie-xian).
22

A population also refers to as the universe of units where the word of universe means “all things.” “All persons in India” defines a universe as does “all students in UWEC” or “ all women in WI.”
SamplesA subset of populationA selected section of a population
Random SelectionIt is a process in which every case has an equal chance of being selected.Random sample and probability sample are used interchangeably because they based on random sampling principle that all cases have a known probability of being selected.
Statistics and parametersA statistics is a characteristic of a sample while a parameter is a characteristic of a population. A statistic is a value to describe a sample while a parameter is to describe the population. A statistic is the estimate of the parameter. An average income for Water ST, for example, is a statistic to describe residents in Eau Claire sample while the average income for all residents of America is a parameter.
Confidence interval and levels
We use a sample statistic to estimate a population parameter. Population mean may be greater or less than the sample mean. To estimate a population mean, we must establish a range around the sample mean within which we think the population mean lies. This range is called confidence interval.
It is a range around the sample mean within which population mean lies.It is a range around the sample mean to predict the population mean. It is a range within which we use a statistic to predict a parameter.
Two levels of confidence interval are commonly used: 95 and 99 percent.
95 percent confidence interval = ± 1.96The chances are 95 out of 100 that we are confident that population mean () lies within this range-the confidence interval.
99 percent confidence interval = ± 2.58The chances are 99 out of 100 that we are confident that the population mean () lies within this range-the confidence interval.
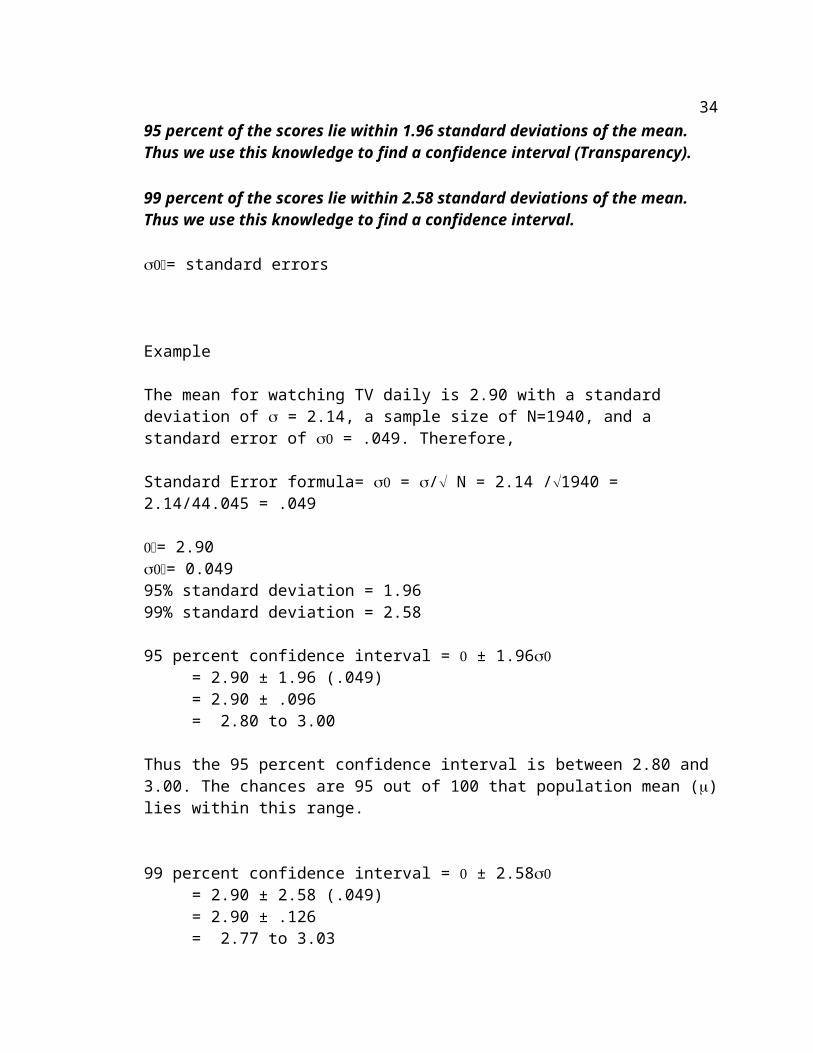
95 percent of the scores lie within 1.96 standard deviations of the mean. Thus we use this knowledge to find a confidence interval (Transparency).
23
99 percent of the scores lie within 2.58 standard deviations of the mean. Thus we use this knowledge to find a confidence interval.
= standard errors
Example
The mean for watching TV daily is 2.90 with a standard deviation of = 2.14, a sample size of N=1940, and a standard error of = .049. Therefore,
Standard Error formula= = / N = 2.14 /1940 = 2.14/44.045 = .049
= 2.90= 0.04995% standard deviation = 1.9699% standard deviation = 2.58
95 percent confidence interval = ± 1.96= 2.90 ± 1.96 (.049)= 2.90 ± .096= 2.80 to 3.00
Thus the 95 percent confidence interval is between 2.80 and 3.00. The chances are 95 out of 100 that population mean () lies within this range.
99 percent confidence interval = ± 2.58= 2.90 ± 2.58 (.049)= 2.90 ± .126= 2.77 to 3.03
Thus the 99 percent confidence interval is between 2.77 and 3.03. The chances are 99 out of 100 that population mean () lies within this range.
Statistically significance and significant levels
Statistically significance is to test the probability that a null hypothesis being true is very small (p< .05). Therefore, we reject the null hypothesis and conclude that there is a relationship between the variables under study. And the relationship is existent in the population from which the sample was drawn.
24
Statistically significance implies that the relationship found in the sample is likely to occur in the population from which the sample was drawn.
Three significant levels:
P< .05 the probability that a null hypothesis being true is small (p< .05).
It implies that the probability that the research hypothesis being true is big (p .95).
p< .01 the probability that a null hypothesis being true is small (p< .01).
p<.001 the probability that a null hypothesis being true is small (p< .001).
Samples versus census
A CENSUS SAMPLE
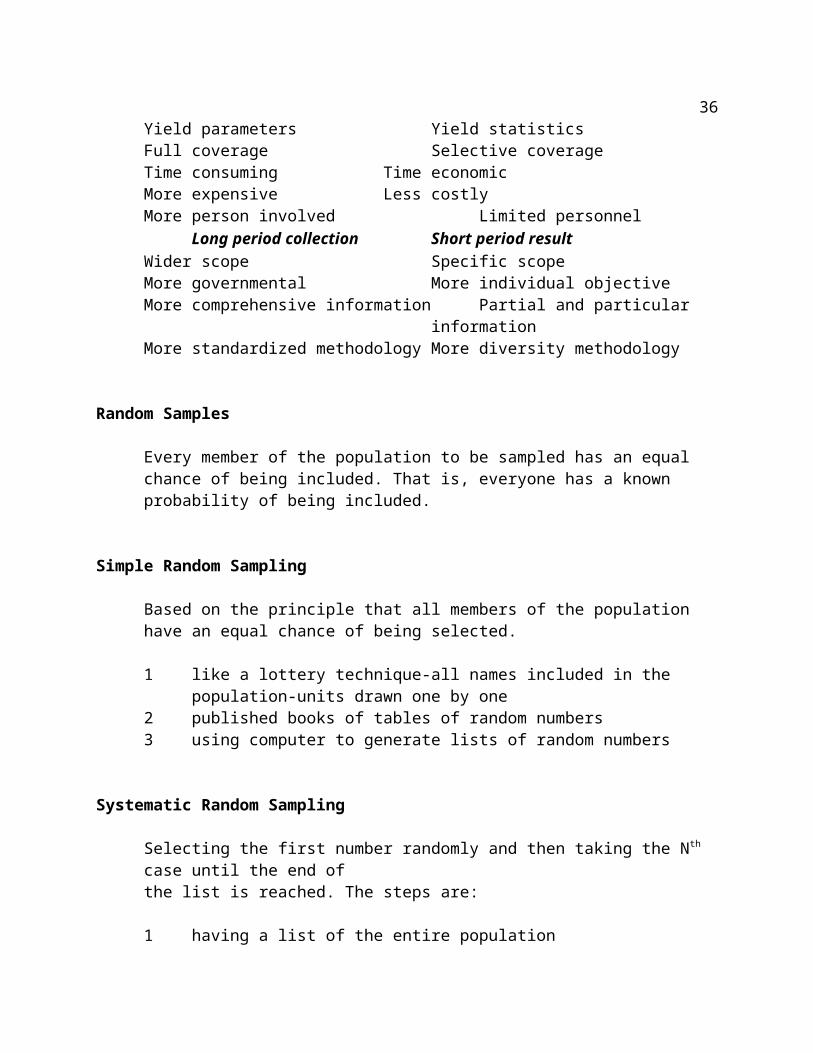
Yield parameters Yield statisticsFull coverage Selective coverageTime consuming Time economicMore expensive Less costlyMore person involved Limited personnel
Long period collection Short period resultWider scope Specific scopeMore governmental More individual objectiveMore comprehensive information Partial and particular informationMore standardized methodology More diversity methodology
Random Samples
Every member of the population to be sampled has an equal chance of being included. That is, everyone has a known probability of being included.
Simple Random Sampling
Based on the principle that all members of the population have an equal chance of being selected.
1 like a lottery technique-all names included in the population-units drawn one by one
2 published books of tables of random numbers
25
3 using computer to generate lists of random numbers
Systematic Random Sampling
Selecting the first number randomly and then taking the Nth case until the end of the list is reached. The steps are:
1 having a list of the entire population2 dividing the total number by the sampling number3 selecting the first number randomly4 taking the Nth case until the end of the list
Example
population = 20,000sample = 1,000sampling fraction = 1000/20000 = 1/20
Suppose the first case is randomly selected as 11, then the second would be 31, the third is 51, the fourth is 71, that is,
11, 31, 51, 71, 91, 111, 131, …
Be sure the first number must be randomly selected in order to meet the principle of every case having an equal chance of being selected.
Telephone Polls
1 less costly2 faster3 efficient4 wide coverage5 97% of all US homes have phones6 phone umbers are unique with area code, prefixes representing specific
geographic areas7 can be selected randomly8 omit those having no phones or inaccessible to those with phones
Steps1 identify the prefixes to locate geographic areas targeted2 generate a list of all phones3 eliminating non-residential or non-working numbers
26
4 use a random number generator to produce a list of phone numbers that have these prefixes
5 call one by one for phone interview with recorders
Stratified Random Samples
A targeted population is divided into several strata or sub-populations and then samples are selected independently from each stratum.
Example based on Individual data
Strata based on characteristics of students in UWEC. The target population is UWEC students.
1 Know all names and addresses of the studentsthe population is stratified prior to drawing samples
3 all students are divided into four subpopulations as freshman, sophomore, juniors, and seniors, and each subpopulation are further divided into two groups: male students and female students
2 know the actual proportion of the each stratum in the population so that it is possible to draw separate samples from each stratum
3 draw from each stratum with appropriate proportion/separate samples
Example based on the aggregate data (omitted)Stratified samples are also used in aggregate dataStudying race segregation in cities, for example, may sample only one stratum.1 first stratifying cities on the bases of the size of African-American population, usually all cities
having more than 100,000 African-Americans.3 then select samples of blocks from each city in the 100,000 stratum4 next calculate an index of dissimilarity for each block 5 finally sum the indexes to yield a score for each city
Disproportionate stratification
If the population involving characteristics are unequally distributed across cases making up the population, more cases from the smaller strata will be selected disproportionately in order to represent that stratum. This practice is known as disproportionate stratification.
Example
27
Canada has 10 provinces. Each province is a separate stratum. The small provinces are over sampled in order to represent the minority.
Studying student performance between Whites and Blacks in UWEC. There are 9,000 white students but 1,000 blacksIf the sample fraction is 10%, then white students will be 900 and blacks 100.To ensure more representatives for blacks, the researcher may increase the fraction to 90% of the blacks thus making about 900 blacks in the sample.
Cluster Sampling
It is a two-step-process in which aggregates or groups of individuals (clusters) are sampled and then samples of individuals are selected from within each cluster.
Cluster sampling is often used to sample institutional clusters such as schools, churches, corporations, and service of residential clusters.
Simply put, it is the Group selection first and individual second.
Example
1 To sample Milwaukee residents, first, samples would be drawn from the clusters - the blocks of the city/clusters of residential districts.
2 Next to locate all residence and list all persons residing in the selected blocks/districts.
4 Then to conduct a stratified random sample (individuals) from that block
Probability Proportional to Size (PPS)
As clusters may differ in size, random sampling for the different sized clusters may under-represent cases for the small clusters but over represent the larger ones. One solution to problem is to use probability proportional to size (PPS). This method emphasizes equal chance of selection and representation.
1 to draw from each cluster a sample proportional to the size of the cluster
2 each case of the cluster selected, big or small, now has the equal/same probability of being included
28
Example
1 to draw 10% residents from a cluster of 1,000 residents, we have 100 cases selected
2 to draw 10% residents from a cluster of 1,000,000 residents, we have 100,000 cases selected
3 in either big or small clusters, PPS guarantees sample size represents proportionately to size of that cluster
4 Read example of “NORC National Samples”- the National Opinion Research Center used by University of Chicago (page 71)
Sampling Elusive Subgroups (Duo-Bi-De)
A certain subgroups of people whose scarcity and location and information are difficult to obtain. A list of blue-eyed persons, for example, is hard to obtain. The homeless in Chicago, for another example, is done with special effort (Jews in America is omitted).
Scarcity is the major problemSubgroups are simply difficult to locate.
Example Homeless in Chicago by Peter Rossi (1989)Consult people who are involved to help the homeless and learn more information about the homeless.
1 Homeless are seasonal, more in summer but less in winter 2 Rossi paid people for interviews3 The homeless are very mobile during the day and settle down at nights4 The homeless have several places for shelters:
parks, sidewalks, doorways, alleys, vacant lots, abandoned buildings, etc.5 Assemble a list of shelters and average number of occupants6 Count all the homeless who are present in the selected shelters7 Make the randomly selection 8 Interview are conducted with pay (80% completed the interviews)
BiasThere are a number of sources of biases that may distort the random samples in addition to random fluctuations.
Non-response biasNot every person selected in the sample agrees to respond. They may either refuse to fill the questionnaires or deny the interview.
A substantial non-response rate will bias the sample because the sample will under-represent certain kinds of respondents in the target population, such as people’s ages,
29
gender, regions (urban or rural), race (Whites or Black), the poor or the wealthy, liberal or conservative, etc.
Selective availabilityThere is a certain group of people whose availability is problematic. 1 Men are less likely to have permanent addresses and rarely at homes2 More women tend to be at home at time of interviews3 Residents of jails, prisons, and military posts are likely to be excluded4 students at schools are less likely to be selected because students’ dormitories are
often excluded in the samples 5 as a result, a certain group of people is likely to be less represented in the
population
Areal biasIn areas or states where the population is widely dispersed and ethnic and religious groups are highly concentrated, areal biases are likely to occur in the cluster samples.
Example
The homeless are likely to be found in big citiesBlacks are more likely to be found in southern states.Asians are more likely to be found in Hawaii, San Francisco, Chicago, New York, Los Angeles, Washington DC, Houston, etc.Latinos are more likely to be found in southern western states.Catholics are more likely to be found in northern states.Baptists are more likely to be found in southern states, etc.
WeightingAssigning different values (weights) to each case in order to obtain proper proportionality to the sample or to the population depending on researchers’ objectives.
1 Weights are assigned so that the size of the weighted samples is the size as the un-weighted sample. It is called weighting to the sample size.
2 Weights are assigned so that the size of the weighted samples is proportional to population size. It is called weighting to the population size.
3 Confidence intervals and significance tests are not used for weights because the number of cases is enormously inflated.
Examples
An example: Assignment weights:
30
Midterm test 25%Final 25%Assignment 20%Term Paper 20%Attendance 10%
------100
1 We have a sample size of 2000 randomly selected cases of nurses in which 1000 are males and 1000 are females. It is obviously male nurse are over-represented. We have few females but too many males. Male and female nurses take equal percentages (50%) of the sample.
2 Assume we only expect 112 males and 1888 females for research purpose. Then we weight each male by .112 and each female by 1.888.
3 That is, each male in the sample is counted as only .112 of a case and each female counted as 1.888 of a case. As a result, male takes about 112/2000 = 5.6% and female take 94.4% of the sample. But all together the sample size remains unchanged 112+1888 = 2000.
4 Consequently, the variable distribution in the weighted sample such as education and income for males and females will make their correct and proportional contributions to the totals.
5 Suppose the population is N=10,000 while the sample size is n=2000.The sample takes 20% of the population. Assume that we want to reduce the sample percentage to 10%. Then we can weight each element of the sample by .5. That is, each element is only counted as .5 of a case and all together the sample is counted as n=2000 x .5 = 1000. As a result, we achieved to the weighted sample proportional to population size by 10%.
Dr. Ji Handout 5Soc 332
CHAPTER 5 CAUSATION AND CAUSAL MODELS____________________________________________________________________________________
Causal Relationships In Social Research Causal Criteria Causal Models
CausesA cause is anything that produces a result or an effect. Causation is one variable that produces results in variation in another variable.
31
In terms of social science, independent variables are seen as causes and dependent variables are as effects.
One of the important tasks for social scientists is to seek causes of social phenomena and then to sort out each as to whether it is an actual cause and how important it is when being compared with other causes.
Criteria of CausationFour criteria must be met before one can claim that the relationships between variables under study are causal.
1 Time order/Temporal orderRefers to the sequence of the variables.A cause must occur before its effect.If the food caused your illness, you must eat food first and then you are sick.
If X is the cause of Y, X must occur prior to Y.
2 CorrelationIf X is the cause of Y, X and Y must co-vary. The cause and the effect vary in unison.Changes in X must cause changes in Y.When variables vary in unison, they are correlated.Correlation can be either positive or negative.The hypothesis must specify the sign of the expected correlation.
3 Non-spurious relationshipTwo variables appearing to be a cause-and-effect relationship may be in fact that their correlations are due to a third variable, an unobserved or unidentified variable. In other words, if a causal relationship is explained away by a third variable, then that presents a spurious relationship.
If X is the cause of Y, but Z is both a cause of X and Y, then the relatio0nship between X and Y is a spurious relationship.
4 Theoretical explanationA causal relationship must be backed up based on a theoretical ground. That is, an explanation is needed from a theory to support the causal relationship.
Causal Aspects of VariablesHypotheses connect variables and often postulate a cause-and-effect relationship among them.
32
The position of a variable in a hypothesis can clarify variables into four types: independent, dependent, intervening, and antecedent.
Independent variableAn independent variable is hypothesized to be the cause of the dependent variable. Women’s education levels, for example, are hypothesized to be the cause of variations in their fertility (number of children born to a woman).
Dependent variableA dependent variable is hypothesized to be the effect being caused. That is, number of children is caused by the variations in women’s educational levels.
Independent Dependent
Education Levels Number of children
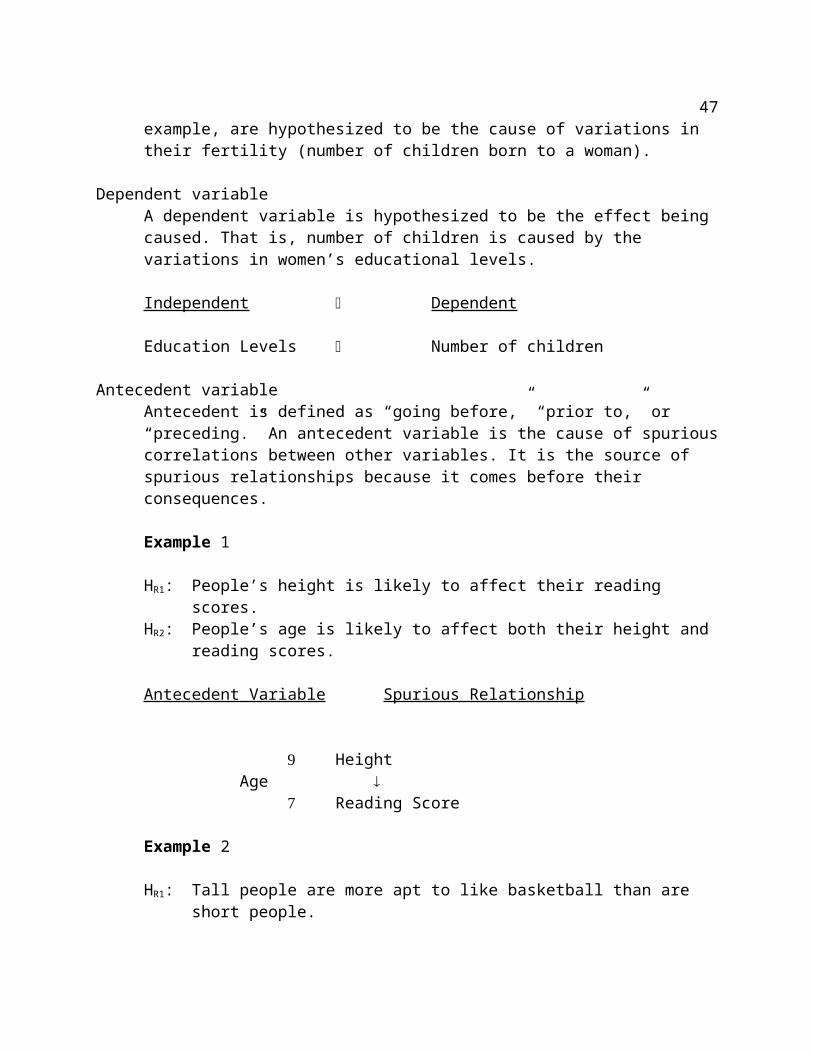
Antecedent variableAntecedent is defined as “going before,” “prior to,” or “preceding.” An antecedent variable is the cause of spurious correlations between other variables. It is the source of spurious relationships because it comes before their consequences.
Example 1
HR1: People’s height is likely to affect their reading scores.HR2: People’s age is likely to affect both their height and reading scores.
Antecedent Variable Spurious Relationship
HeightAge
Reading Score
Example 2
HR1: Tall people are more apt to like basketball than are short people.
Height
Liking Basketball
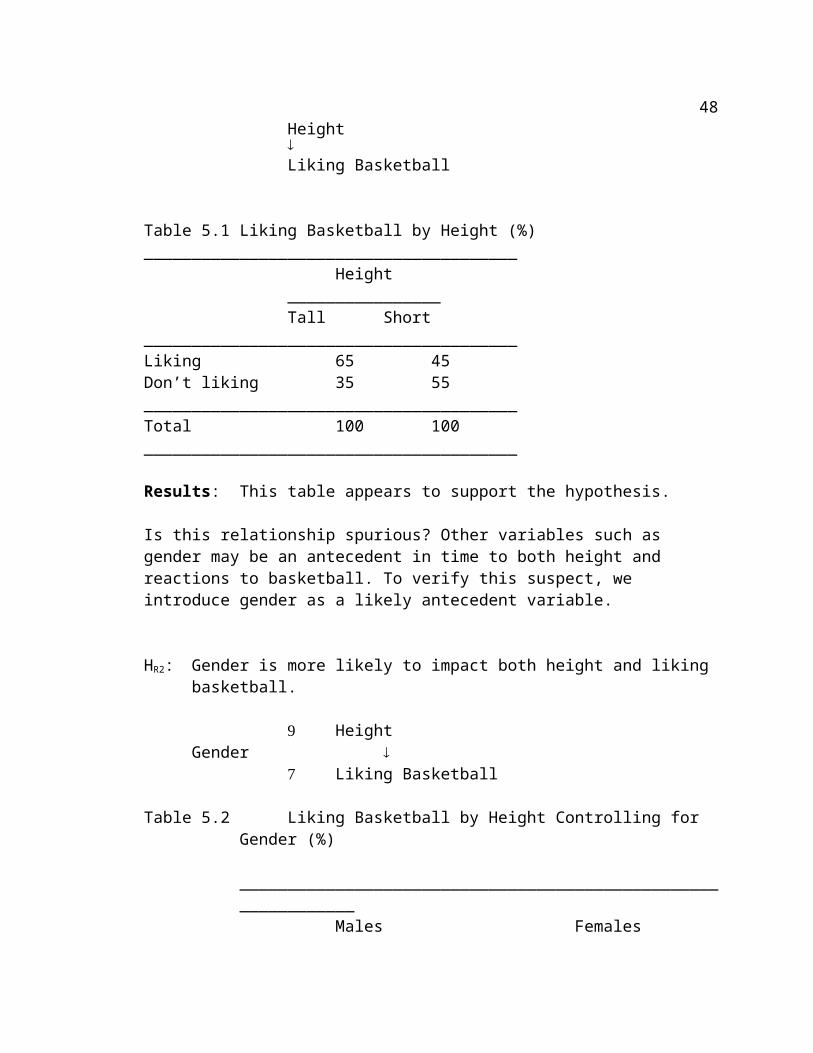
Table 5.1 Liking Basketball by Height (%)_______________________________________
Height________________
33
Tall Short_______________________________________Liking 65 45Don’t liking 35 55_______________________________________Total 100 100_______________________________________
Results: This table appears to support the hypothesis.
Is this relationship spurious? Other variables such as gender may be an antecedent in time to both height and reactions to basketball. To verify this suspect, we introduce gender as a likely antecedent variable.
HR2: Gender is more likely to impact both height and liking basketball.
HeightGender
Liking Basketball Table 5.2 Liking Basketball by Height Controlling for Gender (%)______________________________________________________________
Males Females________________ _________________Tall Short Tall Short
______________________________________________________________Liking 85 85 25 25Don’t liking 15 15 75 75______________________________________________________________Total 100 100 100 100______________________________________________________________
Results: Table 5.2 shows that by treating gender as an antecedent, the table does not support the hypothesis. The relationship between height and liking basketball has disappeared. Then we conclude that the original relationship is spurious (p93).
Intervening variableAn intervening variable acts as a link between an independent and a dependent variable. Compared with the antecedent that occurs prior to both of the variables in a relationship, an intervening variable occurs after the independent but before the dependent variable.
Example
34
HR1: Family structure affects children’s delinquency behavior.
Independent Dependent
Family Structure Delinquency (1~2 parents) (scores)
HR2: Supervision is the link between family structure and delinquency.
*Family structure affects amount of supervision for children and theamount of supervision affects children’s delinquency behavior.
If the hypothesis is true, then it is the supervision that affects then delinquency while family structure makes no difference about delinquency scores.
Independent Intervening Dependent
Family Structure Supervision Delinquency (1/2 parents) (amount of time) (scores)
Family Structure Delinquency (1/2 parents) (scores)
Table 5.3 Delinquency by Family Structure Controlling for supervision (%)__________________________________________________________________
Well Supervision Poorly SupervisionDelinquency __________________ ___________________Score 1 parent 2parent 1 parent 2 parent__________________________________________________________________High 10 10 45 45Low 90 90 55 55__________________________________________________________________Total 100 100 100 100__________________________________________________________________
35
Result: Table 5.3 confirms the hypothesis that supervision is the link between family structure and delinquency. When intervening variable is introduced, the effect of family structure on delinquency is gone. Whether “well supervision or not” makes a difference in delinquency.
Causal ModelsThe statistical descriptions of a set of empirical data that attempt to identify and to measure all of the relationships among some set of independent variables and the dependent variable. A causal model is designed to gauge dynamic relationships among the variables based on deductions from a theory.
Causal models are constructed by examining a number of variables simultaneously.
Causal models can be examined by cross-tabulations and regressions. As cross-tabulation analysis is limited by the umber of variables (3 to 4 variables at a time in a table), regression models are preferred and more advantageous over cross-tabs.
Interpreting Regression Models
Correlation coefficients r, Pearson’s correlation coefficient, only reports the relationship between two variables. Ittells the strength of the relationship between two variables. Coefficients vary from 0.00 (no relationship) to 1.0 (a perfect relationship). It may be either positive or negative. The limitation is that they examine only two variables at a time.
Regression coefficientsRegression coefficients can use the correlations between each pair of variables in a set of variables to calculate relationships among the entire set of variables.Regression coefficients estimate the independent effect of each independent variable on the dependent variable. Ordinal or higher measures are applicable in regression analysis.
Net and Joint EffectsBETA stands for the standardized beta or standardized coefficient, which is the NET effect of each independent variable on the dependent variable.
The R2 (r square) stands for a measure of the combined, or joint effects of the all the independent variables on the dependent variable. R Square can be converted into percentages and is expressed as the percentage of the variance on the dependent variable explained by all the independent variables included in the model (see example p.99).
36
SpuriousnessRegression can test the spuriousness.
H1: Higher Playboy circulation increases liquor consumption.H2: States with more male homes increase liquor consumption.
When putting both variables into the regression model, the relationship between playboy circulation and liquor consumption is insignificant, whereas states with higher male homes do significantly relate to liquor consumption. Therefore, when a variable has no net effect, the original relationship is spurious.
Suppressor VariablesWhen two independent variables are highly correlated with one another and each is strongly correlated with the dependent variable but in the opposite direction. In this case, each of the independent variables may suppress the effect of the other. As a result, two independent variables may appear NOT to be correlated with the dependent variable when in fact they are. This is called a suppressor variable.
Suppressor variables can be identified through “+” or “-“ Standardized Coefficients, BETA.
Standardized beta has the advantages of comparability since the raw values of beta have been “standardized” - converted to a common unit of measurement (regardless the raw units such as years of education, dollars of income, membership rates, etc.).
Comparing ModelsWhen comparing models, reports vary from one researcher to another. In general, however, people will report significance for each variable (t and p), report the variance on the dependent variable explained by the independent variables in terms of R2; some also report the un-standardized coefficients (b); still some report the standardized beta (B).
When making comparisons between models, standardized beta is used; while report analysis from one’s own research work, one can either use un-standardized coefficients (b), or use standardized beta (B), or both.
Examples from SPSS.
Using Categorical Variables
1 Regression analysis requires both dependent and independent variables to be interval, ratio, or ordinal measures.
2 When the independent variable is categorical or nominal, the independent variable must be converted into dummy variable.
37
Dummy VariableA dummy variable is a categorical variable that must be recoded to assign the values 0 and 1 for each category so that 1 indicates the presence of the category, and 0 represents the absence of the category.
When interpreting the regression coefficients for dummy variables, the coefficients represent the means score of the category (recoded 1). The comparisons of means are made within that category between the category recoded 1 and the category recoded 0.
The number of dummy variables = number of categories of that variable - 1Gender (male and female) has one dummy; Religion (Protestant, Catholic, Jewish, others) has three dummy; Marital status (married, single, divorced, widowed, others) has four, etc. (See example paged 105).
Example
Gender: recoded 1= Male and 0 = Female;
Race: recoded 1= whites and 0= Blacks
Religion: Protestants recoded 1 and others = 0;Catholic recoded 1and others = 0;Jewish recoded 1 and others = 0;Others recoded as 0, the reference group.
All categories recoded as “0” categories are called “Reference Group.”
Dichotomous Dependent Variables
When the dependent variable is a dichotomous variable that consists of two values, one has to apply an advanced technique known as “Logistic Regression.” This method will be dealt with in graduate studies and beyond the scope of this text.
See Examples on next page (Transparency)
38
Examples for correlation and regression for Chapter 5 SOC332
Correlation CoefficientsN: 2313 Missing: 519Cronbach's alpha: 0.274LISTWISE deletion (1-tailed test) Significance Levels: ** =.01, * =.05
HEALTH SEX FREQHEALTH 1.000 0.175 **SEX FREQ 0.175 ** 1.000
Correlation CoefficientsN: 2097 Missing: 735Cronbach's alpha: Not calculated--negative correlationsLISTWISE deletion (1-tailed test) Significance Levels: ** =.01, * =.05
39
SEX FREQ HEALTH AGE! EDUCATION! INCOME!SEX FREQ 1.000 0.169 ** -0.380 ** 0.132 ** 0.238 **HEALTH 0.169 ** 1.000 -0.192 ** 0.252 ** 0.261 **AGE! -0.380 ** -0.192 ** 1.000 -0.144 ** -0.031 EDUCATION! 0.132 ** 0.252 ** -0.144 ** 1.000 0.391 **INCOME! 0.238 ** 0.261 ** -0.031 0.391 ** 1.000
Analysis of VarianceDependent Variable: SEX FREQ N: 2313 Missing: 519Multiple R-Square = 0.031 Y-Intercept = 1.467Standard error of the estimate = 0.451LISTWISE deletion (1-tailed test) Significance Levels: **=.01, *=.05
Source Sum of Squares DF Mean Square F Prob.REGRESSION 14.854 1 14.854 73.081 0.000RESIDUAL 469.713 2311 0.203 TOTAL 484.566 2312
Unstand.b Stand.Beta Std.Err.b tHEALTH 0.111 0.175 0.013 8.549 **
Analysis of VarianceDependent Variable: SEX FREQ N: 2097 Missing: 735Multiple R-Square = 0.197 Y-Intercept = 1.849Standard error of the estimate = 0.405LISTWISE deletion (1-tailed test) Significance Levels: **=.01, *=.05
Source Sum of Squares DF Mean Square F Prob.REGRESSION 84.227 4 21.057 128.66 0.000RESIDUAL 342.380 2092 0.164 TOTAL 426.608 2096
Unstand.b Stand.Beta Std.Err.b tHEALTH 0.029 0.046 0.013 2.194 * AGE! -0.010 -0.367 0.001 -18.264 **EDUCATION! -0.003 -0.019 0.003 -0.894 INCOME! 0.019 0.222 0.002 10.235 **Regression can identify spurious relationships
Example H1: Church attendance affects sex frequency
Analysis of VarianceDependent Variable: SEX FREQ! N: 2288 Missing: 544Multiple R-Square = 0.006 Y-Intercept = 2.992Standard error of the estimate = 1.953LISTWISE deletion (1-tailed test) Significance Levels: **=.01, *=.05
Source Sum of Squares DF Mean Square F Prob.REGRESSION 50.304 1 50.304 13.195 0.000RESIDUAL 8715.213 2286 3.812 TOTAL 8765.517 2287
40
Unstand.b Stand.Beta Std.Err.b t
ATTEND! -0.054 -0.076 0 .015 -3.632 **
Is that relationship spurious?
H2: Age affects both church attendance and sex frequency
Analysis of VarianceDependent Variable: SEX FREQ! N: 2287 Missing: 545Multiple R-Square = 0.191 Y-Intercept = 5.073Standard error of the estimate = 1.762LISTWISE deletion (1-tailed test) Significance Levels: **=.01, *=.05
Source Sum of Squares DF Mean Square F Prob.REGRESSION 1676.151 2 838.076 270.060 0.000RESIDUAL 7087.923 2284 3.103 TOTAL 8764.074 2286
Unstand.b Stand.Beta Std.Err.b t
ATTEND! -0.002 -0.002 0.014 -0.113 AGE! -0.051 -0.437 0.002 -22.892 **
Conclusion:
Regression can test the spuriousness.
When putting two or more independent variables into a regression model, if the relationship between one of them and the dependent variable is gone, that implies that the original relationship between that independent and the dependent variable might be spurious.
Suppressor variables can be identified through “+” or “-”standardized coefficients BETA
***Correlation Analysis
H1: Health status and age are likely to be related.
Correlation CoefficientsN: 2312 Missing: 520Cronbach's alpha: Not calculated--negative correlations
41
LISTWISE deletion (1-tailed test) Significance Levels: ** =.01, * =.05
HEALTH! AGE! SEX FREQ!HEALTH! 1.000 -0.235 ** 0.202 **AGE! -0.235 ** 1.000 -0.440 **SEX FREQ! 0.202 ** -0.440 ** 1.000
Findings:
Health and age are negatively related.It is likely that health and age suppress each other and may affect their impact on the dependent variable
***Regression Analysis
H2: Both health status and age affect sex frequency.
Analysis of VarianceDependent Variable: SEX FREQ! N: 2312 Missing: 520Multiple R-Square = 0.204 Y-Intercept = 4.196Standard error of the estimate = 1.751LISTWISE deletion (1-tailed test) Significance Levels: **=.01, *=.05
Source Sum of Squares DF Mean Square F Prob.REGRESSION 1810.677 2 905.339 295.269 0.000RESIDUAL 7079.736 2309 3.066 TOTAL 8890.413 2311
Unstand.b Stand.Beta Std.Err.b tHEALTH! 0.251 0.104 0.046 5.466 **AGE! -0.049 -0.415 0.002 -21.725 **
Findings: Health and age influence sex frequency but in opposite direction.The results may be distorted due to the suppressor effect between health and age.
***For report on regression analysis and model comparisons, refer to Soc331 Chapter 12 transparency.
Dummy Variable Examples
Explore the relationship between marital status and family income.
H1: Family income varies as a function of marital status.
Marital status is a categorical independent variable and can be coded as “dummy variables:”Dmar1 = marriedDmar2 = widowed
42
Dmar3 = divorced or separatedDmar4 = never married coded as “0,” the Reference Group.
The Regression Analysis Results
Predictor R2 strength
b B* tstatistics
Sig. FModel Test
Sig.
MarriedWidowedDivorced
.191 3.712 - 2.326 -.284
.363-.134-.020
11.093-4.584-.652
.000
.000
.515
98.105 .000
Marital Status: The data are consistent with the hypothesis that total family income varies as a function of marital status (F = 98.105, p = .000). The knowledge of marital status explains approximately (R2 = .191) 19.1% of the variance in total family income.
As marital status here is treated as a dummy variable which is coded Dmar1=married, Dmar2=widowed, Dmar3=divorced or separated, and Dmar4=never married coded as “reference group”, so there are three unstandardized regression coefficients b1 = 3.712, b2 = -2.326, and b3= -.284 representing married, widowed, and divorced, respectively. These are the expected mean difference in total family income between married and never married, between widowed and never married, and between divorced and never married respectively. In other words, the expected mean income will be 3.712 units higher for married than for never married, but 2.326 units lower for widowed than for never married, and .284 units lower for divorced or separated than for never married.
These data demonstrate the fact that the expected mean total family income differs among marital status. Therefore, I can conclude that the empirical data support the hypothesis that total family income varies as a function of marital status.
Dr. Ji Handout 6Soc 332
CHAPTER 6 BASIC RESEARCH DESIGN____________________________________________________________________________________
Contour major social research design
The Experimental Research
43
1) Experimental research builds on the principles of a positivist approach more directly than do the other research techniques. It is the strongest for testing causal relationships because the 3 conditions for causality (temporal order, association, no alternative explanations) are clearly met in experimental designs.
2) Experimental research has two features:1) Researchers can manipulate the independent variable - to make it vary as much as
they wish and whenever they wish.2) There is random assignment of subjects - people who participate in the
experiment are referred to as the subjects. They are subjected to different levels of the independent variable
Manipulating the independent variableThe experiment provides the most powerful research design for Causal models: time order, correlations, and establishment of non-spurious relationship by holding constant the control variables.
1) One-shot case study
X O
X is the independent variable and O is the dependent.X is the treatment condition and O stands for observation.
2) The one-group pretest-post test design
O1 X O2
O1 is the group for pretest to record down scoresO2 is the same group for post-test to see any effects after exposure to the independent X
3) The static-group comparison
X O1O2
O1 and O2 are separate two groups. Group O1 is exposed to the X while O2 is not. Then compare the effects between group O1 and O2 to see the effects by X.
4) The pretest-posttest control group design
O1 X O2R
O3 O4
44
Two groups: O1, O2 is the experimental and O3, O4 the control group.R indicates that the subjects of both O1 and O3 are randomly assigned to the groups.Pretest groups O1 and O3.Expose O2 with X but not for O4.Posttest groups O2 and O4, to see the effects.
Randomization1) Subjects are assigned randomly to two or more comparison groups. 2) Establish the equivalence of comparison groups.3) Subjects have an equal probability of being assigned to any of the treatment conditions.4) To make the groups seeing each combination alike so that they will include the same mix
of individual characteristics.5) To prevent spurious experimental findings.
Significance1) Significance test specifies the odds/probability that a given correlation between variables
was caused by random variation. It tells us when to take an observed result as real and when to reject it as a fluke. It is concerned with whether a relationship found in a sample is also to be true in the population.
2) There are two factors affecting the calculation of significance:a) The number of the subjects in the group. The larger the number, the less likely the
results are random flukes.b) The size of the observed differences/correlation. The larger the
difference/correlation, the less likely the difference is caused by flukes.
3) The experiments are the best choice for social research because of manipulation and randomization.
4) The experiments for human beings are most difficult:a) We can’t randomly assign people to be male, Canadian, at age of 5, Protestant, or
to be female, Japanese, 85, and Daoism, etc.b) Social researchers are more prone to non-experimental design.
Advantages (chapter 7 Reference)1). Least vulnerable to problems of internal validity.2). Provides strongest inference about cause and effect. Subjects are assigned randomly to
two or more comparison groups. The comparison group represents the different levels on the Independent Variable. Because true experiments rely on random assignment of subjects to comparison groups. 1. Subjects have an equal probability of being selected. 2. Systematic bias is eliminated.
3). Provides confidence that the distribution of extraneous variables (which could confound the research findings if not controlled)-will be distributed equally across treatment conditions.
4). Establishes the equivalence of comparison groups.
45
5). Controls for the potential contaminating effects of all variables, including those we are not aware of, simultaneously.
6). Provide the strongest support for causal inferences.
Disadvantages: (4) Experiments are typically conducted using volunteer subjects, often college students, who
may not be representative of larger populations.(5) Experiments tend to be highly focused, data is usually collected on only a small number
of variables. Ana(6) since it is a closed-door and artificial research, it can not be used for generalizing
purposes.
Survey ResearchSurvey research is based on samples of individuals who are interviewed (face-to-face or telephone interviews) or who fill out questionnaires. People who are included in the survey are referred to as respondents.
Studying “natural” variationSurvey makes it possible to study variables that are impossible or immoral to manipulate. In other words, survey can examine variation as it naturally occurs.1) We can not manipulate political party preference, for example.2) We can not randomly assign people to live in certain areas.3) We get specific information for our research purposes.
Advantages:(1) used for descriptive and explorative purposes;(2) excellent for describing the characteristics of a larger heterogeneous population;(3) wide coverage and many topics can be obtained from a single survey;(4) effective tool for providing information about non-observable characteristics
( perceptions, beliefs, feelings, motivations, future plans, past behavior, etc.);(5) provides comparable information across units of analysis;(6) data are easy to code and statistically analyze;(7) can establish relationships between variables;(8) data can be used for multiple purposes;(9) can insure subjects anonymity and confidentiality;(10) relatively fast and safe.
Disadvantages:(1) provide weak tests of cause-effect hypothesis;(2) lacks depth - only provide short term or secondary interaction;(3) place primary reliance on verbal reports of non-verbal behavior;(4) assume subjects have the requisite skills to report verbally;(5) tendency to restrict researchers to individuals as the basic unit of analysis;(6) often difficult to develop a representative sampling frame;
46
(7) poor social indicators of social change because most surveys are cross-sectional;(8) highly reactive measurement tools - may produce changes in the attitudes,
opinions, and behavior;(9) cost - widely varies by methods.
Field Research1) Field research involves going out to the real field or natural settings to observe
people as they engage in the activities of interest. Research is conducted in the field - in the natural settings in which people and activities of interest are normally found and studied.
2) Field research is often guided by research hypotheses and exploratory in nature. Anthropologists pioneered field research methods.
3) Field research produces suggestive hypothesis after the observations are completed.
Covert observationPeople who are observed are unaware that they are the objects of research.
1) Researchers must be normal participants.2) Researchers are limited in how inquisitive/curiosity they can be.3) Researchers do not disturb the natural patterns of behavior.4) Able to minimize observer effects.
Overt observationPeople who are observed know they are the objects of research.
Field Notes/Observational research As experiments produce written records and surveys obtain data, field researchers write notes about what they see and hear. These notes constitute the data based on which conclusions may be drawn. These notes can be computerized and the qualitative data can be quantified for analysis. Field research has two limitations.1) It is only suitable for small groups.2) Like all other non-experimental designs, field research cannot offer proof that the
correlation between attachments to the group and conversation was not a spurious relationship.
1) Observational research provides direct and generally un-ambiguous evidence of overt behavior, but it also used to measure subjective experiences such as feelings and attitudes. For example, one could measure interpersonal attraction by observing and recording the physical distance that two people maintain between themselves, with closer distances indicative of greater liking. Besides physical distance and eye contact, researchers have used exterior physical signs (e.g. clothing), gestures, and language to
47
measure behavior. The categories of observation measures often involve the frequency and duration of acts. Observational research applies to properties that can be perceived directly by the senses.
2) Observation is the procedure by which a scientist gathers his data. Whereas measurement is the assignment of numbers to the various outcomes one’s variable can exhibit, observation is the way in which one undertakes to measure a phenomenon. It may be direct, where one actually observes the behavior of the individuals (for example, an anthropologist in a primitive society), or indirect, as through the use of questionnaire, interviews, projective techniques, or physiological reactions.
Advantages:1). Can often provide a detailed description of individuals and the social relationships
in which individuals are involved.2). Offers access to actors of complex situations and events.3). Sampling procedures are better than experiments but still leave questions about
generalizability.4). In observational research, there is often a long period of social interaction
between the subject and the researcher. The researcher can make observations of non-verbal behavior, which may (or may not) be consistent with the subjects’ self-reports.
Disadvantages: 1). Absence of formal controls makes this research least acceptable for testing causal
hypotheses.2). Vulnerability to experimenter and testing effects depends on the investigation and
on how well they are accepted by the group they are studying.3). Very difficult to replicate.4). Typically conducted on small, purposely selected samples, thus, generalizability
of findings to large populations is limited.5). Data from observational research usually consists of text-based notes that are not
in standardized formats. Such information is difficult to sort through, organize and systematically analyze.
Comparative Research/Aggregate Research
1) Unlike studying individuals as units of analysis, comparative research usually identifies comparisons of large social units - typically the units of analysis involve the whole nations, societies, states, cities, counties, etc.
2) Comparative research usually uses aggregate data from a larger areas or districts such as from countries, cities, towns, counties, states, etc.
3) These aggregate data are already organized or published in a tabulated form with few statistical techniques known to researchers. Examples of such data as crude birth rates,
48
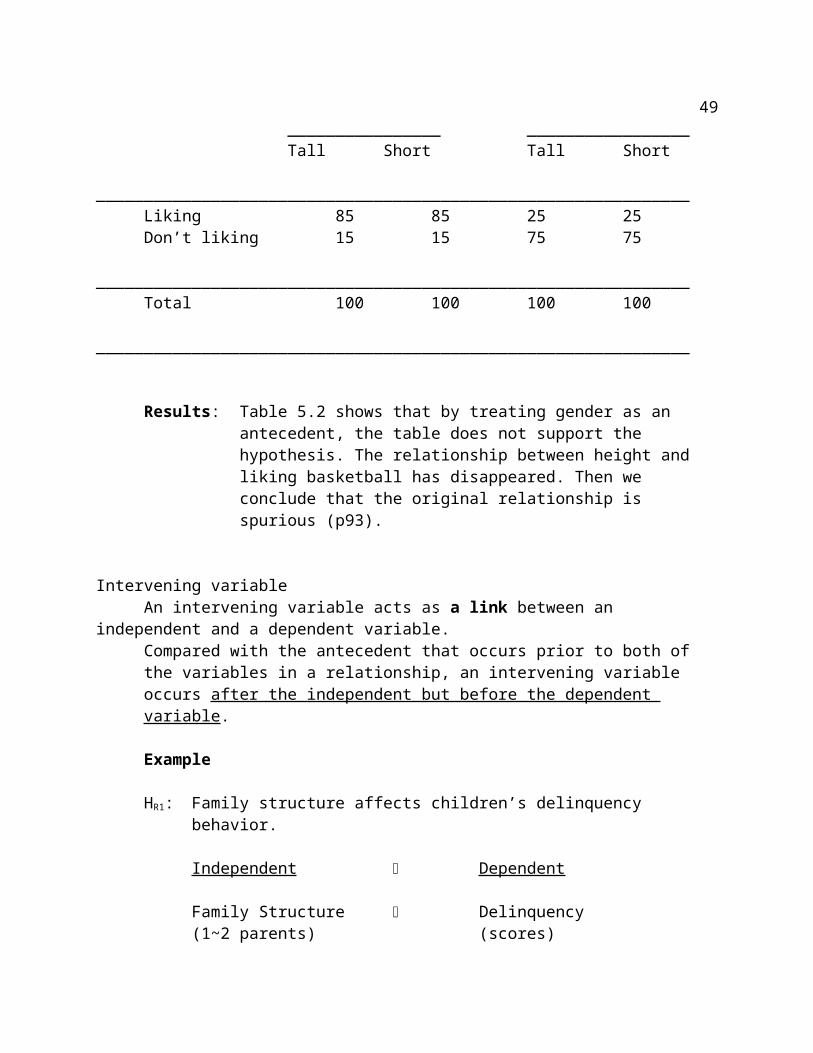
death rates, infant mortality rates, population density, urbanization rates, divorce rates, marriage rates, migration rates, poverty rates, crime rates, unemployment rates, etc.
4) Little can be done for further quantitative data analysis.5) The purposes for comparative research are to seek similarities, differences, or explore
dynamic trend of topics of interests.
Data “Collection”Unlike other research designs, data collection for comparative studies are primarily based on search for governmental documents or international publishing such as almanac in libraries because data are primarily collected by governments agencies.
Using official data to compare nationsThere is a number of very useful almanac:
1) The World Almanac and Book of Facts - ethnic, religious, language compositions; GNP; infant mortality, life expectancy; rates of TV; radios and telephones, etc.
2) The World Fact Book3) The Demographic Year Book - health statistics such as causes of death, etc4) Population Council - issuing fertility and contraceptives, etc.4) World Bank - report on economic development and international trade.
Example (Henan Elderly Data, 1987)
Sources Of Medical Care Of The Aged By Gender And Region In Henan_______________________________________________________________
Male / Female_______________________________________________________________
Urban Rural / Urban RuralSelf 593 8273 / 3140 9658
9.0 92.7 / 42.5 96.5
Half-self 785 270 / 2299 31811.9 3.0 / 31.1 3.2
Public 5200 384 / 1946 3379.1 4.3 / 26.4 .3
Total 6578 8927 / 7385 1000942.4 57.6 / 42.5 57.5
_______________________________________________________________
Cross-cultural samples? P119
49
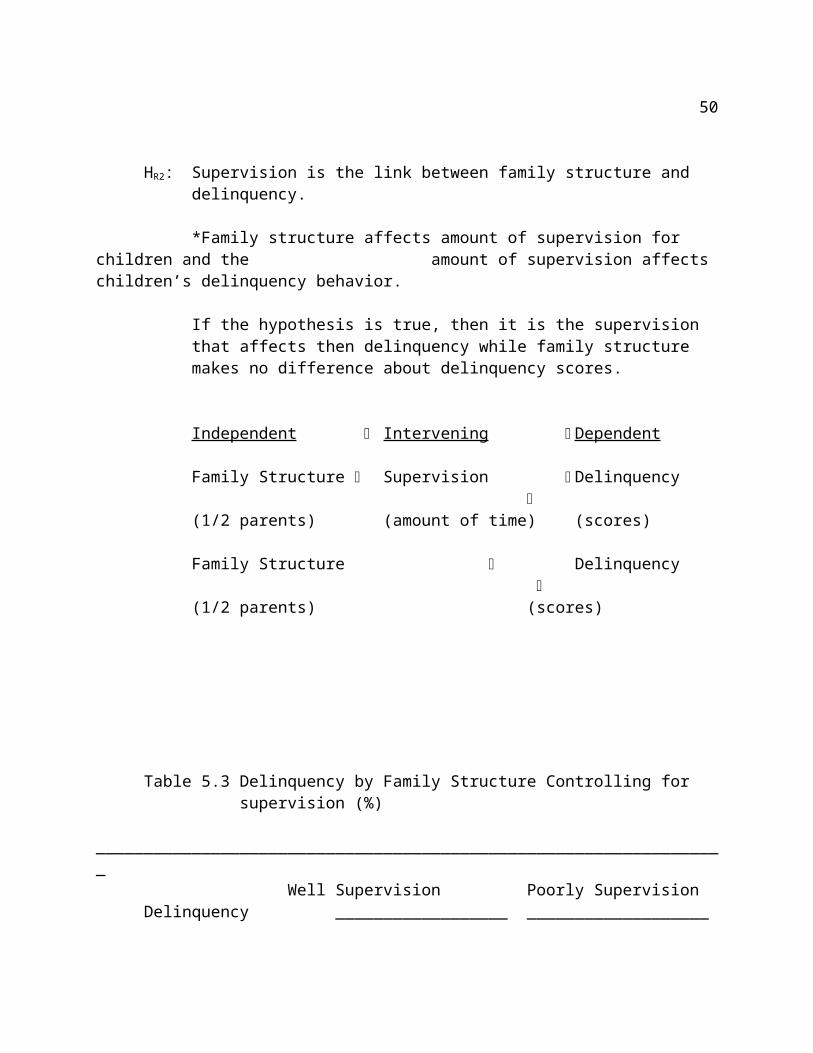
Content Analysis1) Verbal and non-quantitative textual and graphic materials are coded to produce
quantitative data in order to make further analysis for research purposes.2) Many verbal and textual materials are produced without the producers having any
thought about subsequent use or analysis. These materials can produce very important results by coding such materials to create variables.
3). A research method for analyzing the symbolic content of any communication. It is a systematic examination of written documents such as novels, government publications, recorded speeches, and so forth. The basic idea is to reduce the total content of a communication to a set of categories that represent some characteristics of research interest.
There are three types of content analysis:1). Pragmatical, which classifies signs according to their probable causes or
effects/relationships;2). Semantical, which classifies signs according to their meanings; 3). Sign-vehicle, which classifies content according to the psycho-physical properties of the
signs, “e.g., counting the number of times the word ‘Germany’ appears.”
Examples
Are there Liberal-Conservative differences among news magazines such as Times or Newsweek, etc?
Are the restroom-wall graffiti related to the type of social environment in which the restrooms exist? (survey plus content analysis)
Are there any changes in using the terms of “Blacks” and “African Americans” in today’s textbooks compared with what was used in 1950s?
How do medium portray minorities differently than they did three decades ago?
What are the most frequently grammatical mistakes in the student’s term paper -misspellings, tenses, compound sentences, subjunctive mood, etc?
Advantage:1). providing systematic examination of materials that are more typically evaluated
on an impressionistic basis;2). guard against any inadvertent biases one may build into the examination.
Disadvantage:1). may not provide most appropriate reflection of the variable under study;2). scoring methods almost always contain an arbitrary element.
50
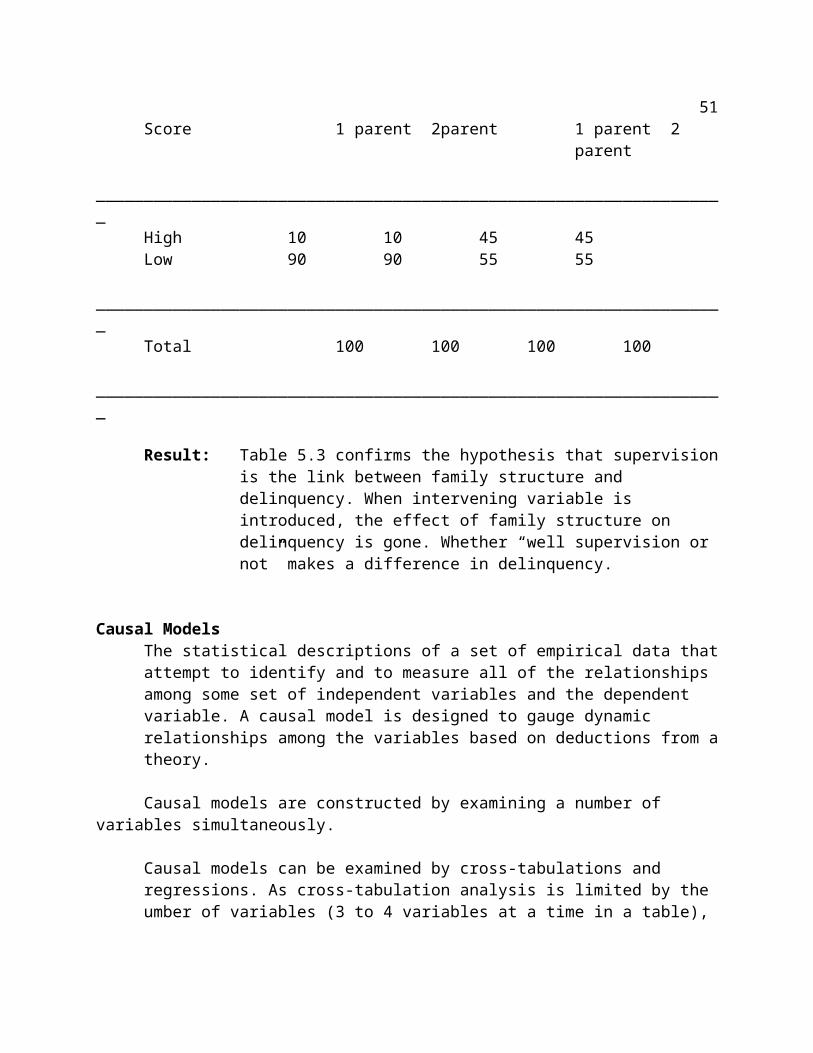
Studying ChangeChanges over time are central to social research. These changes involve attitudes, policies, programs, products, procedures, demographic characteristics, etc.
1). Surveys are taken over a period of time to examine the changes.2). Field research report changes based on observations.3). Comparison research is based on immense literature to study change.4). Censuses are used to study changes by comparing the same question items between-
censuses such as population density, urbanization, fertility levels, contraceptive uses, etc.
4 BASIC EXPERIMENTAL DESIGNS – SUMMARY ILLUSTRATION FOR CHAPTER 6
1) One-shot case study
X O
X is the independent variable and O is the dependent/subject.
51
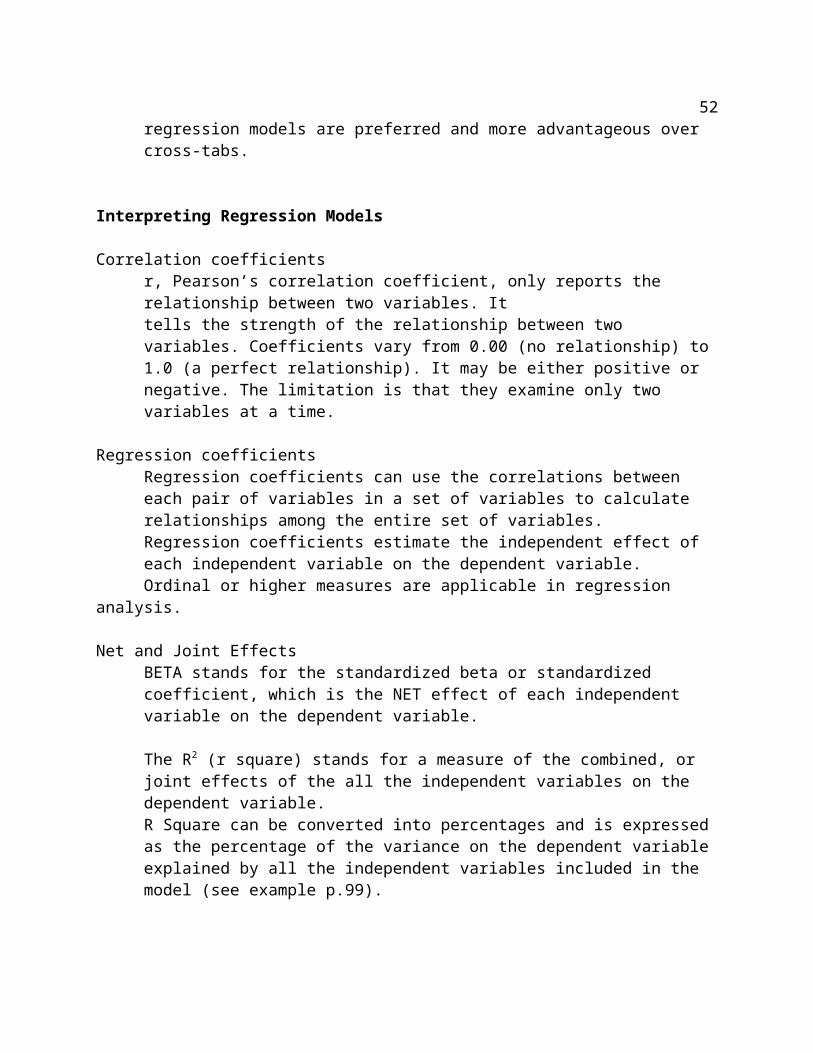
X is the treatment condition and O stands for observation.We manipulate X to O to see the effect on O from X.
2) The one-group pretest-post test design
O1 X O2
O1 is the group for pretest to record down scores.O2 is the same group for post-test to see any effects after exposure to the independent X.Effects are identified by comparing the pre- and post tests on O1 and O2.
3) The static-group comparison
X O1O2
O1 and O2 are separate two groups.O1 is exposed to the X while O2 is not. The effects of X on group O1 and the absence of X on O2 are examined to see the difference.
4) The pretest-posttest control group design
O1 X O2R
O3 O4
Two groups: O1&O2 are the experimental group and O3&O4 the control group.R indicates that the subjects of both O1 and O3 are randomly assigned to the groups.Pretest groups O1 and O3.Expose O2 with X but not for O4.Posttest groups O2 and O4 to see the effects.
Dr. Ji Handout 7Soc 332 Spring 2002
CHAPTER 7 SURVEY RESEARCH____________________________________________________________________________________
Overview of the practice of survey research
52
Evaluation of survey results, advantages and disadvantages
Simple and Proportional FactsSimple facts
A simple fact is a concrete and limited state of affaires. It is a claim that something happened or exists and usually having to do with only one or few cases. African Americans are a minority in USA Jerry’s middle class family and earns an income about $ 46, 000 a year.
Proportional FactsA proportional fact states a distribution of something among a number of cases. It may also be the joint distribution of several things among a number of cases. What is the proportion of African Americans in the USA? What is the proportion of the middle class in America?
Comparisons a simple fact is less expensive and easy to establish a proportional fact is more expensive and difficult to establish proportional facts need specific methods to obtain reliable proportional and specific facts need scientific survey research
Reliability1 The extent to which the measurement instrument procedures produce consistent and
stable results on repeated trials.2 It is concerned with questions of stability and consistency.3 Reliability is reduced from random error, but not nonrandom error.4 Reliability deals with an indicator’s dependability. 5 If you have an eligible indicator or measure, it gives you the same result each time the
same thing is measured (as long as what you are measuring is not changing). 6 Reliability means that the information provided by indicators (e.g. questionnaire) does
not vary as a result of characteristics of the indicator, instrument, or measurement device itself.
7 A measure can have high reliability but not validity.
ExampleIf you get on your bathroom scales and read your weight. You get off and get on them again and again. You have a reliable scale if it gives you the same weight each time, assuming, of course, that you are not eating, drinking, changing clothing, and so on. An unreliable scale is one that registers different weights each time even though your “true” weight does not change. Another everyday example is a car speedometer. If the speedometer jumps between 10 mph and 80 mph when you are going at a constant slow speed over a smooth, flat surface, it is not a reliable indicator.
Three main factors cause unreliability in survey research data:
53
1 Can’t answer/can’t answer accurately1) Respondents really don’t know the answer.
e.g. don’t know how many TV hours watching a week.2) Having difficulties answering income.
e.g. is that annual income, or hourly, weekly, monthly? Is that gross or net income or take-home income? Is that individual income or family income? It is hard to know family income because members really don’t know each other’s actual income.
3) Questions are irrelevant to respondents. They don’t have any opinions about the issues asked; it is not because respondents are stupid simply because they don’t care about one way or another.e.g. political opinion about which candidate is likely to be selected.
4) Misunderstanding the questions. Some questions are badly formulated - the primary reason for misleading.E.g. “Does it seem possible or does it seem impossible to you that the Nazi extermination of the Jews never happened?” - double negative, not meaningful, hard to interpret, badly written.
2 Won’t answer/won’t answer honestly1) People tend not to give some answers honestly.
E.g. people tend to report their ages are 29, 39, 49, or 59 but not 30, 40, 50, or 60 simply not to admit they passed the one of the milestone ages. So the best way to ask ages is to ask their year of birth.
2) People tend to give inaccurate answer for some questions such income, ages, marital status, sexual activities, etc.
3 Refuse to answerFor some other reasons, some people refuse to give answers.
Validity1 Validity refers to the extent of matching or goodness of fit between an operational
definition and concept it is purported to measure. It answers the question “Are you measuring what you intend to measure with this operational definition?” “Does the indicator reflect differences between units of analysis on the characteristics that we seek to measure?
2 When a measure is not valid, it means that the observed differences on the empirical indicator do not reflect the true differences on the characteristics of interest.
3 Validity is reduced from both random and non-random error.4 Validity is the degree to which the empirical indicator measures what it purports to
measure. Validity is something to be argued, not proven. Validity can be thought of as a set of standards by which you judge things. If an indicator is valid, observed differences on the indicators reflect true differences on the characteristic that we seek to measure. When a researcher says that an indicator is valid, it is for a particular purpose and definition. The same indicator can be valid for one purpose but may be less valid for
54
another.(e.g. a measure of morale might be valid for measuring morale among teachers but invalid for measuring the morale of police officers).
5 At its core, measurement validity is the degree of fit between a construct and indicators of it. It refers to how well the conceptual and operational definitions mesh with each other. The better the fit, the greater the measurement validity.
6 Validity is more difficult to achieve than reliability. Researchers cannot have absolute confidence about validity, but some measures are more valid than others. The reason we can never have absolute validity is that the constructs are abstract ideas, whereas indicators refer to concrete observations. This is the gap between our mental pictures about the world and the specific things we do at particular time and place.
7 Measuring attitudes must be distinguished from measuring behavior. 1) Attitude is an enduring, learned predisposition to respond in a consistent way to a
particular stimulus/set of stimuli. We all have attitudes toward significant things surrounding us: people, objects, ideas, events, and so on. An attitude has three components: a) a belief - I believe there is a God.b) an evaluation - Religion is supportive to human being’s spiritual world.c) a behavioral disposition - I support to establish a new church in neighborhood.
2) Behavior is what living creatures do. Behavior involves action. We hold attitudes but perform behavior.
3) Some questions measure an attitude. Some attempt to measure a behavior rather than attitude. “Women are better suited to stay at homes than men.” - (gender bias attitude)“Who did most of your family chores, you or your wife?”(division of labor)
4) Links between attitude and behaviorAttitude can predict behavior but are not measures of behavior.Questions that ask about how a respondent might act in a hypothetical situation are only weak measures of behavior.
Relationships between reliability and validity (random error and systematic error)A highly un-reliable measure cannot be valid — How can you get at whatever you want to measure if your results fluctuate wildly? On the other hand, a very reliable measure still may not be valid — you could be measuring very reliable something other than what you intended to measure — suppose we measure the “INTELLIGENCE” of students by standing them on a bathroom scale and reading the number off the dial. Such an operational definition could be highly reliable as repeated scale readings would yield consistent results. However, it could never be a valid measure of an individual’s “INTELLIGENCE.”
Interviews and Questionnaires
55

Survey research is based on interviews and questionnaires. There are three kinds: Face to face, telephone, and mail questionnaires.
Face-to-face interviewsAdvantages:
(1) highest completion rate (80-90%);(2) greater complexity of question formats and topics;(3) can complete long questionnaire and longer interview schedules;(4) lower rate of item non-response;(5) greater control over the environment where the interview takes place;(6) can examine non-verbal behavior;(7) can maintain question order and sequencing;(8) control over who responds;(9) record date of interview;(10) can separate sample coverage from non-response.
Disadvantages of personal interview:(1) cost most expensive;(2) difficult to cover wide geographic areas;(3) likely to stimulate socially desirable answers;(4) potential for interview bias;(5) potential for other interviewer errors-asking, probing, recording errors, etc.(6) difficult to supervise interviewers;(7) difficult to control time;(8) sometime dangerous to interview in certain areas;(9) inconvenience - intrusion into lives of the respondents;(10) difficult to consult records.
Mailed QuestionnairesAdvantages:
(1) cost less expensive than face-to-face or telephone interviews;(2) wide geographical coverage;(3) less prone to social desirability;(4) no interviewer’s bias;(5) standardized question wording;(6) easier to provide assurance of confidentiality;(7) require fewer resources;(8) questionnaire can be completed at respondent’ convenience.
Disadvantages:(1) lower completion rates;(2) require literate population;(3) difficult to use open-ended questions;(4) difficult to use complicated questions;(5) verbal behavior only;(6) no control of question order;(7) no control over who complete the questionnaire;
56
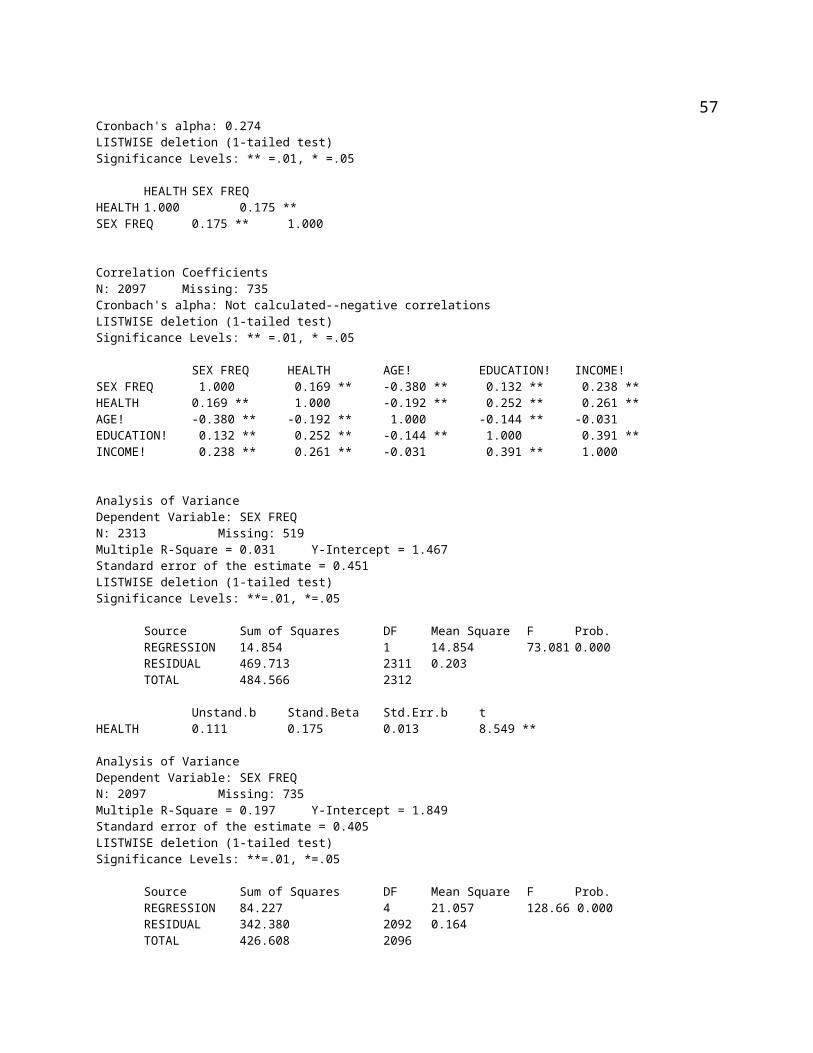
(8) more prone to item non-response;(9) increased likelihood of sample bias.
Telephone interviewsAdvantages:
(1) very fast;(2) cost cheaper;(3) wide geographical coverage;(4) easier to train interviewers;(5) easier to supervise interviewers;(6) less threatening to respondents;(7) allow use of random digit dialing- alleviate problems of developing sampling
frames;(8) higher completion rates than mailing questionnaires but lower than face-to-face
interviews.Disadvantages:
(1) lower completion rate than face-to-face interviews;(2) difficult to use complex question formats;(3) potential for interview bias;(4) tends to under-represent the poor;(5) tends to under-represent those whose unlisted in the phone books;(6) less control over the respondent’s environment;(7) often in-convenient for subjects, similar to personal interviews.
Measuring Concepts with Survey QuestionsStandard versus Original Items
Having been used for decades, many of the same concepts are measured in survey after survey. Consequently, many questions have been accepted as standard items, which have several advantages.
1) permit meaningful comparison across studies;2) highly qualifies3) save time and effort Standard items, however, do not exit for many of the primary concepts to be measured in most surveys. Original items should be always pre-tested before being used.
Closed versus Open-ended QuestionsSurvey questions come in two basic forms: Closed and open-ended.
Closed questionsask respondents to select responses from a set of questions provided by the researchers.Advantages:1) maximize comparability; 2) no re-coding; 3) more efficient;
57
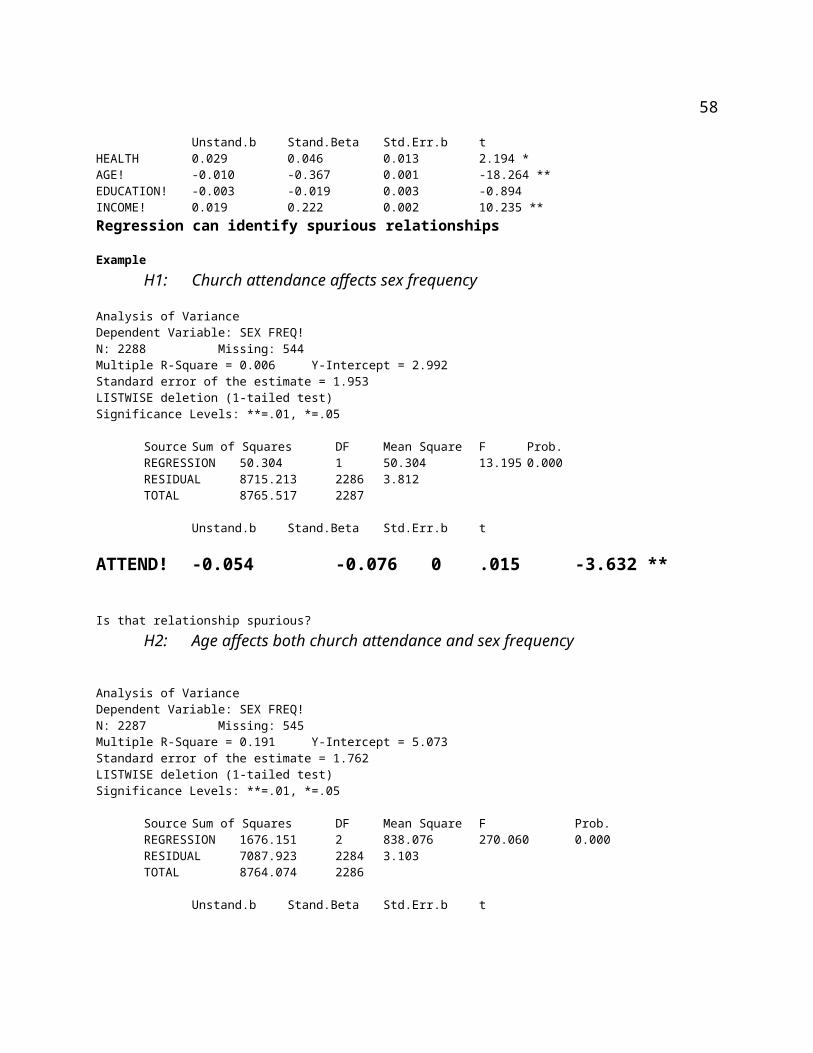
4) more advantageous over open-ended. Disadvantages:1) suppress variation; 2) may mis-classify respondents because questions may be worded poorly or ambiguous.
Open-ended questionpermit respondents to answer in their own words.Advantages:1) respondents are free to express themselves; 2) useful for exploratory studies; 3) working better for sensitive questions; 4) providing juicy quotes for more report Disadvantage:1) hard to make comparisons2) difficult to code3) not standardized items4) time-consuming and more expensive
Evaluating closed questions1) Unbiased language
The way questions are worded has an extraordinary impact on how they are answered:
“Should laws be passed to eliminate all possibilities of special interests giving huge sums of money to candidates?”
Yes 99%No 1%
“Please tell me whether you favor or oppose the proposal: The passage of new laws that would eliminate all possibility of special interests giving large sums of money to candidates.”
Favor 70%Oppose 28%Don’t know 2%
2) ClarityGood survey items must be clearly worded.
“Do you think that McDonald’s should have not been found not liable for damages when a woman spilled a cup of coffee in her lap?” - double negative - bad
“Do you think that McDonald’s should have been found liable for damages when a woman spilled a cup of coffee in her lap?” - drop the negative entirely - better
58
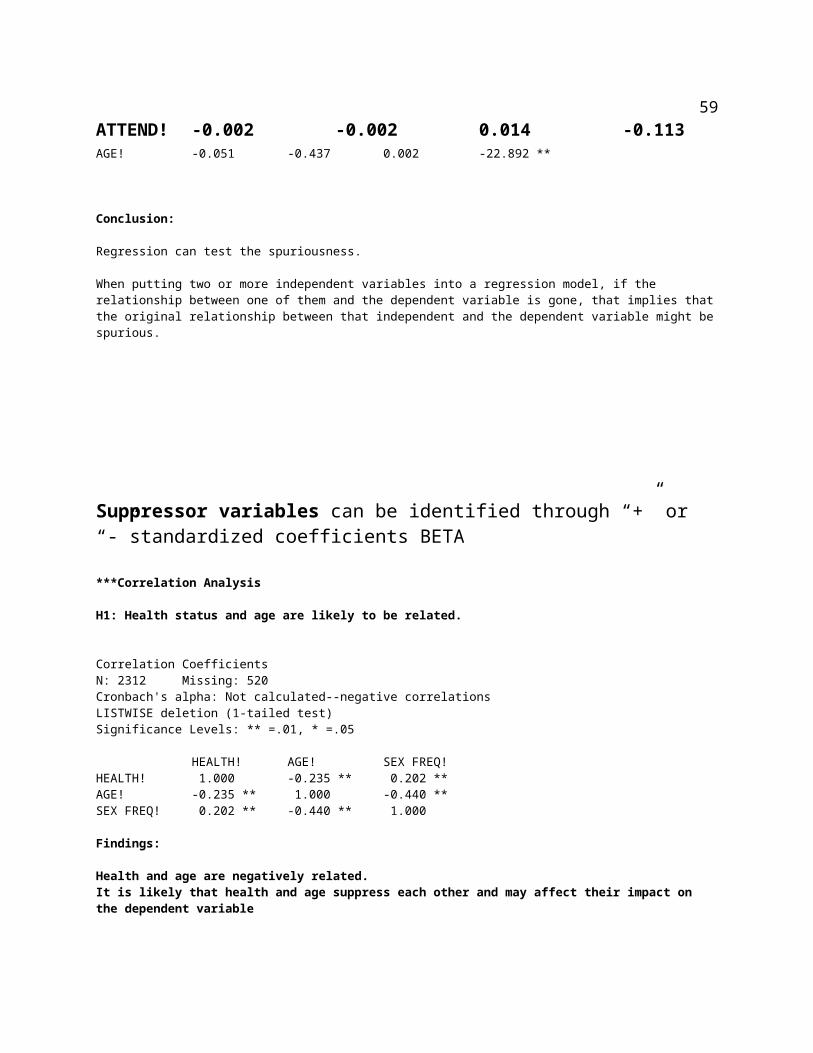
3) Mutually exclusive and exhaustive categoriesCategories must not be overlapped or omitted.
What is your occupation? - exclusive/overlapProfessionalManagerialTechnicalWhite collarSkilled craft
What is your religious belief? - not exhaustiveProtestantCatholicJewish
4) Forcing variationA frequent error in question construction is inappropriate collapsing of categories.
“ how many different people have you had sex in the past 12 months?”- 0-1- 2-3- 4 +
(What about those having no sex? How to distinguish from them?)Cafeteria and forced option questionsCafeteria option questions/Multiple response items
Respondents are allowed to pick and choose from a large selection of responses, indicating only the responses they select.To select all options that applies.
e.g. Here is a list of groups or organizations. Could you tell me whether or not you are a member of each type. Check all that applies:
Service clubsVeteran’s groupPolitical clubsLabor unionsSports groupsYouth unionsSchool service groupsFarm organizationsProfessional societiesAny other groups
Forced option questions
59
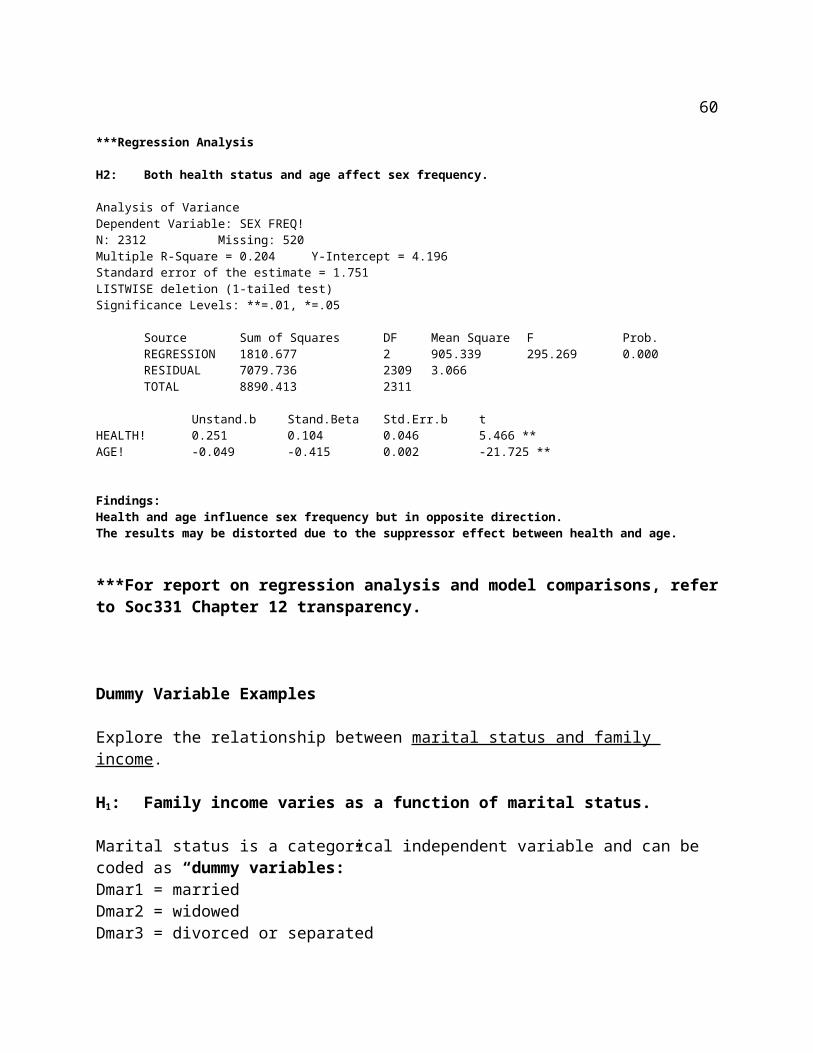
Respondents are required to indicate an appropriate response for each optionTo respond to every option. Either say Yes or No, one must have an option.
ComparisonsCafeteria questions are not good ways to measure things because the researchers don’t know if the respondents agree or disagree by skipping options from the respondents. In comparison, forced questions can let researchers know respondents’ attitudes.
Contingency questions1) Contingency questions divert respondents to different questions and give direction
to skip questions on responses to a prior question.2) Certain questions are only asked if the respondents have answered a previous
question in a particular way.
e.g. Have you ever been rewarded?Yes, very oftenYes, a few timesYes, but only once
If you have been warded, was it in high school or in college?–College– High school– Both
Item order (p. 148 example)1) what the study is about and why it is worthwhile for their participation;2) start with interesting questions3) no sensitive question at the beginning4) building up trust5) put personal background in the end (age, occupation, race, marital status,
education, religion, etc.)
Response biasThere are two commonly found biases in respondents. Conformity and Response set.
Conformityrefers to the tendency of respondents to select the “normal” or “non-controversial” answers, based on their perceived social standards, in order to make a good impression about conforming to social expectations but may not give the most accurate answers.
introduce a few questions that virtually everyone would disagree early in the interview to get the respondents accustomed to disagreeing.
Response set
60
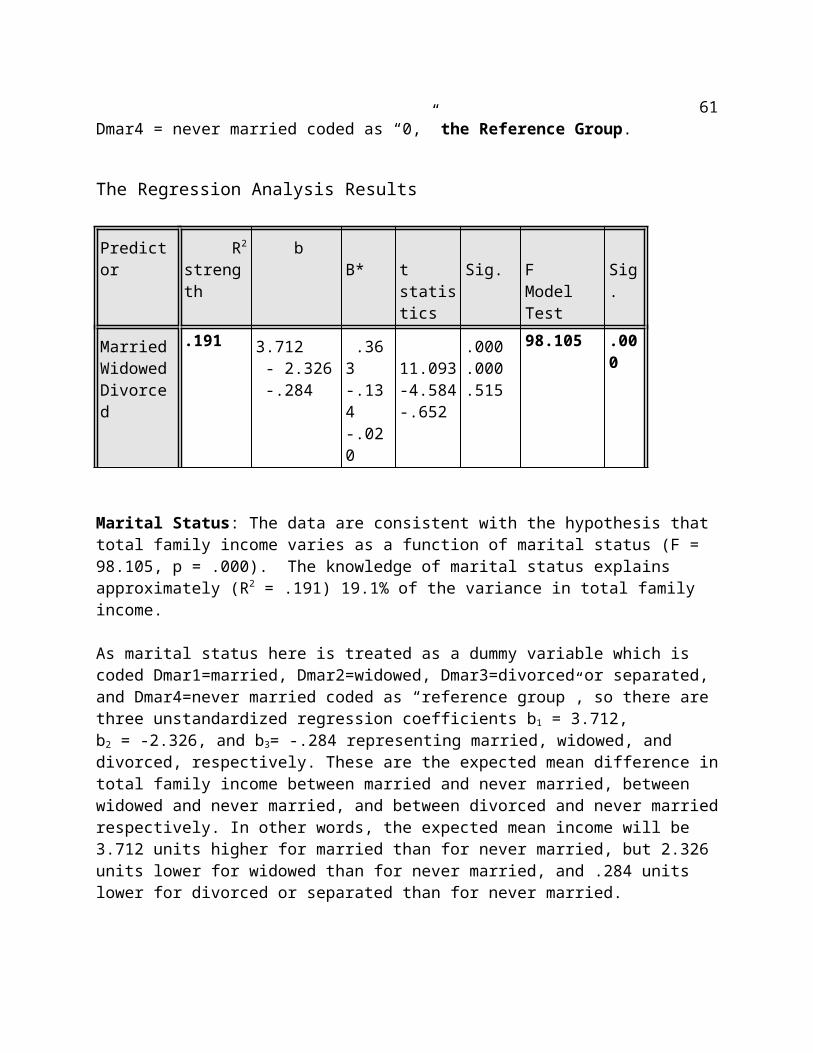
refers to the tendency of respondents to fall into a pattern of responding without regard for variation in content. This occurs partly due to the same set of response categories of all items.
the solution is to alternate negative and positive items in order to prevent such a pattern from developing.
Non-responseMeans to reduce non-response though controversial.
Motivating respondents1) cover letter stating the importance of the survey2) offer money $ 2 - 53) offer merchandise4) prizes5) paying respondents $15 - 50 as time consumed
Assessing non-response biasTo discover how non-response may have influenced the results of a survey.1) sex2) age3) occupation4) race/ethnicity
Interviewing guidelinesBasic points about the selection and training of interviewers.
Selection of interviewers1) develop a warm and friendly impression2) honest3) ask questions in a neutral way4) hear and record faithfully5) select interviewers similar to the intended respondents (combination of age, sex,
race, or ethnicity of interviewers matter very much sometimes)
Training of interviewers1) get familiar with interview schedule2) practice interviews prior to field work3) read questions precisely and use the exact wording4) write down exactly as said (open-ended questions)5) probes are offered as provided in necessary
Studying changeTrend studies
61
A trend study - a given general population may be sampled and studied at different points in time. Each sample represents the same population, though different persons are studied in each survey. Trend studies often involve a rather long period of data collection. Trend studies are based on descriptions of a general population over time, though the members of that population will change. i.e. the Gallop Polls on political campaign. By comparing the results of these several polls, researchers may determine shifts in voting intentions. S56Trend study: A type of longitudinal study in which a given characteristic of some population is monitored over time. An example is the series of Gallop polls showing the political-candidate preferences of the electorate over the course of a campaign, even though different samples are interviewed at each point. It consists of a cross-sectional design in which each survey collects data on the same items or variables with an independent sample of the same target population. Don’t use the same sample; only the same population (GSS). Identifies which variables change over time. Trend studies often involve a rather long period of data collection. Trend studies are based on
descriptions of a general population over time, although the members of that population will change. Persons alive and represented in the first study might be dead at the time of the 2nd, and persons unborn at the time of the 1st study might be represented in the 2nd. Typically, you do not personally collect all the data used in a trend study but instead conduct a secondary analysis of data collected over time by several other researchers.
PanelA panel design - involves the collection of data over time from the same sample of respondents. i.e. you re-interview all your panels to ask their opinions about political attitudes. The then “switchers” and “non-switchers” may tell you the reasons for switching. Panel studies can reveal which individuals are changing over time because the same respondents are surveyed again and again. S58 Panel designs use a sample of the same respondents over a period of time to determine which individuals are changing over time and attempt to determine the causes for this change. The panel study is a powerful type of longitudinal research. In a panel study, a researcher observes exactly the same people, group, or organization in different time periods. In other words, he observes the same thing at multiple times. Panel research is difficult to conduct and very costly. Tracking people over time is difficult because some people die or cannot be located. The results of a well-designed panel study are extremely valuable. For example, a researcher might interview all families living on a city block in 1975. He would then locate the same families, no matter where they were living, in 1980, 1985, & 1990. This would give him 4 observations over a 15-year period. Ana
Longitudinal studiesTime-series design - refers to any set of data in which “a well-defined quantity is recorded at successive, equally spaced time points over a specific period.” An important source of time series data is the CENSUS. However, where the recording interval is not
62
equally spaced, one may still speak of a time series if data over time are involved, but the problems of interpretation of such a series will be much greater. D521Time-series research is a type of longitudinal research that is easier to conduct than a panel study because it does not have to use the same individuals or organizations. Consider the example of the families living on a block in 1975. With time series research, the researcher interviews anyone who lived on the block. Thus, for a panel study the researcher must track down the families who were neighbors in 1975, no matter where they are, whereas for the time series study he just interviews whoever lives there--even if every family from 1975 has left and a whole new set of people live on the block in 1990. Time series results are less powerful than those from panel studies, but it is less difficult or costly to obtain them. Time series designs analyze changes in single variables over time, such as income, birth rate, etc. ana
Age effectPeople change as they get older. They may be more satisfied with their lives as they mature. Age effects are reflected between different age groups. This is called age effects.
Older people differ from the younger people not only because they get older but because of differences between cohorts. Cohort differences are reflected between generations of the different cohorts. Cohort analysis is based on birth cohort - people born within the same period of time. These are called the cohort effects.
Substantial differences occur over time because everyone is changing. These differences reflect the influences associated with a particular historical time period. Differences that occur over time are called period effects.
E.g. Do you think there should be laws against marriage between blacks and whites?
Age effects:Age 20-29 30-39 40-49 50-59 60-69 70-79Yes, should be laws 21% 33% 40% 43% 48% 70%
Period effects:1973 1984 1993
Yes, should be laws 38% 25% 16%
Cohort effects:Yes, should be laws
%Age group 1973 1984 1993
20-29 21 13 11
30-39 33 13 8
63
40-49 40 26 13
50-59 43 35 14
60-69 48 41 27
70-79 70 54 44
Cohort effectA cohort design - focuses on the same specific population each time data are collected, though the samples are studied may be different. A cohort consists of persons who experience the same life event within a specified period of time. Cohorts are identified by their birth date. For example, 1960 cohort would be 20 years old by 1980 survey, 30 years old in 1990 survey. Another example is the selection of a sample of students graduating from State University in the class of 1990. Five years later, we may select and study another sample drawn from the same class of 1990. While the sample may be different each time, we would still describe the class of 1990. S56Cohort design--A study in which some specific group is studied over time although data may be collected from different members in each set of observations. A study of the occupational history of the class of 1970, in which questionnaires were sent every five years, for example would be a cohort study. An additional example would be if we select a sample of students graduating from State University in the class of 1998 to determine their attitudes toward work. Five years late, we might select and study another sample drawn from the same class. While the sample would be different each time, we would still be describing the class of 1998. Ana Consists of a sample of individuals having the same statistical event in common (usually birth year). Enables a researcher to
disentangle the influence of life course, cohort, and historical periods. Ana
Data archivesSurvey data are never out of date. They can be used any time for specific purposes by both current as well as historians. There are two primary survey data archives in USA.1) The Roper Center for Public Opinion Research, at the University of Connecticut,
maintaining more than 10,000 surveys by the Gallup Poll and by the Roper Poll, from the mid-1930s.
2) The Inter-university Consortium for Political and Social Research, at the University of Michigan, although just more recent archives.
Ethical concernsSocial research deals with human beings. The principle is that: there must be no coercion, and no harm comes to those who are studied.
1) Respondents are entirely free to not participate to refuse to answer any questions.2) The privacy of the respondents must be preserved. Respondents’ name, addresses,
ID, etc. cannot be revealed. Respondents’ information must be destroyed once the
64
survey is complete. Then system is to ensure confidentiality and no court will force a researcher to reveal any information about a respondent.
Dr. Ji HANDOUT 8SOC 332
CHAPTER 8 COMPARATIVE RESEARCH: USING AGGREGATE UNITS________________________________________________________________________
Learn the basic aspects of aggregate units Learn the skills in comparative research
Aggregate Units
1 Aggregate units refer to units of analysis larger than the individual such as counties, cities, states, provinces, nations, or even the world.
2 Aggregate units analysis is based on aggregate data, which cases are larger units of analysis and which describe the social reality surrounding the individual. Aggregate data are combined larger groupings based on individual scores.
3 The aggregate data are also called ecological data and the variables represent theses data are called ecological variables, because aggregate data are based on larger units representing spatial or geographic areas. Examples are murder rate, percent urban, average income, population density, percent Hispanic in the 50 states, etc.
Two Kinds of Aggregate Units
1 Areal units, which consists of aggregate units having geographic boundaries – an area. The commonly used areal units are nations, states, countries, cities, communities, or neighborhoods.
2 Social units, which consists of aggregate units having social boundaries – a residential district, an administrative division, an organization, or an large institution such as all persons in New York or Chicago, or all the Whites in Mississippi State.
3 Studies based on aggregate units are usually referred to as comparative studies.
Rates and BasesRate is a ratio of the occurrence in a group category to the total number of elements in a group expressed out of 100.
65
Rates reduce raw numbers to a common base. Rates are expressed as the numbers per 100, or numbers per 1000, per 10,000, or per 100,000. Rates are therefore the standardized measurements that make comparisons possible and meaningful.
Example: murders in Wyoming and CaliforniaDifficult to compare and the comparisons are not meaningful
Murders Population State 11 480,000 Wyoming205 32,000,000 California
The comparisons are not meaningful unless we calculated in rates.
Wyoming Murder rate: 11/480000 X 1000 = 22.9California Murder rate: 205/32000000 X 1000 = 0.006
Crude Birth Ratethe number of lively birth in a given year per 1,000 population.
Crude Death Ratethe number of deaths in a given year per 1,000 population.
ReliabilityAggregate data are more reliable than any data based on individuals.There are less measurement errors involved in aggregate measures.Aggregate data produce higher correlations than survey data.Aggregate data produce zero correlations if there is no significant correlation between variables while the survey data may produce small correlations.
Benefits of Large NumbersAggregate data are based on censuses, registration, records (births or death), or votes (hundreds of thousands of people) collected by governments or agents at all levels, and by systematic registration, which is involved large number of respondents and larger areas. In comparison, surveys are based on a limited number of questionnaires with a limited number of individuals. Therefore, aggregate data are more consistent and reliable than survey data (often fluctuated and less reliable).
Limits of Official Statistics1 Many official statistics are aggregate data such as crime, births, deaths, disease, marriage,
divorce, suicide, education, manufacturing, retail sales, public expenditures, poverty, welfare, and other governmental factual data such as weather, pollution, food and water supplies, irrigated land, paved roads, wildlife, etc.
2 Limitations1) Omissions and biases-because of the way they define or collection and these
shortcomings are unavoidable.
66
For example, US rape rate is 32.7 per 100,000 population in 1999. If only women are included, the rate is 70/100,000; if only for women aged 15 to 50, the rate rose to 130/100,000. Which is correct?
For another example, official crimes are underreporting: only 75% of auto thefts reported; 60% of rapes reported.
Underreporting: children under age of 12 may not be interviewed; victims who were murdered may not be reported.
International omission and biases may be even serious because their accuracy depends upon hundreds or even thousands of separate cities, counties, or communities.
2) False precision: some reports provide very precise statement such as unemployment rate rising by one-tenth of a percent – from 5.9% to 6.0%. Actually this report is far too unreliable (p.168).
ValidityValidity refers to the indicators that are used to measure the concepts they are intended to measure. Validity in this chapter is to answer the question: Do the indicators measure the concepts they are intended to measure? The primary test of validity for aggregate data relies on face validity. That is, to test the validity by looking more closely at how the indicator is defined and calculated.
Example: “How old are you?” is the question indicator to measure the concept of “Age.” It has a face validity that is clearly defined.
Faulty IndicatorsSome taken-for-granted indicators are seemingly popular but may prove invalid.
Example: Governmental unemployment rate is defined as “being out of work.” Seeking more valid measure is very important.
It is calculated only based on who are currently seeking work.What about those who lie but still work? Those who stopped looking for work because they could not find one? Those who are really looking for jobs but are not counted?Those who are seeking work but are still at work?
Assessing ValidityValidity can also be assessed by relating a particular measure to other measures or indicators believed to measure the same concept (convergent validity).
Example: 1) Measure of conservatism ought to be highly correlated with the percent voting
Republican elections;
67
2) Measures of infant and childhood mortality should be highly correlated;3) Children’s death rates ought to highly correlate to overall life expectancy,
availability of medical services, etc.4) Percent of literacy, electricity consumption, per capita income, number of phones,
etc. should be correlated if they are valid measures of economic developmental indicators.
Selecting CasesSelecting cases involve two major concerns: cases should have adequate comparability and sufficient number of cases to ensure a statistical analysis.
ComparabilityWhen using aggregate data from different nations/countries, try to use the comparable units so that the comparisons are meaningful.Example:1) To compare 42 nations in the world, use the same question items;2) When comparing rural areas, do not mix it with cities/urban areas;3) When comparing nations, cities, communities, neighbors, do not mix them each
other;4) When using social aggregates such as schools, universities, colleges, grocery
stores, TV stations, use the same aggregates.
Number of casesStatistical analysis technique requires a substantial number of cases to produce meaningful results. Number of cases equal to or more than 30 are generally accepted. The general rule is that: the larger the number of cases, the more reliable of the data, the better the results.
As aggregate data are on the whole involve nations/countries, states, provinces, cities, counties, or neighborhoods, many nations’ data sets are limited. Example:1) 192 nations in the world2) 300 metropolitan statistical areas in US but 25 in Canada3) 3141 counties and 50 states in US but 55 in Britain4) 3000 colleges and universities in US5) 47 prefectures in Japan6) 30 provinces in China7) 77 neighborhoods in Chicago and 49 in St. Louis
Analyzing Aggregate DataThere are two commonly used approaches: Case-oriented approach and variable-oriented approach.
Case-Oriented Approach
68
1 Case-oriented approach selects two or more cases and examines them closely in order to explain some striking differences between them.
2 Case-oriented studies produce impressive scholarship with insights and ideas.3 Case-oriented studies are fertile sources of concepts and theories.4 Case-oriented studies are unsuitable for testing hypothesis.5 It is impossible to illustrate cause-effect statements.
Example: Comparing Japan and America has become a publishing industry.
Variable-Oriented Approach1 Variable-oriented approach selects a set of cases and tests hypothesis by applying
statistical techniques such as correlation and regression to variables based on an appropriate set of aggregate cases.
2 Variable-oriented approach is used to test theories by checking out their implications on an appropriate set of units of analysis.
3 Level of measurement is based on interval and ratio because nearly all aggregated variables meet the criteria of ratio measurement such as crime rates, fertility rates, illiteracy, per capita income, poverty rates, unemployment rates, etc.
4 Discovering and excluding outliers because outliers distort correlation and cause non-existent relationships existent. Nevada is a typical example as an extreme when correlating marriage rates and alcohol (p. 176).
5 Since aggregate data are based on a universe or a total population such as all 50 states in US, significance therefore is irrelevant because we are using censuses but not samples and we are using parameters but not statistics.
6 Statistical limits of small n. n stand for the number of cases. Aggregate data sets often offer smaller number of n. As a rule, it is suggested not to include more than one independent variable per eight or ten cases (8-10 cases). With 50 states in USA, for example, one is limited to use 5 to 8 independent variables (p. 178).
Studying ChangeStudying social change involves aggregate units and nearly always areal units. They involve comparisons either by case-oriented or variable-oriented approaches.
Historical DataAlthough not always ready to use, there is a wealth of historical data existent.
1. Available data based on governmental or agent documents related to registration, crimes, murders, immigrants, casualties, accidents, catastrophic mortality, etc.
2. Creating data for research purposes. Historical data may not be ready for use for modern techniques. They may need recoding and quantifying procedures to meet research purposes, but they may be very useful for analyzing social changes.
Time Series AnalysisTime series analysis examines the relationship between two or more variables based on the same universe but measured at a number of points in time. Time series analysis is
69
based on repeated measures of the same variables over time. Points in time are the units of analysis in time series analysis.
1. Nonlagged Time Series – when both dependent and independent variables are measured at the same time for any given case, it is called nonlagged time series. For example, to comparing how much time spent on TV and reading newspapers.
2. Lagged Time Series – when there is a systematic time lag between dependent and independent variables or among variables, that is lagged time series. For example, to test the hypothesis that when the interest rates rise, the housing sale falls. Since housing sales may not fall immediately after interest rates rise, so researchers may calculate the correlation between interest rates at time 1 with housing sales at time 2.
Ethical Concerns
People may suffer harm when aggregate units are smaller.For example:1) Publishing family income when in a small town there is only one Hispanic family.2) When studying rates of drunkenness, cocaine use, sexual activity, cheating in
exams, etc. names of any colleges may not be identified.3) US Bureau of the Census refuses to publish any small units in order to avoid
harms.
Dr. Ji Handout 9Soc 332
CHAPTER 9 FIELD RESEARCH______________________________________________________________________________
Basic Procedures of Field Research
Field Research1 Field research allows us the opportunities to see significant social phenomena as they are
but not as they appear.
Field research involves going out to the real field or natural settings to observe people as they engage in the activities of interest. Research is conducted in the field - in the natural settings in which people and activities of interest are normally found and studied.
2 Field research is to study processes and events and to observe phenomena of interest in the actual settings in which the things naturally occur.
Field research is often guided by research hypotheses and exploratory in nature.Anthropologists pioneered field research methods.
70
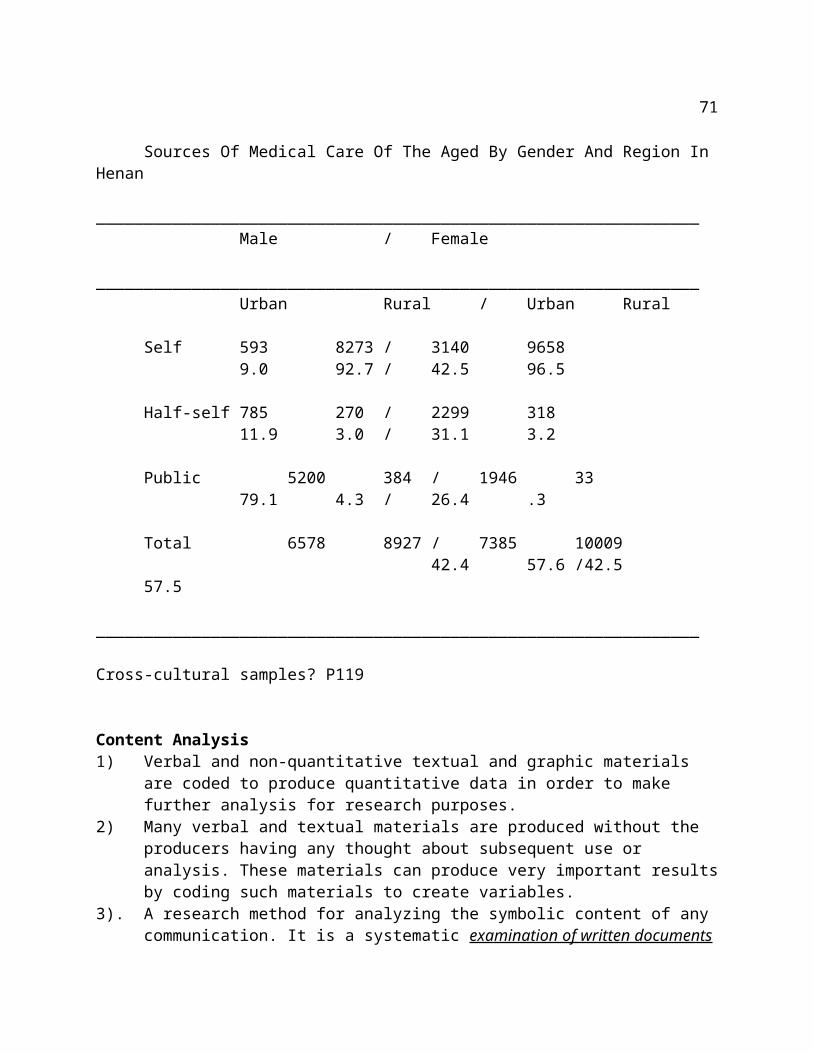
3 The field is a place but not a method.
Field research produces suggestive hypothesis after the observations are completed.
4 In comparison with surveys and censuses, which are appropriate for obtaining proportional facts, field research gathers data on processes involving interpersonal interactions.
Advantages:1). Can often provide a detailed description of individuals and the social relationships
in which individuals are involved.2). Offers access to actors of complex situations and events.3). Sampling procedures are better than experiments but still leave questions about
generalizability.4). In observational research, there is often a long period of social interaction
between the subject and the researcher. The researcher can make observations of non-verbal behavior, which may (or may not) be consistent with the subjects’ self-reports.
Disadvantages: 1). Absence of formal controls makes this research least acceptable for testing causal
hypotheses.2). Vulnerability to experimenter and testing effects depends on the investigation and
on how well they are accepted by the group they are studying.3). Very difficult to replicate.4). Typically conducted on small, purposely selected samples, thus, generalizability
of findings to large populations is limited.5). Data from observational research usually consists of text-based notes that are not
in standardized formats. Such information is difficult to sort through, organize and systematically analyze.
ReliabilityThe greater reliability of field research is based on the ability to directly observe behavior rather than trying to infer how people will act on the basis of their verbal reports. However, in some cases, reliability is based on what researchers heard or was told.
Deception1) Field research is usually conducted by one researcher2) No one else besides the researcher to evaluate what the researcher saw or heard3) The researcher might engage deception4) The deception may be either intentional or unintentional.
71
5) Field research is more reliable if involving multiple observers.
Field Surveys and Censuses1) Field surveys refer to observation in the field on some specific group of people for
some specific purposes.2) A census refers to surveys on everyone in a given community of people. If research
purpose is for proportional facts for a manageable community, a census is needed.
Example of a census by Napoleon Chagnon (p.192)
A study of a “violent society” which involves 12 villages, where 70% of villagers over age of 40 had at least one close relative being killed by another member of tribe and nearly 1/2 of the males over age of 25 took part in a murder.
Eileen Barker’s field study of Moonies/people with mental problems in Britain by field observation- watching, listening, taking notes, and recording - for many years
Validity1) Validity refers to measuring what you think you are measuring. It involves using
right indicators to measure the right concepts.2) Field research tends to be exploratory and descriptive. It is not directed by
theories and does not involve links between concepts and indicators.3) Questions of validity are obvious for survey research but far less obvious for field
research because it is difficult for field researchers to classify their observations. 4) Reliability rather than validity is the primary concern for field research.
Selecting Topics and SitesAll field research begins by defining a topic of interest and identifying a set of units of analysis- what do you want to know and where to find out?
Relevance1) Field research is exploratory and not guided by theories. Therefore there is
immense latitude in selecting topics and places to study.2) Freedom of field research tends to select topics/sites frivolous/playful so that the
research objective may be distorted.3) Field research begins with a clearly defined reason and an objective. Field
researchers know exactly what they want to watch, listen, take notes, record, photograph, and learn.
4) The topics and sites selected must be guided by and relevant to their research purposes.
5) People who have no specific questions in field research must discover a reason relevant during the research.
Accessibility
72
The matter of first importance for field research is the accessibility. Can you get into the site to observe? To observe a new pope selection? A dating teenagers? A quarreling couple?
Risk1) Field research involves serious risk.2) Privacy – dating partnership, cohabitating partnership, 3) Illegal crimes – drugs, thefts, robberies, etc. 4) Terrorism membership5) Safety – housing, residences, properties, estates, etc.6) In group members or outsiders?
Entering the FieldTo enter the field, one needs to solve two problems: to be the overt or the covert observer roles. In either case, one need to get permission from the authorized agent otherwise may face severe ethical problems.
Negotiating Access1) Explain the importance of the field research.2) Establish benefit or positive image of the observed.3) Establish trust.4) Three principles: a) maximize your access- all pertinent sites; b) do not grant
rights of censorship/editing – let the observed read the draft of your report which may result in important corrections but maintain the final judgment by your own; c) secure independent funding – so that not to be controlled or interrupted by others.
Neutralizing Observer EffectsThe disturbance caused by the presence of the known observers can be neutralized with three useful tactics.1) Stay long enough so that people becomes accustomed to having you around. “As a
dull but harmless presence, to which one does not have to pay much attention.”2) Keep a rather low profile in the beginning as you learn to fit in and as others get used
to you.3) Do not begin to be too inquisitive/curious or too intrusive/invasive until you are
familiar with the environment and you are seen as a trustworthy person.
Observation1) Observation requires an immense amount of patience and concentration.2) It can be intense boredom, hard, and difficult.3) One cannot observe everything but make choices among them.4) There are two observations: Unstructured and Structured
Unstructured
73
Unstructured observations are informal, often impromptu/unprepared, and usually are recorded in a narrative fashion. Field notes take everything and sort them afterwards for specific purposes.
StructuredStructured observations are more focused, intentional, and often are recorded on forms prepared for research purposes. Special forms designed to guide what is to be observed and how is to be recorded.
Covert observationPeople who are observed are unaware that they are the objects of research.1) Researchers must be normal participants.2) Researchers are limited in how inquisitive/curiosity they can be.3) Researchers do not disturb the natural patterns of behavior.4) Able to minimize observer effects.
Overt observationPeople who are observed know they are the objects of research.
Interviewing In The FieldField research literally is in the real world based on actual observation. It is to study something by looking at it; to stand close to it; to scrutinize it; to go anywhere one finds it and watch it. Empirical observation is the basis of social science.
Observation is not the primary sources of data for field research, however. Much of the vital data by field researchers is not gathered by researchers who watch but rather by one who listens and who asks questions. Interviewing, therefore, is the primary tool of field research.
Field researchers need rely on two kinds of people: Informants and respondents.
Respondents and Informants People who respond to the interviewer or the questionnaires are respondents. Respondents answer questions about themselves.
Informants are persons who are assumed well informed on the mater of interest to field researchers and who can provide information about the group as a whole or about a particular members or subgroups.
A) Informants are very valuable research resource who knows customs and rituals of the group and can save lots of time for the researcher.
B) Informants can be misleading because informants may be marginal to the group, have biases, harbor resentments, and provide misinformation.
C) It is wise to have a number of informants and check everything across informants.
74
Systematic or Impromptu InterviewingMost of field research is based on impromptu interviewing – that is, unplanned and spontaneous, because the interaction is occurring in the “natural settings.” This is the most appropriate style of interaction at the beginning of the research. It puts people at ease and lets people become used to having observers around. It maximizes the opportunities for unanticipated discoveries.
If to shape some specific conclusions and to establish proportional facts, researchers will go for systematic interviewing (involving a numbers of questions, for example).
Field Notes1) Record what you see and hear.2) Interpret what you see and hear.3) Write down or dictate field notes regularly.4) Do it as soon as possible.5) Organize and analyze the field notes
These notes constitute the data based on which conclusions may be drawn. These notes can be computerized and the qualitative data can be quantified for analysis. Field research has two limitations.1) It is only suitable for small groups.3) Field research cannot offer proof that the correlation between attachments to the
group and conversation was not a spurious relationship.
Organizing Field NotesOrganizing the field notes for professional use.1) Type the filed notes or get notes typed2) Dictate notes typed by others.3) Construct elaborate indexes to field notes.4) Make multiple copies and filed under a number of topics.
Analyzing Field NotesSorting field notes for analyzing them.1) Sorting field notes into categories.2) Searching for common patterns across incidents or discover the need for
additional categories.3) Counting the frequency of various kinds of events.4) Furthering subdivide categories.5) Creating cross-tabulations to seek correlations or even to seek causal
relationships.6) Many cross-tabulations correlations make it possible to seek potential causal
relationships.
75
Studying ChangeField research is not a rapid style for studies of change. It involves lengthy period of weeks, months, even years of observation. The typical time is two years in the field; some spent 6 years as Eileen Barker’s study of Moonies in the book, for example.
Ethical ConcernsSerious ethical problems are involved in field observation.1) The right of primacy. Not to violate privacy but interested in privacy by
researchers. To solve this “dilemma” is to resort to fictitious names such as “ Yankee City, Middletown, Westville, The corner boys, the Blue Gangs, etc.
2) The issue of deception. How far can a researcher go in concealing one’s true identity or motives?
3) The issue of take-part-in-activities/involvement. Often unwillingly, researchers contribute to and take part in the activities they observe. The “involvement” seems innocent but can be risky or dangerous in some cases. What about the drug sale, terrorist acts, robbery, fight between a couple, etc.?
4) Maintaining one’s objectivity and intellectual independence. But unfortunately, some field observers become committed participants in the group; several jointed the cults/religious group they were studying; some stayed with the tribes they were observing.
Dr. Ji Handout 10Soc 332
CHAPTER 10 EXPERIMENTAL RESEARCH______________________________________________________________________________
A basic understanding of the logic of experimental research Experimental designs and characteristics
Experimental Research1) Research conducted by manipulating variables and randomly assigning subjects2) Controls time order and eliminates potential sources of spuriousness3) A typical research method to establish causal relationships
Experimental SettingsThere are three kinds of experiments: Laboratory experiments, Field experiments, and Survey experiments.
Laboratory Experiments1) Laboratory experiment provides maximum control over all relevant
variables.
76
2) Lab can prevent interruptions.3) Lab experiment is good for natural sciences.4) Lab is hard for human beings: people cannot be brought into labs; people cannot
be kept long; labs are ill suited for human beings; lab cannot control over people.
Field Experiments1) Field experiment usually consists of two groups: experimental and control groups2) Experimental groups – persons who are randomly assigned to be exposed to the
experimental stimulus (independent variables)3) Control group – persons who are randomly assigned to be NOT exposed to the
experimental stimulus4) The purpose of the control group is to provide a baseline in order to compare the
effects of the experimental stimulus of the experimental group
Experiments in Surveys1) Experiments are incorporated into surveys.2) The purpose of experiment in surveys is to assess survey techniques.
ReliabilityReliability concerns consistent measurement. Replication is the primary method for assessing reliability in experiment. Failure to obtain similar findings is taken as proof that the original findings were unreliable. Two sources of bias produce faulty results. Subject bias and experimenter bias.
Subject Bias/Demand Characteristics1) Subject bias is introduced by letting the experimental subjects know that they are
being treated while the control subjects know they are NOT being treated. That knowledge alone will bring subjects bias.
2) As a result, the subjects will try to meet the expectations of the social scientists. The subjects tend to be cooperative and to respond to demand characteristics.
3) To prevent subject bias, the solution is to make sure that the subjects are unaware of what the experiments expect and to minimize the demand characteristics.
Experimenter BiasExperimenter bias is introduced when the experimenters unwillingly alter their behavior in ways that can influence the outcomes such as more friendlier to subjects, more carefully give instructions, etc.
ValidityIf things are done right/in a valid way in the experiments, then the results must be valid.
77
Assessing the Manipulation To assess the manipulation is to make sure that the independent variable really varies – that the manipulation is effective, so that the dependent variable could be affected. If the independent variable does not vary, the manipulation will not be effective.
X Y Y’ (Y Y’)Film Prejudice Prejudice
(X = Independent variable of film. Everyone Y is exposed to X. No manipulation of X. The independent variable does not vary. No comparison is to be made. How do you know the Y changed?)
Realism1) A major criticism of experiments is that they are artificial and the independent
variables are not sufficiently real, especially in a laboratory setting.2) The dilemma is, the more realistic the experiment attempts to be, the less convincing
the validity is claimed to be.
Assessing Experimental and Quasi-Experimental Designs
Four models of experimental designs are illustrated. They are demonstrated by establishing the relationships between “Showing Movies” (Independent variable) and the effect on “Racial Prejudices” (dependent variable).
The Independent Variable is MoviesThe Dependent Variable is Racial Prejudice
All school children are given permission to watch Movies once a week after school to reduce racial prejudice. By the end of the school term of 6 months, all students are given questionnaires and prejudice scores are measured.
Design 1
Independent DependentVariables Variable
Subjects Movies Prejudice are shown is measured
Features:1) The subjects are students.
78
2) Every student saw the movie.3) Do students who did not see the movie score higher or lower compared with
whose students who saw it? No comparison. No answer!4) The independent variable does not vary !5) The average prejudice score is 25 (on a scale of 0 – 1000). We learn nothing from
this design.
Design 2
Pretest of Independent Posttest
Prejudice Variables Prejudice
Prejudice Movies Prejudice Is measured are shown is measured
Features:1) Prejudice is measured before and after seeing the film.2) Comparisons can be made by checking scores before and after the film is shown.3) The pretest score is 50 compared with posttest score of 25.4) Design 2 is better than design 1. But, 5) Can we say that “Showing the film does cause prejudice to decrease?” No.
Because of following reasons:(1) History – any event occurring simultaneously with the independent variable
that might account for the observed changes. For example, what about students reading stories, seeing other films, or other events occurring that influenced students’ prejudice?
(2) Maturation – the effects of subjects getting older as time passes by (maturing for six months in this example). When getting older, people may see things differently as they saw it before.
(3) Testing Effects – simply by being measured or pre-tested, the subjects may change their attitudes or behavior.
(4) Instrument Effects – differences produced by variations in the accuracy of the multiple measurements. Pre-test questionnaires different from the post-test ones may cause scores to decline or to increase!
(5) Regression to the Mean – the tendency of extreme scores to move/regress over time toward the group average. This is a well-known statistical principle that when cases are selected on the basis of scoring far from the mean, they will score closer to the mean on a subsequent measurement over time. So it is hard to know the changes due to time effect or due to the independent variable.
Design 3
79
Pretest of Independent PosttestPrejudice Variables Prejudice
Experimental Prejudice Movies Prejudice Group Is measured are shown is measured
Control Prejudice No Movies Prejudice Group Is measured are shown is measured
Features:1) Introducing a control group compared with design 2.2) By comparing the two groups, the differences caused by History, Maturation,
Testing effects, Instrument effects, and Regression to the mean can be ruled out.3) Selection biases , however, may occur when people are assigned to the
experimental or control groups in Non-random ways. That means, when people know they are being tested or not tested, they are likely to act more responsive to authority.
Design 4
Pretest of Independent PosttestPrejudice Variables Prejudice
Experimental Prejudice Movies Prejudice Group Is measured are shown is measured
Randomization
Control Prejudice No Movies Prejudice Group Is measured are shown is measured
Features:1) Introducing random assigning subjects to both experimental and control groups.
2) By giving random assignment, the experimental and control groups will look alike in every ways except their exposure to the independent variable.
80
3) When randomization is the basis for selection, the study is a true experiment. Design 4 is a True Experiment.
4) Since designs 1, 2, and 3 are not based on randomization, their designs are called Quasi-Experiments.
Quasi-ExperimentsStudies posed as experiments but failed to meet the essential experimental standards of internal validity. A not randomly assigned subject is an example. [Quasi mean “having superficial resemblance to.”]
Internal ValidityConsists of eliminating all of the sources of bias – history, maturation, testing effects, etc. To ensure internal validity, there must be two groups to compare and the subjects must be randomly assigned (as illustrated by Design 4).
Subject “Mortality”Refers to the loss of subjects over the duration of an experiment (due to moving,
drop out, death, etc.)
External ValidityExternal validity of an experiment is the extent to which its findings can be generalized.
There are two basic types of generalization: Statistical generalization and Theoretical
generalization.
Statistical generalization involves successfully inferring that observations based on a sample apply to the unobserved member of that same population.
Theoretical generalization involves increasing the scope of tests of a theory by applying the theory to a variety of settings.
External Validity of Laboratory ExperimentsLaboratory experiments are rarely based on a sample of any known population of interest.
Subjects are volunteers. There is nothing of the same kind from one group of subjects to
another. Therefore, laboratory experiments rarely have external validity for statistical
generalization.
81
However, laboratory experiments are well designed to support theoretical generalizations. Virtually all laboratory experiments are designed to test a theory/theories and their results are generalized to the theory. That is, laboratory experiments have external validity for theoretical generalization.
Laboratory experiments do not generalize through the wall of the laboratory, but through its ceiling – to higher levels of abstraction. They generalize to the abstract theories from which their hypotheses are derived.
Studying Change1) Experiments are powerful method for studying the causes of changes.2) But experiments are limited to time span. Experiments usually go for an hour or
two, seldom span goes over two or three years.3) Therefore, social scientists seldom use experiment research to study changes
unless in some special cases.
Ethical Concerns1) Experiments on human beings, either in experimental group or control group, are
likely bringing about negative result. The Salk polio vaccine experiments resulted in 4 deaths in control group – who received no vaccine injection!
2) The dilemma is that, however, without control group, it is impossible to know that vaccine really causing reducing polio for kids.
3) The principle in social scientific experiment is to risk no lives but there is no simple resolution to such concerns.
4) Human experiments sometimes need deception. However, when subjects were deceived, they must be fully debriefed at the end of the experiment.
5) The rule is to lower the harm to human beings at the lowest level.
Dr. Ji Handout 11Soc 332
CHAPTER 11 CONTENT ANALYSIS AND OTHER UNOBTRUSIVE TECHNIQUES
____________________________________________________________________________________
Content Analysis Evaluation Reliability and Validity
Content Analysis
82
1) Systematic transformation of qualitative materials such as verbal, visual, or textual materials into quantitative data to which standard statistical analysis technique can be applied.
2) Content analysis creates a set of codes based on concepts and rules for applying these codes. Content Analysis is a kind of unobtrusive measurement.
Unobtrusive measurementIt is a measurement based on which the objects being studied don’t know that they are being studied. This measurement has no effects on the subjects being studied.
Cultural artifacts1) An artifact is any object made by human work. A cultural artifact is any such object that
informs us of about the physical and /or mental life of some set of human being. The word of object here means very broadly to include written, filmed, and recorded material.
2) Human beings leave traces of their behavior and an immense wake of cultural artifacts such as the suits of armors, sculptures, buildings, tools, and other immense body of scholarship.
3) Studies based on cultural artifacts involve simple elaboration such as counting, comparing, coding schemes, and converting into rates (known as content analysis).
Occult activitiesPeople may be interested in occult activities such as religious, mystical, magical beliefs, or practices such as psychic readings, astrology, fortune-telling, meditation, or even businesses, locations, etc. There are many ways to explore these occult activities.
1) Yellow bookslisting of business firmslisting of personal phoneslisting of names, addresses of companies, or persons.
2) Internet homepagesproviding detailed personal information as well as information for firms and companies.
ReliabilityContent analysis is an entirely unobtrusive measure. Speeches, letters, movies, lyrics, magazines, and portraits, belong to certain categories and are all created for specific audiences. These materials are of primary interest to content analysis.
Manifest and Latent Content
1) Manifest content refers to the explicit, clear, and perhaps superficial meaning of verbal, visual, or textual materials. Latent content refers to implicit meanings. “I love that kind of car,” for example, is an expression of manifest content that may mean the person really
83
likes that car. However, the facial expression or the tone of voice of that speaker may suggest that the person really dislikes that car.
2) Content analysis involves imposing categories on materials.
3) Coders must make subjective judgments to distinguish latent from the manifest content.
4) Two primary sources for unreliability in content analysis: unreliable codes and unreliable coders.
Reliable CodesCodes are not too subjective
not too vaguenot biased.
Categories do not overlapare exhaustiveprovide sufficient scope for variation
Reliable CodingReliable coding depends on coders. If coders code scores as 2 on a variable to be coded as 1, then the result won’t be reliable.
Solution:use several coders/multiple coderseach codes the same materialscompare their codingdisagreement is carefully checkedcontent analysis will not be accepted unless multiple coders are usedensure intercoder reliability
ValidityDeposit Bias
Circumstances in which only some portion of the pertinent materials was originally included in the set of materials to be coded. As a result, that portion was not a random sample of the population, hence comes the deposit bias, leading to problematic validity.
What kind of people, after all, tended to burst forth in love letters, write novels, or compose songs? Only less than 5% of the population. Do you intended to study them?
84
Survival BiasCircumstances in which only some portion of the pertinent phenomena was retained in the set of materials to be coded.
Invalid GeneralizationsThe major source of invalidity in use of content analysis is to generalize findings based on verbal, visual, or textual materials to human populations.
Content analysis focuses on objects but researchers really want to know is the people’s behavior. Therefore, drawing conclusion about the population from a sample is the real focus of a researcher for content analysis.
Example - Leo Lowenthal studied cultural values shifts by coding biographies that appeared in popular magazines between 1901 and 1941.
Hypothesis: There is a major shift from “idols of production” (founders of larger corporations) to the “idols of consumption” (movies and sports stars) from 1901 to 1941.
Findings: Idols of production dominated magazine biographies prior to WWI but the pattern had shifted to biographies of idols of consumption after 1920s.
Results: Supported. Good example of generalizations.
Selecting Units and CasesDifferent units of analysis are always problematic to generalize results based on one kind of units of analysis to another variety - from aggregates to individuals, for example. Be sure that always draw conclusion about the people from any objects or materials under study.
Appropriate UnitsBe clear about units of analysis under study.
Hypothesis usually tells the units of analysis.“Are movies more violent today?” -The units of analysis are movies.
“TVs have become important means of socialization of kids.”- The units of analysis is TVs.
85
“MacroCase is one of the mostly used soft-wear techniques”- The units of analysis are MacroCase.
“The American business communication is less formal” - The units of analysis business letters.
Sample versus CensusWhether to sample or use census depends on how many cases you want.
It is usually necessary to select a sample of cases. In whatever cases, one needs to define the population or universe of cases to be sampled, and then to use random procedures to select cases.
ExampleIf one is to sample ads for a particular newspaper with interest in “the shifts or changes,” one needs to code all ads of a particular kind for a period of years, say, from 1960 to 2000, so that to draw conclusion from the sample
Constructing Coding Schemes1) A content analysis coding scheme is a questionnaire that coders fill out on behalf of each
case. It must adhere to the fundamental principles of question construction (Chapter 7).
2) Prepare a draft of the coding scheme and try it out on a few cases. Find problems and fix it to fit your research objective.
3) When creating and refining a coding scheme, check the following several issues to ensure the coding scheme fit your research goal:A) what are you going to do with the data after they are coded?B) what are your hypotheses?C) what data do you need to test them-are you leaving something important?D) multiple coders will be used to ensure intercoder reliability.
Studying Change1) Content analysis often examines social change and trends by studying cultural artifacts,
magazines, newspapers, and by coding Yellow Page listings from past years.2) Studies of change are usually based on verbal, visual, or textual materials.3) Try to avoid deposit or survival biases.4) The selection of units of analysis is appropriate and the coding categories clear.
Examples of president’s campaigns:
86
1) The average quote of a candidate’s words was 14 lines 1960
6 lines 1992
2) Most campaign statements represent their polices 1962
80% of campaign statements were basis of strategy1992interpreted on the
3) Leading publications have shifted from reporting what the candidates say to 1962featuring partisan interpretation of what is really going on 1992
Ethical Concerns1) In general, unobtrusive methods are of no harm, but may pose problems if not careful.2) Company documents or private letters must be given permission before one can use them
or code them.3) The confidentiality of the people involved must be preserved. Individual information
cannot be identified or revealed. The same principle should apply to individual records, arrest records, credit histories, academic transcripts, personal files, etc. Otherwise, one may commit ethical or even legal violations.
87