Embed Size (px)
Citation preview
READING GRAPHS AND INTERPRETING SLOPE: A MATH/SCIENCE TARGETED CONNECTION
Dr. Cheryl Malm, Northwest Missouri State University
Dr. Patricia Lucido, SySTEMic Innovations
RESEARCH FOCUS:
To examine mathematics and science
concepts to identify supporting ideas,
processes, and skills that allow the design of
parallel curricula or “targeted connections”.
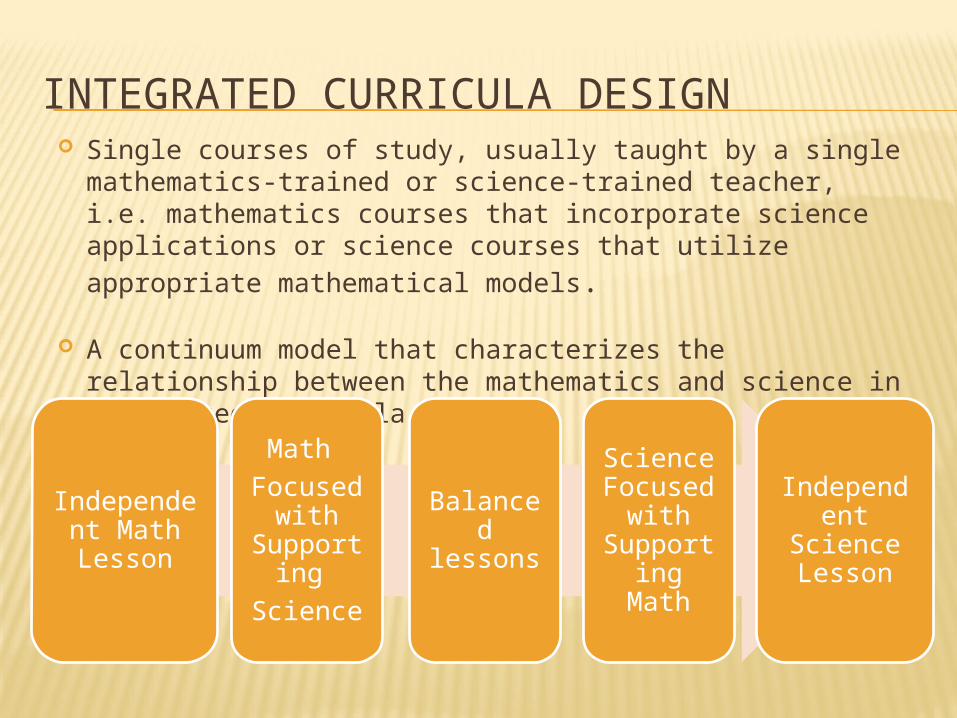
INTEGRATED CURRICULA DESIGN Single courses of study, usually taught by a single
mathematics-trained or science-trained teacher, i.e. mathematics courses that incorporate science applications or science courses that utilize appropriate mathematical models.
A continuum model that characterizes the relationship between the mathematics and science in integrated curricula.
Independent Math Lesson
Math Focused
with Supporting
Science
Balanced lessons
Science Focused
with Supporting
Math
Independent Science Lesson
CORRELATED LESSONS Correlated lessons extend the definition of integration,
striving to achieve “balanced” integration in which the mathematics and science content is of equal importance (Berlin & White, 1994; Lonning & Defranco, 1997).
Parallel mathematics and science lessons are developed by a team of teachers, each a content specialist in their own discipline, to allow the concepts from both disciplines to be almost equally taught (Vasques-Mireles & West, 2007).
A strength is the team-teaching approach; conversations occur around the language and the parallel relationships that are being taught.
The challenges range from lack of planning time and difficulties in coordinating team taught lessons to lack of materials and difficulties identifying appropriate connections (Vasques-Mireles & West, 2007).
TARGETED CONNECTIONS Targeted connections expand the definition of correlated
lessons to encompass correlated units of study.
Rather than selecting a mathematics or science topic and then attempting to incorporate the pertinent topics from the other discipline , parallel programs would be designed in mathematics and science that would connect underlying, supporting conceptual understandings as well as appropriate skills and applications.
Content designed to be taught simultaneously in a math course and a science course would each develop the connected conceptual understanding within the context of the separate discipline.
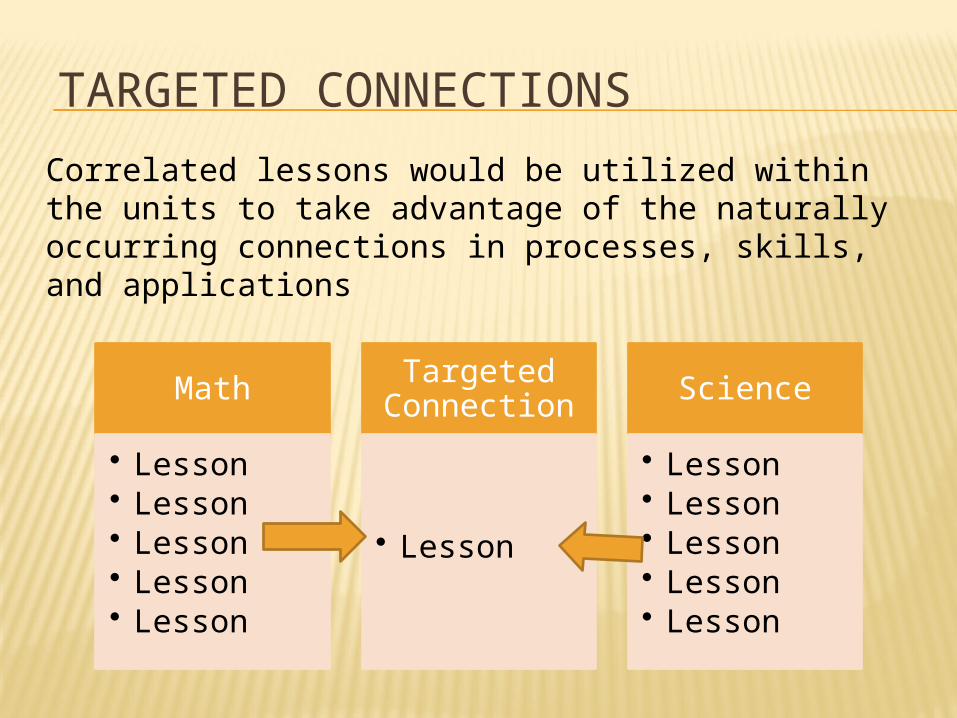
TARGETED CONNECTIONS
Math
• Lesson• Lesson• Lesson• Lesson• Lesson
Targeted Connection
• Lesson
Science
• Lesson• Lesson• Lesson• Lesson• Lesson
Correlated lessons would be utilized within the units to take advantage of the naturally occurring connections in processes, skills, and applications
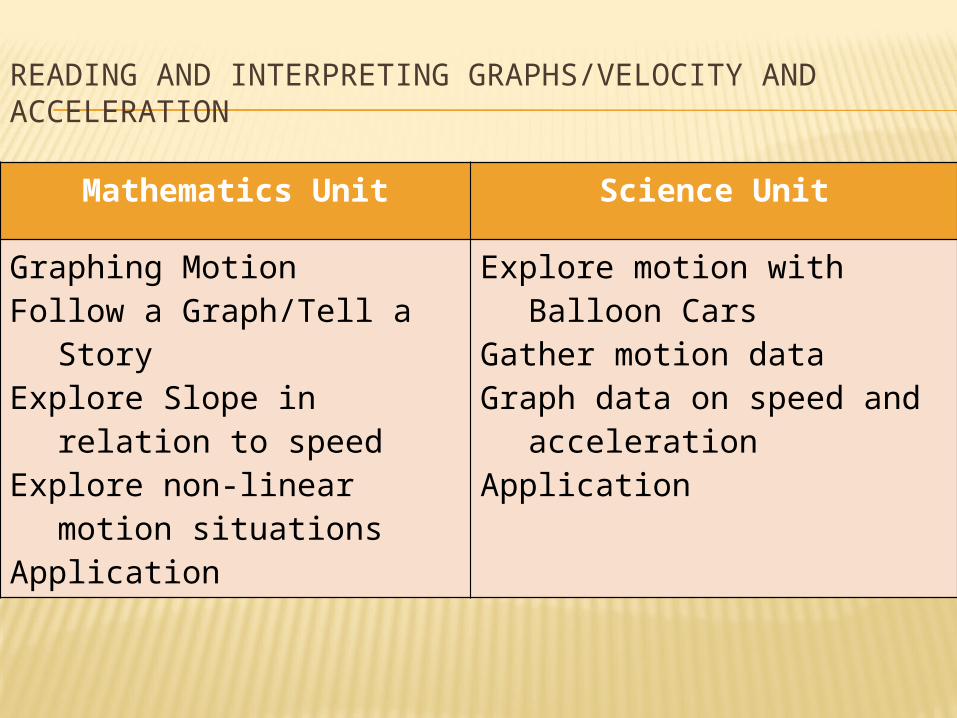
READING AND INTERPRETING GRAPHS/VELOCITY AND ACCELERATION
Mathematics Unit Science Unit
Graphing MotionFollow a Graph/Tell a StoryExplore Slope in relation to
speedExplore non-linear motion
situationsApplication
Explore motion with Balloon Cars
Gather motion dataGraph data on speed and
accelerationApplication
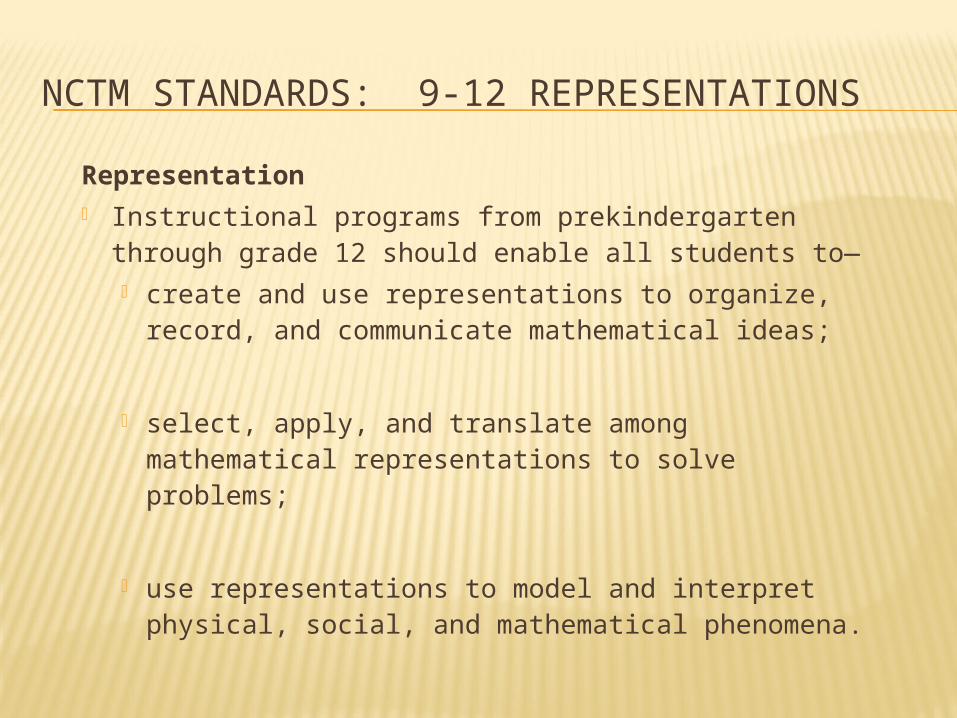
NCTM STANDARDS: 9-12 REPRESENTATIONS
Representation Instructional programs from prekindergarten
through grade 12 should enable all students to— create and use representations to organize,
record, and communicate mathematical ideas;
select, apply, and translate among mathematical representations to solve problems;
use representations to model and interpret physical, social, and mathematical phenomena.
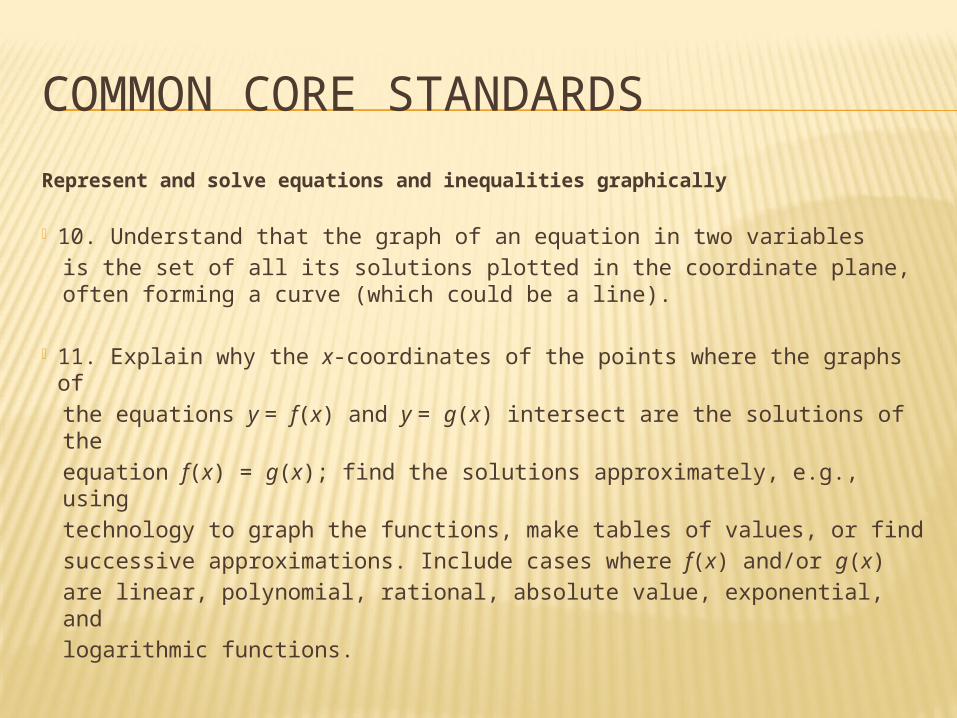
COMMON CORE STANDARDS
Represent and solve equations and inequalities graphically
10. Understand that the graph of an equation in two variables is the set of all its solutions plotted in the coordinate plane, often forming a curve (which could be a line).
11. Explain why the x-coordinates of the points where the graphs ofthe equations y = f(x) and y = g(x) intersect are the solutions of theequation f(x) = g(x); find the solutions approximately, e.g., usingtechnology to graph the functions, make tables of values, or findsuccessive approximations. Include cases where f(x) and/or g(x)are linear, polynomial, rational, absolute value, exponential, andlogarithmic functions.
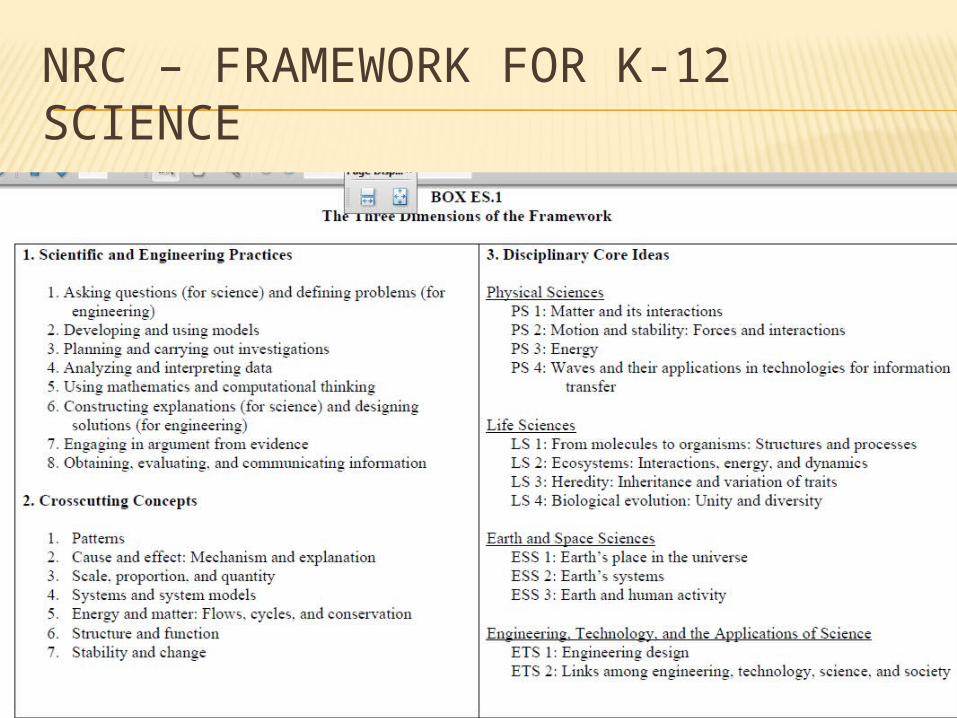
NRC – FRAMEWORK FOR K-12 SCIENCE Insert science standards here to make
the connection?????? – see next slide
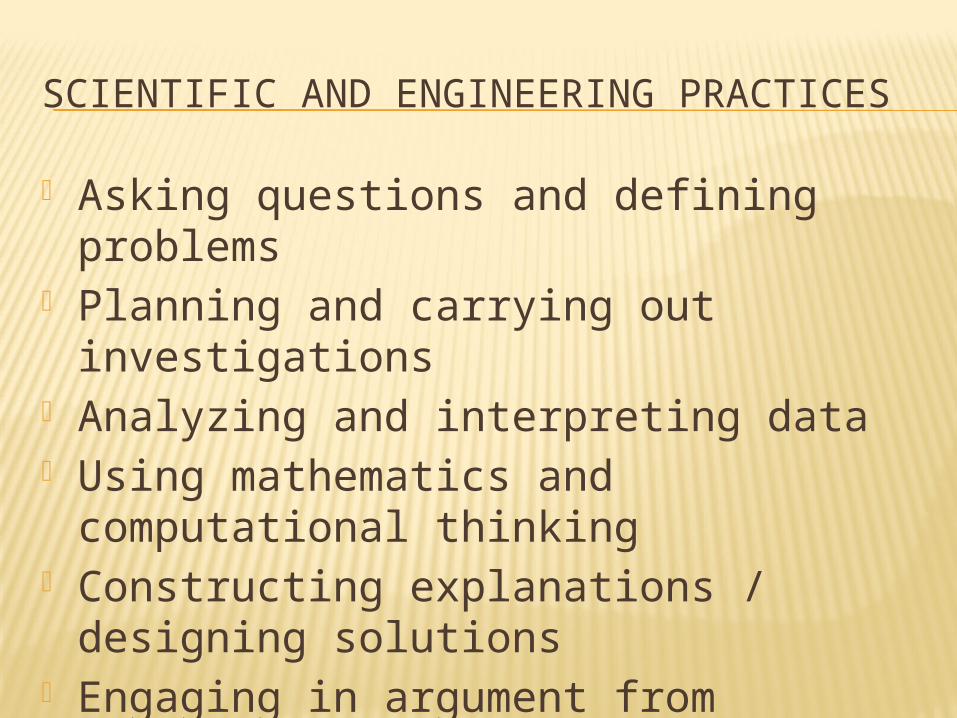
SCIENTIFIC AND ENGINEERING PRACTICES
Asking questions and defining problems Planning and carrying out
investigations Analyzing and interpreting data Using mathematics and computational
thinking Constructing explanations / designing
solutions Engaging in argument from evidence Obtaining, evaluating and
communicating information
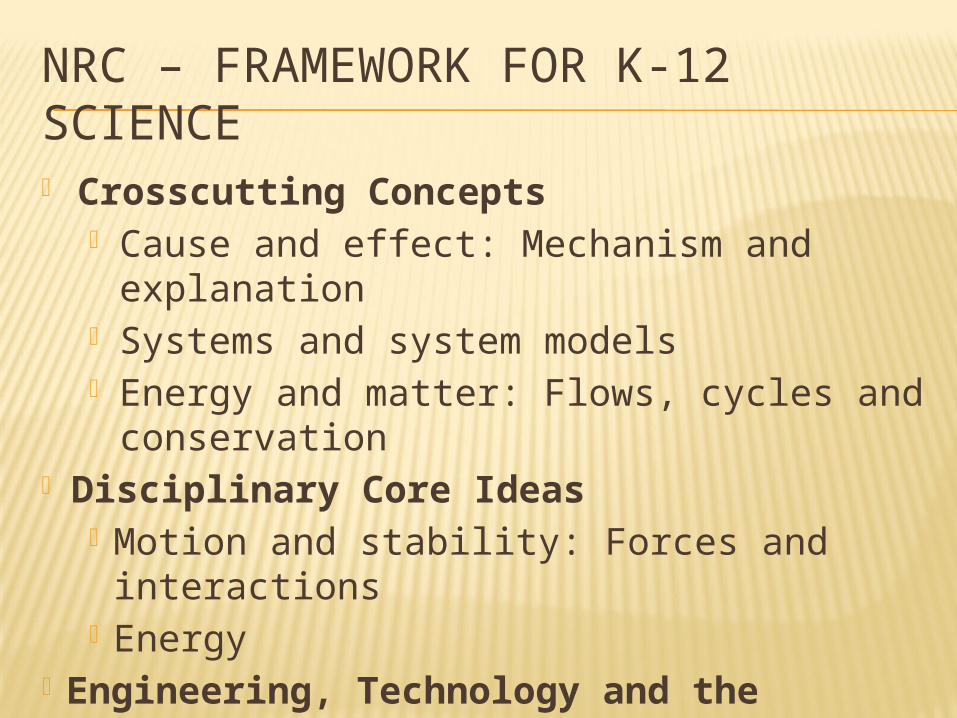
NRC – FRAMEWORK FOR K-12 SCIENCE Crosscutting Concepts
Cause and effect: Mechanism and explanation
Systems and system models Energy and matter: Flows, cycles and
conservation Disciplinary Core Ideas
Motion and stability: Forces and interactions
Energy Engineering, Technology and the Application of Science
Engineering design
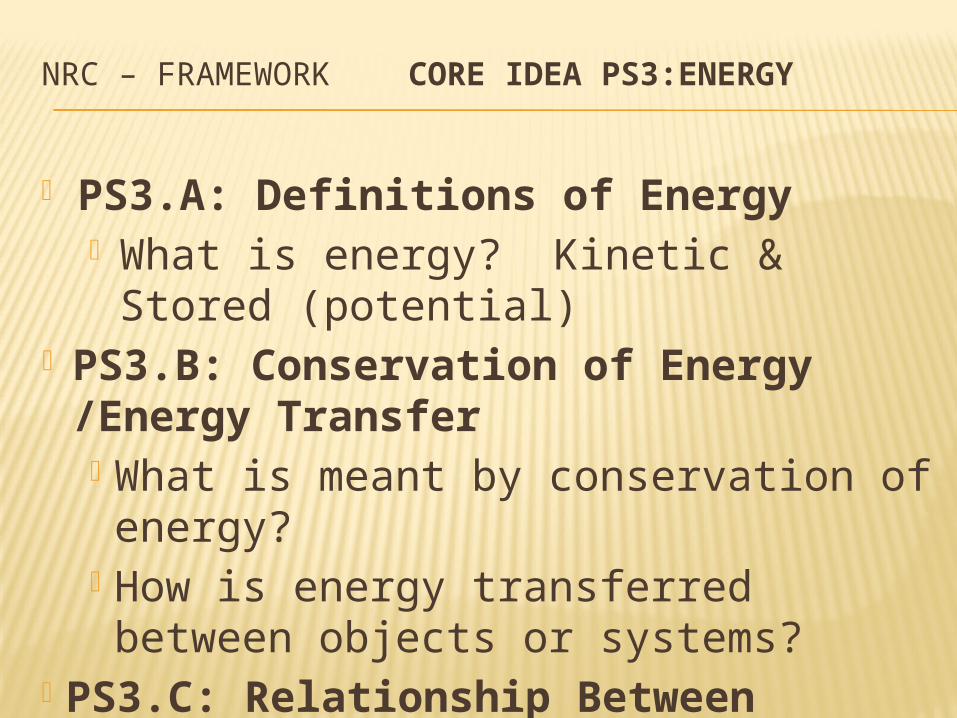
NRC – FRAMEWORK CORE IDEA PS3:ENERGY
PS3.A: Definitions of Energy What is energy? Kinetic & Stored
(potential) PS3.B: Conservation of Energy
/Energy Transfer What is meant by conservation of energy?
How is energy transferred between objects or systems?
PS3.C: Relationship Between Energy and Forces
How are forces related to energy?
NATIONAL SCIENCE EDUCATION STANDARDS:
MOTIONS AND FORCES
Objects change their motion only when a net force is applied. Laws of motion are used to calculate precisely the effects of forces on the motion of objects. The magnitude of the change in motion can be calculated using the relationship F = ma, which is independent of the nature of the force. Whenever one object exerts force on another, a force equal in magnitude and opposite in direction is exerted on the first object.
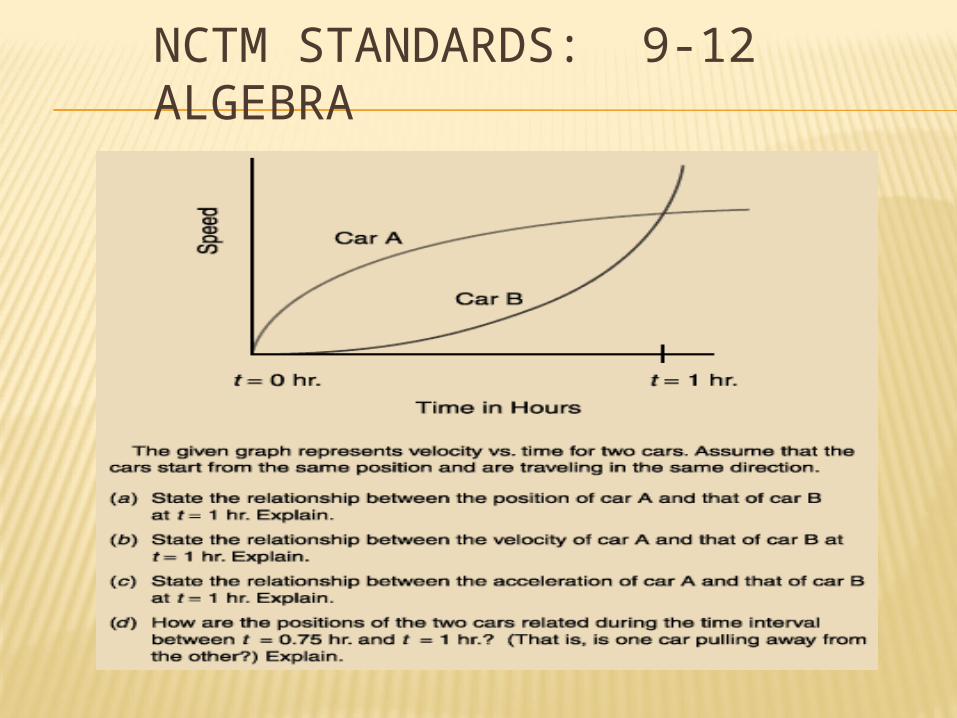
NCTM STANDARDS: 9-12 ALGEBRA
PRINCIPLES AND STANDARDS FOR SCHOOL MATHEMATICS: 9-12 REPRESENTATIONS
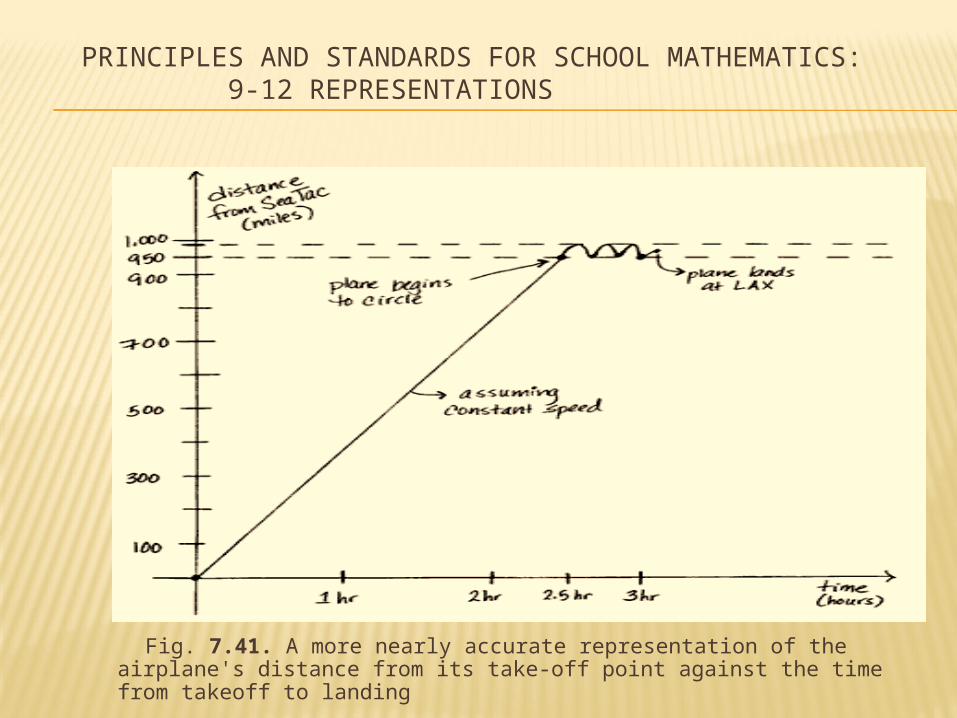
A flight from SeaTac Airport near Seattle, Washington, to LAX Airport in Los Angeles has to circle LAX several times before being allowed to land. Plot a graph of the distance of the plane from Seattle against time from the moment of takeoff until landing. adapted from Hughes-Hallett et al. Calculus, 1994, p. 6
PRINCIPLES AND STANDARDS FOR SCHOOL MATHEMATICS: 9-12 REPRESENTATIONS
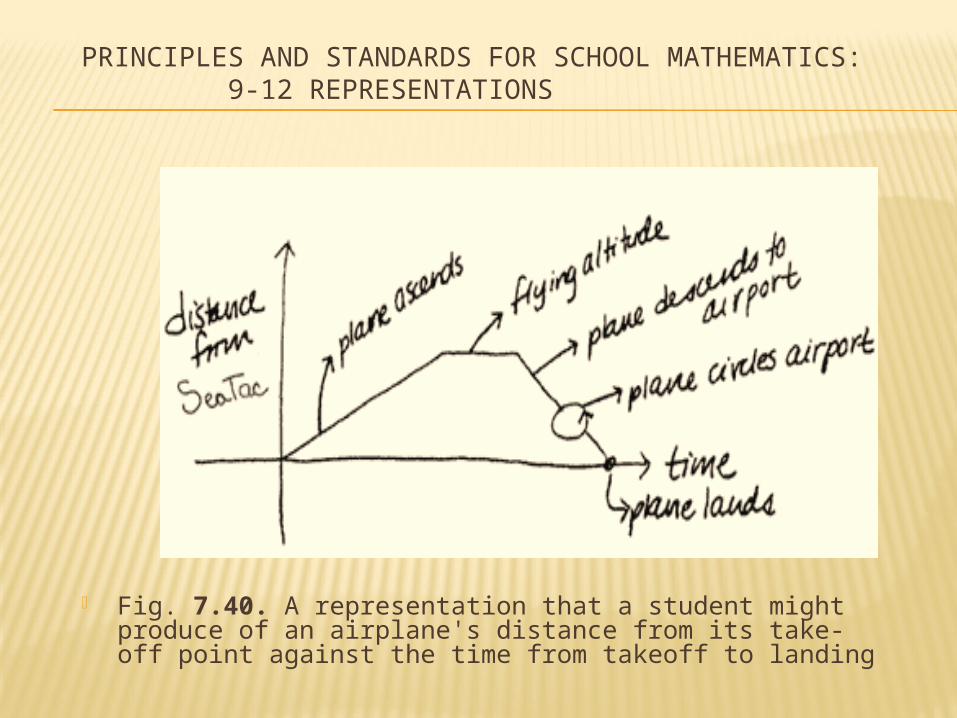
Fig. 7.40. A representation that a student might produce of an airplane's distance from its take-off point against the time from takeoff to landing
PRINCIPLES AND STANDARDS FOR SCHOOL MATHEMATICS: 9-12 REPRESENTATIONS
Fig. 7.41. A more nearly accurate representation of the airplane's distance from its take-off point against the time from takeoff to landing
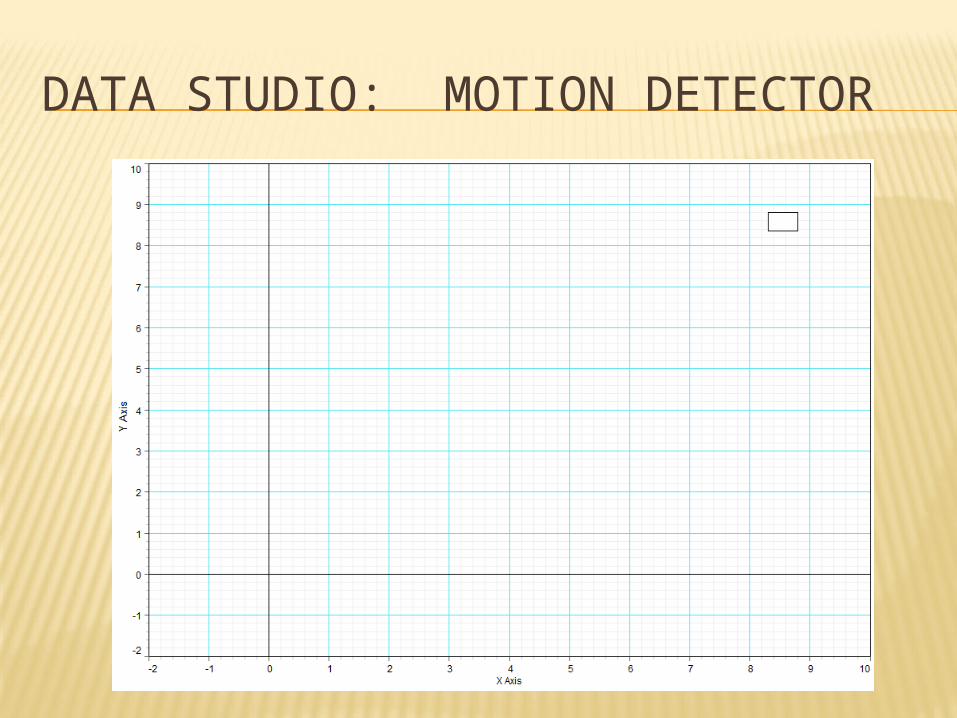
DATA STUDIO: MOTION DETECTOR
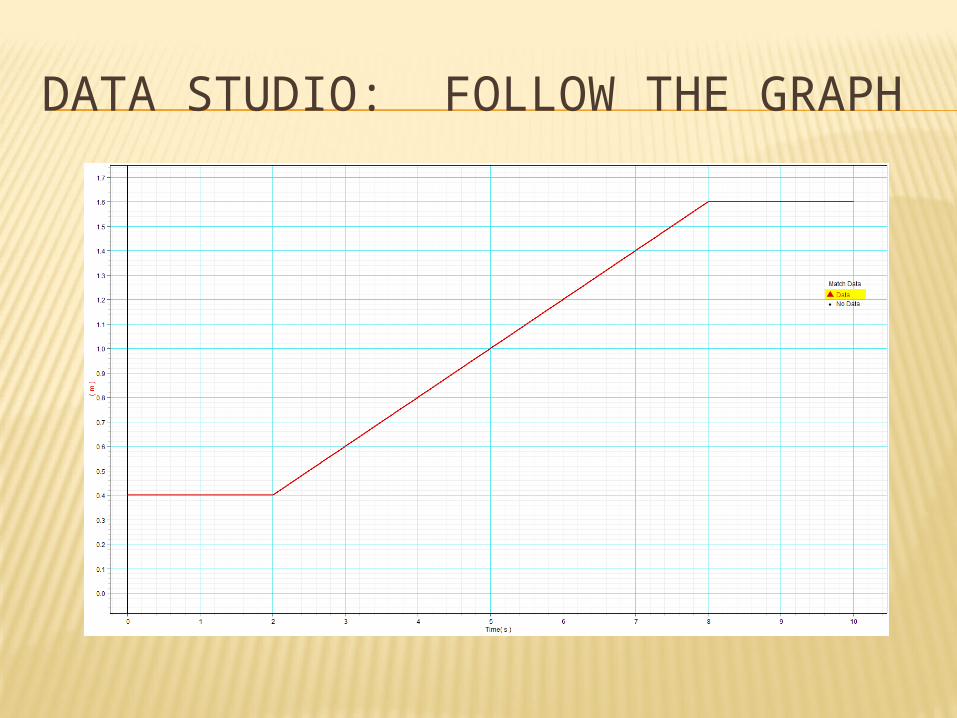
DATA STUDIO: FOLLOW THE GRAPH
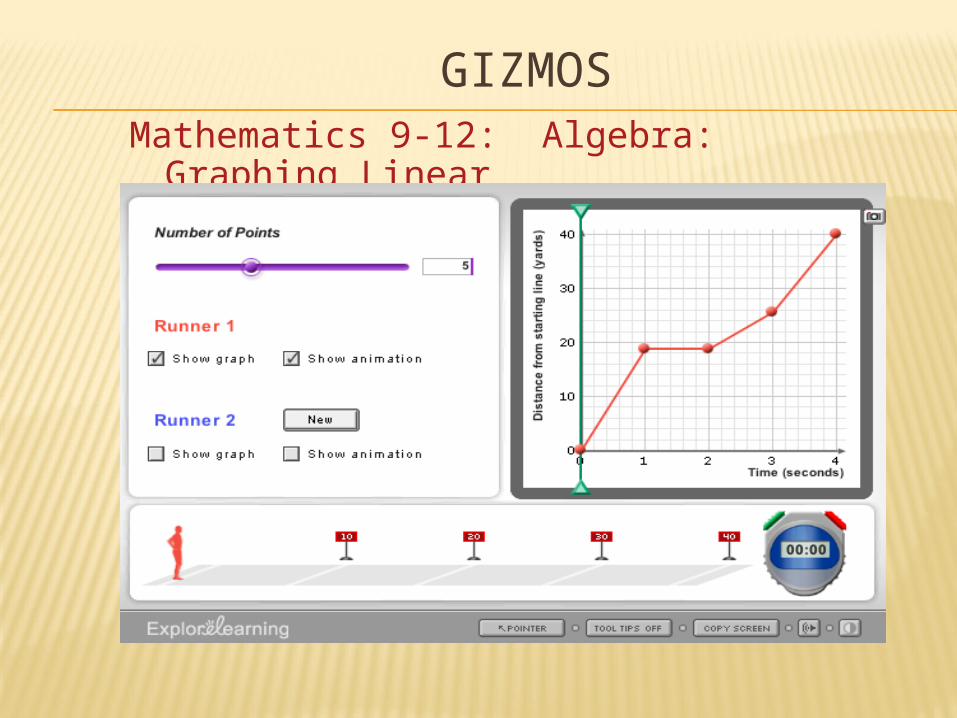
GIZMOSMathematics 9-12: Algebra: Graphing
Linear
PLANNING EXPERIMENTS
9 Steps to the Plan
Starting with 4 questions from Cothron, Giese, Rezba’s Students and Research
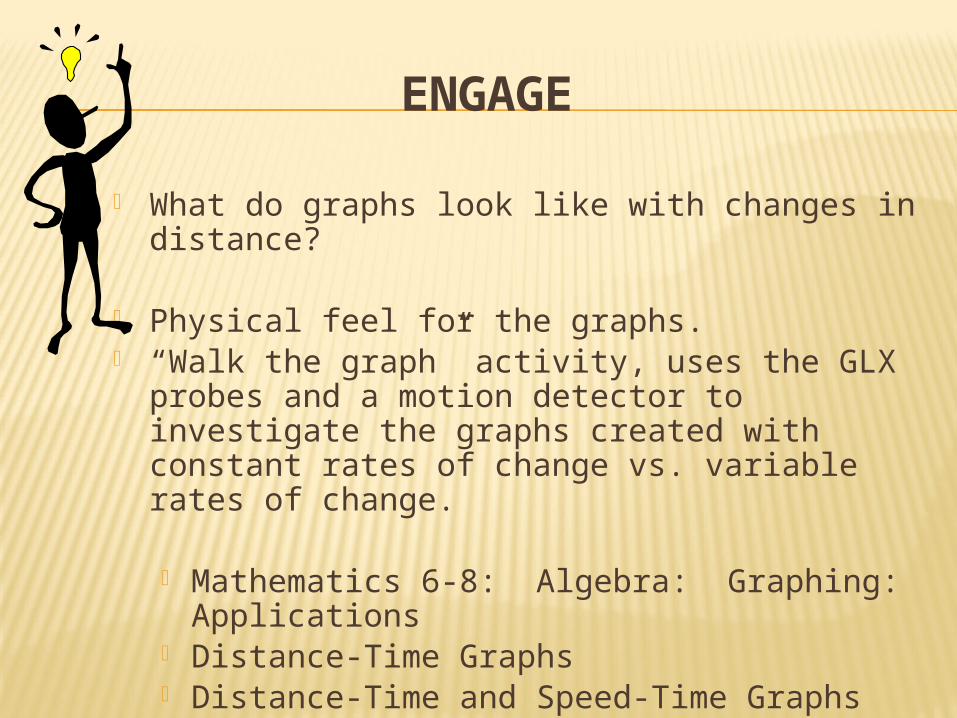
ENGAGE
What do graphs look like with changes in distance?
Physical feel for the graphs. “Walk the graph” activity, uses the GLX probes
and a motion detector to investigate the graphs created with constant rates of change vs. variable rates of change.
Mathematics 6-8: Algebra: Graphing: Applications
Distance-Time Graphs Distance-Time and Speed-Time Graphs
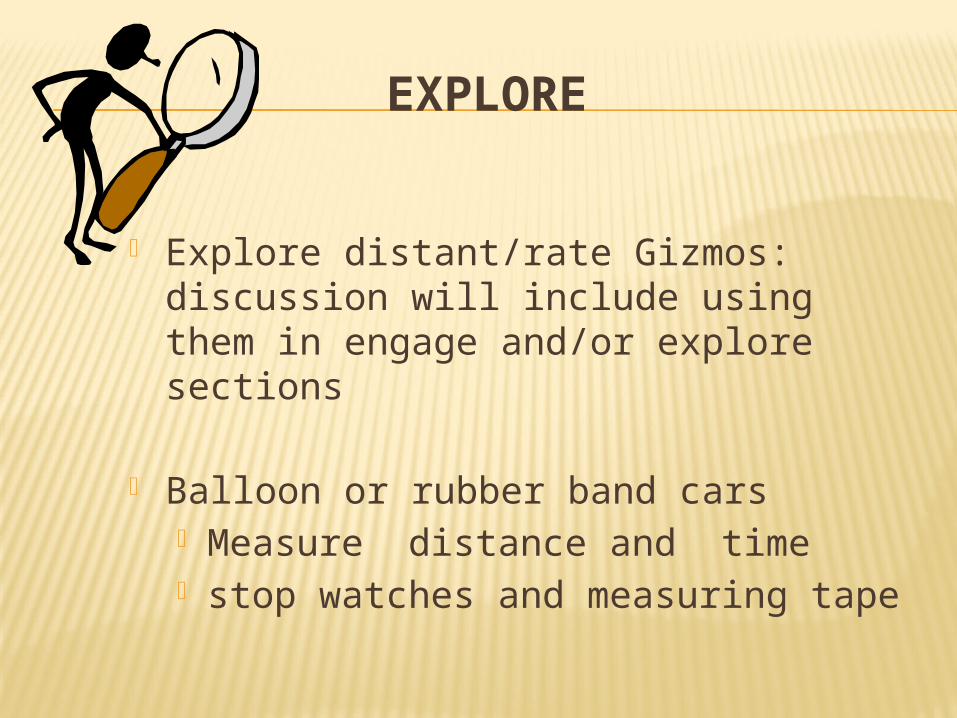
EXPLORE
Explore distant/rate Gizmos: discussion will include using them in engage and/or explore sections
Balloon or rubber band cars Measure distance and time stop watches and measuring tape
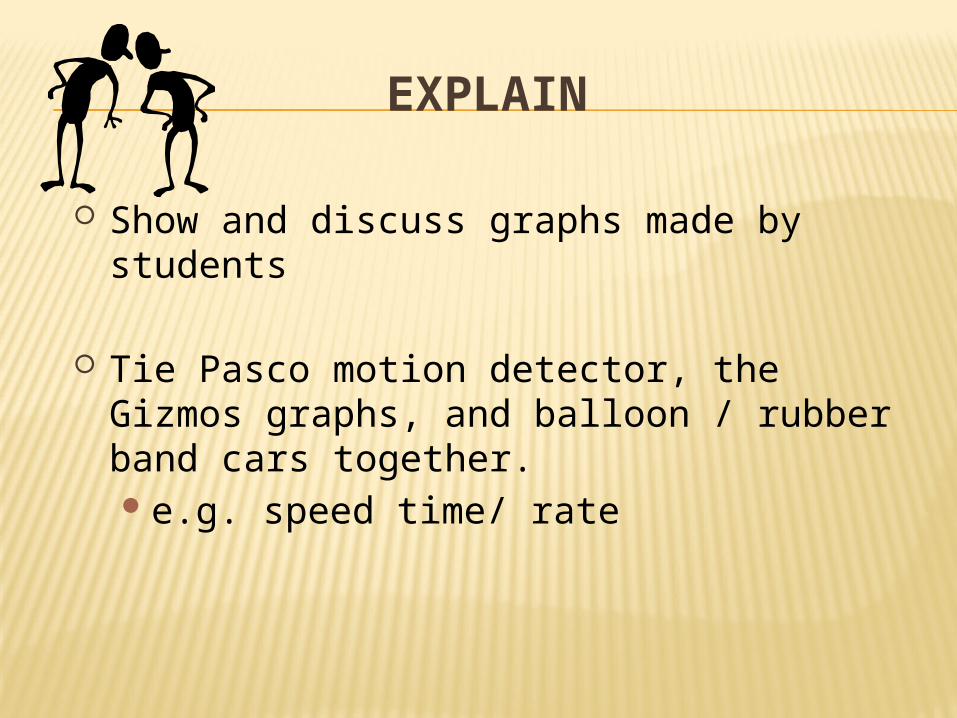
EXPLAIN
Show and discuss graphs made by students
Tie Pasco motion detector, the Gizmos graphs, and balloon / rubber band cars together. e.g. speed time/ rate
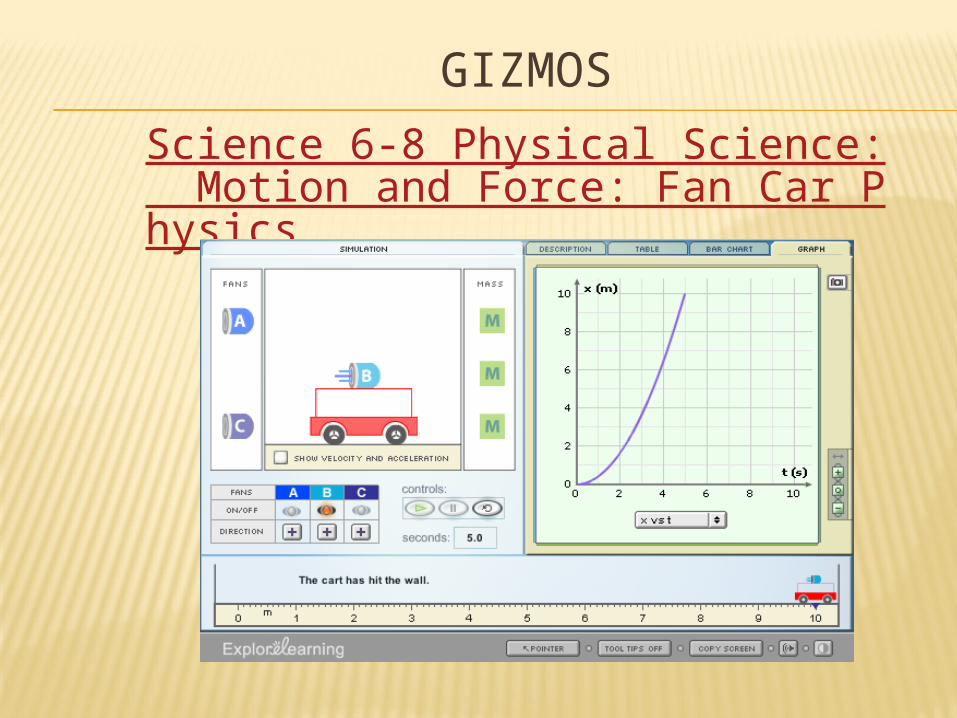
GIZMOS
Science 6-8 Physical Science: Motion and Force: Fan Car Physics
ELABORATE
Science 6-8 physical science: Motion and force: Fan Cart Physics
Nine question strategy – student design investigations, Use Fan Cart Gizmo
9 question with Fan Cart Physics Different graphs
WHAT MATERIALS ARE AVAILABLE FOR EXPERIMENTING WITH FAN CARTS?
What materials / conditions are available for conducting experiments on Fan Carts ?
Cart Forces in terms of fans Load placed on the cart
Q 1
HOW CAN THE MATERIALS / CONDITIONS BE CHANGED? (INDEPENDENT VARIABLE)
Cart Fans Load Track -------- number mass --------
direction
Q 2
HOW TO FAN CARTS ACT?
Change position with time Accelerate over time Have speed or velocity
HOW CAN THE RESPONSE TO THE CHANGE BE MEASURED? (DEPENDENT VARIABLE)
Cart position
Speed or velocity (m/s)
Cart Acceleration (m/s2)
Q 4
WHAT EQUIPMENT OR MEASUREMENT TOOLS ARE NECESSARY?
Means of detection or measurement –
Measurement is completed in the simulation.
Balloon cars meter sticks or tape and stop watches Q 6

WHAT OTHER SUPPLIES ARE NEEDED? Gizmo - The camera feature is very
useful.
WHAT IS THE EXPERIMENTAL PLAN?
Title Hypothesis Independent Variable Control Levels of the Independent Variable Number of Trials Dependent Variable Constants
Q 5
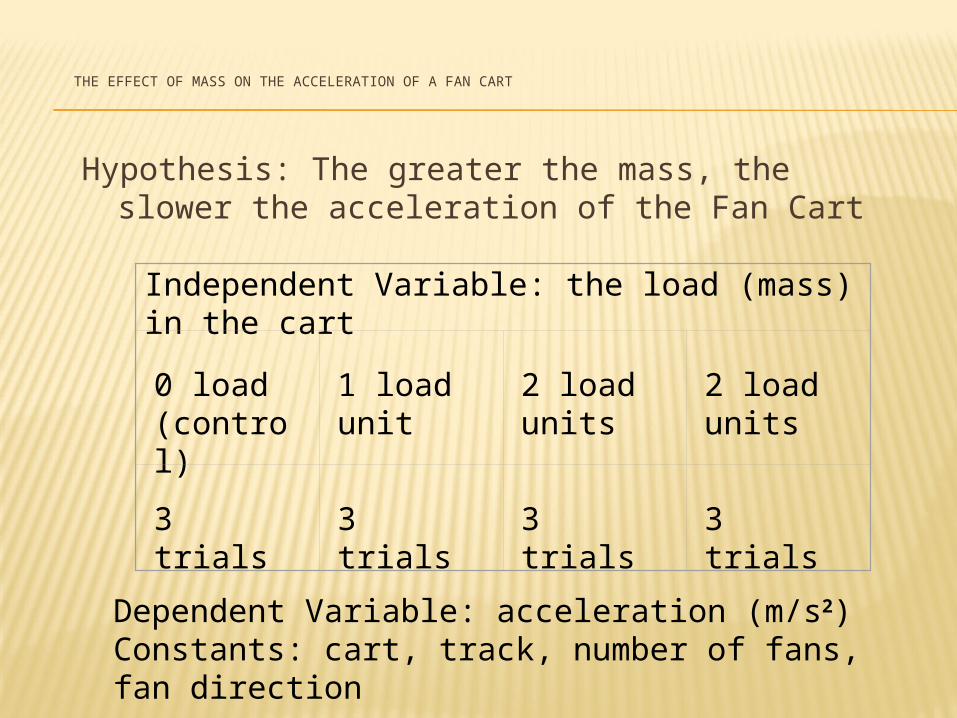
THE EFFECT OF MASS ON THE ACCELERATION OF A FAN CART
Hypothesis: The greater the mass, the slower the acceleration of the Fan Cart
Independent Variable: the load (mass) in the cart 0 load (control)
1 load unit
2 load units
2 load units
3 trials
3 trials
3 trials
3 trials
Dependent Variable: acceleration (m/s2)Constants: cart, track, number of fans, fan direction

GIZMOS
Science 6-8 Physical Science: Motion and Force: Fan Car Physics
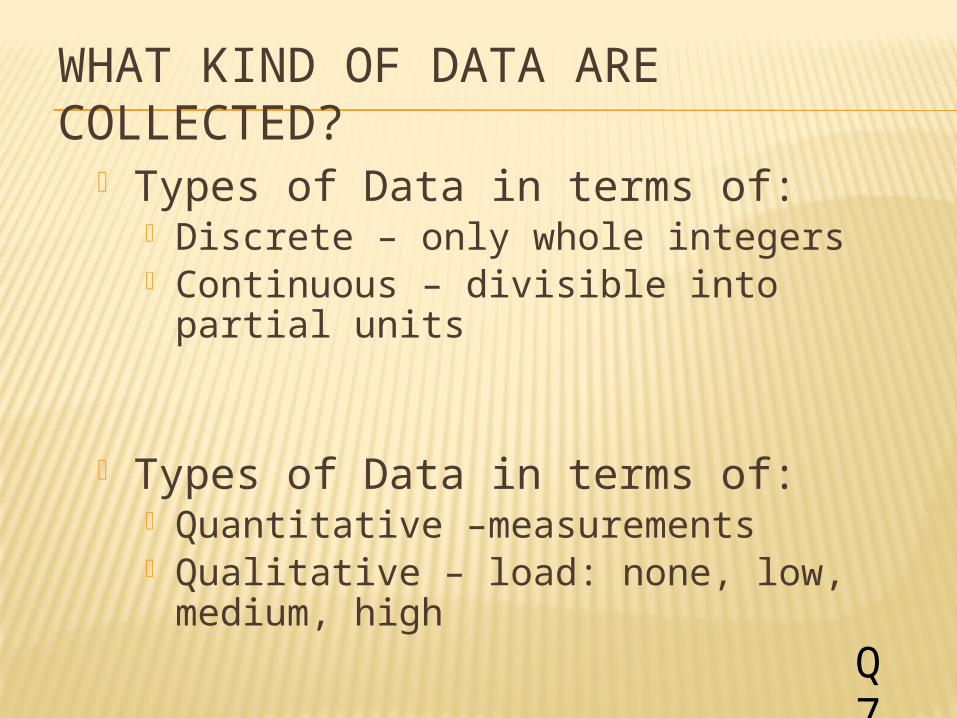
WHAT KIND OF DATA ARE COLLECTED?
Types of Data in terms of: Discrete – only whole integers Continuous – divisible into partial units
Types of Data in terms of: Quantitative –measurements Qualitative – load: none, low, medium,
high
Q 7
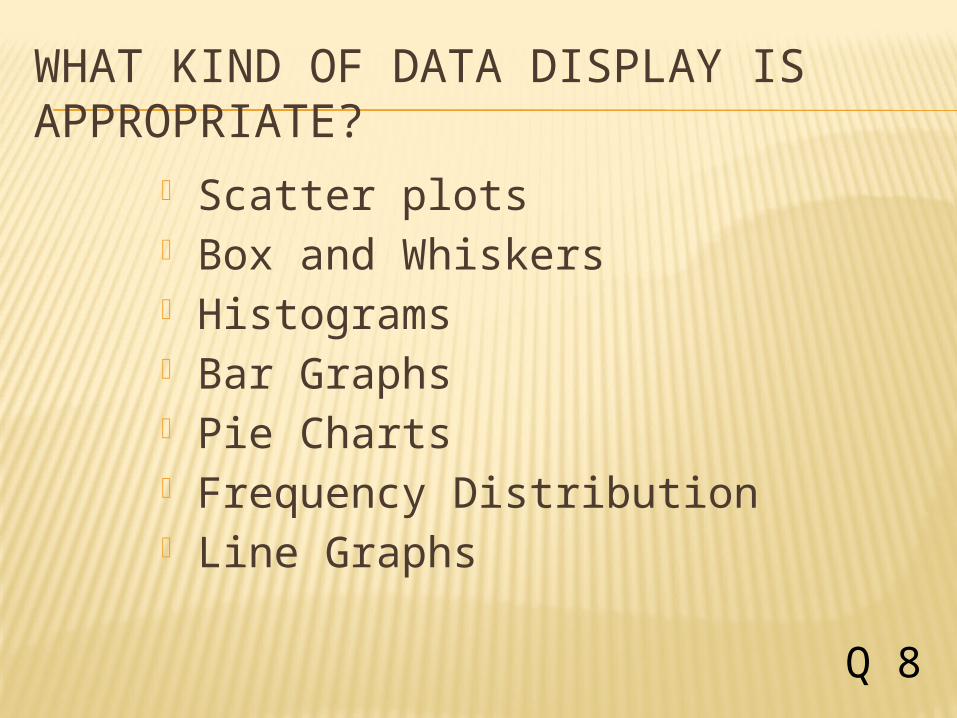
WHAT KIND OF DATA DISPLAY IS APPROPRIATE?
Scatter plots Box and Whiskers Histograms Bar Graphs Pie Charts Frequency Distribution Line Graphs
Q 8
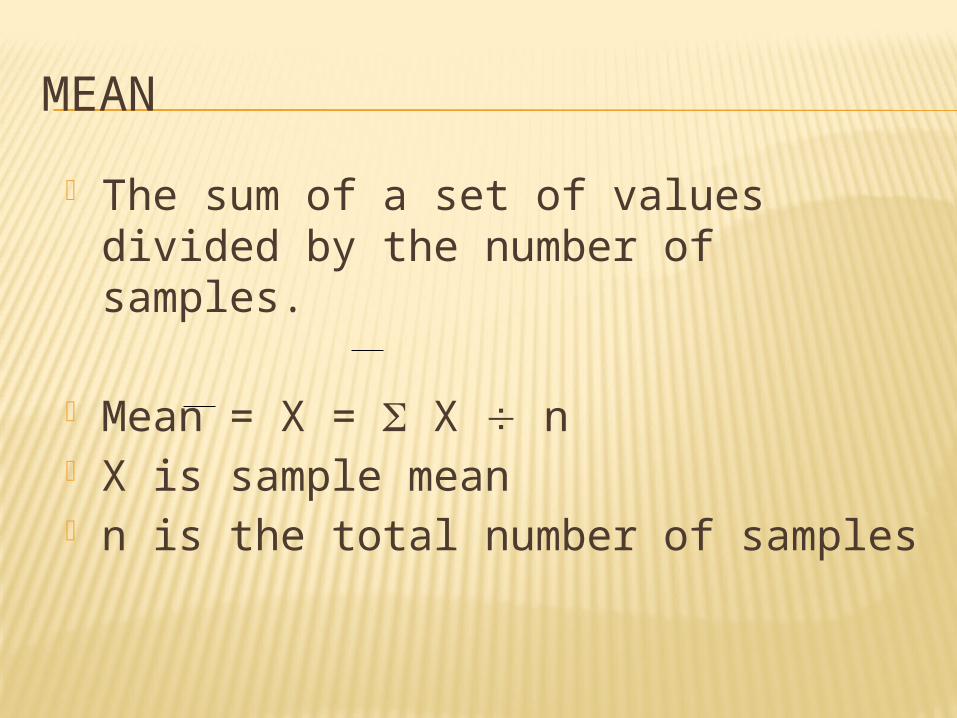
MEAN
The sum of a set of values divided by the number of samples.
Mean = X = X n X is sample mean n is the total number of samples
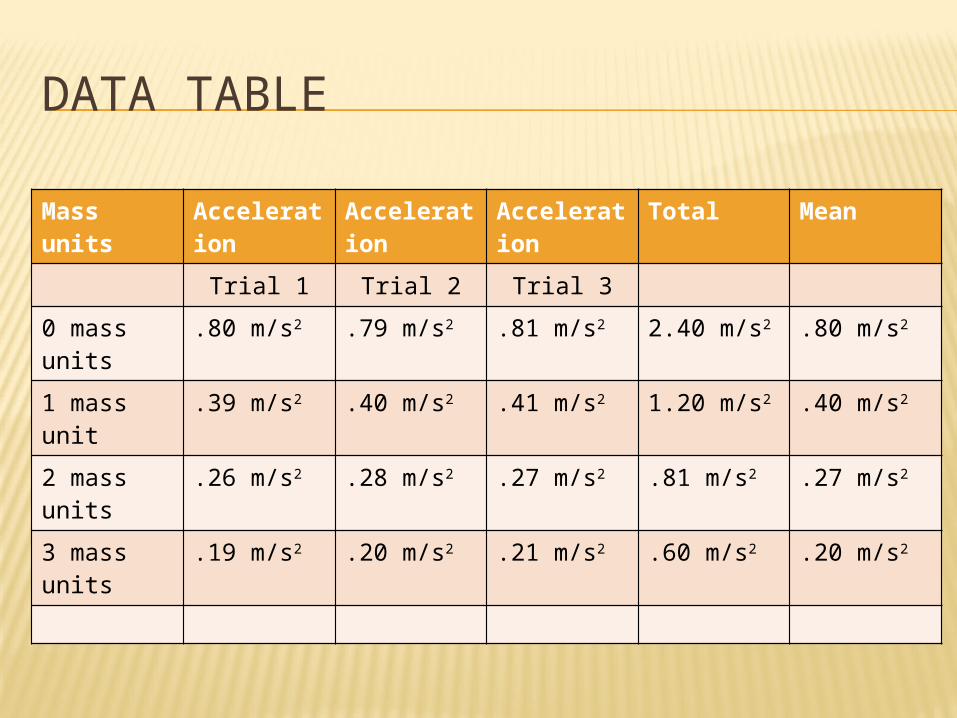
DATA TABLE
Mass units
Acceleration
Acceleration
Acceleration
Total Mean
Trial 1 Trial 2 Trial 3
0 mass units
.80 m/s2 .79 m/s2 .81 m/s2 2.40 m/s2 .80 m/s2
1 mass unit
.39 m/s2 .40 m/s2 .41 m/s2 1.20 m/s2 .40 m/s2
2 mass units
.26 m/s2 .28 m/s2 .27 m/s2 .81 m/s2 .27 m/s2
3 mass units
.19 m/s2 .20 m/s2 .21 m/s2 .60 m/s2 .20 m/s2
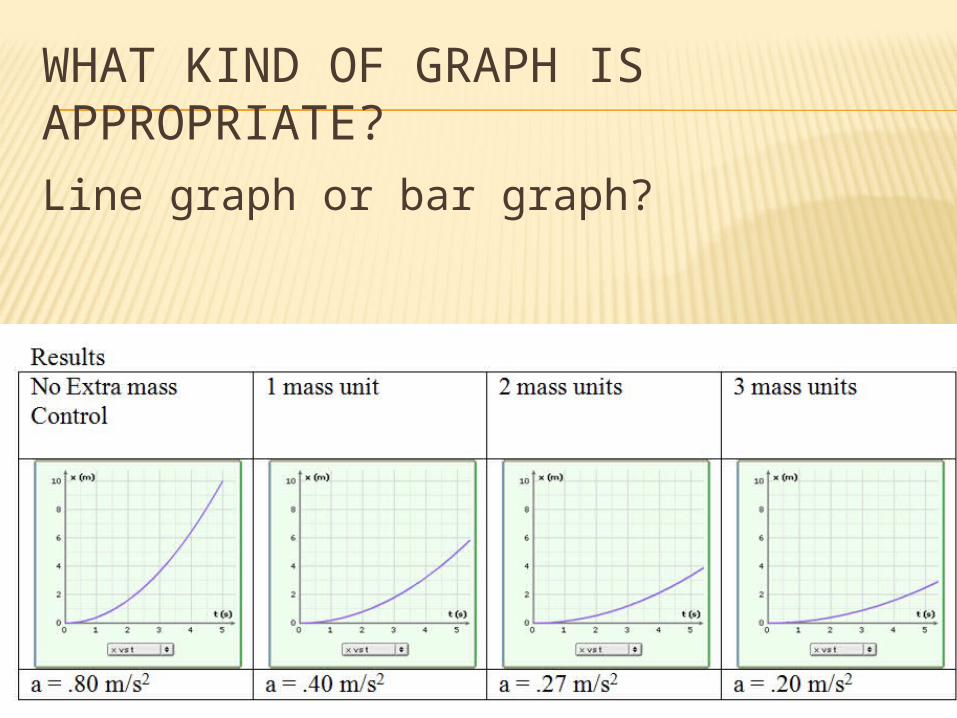
WHAT KIND OF GRAPH IS APPROPRIATE?
Line graph or bar graph?
WHAT STATISTICAL DESCRIPTIONS ARE APPROPRIATE?
Descriptive statistics Central Tendency Variation
Inferential statistics t Test Chi-Square
Q 8
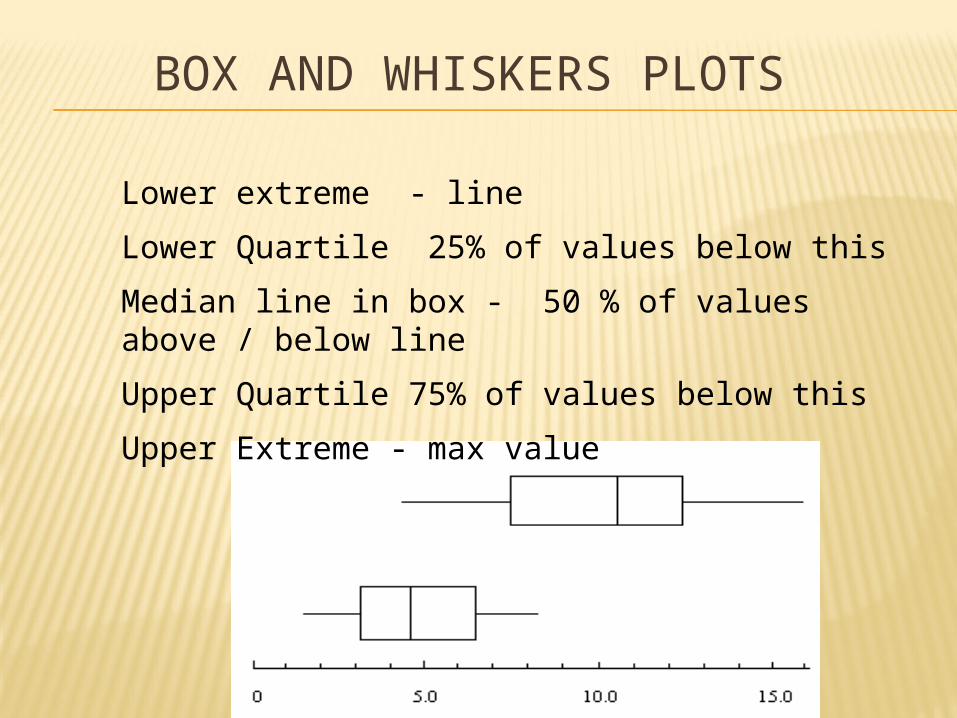
BOX AND WHISKERS PLOTS
Lower extreme - line
Lower Quartile 25% of values below this
Median line in box - 50 % of values above / below line
Upper Quartile 75% of values below this
Upper Extreme - max value
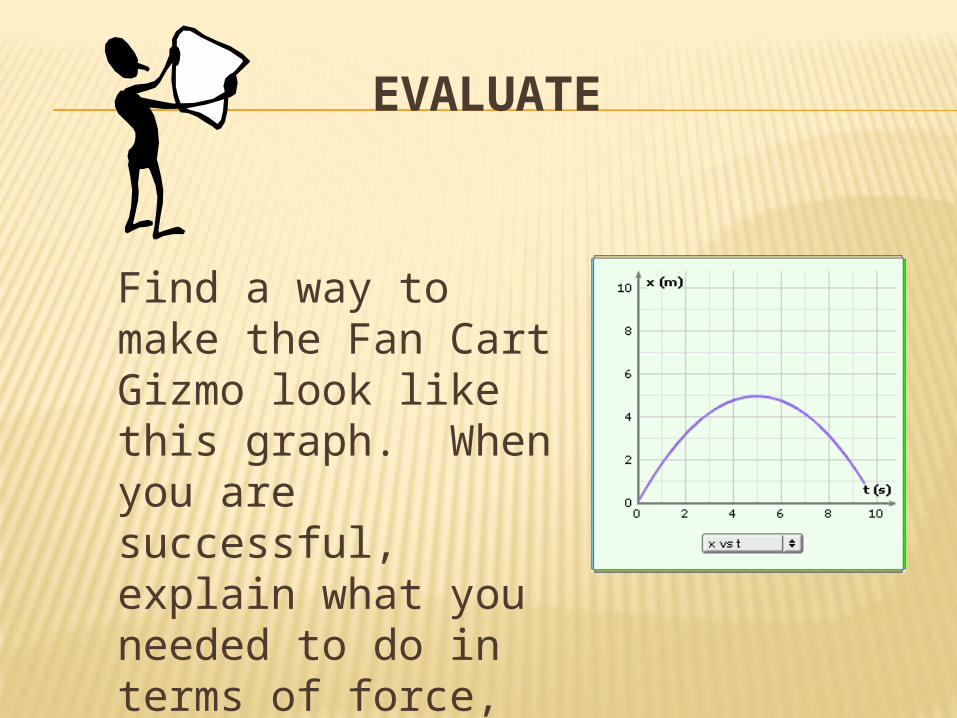
EVALUATE
Find a way to make the Fan Cart Gizmo look like this graph. When you are successful, explain what you needed to do in terms of force, time, and direction