Embed Size (px)
Citation preview
Produced by the Secretariat of the International Plant Protection Convention (IPPC)
ENG
DIA
GN
OST
IC P
ROTO
CO
LSIN
TERN
ATI
ON
AL
STA
ND
ARD
FO
R PH
YTO
SAN
ITA
RY M
EASU
RES
ISPM 27ANNEX 14
DP 14: Xanthomonas fragariae
27

This page is intentionally left blank
This diagnostic protocol was adopted by the Standards Committee on behalf of the Commission on Phytosanitary Measures
in August 2016.
The annex is a prescriptive part of ISPM 27.
DP 14-1 International Plant Protection Convention
ISPM 27 Diagnostic protocols for regulated pests
DP 14: Xanthomonas fragariae
Adopted 2016; published 2017
CONTENTS
1. Pest Information ......................................................................................................................... 3
2. Taxonomic Information .............................................................................................................. 3
3. Detection ..................................................................................................................................... 3
3.1 Symptoms .................................................................................................................... 4
3.2 Sampling ..................................................................................................................... 5
3.3 Sample preparation ...................................................................................................... 5
3.4 Rapid screening tests ................................................................................................... 5
3.5 Isolation ....................................................................................................................... 5
3.5.1 Isolation method 1 ....................................................................................................... 6
3.5.2 Isolation method 2 ....................................................................................................... 6
3.5.3 Interpretation of isolation results ................................................................................. 6
3.6 Detached leaf assay and biological enrichment .......................................................... 7
3.6.1 Detached leaf assay ..................................................................................................... 7
3.6.2 Interpretation of detached leaf assay results................................................................ 7
3.6.3 Enrichment in planta isolation..................................................................................... 7
3.6.4 Enrichment in vitro-PCR from detached leaf assay .................................................... 8
3.7 ELISA ......................................................................................................................... 8
3.7.1 Indirect ELISA ............................................................................................................ 8
3.7.2 DAS-ELISA ................................................................................................................ 8
3.7.3 Interpretation of ELISA results ................................................................................... 9
3.8 Immunofluorescence ................................................................................................... 9
3.8.1 Interpretation of immunofluorescence results ............................................................. 9
3.9 PCR ........................................................................................................................... 10
3.9.1 DNA extraction ......................................................................................................... 10
3.9.2 Multiplex PCR .......................................................................................................... 11
3.9.2.1 Protocol of Hartung and Pooler (1997) ..................................................................... 11
3.9.3 Nested PCR ............................................................................................................... 11
3.9.3.1 Protocol of Moltmann and Zimmerman (2005) ........................................................ 11
3.9.3.2 Protocol of Roberts et al. (1996) ............................................................................... 12
3.9.4 Real-time PCR .......................................................................................................... 12
3.9.4.1 Protocol of Weller et al. (2007) ................................................................................ 12
3.9.5 Interpretation of PCR results ..................................................................................... 13
3.9.5.1 Conventional PCR ..................................................................................................... 13
Diagnostic protocols for regulated pests DP 14
International Plant Protection Convention DP 14-2
3.9.5.2 Real-time PCR .......................................................................................................... 13
3.9.6 Controls for molecular tests ...................................................................................... 13
4. Identification ............................................................................................................................. 14
4.1 Biochemical and physiological tests ......................................................................... 14
4.1.1 Fatty acid methyl ester profiling ............................................................................... 17
4.1.1.1 Interpretation of FAME profiling results .................................................................. 17
4.2 Serological tests ........................................................................................................ 17
4.2.1 Immunofluorescence ................................................................................................. 17
4.2.2 ELISA ....................................................................................................................... 18
4.3 Molecular tests .......................................................................................................... 18
4.3.1 PCR ........................................................................................................................... 18
4.3.2 REP-PCR................................................................................................................... 18
4.3.2.1 Interpretation of REP-PCR results ............................................................................ 18
4.3.3 Multilocus sequence analysis .................................................................................... 18
4.4 Pathogencity tests ...................................................................................................... 19
4.4.1 General inoculation procedure .................................................................................. 19
4.4.1.1 Interpretation of pathogenicity test results ................................................................ 19
4.4.2 Hypersensitive reaction ............................................................................................. 19
4.4.2.1 Interpretation of HR results ....................................................................................... 19
5. Records ..................................................................................................................................... 20
6. Contact Points for Further Information .................................................................................... 20
7. Acknowledgements .................................................................................................................. 20
8. References ................................................................................................................................ 20
9 Figures ...................................................................................................................................... 25
DP 14 Diagnostic protocols for regulated pests
DP 14-3 International Plant Protection Convention
1. Pest Information
Xanthomonas fragariae Kennedy and King, 1962 is the causal agent of bacterial angular leaf spot
disease of strawberry. The disease is prevalent mainly in North America and was first reported in the
United States in 1962 (Kennedy and King, 1962; Hildebrand et al., 1967; Maas et al., 1995), but it has
been subsequently reported in many strawberry growing areas around the world, including South
America and Europe (CABI). Fragaria × ananassa, the predominant cultivated strawberry, is the
primary host of X. fragariae. Commercial cultivars vary in susceptibility, and other Fragaria species,
including F. chiloensis, F. virginiana and F. vesca, as well as Potentilla fruticosa and P. glandulosa,
are also susceptible. Among Fragaria species only F. moschata is immune (Kennedy and King, 1962;
Kennedy, 1965; Maas, 1998).
X. fragariae is readily transmitted via asymptomatic planting stock with latent infection. Inoculum
sources for primary infection are infected but visually asymptomatic daughter plants that develop on
runners from infected nursery plants and that are used for planting in fruit production fields. Although
X. fragariae is not free-living in the soil, it can overwinter in the soil in association with previously
infected plant material and persist there for long periods of time (Maas, 1998). Residues of infected
leaves and crown infections on runners used for planting are also sources of inoculum for primary
infection.
Analyses of X. fragariae strains isolated at different times in diverse locations around the world indicate
some genetic and phenotypic diversity among these strains (Opgenorth et al., 1996; Pooler et al., 1996;
Roberts et al., 1996). In addition, some differential pathogenicity has been noted among X. fragariae
strains (Maas et al., 2000). Nevertheless, there is a high degree of similarity among pathogenic strains
of this phytopathogen, and there has been no correlation between genotypes or phenotypes and
geographic origin of the strains. Currently known X. fragariae strains around the world are thus likely
to represent a clonal population. Early detection of X. fragariae in infected but asymptomatic strawberry
planting stock is critical for avoiding dissemination of the pathogen and disease development.
2. Taxonomic Information
Name: Xanthomonas fragariae Kennedy and King, 1962
Synonyms: None
Taxonomic position: Bacteria, Proteobacteria, Gammaproteobacteria, Xanthomonadales,
Xanthomonadaceae
Common names: Bacterial angular leaf spot
Note: Xanthomonas fragariae Kennedy and King, 1962 is a member of the gamma subdivision of the
Proteobacteria (Stackebrandt et al., 1988), Phenon 3 of Van den Mooter and Swings (1990), DNA-DNA
homology Group 1 of Rademaker et al. (2000) and DNA Group 1 of Rademaker et al. (2005).
3. Detection
Diagnosis of bacterial angular leaf spot disease of strawberry caused by X. fragariae is based on
inspection for diagnostic symptoms, direct or indirect isolation of the pathogen, serological tests (e.g.
indirect immunofluorescence, enzyme-linked immunosorbent assay (ELISA)) and molecular methods.
Several polymerase chain reaction (PCR) detection tests, each targeting different loci in the X. fragariae
genome, have been developed (Roberts et al., 1996; Zimmerman et al., 2004; Weller et al., 2007;
Vandroemme et al., 2008; Turechek et al., 2008; Vermunt and van Beuningen, 2008). These tests can
be used to confirm the presence of X. fragariae in symptomatic plant material, and several of them have
also been used for the detection of latent X. fragariae infection (Mahuku and Goodwin, 1997;
Zimmerman et al., 2004; Moltman and Zimmerman, 2005). A detached leaf assay (Civerolo et al.,
1997a) is useful for presumptive diagnosis of X. fragariae in cases where direct isolation is very slow
or inhibited. The methods described in this diagnostic protocol, with the exception of the nested PCR,
Diagnostic protocols for regulated pests DP 14
International Plant Protection Convention DP 14-4
have been validated in a test performance study funded by the European Union (SMT-4-CT98-2252)
(López et al., 2005).
Direct isolation of X. fragariae is difficult, even in the presence of characteristic symptoms and bacterial
exudates, because the bacterium grows very slowly on artificial nutrient media and is readily overgrown
by saprophytic bacteria (Hazel and Civerolo 1980; López, et al., 1985; Schaad et al., 2001; Saddler and
Bradbury, 2005). Specific procedures for direct isolation of X. fragariae are given in López et al. (2005).
Selective enrichment of the pathogen in planta by inoculating detached strawberry leaves with aqueous
extracts of diseased or suspected infected tissue can facilitate isolation of X. fragariae in vitro (Civerolo
et al., 1997a).
Procedures for the detection of X. fragariae in symptomatic and asymptomatic plants are presented
below.
In this diagnostic protocol, methods (including reference to brand names) are described as published, as
these defined the original level of sensitivity, specificity and/or reproducibility achieved. The use of
names of reagents, chemicals or equipment in these diagnostic protocols implies no approval of them to
the exclusion of others that may also be suitable. Laboratory procedures presented in the protocols may
be adjusted to the standards of individual laboratories, provided that they are adequately validated.
3.1 Symptoms
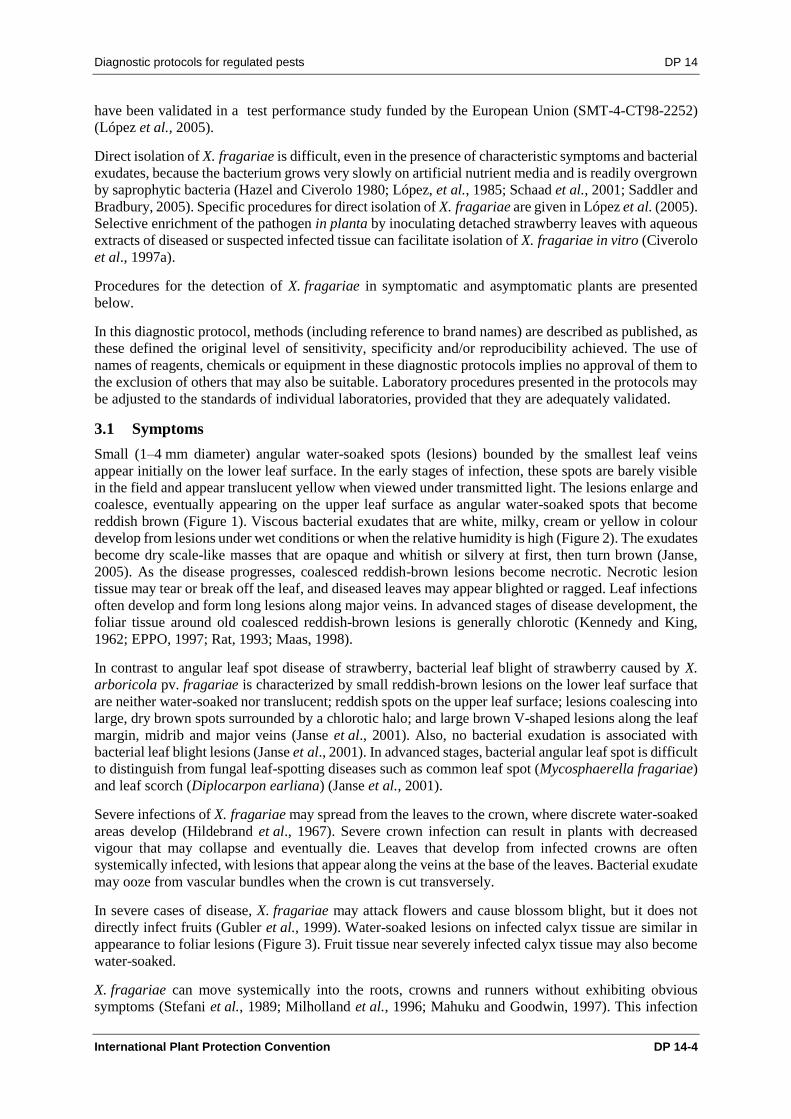
Small (1–4 mm diameter) angular water-soaked spots (lesions) bounded by the smallest leaf veins
appear initially on the lower leaf surface. In the early stages of infection, these spots are barely visible
in the field and appear translucent yellow when viewed under transmitted light. The lesions enlarge and
coalesce, eventually appearing on the upper leaf surface as angular water-soaked spots that become
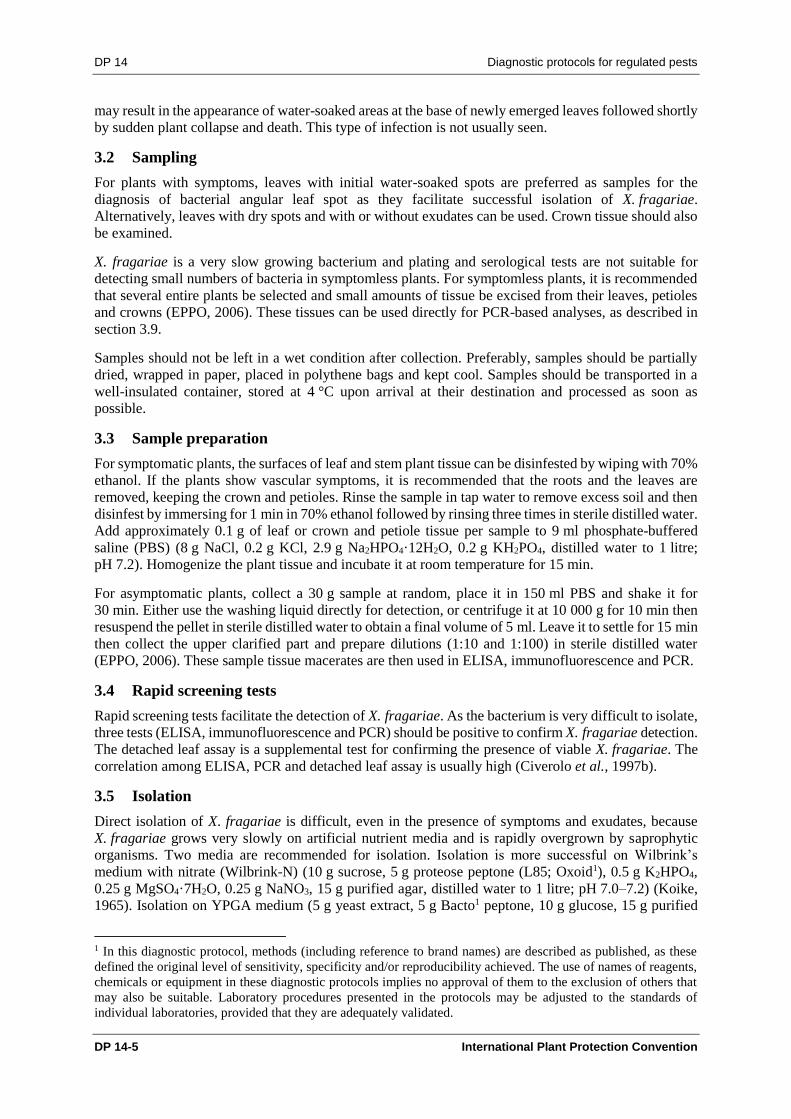
reddish brown (Figure 1). Viscous bacterial exudates that are white, milky, cream or yellow in colour
develop from lesions under wet conditions or when the relative humidity is high (Figure 2). The exudates
become dry scale-like masses that are opaque and whitish or silvery at first, then turn brown (Janse,
2005). As the disease progresses, coalesced reddish-brown lesions become necrotic. Necrotic lesion
tissue may tear or break off the leaf, and diseased leaves may appear blighted or ragged. Leaf infections
often develop and form long lesions along major veins. In advanced stages of disease development, the
foliar tissue around old coalesced reddish-brown lesions is generally chlorotic (Kennedy and King,
1962; EPPO, 1997; Rat, 1993; Maas, 1998).
In contrast to angular leaf spot disease of strawberry, bacterial leaf blight of strawberry caused by X.
arboricola pv. fragariae is characterized by small reddish-brown lesions on the lower leaf surface that
are neither water-soaked nor translucent; reddish spots on the upper leaf surface; lesions coalescing into
large, dry brown spots surrounded by a chlorotic halo; and large brown V-shaped lesions along the leaf
margin, midrib and major veins (Janse et al., 2001). Also, no bacterial exudation is associated with
bacterial leaf blight lesions (Janse et al., 2001). In advanced stages, bacterial angular leaf spot is difficult
to distinguish from fungal leaf-spotting diseases such as common leaf spot (Mycosphaerella fragariae)
and leaf scorch (Diplocarpon earliana) (Janse et al., 2001).
Severe infections of X. fragariae may spread from the leaves to the crown, where discrete water-soaked
areas develop (Hildebrand et al., 1967). Severe crown infection can result in plants with decreased
vigour that may collapse and eventually die. Leaves that develop from infected crowns are often
systemically infected, with lesions that appear along the veins at the base of the leaves. Bacterial exudate
may ooze from vascular bundles when the crown is cut transversely.
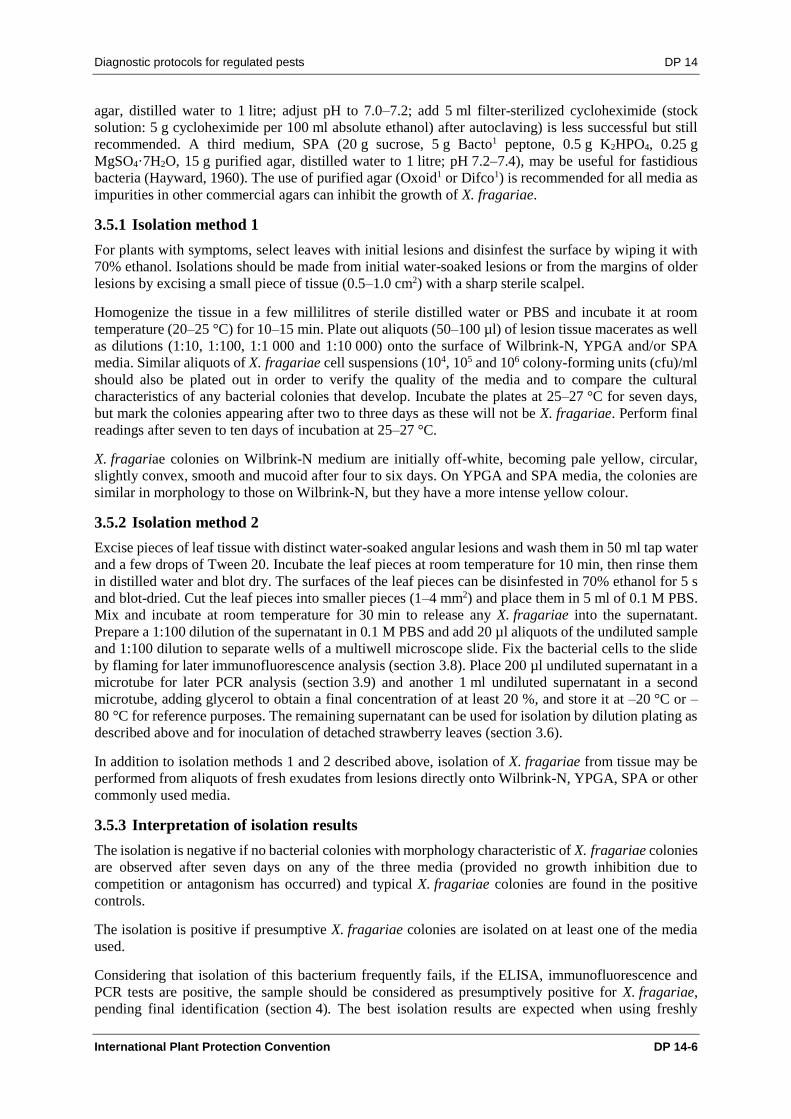
In severe cases of disease, X. fragariae may attack flowers and cause blossom blight, but it does not
directly infect fruits (Gubler et al., 1999). Water-soaked lesions on infected calyx tissue are similar in
appearance to foliar lesions (Figure 3). Fruit tissue near severely infected calyx tissue may also become
water-soaked.
X. fragariae can move systemically into the roots, crowns and runners without exhibiting obvious
symptoms (Stefani et al., 1989; Milholland et al., 1996; Mahuku and Goodwin, 1997). This infection
DP 14 Diagnostic protocols for regulated pests
DP 14-5 International Plant Protection Convention
may result in the appearance of water-soaked areas at the base of newly emerged leaves followed shortly
by sudden plant collapse and death. This type of infection is not usually seen.
3.2 Sampling
For plants with symptoms, leaves with initial water-soaked spots are preferred as samples for the
diagnosis of bacterial angular leaf spot as they facilitate successful isolation of X. fragariae.
Alternatively, leaves with dry spots and with or without exudates can be used. Crown tissue should also
be examined.
X. fragariae is a very slow growing bacterium and plating and serological tests are not suitable for
detecting small numbers of bacteria in symptomless plants. For symptomless plants, it is recommended
that several entire plants be selected and small amounts of tissue be excised from their leaves, petioles
and crowns (EPPO, 2006). These tissues can be used directly for PCR-based analyses, as described in
section 3.9.
Samples should not be left in a wet condition after collection. Preferably, samples should be partially
dried, wrapped in paper, placed in polythene bags and kept cool. Samples should be transported in a
well-insulated container, stored at 4 °C upon arrival at their destination and processed as soon as
possible.
3.3 Sample preparation
For symptomatic plants, the surfaces of leaf and stem plant tissue can be disinfested by wiping with 70%
ethanol. If the plants show vascular symptoms, it is recommended that the roots and the leaves are
removed, keeping the crown and petioles. Rinse the sample in tap water to remove excess soil and then
disinfest by immersing for 1 min in 70% ethanol followed by rinsing three times in sterile distilled water.
Add approximately 0.1 g of leaf or crown and petiole tissue per sample to 9 ml phosphate-buffered
saline (PBS) (8 g NaCl, 0.2 g KCl, 2.9 g Na2HPO4·12H2O, 0.2 g KH2PO4, distilled water to 1 litre;
pH 7.2). Homogenize the plant tissue and incubate it at room temperature for 15 min.
For asymptomatic plants, collect a 30 g sample at random, place it in 150 ml PBS and shake it for
30 min. Either use the washing liquid directly for detection, or centrifuge it at 10 000 g for 10 min then
resuspend the pellet in sterile distilled water to obtain a final volume of 5 ml. Leave it to settle for 15 min
then collect the upper clarified part and prepare dilutions (1:10 and 1:100) in sterile distilled water
(EPPO, 2006). These sample tissue macerates are then used in ELISA, immunofluorescence and PCR.
3.4 Rapid screening tests
Rapid screening tests facilitate the detection of X. fragariae. As the bacterium is very difficult to isolate,
three tests (ELISA, immunofluorescence and PCR) should be positive to confirm X. fragariae detection.
The detached leaf assay is a supplemental test for confirming the presence of viable X. fragariae. The
correlation among ELISA, PCR and detached leaf assay is usually high (Civerolo et al., 1997b).
3.5 Isolation
Direct isolation of X. fragariae is difficult, even in the presence of symptoms and exudates, because
X. fragariae grows very slowly on artificial nutrient media and is rapidly overgrown by saprophytic
organisms. Two media are recommended for isolation. Isolation is more successful on Wilbrink’s
medium with nitrate (Wilbrink-N) (10 g sucrose, 5 g proteose peptone (L85; Oxoid1), 0.5 g K2HPO4,
0.25 g MgSO4·7H2O, 0.25 g NaNO3, 15 g purified agar, distilled water to 1 litre; pH 7.0–7.2) (Koike,
1965). Isolation on YPGA medium (5 g yeast extract, 5 g Bacto1 peptone, 10 g glucose, 15 g purified
1 In this diagnostic protocol, methods (including reference to brand names) are described as published, as these
defined the original level of sensitivity, specificity and/or reproducibility achieved. The use of names of reagents,
chemicals or equipment in these diagnostic protocols implies no approval of them to the exclusion of others that
may also be suitable. Laboratory procedures presented in the protocols may be adjusted to the standards of
individual laboratories, provided that they are adequately validated.
Diagnostic protocols for regulated pests DP 14
International Plant Protection Convention DP 14-6
agar, distilled water to 1 litre; adjust pH to 7.0–7.2; add 5 ml filter-sterilized cycloheximide (stock
solution: 5 g cycloheximide per 100 ml absolute ethanol) after autoclaving) is less successful but still
recommended. A third medium, SPA (20 g sucrose, 5 g Bacto1 peptone, 0.5 g K2HPO4, 0.25 g
MgSO4·7H2O, 15 g purified agar, distilled water to 1 litre; pH 7.2–7.4), may be useful for fastidious
bacteria (Hayward, 1960). The use of purified agar (Oxoid1 or Difco1) is recommended for all media as
impurities in other commercial agars can inhibit the growth of X. fragariae.
3.5.1 Isolation method 1
For plants with symptoms, select leaves with initial lesions and disinfest the surface by wiping it with
70% ethanol. Isolations should be made from initial water-soaked lesions or from the margins of older
lesions by excising a small piece of tissue (0.5–1.0 cm2) with a sharp sterile scalpel.
Homogenize the tissue in a few millilitres of sterile distilled water or PBS and incubate it at room
temperature (20–25 °C) for 10–15 min. Plate out aliquots (50–100 µl) of lesion tissue macerates as well
as dilutions (1:10, 1:100, 1:1 000 and 1:10 000) onto the surface of Wilbrink-N, YPGA and/or SPA
media. Similar aliquots of X. fragariae cell suspensions (104, 105 and 106 colony-forming units (cfu)/ml
should also be plated out in order to verify the quality of the media and to compare the cultural
characteristics of any bacterial colonies that develop. Incubate the plates at 25–27 °C for seven days,
but mark the colonies appearing after two to three days as these will not be X. fragariae. Perform final
readings after seven to ten days of incubation at 25–27 °C.
X. fragariae colonies on Wilbrink-N medium are initially off-white, becoming pale yellow, circular,
slightly convex, smooth and mucoid after four to six days. On YPGA and SPA media, the colonies are
similar in morphology to those on Wilbrink-N, but they have a more intense yellow colour.
3.5.2 Isolation method 2
Excise pieces of leaf tissue with distinct water-soaked angular lesions and wash them in 50 ml tap water
and a few drops of Tween 20. Incubate the leaf pieces at room temperature for 10 min, then rinse them
in distilled water and blot dry. The surfaces of the leaf pieces can be disinfested in 70% ethanol for 5 s
and blot-dried. Cut the leaf pieces into smaller pieces (1–4 mm2) and place them in 5 ml of 0.1 M PBS.
Mix and incubate at room temperature for 30 min to release any X. fragariae into the supernatant.
Prepare a 1:100 dilution of the supernatant in 0.1 M PBS and add 20 µl aliquots of the undiluted sample
and 1:100 dilution to separate wells of a multiwell microscope slide. Fix the bacterial cells to the slide
by flaming for later immunofluorescence analysis (section 3.8). Place 200 µl undiluted supernatant in a
microtube for later PCR analysis (section 3.9) and another 1 ml undiluted supernatant in a second
microtube, adding glycerol to obtain a final concentration of at least 20 %, and store it at –20 °C or –
80 °C for reference purposes. The remaining supernatant can be used for isolation by dilution plating as
described above and for inoculation of detached strawberry leaves (section 3.6).
In addition to isolation methods 1 and 2 described above, isolation of X. fragariae from tissue may be
performed from aliquots of fresh exudates from lesions directly onto Wilbrink-N, YPGA, SPA or other
commonly used media.
3.5.3 Interpretation of isolation results
The isolation is negative if no bacterial colonies with morphology characteristic of X. fragariae colonies
are observed after seven days on any of the three media (provided no growth inhibition due to
competition or antagonism has occurred) and typical X. fragariae colonies are found in the positive
controls.
The isolation is positive if presumptive X. fragariae colonies are isolated on at least one of the media
used.
Considering that isolation of this bacterium frequently fails, if the ELISA, immunofluorescence and
PCR tests are positive, the sample should be considered as presumptively positive for X. fragariae,
pending final identification (section 4). The best isolation results are expected when using freshly
DP 14 Diagnostic protocols for regulated pests
DP 14-7 International Plant Protection Convention
prepared sample extracts from young lesions. Isolation onto media can also be achieved by in planta
enrichment, as described in section 3.6.
3.6 Detached leaf assay and biological enrichment
3.6.1 Detached leaf assay
Tissue sample preparations (section 3.3) can be used for inoculating detached strawberry leaves as soon
as they are prepared in extraction buffer or distilled water (Civerolo et al., 1997a). Use young (7–14 day
old) leaves of a cultivar susceptible to X. fragariae (e.g. Camarosa, Pajaro, Seascape, Selva, Korona)
from greenhouse-grown, X. fragariae-free plants. The quality of the leaves and their age are essential
considerations for a successful test.
Aseptically remove three leaves (each one with three leaflets) from the greenhouse-grown plants, cut
off the basal portion of the petioles and immediately place the petioles in glass tubes containing sterile
water.
Prepare a cell suspension of a reference X. fragariae strain (table 3) containing 105–106 cfu/ml in PBS
or distilled water as a positive control. PBS or distilled water is used as a negative control. Infiltrate four
sites on the abaxial surface of each leaflet (two on each side of the main vein) using a needleless syringe
(3 cc plastic disposal BD1, 2 mm orifice).
Rinse off the excess inoculum with sterile water 1 h after inoculation. Place the leaves with their petioles
in the tubes in a humid chamber (relative humidity 95–100%) and incubate at 18–20 °C with a 12 h
photoperiod for up to 21 days. The specified temperature and illumination during incubation is essential
for avoiding false negative results. The inoculated leaves should not have visible injuries, and water-
soaking caused by the inoculum infiltration should disappear within 24 h.
Specific symptoms (i.e. angular dark water-soaked lesions) similar to those observed on naturally
infected leaves begin to appear a few days after inoculation. Record symptoms every two days for 14–
21 days.
3.6.2 Interpretation of detached leaf assay results
The detached leaf assay is negative if no typical X. fragariae angular leaf spots (i.e. dark and water-
soaked when viewed with reflected light; translucent yellow when viewed with transmitted light) and/or
chlorotic halos appear at any of the inoculated sites after 21 days. No water-soaked spots that appear
translucent yellow when viewed with transmitted light should appear within inoculation sites infiltrated
with negative controls (Civerolo et al., 1997a).
The detached leaf assay is positive if typical X. fragariae angular leaf spots (i.e. dark and water-soaked
when viewed with reflected light; translucent yellow when viewed with transmitted light) develop at the
infiltration inoculation sites within 10 to 21 days. These should be similar in appearance to those that
develop at inoculation sites infiltrated with the positive control suspensions. No water-soaked spots that
appear translucent yellow when viewed with transmitted light should appear within inoculation sites
infiltrated with negative controls (Civerolo et al., 1997a).
3.6.3 Enrichment in planta isolation
Select one leaf per sample from those inoculated in the detached leaf assay 48 h after inoculation for
isolation onto nutrient media. Excise 10–12 small discs, 0.5 cm in diameter, from each inoculated site
per inoculated detached leaf and crush it in 4.5 ml PBS. Prepare dilutions as for direct isolation
(section 3.5) in PBS and streak 50 µl of each dilution onto the surface of Wilbrink-N medium in
triplicate. Incubate the plates at 25–27 °C and check for X. fragariae-like colonies after five to seven
days.
Diagnostic protocols for regulated pests DP 14
International Plant Protection Convention DP 14-8
3.6.4 Enrichment in vitro-PCR from detached leaf assay
Use the Wilbrink-N medium plates streaked with extracts prepared for isolation following enrichment
in planta as described in section 3.6.3 after incubation at 25–27 °C for four days. Wash bacterial colonies
off the surface of the medium in 3–5 ml PBS and use them for PCR analysis (section 3.9). This is a
modification of the bio-enrichment PCR described by Schaad et al. (1995).
3.7 ELISA
The specificity of ELISA with two commercially available polyclonal anti-X. fragariae sera has been
validated (López et al., 2005). Rowhani et al. (1994) showed that ELISA using polyclonal antibodies
could specifically detect 34 strains of X. fragariae and the antibodies did not cross-react with other
closely related pathovars or other bacteria isolated from strawberry plants. A test sensitivity of
105 cfu/ml has been reported for ELISA detection of X. fragariae (Rowhani et al., 1994; Civerolo et al.,
1997b).
Use cell suspensions prepared from pure cultures of X. fragariae and a non-X. fragariae strain as
positive and negative controls in each microtiter plate. It is recommended that the appropriate working
dilution of each polyclonal antiserum be determined.
3.7.1 Indirect ELISA
Mix 210 µl of each test sample, the positive X. fragariae cell suspension (approximately 109 cfu/ml),
the negative non-X. fragariae cell suspension (approximately 109 cfu/ml) and the negative control
(suspension of healthy strawberry material, see below) with 210 µl coating buffer (1.59 g Na2CO3,
2.93 g NaHCO3, distilled water to 1 litre) and add 200 µl of the sample and buffer mixture to each of
two wells of a microtiter plate (PolySorp (Nunc1) or equivalent). For the negative plant material control,
crush approximately 0.1 g healthy strawberry leaf, petiole or crown tissue in 0.9 ml PBS and add 0.9 ml
coating buffer.
Incubate the plate at 4 °C overnight. Wash the plate three times with PBS containing 0.05% Tween 20
(PBS-T) (8 g NaCl, 0.2 g KCl, 0.2 g Na2HPO4·12H2O, 2.9 g KH2PO4, 500 µl Tween 20, distilled water
to 1 litre). After washing add 200 µl blocking buffer (PBS containing 1% bovine serum albumin (BSA)
or non-fat milk powder) to each of the test wells and incubate at 37 °C for 1 h. Wash the plate three
times with PBS-T.
Prepare the appropriate working dilution, according to the manufacturer’s instructions, of the anti-
X. fragariae serum in PBS and add 200 µl to each test well. Incubate at 37 °C for 2 h and then wash the
plate three times with PBS-T. Add 200 µl of the antibody–enzyme conjugate at the appropriate dilution
in PBS containing 0.2% BSA to each well. Incubate at 37 °C for 1 h and then wash the plate four times
with PBS-T. Add 200 µl freshly prepared substrate (1 mg p-nitrophenylphosphate/ml substrate buffer,
pH 9.8) to each test well. Incubate in the dark at room temperature for 15, 30 and 60 min, and read the
absorbance at 405 nm.
3.7.2 DAS-ELISA
For double antibody sandwich (DAS)-ELISA, add 200 µl of an appropriate dilution of anti-X. fragariae
serum in the coating buffer to each well of two microtiter plates (PolySorp (Nunc1) or equivalent).
Incubate at 37 °C for 4 h and wash the wells three times with PBS-T. Add 200 µl of each tissue macerate
sample, and a positive and a negative control, as described for indirect ELISA (section 3.7.1), to each
of two wells of each plate and incubate at 4 °C overnight. After washing the plates three times with
PBS-T, add 200 µl of an appropriate dilution of the enzyme–antibody conjugate in PBS containing 0.2%
BSA to each well. Incubate at 37 °C for 3 h. After washing the plates four times with PBS-T add 200 µl
of freshly prepared substrate (1 mg ρ-nitrophenylphosphate/ml substrate buffer, pH 9.8) to each test
well. Incubate in the dark at room temperature for 15, 30 and 60 min, and read the absorbance at 405 nm.
DP 14 Diagnostic protocols for regulated pests
DP 14-9 International Plant Protection Convention
3.7.3 Interpretation of ELISA results
The ELISA is negative if the average absorbance reading of duplicate wells containing tissue macerate
is <2× the average absorbance reading of the negative control wells containing healthy strawberry tissue
macerate.
The ELISA is positive if (1) the average absorbance reading of duplicate sample wells is >2× the average
absorbance reading of the negative control wells containing healthy strawberry tissue macerate, and (2)
the average absorbance reading of the positive control wells is >2× that of the average absorbance
reading of the negative control wells.
Negative ELISA results for positive control wells indicate that the test was not performed correctly
and/or the reagents have degraded or expired.
Positive ELISA results for negative control wells indicate that cross-contamination or non-specific
antibody binding has occurred. The test should be repeated with fresh tissue or another test based on a
different principle should be performed.
3.8 Immunofluorescence
Immunofluorescence procedures for identifying phytopathogenic bacteria are given in De Boer (1990)
and EPPO (2009). Three commercially available polyclonal anti-X. fragariae sera (Table 1) have been
validated using fluorescein isothiocyanate (FITC)-conjugated anti-rabbit immunoglobulins (López
et al., 2005). Immunofluorescence with these antibodies allows the detection of 103–104 cfu/ml
X. fragariae in strawberry tissue (Calzolari and Mazzucchi, 1989).
Test samples consist of dilutions of tissue macerates (1:10, 1:100 and 1:1 000) and cell suspensions
(106 cfu/ml) of a positive X. fragariae and a negative non-X. fragariae bacterial strain in PBS or distilled
water. Negative controls should consist of healthy plant tissue extracts.
Add aliquots (20 μl) of test samples and positive and negative control suspensions to separate wells of
a multiwell microscope slide. Air-dry the preparations and fix them by flaming or by soaking the slides
in acetone for 10 min followed by air-drying. Slides can be stored at –20 °C until required. Dilute the
primary X. fragariae antibody in PBS containing 10% skim milk powder. Select the lowest antibody
concentration that gives good staining when there are up to 100 positive cells per microscope field. It is
advisable that two dilutions of the antibody are used to detect cross-reactions with other bacteria. Apply
20 μl of the primary antibody to each well and incubate the slides in a moist chamber at room
temperature or at 37 °C for 30–60 min. Rinse the slides in PBS and wash them by submerging them in
the same buffer for 10 min. Dilute the FITC-conjugated secondary antibody in PBS (optimum dilutions
usually vary between 1:20 and 1:200). Cover the wells of the slides with the secondary antibody and
incubate in a moist chamber at room temperature or at 37 °C for 30–60 min. Repeat the washing step
then air-dry the slides. Mount coverslips on the slides with mounting fluid (90 ml glycerol, 10 ml PBS)
containing 1 mg ρ-phenylenediamine/ml and view the slides under oil immersion at 500–1 000×
magnification. Count the cells that fluoresce and have a similar size to the cells of the reference
X. fragariae strain (López et al., 2005).
3.8.1 Interpretation of immunofluorescence results
The immunofluorescence test is negative if green-fluorescing cells with characteristic morphology of
X. fragariae are observed in positive control wells but not in test sample or negative control wells.
The immunofluorescence test is positive if green-fluorescing cells with characteristic morphology of
X. fragariae are observed in positive control and test sample wells but not in negative control wells.
As a population of 103 cells/ml is considered the limit of reliable detection by immunofluorescence,
samples with >103 cells/ml are considered positive (De Boer, 1990). The immunofluorescence test may
be considered to be inconclusive for samples with <103 cells/ml. In this case, further testing or re-
sampling should be performed. Samples with large numbers of incompletely or weakly fluorescing cells
Diagnostic protocols for regulated pests DP 14
International Plant Protection Convention DP 14-10
compared with the positive control need further testing with different dilutions of antibody or another
source of antibody.
Table 1. Polyclonal antibodies to Xanthomonas fragariae currently recommended for use in serological tests
Source Recommended uses†
Neogen Europe1 Detection using immunofluorescence or double antibody sandwich-enzyme-linked immunosorbent assay
Plant Research International, Wageningen UR
Detection using immunofluorescence
Bioreba AG1 Detection using double antibody sandwich-enzyme-linked immunosorbent assay
† Validated in a test performance study in a European Union-funded project (SMT-4-CT98-2252) (López et al., 2005).
3.9 PCR
The PCR methods described in this diagnostic protocol, with the exception of the nested PCR developed
by Zimmerman et al. (2004), have been validated in a a test performance study funded by the European
Union (SMT-4-CT98-2252) (López et al., 2005). Nested PCR protocols have been reported to increase
sensitivity up to 100 times compared with conventional PCR protocols (Roberts et al., 1996;
Zimmerman et al., 2004).
Protocols for DNA extraction from plant samples and PCR described in Pooler et al. (1996) and Hartung
and Pooler (1997) have been validated (López et al., 2005). A modified protocol using the REDExtract-
N-Amp Plant PCR Kit (Sigma1) has also been reported to be appropriate for DNA extraction before
amplification for testing large numbers of samples of asymptomatic leaves (Stöger and Ruppitsch,
2004). Other commercial kits for extracting DNA and for nested PCR and PCR using other primers
(Roberts et al., 1996) are available; however, these have not yet been validated (López et al., 2005).
Two sensitive real-time PCR tests have been described for the detection of X. fragariae (Weller et al.,
2007; Vandroemme et al., 2008) in strawberry tissue. The real-time PCR test developed by Weller et al.
(2007) will also differentiate between X. fragariae and X. arboricola pv. fragariae. The real-time PCR
described by Weller et al. (2007) is based on primers designed within regions of the gyrB gene unique
to X. fragariae and the pep gene unique to X. arboricola pv. fragariae. The real-time PCR developed
by Vandroemme et al. (2008), yielding a 41 base pair (bp) amplicon, is based on primers designed from
the 550 bp amplicon from the PCR described by Pooler et al. (1996). These methods are potentially
useful for detecting low levels of X. fragariae in asymptomatic or latent infections.
3.9.1 DNA extraction
The DNeasy Plant Mini Kit (Qiagen1), as modified for mycoplasmalike organism (MLO) DNA
extraction (Lopez et al., 2005), provided the best results during the European Union ring test (SMT-4-
CT98-2252).
For DNA extraction use 250 µl test sample tissue macerate(s); similarly prepared healthy strawberry
plant material and sterile PBS or ultrapure water as negative controls; and a cell suspension of a pure
culture of X. fragariae as a positive control. Add 250 µl cetyl trimethylammonium bromide (CTAB)
extraction buffer (50 ml of 1 M Tris-HCI, 50 ml of 5 M ethylenediaminetetraacetic acid (EDTA), 40.9 g
NaCl, 5 g polyvinylpyrrolidone (PVP)-40, 12.5 g CTAB, distilled water to 500 ml) and 4 µl RNase A
(100 mg/ml), mix by inverting gently five times, and incubate at 65 °C for 10 min with occasional
mixing by inversion. Then follow the manufacturer’s instructions until the DNA elution step.
To elute the DNA, add 100 µl of 10 mM Tris-HCI, pH 9 (preheated to 65 °C) to the column and
centrifuge at ≥6 000 g for 1 min. Add an additional 100 µl Tris-HCI and repeat the centrifugation step.
Adjust the DNA solution to a total volume of 300 µl with Tris-EDTA (TE) buffer and add 200 µl of
5 M ammonium acetate and 1 ml absolute ethanol. Mix well and incubate at –20 °C for 1 h to overnight.
After incubation, centrifuge at 17 000 g for 10 min. Discard the supernatant and wash the DNA pellet
in 1 ml absolute ethanol and centrifuge at 16 000 g for 5 min. Discard the supernatant and wash the
DP 14 Diagnostic protocols for regulated pests
DP 14-11 International Plant Protection Convention
DNA pellet in 500 µl of 80% ethanol and centrifuge at 16 000 g for 5 min. Discard the supernatant.
After the pellet has dried, resuspend it in 50 µl sterile distilled water.
3.9.2 Multiplex PCR
3.9.2.1 Protocol of Hartung and Pooler (1997)
Specificity for this protocol was confirmed in a study with 30 isolates of X. fragariae, 36 isolates of
X. campestris (representing 19 pathovars) and 62 isolates of epiphytic bacteria commonly isolated from
strawberry. Only X. fragariae was detected (in all isolates). This multiplex PCR enabled detection to
103 cfucfu/ml in plant tissue (Pooler et al., 1996; Hartung and Pooler 1997).
The three sets of primers described by Pooler et al. (1996) are:
241A: 5′-GCCCGACGCGAGTTGAATC-3′
241B: 5′-GCCCGACGCGCTACAGAC TC-3′
245A: 5′-CGCGTGCCAGTGGAGATCC-3′
245B: 5′-CGCGTGCCAGAACTAGCAG-3′
295A: 5′-CGT TCC TGGCCGATT AATAG-3′
295B: 5′-CGCGTTCCT GCG TTTTTT CG-3′
PCR is carried out in 25 µl reaction mixtures containing 2.5 µl buffer (PerkinElmer1) (containing 15 mM
MgCl2), 5.0 µl deoxyribonucleotide triphosphate (dNTP) (1 mM), 2.0 µl (0.4 µM) of each of the six
primers, 0.5 µl Taq DNA polymerase and 5.0 µl sample DNA. The cycling parameters are an initial
activation step of 95 °C for 15 min; 35 cycles of 95 °C for 1 min, 57 °C for 1 min and 72 °C for 1 min;
and a final extension step of 72 °C for 7 min. PCR products are analysed by 1.5% agarose gel
electrophoresis in 0.5× Tris-acetate-EDTA (TAE) buffer (EPPO, 2006).
Specific PCR amplicons for X. fragariae are 300, 550 and 615 bp, as previously described (Pooler et al.,
1996; Hartung and Pooler, 1997). The 300 bp band is usually present when the extracts are from plants
infected with X fragariae but the other bands (550 and 615 bp) may appear occasionally.
The primers 245A and 245B can be used in a conventional PCR, using the procedure described above,
and will produce an amplicon of 300 bp.
3.9.3 Nested PCR
The nested PCR described by Moltmann and Zimmerman (2005) using primers developed by Pooler
et al. (1996) and Zimmerman et al. (2004) is recommended for diagnosing X. fragariae in symptomatic
strawberry plants as well as for testing asymptomatic strawberry plants (frigo and green plants). The
nested PCR described by Roberts et al. (1996) offers an alternative method for confirmation.
3.9.3.1 Protocol of Moltmann and Zimmerman (2005)
Specificity for this protocol was confirmed in a study with 14 isolates of X. fragariae, 30 isolates of
X. campestris (representing 14 pathovars) and 17 isolates of unidentified bacteria associated with
strawberry leaves. In addition, the specificity of the external primer set was verified by Hartung and
Pooler (1997) (section 3.9.2.1). No cross-reactions were observed with the isolates tested. This PCR has
been successfully applied to testing of samples collected during a survey of strawberry plants and
imported plants (Moltmann and Zimmerman, 2005). It enabled detection to 200 fg DNA per reaction
and was 100 times more sensitive than conventional PCR (Zimmerman et al., 2004).
Incubate leaf, petiole and crown tissue (30–70 g) in 10–20 ml of 0.01 M sodium phosphate buffer
(pH 7.2) per gram of tissue at room temperature overnight. Extract DNA and analyse by single and
nested PCR as described by Zimmerman et al. (2004).
The primers are:
245A: 5′-CGCGTGCCAGTGGAGATCC-3′
Diagnostic protocols for regulated pests DP 14
International Plant Protection Convention DP 14-12
245B: 5′-CGCGTGCCAGAACTAGCAG-3′
245.5: 5′-GGTCCAGTGGAGATCCTGTG-3′
245.267: 5′-GTTTTCGTTACGCTGAGTACTG-3′
PCR is carried out in 25 µl reaction mixtures containing PCR buffer (10 mM Tris-HCl, 50 mM KCl,
0.08% Nonidet P-40, 2.5 mM MgCl2), 0.2 mM each dNTP, 0.2 µM each primer and 0.5 µl Taq DNA
polymerase. The cycling parameters are an initial denaturation step of 94 °C for 4 min; 35 cycles of
94 °C for 1 min, 68 °C for 1 min and 72 °C for 1 min; and a final extension step of 72 °C for 7 min. For
nested PCR, after amplification of DNA with the first round primers (245A and 245B), 1 µl of the first
PCR product is used as template in a second PCR with the internal primers 245.5 and 245.267. The same
cycling parameters are used except the annealing temperature is 62 °C for the internal primers 245.5 and
245.267. PCR products are analysed by 1.2% agarose gel electrophoresis in 0.5× TAE buffer.
Specific PCR amplicons for X. fragariae are 300 bp in the first round PCR using the 245A and 245B
primers, and 286 bp in the nested PCR using the internal primers 245.5 and 245.267. With high template
concentrations, a second fragment of approximately 650 bp is sometimes amplified.
3.9.3.2 Protocol of Roberts et al. (1996)
Specificity for this protocol was confirmed in a study with 30 isolates of X. fragariae, 17 isolates of
X. campestris (representing 16 pathovars) and 9 isolates of non-pathogenic xanthomonads isolated from
strawberry. No cross-reactions were observed with the isolates tested. This nested PCR enabled
detection to approximately 18 X. fragariae cells in plant tissue (Roberts et al., 1996).
The semi-nested primers, as described by Roberts et al. (1996), are:
XF9: 5′-TGGGCCATGCCGGTGGAACTGTGTGG-3′
XF11: 5′-TACCCAGCCGTCGCAGACGACCGG-3′
XF12: 5′-TCCCAGCAACCCAGATCCG-3′
PCR is carried out in 25 µl reaction mixtures containing PCR buffer (10 mM Tris-HCl, 50 mM KCl,
1.5 mM MgCl2), 0.2 mM each dNTP, 0.2 µM each primer and 0.5 µl Taq DNA polymerase. The cycling
parameters are an initial denaturation step of 95 °C for 2 min; 30 cycles of 95 °C for 30 s, 65 °C for 30 s
and 72 °C for 45 s; and a final extension step of 72 °C for 5 min. For the semi-nested PCR, after
amplification of DNA with the first round primers (XF9 and XF11), 3 µl of the first PCR product is
used as template in a second PCR with the primers XF9 and XF12. The same cycling parameters as
described for the first round are performed except that the annealing temperature is 58 °C. PCR products
are analysed by 1.5% agarose gel electrophoresis in 0.5× TAE buffer.
Specific PCR amplicons for X. fragariae are 537 bp in the first round PCR using the XF9 and XF11
primers, and 458 bp in the semi-nested PCR using the XF9 and XF12 primers.
3.9.4 Real-time PCR
3.9.4.1 Protocol of Weller et al. (2007)
Specificity for this protocol was confirmed in a study with 10 isolates of X. fragariae and 24
Xanthomonas isolates (representing 12 species and 17 pathovars). Only X. fragariae was detected (in
all isolates). This real-time PCR enabled detection to 103 cfu per leaf disc (Weller et al., 2007). This
protocol has been further validated by a laboratory in the Netherlands; the validation data are available
on the EPPO database on diagnostic expertise ().
The primers, based on sequences of the gyrB gene, and TaqMan probe, covalently labelled at the 5′ end
with the reporter dye JOE and at the 3′ end with the quencher dye TAMRA, are:
Xf gyrB-F: 5'-CCG CAG CGA CGC TGA TC -3'
Xf gyrB-R: 5'-ACG CCC ATT GGC AAC ACT TGA-3'
Xf gyrB-P: 5'-TCC GCA GGC ACA TGG GCG AAG AAT TC-3'
DP 14 Diagnostic protocols for regulated pests
DP 14-13 International Plant Protection Convention
PCR is carried out by adding 4 µl template DNA to a reaction mixture containing 1× TaqMan Buffer A
(Applied Biosystems1), 5.5 mM MgCl2, 200 μM dNTPs (Promega1), 300 nM each primer, 100 nM
probe and 0.63 U AmpliTaq Gold DNA polymerase (Applied Biosystems1). The cycling parameters are
an initial activation step of 2 min at 50 °C then 15 min at 95 °C followed by 40 cycles of 10 s at 95 °C
and 1 min at 60 °C.
3.9.5 Interpretation of PCR results
3.9.5.1 Conventional PCR
The PCR test is negative if none of the X. fragariae-specific amplicons of expected size is detected for
samples and negative controls but the amplicons are detected for all positive controls.
The PCR test is positive if at least one of the X. fragariae-specific amplicons of expected size is detected,
providing that it is not amplified from any of the negative controls.
Inhibition of the PCR may be suspected if the expected amplicon is obtained from the positive control
containing X. fragariae in water but negative results are obtained from positive controls with
X. fragariae in plant extract. Repeating the PCR with 1:10, 1:100 and 1:1 000 dilutions of the extract or
repeating the DNA extraction is recommended.
3.9.5.2 Real-time PCR
The real-time PCR test will be considered valid only if:
- the positive control produces an amplification curve with the pathogen-specific primers
- no amplification curve is seen (i.e. cycle threshold (Ct) value is 40) with the negative extraction
control and the negative amplification control.
If the COX internal control primers are used, then the negative control (if used), positive control and
each of the test samples must produce an amplification curve. Failure of the samples to produce an
amplification curve with the internal control primers suggests, for example, that the DNA extraction
failed, the DNA was not included in the reaction mixture, compounds inhibitory to PCR were present
in the DNA extract, or the nucleic acid was degraded.
A sample will be considered positive if it produces a typical amplification curve. The Ct value needs to
be verified in each laboratory when implementing the test for the first time.
3.9.6 Controls for molecular tests
For the test result obtained to be considered reliable, appropriate controls – which will depend on the
type of test used and the level of certainty required – should be considered for each series of nucleic
acid isolation and amplification of the target pest or target nucleic acid. For PCR, a positive nucleic acid
control, an internal control and a negative amplification control (no template control) are the minimum
controls that should be used.
Positive controls should be prepared in a separate area than that in which the samples will be tested.
Positive nucleic acid control. This control is used to monitor the efficiency of PCR amplification. Pre-
prepared (stored) nucleic acid, whole genome DNA or a synthetic control (e.g. cloned PCR product)
may be used. For this protocol, a suspension of pure culture X. fragariae cells (104–106 cfu/ml) is
recommended as a positive nucleic acid control.
Internal control. For conventional and real-time PCR, a plant housekeeping gene (HKG) such as COX
(Weller et al., 2000), 16S ribosomal (r)DNA (Weisberg et al., 1991) or GADPH (Mafra et al., 2012)
should be incorporated into the protocol to eliminate the possibility of PCR false negatives due to nucleic
acid extraction failure or degradation or the presence of PCR inhibitors.
Negative amplification control (no template control). This control is necessary for conventional and
real-time PCR to rule out false positives due to contamination during preparation of the reaction mixture.
Diagnostic protocols for regulated pests DP 14
International Plant Protection Convention DP 14-14
PCR-grade water that was used to prepare the reaction mixture or sterile PBS is added at the
amplification stage.
Positive extraction control. This control is used to ensure that nucleic acid from the target is of
sufficient quality for PCR amplification. Nucleic acid is extracted from infected host tissue or healthy
plant tissue that has been spiked with the target near the concentration considered the detection limit of
the protocol.
The positive control should be approximately one-tenth of the amount of leaf tissue used per plant for
the DNA extraction. For this protocol, X. fragariae tissue macerates spiked with 106 cfucfu/ml of a
reference X. fragariae strain are recommended as positive extraction controls.
For PCR, care needs to be taken to avoid cross-contamination due to aerosols from the positive control
or from positive samples (in particular for nested PCR). If required, the positive control used in the
laboratory should be sequenced so that this sequence can be readily compared with sequences obtained
from PCR amplicons of the correct size. Alternatively, synthetic positive controls can be made with a
known sequence that, again, can be compared with PCR amplicons of the correct size.
Negative extraction control. This control is used to monitor contamination during nucleic acid
extraction and/or cross-reaction with the host tissue. The control comprises nucleic acid that is extracted
from uninfected host tissue and subsequently amplified, or a tissue macerate sample extract previously
tested negative for X. fragariae. Multiple controls are recommended to be included when large numbers
of positive samples are expected.
4. Identification
The minimum requirements for identification are isolation of the bacterium and a positive result from
each of the three detection techniques: (1) indirect ELISA, DAS-ELISA (section 3.7) or
immunofluorescence (section 3.8) using polyclonal antibodies; (2) PCR (section 3.9); and (3)
pathogenicity testing by inoculation of strawberry hosts to fulfil the requirements of Koch’s postulates
(sections 4.4 and 3.6). Additional tests (sections 4) may be done to further characterize the strain present.
In all tests, positive and negative controls must be included.
In the case of latent infections or asymptomatic plants, after an initial screening test the pathogen should
be isolated and its identity confirmed, including by pathogenicity testing with the pure culture and the
fulfilment of Koch’s postulates.
4.1 Biochemical and physiological tests
X. fragariae has the common cultural characteristics of all xanthomonads. Cells are Gram-negative,
aerobic rods with a single polar flagellum. Nitrates not reduced, catalase test positive, and asparagine
not used as a sole source of carbon and nitrogen (Bradbury, 1977; Bradbury, 1984; Schaad et al., 2001).
Weak production of acids from carbohydrates. Colonies are mucoid, convex and shiny on YPGA and
Wilbrink-N media (Dye, 1962; van den Mooter and Swings 1990; Swings et al., 1993; Schaad et al.,
2001). Xanthomonas species are easily differentiated from the other genera of aerobic, Gram-negative
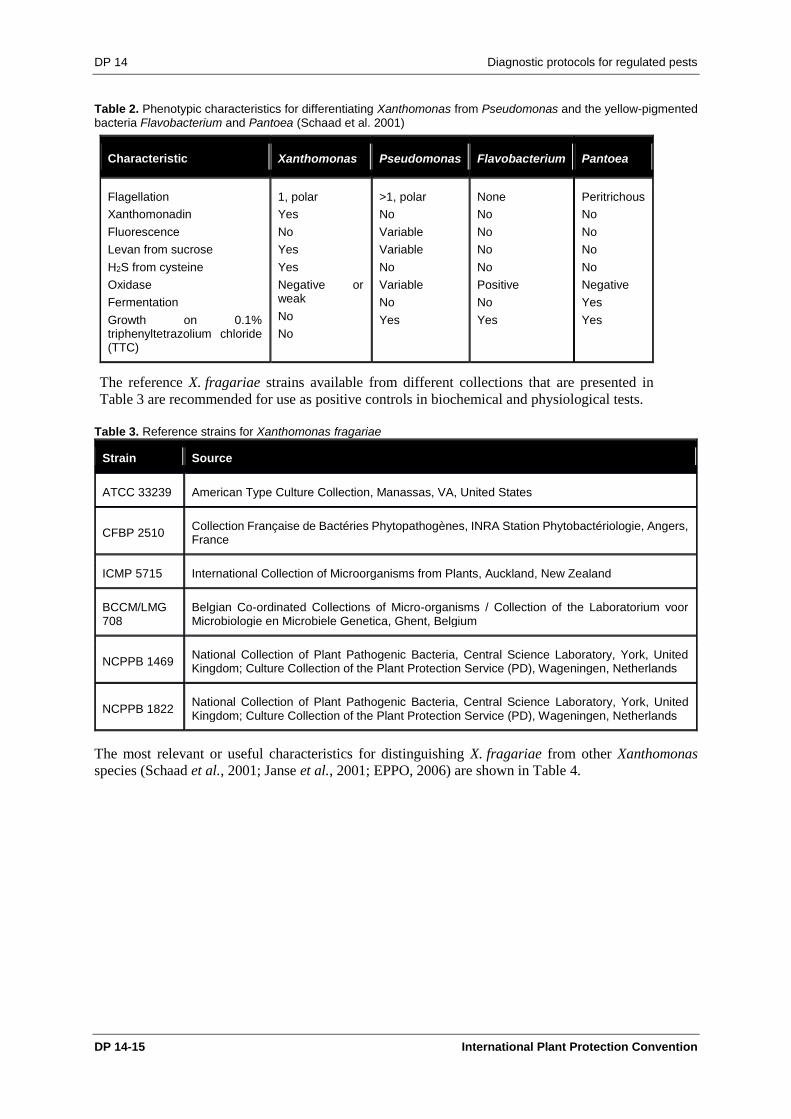
rod-shaped and other yellow-pigmented bacteria by the characteristics shown in Table 2 as described by
Schaad et al. (2001).
DP 14 Diagnostic protocols for regulated pests
DP 14-15 International Plant Protection Convention
Table 2. Phenotypic characteristics for differentiating Xanthomonas from Pseudomonas and the yellow-pigmented bacteria Flavobacterium and Pantoea (Schaad et al. 2001)
Characteristic Xanthomonas Pseudomonas Flavobacterium Pantoea
Flagellation
Xanthomonadin
Fluorescence
Levan from sucrose
H2S from cysteine
Oxidase
Fermentation
Growth on 0.1% triphenyltetrazolium chloride (TTC)
1, polar
Yes
No
Yes
Yes
Negative or weak
No
No
>1, polar
No
Variable
Variable
No
Variable
No
Yes
None
No
No
No
No
Positive
No
Yes
Peritrichous
No
No
No
No
Negative
Yes
Yes
The reference X. fragariae strains available from different collections that are presented in
Table 3 are recommended for use as positive controls in biochemical and physiological tests.
Table 3. Reference strains for Xanthomonas fragariae
Strain Source
ATCC 33239 American Type Culture Collection, Manassas, VA, United States
CFBP 2510 Collection Française de Bactéries Phytopathogènes, INRA Station Phytobactériologie, Angers, France
ICMP 5715 International Collection of Microorganisms from Plants, Auckland, New Zealand
BCCM/LMG 708
Belgian Co-ordinated Collections of Micro-organisms / Collection of the Laboratorium voor Microbiologie en Microbiele Genetica, Ghent, Belgium
NCPPB 1469 National Collection of Plant Pathogenic Bacteria, Central Science Laboratory, York, United Kingdom; Culture Collection of the Plant Protection Service (PD), Wageningen, Netherlands
NCPPB 1822 National Collection of Plant Pathogenic Bacteria, Central Science Laboratory, York, United Kingdom; Culture Collection of the Plant Protection Service (PD), Wageningen, Netherlands
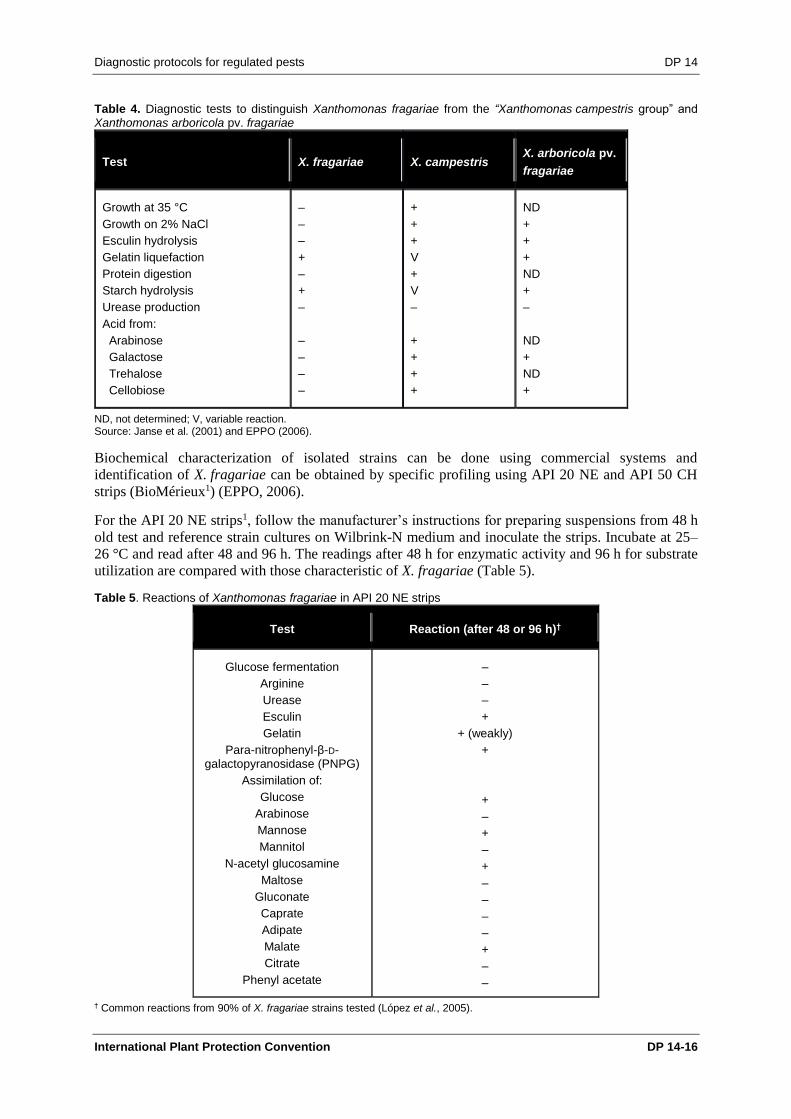
The most relevant or useful characteristics for distinguishing X. fragariae from other Xanthomonas
species (Schaad et al., 2001; Janse et al., 2001; EPPO, 2006) are shown in Table 4.
Diagnostic protocols for regulated pests DP 14
International Plant Protection Convention DP 14-16
Table 4. Diagnostic tests to distinguish Xanthomonas fragariae from the “Xanthomonas campestris group” and Xanthomonas arboricola pv. fragariae
Test X. fragariae X. campestris X. arboricola pv.
fragariae
Growth at 35 °C
Growth on 2% NaCl
Esculin hydrolysis
Gelatin liquefaction
Protein digestion
Starch hydrolysis
Urease production
Acid from:
Arabinose
Galactose
Trehalose
Cellobiose
–
–
–
+
–
+
–
–
–
–
–
+
+
+
V
+
V
–
+
+
+
+
ND
+
+
+
ND
+
–
ND
+
ND
+
ND, not determined; V, variable reaction. Source: Janse et al. (2001) and EPPO (2006).
Biochemical characterization of isolated strains can be done using commercial systems and
identification of X. fragariae can be obtained by specific profiling using API 20 NE and API 50 CH
strips (BioMérieux1) (EPPO, 2006).
For the API 20 NE strips1, follow the manufacturer’s instructions for preparing suspensions from 48 h
old test and reference strain cultures on Wilbrink-N medium and inoculate the strips. Incubate at 25–
26 °C and read after 48 and 96 h. The readings after 48 h for enzymatic activity and 96 h for substrate
utilization are compared with those characteristic of X. fragariae (Table 5).
Table 5. Reactions of Xanthomonas fragariae in API 20 NE strips
Test Reaction (after 48 or 96 h)†
Glucose fermentation
Arginine
Urease
Esculin
Gelatin
Para-nitrophenyl-β-D-galactopyranosidase (PNPG)
Assimilation of:
Glucose
Arabinose
Mannose
Mannitol
N-acetyl glucosamine
Maltose
Gluconate
Caprate
Adipate
Malate
Citrate
Phenyl acetate
–
–
–
+
+ (weakly)
+
+
–
+
–
+
–
–
–
–
+
–
–
† Common reactions from 90% of X. fragariae strains tested (López et al., 2005).
DP 14 Diagnostic protocols for regulated pests
DP 14-17 International Plant Protection Convention
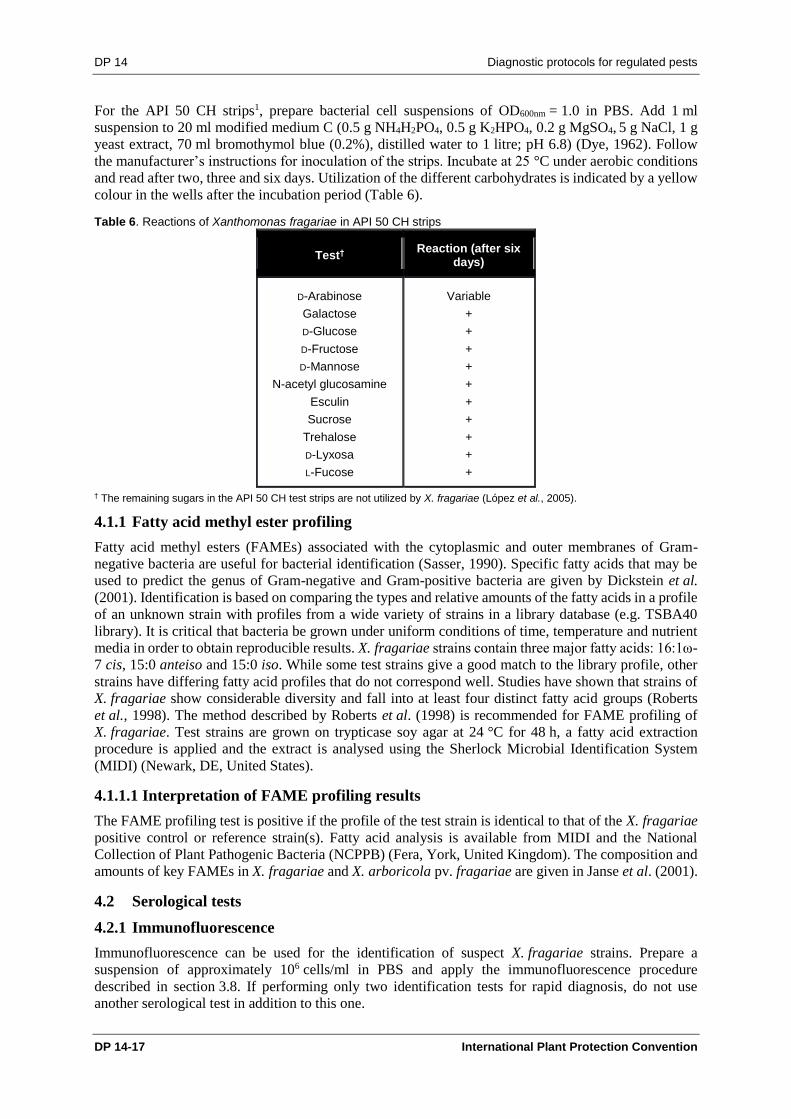
For the API 50 CH strips1, prepare bacterial cell suspensions of OD600nm = 1.0 in PBS. Add 1 ml
suspension to 20 ml modified medium C (0.5 g NH4H2PO4, 0.5 g K2HPO4, 0.2 g MgSO4, 5 g NaCl, 1 g
yeast extract, 70 ml bromothymol blue (0.2%), distilled water to 1 litre; pH 6.8) (Dye, 1962). Follow
the manufacturer’s instructions for inoculation of the strips. Incubate at 25 °C under aerobic conditions
and read after two, three and six days. Utilization of the different carbohydrates is indicated by a yellow
colour in the wells after the incubation period (Table 6).
Table 6. Reactions of Xanthomonas fragariae in API 50 CH strips
Test† Reaction (after six
days)
D-Arabinose
Galactose
D-Glucose
D-Fructose
D-Mannose
N-acetyl glucosamine
Esculin
Sucrose
Trehalose
D-Lyxosa
L-Fucose
Variable
+
+
+
+
+
+
+
+
+
+
† The remaining sugars in the API 50 CH test strips are not utilized by X. fragariae (López et al., 2005).
4.1.1 Fatty acid methyl ester profiling
Fatty acid methyl esters (FAMEs) associated with the cytoplasmic and outer membranes of Gram-
negative bacteria are useful for bacterial identification (Sasser, 1990). Specific fatty acids that may be
used to predict the genus of Gram-negative and Gram-positive bacteria are given by Dickstein et al.
(2001). Identification is based on comparing the types and relative amounts of the fatty acids in a profile
of an unknown strain with profiles from a wide variety of strains in a library database (e.g. TSBA40
library). It is critical that bacteria be grown under uniform conditions of time, temperature and nutrient
media in order to obtain reproducible results. X. fragariae strains contain three major fatty acids: 16:1ω-
7 cis, 15:0 anteiso and 15:0 iso. While some test strains give a good match to the library profile, other
strains have differing fatty acid profiles that do not correspond well. Studies have shown that strains of
X. fragariae show considerable diversity and fall into at least four distinct fatty acid groups (Roberts
et al., 1998). The method described by Roberts et al. (1998) is recommended for FAME profiling of
X. fragariae. Test strains are grown on trypticase soy agar at 24 °C for 48 h, a fatty acid extraction
procedure is applied and the extract is analysed using the Sherlock Microbial Identification System
(MIDI) (Newark, DE, United States).
4.1.1.1 Interpretation of FAME profiling results
The FAME profiling test is positive if the profile of the test strain is identical to that of the X. fragariae
positive control or reference strain(s). Fatty acid analysis is available from MIDI and the National
Collection of Plant Pathogenic Bacteria (NCPPB) (Fera, York, United Kingdom). The composition and
amounts of key FAMEs in X. fragariae and X. arboricola pv. fragariae are given in Janse et al. (2001).
4.2 Serological tests
4.2.1 Immunofluorescence
Immunofluorescence can be used for the identification of suspect X. fragariae strains. Prepare a
suspension of approximately 106 cells/ml in PBS and apply the immunofluorescence procedure
described in section 3.8. If performing only two identification tests for rapid diagnosis, do not use
another serological test in addition to this one.
Diagnostic protocols for regulated pests DP 14
International Plant Protection Convention DP 14-18
4.2.2 ELISA
Indirect ELISA or DAS-ELISA (described in sections 3.7.1 and 3.7.2, respectively) can be used for the
identification of suspect X. fragariae strains isolated from plant material affected by suspected bacterial
angular leaf spot. If performing only two identification tests for rapid diagnosis, do not use another
serological test in addition to this one.
4.3 Molecular tests
4.3.1 PCR
Suspect X. fragariae cultures can be identified using the PCR protocols described in section 3.9.
4.3.2 REP-PCR
Specific repetitive extragenic palindromic (REP)-PCR protocols for the identification of X. fragariae
strains are described by Opgenorth et al. (1996) and Pooler et al. (1996). Either one of these protocols
can be used for the reliable identification of test strains as X. fragariae.
The PCR protocol described below is based on the reaction mixture and amplification conditions
described by Opgenorth et al. (1996).
Bacterial strains to be analysed are taken from streaks or individual colonies on Pierce’s disease
modified medium (5.0 g sucrose, 2.5 g Phytone (BD BBL1), 10 g Phytagel (BD BBL1); distilled water
to 1 litre, adjust pH to 7.5 with 2 N HCl before autoclaving;) (Opgenorth et al., 1996). Different growth
media can be used; however, these should be standardized before use.
The two sets of primers are:
REP1R-I: 5′-IIIICGICGICATCIGGC-3′
REP2-I: 5′-ICGICTTATCIGGCCTAC-3′
ERIC1R: 5′-ATGTAAGCTCCTGGGGATTCAC-3′
ERIC2: 5′-AAGTAAGTGACTGGGGTGAGC G-3′
The reaction buffer contains 16.6 mM (NH4)2SO4, 67 mM Tris-HCl (pH 8.8), 6.7 μM EDTA, 30 mM 2-
mercaptoethanol, 0.17 mg BSA/ml, 10% (v/v) dimethyl sulfoxide, 1.2 mM of each dNTP, 62 pmol each
primer and 2 U Taq DNA polymerase. Bacteria from a representative colony of the test strain are
transferred, using a sterile 10 μl pipette tip (or other suitable implement), to a PCR tube containing 25 μl
of the reaction mixture. The cycling parameters are 95 °C for 6 min followed by 35 cycles at 94 °C for
1 min, 44 °C (REP primers) or 52 °C (ERIC primers) for 1 min and 65 °C for 8 min. The amplification
cycles are followed by a final extension step of 68 °C for 16 min. The amplification products (5–10 μl)
are electrophoresed in a 1.5% (w/v) agarose gel. Amplified DNA fragments are visualized after staining
with ethidium bromide by ultraviolet transillumination.
4.3.2.1 Interpretation of REP-PCR results
Test bacterial strains are identified as X. fragariae if they have the same genomic fingerprints as those
of the REP and ERIC genotypes of the reference strains (Pooler et al., 1996) amplified in the same PCR
and run in the same gel. A small number of polymorphic bands may be obtained from different strains
of X. fragariae owing to low levels of genomic variability.
4.3.3 Multilocus sequence analysis
A multilocus sequence analysis (MLSA) approach has been widely used for the specific identification
of xanthomonads (Parkinson et al., 2007; Almeida et al., 2010; Hamza et al., 2012) and could be used
for the identification of X. fragariae, especially now that a draft genome sequence is available
(Vandroemme et al., 2013). However, it should be noted that this methodology has not yet been
validated for the identification of X. fragariae. Housekeeping genes (e.g. gyrB, rpoD) are amplified
using primers and conditions as described by Almeida et al. (2010) and Hamza et al. (2012). MLSA
DP 14 Diagnostic protocols for regulated pests
DP 14-19 International Plant Protection Convention
consists of sequencing multiple loci (typically four to eight housekeeping genes) and comparing these
sequences with reference sequences of Xanthomonas species deposited in nucleotide databases; for
example, the Plant Associated and Environmental Microbes Database (PAMDB)
(http://genome.ppws.vt.edu/cgi-bin/MLST/home.pl) (Almeida et al., 2010), MLVAbank for microbe
genotyping http://mlva.u-psud.fr/mlvav4/genotyping/ and Q-bank Bacteria database (http://www.q-
bank.eu/Bacteria/).
4.4 Pathogencity tests
The identity of bacterial strains suspected of being X. fragariae should be confirmed by a pathogenicity
test, when required. Strains selected from isolation or enrichment plates should be inoculated into
attached leaves of susceptible strawberry plants (or into detached leaves as described in section 3.6).
Several procedures are available: Hazel and Civerolo (1980), Civerolo et al. (1997a) and Hildebrand
et al. (2005).
4.4.1 General inoculation procedure
A recommended inoculation procedure is to use X. fragariae-free strawberry plants of a susceptible
cultivar (e.g. Camarosa, Seascape, Selva, Korona, Pajaro). If possible, plants should be held overnight
in an environmental chamber at 20–25 °C with high (>90%) relative humidity and exposed to light for
4 h before inoculation to induce stomatal opening.
Prepare bacterial cell suspensions (106 cfu/ml) in sterile distilled water or 10 mM PBS. Apply inoculum
for each strain to the abaxial surfaces of three trifoliate leaves on each of two or three plants with a low
pressure spray gun, airbrush or similar device (e.g. from DeVilbiss1) so as not to induce water-soaking.
Infection may be facilitated by wounding leaves (e.g. puncturing the abaxial surface with a needle)
before applying inoculum, although it is not necessary to do this. After inoculation, incubate plants in a
chamber maintained at 20–25 °C with high humidity (>90%) and a 12–14 h photoperiod. Suspensions
of cells of a reference X. fragariae strain (prepared in the same manner as the test strain) and sterile
distilled water or 10 mM PBS serve as positive and negative controls, respectively, and should be
inoculated in different trays. Evaluate lesion development weekly for three weeks (21 days) post-
inoculation. Re-isolate the pathogen from such lesions, as described in section 3.5, and identify by
ELISA, immunofluorescence or PCR.
4.4.1.1 Interpretation of pathogenicity test results
If the bacterial cell suspension contains X. fragariae, initial symptoms will be dark, water-soaked (when
viewed with reflected light) lesions on the lower leaf surfaces. These lesions appear translucent yellow
when viewed with transmitted light. Later these lesions develop into necrotic spots surrounded by a
yellow halo or marginal necrosis. The same symptoms should appear on leaves inoculated with a
reference X. fragariae strain (positive control).
Similar symptoms should not appear on the leaves inoculated with sterile distilled water or 10 mM PBS
(negative control).
4.4.2 Hypersensitive reaction
A hypersensitive reaction (HR) in tobacco leaves can be an indication of the presence of hrp genes and
a positive reaction is induced by many plant pathogenic bacteria. A positive control, for example a strain
of Pseudomonas syringae pv. syringae, can be used. Use the tobacco cultivar Samsun or Xanthi plants
with more than five leaves. Prepare bacterial suspensions of 109 cfu/ml (OD600nm = 1.0) in sterile distilled
water or 10 mM PBS and infiltrate the suspension into the intercellular spaces through the abaxial
surfaces of adult leaves with a syringe equipped with a 25 gauge needle.
4.4.2.1 Interpretation of HR results
Complete collapse and necrosis of the infiltrated tissue within 24–48 h post-inoculation is recorded as a
positive test result. Most X. fragariae strains are HR positive. However, some may be HR negative,
Diagnostic protocols for regulated pests DP 14
International Plant Protection Convention DP 14-20
especially after being stored for some time. Similar reactions should not appear on leaves inoculated
with sterile distilled water or 10 mM PBS as a negative control.
5. Records
Records and evidence should be retained as described in section 2.5 of ISPM 27 (Diagnostic protocols
for regulated pests).
In cases where other contracting parties may be affected by the results of the diagnosis, in particular in
cases of non-compliance (ISPM 13 (Guidelines for the notification of non-compliance and emergency
action)) and where the pest is found in an area for the first time, the following records and evidence and
additional material should be kept for at least one year in a manner that ensures traceability: the original
sample, culture(s) of the pest, preserved or mounted specimens, or test materials (e.g. photographs of
gels, printouts of ELISA results, PCR amplicons).
6. Contact Points for Further Information
Further information on this protocol can be obtained from:
United States Department of Agriculture (USDA) Agricultural Research Service (ARS) (formerly),
(Edwin L. Civerolo; e-mail: [email protected]).
Plant and Environmental Bacteriology, Fera, Sand Hutton, York YO41 1LZ, United Kingdom (John
Elphinstone; e-mail: [email protected]).
Centro de Protección Vegetal y Biotecnología, Instituto Valenciano de Investigaciones Agrarias (IVIA),
Carretera Moncada-Náquera km 4.5, 46113 Moncada (Valencia), Spain (María M. López; e-mail:
[email protected]; tel.: +34 963 424000; fax: +34 963 424001).
A request for a revision to a diagnostic protocol may be submitted by national plant protection
organizations (NPPOs), regional plant protection organizations (RPPOs) or Commission on
Phytosanitary Measures (CPM) subsidiary bodies through the IPPC Secretariat ([email protected]), which
will in turn forward it to the Technical Panel on Diagnostic Protocols (TPDP).
7. Acknowledgements
The first draft of this protocol was written by E.L. Civerolo (USDA ARS (formerly), United States (see
preceding section)) and revised by J. Elphinstone (Fera, United Kingdom (see preceding section)) and
M.M. López (IVIA, Spain (see preceding section)).
8. References
The present annex may refer to international standards for phytosanitary measures (ISPMs). ISPMs are
available on the International Phytosanitary Portal (IPP) at https://www.ippc.int/core-
activities/standards-setting/ispms.
Almeida, N.F., Yan, S., Cai, R., Clarke, C.R., Morris, C.E., Schaad, N.W., Schuenzel, E.L., Lacy,
G.H., Sun, X., Jones, J.B., Castillo, J.A., Bull, C.T., Leman, S., Guttman, D.S., Setubal, J.C.
& Vinatzer, B.A. 2010. PAMDB, a multilocus sequence typing and analysis database and
website for plant-associated microbes. Phytopathology, 100(3): 208–215.
Bradbury, J.F. 1977. Xanthomonas fragariae. CMI descriptions of pathogenic fungi and bacteria No.
558. Wallingford, UK, CABI.
Bradbury, J.F. 1984. Xanthomonas. In N.R. Krieg & J.G. Holt, eds. Bergey’s manual of systematic
bacteriology, Vol. 1. Baltimore, MD, Williams & Wilkins.
CABI. n.d. Crop protection compendium. Wallingford, UK, CABI. Available at
http://www.cabi.org/cpc/ (last accessed 16 April 2016).
Calzolari, A. & Mazzucchi, U. 1989. Attempts to detect Xanthomonas fragariae in symptomless
strawberry plants. Acta Horticulturae, 265: 601–604.
DP 14 Diagnostic protocols for regulated pests
DP 14-21 International Plant Protection Convention
Civerolo, E.L., Feliciano, A.J., Melvin, J.A. & Gubler, W.D. 1997a. A detached leaf bioassay for
Xanthomonas fragariae. In A. Mahadevin, ed. Proceedings of the 9th International Conference
of Plant Pathogenic Bacteria, pp. 89–94. University of Madras, Madras, India.
Civerolo, E.L., Roberts, P., Feliciano, A.J., Melvin, J.A., Buchner, R.P., Jones, J.B. & Gubler,
W.D. 1997b. Comparative detection of Xanthomonas fragariae in strawberry plants by detached
leaf inoculation, ELISA and PCR. In A. Mahadevin, ed. Proceedings of the 9th International
Conference of Plant Pathogenic Bacteria, pp. 95–99. University of Madras, Madras, India.
De Boer, S.H. 1990. Immunofluorescence for bacteria. In R. Hamptom, E. Ball & S. De Boer, eds.
Serological methods for detection and identification of viral and bacterial plant pathogens: A
laboratory manual, pp. 295–298. St Paul, MN, APS Press.
Dickstein, E.R., Jones, J.B. & Stead, D.E. 2001. Automated techniques. In N.W. Schaad, J.B. Jones
& W. Chun, eds. Laboratory guide for identification of plant pathogenic bacteria, pp. 343–358.
St Paul, MN, APS Press.
Dye, D.W. 1962. The inadequacy of the usual determinative tests for the identification of Xanthomonas
spp. New Zealand Journal of Science, 5(4): 393–416.
EPPO (European and Mediterranean Plant Protection Organization). 1997. Data sheet on Xanthomonas
fragariae. In EPPO/CABI (I.M. Smith, D.G. McNamara, P.R. Scott, & M. Holderness, eds), ed.
Quarantine pests for Europe, 2nd edn, pp. 1124–1128. Wallingford, UK, CABI.
EPPO (European and Mediterranean Plant Protection Organization). 2006. Diagnostic protocol for
Xanthomonas fragariae. EPPO Standards PM 7/65. EPPO Bulletin, 36: 135–144.
EPPO (European and Mediterranean Plant Protection Organization). 2009. Indirect
immunofluorescence test for plant pathogenic bacteria. EPPO Standards PM 7/97 (1). EPPO
Bulletin, 39: 413–416.
Gubler, W.D., Feliciano, A.J., Bordas, A., Civerolo, E.L., Melvin, J. & Welch, N. 1999. X. fragariae
and C. cladosporioides cause strawberry blossom blight. California Agriculture, 53: 26–28.
Hamza, A.A., Robene-Soustrade, I., Jouen, E., Lefeuvre, P., Chiroleu, F., Fisher-Le Saux, M.,
Gagnevin, L. & Pruvost, O. 2012. Multilocus sequence analysis- and amplified fragment length
polymorphism-based characterization of xanthomonads associated with bacterial spot of tomato
and pepper and their relatedness to Xanthomonas species. Systematic and Applied Microbiology,
35(3): 183–190.
Hartung, J.S. & Pooler, M.R. 1997. Immunocapture and multiplexed-PCR assay for Xanthomonas
fragariae, causal agent of angular leafspot disease. Acta Horticulturae, 439: 821–828.
Hayward, C. 1960. A method for characterizing Pseudomonas solanacearum. Nature, 186: 405–406.
Hazel, W.J. & Civerolo, E.L. 1980. Procedures for growth and inoculation of Xanthomonas fragariae,
causal organism of angular leaf spot of strawberry. Plant Disease, 64: 178–181.
Hildebrand, P.D., Braun, P.G., Renderos, W.E., Jamieson, A.R., McRae, K.B. & Binns, M.R. 2005.
A quantitative method for inoculating strawberry leaves with Xanthomonas fragariae, factors
affecting infection, and cultivar reactions. Canadian Journal of Plant Pathology, 27: 16–24.
Hildebrand, D.C., Schroth, M.N. & Wilhelm, S. 1967. Systemic invasion of strawberry by
Xanthomonas fragariae causing vascular collapse. Phytopathology, 57: 1260–1261.
Janse, J.D. 2005. Examples of bacterial diseases of cultivated and wild plants – Xanthomonas fragariae.
In: Phytobacteriology: principles and practice. Chapter 7. Wallingford, UK, CABI Publishing.
Pp. 224-225.
Janse, J.D., Ross, M.P., Gorkink, R.F.J., Derks, J.H.J., Swings, J. Janssens, D. & Scortichini, M.
2001. Bacterial leaf blight of strawberry (Fragaria (×) ananassa) caused by a pathovar of
Xanthomonas arboricola, not similar to Xanthomonas fragariae Kennedy & King. Description of
the causal organism as Xanthomonas arboricola pv. fragariae (pv. nov., comb. nov.). Plant
Pathology, 50: 653–665.
Kennedy, B.W. 1965. Infection of Potentilla by Xanthomonas fragariae. Plant Disease Reporter, 49:
491–492.
Diagnostic protocols for regulated pests DP 14
International Plant Protection Convention DP 14-22
Kennedy, B.W. & King, T.H. 1962. Angular leaf spot of strawberry caused by Xanthomonas fragariae
sp. nov. Phytopathology, 52: 873–875.
Koike, H. 1965. The aluminum-cap method for testing sugarcane varieties against leaf scald disease.
Phytopathology, 55: 317–319.
López, M.M., Aramburu, J.M., Cambra, M. & Borrás, V. 1985. [Detection and identification of
Xanthomonas fragariae in Spain.] Anales del Instituto Nacional de Investigaciones Agrarias,
Serie Agricola, 28: 245–259 (in Spanish).
López, M.M., Dominguez, F., Morente, C., Salcedo, C.I., Olmos, A. & Civerolo, E. 2005. Diagnostic
protocols for organisms harmful to plants: Diagnosis Xanthomonas fragariae. SMT-4-CT98-
2252.
Maas, J.L., ed. 1998. Compendium of strawberry diseases, 2nd edn. St Paul, MN, APS Press.
Maas, J.L., Gouin-Behe, C., Hartung J.S. & Hokanson, S.C. 2000. Sources of resistance for two
differentially pathogenic strains of Xanthomonas fragariae in Fragaria genotypes. Horticultural
Science, 35: 128–131.
Maas, J.L., Pooler, M. & Galletta, G.J. 1995. Bacterial angular leafspot disease of strawberry: Present
status and prospects for control. Advances in Strawberry Research, 14: 18–24.
Mafra, V., Kubo, K.S., Alves-Ferreira, M., Ribeiro-Alves, M., Stuart, R.M., Boava, L.P.,
Rodrigues, C.M. & Machado, M.A. 2012. Reference genes for accurate transcript normalization
in citrus genotypes under different experimental conditions. PloS One, 7(2), e31263.
Mahuku, G.S. & Goodwin, P.H. 1997. Presence of Xanthomonas fragariae in symptomless strawberry
crowns in Ontario detected using a nested polymerase chain reaction (PCR). Canadian Journal
of Plant Pathology, 19: 366–370.
Milholland, R.D., Ritchie, D.F., Dayking, M.E. & Gutierrez, W.A. 1996. Multiplication and
translocation of Xanthomonas fragariae in strawberry. Advances in Strawberry Research, 15: 13–
17.
Moltmann, E. & Zimmermann, C. 2005. Detection of Xanthomonas fragariae in symptomless
strawberry plants by nested PCR. EPPO Bulletin, 35: 53–54.
Opgenorth, D.C., Smart, C.D., Louws, F.J., de Bruijn, F.J. & Kirkpatrick, B.C. 1996. Identification
of Xanthomonas fragariae field isolates by rep-PCR genomic fingerprinting. Plant Disease, 80:
868–873.
Parkinson, N., Aritua, V., Heeney, J., Cowie, C., Bew, J. & Stead, D. 2007. Phylogenetic analysis of
Xanthomonas species by comparison of partial gyrase B gene sequences. International Journal
of Systematic and Evolutionary Microbiology, 57(12): 2881–2887.
Pooler, M.R., Ritchie, D.F. & Hartung, J.S. 1996. Genetic relationships among strains of
Xanthomonas fragariae based on random amplified polymorphic DNA PCR, repetitive
extragenic palindromic PCR and enterobacterial repetitive intergenic consensus PCR data and
generation of multiplexed PCR primers useful for the identification of this phytopathogen.
Applied and Environmental Microbiology, 62: 3121–3127.
Rademaker, J.L.W., Hoste, B., Louws, F.J., Kersters, K., Swings, J., Vauterin, L., Vauterin, P. &
De Bruijn, F.J. 2000. Comparison of AFLP and rep-PCR genomic fingerprinting with DNA-
DNA homology studies: Xanthomonas as a model system. International Journal of Systematic
and Evolutionary Microbiology, 50: 665–677.
Rademaker, J.L.W., Louws, F.J., Schultz, M.H., Rossbach, U., Vauterin, L., Swings, J. & de
Bruijn, F.J. 2005. A comprehensive species to strain taxonomic framework for Xanthomonas.
Phytopathology, 95: 1098–1111.
Rat, B. 1993. Xanthomonas fragariae: Causal agent of angular leaf spot of strawberry. In J.G. Swings
& E.L. Civerolo, eds. Xanthomonas, pp. 69–70. London, Chapman and Hall.
Roberts, P.D., Hodge, N.C., Bouzar, H., Jones, J.B., Stall, R.E., Berger, R.D. & Chase, A.R. 1998.
Relatedness of strains of Xanthomonas fragariae by restriction fragment length polymorphism,
DP 14 Diagnostic protocols for regulated pests
DP 14-23 International Plant Protection Convention
DNA-DNA reassociation, and fatty acid analyses. Applied and Environmental Microbiology, 64:
3961–3965.
Roberts, P.D., Jones, J.B., Chandler, C.K., Stall, R.E. & Berger, R.D. 1996. Survival of
Xanthomonas fragariae on strawberry in summer nurseries in Florida detected by specific primers
and nested PCR. Plant Disease, 80: 1283–1288.
Rowhani, A., Feliciano, A.J., Lips, T. & Gubler, W.D. 1994. Rapid identification of Xanthomonas
fragariae in infected strawberry leaves by enzyme-linked immunosorbent assay. Plant Disease,
78: 248–250.
Saddler, G.S. & Bradbury, J.F. 2005. Xanthomonas. In G.M. Garrity, editor-in-chief; D.J. Brenner,
N.R. Krieg & J.T. Stanley, eds Vol. 2. Bergey’s manual of systematic bacteriology, 2nd edn, Vol.
2, Part B, pp. 63–90. New York, Springer.
Sasser, M. 1990. Identification of bacteria through fatty acid analysis. In Z. Klement, K. Rudolph &
D.C. Sands, eds. Methods in phytopathology, pp. 200–204. Budapest, Akademiai Kiado.
Schaad, N.W., Jones, J.B. & Lacy, G.H. 2001. Xanthomonas. In N.W. Schaad, J.B. Jones & W. Chun,
eds. Laboratory guide for identification of plant pathogenic bacteria, 3rd edn, pp. 175–200. St
Paul, MN, APS Press.
Schaad, N.W., Tamaki, S., Hatziloukas, E. & Panapoulos, N.J. 1995. A combined biological
enzymatic amplification (Bio-PCR) technique to detect Pseudomonas syringae pv. phaseolicola
in bean seed extracts. Phytopathology, 85: 243–248.
Stackebrandt, E., Murray, R.G.E. & Truper, H.G. 1988. Proteobacteria classis nov., a name for the
phylogenetic taxon that includes the “purple bacteria and their relatives”. International Journal
of Systematic Bacteriology, 38: 321–325.
Stefani, E., Mazzucchi, U. & Calzolari, A. 1989. Evidence of endophytic movement of Xanthomonas
fragariae Kenn. and King in strawberry. Phytopathologia Mediterranea, 28: 147–149.
Stöger, A. & Ruppitsch, W. 2004. A rapid and sensitive method for the detection of Xanthomonas
fragariae, causal agent of angular leafspot disease in strawberry plants. Journal of
Microbiological Methods, 58: 281–284.
Swings, J., Vauterin, L. & Kersters, K. 1993. The bacterium Xanthomonas. In J. Swings & E.L.
Civerolo, eds. Xanthomonas, pp. 138–144. London, Chapman and Hall.
Turechek, W.W., Hartung, J.S. & McCallister, J. 2008. Development and optimization of a real-time
detection assay for Xanthomonas fragariae in strawberry crown tissue with receiver operating
characteristic curve analysis. Phytopathology, 98(3): 359-368.
Van den Mooter, M. & Swings, J. 1990. Numerical analyses of 295 phenotypic features of 266
Xanthomonas strains and related strains and an improved taxonomy of the genus. International
Journal of Systematic Bacteriology, 40: 348–369.
Vandroemme, J., Baeyen, S., Van Vaerenbergh, J., De Vos, P. & Maes, M. 2008. Sensitive real-
time PCR detection of Xanthomonas fragariae in strawberry plants. Plant Pathology, 57(3): 438–
444.
Vandroemme, J., Cottyn, B., Baeyen, S., De Vos, P. & Maes, M. 2013. Draft genome sequence of
Xanthomonas fragariae reveals reductive evolution and distinct virulence-related gene content.
BMC Genomics, 14(1), 829.
Weisberg, W.G., Barns, S.M., Pelletier, B.A. & Lane, D.J. 1991. 16S ribosomal DNA amplification
for phylogenetic study. Journal of Bacteriology, 173: 697–703.
Weller, S.A., Beresford-Jones, N.J., Hall, J., Thwaites, R., Parkinson, N. & Elphinstone, J.G. 2007.
Detection of Xanthomonas fragariae and presumptive detection of Xanthomonas arboricola pv.
fragariae, from strawberry leaves, by real-time PCR. Journal of Microbiological Methods, 70:
379–383.
Weller, S.A., Elphinstone, J.G., Smith, N.C., Boonham, N. & Stead, D.E. 2000. Detection of
Ralstonia solanacearum strains with a quantitative, multiplex, real-time, fluorogenic PCR
(TaqMan) Assay. Applied and Environmental Microbiology, 66(7): 2853–2858.
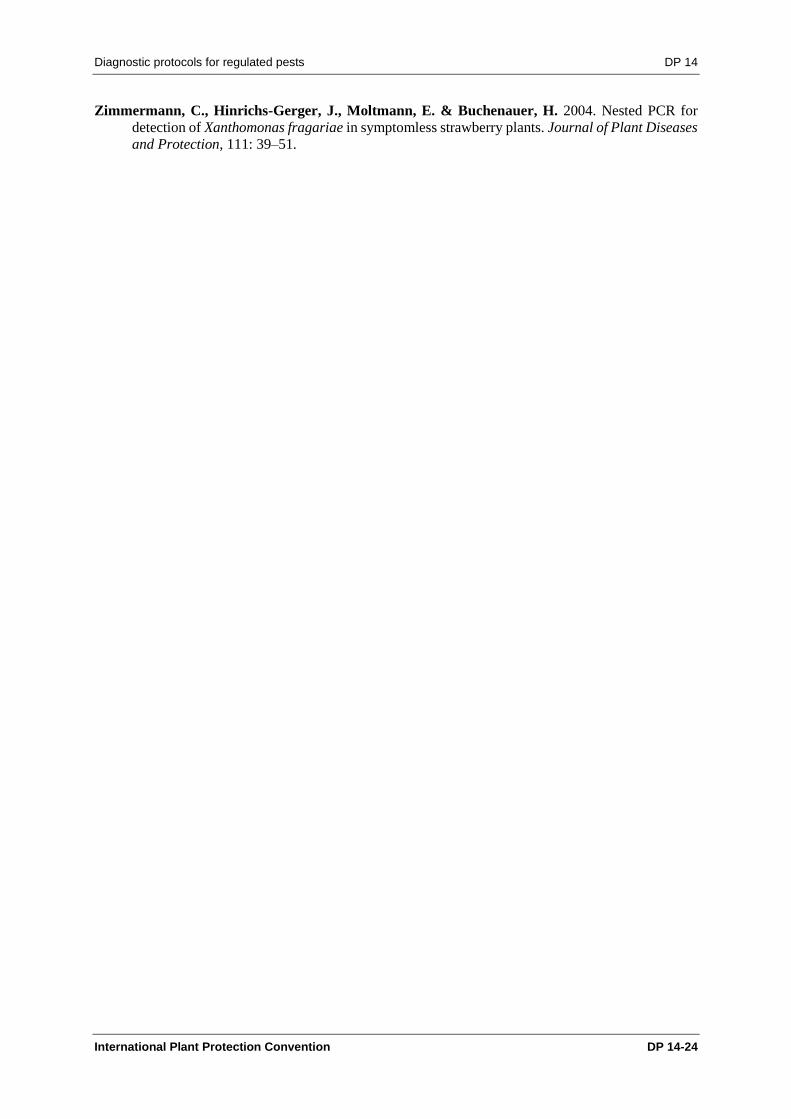
Diagnostic protocols for regulated pests DP 14
International Plant Protection Convention DP 14-24
Zimmermann, C., Hinrichs-Gerger, J., Moltmann, E. & Buchenauer, H. 2004. Nested PCR for
detection of Xanthomonas fragariae in symptomless strawberry plants. Journal of Plant Diseases
and Protection, 111: 39–51.
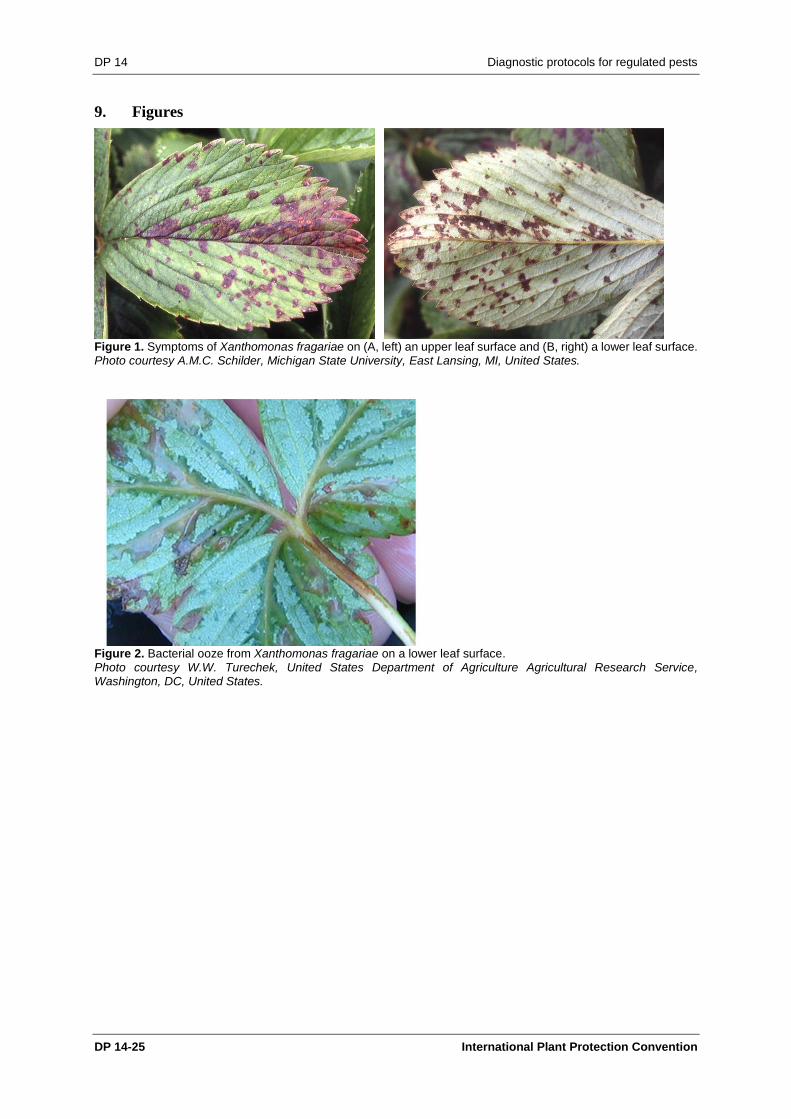
DP 14 Diagnostic protocols for regulated pests
DP 14-25 International Plant Protection Convention
9. Figures
Figure 1. Symptoms of Xanthomonas fragariae on (A, left) an upper leaf surface and (B, right) a lower leaf surface. Photo courtesy A.M.C. Schilder, Michigan State University, East Lansing, MI, United States.
Figure 2. Bacterial ooze from Xanthomonas fragariae on a lower leaf surface. Photo courtesy W.W. Turechek, United States Department of Agriculture Agricultural Research Service, Washington, DC, United States.
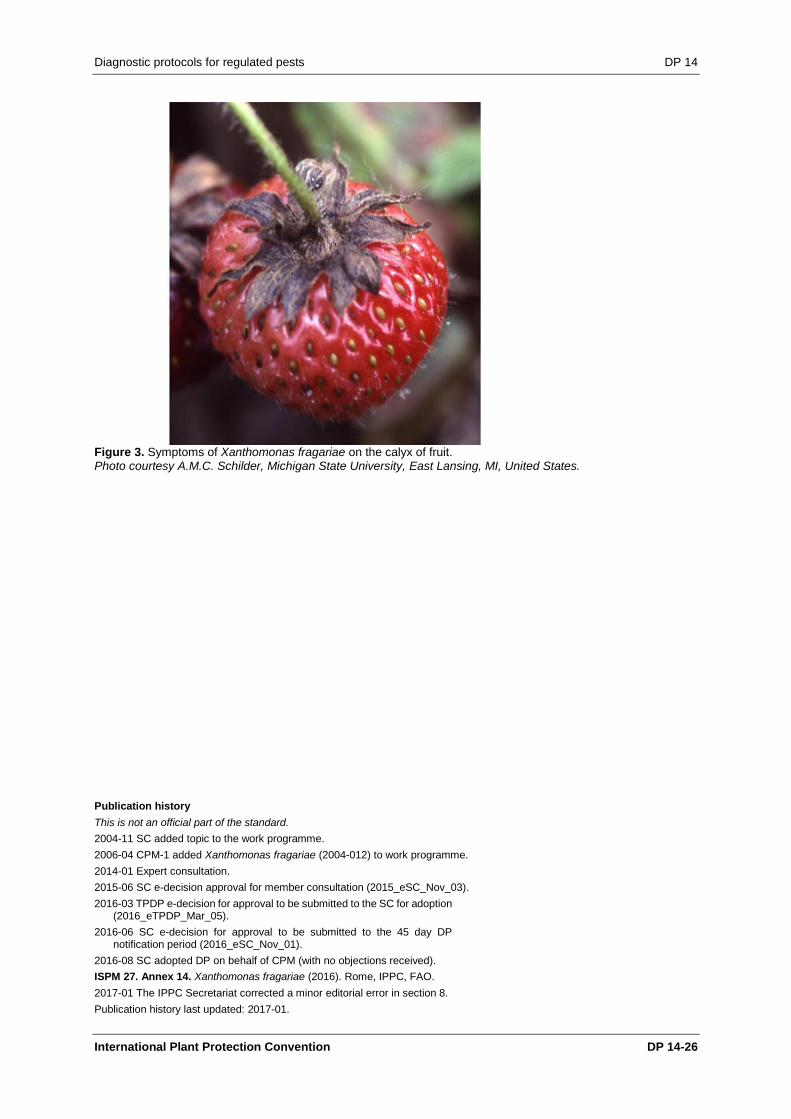
Diagnostic protocols for regulated pests DP 14
International Plant Protection Convention DP 14-26
Figure 3. Symptoms of Xanthomonas fragariae on the calyx of fruit. Photo courtesy A.M.C. Schilder, Michigan State University, East Lansing, MI, United States.
Publication history
This is not an official part of the standard.
2004-11 SC added topic to the work programme.
2006-04 CPM-1 added Xanthomonas fragariae (2004-012) to work programme.
2014-01 Expert consultation.
2015-06 SC e-decision approval for member consultation (2015_eSC_Nov_03).
2016-03 TPDP e-decision for approval to be submitted to the SC for adoption (2016_eTPDP_Mar_05).
2016-06 SC e-decision for approval to be submitted to the 45 day DP notification period (2016_eSC_Nov_01).
2016-08 SC adopted DP on behalf of CPM (with no objections received).
ISPM 27. Annex 14. Xanthomonas fragariae (2016). Rome, IPPC, FAO.
2017-01 The IPPC Secretariat corrected a minor editorial error in section 8.
Publication history last updated: 2017-01.

This page is intentionally left blank
IPPCThe International Plant Protection Convention (IPPC) is an international plant health agreement that aims to protect cultivated and wild plants by preventing the introduction and spread of pests. International travel and trade are greater than ever before. As people and commodities move around the world, organisms that present risks to plants travel with them.
Organization + There are over 180 contracting parties to the IPPC. + Each contracting party has a national plant protection
organization (NPPO) and an Official IPPC contact point. + Nine regional plant protection organizations (RPPOs) work
to facilitate the implementation of the IPPC in countries. + IPPC liaises with relevant international organizations to
help build regional and national capacities. + The Secretariat is provided by the Food and Agriculture
Organization of the United Nations (FAO).
International Plant Protection Convention (IPPC)
Viale delle Terme di Caracalla, 00153 Rome, Italy
Tel: +39 06 5705 4812 - Fax: +39 06 5705 4819
Email: [email protected] - Web: www.ippc.int


![Host–Pathogen Interactions between Xanthomonas fragariae ...€¦ · with F. ananassa [10]. F. vesca has a small genome size (approximately 240 Mb; 2n = 2x = 14) [11] and its full](https://img.pdfslide.us/doc/110x75/611648d6b5f43257362095a2/hostapathogen-interactions-between-xanthomonas-fragariae-with-f-ananassa.jpg)