Embed Size (px)
Citation preview
1
Peptide Biomarkers as Evidence of Perchlorate Biodegradation 1
Reema Bansal a, Ronald L. Crawford
a,b, and Andrzej J. Paszczynski
a,b* 2
a Environmental Biotechnology Institute, Environmental Science Program, University of Idaho, 3
Moscow, ID 83844 4
b Department of Microbiology, Molecular Biology and Biochemistry, University of Idaho, Moscow, ID 5
83844, USA 6
7
*Corresponding author: Environmental Biotechnology Institute and Department of Microbiology, 8
Molecular Biology and Biochemistry, University of Idaho, Moscow, ID 83844-1052, United States. 9
Phone: +1 (208) 885-6580; Fax: +1 (208) 885-5741. 10
E-mail addresses: [email protected] (Reema Bansal), [email protected] (R.L. Crawford), 11
[email protected] (A. J. Paszczynski) 12
13
14
Abstract 15
Perchlorate is a known health hazard for humans, fishes and other species. Therefore, it is important to 16
assess the response of an ecosystem exposed to perchlorate contamination. Data reported here show that a 17
liquid chromatography/mass spectrometry-based proteomics approach for detection of perchlorate-18
reducing enzymes can be used to measure the ability of microorganisms to degrade perchlorate, including 19
determining the current perchlorate degradation status. Signature peptides derived from chlorite dismutase 20
and perchlorate reductase can be used as biomarkers of perchlorate presence and biodegradation. Four 21
each of peptides derived from chlorite dismutase (CD) and perchlorate reductase subunit A (PcrA), and 22
seven peptides derived from perchlorate reductase subunit B (PcrB) were identified as signature 23
biomarkers for perchlorate degradation as these sequences are conserved in the majority of the pure and 24
mixed perchlorate-degrading microbial cultures examined. However, chlorite dismutase signature 25
biomarker peptides from Dechlormonas agitata CKB were found to be different from other cultures used 26
Copyright © 2010, American Society for Microbiology and/or the Listed Authors/Institutions. All Rights Reserved.Appl. Environ. Microbiol. doi:10.1128/AEM.01323-10 AEM Accepts, published online ahead of print on 29 November 2010
on April 24, 2019 by guest
http://aem.asm
.org/D
ownloaded from
2
and should also be included along with selected CD biomarkers. The combination of these peptides 27
derived from the two enzymes represents a promising perchlorate presence/biodegradation biomarker 28
system. The biomarker peptides were detected at perchlorate concentrations as low as 0.1 mM and at 29
different time-points in both pure cultures and within perchlorate-reducing environmental enrichment 30
consortia. The peptide biomarkers were also detected in the simultaneous presence of perchlorate and an 31
alternate electron acceptor, nitrate. We believe that this technique can be a useful for monitoring 32
bioremediation processes of other anthropogenic environmental contaminants with known metabolic 33
pathways. 34
35
Introduction 36
An assessment of the physiological state of an ecosystem is a useful tool for evaluating exposure to and 37
effects of an environmental contaminant. The physiological state of an ecosystem can be assessed by 38
measuring the changes in the autochthonous microbial community in response to a disturbance such as 39
contamination by heavy metals, organic and inorganic contaminants, or other xenobiotic substances. For 40
example, changes in the native microbial community’s structure and function reflected in changed rates of 41
biodegradation, biotransformation and bioaccumulation of contaminants by microbes can be early 42
indicators of how an ecosystem is adjusting to a given pollutant. These induced alterations in cellular or 43
biochemical components or processes in a microbial community can be measured and used as biological 44
markers to measure the ability of the ecosystem to respond to a pollutant (13,22) and can help to make 45
decision about extent and need of human involvement in the cleanup process. Because microbes adjust to 46
the environmental changes through modifications of their proteomes, the global analysis of microbial 47
proteins is an effective way to track subtle changes in a microbial community’s physiology and structure 48
if the functions of proteins are known and there is a metagenomic scaffold to identify the full-length 49
sequences. For example, it has been shown that perturbation of an ecosystem can modify indigenous 50
microbial protein sequences or induce expression, repression, degradation or overproduction of certain 51
on April 24, 2019 by guest
http://aem.asm
.org/D
ownloaded from
3
proteins. Therefore, analyses of microbial proteins (metaproteomics) can provide insight into the 52
dynamics of both pristine and perturbed biological systems (17,19). 53
54
Proteins as diagnostic biomarkers have been used and researched in the area of medical toxicology for 55
several years (24,37). The use of proteomics in environmental toxicology is also growing steadily. 56
Environmental toxicology studies thus far have focused mostly on effects of toxic chemicals on a variety 57
of biological systems including microorganisms (bacteria and fungi), vertebrates (fish and rodents), 58
invertebrates (insects, worms, and mollusks), and plants (1,3,6,16,25,27,28,32,34). The responses of these 59
organisms were determined by proteome comparisons between altered and control states, which led to the 60
identification of toxicity-associated protein biomarkers. 61
62
Here, we are reporting a new proteomics-based tool that can be used together with other chemical and 63
biomolecular methods available for developing an effective system for monitoring and measuring the 64
exposure of a given environment to perchlorate contamination and/or to determine the current perchlorate 65
degradation status. Perchlorate is a health hazard for humans, fishes and other species. In humans it 66
competitively inhibits iodine uptake by the thyroid gland and affects thyroid hormone synthesis 67
(9,29,31,35). Thyroid hormones are required for normal development in children and regulation of 68
metabolism in adults. In pregnant females destruction of thyroid function can affect the fetus and can lead 69
to delayed development, and decreased learning capability. Short-term exposure to high perchlorate doses 70
can result in eye and skin irritation, cough, nausea, vomiting and diarrhea (10,35). Perchlorate can impair 71
proper functioning of thyroid glands at concentrations as low as 24 ppb (12). Thus, it is important to 72
assess the ecological responses of environments where perchlorate contamination is known or suspected. 73
We believe that proteomics-based techniques can be useful for developing protein biomarkers for 74
monitoring the dynamics of perchlorate metabolic processes. We also believe that such an approach can 75
be used to develop protein biomarkers to monitor environmental responses to other anthropogenic 76
environmental contaminants with known metabolic pathways, leading to the future creation of peptide 77
on April 24, 2019 by guest
http://aem.asm
.org/D
ownloaded from
4
sequences library that can be used to monitor the fate and degradation dynamics of anthropogenic 78
chemicals in the Biosphere. 79
80
Several microorganisms are known to grow by anaerobic reductive dissimilation of perchlorate into 81
chloride using two essential enzymes, perchlorate reductase and chlorite dismutase (14). Perchlorate 82
reductase (PR) catalyzes the first step in the perchlorate reduction pathway and reduces perchlorate (ClO4
-83
) to chlorite (ClO2
-) and oxygen (O2) which is followed by disproportionation (dismutation) of toxic 84
chlorite into molecular oxygen and chloride by chlorite dismutase (CD). Work to date indicates that 85
perchlorate reductase is an inducible enzyme and is expressed only when an organism capable of 86
perchlorate-reduction is grown with perchlorate as the primary electron acceptor (14). The mechanism of 87
expression of chlorite dismutase is more variable and species specific. For example, in D. agitata strain 88
CKB chlorite dismutase is detectable under aerobic conditions, but its expression is up-regulated in the 89
presence of perchlorate; however, in Pseudomonas strain PDA and Pseudomonas strain PK CD is 90
constitutively expressed (14,36). CD, encoded by the cld gene, is unique and highly conserved in 91
dissimilatory perchlorate and chlorate reducing organisms (4,21), with low sequence similarity between 92
cld and any other sequence in GenBank (30). Both PR and CD satisfy the important attributes of a 93
biological marker. They are unique and specific for perchlorate, quantifiable, and since their synthesis is 94
induced or up-regulated in presence of perchlorate, the concentration of these proteins indicates the state 95
of perchlorate metabolism in a given environment (5). Thus, we suggest that amino acid sequences of 96
signature peptides from both enzymes can be used to indicate the presence of perchlorate contamination 97
and to detect and quantify perchlorate-degrading enzymes. 98
99
As reported here, we used a mass spectrometry (MS)-based proteomics approach to identify signature 100
peptides from known perchlorate degrading pure bacterial cultures (nine strains) and mixed-culture 101
environmental enrichment samples (three examples) grown under similar conditions. Specific CD and PR 102
on April 24, 2019 by guest
http://aem.asm
.org/D
ownloaded from
5
signature peptides common to all or a majority of the samples were selected as biomarkers to indicate the 103
presence of perchlorate degrading proteins. Previous research indicated a need for use of a number of 104
proteins as biomarkers for reliable results (19,33). Therefore, multiple signature peptides from both CD 105
and PR were chosen as primary biomarkers. To further validate the effectiveness and utility of the 106
selected biomarkers, one of the mixed culture samples (an aliquot of a biomass-covered activated carbon 107
matrix taken from a bioreactor being used to treat perchlorate contaminated drinking water) (7) was 108
chosen and the signature peptides were identified under a variety of growth conditions. We also examined 109
this sample to determine the potential of interference (repression) of perchlorate enzymes by the 110
alternative electron acceptor nitrate. 111
112
Materials and Methods 113
Microorganisms used and culture conditions 114
115
Pure bacterial cultures and environmental samples 116
The following perchlorate-degrading pure bacterial strains were used: Dechlorosoma sp. KJ (BAA 592) 117
(OD600: 0.53), Dechloromonas hortensis (DSMZ-No. 15637) (OD600: 0.78), Dechloromonas MissR 118
(OD600: 0.76) (courtesy of Dr. J. Coates, University of California Berkeley), Dechloromonas agitata CKB 119
(DSMZ-No. 13637) CKB (OD600: 0.52), Dechlorospirillum anomalous (NCCBNr 100047) (OD600: 0.46), 120
Azospira oryzae (DSMZ-No. 11199) (OD600: 0.54), and Azospira oryzae (= Dechlorosoma suillum) 121
(DSMZ-No. 13638) (OD600: 0.69). Two unidentified perchlorate-degrading pure strains previously 122
isolated in our laboratory were also used. Isolate “Bior” (OD600: 0.61) was purified from a bioreactor used to 123
treat perchlorate contaminated drinking water (7) and the isolate “Crw” was isolated from the Clearwater 124
River near Lewiston, Idaho. Bacterial strains were grown and maintained on the culture media 125
recommended by the culture collections from which the cultures were obtained. Dechloromonas MissR, 126
Bior, and Crw were maintained on R2A medium. The R2A medium (g/L) consists of 0.5g proteose 127
peptone, 0.5g casamino acids, 0.5g yeast extract, 0.5g dextrose, 0.5g soluble starch, 0.3g dipotassium 128
on April 24, 2019 by guest
http://aem.asm
.org/D
ownloaded from
6
phosphate, 0.3g sodium pyruvate, and 0.05g magnesium sulfate. Actively growing bacterial cells from log 129
phase cultures in maintenance media were used to inoculate ATCC 2106 liquid media containing 5 mM 130
ammonium perchlorate as the electron acceptor and 20 mM sodium acetate as electron donor. Three 131
mixed-culture microbiological samples included an aliquot of a biomass-covered activated carbon matrix 132
taken from a bioreactor being used to treat perchlorate contaminated drinking water (Bior enrichment) 133
(OD600: 0.59) (7), a sample of waste water taken from paper mill effluent treatment basin (Idaho, USA) 134
(Pt enrichment) (OD600: 0.43) and a biofilm sample taken from the rock in the Clearwater River near a 135
paper and pulp industry in Lewiston, Idaho (Crw enrichment) (OD600: 0.57). The samples were inoculated 136
and enriched in ATCC 2106 media supplemented with 5 mM ammonium perchlorate and 20 mM sodium 137
acetate. All the cultures (20 ml) were grown anaerobically in 25 ml gas tight anaerobic test tubes with 1 138
cm butyl rubber stoppers secured with aluminum crimp seals and incubated at room temperature without 139
shaking. Growth of cultures was measured by monitoring OD600. Majority of perchlorate reducing 140
microbes can also use oxygen as alternate electron acceptor and they are also microaerophilic in nature. 141
Therefore, there will not be significant dissolved oxygen concentration in the media and will not affect 142
the growth and activity of the microorganisms. 143
144
Detection of biomarkers in a mixed culture at different growth phases and concentrations of 145
perchlorate 146
The enrichment culture from the bioreactor sample was used to inoculate ATCC 2106 media with 5 mM 147
ammonium perchlorate and 20 mM sodium acetate and incubated anaerobically at room temperature 148
without shaking. Samples for mass spectrometric analysis were drawn from the culture at three different 149
time-points (early-log, mid-log and late-log phase) during the growth cycle. In a second set of 150
experiments, ATCC 2106 media was inoculated with enrichment culture from the bioreactor using 20 151
mM sodium acetate and four different concentration of ammonium perchlorate (0.1 mM, 0.5 mM, 1 mM, 152
and 2.5 mM). The cultures were also grown anaerobically at room temperature without shaking and 153
growth was measured by monitoring OD600. The different perchlorate concentrations were chosen for 154
on April 24, 2019 by guest
http://aem.asm
.org/D
ownloaded from
7
experimental purpose. There are not many documented sites as yet with perchlorate concentration higher 155
than 0.1 mM. The USEPA has reported ~10 sites with greater than 01. mM perchlorate in 2003 (14). But 156
our technique described is very sensitive and will be useful for sites with less than 0.1 mM perchlorate 157
concentration due to lower detection limit (10-15
mole of peptide per 2uL injection). 158
159
Detection of biomarker in a mixed culture in the simultaneous presence of perchlorate and nitrate 160
ATCC 2106 medium with 20 mM sodium acetate was inoculated with the bioreactor enrichment culture. 161
The following concentration combinations of ammonium perchlorate and sodium nitrate were used: (a) 162
1.25 mM perchlorate and 3.75 mM nitrate, (b) 1.67 mM perchlorate and 3.33 mM nitrate, (c) 2.5 mM 163
perchlorate and 2.5 mM nitrate, and (d) 5 mM nitrate (control). The cultures were grown anaerobically at 164
room temperature without shaking and growth was measured by monitoring OD600. Perchlorate and 165
nitrate concentrations were monitored at regular time intervals using negative electrospray ionization 166
mass spectrometry (ESI/MS). A Micromass Quattro II triple quadrupole mass spectrometer with 167
electrospray ionization source (Waters Corporation, Milford, MA, USA) was used for these analyses. The 168
instrument was controlled by MassLynx V4.0 software (Waters Corporation, Milford, MA, USA). The 169
mass spectrometer settings used were the same as described by (2). Perchlorate (m/z = 99.45) and nitrate 170
(m/z = 62) concentrations were determined by peak intensities in the total ion spectrum using standard 171
curves (perchlorate and nitrate) prepared by analysis of a range of known concentrations of pure standards 172
between 5 µM and 0.5 mM. All experiments were performed in triplicate. 173
174
Proteomics methods 175
176
Protein extraction and sequencing 177
Late-log phase cells, unless specified otherwise, were harvested from pure cultures and enrichments. The 178
volume (range 0.9 – 1.8 ml) was adjusted to normalize the samples with respect to their optical density 179
depending on the growth of the microorganism. The protein was extracted and digested using the method 180
on April 24, 2019 by guest
http://aem.asm
.org/D
ownloaded from
8
described by (2). Dry peptide samples were solubilized in 20 µL of H2O containing 5% acetonitrile and 181
0.1% formic acid, and spiked with 50 fmol/µL of bovine serum albumin peptides as the internal standard 182
(MassPREP BSA digestion standard, Waters Corporation, Milford, MA, USA). Samples were clarified by 183
centrifugation at 10,000 x g for 10 minutes just before mass spectral (MS) analysis. Peptides were then 184
separated and analyzed by a LC-MS method described by (2) with some modifications. Peptides in the 185
sample were separated using reverse phase liquid chromatography on a nanoACQUITY Ultra 186
Performance Liquid Chromatography (UPLC) system (Waters Corporation, Milford, MA, USA) and 187
analyzed using a Q-TOF Premier quadrupole time of flight tandem mass spectrometry system. Peptides 188
from two µL of sample hydrolysate was trapped onto a 0.18 mm x 20 mm Symmetry C18 trap column 189
(Waters Corp.) prior to injection onto the analytical column (0.075 mm x 200 mm (I) BEH 130 C18 190
nanoACQUITY UPLC column (Waters Corp.). Solvents used were 0.1% formic acid in H2O (solvent A) 191
and 0.1% formic acid in acetonitrile (solvent B). Peptides were trapped on the loading column using 192
100% solvent A at a flow rate of 5 µL min-1
for 3 minutes. Trapped peptides were then separated at a flow 193
rate of 0.4 µL min-1
using the following conditions: (1) isocratic: 94% solvent A and 6% solvent B for 1 194
minute; (2) gradient: 1 minute after injection, concentration of solvent A was decreased to 73% and 195
solvent B was increased to 27% over the next 70 minutes; (3) gradient: concentration of solvent A was 196
decreased to 43% and solvent B was increased to 57% over the next 20 minutes; (4) gradient: 197
concentration of solvent A was decreased to 10% and solvent B was increased to 90% over the next 10 198
minutes; (5) isocratic: 10% A and 90% B for 10 minutes; and (6) gradient: concentration of solvent A was 199
increased to 94% and solvent B was decreased to 6% over the next 10 minutes. The column effluent was 200
delivered directly to Q-TOF Premier using a nanospray source inlet. The nanosprayer was fitted with a 20 201
µm (i.d.) fused silica emitter tip. The following mass spectrometer settings were used; 3.80 kV capillary 202
voltage, 25 V cone voltage, 120°C source temperature, 0.45 bar sheath gas pressure, 5.0 V collision 203
energy and 2050 V detector voltage. The MS and UPLC were controlled by MassLynx 4.1 software 204
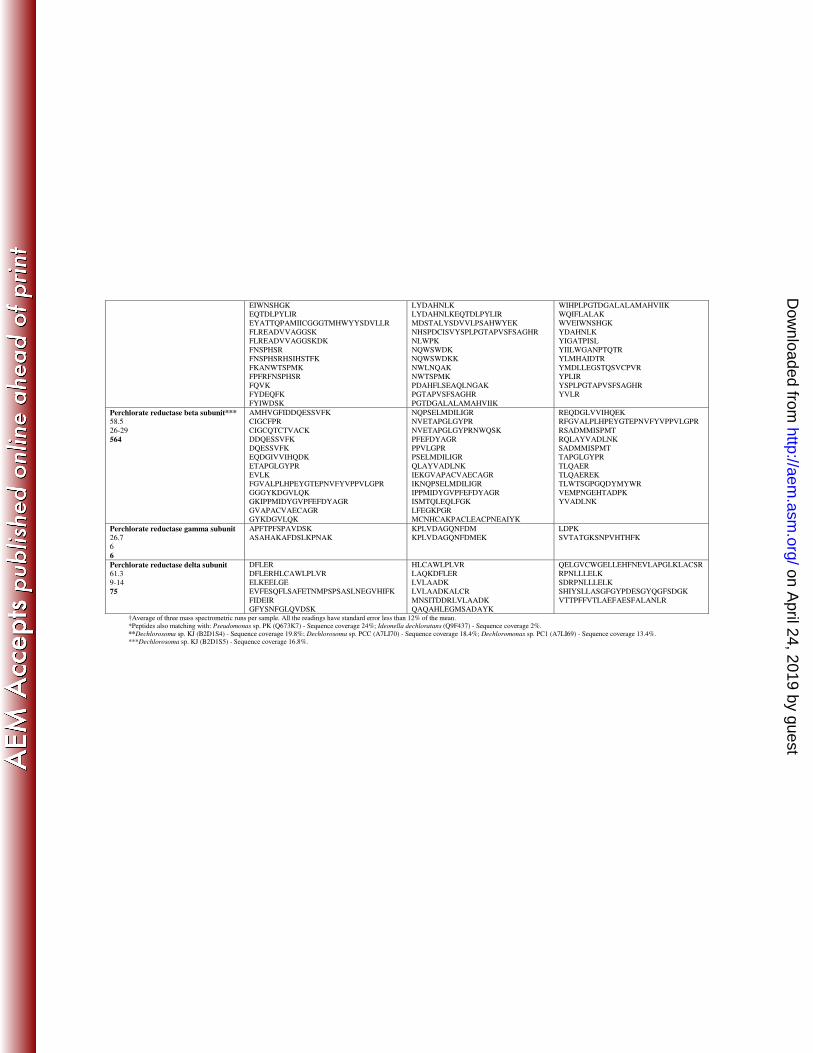
(Waters Corporation, Milford, MA, USA). LC/MSE mode of acquisition with alternating 1.5 seconds scan 205
of low (10 V) or high (15-40 V) collision energies were used to obtain both identification and 206
on April 24, 2019 by guest
http://aem.asm
.org/D
ownloaded from
9
quantification MS/MS information. A reference peptide (or lockmass) was sprayed simultaneously with 207
the LC effluent and was sampled for 1 sec every 30 sec. The lockmass standard used was human [glu1]-208
fibrinopeptide B (Sigma-Aldrich, St. Louis, MO). 209
210
Mass spectrometric data analysis 211
Data were analyzed as described by (2) with some modifications. ProteinLynx Global Server 2.3 (PLGS) 212
(Waters, Milford, MA, USA) was used for mass spectra analysis, peptide sequencing, protein 213
identification and quantification. Partial protein amino acid sequences were identified by searching a 214
custom database created in PLGS 2.3 using perchlorate reductase and chlorite dismutase amino acid 215
sequences obtained in our lab and from public database (downloaded from ExPASy Proteomics Server, 216
http://ca.expasy.org/). The amino acid sequence of the internal standard protein, bovine serum albumin 217
was also added to the database. The BSA concentration used was specified in the PLGS program. The 218
PLGS software quantifies the proteins by measuring and comparing the average MS signal response of 219
the three most intense tryptic peptides from BSA with other identified proteins. A fixed carbamidomethyl 220
C modification was used and only 1 missed trypsin cleavage site was allowed. 221
222
Results 223
224
Selection of protein biomarkers 225
The MS spectra obtained for the pure bacterial and environmental consortia samples were searched 226
against the custom database containing amino acid sequences of known perchlorate metabolizing 227
enzymes created in ProteinLynx Global Server; Protein Identity 2.3. The amino acid sequences (signature 228
peptides) from chlorite dismutase, perchlorate reductase subunit A and subunit B from all 12 samples 229
(Dechlorosoma sp. KJ, D. hortensis, D. MissR, D. agitata CKB, D. anomalous, A. oryzae (DSM-No. 230
11199), A. oryzae (DSM-No. 13638), Bior isolate, Crw isolate, Bior enrichment, Crw enrichment, and Pt 231
on April 24, 2019 by guest
http://aem.asm
.org/D
ownloaded from
10
enrichment culture) were compiled and analyzed. The amino acid sequences from CD, PcrA, and PcrB 232
which were detected in majority of samples were chosen to be used as biomarkers (Table 1). 233
234
None of the CD, PcrA and PcrB peptide biomarkers was detected that covered all the pure bacterial and 235
mixed-culture samples used in the study. The chlorite dismutase signature peptides GLETNSDFFFR, 236
GTILTQPGVFGVFTMFK, HKDNVLVDLYLTR, and YVIVIPVKK were detected in all the samples 237
except D. agitata CKB. Thus, any or all of the chosen CD signature peptides can be used as biomarkers. 238
In case of the perchlorate reductase A subunit, amino acid sequence MDSTALYSDVVLPSAHWYEK 239
was universally found in all samples except the Bior strain. Signature peptides DIAPMPNIPEYNPR, 240
EQTDLSYLVR, and YIILWGSNPTQTR were found in every sample except D. agitata CKB, Crw strain 241
and the Pt enrichment culture. For the perchlorate reductase B subunit, peptide NVETAPGLGYPR was 242
detected in all samples except the Crw strain. PcrB sequence IPLAQLEGLFGK was not found in D. 243
agitata CKB and the Pt enrichment culture. The signature peptides GKIPPMIDYGIPFEFDYAGR, 244
IEQGVAPACVAQCVGR, IPPMIDYGIPFEFDYAGR, VALPLHPEFGTEPNVFYVPPVLGPR, and 245
SAPNWDEDQGAGEYPNNSFFYLPR were detected in nine samples. The first four were absent in D. 246
agitata CKB, Crw strain and the Pt enrichment culture, while SAPNWDEDQGAGEYPNNSFFYLPR 247
was not found in D. agitata CKB, the Bior strain or the Pt enrichment culture. In case of perchlorate 248
reductase, a combination of any of the above signature peptides from PcrA and PcrB can be used as 249
biomarkers. The signature peptides of chlorite dismutase and perchlorate reductase in D. agitata CKB 250
were found to be different from majority of other perchlorate degrading microbial cultures. Therefore, a 251
different set of biomarkers for D. agitata, (listed in Table 2), should also be included along with selected 252
biomarkers. Any combination of the CD, PcrA and PcrB signature peptide listed in table 2 can be used as 253
biomarker for D. agitata, since all the peptides were detected universally within the similar concentration 254
range. 255
256
Validation and quantification of biomarkers 257
on April 24, 2019 by guest
http://aem.asm
.org/D
ownloaded from
11
The presence of the selected CD and Pcr biomarkers was tested when a representative mixed-culture 258
sample (Bior enrichment culture) was grown under different growth conditions (Table 3): a) different 259
time-points during the growth cycle; b) different concentrations of perchlorate; and c) in presence of an 260
alternative/competing electron acceptor, nitrate. The chlorite dismutase and perchlorate reductase 261
biomarkers detected under the aforesaid conditions were also quantified using the LC/MSE mode of data 262
acquisition on the Q-TOF mass spectrometer (Table 3). 263
264
In the early-log phase of the growth cycle we detected all four of the selected CD signature biomarkers 265
with the mean concentration of 285 ng/mg of total protein. We also detected all the selected PcrA and 266
PcrB subunit biomarkers with the mean concentration of 1051 ng/mg and 268 ng/mg of the total protein, 267
respectively. In the mid-log phase of the growth cycle the mean concentration for CD (271 ng/mg) and 268
PcrB (225 ng/mg) peptides did not change much; however, the mean concentration for PcrA peptides 269
(646 ng/mg) decreased ~38% as compared to the early-log phase. In the late-log phase all the selected CD 270
and PcrB biomarkers were detected with mean concentrations of 342 ng/mg and 243 ng/mg of total 271
protein, respectively. Only one peptide for PcrA, YIILWGSNPTQTR, was detected with a mean 272
concentration of 317 ng/mg, which is ~50% of the concentration detected at the mid-log phase (figure 1). 273
274
The signature peptides from both CD and PcrA and PcrB were detected at several different perchlorate 275
concentrations (0.1 mM, 0.5 mM, 1 mM, and 2.5 mM) (Table 3). The growth of the Bior enrichment 276
culture on different perchlorate concentrations is shown in Figure 1. At 0.1 mM perchlorate, we detected 277
one peptide biomarker each of CD (GTILTQPGVFGVFTMFK) and PcrA (YIILWGSNPTQTR) with 278
mean concentration of 641 ng/mg and 1203 ng/mg of total protein, respectively. The signature biomarker 279
sequences from PcrB were also found with a mean concentration of 816 ng/mg of total protein. With a 0.5 280
mM perchlorate concentration, three biomarkers each of CD and PcrA were identified. The concentration 281
of CD and PcrA peptides was increased to 1237 ng/mg and 1459 ng/mg of total protein, respectively. For 282
PcrB, we detected five peptide biomarkers with a mean concentration of 774 ng/mg of total protein. At 1 283
on April 24, 2019 by guest
http://aem.asm
.org/D
ownloaded from
12
mM perchlorate concentration all the above selected CD, PcrA and PcrB signature peptides were detected 284
with mean concentration of 1353 ng/mg, 1645 ng/mg, and 683 ng/mg of total protein, respectively. 285
Microbial cultures growing on perchlorate concentrations lower than 0.1 mM were not used for analysis 286
as the cellular biomass was not sufficient for proteomic experiments. 287
288
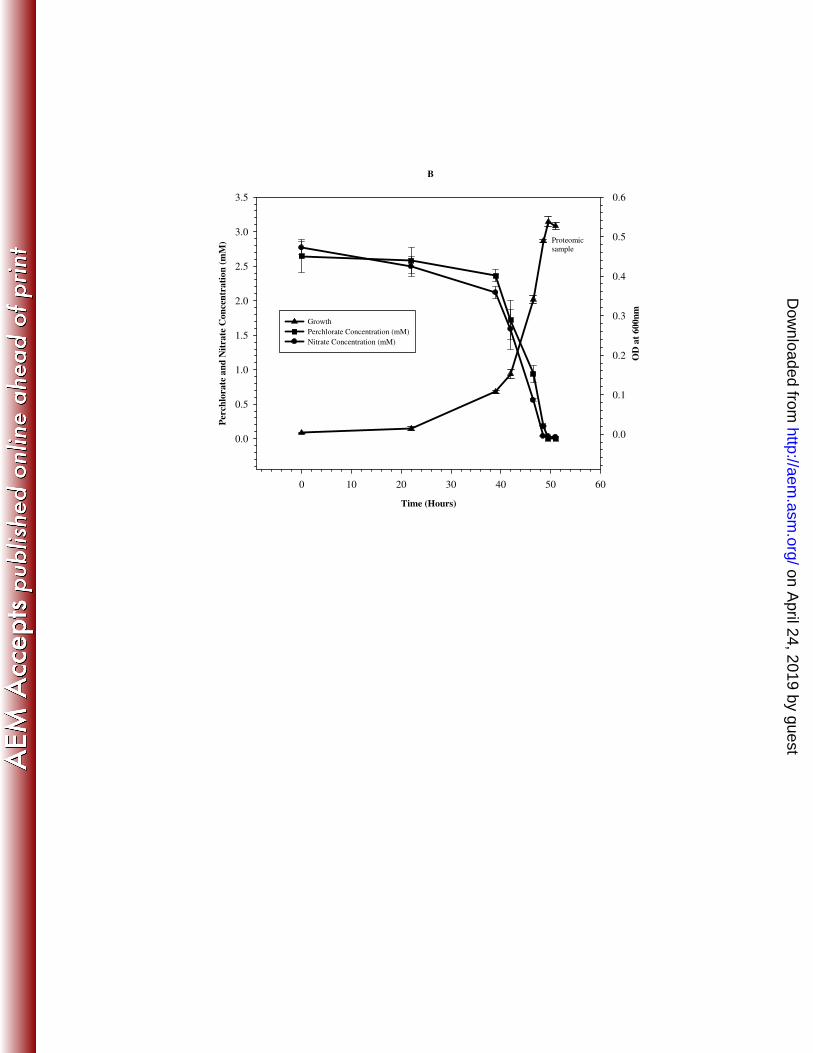
Perchlorate and nitrate degradation by the Bior enrichment culture were monitored along with its growth 289
(Figures 2a and 2b). It was observed that both perchlorate and nitrate were removed simultaneously by 290
the Bior enrichment culture at all the different concentration combinations of these electron acceptors 291
used. Results indicated that the signature biomarkers from CD, PcrA and PcrB were detected even in the 292
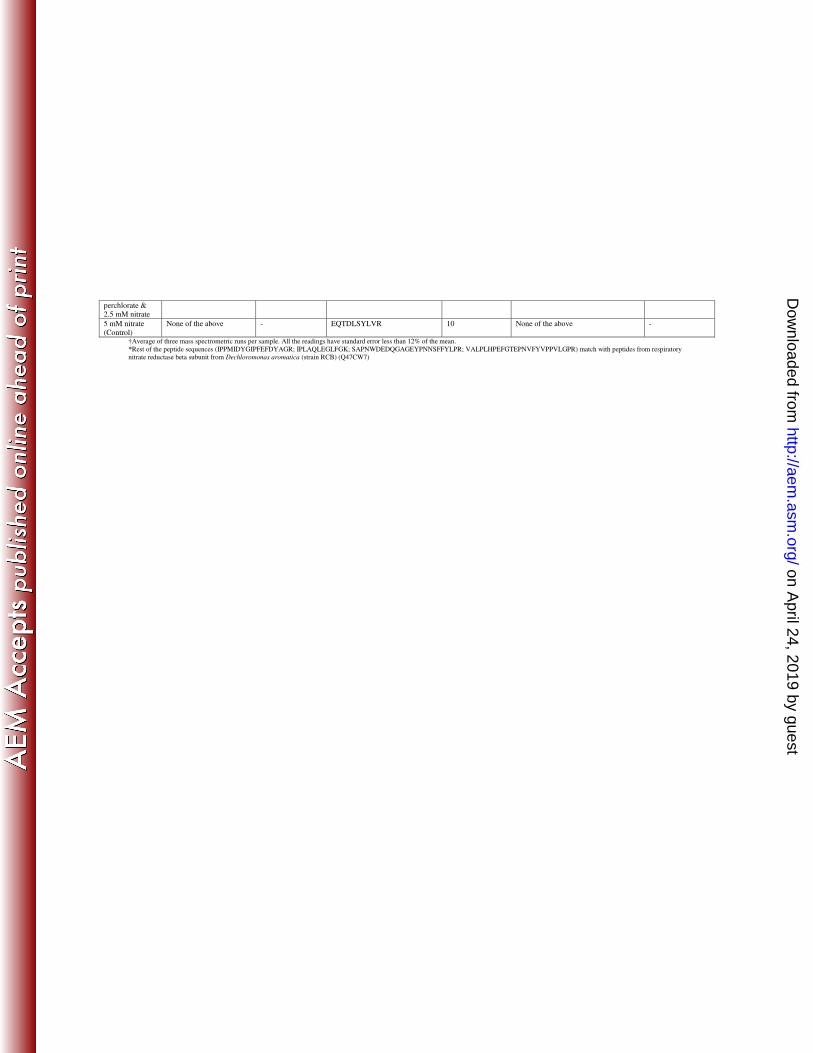
presence of nitrate (Table 3). At 1.25 mM perchlorate and 3.75 mM nitrate (combination a) we detected 293
all selected CD and PcrA and two PcrB biomarkers with mean concentrations of 410 ng/mg, 1213 ng/mg 294
and 655 ng/mg of total protein, respectively. Similarly, CD, PcrA and PcrB biomarker peptides were 295
obtained for 1.67 mM perchlorate and 3.33 mM nitrate (combination b) and 2.5 mM perchlorate and 2.5 296
mM nitrate (combination c) experimental sets. For the (b) combination set, the mean concentration for 297
CD was found to be 725 ng/mg. PcrA was 1431 ng/mg and PcrB was 622 ng/mg of total protein. And for 298
the (c) combination set, the mean concentration for CD was found to be 160 ng/mg. PcrA was 613 ng/mg 299
and PcrB was 227 ng/mg of total protein. The results showed that the PcrB peptides 300
IEQGVAPACVAQCVGR and NVETAPGLGYPR are unique to perchlorate reductase while other 301
chosen signature peptides from PcrB (GKIPPMIDYGIPFEFDYAGR, IPLAQLEGLFGK, 302
IPPMIDYGIPFEFDYAGR, SAPNWDEDQGAGEYPNNSFFYLPR, and 303
VALPLHPEFGTEPNVFYVPPVLGPR) matched with beta subunit of respiratory nitrate reductase. At 5 304
mM nitrate only (control), as expected no chlorite dismutase and PcrB (IEQGVAPACVAQCVGR, and 305
NVETAPGLGYPR) biomarkers were detected. However, one peptide from PcrA with negligible mean 306
concentration was detected, which could be due to possible cross contamination of chromatography 307
column from the previous sample. The signature peptides from respiratory nitrate reductase beta subunit 308
and periplasmic nitrate reductase with their mean concentration are listed in Table 4 (supplemental 309
on April 24, 2019 by guest
http://aem.asm
.org/D
ownloaded from
13
material) for reference. No similarity was found between the amino acid sequences from perchlorate 310
reductase beta subunit and periplasmic nitrate reductase. 311
312
Discussion 313
Microbial proteins are the best indicator of the functional changes in microbial communities or pure 314
cultures because there is a direct association between chemical exposure and changes in microbial cellular 315
components, especially enzymes of biotransformation pathway. Proteins control the real-time metabolic 316
processes within microbial systems and provide a dynamic picture of the systems and how they are 317
adjusting to environmental changes. Protein biomarkers can provide insight into both the occurrence of 318
perchlorate contamination as well as the current perchlorate degradation status. In the work described 319
here we used a mass spectrometry based method to identify signature peptides from the enzymes involved 320
in the bacterial perchlorate degradation pathway for development of the biomarkers that can be used to 321
monitor processes of perchlorate metabolism in cultures and eventually contaminated sites. Mass 322
spectrometry along with an LC/MSE mode of acquisition is a sensitive method, which can detect minute 323
concentrations of analytes (10-15
M) and quantify these even at these very low concentrations. This 324
includes not only pollutants, but also proteins involved in pollutant degradation. 325
326
Chlorite dismutase (CD) and perchlorate reductase (Pcr) are the two enzymes that are known to catalyze 327
perchlorate degradation in bacteria. Both enzymes are unique to perchlorate degradation. Perchlorate 328
reductase consists of four subunits (PcrA, PcrB, PcrC and PcrD) and is encoded by the pcrABCD operon. 329
Purified Pcr contains two structural subunits, PcrA and PcrB that are involved in electron transfer. The 330
PcrC subunit functions as a c-type cytochrome and is lost during the purification of the enzyme. The PcrD 331
subunit functions as a chaperone and is not a part of the active enzyme (14). During our analyses, we 332
detected very few signature peptides from PcrC and PcrD. Also, even these few sequences were not found 333
consistently in all the samples. Therefore, we used signature peptides from chlorite dismutase and 334
perchlorate reductase alpha and beta subunits as biomarkers of the perchlorate reduction pathway. Use of 335
on April 24, 2019 by guest
http://aem.asm
.org/D
ownloaded from
14
two proteins for development of biomarkers provides a group of peptides which will act as reliable 336
indicators of the presence of the perchlorate pathway that complement and support each other. 337
338
We detected four chlorite dismutase signature peptides which were found to be conserved in all the 339
microbial cultures examined, except D. agitata CKB. The chlorite dismutase sequences obtained from D. 340
agitata CKB were different from other dissimilatory perchlorate-reducing microbial samples used in this 341
study and no common peptide that included this bacterium was detected. D. agitata CKB was found to 342
have signature peptides common with Pseudomonas sp. PK (Q673K7) and Ideonella dechloratans 343
(Q9F437) (Table 2). We compared and aligned the CD amino acid sequence from D. agitata CKB 344
(AAM92878) with other available chlorite dismutase sequences from Dechlorosoma sp. KJ (EU571095), 345
D. hortensis (EU436747), and D. aromatica (CP000089.1) using ClustalX 2.0 (Figure 3). The sequences 346
were compared without signal peptide sequences, as these are not a part of the functional enzyme. The 347
results indicated only 62-63% amino acid sequence identity between D. agitata CKB and other sequences 348
compared. Although there are some homology between the compared sequences but the homologous 349
peptides were not detected by mass spectrometry, which could be due to nature of the peptide, trypsin 350
cleavage specificity, or MS-ESI source ionization efficiency. Therefore, the presence of biomarker 351
peptides from D. agitata CKB listed in Table 2 should also be tested along with the four aforesaid CD 352
biomarkers for a given system. In case of perchlorate reductase, we detected and selected four PcrA and 353
seven PcrB signature biomarkers that were conserved in majority of the microbial cultures used. Results 354
indicate that perchlorate reductase peptide sequences are less conserved among dissimilatory perchlorate-355
reducing microorganisms as compared to chlorite dismutase. We found four microbial samples (D. 356
agitata CKB, Bior strain, Crw strain, and the Pt enrichment culture) that were missing one or more of the 357
selected PcrA and PcrB biomarkers. It is known that D. agitata CKB clusters with β-Proteobacteria 358
group on 16S rRNA gene trees, but is placed away from that cluster on the cld tree when all available 359
partial and complete chlorite dismutase nucleotide sequences are compared (4) (unpublished results). 360
Therefore, differences in CD and PcrA and PcrB amino acid sequences between D. agitata CKB and 361
on April 24, 2019 by guest
http://aem.asm
.org/D
ownloaded from
15
other samples support the idea of a separate path of evolution of the perchlorate degradation pathway in 362
D. agitata CKB as compared to other perchlorate-reducing microbes. In future as more perchlorate-363
reducing strains, degradation pathway and enzyme homologs will be discovered there will be a need to 364
introduce and use different sets of biomarkers depending on peptide sequence similarity and divergence. 365
However, the basic premise of using peptide biomarkers will not change. To validate our results, all listed 366
CD, PcrA, and PcrB signature biomarkers were examined in a pure bacterial culture (Dechlorosoma sp. 367
KJ) by targeting the chosen peptide sequences on the basis of the m/z value in the spectra (data not 368
shown). Our conclusion is that the presence of any or combination of the selected microbial peptide 369
biomarkers derived from chlorite dismutase and perchlorate reductase alpha and beta subunits in a given 370
culture and most likely ecosystem sample will indicate the presence of perchlorate contamination and 371
microbial reduction of perchlorate. Our results also indicate that the peptide biomarkers should be chosen 372
carefully as there will be microorganisms that have evolved unique sets of proteins to perform the same 373
metabolic pathway. Hence, known unique sets of biomarker peptides should be included in any 374
environmental study. Similarly, identification of a strain on the basis of unique signature peptides should 375
be done with caution. 376
377
To further assess and confirm the utility of the selected CD and Pcr biomarkers, we detected and 378
quantified their presence under different growth conditions. A perchlorate degrading mixed-culture 379
sample, the Bior enrichment, was selected to be representative of a natural microbial consortium. In the 380
first set of experiments, we tested the presence of biomarkers at different time-points during the growth 381
cycle of the enrichment to make sure that they were detected throughout the cycle, and their detection was 382
not affected or dependent on the time of sample collection. The results indicated that all the chosen CD, 383
PcrA and PcrB biomarkers were present at all the chosen time-points during the growth cycle; however, 384
we detected only one peptide of PcrA in late-log growth phase. This may be because the other perchlorate 385
reductase subunits are turned over faster in an aging culture. This was also evident by the mean 386
concentration of PcrA obtained (Table 3). The concentration of CD biomarkers remained almost constant 387
on April 24, 2019 by guest
http://aem.asm
.org/D
ownloaded from
16
throughout the log-phase of the growth cycle, which indicates that chlorite dismutase was expressed 388
constitutively throughout this phase. In a second experiment we used different concentrations of 389
perchlorate to determine the lowest concentration at which selected CD, PcrA and PcrB biomarkers could 390
be detected. Perchlorate concentrations ranging from 0.1 mM to 2.5 mM were used. Microbial growth 391
was observed at perchlorate concentrations lower than 0.1 mM, but sufficient cellular biomass for 392
proteomic analysis was not produced in this experiment. However, required biomass for environmental 393
proteomics can be obtained by using large culture volumes as we have demonstrated in our previous work 394
on methanotrophs. We reported that only ~1000 cells from a pure culture and ~10,000 cells from a 395
complex sample are required for detection of methane monooxygenase peptides using MS/MS (23). 396
Results showed that as the perchlorate concentration increased microbial growth and the number and 397
concentration of certain signature biomarkers detected also increased; however, the concentration of PcrB 398
biomarkers showed a reverse trend as compared to PcrA biomarkers. This could be due to nature of 399
peptides derived from PcrB which will affect their stability, extraction and ionization efficiency during 400
processing and MS/MS analysis, or the relation between these two subunits is more complex than 401
research of Kengen et al. (15) and Gu et al. (14) suggest. From their research the concentration of PcrB 402
peptides should follow the similar trend as PcrA peptides as these subunits are closely associated and are 403
translocated together and found as heterodimers (αβ). 404
405
To evaluate the effect of presence of nitrate on the detection of CD and Pcr biomarkers, the Bior 406
enrichment was grown with varying concentrations of two electron acceptors (ammonium perchlorate and 407
sodium nitrate). It has been shown in previous studies that many of the dissimilatory perchlorate-reducing 408
microorganisms use nitrate as an alternate electron acceptor even in the presence of perchlorate (8,11). 409
The results show that the Bior enrichment culture, a known perchlorate degrading consortium, can use 410
both the electron acceptors simultaneously irrespective of their concentrations used in the study. The 411
detection of selected signature biomarkers from CD, PcrA, and PcrB was not affected by the presence of 412
nitrate. However, we found that five out of seven selected PcrB biomarkers were similar to beta subunit 413
on April 24, 2019 by guest
http://aem.asm
.org/D
ownloaded from
17
of respiratory nitrate reductase. Both perchlorate and nitrate reductase belong to dimethyl sulfoxide 414
(DMSO) reductase family of enzymes and require molybdenum as a cofactor. It is known from previous 415
research that enzymes from DMSO reductase family are highly similar to each other (18). Therefore, the 416
two unique PcrB biomarkers should always be used when nitrate is present in the system. This 417
proteomics-based biomarker approach is thus particularly useful as it can simultaneously detect signature 418
peptides from multiple enzymes in a system where multiple metabolic pathways function simultaneously 419
as in our example of perchlorate reductase along with nitrate and nitrite reductases. 420
421
Previous studies have reported methods to detect and quantify perchlorate-reducing bacteria by targeting 422
either of the two central genes or enzymes (chlorite dismutase, cld; and perchlorate reductase, pcr) 423
involved in the perchlorate degradation pathway. O’Connor et al. (21) and Bender et al. (4) described a 424
detection method for perchlorate reducers by using an immunoprobe and genetic probes targeting the 425
chlorite dismutase enzyme and gene, respectively. Nozawa-Inoue et al. (20) reported a quantitative 426
detection method using real-time PCR (qPCR) targeting the perchlorate reductase gene (pcrA). However, 427
our present research indicates that even though the chlorite dismutase sequence is highly conserved, there 428
will be some exceptions. Also, it is known that chlorite dismutase is not unique to perchlorate reducers 429
and is found also in chlorate reducing microorganisms. Similarly, use of perchlorate reductase alone can 430
also lead to biased results as the Pcr sequence is not highly conserved among perchlorate-reducing 431
microbes and is similar to other DMSO reductases, as described above. Therefore, we highly recommend 432
using peptide biomarkers from both the enzymes simultaneously for reliable interpretation of results. Use 433
of real-time PCR for detection and quantification of perchlorate reducing genes offer advantage of nucleic 434
acid amplification but can lead to biased results. PCR results are affected by the primer design and 435
specificity, amplification reaction efficiency, DNA purity and quality of cDNA (26). On the other hand, 436
protein biomarker detection system using mass spectrometry overcomes the PCR biases, is sensitive, 437
direct protein detection technique, that provides qualitative and quantitative information about the 438
metabolic processes, but is limited by the availability of given protein sequences in the database. The 439
on April 24, 2019 by guest
http://aem.asm
.org/D
ownloaded from
18
other limitations include: knowledge of the key proteins involved in the pathway of interest, existence of 440
unique and diagnostic peptides, and certain volume and biomass requirement. 441
442
The biomarker system developed here shows promise as a tool in the management of environmental 443
restoration activities such as microbially augmented bioremediation and/or monitored natural attenuation. 444
The biomarker-based monitoring system to this point has only been tested in the laboratory using both 445
pure cultures and model natural consortia. Thus, it requires validation using samples collected from field 446
locations such as subsurface biofilms found within perchlorate-contaminated aquifers or streams down 447
gradient from point source contamination by perchlorate. The system also can be extended to the study of 448
other xenobiotic contaminants of environmental health concern where biodegradation pathways are well 449
understood. 450
451
Acknowledgment We thank Dr. Lee A. Deobald for assistance with liquid chromatography/mass 452
spectrometry system. We also thank Stephanie Smith for providing Bior and Crw isolates for this study. 453
The presented research results are based upon work supported by the US Army Corps of Engineers, 454
Humphreys Engineering Center Support Activity under Contract No. W912HQ-07-C-0014. VIEWS, 455
OPINIONS, AND/OR FINDINGS CONTAINED IN THIS REPORT ARE THOSE OF THE 456
AUTHOR(S) AND SHOULD NOT BE CONSTRUED AS AN OFFICIAL DEPARTMENT OF 457
DEFENSE POSITION OR DECISION UNLESS SO DESIGNATED BY OTHER OFFICIAL 458
DOCUMENTATION. 459
460
References 461
1. Bae, H. and R. Sicher. 2004. Changes of soluble protein expression and leaf metabolite levels in 462
Arabidopsis thaliana grown in elevated atmospheric carbon dioxide. Field Crop.Res. 90:61-73. 463
2. Bansal, R., L. A. Deobald, R. L. Crawford, and A. J. Paszczynski. 2009. Proteomic detection 464
of proteins involved in perchlorate and chlorate metabolism. Biodegradation. 20:603-620. 465
on April 24, 2019 by guest
http://aem.asm
.org/D
ownloaded from
19
3. Bar, C., R. Patil, J. Doshi, M. J. Kulkarni, and W. N. Gade. 2007. Characterization of the 466
proteins of bacterial strain isolated from contaminated site involved in heavy metal resistance--a 467
proteomic approach. J.Biotechnol. 128:444-451. 468
4. Bender, K. S., M. R. Rice, W. H. Fugate, J. D. Coates, and L. A. Achenbach. 2004. Metabolic 469
primers for detection of (Per)chlorate-reducing bacteria in the environment and phylogenetic 470
analysis of cld gene sequences. Appl.Environ.Microbiol. 70:5651-5658. 471
5. Benninghoff, A. D. 2007. Toxicoproteomics--the next step in the evolution of environmental 472
biomarkers. Toxicol.Sci. 95:1-4. 473
6. Bestel-Corre, G., S. Gianinazzi, and E. Dumas-Gaudot. 2004. Impact of sewage sludges on 474
Medicago truncatula symbiotic proteome. Phytochemistry 65:1651-1659. 475
7. Brown, J., C. Lauderdale, E. Morgenroth, and L. Raskin. 2007. Direct fixed-bed biological 476
perchlorate destruction demonstration. SERDP and ESTCP's Partners in Environmental 477
Technology Technical Symposium & Workshop, Washington, D.C. 478
8. Bruce, R. A., L. A. Achenbach, and J. D. Coates. 1999. Reduction of (per)chlorate by a novel 479
organism isolated from paper mill waste. Environ.Microbiol. 1:319-329. 480
9. Clark, J. J. 2000. Toxicology of perchlorate, p. 15-29. In: E. T. Urbansky (ed.), Perchlorate in 481
the Environment. Kluwer Academic/Plenum Publishers, New York. 482
10. CLU-IN (The Contaminated Site Clean-Up Information). 2010. Perchlorate Toxicology. 483
http://www.clu-in.org/contaminantfocus/default.focus/sec/perchlorate/cat/toxicology/. 484
11. Coates, J. D., U. Michaelidou, R. A. Bruce, S. M. O'Connor, J. N. Crespi, and L. A. 485
Achenbach. 1999. Ubiquity and diversity of dissimilatory (per)chlorate-reducing bacteria. 486
Appl.Environ.Microbiol. 65:5234-5241. 487
12. EWG (Environmental Working Group). 2008. Is toxic perchlorate in Utah's food? 488
http://www.ewg.org/node/25973. 489
13. Gil, F. and A. Pla. 2001. Biomarkers as biological indicators of xenobiotic exposure. Journal of 490
Applied Toxicology 21:245-255. 491
on April 24, 2019 by guest
http://aem.asm
.org/D
ownloaded from
20
14. Gu, B. and J. D. Coates. 2006. Perchlorate environmental occurrence, interactions and 492
treatment. Springer Science and Business Media, Inc, New York. 493
15. Kengen, S. W. M., G. B. Rikken, W. R. Hagen, C. G. van Ginkel, and A. J. M. Stams. 1999. 494
Purification and characterization of (per)chlorate reductase from the chlorate-respiring strain GR-495
1. Journal of Bacteriology 181:6706-6711. 496
16. Kusch, H., S. Engelmann, D. Albrecht, J. Morschhauser, and M. Hecker. 2007. Proteomic 497
analysis of the oxidative stress response in Candida albicans. Proteomics. 7:686-697. 498
17. Lopez-Barea, J. and J. L. Gomez-Ariza. 2006. Environmental proteomics and metallomics. 499
Proteomics. 6 Suppl 1:S51-S62. 500
18. Mcewan, A. G., J. P. Ridge, C. A. McDevitt, and P. Hugenholtz. 2002. The DMSO reductase 501
family of microbial molybdenum enzymes; Molecular properties and role in the dissimilatory 502
reduction of toxic elements. Geomicrobiology Journal 19:3-21. 503
19. Nesatyy, V. J. and M. J. F. Suter. 2007. Proteomics for the analysis of environmental stress 504
responses in organisms. Environ.Sci.Technol. 41:6891-6900. 505
20. Nozawa-Inoue, M., M. Jien, N. S. Hamilton, V. Stewart, K. M. Scow, and K. R. Hristova. 506
2008. Quantitative detection of perchlorate-reducing bacteria by real-time PCR targeting the 507
perchlorate reductase gene. Appl.Environ.Microbiol. 74:1941-1944. 508
21. O'Connor, S. M. and J. D. Coates. 2002. Universal immunoprobe for (per)chlorate-reducing 509
bacteria. Appl.Environ.Microbiol. 68:3108-3113. 510
22. Ogunseitan, O. A. 2000. Microbial proteins as biomarkers of ecosystem health, p. 207-222. In: 511
K. M. Scow, G. E. Fogg, D. E. Hinton, and M. L. Johnson (eds.), Integrated Assessment of 512
Ecosystem Health . CRC Press LLC, Boca Raton, FL. 513
23. Paidisetti, R. 2007. Ecoproteomic and ecogenomic approaches to monitor microbial activity in a 514
subsurface aquifer and effect of compost infusion enrichment on bacterial community structure of 515
polycylic aromatic hydrocarbon contaminated soils. Master's Thesis, Department of 516
Microbiology, Molecular Biology and Biochemistry, University of Idaho, Moscow. 517
on April 24, 2019 by guest
http://aem.asm
.org/D
ownloaded from
21
24. Petricoin, E. F., A. M. Ardekani, B. A. Hitt, P. J. Levine, V. A. Fusaro, S. M. Steinberg, G. 518
B. Mills, C. Simone, D. A. Fishman, E. C. Kohn, and L. A. Liotta. 2002. Use of proteomic 519
patterns in serum to identify ovarian cancer. Lancet 359:572-577. 520
25. Rodriguez-Ortega, M. J., B. E. Grosvik, A. Rodriguez-Ariza, A. Goksoyr, and J. Lopez-521
Barea. 2003. Changes in protein expression profiles in bivalve molluscs (Chamelea gallina) 522
exposed to four model environmental pollutants. Proteomics. 3:1535-1543. 523
26. SA Biosciences. Designing and validating real-time PCR primers: systematic guidelines. 524
Pathways (7). 2008. 525
27. Shepard, J. L., B. Olsson, M. Tedengren, and B. P. Bradley. 2000. Protein expression 526
signatures identified in Mytilus edulis exposed to PCBs, copper and salinity stress. 527
Mar.Environ.Res. 50:337-340. 528
28. Shrader, E. A., T. R. Henry, M. S. Greeley, Jr., and B. P. Bradley. 2003. Proteomics in 529
zebrafish exposed to endocrine disrupting chemicals. Ecotoxicology 12:485-488. 530
29. Smith, P. N., C. W. Theodorakis, T. A. Anderson, and R. J. Kendall. 2001. Preliminary 531
assessment of perchlorate in ecological receptors at the Longhorn Army Ammunition Plant 532
(LHAAP), Karnack, Texas. Ecotoxicology 10:305-313. 533
30. Streit, B. R. and J. L. DuBois. 2008. Chemical and steady-state kinetic analyses of a 534
heterologously expressed heme dependent chlorite dismutase. Biochemistry 47:5271-5280. 535
31. Theodorakis, C., J. Rinchard, T. Anderson, F. Liu, J. W. Park, F. Costa, L. Mcdaniel, R. 536
Kendall, and A. Waters. 2006. Perchlorate in fish from a contaminated site in east-central 537
Texas. Environmental Pollution 139:59-69. 538
32. Vido, K., D. Spector, G. Lagniel, S. Lopez, M. B. Toledano, and J. Labarre. 2001. A 539
proteome analysis of the cadmium response in Saccharomyces cerevisiae. J.Biol.Chem. 540
276:8469-8474. 541
33. Wang, P., F. G. Bouwman, and E. C. Mariman. 2009. Generally detected proteins in 542
comparative proteomics--a matter of cellular stress response? Proteomics. 9:2955-2966. 543
on April 24, 2019 by guest
http://aem.asm
.org/D
ownloaded from
22
34. Witzmann, F. A., C. D. Fultz, R. A. Grant, L. S. Wright, S. E. Kornguth, and F. L. Siegel. 544
1999. Regional protein alterations in rat kidneys induced by lead exposure. Electrophoresis 545
20:943-951. 546
35. Wolff, J. 1998. Perchlorate and the thyroid gland. Pharmacol.Rev. 50:89-105. 547
36. Xu, J., J. J. Trimble, L. Steinberg, and B. E. Logan. 2004. Chlorate and nitrate reduction 548
pathways are separately induced in the perchlorate-respiring bacterium Dechlorosoma sp. KJ and 549
the chlorate-respiring bacterium Pseudomonas sp. PDA. Water Res. 38:673-680. 550
37. Yang, S. Y., X. Y. Xiao, W. G. Zhang, L. J. Zhang, W. Zhang, B. Zhou, G. Chen, and D. C. 551
He. 2005. Application of serum SELDI proteomic patterns in diagnosis of lung cancer. 552
BMC.Cancer 5:83. 553
on April 24, 2019 by guest
http://aem.asm
.org/D
ownloaded from
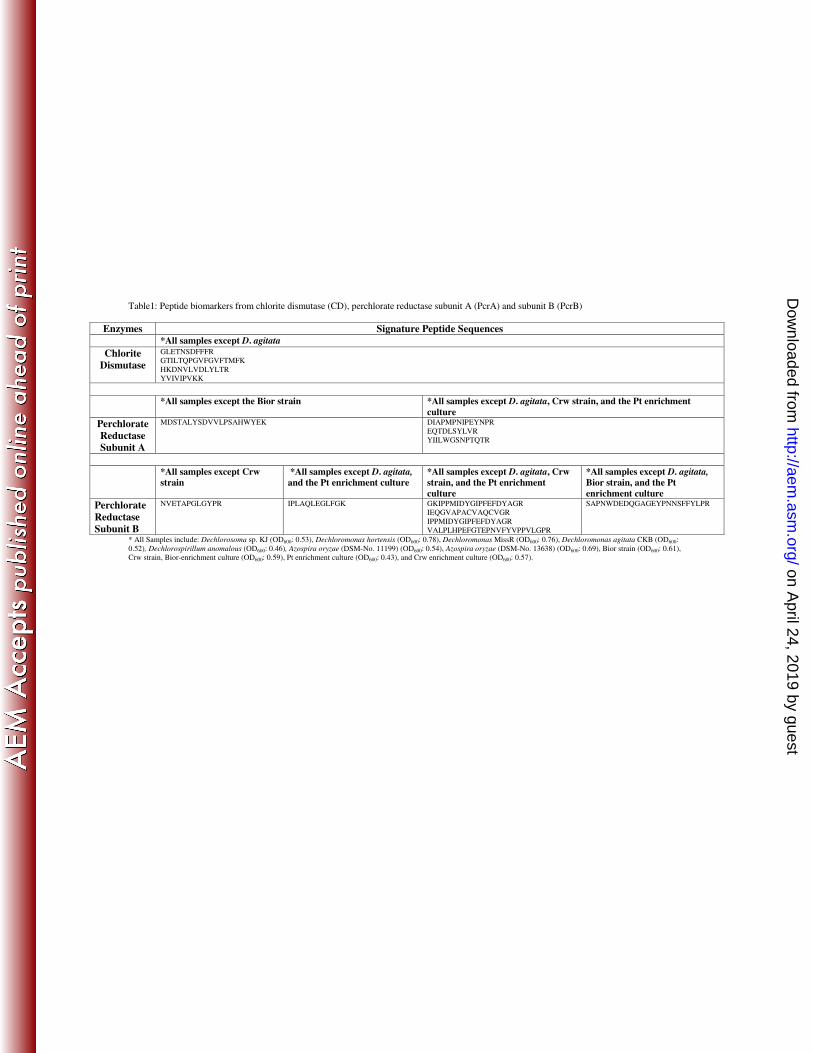
Table1: Peptide biomarkers from chlorite dismutase (CD), perchlorate reductase subunit A (PcrA) and subunit B (PcrB)
Enzymes Signature Peptide Sequences
*All samples except D. agitata
Chlorite
Dismutase
GLETNSDFFFR
GTILTQPGVFGVFTMFK
HKDNVLVDLYLTR
YVIVIPVKK
*All samples except the Bior strain *All samples except D. agitata, Crw strain, and the Pt enrichment
culture
Perchlorate
Reductase
Subunit A
MDSTALYSDVVLPSAHWYEK
DIAPMPNIPEYNPR
EQTDLSYLVR
YIILWGSNPTQTR
*All samples except Crw
strain
*All samples except D. agitata,
and the Pt enrichment culture
*All samples except D. agitata, Crw
strain, and the Pt enrichment
culture
*All samples except D. agitata,
Bior strain, and the Pt
enrichment culture
Perchlorate
Reductase
Subunit B
NVETAPGLGYPR
IPLAQLEGLFGK
GKIPPMIDYGIPFEFDYAGR
IEQGVAPACVAQCVGR
IPPMIDYGIPFEFDYAGR
VALPLHPEFGTEPNVFYVPPVLGPR
SAPNWDEDQGAGEYPNNSFFYLPR
* All Samples include: Dechlorosoma sp. KJ (OD600: 0.53), Dechloromonas hortensis (OD600: 0.78), Dechloromonas MissR (OD600: 0.76), Dechloromonas agitata CKB (OD600:
0.52), Dechlorospirillum anomalous (OD600: 0.46), Azospira oryzae (DSM-No. 11199) (OD600: 0.54), Azospira oryzae (DSM-No. 13638) (OD600: 0.69), Bior strain (OD600: 0.61),
Crw strain, Bior-enrichment culture (OD600: 0.59), Pt enrichment culture (OD600: 0.43), and Crw enrichment culture (OD600: 0.57).
on April 24, 2019 by guest
http://aem.asm
.org/D
ownloaded from
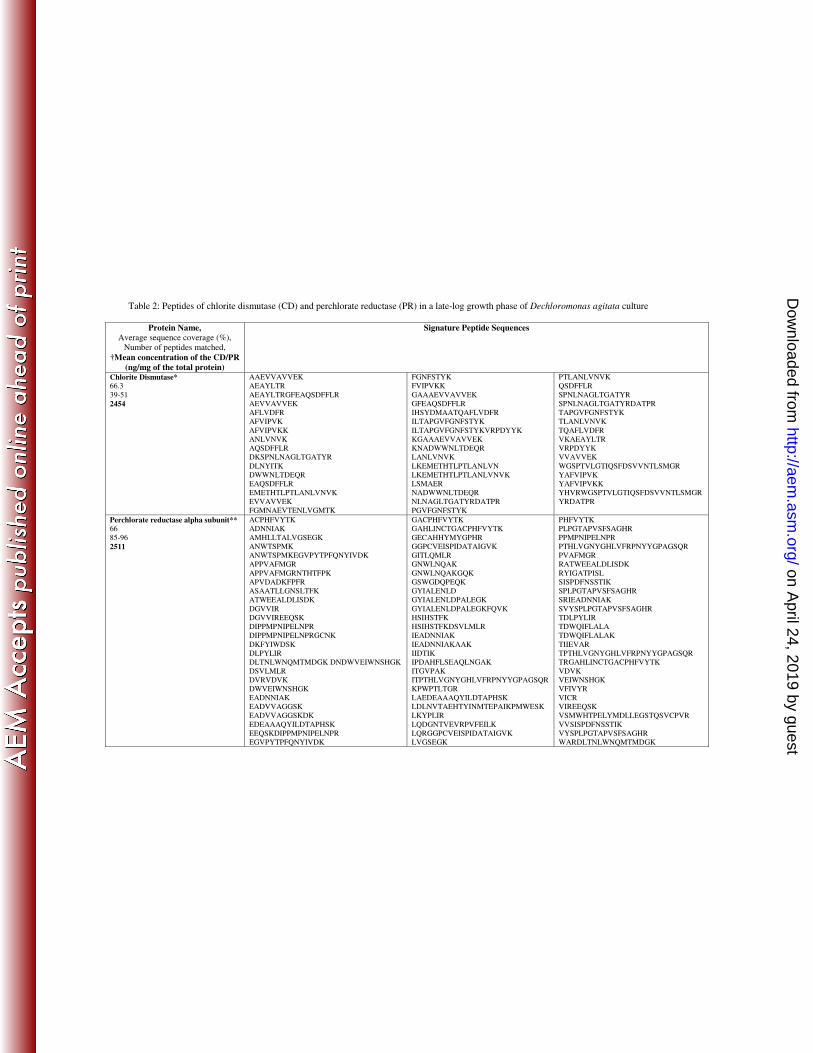
Table 2: Peptides of chlorite dismutase (CD) and perchlorate reductase (PR) in a late-log growth phase of Dechloromonas agitata culture
Protein Name,
Average sequence coverage (%),
Number of peptides matched,
†Mean concentration of the CD/PR
(ng/mg of the total protein)
Signature Peptide Sequences
Chlorite Dismutase* 66.3
39-51
2454
AAEVVAVVEK
AEAYLTR
AEAYLTRGFEAQSDFFLR
AEVVAVVEK
AFLVDFR
AFVIPVK
AFVIPVKK
ANLVNVK
AQSDFFLR
DKSPNLNAGLTGATYR
DLNYITK
DWWNLTDEQR
EAQSDFFLR
EMETHTLPTLANLVNVK
EVVAVVEK
FGMNAEVTENLVGMTK
FGNFSTYK
FVIPVKK
GAAAEVVAVVEK
GFEAQSDFFLR
IHSYDMAATQAFLVDFR
ILTAPGVFGNFSTYK
ILTAPGVFGNFSTYKVRPDYYK
KGAAAEVVAVVEK
KNADWWNLTDEQR
LANLVNVK
LKEMETHTLPTLANLVN
LKEMETHTLPTLANLVNVK
LSMAER
NADWWNLTDEQR
NLNAGLTGATYRDATPR
PGVFGNFSTYK
PTLANLVNVK
QSDFFLR
SPNLNAGLTGATYR
SPNLNAGLTGATYRDATPR
TAPGVFGNFSTYK
TLANLVNVK
TQAFLVDFR
VKAEAYLTR
VRPDYYK
VVAVVEK
WGSPTVLGTIQSFDSVVNTLSMGR
YAFVIPVK
YAFVIPVKK
YHVRWGSPTVLGTIQSFDSVVNTLSMGR
YRDATPR
Perchlorate reductase alpha subunit** 66
85-96
2511
ACPHFVYTK
ADNNIAK
AMHLLTALVGSEGK
ANWTSPMK
ANWTSPMKEGVPYTPFQNYIVDK
APPVAFMGR
APPVAFMGRNTHTFPK
APVDADKFPFR
ASAATLLGNSLTFK
ATWEEALDLISDK
DGVVIR
DGVVIREEQSK
DIPPMPNIPELNPR
DIPPMPNIPELNPRGCNK
DKFYIWDSK
DLPYLIR
DLTNLWNQMTMDGK DNDWVEIWNSHGK
DSVLMLR
DVRVDVK
DWVEIWNSHGK
EADNNIAK
EADVVAGGSK
EADVVAGGSKDK
EDEAAAQYILDTAPHSK
EEQSKDIPPMPNIPELNPR
EGVPYTPFQNYIVDK
GACPHFVYTK
GAHLINCTGACPHFVYTK
GECAHHYMYGPHR
GGPCVEISPIDATAIGVK
GITLQMLR
GNWLNQAK
GNWLNQAKGQK
GSWGDQPEQK
GYIALENLD
GYIALENLDPALEGK
GYIALENLDPALEGKFQVK
HSIHSTFK
HSIHSTFKDSVLMLR
IEADNNIAK
IEADNNIAKAAK
IIDTIK
IPDAHFLSEAQLNGAK
ITGVPAK
ITPTHLVGNYGHLVFRPNYYGPAGSQR
KPWPTLTGR
LAEDEAAAQYILDTAPHSK
LDLNVTAEHTYINMTEPAIKPMWESK
LKYPLIR
LQDGNTVEVRPVFEILK
LQRGGPCVEISPIDATAIGVK
LVGSEGK
PHFVYTK
PLPGTAPVSFSAGHR
PPMPNIPELNPR
PTHLVGNYGHLVFRPNYYGPAGSQR
PVAFMGR
RATWEEALDLISDK
RYIGATPISL
SISPDFNSSTIK
SPLPGTAPVSFSAGHR
SRIEADNNIAK
SVYSPLPGTAPVSFSAGHR
TDLPYLIR
TDWQIFLALA
TDWQIFLALAK
TIIEVAR
TPTHLVGNYGHLVFRPNYYGPAGSQR
TRGAHLINCTGACPHFVYTK
VDVK
VEIWNSHGK
VFIVYR
VICR
VIREEQSK
VSMWHTPELYMDLLEGSTQSVCPVR
VVSISPDFNSSTIK
VYSPLPGTAPVSFSAGHR
WARDLTNLWNQMTMDGK
on April 24, 2019 by guest
http://aem.asm
.org/D
ownloaded from
EIWNSHGK
EQTDLPYLIR
EYATTQPAMIICGGGTMHWYYSDVLLR
FLREADVVAGGSK
FLREADVVAGGSKDK
FNSPHSR
FNSPHSRHSIHSTFK
FKANWTSPMK
FPFRFNSPHSR
FQVK
FYDEQFK
FYIWDSK
LYDAHNLK
LYDAHNLKEQTDLPYLIR
MDSTALYSDVVLPSAHWYEK
NHSPDCISVYSPLPGTAPVSFSAGHR
NLWPK
NQWSWDK
NQWSWDKK
NWLNQAK
NWTSPMK
PDAHFLSEAQLNGAK
PGTAPVSFSAGHR
PGTDGALALAMAHVIIK
WIHPLPGTDGALALAMAHVIIK
WQIFLALAK
WVEIWNSHGK
YDAHNLK
YIGATPISL
YIILWGANPTQTR
YLMHAIDTR
YMDLLEGSTQSVCPVR
YPLIR
YSPLPGTAPVSFSAGHR
YVLR
Perchlorate reductase beta subunit*** 58.5
26-29
564
AMHVGFIDDQESSVFK
CIGCFPR
CIGCQTCTVACK
DDQESSVFK
DQESSVFK
EQDGIVVIHQDK
ETAPGLGYPR
EVLK
FGVALPLHPEYGTEPNVFYVPPVLGPR
GGGYKDGVLQK
GKIPPMIDYGVPFEFDYAGR
GVAPACVAECAGR
GYKDGVLQK
NQPSELMDILIGR
NVETAPGLGYPR
NVETAPGLGYPRNWQSK
PFEFDYAGR
PPVLGPR
PSELMDILIGR
QLAYVADLNK
IEKGVAPACVAECAGR
IKNQPSELMDILIGR
IPPMIDYGVPFEFDYAGR
ISMTQLEQLFGK
LFEGKPGR
MCNHCAKPACLEACPNEAIYK
REQDGLVVIHQEK
RFGVALPLHPEYGTEPNVFYVPPVLGPR
RSADMMISPMT
RQLAYVADLNK
SADMMISPMT
TAPGLGYPR
TLQAER
TLQAEREK
TLWTSGPGQDYMYWR
VEMPNGEHTADPK
YVADLNK
Perchlorate reductase gamma subunit
26.7
6
6
APFTPFSPAVDSK
ASAHAKAFDSLKPNAK
KPLVDAGQNFDM
KPLVDAGQNFDMEK
LDPK
SVTATGKSNPVHTHFK
Perchlorate reductase delta subunit 61.3
9-14
75
DFLER
DFLERHLCAWLPLVR
ELKEELGE
EVFESQFLSAFETNMPSPSASLNEGVHIFK
FIDEIR
GFYSNFGLQVDSK
HLCAWLPLVR
LAQKDFLER
LVLAADK
LVLAADKALCR
MNSITDDRLVLAADK
QAQAHLEGMSADAYK
QELGVCWGELLEHFNEVLAPGLKLACSR
RPNLLLELK
SDRPNLLLELK
SHIYSLLASGFGYPDESGYQGFSDGK
VTTPFFVTLAEFAESFALANLR
†Average of three mass spectrometric runs per sample. All the readings have standard error less than 12% of the mean.
*Peptides also matching with: Pseudomonas sp. PK (Q673K7) - Sequence coverage 24%; Ideonella dechloratans (Q9F437) - Sequence coverage 2%.
**Dechlorosoma sp. KJ (B2D1S4) - Sequence coverage 19.8%; Dechlorosoma sp. PCC (A7LI70) - Sequence coverage 18.4%; Dechloromonas sp. PC1 (A7LI69) - Sequence coverage 13.4%.
***Dechlorosoma sp. KJ (B2D1S5) - Sequence coverage 16.8%.
on April 24, 2019 by guest
http://aem.asm
.org/D
ownloaded from
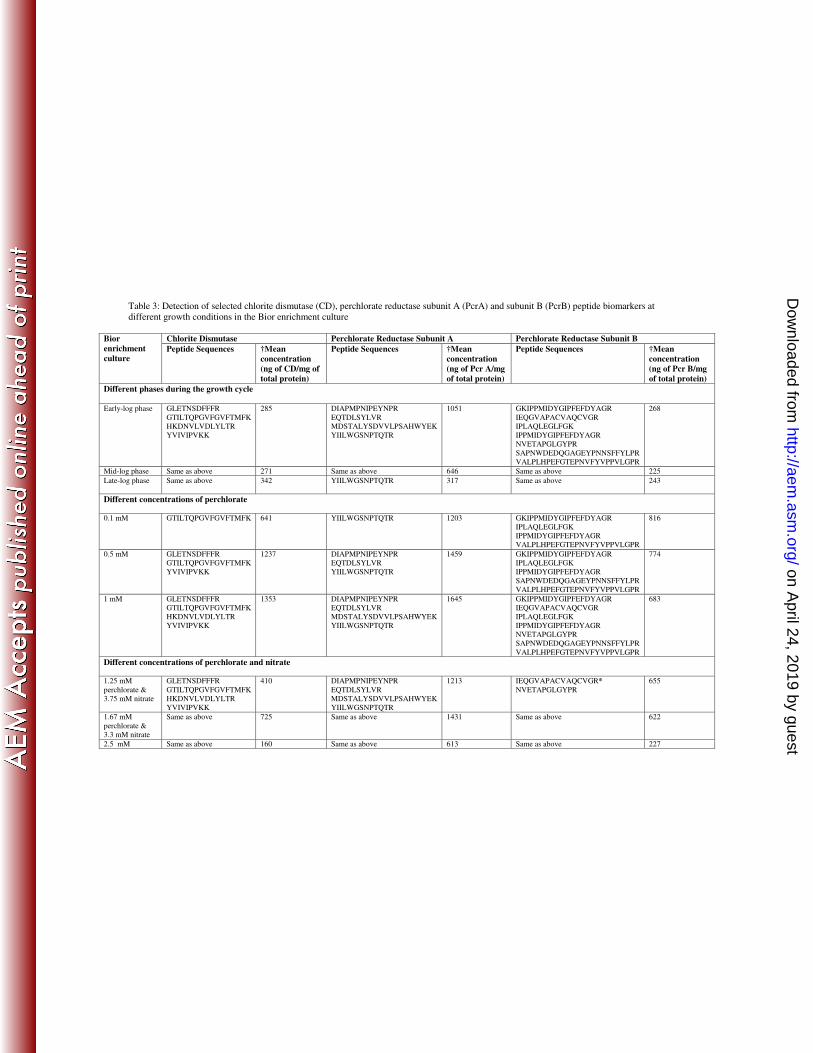
Table 3: Detection of selected chlorite dismutase (CD), perchlorate reductase subunit A (PcrA) and subunit B (PcrB) peptide biomarkers at
different growth conditions in the Bior enrichment culture
Chlorite Dismutase Perchlorate Reductase Subunit A Perchlorate Reductase Subunit B Bior
enrichment
culture Peptide Sequences †Mean
concentration
(ng of CD/mg of
total protein)
Peptide Sequences †Mean
concentration
(ng of Pcr A/mg
of total protein)
Peptide Sequences †Mean
concentration
(ng of Pcr B/mg
of total protein)
Different phases during the growth cycle
Early-log phase GLETNSDFFFR
GTILTQPGVFGVFTMFK
HKDNVLVDLYLTR
YVIVIPVKK
285 DIAPMPNIPEYNPR
EQTDLSYLVR
MDSTALYSDVVLPSAHWYEK
YIILWGSNPTQTR
1051
GKIPPMIDYGIPFEFDYAGR
IEQGVAPACVAQCVGR
IPLAQLEGLFGK
IPPMIDYGIPFEFDYAGR
NVETAPGLGYPR
SAPNWDEDQGAGEYPNNSFFYLPR
VALPLHPEFGTEPNVFYVPPVLGPR
268
Mid-log phase Same as above 271 Same as above 646 Same as above 225
Late-log phase Same as above 342 YIILWGSNPTQTR
317 Same as above 243
Different concentrations of perchlorate
0.1 mM GTILTQPGVFGVFTMFK
641 YIILWGSNPTQTR
1203 GKIPPMIDYGIPFEFDYAGR
IPLAQLEGLFGK
IPPMIDYGIPFEFDYAGR
VALPLHPEFGTEPNVFYVPPVLGPR
816
0.5 mM GLETNSDFFFR
GTILTQPGVFGVFTMFK
YVIVIPVKK
1237 DIAPMPNIPEYNPR
EQTDLSYLVR
YIILWGSNPTQTR
1459 GKIPPMIDYGIPFEFDYAGR
IPLAQLEGLFGK
IPPMIDYGIPFEFDYAGR
SAPNWDEDQGAGEYPNNSFFYLPR
VALPLHPEFGTEPNVFYVPPVLGPR
774
1 mM GLETNSDFFFR
GTILTQPGVFGVFTMFK
HKDNVLVDLYLTR
YVIVIPVKK
1353
DIAPMPNIPEYNPR
EQTDLSYLVR
MDSTALYSDVVLPSAHWYEK
YIILWGSNPTQTR
1645
GKIPPMIDYGIPFEFDYAGR
IEQGVAPACVAQCVGR
IPLAQLEGLFGK
IPPMIDYGIPFEFDYAGR
NVETAPGLGYPR
SAPNWDEDQGAGEYPNNSFFYLPR
VALPLHPEFGTEPNVFYVPPVLGPR
683
Different concentrations of perchlorate and nitrate
1.25 mM
perchlorate &
3.75 mM nitrate
GLETNSDFFFR
GTILTQPGVFGVFTMFK
HKDNVLVDLYLTR
YVIVIPVKK
410 DIAPMPNIPEYNPR
EQTDLSYLVR
MDSTALYSDVVLPSAHWYEK
YIILWGSNPTQTR
1213 IEQGVAPACVAQCVGR*
NVETAPGLGYPR
655
1.67 mM
perchlorate &
3.3 mM nitrate
Same as above 725 Same as above 1431 Same as above 622
2.5 mM Same as above 160 Same as above 613 Same as above 227
on April 24, 2019 by guest
http://aem.asm
.org/D
ownloaded from
perchlorate &
2.5 mM nitrate
5 mM nitrate
(Control)
None of the above - EQTDLSYLVR
10 None of the above -
†Average of three mass spectrometric runs per sample. All the readings have standard error less than 12% of the mean.
*Rest of the peptide sequences (IPPMIDYGIPFEFDYAGR; IPLAQLEGLFGK; SAPNWDEDQGAGEYPNNSFFYLPR; VALPLHPEFGTEPNVFYVPPVLGPR) match with peptides from respiratory
nitrate reductase beta subunit from Dechloromonas aromatica (strain RCB) (Q47CW7)
on April 24, 2019 by guest
http://aem.asm
.org/D
ownloaded from
1
Figure Captions
Figure 1: Growth of the Bioreactor enrichment culture under 0.1, 0.5, 1, 2.5 and 5 mM concentrations of
ammonium perchlorate. Detected concentration (ng/mg of total protein) of CD, PcrA and PcrB
biomarkers at marked time-points during the growth on 5 mM ammonium perchlorate are indicated.
Figure 2: Growth and decomposition of perchlorate and nitrate by the Bioreactor enrichment culture.
Concentration of perchlorate and nitrate were monitored using ESI/MS. The data indicate simultaneous
removal of both the electron acceptors irrespective of the concentration ratios. a) 1.67 mM of ammonium
perchlorate and 3.33 mM of sodium nitrate; b) 2.5 mM of ammonium perchlorate and 2.5 mM of sodium
nitrate
Figure 3: Amino acid alignment of chlorite dismutase without the signal peptide from Dechloromonas
agitata (D agit), Dechlorosoma sp. KJ (D sp. KJ), Dechloromonas hortensis (D hort), Dechloromonas
aromatica (D arom). The shaded peptide sequences represent the conserved region between different
organisms and can be used as biomarkers.
on April 24, 2019 by guest
http://aem.asm
.org/D
ownloaded from
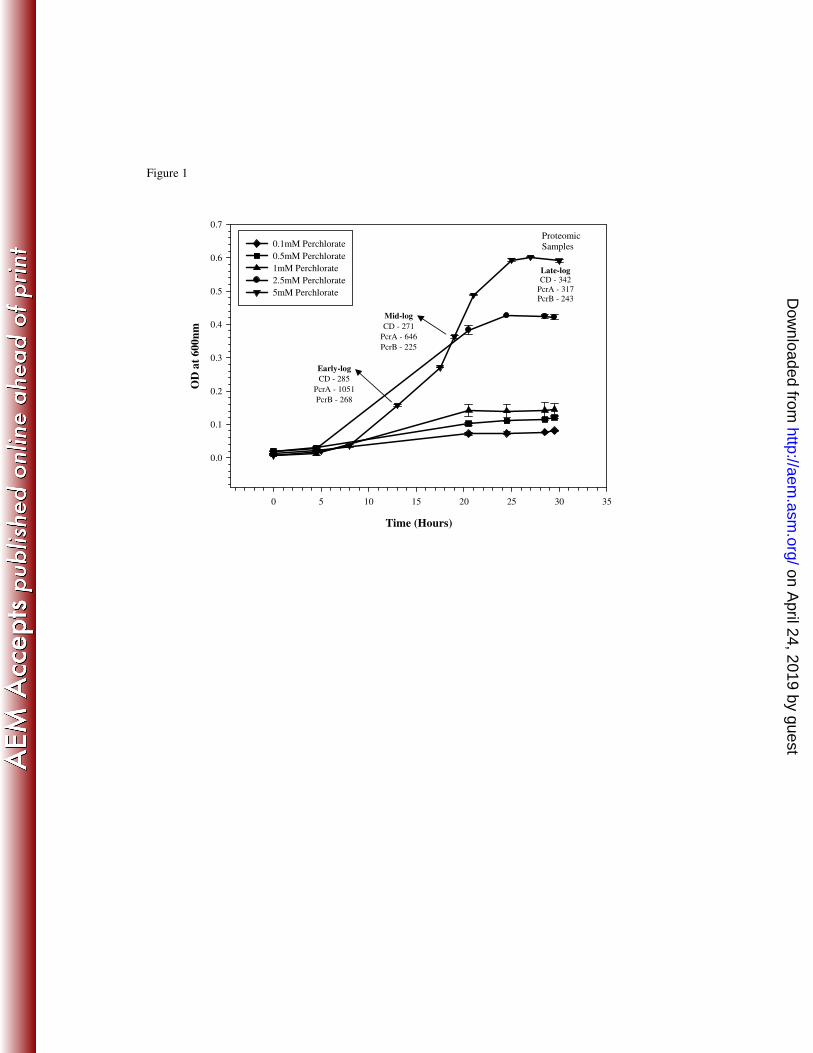
Figure 1
Time (Hours)
0 5 10 15 20 25 30 35
OD
at
600
nm
0.0
0.1
0.2
0.3
0.4
0.5
0.6
0.7
0.1mM Perchlorate
0.5mM Perchlorate
1mM Perchlorate
2.5mM Perchlorate
5mM Perchlorate
Early-log
CD - 285
PcrA - 1051
PcrB - 268
Proteomic
Samples
Mid-log
CD - 271
PcrA - 646
PcrB - 225
Late-logCD - 342
PcrA - 317
PcrB - 243
on April 24, 2019 by guest
http://aem.asm
.org/D
ownloaded from
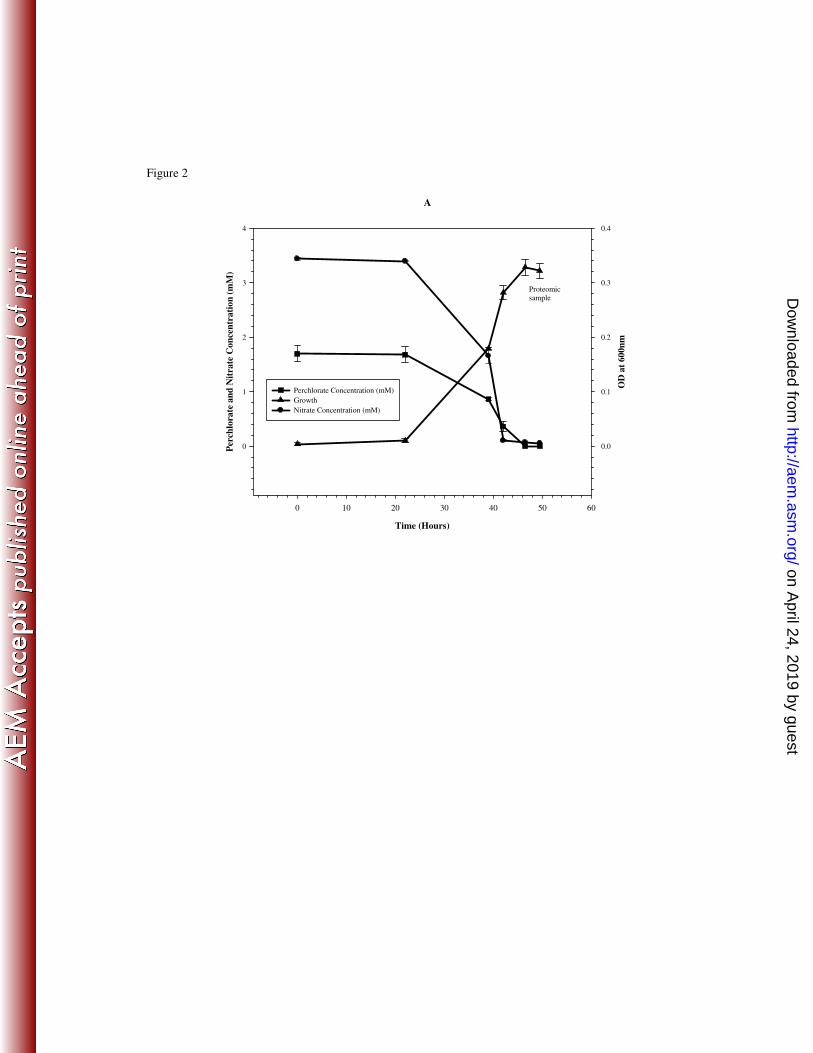
Figure 2
A
Time (Hours)
0 10 20 30 40 50 60
Per
chlo
rate
an
d N
itra
te C
on
cen
trati
on
(m
M)
0
1
2
3
4
OD
at
600n
m
0.0
0.1
0.2
0.3
0.4
Perchlorate Concentration (mM)
Growth
Nitrate Concentration (mM)
Proteomic
sample
on April 24, 2019 by guest
http://aem.asm
.org/D
ownloaded from
B
Time (Hours)
0 10 20 30 40 50 60
OD
at
60
0n
m
0.0
0.1
0.2
0.3
0.4
0.5
0.6
Per
chlo
rate
an
d N
itra
te C
on
cen
tra
tio
n (
mM
)
0.0
0.5
1.0
1.5
2.0
2.5
3.0
3.5
Growth
Perchlorate Concentration (mM)
Nitrate Concentration (mM)
Proteomic sample
on April 24, 2019 by guest
http://aem.asm
.org/D
ownloaded from
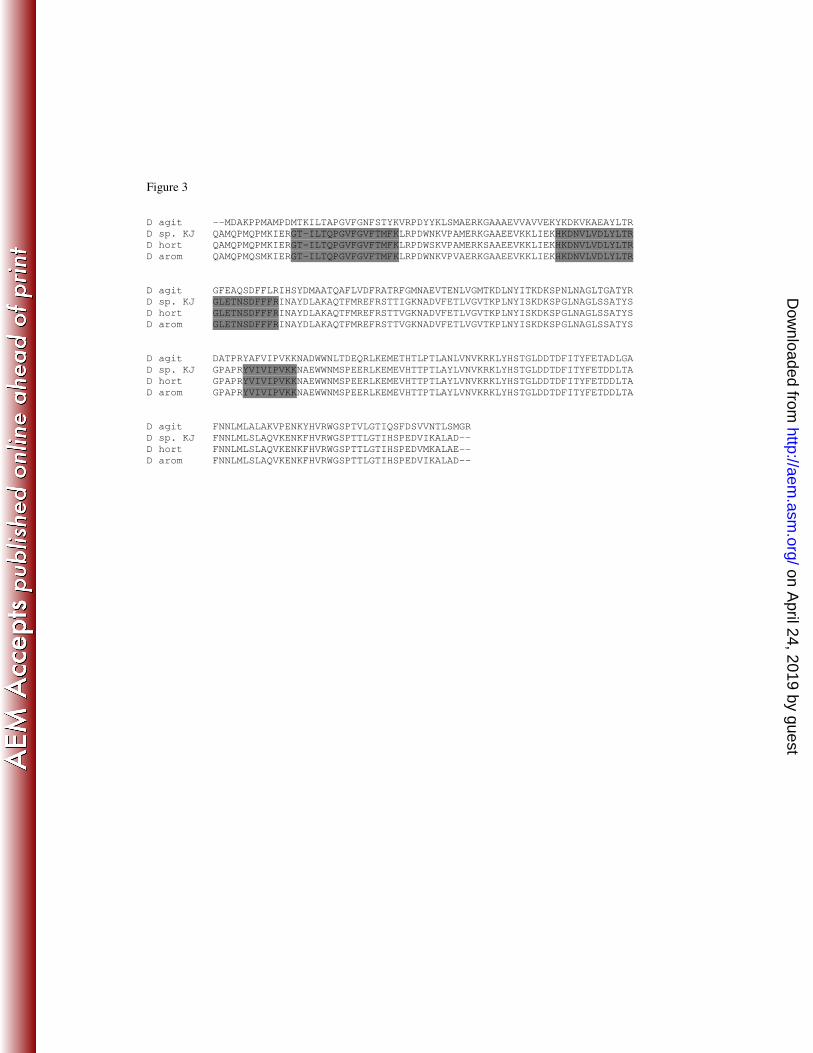
Figure 3
D agit --MDAKPPMAMPDMTKILTAPGVFGNFSTYKVRPDYYKLSMAERKGAAAEVVAVVEKYKDKVKAEAYLTR
D sp. KJ QAMQPMQPMKIERGT-ILTQPGVFGVFTMFKLRPDWNKVPAMERKGAAEEVKKLIEKHKDNVLVDLYLTR
D hort QAMQPMQPMKIERGT-ILTQPGVFGVFTMFKLRPDWSKVPAMERKSAAEEVKKLIEKHKDNVLVDLYLTR
D arom QAMQPMQSMKIERGT-ILTQPGVFGVFTMFKLRPDWNKVPVAERKGAAEEVKKLIEKHKDNVLVDLYLTR
D agit GFEAQSDFFLRIHSYDMAATQAFLVDFRATRFGMNAEVTENLVGMTKDLNYITKDKSPNLNAGLTGATYR
D sp. KJ GLETNSDFFFRINAYDLAKAQTFMREFRSTTIGKNADVFETLVGVTKPLNYISKDKSPGLNAGLSSATYS
D hort GLETNSDFFFRINAYDLAKAQTFMREFRSTTVGKNADVFETLVGVTKPLNYISKDKSPGLNAGLSSATYS
D arom GLETNSDFFFRINAYDLAKAQTFMREFRSTTVGKNADVFETLVGVTKPLNYISKDKSPGLNAGLSSATYS
D agit DATPRYAFVIPVKKNADWWNLTDEQRLKEMETHTLPTLANLVNVKRKLYHSTGLDDTDFITYFETADLGA
D sp. KJ GPAPRYVIVIPVKKNAEWWNMSPEERLKEMEVHTTPTLAYLVNVKRKLYHSTGLDDTDFITYFETDDLTA
D hort GPAPRYVIVIPVKKNAEWWNMSPEERLKEMEVHTTPTLAYLVNVKRKLYHSTGLDDTDFITYFETDDLTA
D arom GPAPRYVIVIPVKKNAEWWNMSPEERLKEMEVHTTPTLAYLVNVKRKLYHSTGLDDTDFITYFETDDLTA
D agit FNNLMLALAKVPENKYHVRWGSPTVLGTIQSFDSVVNTLSMGR
D sp. KJ FNNLMLSLAQVKENKFHVRWGSPTTLGTIHSPEDVIKALAD--
D hort FNNLMLSLAQVKENKFHVRWGSPTTLGTIHSPEDVMKALAE--
D arom FNNLMLSLAQVKENKFHVRWGSPTTLGTIHSPEDVIKALAD--
on April 24, 2019 by guest
http://aem.asm
.org/D
ownloaded from

![Downloaded from //aem.asm.org/content/aem/early/2015/10/19/AEM.02806-15.full.pdf · 49 high concentrations required (10% (v/v)), make it impractical for widespread use [5]. 50 .](https://img.pdfslide.us/doc/110x75/5e2ff5466d34a663a65c52ab/downloaded-from-aemasmorgcontentaemearly20151019aem02806-15fullpdf.jpg)