Embed Size (px)
Citation preview
Important Ecological Areas in the Ocean:
A Comprehensive Ecosystem Protection Approach to the
Spatial Management of Marine Resources
Oceana Discussion Paper
Jim Ayers1, Ashley Blacow, Ben Enticknap, Chris Krenz, Susan Murray,
Santi Roberts, Geoff Shester, Jeffrey Short2, and Jon Warrenchuk
August 23, 2010
1. Author sequence is alphabetical and does not imply seniority.
2. Author to whom correspondence should be addressed

Oceana Discussion Paper – Important Ecological Areas – August 23, 2010
2
Table of Contents
I. Executive Summary.................................................................................................... 3
II. Introduction ................................................................................................................ 6
III. Identifying Important Ecological Areas..................................................................... 9
IV. Protecting Important Ecological Areas.................................................................... 11
V. Monitoring and Adaptive Management of Important Ecological Areas.................. 13
VI. Conclusion ............................................................................................................... 14
VII. References ............................................................................................................... 16
VIII. Appendices.............................................................................................................. 20
A. Using MARXAN to Help Identify Important Ecological Areas .......................... 20
B. Use of IEAs in Marine Spatial Planning Efforts................................................... 28
C. Use of IEAs in Marine Protected Area Processes................................................. 30
D. Use of IEAs in Disaster Response ........................................................................ 33
E. Political Considerations for Protecting Important Ecological Areas.................... 34
Oceana Discussion Paper – Important Ecological Areas – August 23, 2010
3
I. Executive Summary
We urgently need a practical approach to preserve the health, biodiversity and resilience
of marine ecosystems. Left unconstrained, the thermal and acidifying effects of rising
carbon dioxide levels in the atmosphere combined with extractive uses, development,
pollution, and other anthropogenic impacts on the marine environment will dramatically
accelerate extinction rates in the world’s oceans and the irreversible loss of valuable
ecosystem services. We explicitly embrace a strategic approach to protecting the health
of our coasts and oceans and reducing activities that are incompatible with ecosystem
protection, all the while maintaining and promoting present and future economic benefits.
This strategic approach combines the rigors of the western scientific process with the vast
storehouse of local and traditional knowledge, with an emphasis on understanding and
integrating the knowledge base of indigenous communities that have observed and
managed their ocean resources since time immemorial. This holistic, iterative approach
is necessary to ensure we have vibrant coastal communities for this and future
generations. Our approach leverages science, law, policy and the public to identify and
protect Important Ecological Areas (IEAs).
IEAs are geographically delineated areas which by themselves or in a network have
distinguishing ecological characteristics, are important for maintaining habitat
heterogeneity or the viability of a species, or contribute disproportionately to an
ecosystem's health, including its productivity, biodiversity, function, structure, or
resilience. IEAs include places like migration routes, subsistence areas, sensitive seafloor
habitats, breeding and spawning areas, foraging areas, and areas of high primary
productivity. The goal of the IEA approach is to preserve the health, productivity,
biodiversity and resilience of marine ecosystems while providing for ecologically
sustainable fisheries and other economic endeavors, traditional subsistence uses, and
viable marine-dependent communities.
Important ecological areas can be identified either on the basis of their relative
importance to a single ecological feature (e.g. the presence of rare deep sea coral) or
multiple features (e.g. an area containing high primary productivity, a teeming kelp
forest, and an important foraging ground). The process of identifying IEAs helps distill
broad ecological principles (e.g., diversity, connectivity, productivity) into groupings of
ecological features, for which we consolidate relevant datasets and map how these
features are distributed through space. This process includes the gathering of existing
data and acquiring additional essential data, such as local and traditional knowledge of
indigenous peoples, tribes, and coastal communities. By recognizing the value of
bringing indigenous people and local communities into the process, the IEA process will
be more robust and create value to information that is typically overlooked in traditional
planning or conservation processes. IEAs may be static or dynamic based on real-time
observing, depending on the nature of the ecological features they contain.
Once IEAs are identified, we evaluate protection needs, assessing impacts, potential
threats, and overall compatibility between ecological features and human activities. In

Oceana Discussion Paper – Important Ecological Areas – August 23, 2010
4
some cases, area-based protective measures that limit human activities (such as time/area
closures) may be warranted when damages posed by industrial activities threaten
irreparable harm to the ecological services provided by an IEA. Conversely, some IEAs
may not need prohibitive measures to protect them from current activities, but simply are
identified to prevent potential future threats that may not currently be apparent. Efforts
for restrictive sanctions for IEAs that do not face current or known future threats
squander scarce political capital needed to secure protections that could be put to better
use elsewhere. Ideally, all IEAs should receive the protection of monitoring, which alerts
managers to emerging threats and provides other critical information useful for managers,
conservation groups, local communities, and the broader public. Collecting data inside
and outside IEAs over time will help determine if ecological features within IEAs are
being adequately protected and can distinguish secular environmental changes from those
caused by human activities. Protective measures can then be modified as needed.
IEAs are useful in a broad suite of application and policy contexts including marine
spatial planning (MSP), climate change adaptation, and disaster response. Marine spatial
planning is rapidly gaining political momentum. Comprehensive MSP, if done
rigorously and appropriately, can benefit both industry and the environment, presenting
an opportunity to fully consider current and future cumulative impacts to ecosystem
health. To ensure adequate protection of the health, function, and biodiversity of coastal
and marine ecosystems, IEAs must first be identified before delineating where competing
uses should go. MSP benefits industry by proactively identifying and getting broad
stakeholder approval for areas where development could occur with minimal impact to
the marine environment. The largest benefit and primary purpose of MSP, however,
should be to ensure ecosystem health and biodiversity are maintained. To do this, it is
critical to protect IEAs.
IEAs can serve critical roles in responses to major disasters and catastrophes such as oil
spills. Before such an event occurs, protection of the critical features in these areas
increases their resilience to such events. Resource managers can also be better prepared
for such catastrophes by storing necessary recovery equipment and resources in
proximity to IEAs and creating response plans in relation to the location of IEAs and the
features contained within them. The IEA atlas gives resource managers a comprehensive
tool to understand where ecological features at risk from such events occur in space and
time, and provides a systematic way to prioritize conservation, response, and restoration
efforts. In summary, by presenting scientific information, thoughtful analysis, and local
and traditional knowledge as an accessible atlas of IEAs, we create a powerful tool for
informed decision making to promote both ecosystem health and the ecologically
sustainable use of our oceans.

Oceana Discussion Paper – Important Ecological Areas – August 23, 2010
5
The Important Ecological Areas approach can be summarized in the following steps,
grouped into three phases:
Identify Ecological Features
Gather, Process, and Analyze Data
Identify Preliminary IEAs on Map
External Review and Feedback
Official Recognition of IEAs
Develop Management Measures for Each IEA as Appropriate
Identify and Gather Data on Threats to IEAs
Monitor and Revise IEAs Over Time
Phase 1:Identification
Phase 2:Protection
Phase 3:
Adaptive Management
Publish IEA Atlas
Up
da
te P
erio
dic
ally

Oceana Discussion Paper – Important Ecological Areas – August 23, 2010
6
II. Introduction
Finding an appropriate balance between economic development and environmental
impacts with the ultimate goal of ecological sustainability is arguably the most daunting
problem confronting marine resource managers. Human uses of the ocean almost always
have some impact on marine ecosystems, but these impacts are often masked by our lack
of understanding of the prior state of the ecosystem or failure to monitor the status of
affected ocean resources. As a result, resource exploitation risks compromising
sustainability before impacts are recognized. The recent rise of ocean surface
temperatures and acidification (IPCC 2007, Caldeira and Wickett 2005) caused by
anthropogenic carbon dioxide emissions to the atmosphere (IPCC 2007) place increasing
stress on marine ecosystems worldwide (Orr et al. 2005, Myers et al. 2007). These global
stresses are compounded by more localized impacts from extractive ocean uses and
development, including risks of catastrophic events such as the recent Deepwater
Horizon oil rig blowout in the Gulf of Mexico. Taken together, these stresses threaten
widespread species’ extinctions defining a new geologic boundary between the most
recent Holocene Epoch and its successor, the Anthropocene (Crutzen and Stoermer
2000).
These risks may be substantially reduced by understanding the various ecosystem
structures, functioning, biodiversity and resilience that contribute to the oceans’ ability to
provide ecosystem services; identifying the most important areas of the ocean for
maintaining ecosystem health; and then adopting targeted management measures to
protect those areas’ ecological integrity. Once identified, important ecological areas
(IEAs) form a critical precursor for marine spatial planning (MSP) efforts to avoid
unnecessary impacts while promoting ecologically sustainable use of marine resources
and the environment. Protecting the ecological features that make an area important
provides an efficient means of reducing anthropogenic stressors, extinction risks, loss of
ecosystem services, and other undesirable and irreversible ecosystem changes.
The primary goal of the IEA approach is to maintain, restore, and protect the health,
biodiversity, resilience, and functioning of the marine ecosystem. Implicit in this goal is
a focus on maintaining key ecological principles including productivity, native species
diversity, habitat diversity and heterogeneity, key species, and connectivity; many of
these principles are identified by Foley et al. (2010). In addition the approach recognizes
indigenous peoples and local communities as co-managers of ocean resources. These
groups have frequently been disenfranchised from ocean resource decisions in the past.
The approach seeks to bring these groups to the table and incorporate local and traditional
knowledge (LTK) on equal footing with other scientific data used in management
decisions, hence giving value to LTK and empowering local communities to incorporate
this information into the scientific and management process. Fundamental differences in
the relative contribution of marine habitats to different functions are widely
acknowledged. For example, kelp forests have higher productivity than the abyssal plain,
and the areas of highest density of sensitive corals on the seafloor may not necessarily be
the same areas as the largest breeding colonies for seabirds. Furthermore, areas that
contain a number of important features, such as high primary productivity, sea bird and

Oceana Discussion Paper – Important Ecological Areas – August 23, 2010
7
marine mammal feeding areas, deep sea corals, etc., could be considered to be more
important to ecosystem health than areas that contain only one of those features. In
addition, the three dimensional nature of the water column contains vertical
heterogeneity, which also distinguishes marine-based approaches from terrestrial ones.
However, formal and consistent procedures for ranking importance both for individual
features as well as across multiple functions are not well established.
The dynamics and community structure of marine ecosystems are often driven by a few
key species, and we prioritize the areas used by these species within our approach.
Keystone species have disproportionately strong interactive effects relative to their
biomass (Paine 1966; Paine 1980; Navarrete and Menge 1996; Power et al. 1996; Soule
et al. 2005). Structure-forming species (e.g., eelgrass, corals, kelp) provide food and
shelter for a wide suite of species, often serving as the basis for entire assemblages of
associated species. Forage species transfer nutrients and energy from low to high trophic
levels and influence the structure and stability of food webs (Menge et al. 2002, Thayer
& Sydeman 2007). In addition, areas important to the life histories of endangered,
threatened, or rare species should receive priority attention based on the principle of
maintaining biodiversity. Similar to individual species contributing differently to the
structure and functioning of marine ecosystems, spatial variability results in one area
contributing differently from another area to the structure and functioning of ecosystems.
While all areas are almost certainly important to one aspect or another of ecosystem
health, spatial variability leads to areas contributing differently to the overall health and
biodiversity of our oceans within a spectrum of relative importance.
Determining “importance” requires a process for establishing and comparing relative
contributions to individual or multiple ecological features. Therefore IEAs can be based
on single features that are important, on the overlap of multiple features in the same area,
or on a combination. Defining aggregate importance to aggregate ecosystem health
inevitably requires weighting of various attributes, with the potential to generate diverse
outcomes based on relative valuations of ecological features. Methods that provide a
clear basis for comparing the value of ecological features both for overall ecosystem
health and within specific ecological features will equip stakeholders and policy makers
with more useful and transparent decision tools. The IEA approach utilizes the spatial
variability in our oceans in order to better protect them; we put forth a consistent
procedure for determining the relative importance of areas in the ocean to ecosystem
health to help prioritize efforts designed to protect, maintain and restore the health of the
coasts and oceans.
Our approach recognizes and builds on other attempts and criteria that have been used to
identify priority conservation areas or hotspots in the ocean (e.g., Global Ocean
Biodiversity Initiative’s “ecologically and biologically significant areas (EBSAs)” on the
high seas www.gobi.org; the Bering to Baja Initiative (Morgan et al. 2004); biological
valuation maps as proposed in Derous et al. (2007); Fisheries and Oceans Canada’s
criteria for selecting ecologically significant areas (Breeze 2004); Marine Ecoregional
Assessments by The Nature Conservancy and World Wildlife Fund
(http://conserveonline.org/workspaces/cbdgateway/era/index_html); the National

Oceana Discussion Paper – Important Ecological Areas – August 23, 2010
8
Audubon Society’s Important Bird Areas (www.audubon.org/bird/iba/); and others). The
approach adds to these efforts by incorporating local and traditional knowledge,
providing a comprehensive and flexible approach dealing with the full suite of ecological
features, and provides transparent justification and procedure for developing management
measures and monitoring. As a multi-faceted decision support tool, identified IEAs are
presented together in a comprehensive atlas containing the following three components,
which better allows for comprehensive policy decisions:
1. The identification of IEAs within a region, including a map of the relative
importance of areas to ecosystem health and biodiversity (e.g., at intersections of
multiple ecological features or features disproportionately contributing to
ecosystem health).
2. For any ecological feature, identification of the areas that disproportionately
contribute to the overall spatial distribution of that feature (the most important
areas for each respective feature; e.g., best breeding grounds, highest
concentrations of corals, etc.).
3. For any proposed or current human use, identification of the areas where such
uses are compatible or incompatible with features that are important for
ecosystem health or biodiversity.
We assert that identifying IEAs, while challenging, is an essential precursory step for
Marine Spatial Planning efforts in order to foster ecological sustainability, and for
designating appropriate levels and networks of protective management measures to
promote that sustainability. Our proposed method for valuing marine habitats throughout
the water column emphasizes the transparency of the assumptions used. Our overarching
goal is to preserve the health, productivity, biodiversity and resilience of marine
ecosystems while providing for ecologically sustainable fisheries, subsistence uses and
other economic endeavors. Together healthy ecosystems and economic opportunities
help provide for vibrant human communities. The cumulative and deliberate nature of
the IEA approach may be tailored to provide efficient and cost-effective conservation
measures that ensure the economic and ecological goods and services provided by marine
ecosystems are sustained for future generations. The Important Ecological Areas
approach comprises the following three phases described in more detail in the remainder
of this document:
Phase I. Identify IEAs
• Identify ecological features representative of ecological principles and criteria.
• Gather, format, digitize, and analyze relevant datasets, including those generated
through local and traditional knowledge, to determine the spatial distribution,
density, connectivity, and intersection of ecological features.
• Have ecologists and experts as available review preliminary datasets and analyses
for accuracy and completeness.
• Delineate approximate IEA boundaries based on analyses and knowledge of
ecosystem functioning, and compile into a publically accessible atlas.
Oceana Discussion Paper – Important Ecological Areas – August 23, 2010
9
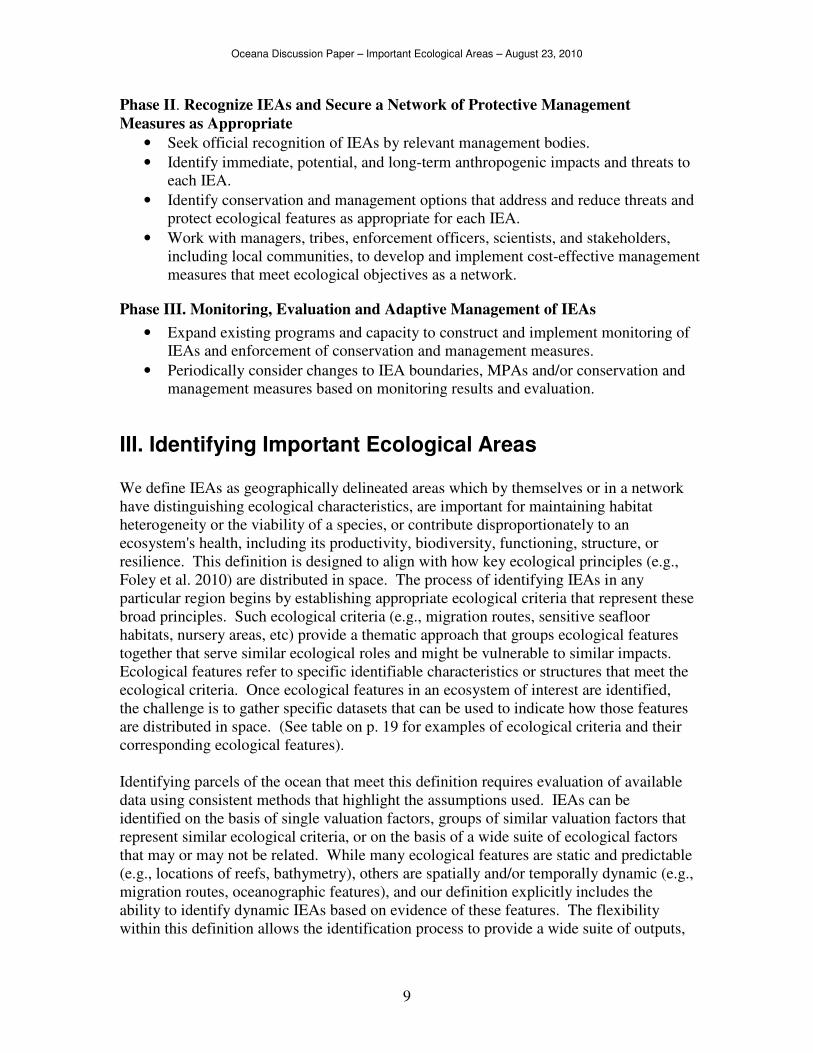
Phase II. Recognize IEAs and Secure a Network of Protective Management
Measures as Appropriate
• Seek official recognition of IEAs by relevant management bodies.
• Identify immediate, potential, and long-term anthropogenic impacts and threats to
each IEA.
• Identify conservation and management options that address and reduce threats and
protect ecological features as appropriate for each IEA.
• Work with managers, tribes, enforcement officers, scientists, and stakeholders,
including local communities, to develop and implement cost-effective management
measures that meet ecological objectives as a network.
Phase III. Monitoring, Evaluation and Adaptive Management of IEAs
• Expand existing programs and capacity to construct and implement monitoring of
IEAs and enforcement of conservation and management measures.
• Periodically consider changes to IEA boundaries, MPAs and/or conservation and
management measures based on monitoring results and evaluation.
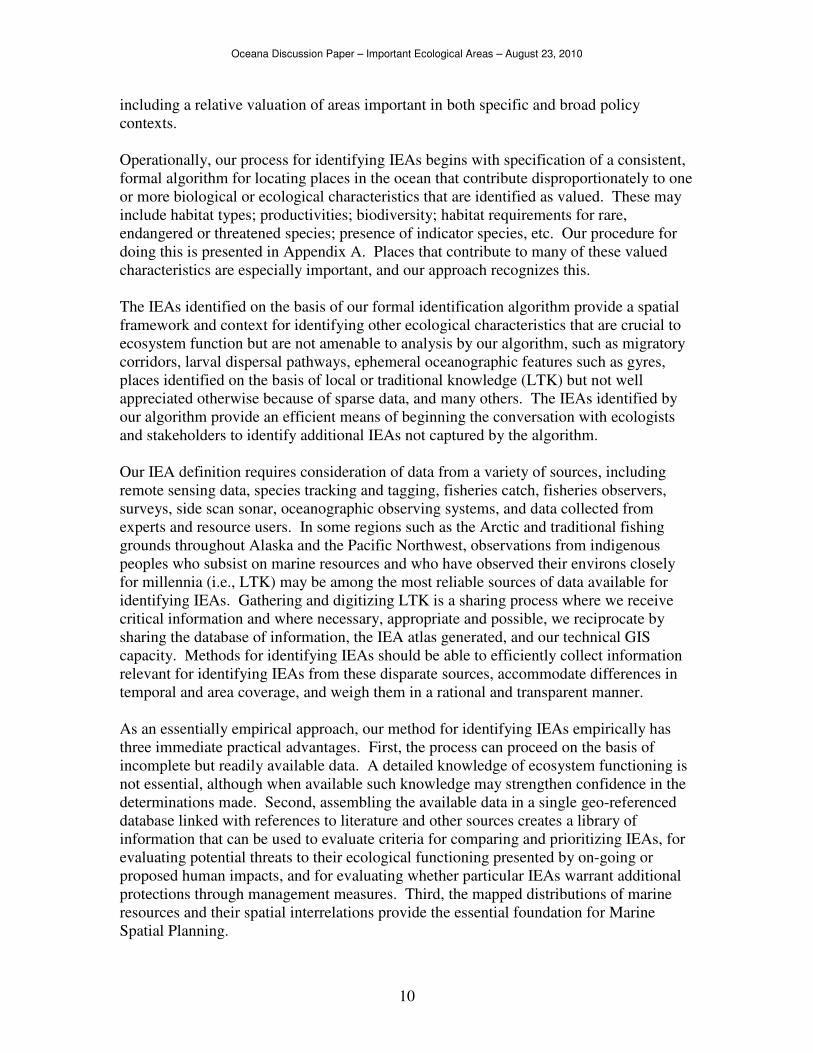
III. Identifying Important Ecological Areas
We define IEAs as geographically delineated areas which by themselves or in a network
have distinguishing ecological characteristics, are important for maintaining habitat
heterogeneity or the viability of a species, or contribute disproportionately to an
ecosystem's health, including its productivity, biodiversity, functioning, structure, or
resilience. This definition is designed to align with how key ecological principles (e.g.,
Foley et al. 2010) are distributed in space. The process of identifying IEAs in any
particular region begins by establishing appropriate ecological criteria that represent these
broad principles. Such ecological criteria (e.g., migration routes, sensitive seafloor
habitats, nursery areas, etc) provide a thematic approach that groups ecological features
together that serve similar ecological roles and might be vulnerable to similar impacts.
Ecological features refer to specific identifiable characteristics or structures that meet the
ecological criteria. Once ecological features in an ecosystem of interest are identified,
the challenge is to gather specific datasets that can be used to indicate how those features
are distributed in space. (See table on p. 19 for examples of ecological criteria and their
corresponding ecological features).
Identifying parcels of the ocean that meet this definition requires evaluation of available
data using consistent methods that highlight the assumptions used. IEAs can be
identified on the basis of single valuation factors, groups of similar valuation factors that
represent similar ecological criteria, or on the basis of a wide suite of ecological factors
that may or may not be related. While many ecological features are static and predictable
(e.g., locations of reefs, bathymetry), others are spatially and/or temporally dynamic (e.g.,
migration routes, oceanographic features), and our definition explicitly includes the
ability to identify dynamic IEAs based on evidence of these features. The flexibility
within this definition allows the identification process to provide a wide suite of outputs,
Oceana Discussion Paper – Important Ecological Areas – August 23, 2010
10
including a relative valuation of areas important in both specific and broad policy
contexts.
Operationally, our process for identifying IEAs begins with specification of a consistent,
formal algorithm for locating places in the ocean that contribute disproportionately to one
or more biological or ecological characteristics that are identified as valued. These may
include habitat types; productivities; biodiversity; habitat requirements for rare,
endangered or threatened species; presence of indicator species, etc. Our procedure for
doing this is presented in Appendix A. Places that contribute to many of these valued
characteristics are especially important, and our approach recognizes this.
The IEAs identified on the basis of our formal identification algorithm provide a spatial
framework and context for identifying other ecological characteristics that are crucial to
ecosystem function but are not amenable to analysis by our algorithm, such as migratory
corridors, larval dispersal pathways, ephemeral oceanographic features such as gyres,
places identified on the basis of local or traditional knowledge (LTK) but not well
appreciated otherwise because of sparse data, and many others. The IEAs identified by
our algorithm provide an efficient means of beginning the conversation with ecologists
and stakeholders to identify additional IEAs not captured by the algorithm.
Our IEA definition requires consideration of data from a variety of sources, including
remote sensing data, species tracking and tagging, fisheries catch, fisheries observers,
surveys, side scan sonar, oceanographic observing systems, and data collected from
experts and resource users. In some regions such as the Arctic and traditional fishing
grounds throughout Alaska and the Pacific Northwest, observations from indigenous
peoples who subsist on marine resources and who have observed their environs closely
for millennia (i.e., LTK) may be among the most reliable sources of data available for
identifying IEAs. Gathering and digitizing LTK is a sharing process where we receive
critical information and where necessary, appropriate and possible, we reciprocate by
sharing the database of information, the IEA atlas generated, and our technical GIS
capacity. Methods for identifying IEAs should be able to efficiently collect information
relevant for identifying IEAs from these disparate sources, accommodate differences in
temporal and area coverage, and weigh them in a rational and transparent manner.
As an essentially empirical approach, our method for identifying IEAs empirically has
three immediate practical advantages. First, the process can proceed on the basis of
incomplete but readily available data. A detailed knowledge of ecosystem functioning is
not essential, although when available such knowledge may strengthen confidence in the
determinations made. Second, assembling the available data in a single geo-referenced
database linked with references to literature and other sources creates a library of
information that can be used to evaluate criteria for comparing and prioritizing IEAs, for
evaluating potential threats to their ecological functioning presented by on-going or
proposed human impacts, and for evaluating whether particular IEAs warrant additional
protections through management measures. Third, the mapped distributions of marine
resources and their spatial interrelations provide the essential foundation for Marine
Spatial Planning.
Oceana Discussion Paper – Important Ecological Areas – August 23, 2010
11
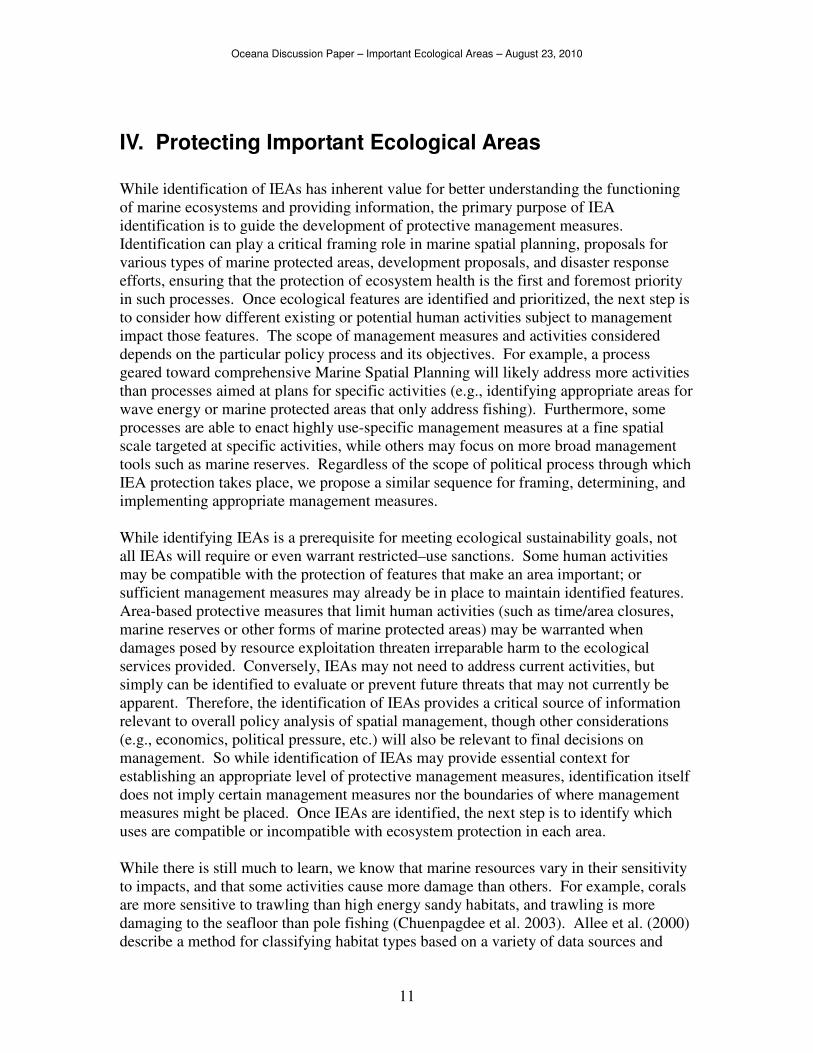
IV. Protecting Important Ecological Areas
While identification of IEAs has inherent value for better understanding the functioning
of marine ecosystems and providing information, the primary purpose of IEA
identification is to guide the development of protective management measures.
Identification can play a critical framing role in marine spatial planning, proposals for
various types of marine protected areas, development proposals, and disaster response
efforts, ensuring that the protection of ecosystem health is the first and foremost priority
in such processes. Once ecological features are identified and prioritized, the next step is
to consider how different existing or potential human activities subject to management
impact those features. The scope of management measures and activities considered
depends on the particular policy process and its objectives. For example, a process
geared toward comprehensive Marine Spatial Planning will likely address more activities
than processes aimed at plans for specific activities (e.g., identifying appropriate areas for
wave energy or marine protected areas that only address fishing). Furthermore, some
processes are able to enact highly use-specific management measures at a fine spatial
scale targeted at specific activities, while others may focus on more broad management
tools such as marine reserves. Regardless of the scope of political process through which
IEA protection takes place, we propose a similar sequence for framing, determining, and
implementing appropriate management measures.
While identifying IEAs is a prerequisite for meeting ecological sustainability goals, not
all IEAs will require or even warrant restricted–use sanctions. Some human activities
may be compatible with the protection of features that make an area important; or
sufficient management measures may already be in place to maintain identified features.
Area-based protective measures that limit human activities (such as time/area closures,
marine reserves or other forms of marine protected areas) may be warranted when
damages posed by resource exploitation threaten irreparable harm to the ecological
services provided. Conversely, IEAs may not need to address current activities, but
simply can be identified to evaluate or prevent future threats that may not currently be
apparent. Therefore, the identification of IEAs provides a critical source of information
relevant to overall policy analysis of spatial management, though other considerations
(e.g., economics, political pressure, etc.) will also be relevant to final decisions on
management. So while identification of IEAs may provide essential context for
establishing an appropriate level of protective management measures, identification itself
does not imply certain management measures nor the boundaries of where management
measures might be placed. Once IEAs are identified, the next step is to identify which
uses are compatible or incompatible with ecosystem protection in each area.
While there is still much to learn, we know that marine resources vary in their sensitivity
to impacts, and that some activities cause more damage than others. For example, corals
are more sensitive to trawling than high energy sandy habitats, and trawling is more
damaging to the seafloor than pole fishing (Chuenpagdee et al. 2003). Allee et al. (2000)
describe a method for classifying habitat types based on a variety of data sources and
Oceana Discussion Paper – Important Ecological Areas – August 23, 2010
12
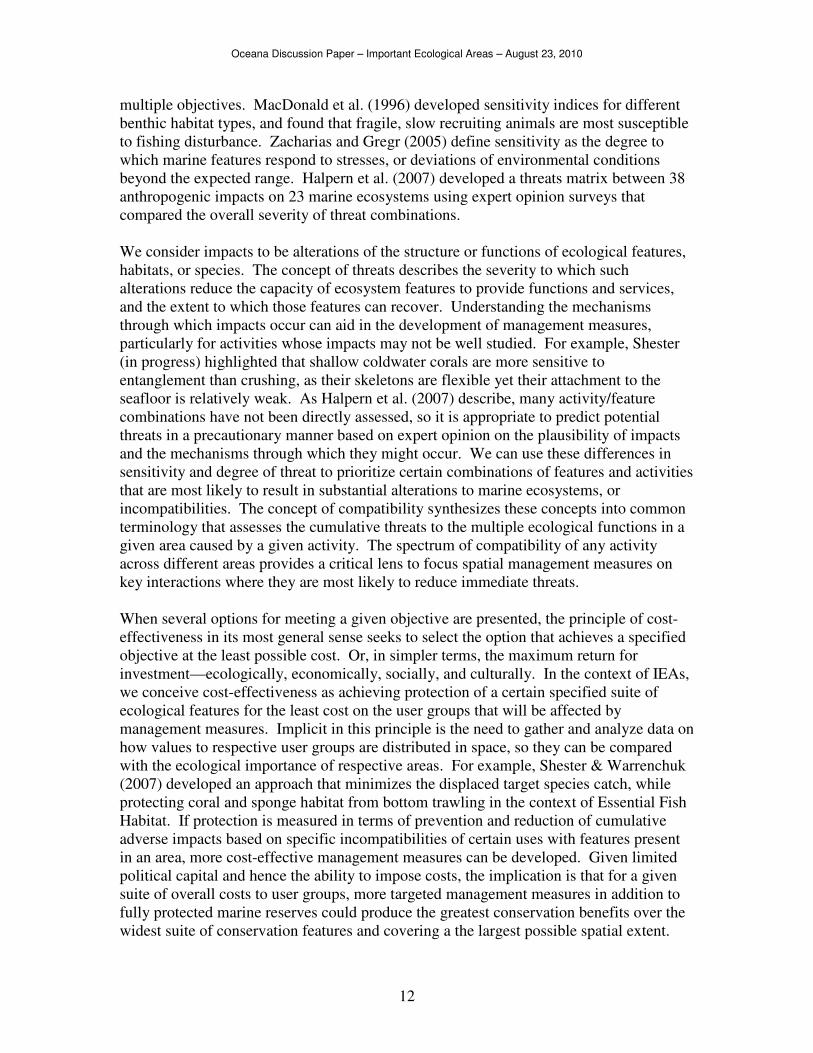
multiple objectives. MacDonald et al. (1996) developed sensitivity indices for different
benthic habitat types, and found that fragile, slow recruiting animals are most susceptible
to fishing disturbance. Zacharias and Gregr (2005) define sensitivity as the degree to
which marine features respond to stresses, or deviations of environmental conditions
beyond the expected range. Halpern et al. (2007) developed a threats matrix between 38
anthropogenic impacts on 23 marine ecosystems using expert opinion surveys that
compared the overall severity of threat combinations.
We consider impacts to be alterations of the structure or functions of ecological features,
habitats, or species. The concept of threats describes the severity to which such
alterations reduce the capacity of ecosystem features to provide functions and services,
and the extent to which those features can recover. Understanding the mechanisms
through which impacts occur can aid in the development of management measures,
particularly for activities whose impacts may not be well studied. For example, Shester
(in progress) highlighted that shallow coldwater corals are more sensitive to
entanglement than crushing, as their skeletons are flexible yet their attachment to the
seafloor is relatively weak. As Halpern et al. (2007) describe, many activity/feature
combinations have not been directly assessed, so it is appropriate to predict potential
threats in a precautionary manner based on expert opinion on the plausibility of impacts
and the mechanisms through which they might occur. We can use these differences in
sensitivity and degree of threat to prioritize certain combinations of features and activities
that are most likely to result in substantial alterations to marine ecosystems, or
incompatibilities. The concept of compatibility synthesizes these concepts into common
terminology that assesses the cumulative threats to the multiple ecological functions in a
given area caused by a given activity. The spectrum of compatibility of any activity
across different areas provides a critical lens to focus spatial management measures on
key interactions where they are most likely to reduce immediate threats.
When several options for meeting a given objective are presented, the principle of cost-
effectiveness in its most general sense seeks to select the option that achieves a specified
objective at the least possible cost. Or, in simpler terms, the maximum return for
investment—ecologically, economically, socially, and culturally. In the context of IEAs,
we conceive cost-effectiveness as achieving protection of a certain specified suite of
ecological features for the least cost on the user groups that will be affected by
management measures. Implicit in this principle is the need to gather and analyze data on
how values to respective user groups are distributed in space, so they can be compared
with the ecological importance of respective areas. For example, Shester & Warrenchuk
(2007) developed an approach that minimizes the displaced target species catch, while
protecting coral and sponge habitat from bottom trawling in the context of Essential Fish
Habitat. If protection is measured in terms of prevention and reduction of cumulative
adverse impacts based on specific incompatibilities of certain uses with features present
in an area, more cost-effective management measures can be developed. Given limited
political capital and hence the ability to impose costs, the implication is that for a given
suite of overall costs to user groups, more targeted management measures in addition to
fully protected marine reserves could produce the greatest conservation benefits over the
widest suite of conservation features and covering a the largest possible spatial extent.
Oceana Discussion Paper – Important Ecological Areas – August 23, 2010
13
For uses that are proposed or not yet established, the identification of IEAs may serve as
an important framing tool to remove certain areas from consideration altogether. For
example, in the context of identifying potential sites for wind or wave energy generation,
it may be appropriate to exclude consideration of placement in some IEAs, depending on
the features identified. Once these areas are off the table, additional data on potential use
values in different areas as well as a comprehensive analysis for compatibility with a
wide suite of ecological features (as identified in the accompanying IEA atlas) could help
determine the most appropriate areas for such activities. This example illustrates the
value of identifying IEAs prior to allowing expanded new activities, since it is often
much more costly and politically challenging to prohibit activities in areas once already
established.
V. Monitoring and Adaptive Management of Important Ecological Areas
Regardless of whether protective management measures are conferred on IEAs, their
recognition and monitoring help provide critical information useful for managers,
conservation groups, local communities, and the broader public. Monitoring in the
context of IEAs generally refers to the process of collecting information about variables
(i.e. abundance, size, temperature) over time for the purpose of detecting change (Gerber
et al. 2005). The three primary objectives of monitoring IEAs are:
1. Evaluating the effectiveness of management measures in sustaining the ecosystem
services furnished by IEAs;
2. Better understanding the impacts of human activities on ecological features; and
3. Distinguishing secular environmental changes from those caused by specific
activities.
Existing approaches to monitoring have focused on maximizing statistical power (i.e.,
Thompson and Mapstone 2002), which helps determine confidence of observed changes.
Ideally, a scientifically-designed monitoring system should be implemented in each IEA
to ensure data are useful for adaptive management. An excellent example of a long-term
monitoring program is PISCO (Partnership for Interdisciplinary Studies of Coastal
Oceans http://www.piscoweb.org/), which has an existing network of coastal monitoring
sites along the Pacific West Coast. In addition the Integrated Ocean Observing System
(http://ioos.gov), provides a central data portal for oceanographic data useful for
monitoring IEAs, and is divided into 11 regional associations in the U.S. The statistical
component of monitoring is also relevant for design of IEA networks and monitoring
programs, because the replication of different treatments (i.e. management measures)
applied in similar areas is needed to detect change. The overall network of IEAs should
be designed with adequate statistical power so the efficacy of the management measures
can be confidently evaluated.

Oceana Discussion Paper – Important Ecological Areas – August 23, 2010
14
Additionally, since the social costs and benefits of spatial management measures are
sometimes poorly known or predicted, emphasis needs to be placed on socioeconomic
monitoring that tracks the changes to economic opportunities following implementation
of new management measures for an IEA. Observations by resource users operating
within or nearby IEAs provide an invaluable source of monitoring information. These
data include information on the distribution and magnitude of uses before and after
implementation of any management measures. If resource users collect data for
monitoring, they take a more active role in the ongoing management of IEAs while
providing more cost-effective monitoring.
Monitoring efforts must be developed and considered in the context of management
objectives for each IEA and the specific ecological functions for which it was identified.
For example, monitoring of some IEAs might focus on populations of specific species
where in other cases monitoring may focus on changes in overall diversity. Gerber et al.
(2005) recommend that changes in management measures should be triggered by specific
monitoring results that are based on objectives set for the area. Monitoring priorities may
change over time, for example monitoring a specific feature may be reduced after an
objective is met. Finally, monitoring decisions should balance costs of increased
monitoring effort and expected management benefits.
Results from monitoring should be communicated and discussed in an open forum aimed
at using these results to inform adaptive management. The forums could take the format
of regional periodic workshops to discuss the ‘state of the ecosystem’ with a range of
stakeholders and managers. These regional ecosystem forums would provide
opportunities for agencies, communities, and environmental and industry stakeholders to
discuss ecosystem health and potential adaptive management measures for IEAs. The
regional ecosystem forums could then make recommendations to the appropriate agency
for management of activities within the IEA.
Finally, all information on the identification, monitoring, and management of IEAs
should be made widely available to the public. Since relatively few members of the
public may have the opportunity or resources to physically visit particular IEAs, a strong
effort should be made to bring the experience to the public. A broad effort for public
education and information sharing through dockside interpretive displays, ocean
roadmaps, and web pages would strengthen the public’s sense of ownership and
responsibility for IEAs.
VI. Conclusion
The process of identifying, protecting, and monitoring Important Ecological Areas is
intended to be dynamic and on-going, in the sense that it should be re-iterated as new
information becomes available. It can be used both to address current threats to
ecosystem health and to help guide responsible and sustainable development. Important
ecological areas are not generally intended to result in marine reserves, though in certain
cases reserve designation may be warranted. Nor should the boundaries of IEAs be
Oceana Discussion Paper – Important Ecological Areas – August 23, 2010
15
assumed to signify where management boundaries will be located. Rather, IEAs provide
useful synthesis of geospatial data to help frame policy debates and processes,
particularly marine spatial planning, so that ecosystem protection is the top priority and
constraint under which decisions about appropriate uses should abide.
The primary product of the IEA approach is a comprehensive ecological atlas that may be
used to evaluate threats to IEAs and to formulate arguments to counter or better inform
proposals for new activities when appropriate. The atlas integrates scientific and LTK
information in a single, accessible resource and decision support tool. This resource
facilitates rapid response in reaction to development proposals, which in many cases may
be decisive in persuading modification, relocation, deferral or even cancellation if
warranted.
The process of moving from IEA identification to management measures and ultimately
to adaptive management and monitoring is certainly complex and will vary by political
process, geography, stakeholders, and policy objectives. For this reason, the concepts
and methodologies embedded within the IEA approach are designed to be flexible and
adaptable to a broad suite of policy contexts. Ultimately, the value of IEAs lies in their
ability to effectively prioritize conservation efforts that will protect, maintain, and restore
the resilience of ocean ecosystems in the face of an ever increasing human population.
Acknowledgments
The authors are indebted to Raychelle Daniel, Henry Huntington, Stanley Senner, Mark
Carr, Charles ‘Pete’ Peterson, Michael Hirshfield, Matt Armsby, Melissa Foley, and
Whit Sheard whose insightful comments helped us clarify our thinking, concepts, and
writing.

Oceana Discussion Paper – Important Ecological Areas – August 23, 2010
16
VII. References Agardy, T., Bridgewater P., Crosby M. P., Day J., Dayton P. K., Kenchington R., Laffoley D., McConney
P., Murray P. A., Parks J. E., and Peau L. 2003. Dangerous Targets? Unresolved Issues and
Ideological Clashes around Marine Protected Areas. Aquatic Conservation: Marine and
Freshwater Ecosystems. 13. 353-367.
Airame, S., Dugan, J.E., Lafferty, K.D., Leslie, H., McArdle, D.A., and Warner, R.R. 2003. Applying
ecological criteria to marine reserve design: A case study from the California Channel Islands.
Ecological Applications, 13(1) Supplement, 2003, pp. S170–S184.
Allee, R.J., Dethier M., Brown D., Deegan L., Ford R.G., Hourigan T.F., Maragos J., Schoch C., Sealey K.,
Twilley R., Weinstein M.P., and Yoklavich M. 2000. Marine and Estuarine Ecosystem and
Habitat Classification, NOAA Technical Memorandum NMFS-F/SPO-43. US Department of
Commerce - NOAA - Fisheries. Silver Spring, MD.
Allison G.W., Lubchenco J., and Carr, M H. 1998. Marine reserves are necessary but not sufficient for
marine conservation. Ecological Applications 8:S79-S92.
Ardron, J.A., Lash, J., and Haggarty, D. 2002. Modelling a Network of Marine Protected Areas for the
Central Coast of British Columbia. Version 3.1. Living Oceans Society, Sointula, BC, Canada.
Ball, I.R., H.P. Possingham, and M. Watts. 2009. Marxan and relatives: Software for spatial conservation
prioritisation. Chapter 14: Pages 185-195 in Spatial conservation prioritisation: Quantitative
methods and computational tools. Eds Moilanen, A., K.A. Wilson, and H.P. Possingham. Oxford
University Press, Oxford, UK.
Beck, M.W., Z. Ferdaña, J. Kachmar, K.K. Morrison, P. Taylor and others. 2009. Best Practices for Marine
Spatial Planning. The Nature Conservancy, Arlington, VA. 25 pp.
Boersma, P.D., and Parrish, J.K. 1999. Limiting abuse: marine protected areas, a limited solution.
Ecological Economics 31:287-304.
Breeze, H. 2004. Review of criteria for selecting ecologically significant areas of the Scotian shelf and
slope: A discussion paper. Ocean and Coastal Management Report 2004-04. Fisheries and Oceans
Canada, Bedford Institute of Oceanography.
Bryant, D., L. Burke, J. McManus, and M. Spalding. 1998. Reefs at risk: a map-based indicator of threats
to the world’s coral reefs. World Resources Institute, Washington, D.C.
Caldeira, K., and Wickett M.E. 2005. Ocean model predictions of chemistry changes from carbon dioxide
emissions to the atmosphere and ocean. Journal of Geophysical Research 110:C09S04.
Chuenpagdee, R., Morgan, L.E., Maxwell, S., Norse, E.A., and Pauly, D. 2003. Shifting gears: assessing
collateral impacts of fishing methods in US waters. Frontiers in Ecology and the Environment
1(10):517-524.
Crutzen, P. J., and Stoermer, E.F. 2000. The 'Anthropocene'. Global Change Newsletter 41:17-18.
Day, V., Paxinos, R., Emmett, J., Wright, A., and Goecker, M. 2007. The Marine Planning Framework for
South Australia: A new ecosystem-based zoning policy for marine management. Marine Policy
doi:10.1016/j.marpol.2007.10.009.
Derous, S., Agardy, T., Hillewaert, H., Hostens, K., Jamieson, G., Lieberknecht, L., Mees, J., Moulaert, I.,
Olenin, S., Paelinckx, D., Rabaut, M., Rachor, E., Roff, J., Stienen, E.W.M., van der Wal, J.T.,
Van Lancker, V., Verfaillie, E., Vincx, M., Weslawski, J.M., and Degraer, S. (2007). A concept
for biological valuation in the marine environment. Oceanologia 49 (1), 99-128
Foley, M.M., Halpern, B.S., Micheli, F., Armsby, M.H., Caldwell, M.R., Crain, C.M., Prahler, E., Rohr, N.,
Sivas, D., Beck, M.W., Carr, M.H., Crowder, L.B., Duffy, J.E., Hacker, S.D., McLeod, K.L,,
Palumbi, S.R., Peterson, C.H., Regan, H.M., Ruckelshaus, M.H., Sandifer, P.A., and Steneck,
R.S.. 2010. Guiding ecological principles for marine spatial planning. Marine Policy
doi:10.1016/j.marpol.2010.02.001.
Game, E.T. and Grantham, H.S.. (2008). Marxan User Manual: For Marxan version 1.8.10. University of
Queensland, St. Lucia, Queensland, Australia, and Pacific Marine Analysis and Research
Association, Vancouver, British Columbia, Canada.
Gerber, L.R., Beger, M., McCarthy, M.A., and Possingham, H.P. 2005. A theory for optimal monitoring of
marine reserves. Ecology Letters 8:829-837.
Oceana Discussion Paper – Important Ecological Areas – August 23, 2010
17
Hastings, A. and Botsford, L.W. Persistence of spatial populations depends on returning home. Proceedings
of the National Academy of Sciences of the United States of America 2006;103(15):6067–72.
Halpern, B.S., Selkoe, K.A., Micheli, F., and Kappel, C.V. 2007. Evaluating and ranking the vulnerability
of global marine ecosystems to anthropogenic threats. Conservation Biology 21(5): 1301 – 1315.
Hilborn, R., Stokes, K., Maguire, J.J., Smith, T., Botsford, L.W., Mangel, M., Orensanze, J., Parma, A.,
Rice, J., Bell, J., Cochrane, K.L., Garcia, S., Hall, S.J., Kirkwood, G.P., Sainsbury, K., Stefansson,
G., and Walters, C. 2004. When can marine reserves improve fisheries management? Ocean &
Coastal Management 47:197-205.
Interagency Ocean Policy Task Force (IOPTF) 2010. Final Recommendations Of The Interagency Ocean
Policy Task Force. 77 pp. The White House Council on Environmental Quality
http://www.whitehouse.gov/files/documents/OPTF_FinalRecs.pdf.
IPCC. 2007. Climate change 2007: The physical science basis. Contribution of Working Group I to the
Fourth Assessment Report of the Intergovernmental Panel on Climate Change. Cambridge
University Press, Cambridge, U.K.
Kappel, C.V. 2005. Losing pieces of the puzzle: threats to marine, estuarine, and diadromous species.
Frontiers in Ecology and the Environment 3:275–282.
Kappel, C.V., Halpern, B.S., Martone, R.G., Micheli, F., and Selkoe, K.A. 2009. In the zone:
comprehensive ocean protection. Issues in Science and Technology 22-MAR-09.
Kirkpatrick, S., Gelatt, C.D., and Vecchi, M.P. 1983. Optimisation by simulated annealing. Science 220:
671-680.
Lauck, T., Clark, C.W., Mangel, M., and Munro, G.R., 1998. Implementing the precautionary principle in
fisheries management through marine reserves. Ecological Applications 8:S72-S78.
Lee, K.N. 1993. Compass and Gyroscope: Integrating Science and Politics for the Environment. Island
Press, 1718 Connecticutt Ave. NW, Washington, DC 20009-1148.
Leslie, H., Ruckelshaus, M., Ball, I. R., Andelman, S., and Possingham, H. P. 2003. Using siting
algorithms in the design of marine reserve networks. Ecological Applications 13
Supplement:S185-S198.
Lubchenco, J., Palumbi, S.R., Gaines, S.D., and Andelman, S. 2003. Plugging a hole in the ocean: the
emerging science of marine reserves. Ecological Applications 13 Supplement:S3-S7.
Macdonald, D.S., Little, M., Eno, N.C., and Hiscock, K. 1996. Disturbance of benthic species by fishing
activities: a sensitivity index. Aquatic Conservation 6:257-268.
Menge B.A., Sanford E., Daley B.A., Freidenburg T.L., Hudson G., and Lubchenco J. Inter-hemispheric
comparison of bottom-up effects on community structure: insights revealed using the comparative-
experimental approach. Ecological Research 2002;17(1):1–16.
Marine Life Protection Act. 2004 (as amended). California Fish and Game Code Sections 2850-2863.
Available online at: http://www.dfg.ca.gov/mlpa/pdfs/mlpa_language.pdf.
Massachusetts Ocean Management Plan. 2009. The Commonwealth of Massachusetts. Executive Office
of Energy and Environmental Affairs. December 2009. Available at:
http://www.mass.gov/?pageID=eoeeasubtopic&L=3&L0=Home&L1=Ocean+%26+Coastal+Man
agement&L2=Massachusetts+Ocean+Plan&sid=Eoeea.
Morgan, L.E., Etnoyer, P., Wilkinson, T., Herrmann, H., Tsao, C.F., and Maxwell, S.. (2004). Identifying
priority conservation areas from Baja California to the Bering Sea. Marine Conservation Biology
Institute. Available at: http://www.mcbi.org/what/b2b.htm.
Mumby, P.J., Edwards, A.J., Arias-Gonzalez, J.E., Lindeman, K.C., Blackwell, P.G., Gall, A., Gorczynska,
M.I., Harborne, A.R., Pescod, C.L., Renken, H., Wabnitz, C.C.C., and Llewellyn, G. 2004.
Mangroves enhance the biomass of coral reef fish communities in the Caribbean. Nature 427:533-
536. 5 February 2004
Myers, R.A., Baum, J.K., Shepherd, T.D., Powers, S.P., and Peterson, C.H. 2007. Cascading effects of the
loss of apex predatory sharks from a coastal ocean. Science 315:1846-1850.
National Research Council. 2001. Marine Protected Areas: Tools for Sustaining Ocean Ecosystems.
National Academy Press, Washington, D.C.
Navarrete, S.A. and Menge, B.A. 1996. Keystone predation and interaction strength: interactive effects of
predators on their main prey. Ecological Monographs 66(4):409–29.
Nur, N., Jahncke, J., Herzog, M., Howar, J., Hyrenbach, K.D., Ainley, D.G., Wiens, J.A., Ballance, L.,
Morgan, K., Zamon, J.E., and Stralberg, D. Where the wild things are: Predicting hotspots of
seabird aggregations in the California Current system. Ecological Applications (in press).
Oceana Discussion Paper – Important Ecological Areas – August 23, 2010
18
Oksanen, L., Fretwell, S.D., Arruda, J., and Niemala, P. 1981. Exploitation ecosystems in gradients of
primary productivity. American Naturalist 118:240-261.
Orr, J.C., Fabry, V. J., Aumont, O., Bopp, L., Doney, S.C., Feely, R.A., Gnanadesikan, A., Gruber, N.,
Ishida, A., Joos, F., Key, R.M., Lindsay, K., Maier-Reimer, E., Matear, R., Monfray, P., Mouchet,
A., Najjar, R.G., Plattner, G., Rodgers, K.B., Sabine, C.L., Sarmiento, J.L., Schlitzer, R., Slater, R.
D., Totterdell, I.J., Weirig, M., Yamanaka, Y., and Yool, A. 2005. Anthropogenic ocean
acidification over the twenty-first century and its impact on calcifying organisms. Nature 437:681-
686.
Paine, R.T. 1966. Food Web Complexity and Species Diversity". The American Naturalist 100 (910): 65–
75.
Paine, R.T. 1980. Foodwebs—linkage, interaction strength and community infrastructure—the 3rd
tansley
lecture. Journal of Animal Ecology 49(3):667–85.
Pauly, D., Christensen, V., Guénette, S., Pitcher, T. J., Sumaila, U. R., Walters, C. J., Watson, R. and
Zeller, D. 2000. Towards sustainability in world fisheries. Nature 418:689-695.
Polacheck, T. 1990. Year round closed areas as a management tool. Natural Resource Modeling 4:327-354.
Power, M.E., Tilman, D., Estes, J.A., Menge, B.A., Bond, W.J., Mills, L.S., Daily, G., Castilla, J.C.,
Lubchenco, J., and Paine, R.T. 1996. Challenges in the quest for keystones. Bioscience 46(8):
609-620.
Roberts, C.M., 2000. Selecting marine reserve locations: optimality versus opportunism. Bulletin of Marine
Science. 66:581-592.
Shanks, A.L., Grantham, B.A., and Carr, M.H. Propagule dispersal distance and the size and spacing of
marine reserves. Ecological Applications 2003;13(1): S69–S159.
Soule, M.E., Estes, J.A., Miller, B., and Honnold, D.L. Strongly interacting species, conservation policy,
management, and ethics. Bioscience 2005;55(2): 168–76.
Shester, G. and Warrenchuk, J. 2007. U.S. Pacific coast experiences in achieving deep-sea coral
conservation and marine habitat protection. Bulletin of Marine Science 81:169-184.
Thayer, J.A. and Sydeman, W.J. Spatio-temporal variability in prey harvest and reproductive ecology of a
piscivorous seabird, Cerorhinca monocerata, in an upwelling system. Marine Ecology-Progress
Series 2007;329: 253–65.
Thompson, A.A. and Mapstone, B.D. 2002. Intra- versus inter-annual variation in counts of reef fishes and
interpretations of long-term monitoring studies. Marine Ecology Progress Series 232:247-257.
Watts, M.E, Ball, I.R., Stewart, R.R., Klein, C.J., Wilson, K., Steinback, C., Lourival, R., Kircher, L., and
Possingham, H.P.. 2009. Marxan with Zones: software for optimal conservation based land- and
sea-use zoning, Environmental Modelling & Software (2009), doi:10.1016/j.envsoft.2009.06.005.
Weng, K.C., Boustany, A.M., Pyle, P., Anderson, S.D., Brown, A., and Block, B.A. 2007. Migration and
habitat of white sharks (Carcharodon carcharias) in the eastern Pacific Ocean. Marine Biology.
DOI 10.1007/s00227-007-0739-4.
Weng, K.C., Foley, D.G., Ganong, J.E., Perle, C., Shillinger, G.L., and Block, B.A. 2008. Migration of an
upper trophic level predator, the salmon shark Lamna ditropis, between distant ecoregions. Mar
Ecol Prog Ser 372: 253–264.
Zacharias, M. A. and Gregr, E. J. 2005. Sensitivity and vulnerability in marine environments: an approach
to identifying vulnerable marine areas. Conservation Biology 19:86-97.
Zeidberg, L., Miller, C., and Booth, J.A. 2010. Quantifying spawning habitat for the California market
squid, Doryteuthis opalescens. Poster presentation at 2010 Sanctuary Currents Symposium,
Monterey, CA.

Oceana Discussion Paper – Important Ecological Areas – August 23, 2010
19
Table: Example thematic groupings of ecological features by criteria and relevant considerations.
Ecological criteria
Description Examples of specific features
Example references Potential management considerations
Special considerations
Sensitive benthic habitats:
areas containing structural features and species impacted by activities that contact seafloor habitat.
Rocky reefs, corals, sponges, trawl hangs
Shester & Warrenchuk 2007 (Aleutian Islands & US west coast EFH)
Bottom contact activities, undersea cables, sedimentation
Pelagic migratory corridors:
areas used disproportionately by one or more pelagic species during their migration to and from foraging and breeding areas.
Migration routes for whales, sea turtles, swordfish, etc.
NMFS leatherback critical habitat; Weng et al. 2007, 2008; bowhead migration; gray whale migration
Entanglement with pelagic fishing gears (drift gillnets, pelagic longlines) or obstruction by large permanent structures
May exhibit spatio-temporal variation based on ocean conditions
Foraging areas: areas where oceanographic features support consistent and predictable high relative abundances of forage species and attract aggregations of higher trophic group predators.
Krill aggregations, spawning aggregations for key forage species
Seabird foraging hotspots (Nur et al., in press)
Activities that disrupt successful foraging; harvest of forage species
May exhibit spatiotemporal variation based on ocean conditions; determine whether area-based management affects overall availability to predators
Nesting, resting, and rearing areas:
areas where congregations of one or multiple species seek refuge as they tend to highly vulnerable offspring.
Sea turtle nesting beaches, marine mammal rookeries, seabird nesting colonies, polynyas
MLPA special closures Direct harvest of eggs, activities that cause nest abandonment or disturbance
May require distance buffers to prevent nest/pup abandonment
Spawning and breeding areas:
areas where one or more species congregates for reproductive purposes.
Spawning aggregations for grouper, herring, squid
Zeidberg et al. 2010 (squid spawning areas)
Activities that may disrupt successful reproduction; harvest of species
Nursery areas: areas where larval or juvenile life stages of one or more species seek refuge and experience lower mortality rates than surrounding areas during this critical life history stage.
Kelp forests, eelgrass beds, estuaries, deep-sea corals, coastal marshes, mangroves
Mumby et al. 2004 (Mangroves as nursery areas)
Development activities, water quality, harvest of species
Species may be obligate or facultative habitat use, and may be present for certain times of the year. Habitat extent may also show annual to interannual variability (e.g. kelp).
Primary and secondary productivity:
areas where oceanographic features support consistently high primary productivity relative to other areas.
Chlorophyll concentrations, benthic infaunal biomass
Oksanen et al. 1981 Indicative of foraging areas and high diversity, important for monitoring
Larval production and settlement areas:
areas where species with small adult home ranges and mid-range larval dispersal are found in higher numbers and/or have habitat features conducive to larval retention and survival.
Leeward areas at coastal points; kelp forests; rocky reefs
MLPA closures (SAT size and spacing guidelines)
Harvest of adults of identified species; protection of habitat features
Areas should encompass adult home range size and be arranged in a network such that spacing does not exceed larval dispersal distances
Habitat and species diversity:
areas where a high amount of heterogeneous habitat types or species are found in a small amount of area.
Multiple habitat types within small spatial extent, representative species assemblages
Airame et al. 2003 (Channel Islands reserve design)
Representative areas for monitoring; marine reserve design
Can be used as a proxy for species diversity if data on species is poor
Vulnerable species areas:
areas where high relative densities of endangered, threatened, overfished or other vulnerable species are found in high numbers.
ESA critical habitats; high habitat suitability for overfished species
IUCN, ESA listings Activities that may take or otherwise interact with vulnerable species
DRAFT Oceana Discussion Paper – Important Ecological Areas – August 23, 2010
20
VIII. Appendices
A. Using MARXAN to Help Identify Important Ecological Areas
The limitations of methods available for identifying and comparing IEAs suggest a largely
empirical approach. This approach begins with collations of spatially geo-referenced distribution
data for physical, chemical and biological oceanographic parameters such as temperature,
salinity, nutrients, primary and secondary productivity, etc. Of these, primary productivity is
particularly important, because the biomass and to a great extent the complexity of any
ecosystem is limited by it (Oksanen et al. 1981) and it can be synoptically estimated by ocean-
color monitoring satellites. When available, these data on “bottom-up” factors may be
augmented by data on distributions of species at higher trophic levels including fish, birds and
marine mammals.
We use an adaptation of MARXAN, an algorithm originally developed to optimize the design of
marine reserve networks, as an informative, quantitative tool in our approach to identifying
marine IEAs. MARXAN is fundamentally a procedure for efficiently identifying minimal areas
that represent specified environmental features in a region (Ball et al. 2009). Although initially
developed to represent specified proportions of habitat types within the smallest cumulative area
selected for inclusion in a network of proposed marine reserves (e.g., Airame et al. 2003), the
same process can be applied to finding the smallest area that accounts for a specified proportion
of other ecosystem features such as primary productivity, nursery grounds, or biodiversity.
Finding the smallest area then amounts to identifying areas that contribute disproportionately
with respect to the ecological feature of interest, which is consistent with our definition for IEAs.
For example, the smallest area that accounts for 50% of net primary productivity corresponds
with areas where productivity per unit area is greatest, which could be considered productivity
“hotspots” within the region for the purpose of inclusion in an IEA network.
Application of MARXAN involves four procedural steps: (1) partitioning the region of interest
into contiguous sites known as planning units; (2) identifying and processing the data to be
included so that a value for each ecological feature of interest is assigned to each site in a
consistent and comparable manner across features; (3) identifying the constraints to be imposed
that determine the weight accorded to each of the ecological features and the boundary
constraints on the selected areas; and (4) running the MARXAN algorithm to produce an
approximation of the optimal solution under the constraints used. These steps are explained
more fully as follows:
(1) Site identification: MARXAN provides a uniform framework for evaluating if
scenarios of selected sites meet specified conservation targets while minimizing the total
area selected. This framework is defined by a partitioning of the region of interest into
contiguous sites (or “planning units”) that cover the entire region. These sites may be
rectangular or hexagonal in shape, but for our purposes must have equal areas and a
consistent shape, though it is possible to use different size planning units in MARXAN if
DRAFT Oceana Discussion Paper – Important Ecological Areas – August 23, 2010
21
appropriate. The size of the sites should be small relative to the spatial scale of data
variation for each type of data used, but not so small as to extend the time for computations
prohibitively. Once identified, each site retains a fixed location and is identified by an
index denoted as “i” that is unique to each site. The Nature Conservancy’s Best Practices
for Marine Spatial Planning (Beck et al. 2009) provides guidance for the appropriate
selection of geographic boundaries, planning units, and data management.
(2) Data identification and processing: Ecological features are identified based on the
extent to which they represent the ecosystem principles, and can be grouped into themes
representing similar classes. Ideally thematic groupings are arranged so features within
each group have similar management considerations or are impacted by similar activities
(See Table on p. 18). Once determined, the data types to be used for IEA identification
(and associated metadata) must be collected into a database and processed for insertion into
MARXAN. The only requirement for these factors besides their ecological relevance is
amenability to quantitative expression (for intensive variables) or categorical expression
(for extensive variables). Examples of intensive variables include primary productivity
which can be expressed as grams of carbon fixed within the area considered per year and
biodiversity which can be measured with any of several indices (e.g., Shannon diversity
index). Extensive variables, such as habitats can be categorized into multiple types, made
up as a set of polygons covering 100% of the study area. Each planning unit (grid cell)
must contain a single value for intensive variables or a proportion of each category for
extensive variables totaling 100%.
The database must include the spatial and temporal ranges of applicability for each data
type available. Data that are too sparse in space or time, are poorly documented or
unsuitable for other reasons are noted and disqualified for the MARXAN process, but
could be used post-hoc to supplement the MARXAN results. Values for each factor
retained are assigned to each site, which may include values of continuous variables, (e.g.
productivities, densities of species per unit area sea surface or sea floor, etc), values of
qualitative rankings or binary (i.e. presence/absence) data. Where data are unavailable, the
value for that factor is zero. This results in a data matrix A* of elements a*ij denoting the
magnitude of factor j at site i, with a total number of factors and sites denoted by J and I
respectively.
Each MARXAN formulation is optimized in terms of the data matrix A*. Each factor j has
a cumulative value given as:
∑=
=
I
i
ijavJ
1
* i = 1, 2, ..., I
Normalizing each factor by its cumulative value over the region of interest allows
consideration of different factors on a comparable basis, where these normalized values are
simply aij = a*ij / Jv . Hence, aij is the proportion of the cumulative value of factor j that is
present at site i. Site i might be regarded as important for factor j if aij is greater than the

DRAFT Oceana Discussion Paper – Important Ecological Areas – August 23, 2010
22
mean value Jv = Jv / I of factor j. This process results in a matrix A of normalized data,
with elements aij.
(3) Selection of constraints: The problem is to find the smallest collection of sites that
account for a defined proportion of the total value Jv for each factor j, meeting all specified
conservation targets. Following Leslie et al. 2003, these constraints may be represented as:
j
I
i
iij txa ≥∑=1
, j∀
where xi is an indicator variable with a value of 1 if site i is included in the collection and
zero otherwise ( }1,0{∈ix ), and tj is a threshold value that indicates the cumulative
proportion of factor j that is included in the selected sites. Setting tj = 0.5 would lead to a
collection of sites that account for half the cumulative value of factor j. If this collection is
the smallest possible, the included sites will contribute disproportionately to the cumulative
value of factor j in the region. Note that setting tj = 1 requires that all sites for which the
value of factor j is greater than zero be included, providing a means of guaranteeing
inclusion of factors deemed “important” a priori.
The selection of conservation targets (tj) in MARXAN requires an explicit valuation of the
importance of each factor relative to other factors. This valuation could occur through
expert opinion, stakeholder consultation, or potentially through empirical estimation the
relative contribution of each function to ecosystem services with known values. General
principles to consider in valuation across ecological features could include but are not
limited to:
• the ecological significance of respective habitats to maintaining ecosystem structure;
• the rarity of a ecological features;
• the interaction strengths of various species in food webs;
• the vulnerability or sensitivity to impacts or disturbance;
• the relative importance of various life history stages in terms of individual species
population dynamics;
• the population status of respective species (e.g., endangered, threatened, healthy);
• the economic importance of respective ecosystem services; and
• perceived existence value.
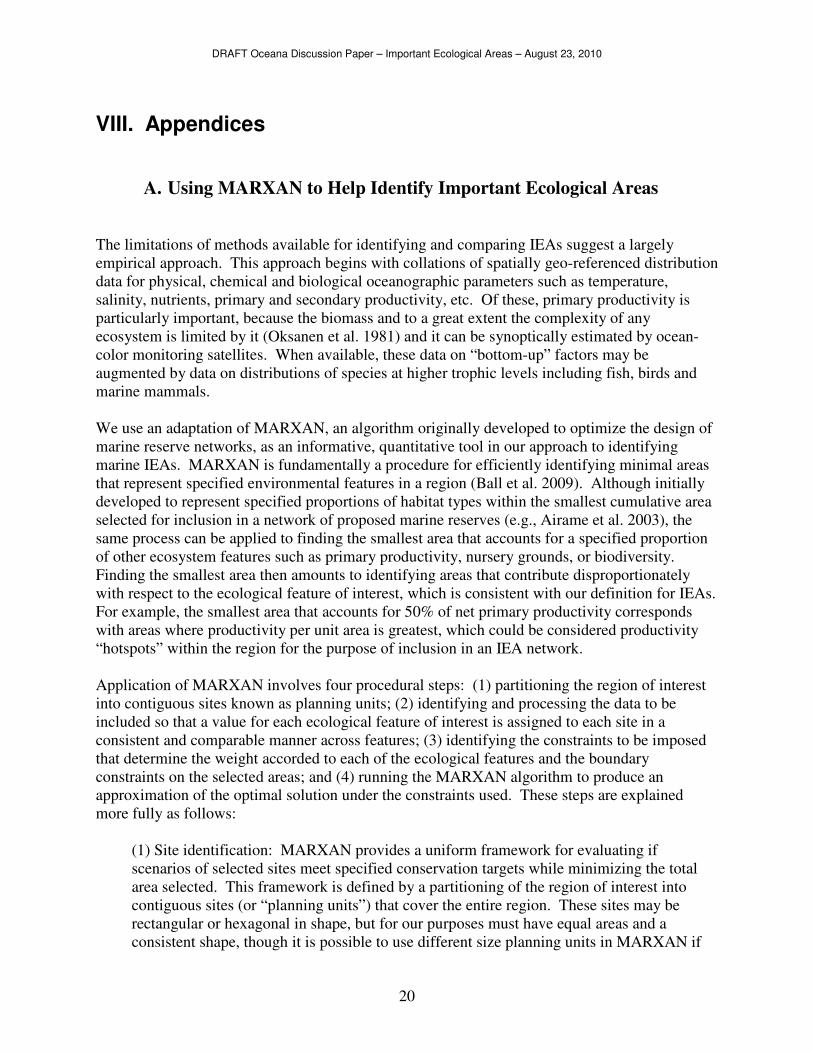
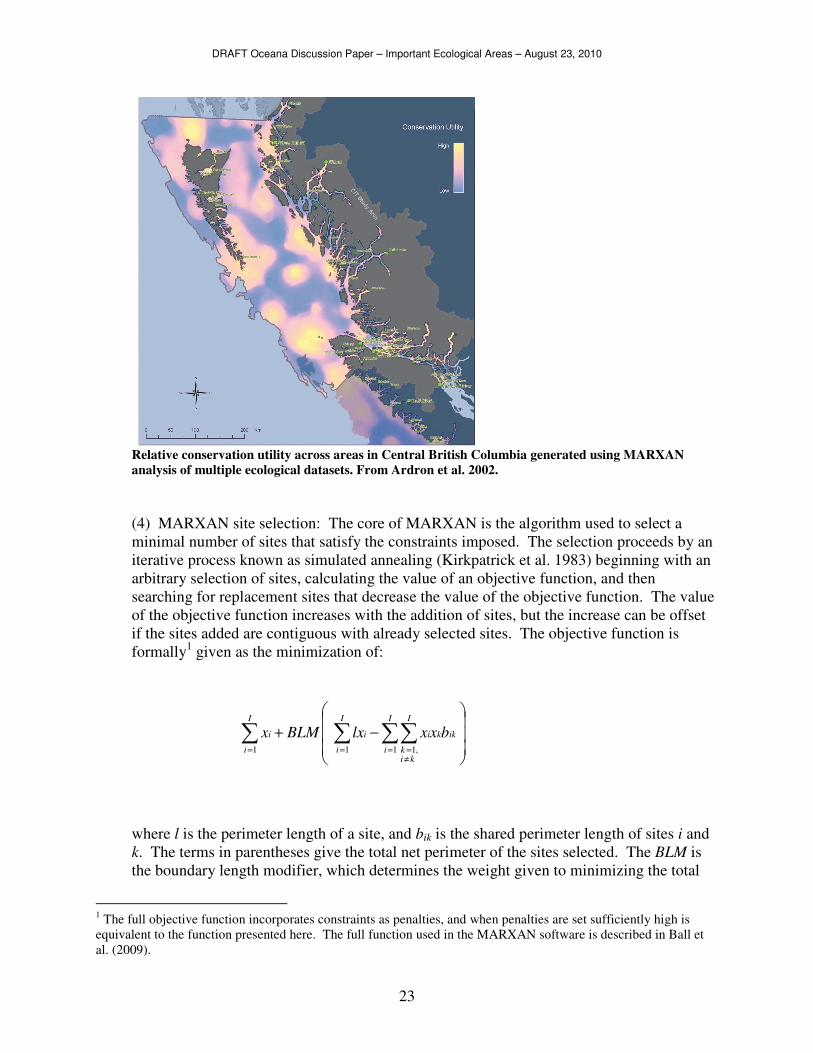
In addition to the relative valuation of factors, the absolute values on a scale of 0-100% will
largely determine the overall spatial coverage. Lower target values will produce results
covering a smaller spatial extent and reflect the areas of highest relative importance. Using
higher target values will also include areas of moderate relative importance and henceforth
a larger spatial extent. Running MARXAN using a variety of scalar multipliers on the
respective conservation target thresholds (tj) and calculating the summed frequency of
inclusion of each site into the selected outputs can thus illuminate peaks and valleys of
relative importance (e.g., Ardron et al. 2002).
DRAFT Oceana Discussion Paper – Important Ecological Areas – August 23, 2010
23
Relative conservation utility across areas in Central British Columbia generated using MARXAN
analysis of multiple ecological datasets. From Ardron et al. 2002.
(4) MARXAN site selection: The core of MARXAN is the algorithm used to select a
minimal number of sites that satisfy the constraints imposed. The selection proceeds by an
iterative process known as simulated annealing (Kirkpatrick et al. 1983) beginning with an
arbitrary selection of sites, calculating the value of an objective function, and then
searching for replacement sites that decrease the value of the objective function. The value
of the objective function increases with the addition of sites, but the increase can be offset
if the sites added are contiguous with already selected sites. The objective function is
formally1 given as the minimization of:
−+ ∑ ∑∑∑= =
≠
==
I
i
I
i
I
kik
ikkii
I
i
i bxxlxBLMx1 1 ,11
where l is the perimeter length of a site, and bik is the shared perimeter length of sites i and
k. The terms in parentheses give the total net perimeter of the sites selected. The BLM is
the boundary length modifier, which determines the weight given to minimizing the total
1 The full objective function incorporates constraints as penalties, and when penalties are set sufficiently high is
equivalent to the function presented here. The full function used in the MARXAN software is described in Ball et
al. (2009).
DRAFT Oceana Discussion Paper – Important Ecological Areas – August 23, 2010
24
perimeter length of the sites selected in comparison with the number of sites selected.
Setting the BLM to zero leads to a solution that includes the smallest number of sites that
satisfy the constraints identified in (3) above, and increasing the BLM puts an increasing
premium on sites that are adjacent. This adds flexibility to the algorithm to value adjacent
sites that satisfy multiple constraints at the expense of efficiency, which may be useful for
identifying IEAs that are important for multiple reasons and are close together (see BLM
Figure below). This formulation assumes all sites have equal costs of inclusion, though it
is also possible to assign variable costs to sites based on economic, political, or other
factors.
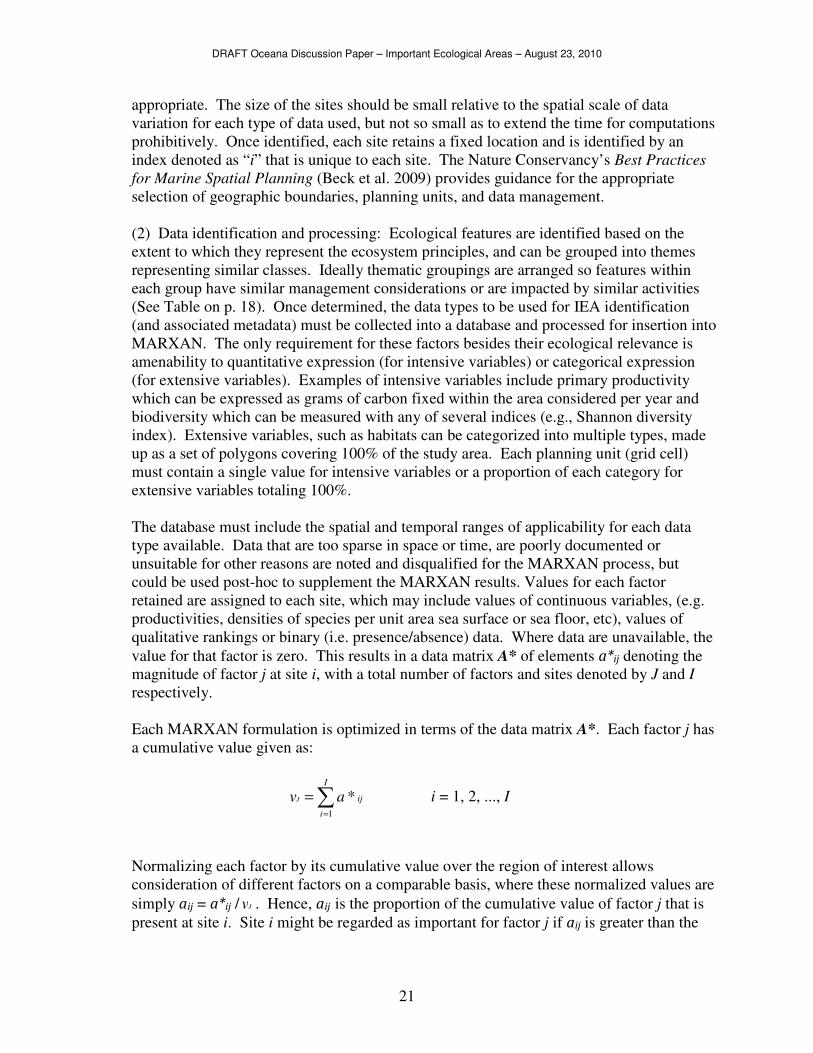
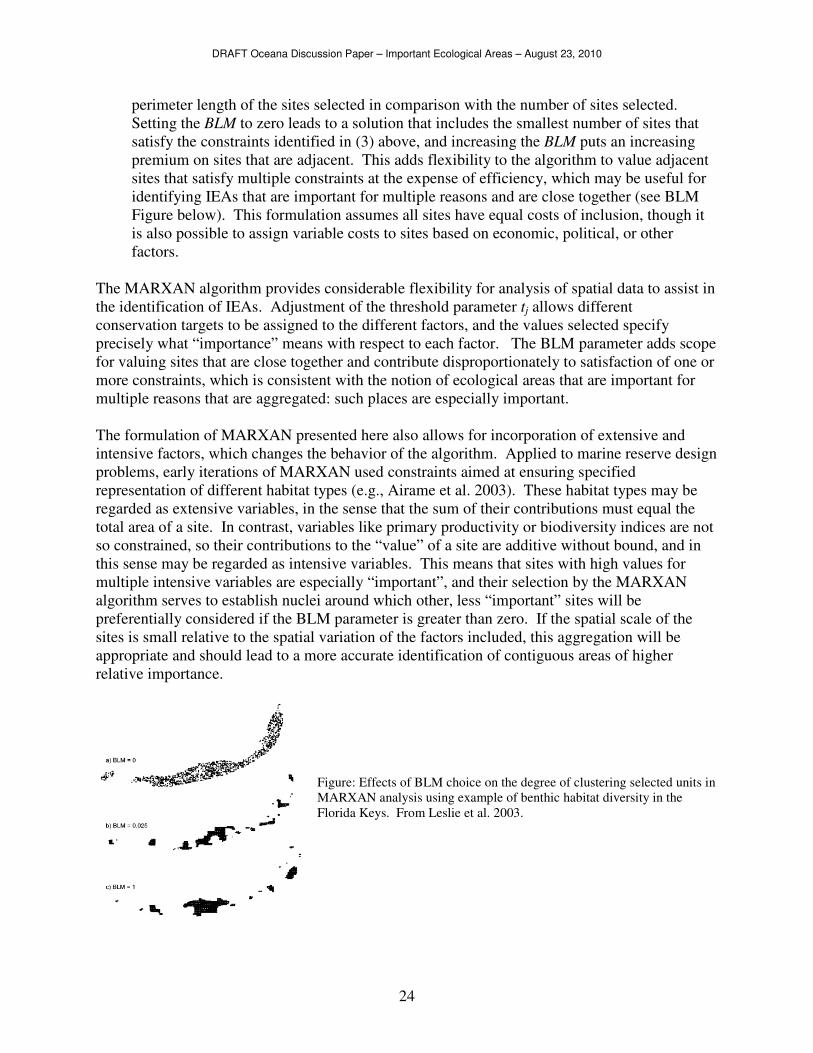
The MARXAN algorithm provides considerable flexibility for analysis of spatial data to assist in
the identification of IEAs. Adjustment of the threshold parameter tj allows different
conservation targets to be assigned to the different factors, and the values selected specify
precisely what “importance” means with respect to each factor. The BLM parameter adds scope
for valuing sites that are close together and contribute disproportionately to satisfaction of one or
more constraints, which is consistent with the notion of ecological areas that are important for
multiple reasons that are aggregated: such places are especially important.
The formulation of MARXAN presented here also allows for incorporation of extensive and
intensive factors, which changes the behavior of the algorithm. Applied to marine reserve design
problems, early iterations of MARXAN used constraints aimed at ensuring specified
representation of different habitat types (e.g., Airame et al. 2003). These habitat types may be
regarded as extensive variables, in the sense that the sum of their contributions must equal the
total area of a site. In contrast, variables like primary productivity or biodiversity indices are not
so constrained, so their contributions to the “value” of a site are additive without bound, and in
this sense may be regarded as intensive variables. This means that sites with high values for
multiple intensive variables are especially “important”, and their selection by the MARXAN
algorithm serves to establish nuclei around which other, less “important” sites will be
preferentially considered if the BLM parameter is greater than zero. If the spatial scale of the
sites is small relative to the spatial variation of the factors included, this aggregation will be
appropriate and should lead to a more accurate identification of contiguous areas of higher
relative importance.
Figure: Effects of BLM choice on the degree of clustering selected units in
MARXAN analysis using example of benthic habitat diversity in the
Florida Keys. From Leslie et al. 2003.

DRAFT Oceana Discussion Paper – Important Ecological Areas – August 23, 2010
25
The ability to force inclusion of sites by setting the threshold value tj = 1 for sites where the
factor is present permits recognition of “fiat” sites, such as sites that are deemed important “no
matter what”. These might, for example, include sites identified on the basis of local and
traditional knowledge (LTK), or critical habitat for rare or endangered species. However,
inclusion of such sites in this manner may introduce a computational artifact known as a “seed
effect”. By stipulating that some sites must be included, adjacent sites will be preferentially
considered if the BLM has a positive value. Hence, it may be useful to run multiple scenarios
with and without such sites to evaluate the magnitude of this effect on the outcome. More
generally, running multiple repetitions of the algorithm with different randomly-chosen site
selections initially provides an indication of the robustness of the results, as sites that are more
consistently retained may be essential to any notion of IEAs in the region considered.
The procedure described above has other limitations besides vulnerability to seed effects.
MARXAN does not consider uncertainty in the data or other aspects of data quality, instead
assuming that all feature representations are true and all occurrences of each feature of equal
value. In addition, some datasets present challenges that are not immediately conducive to the
basic procedure and require either additional processing prior to use or modifications to the
MARXAN parameters. Features such as migratory corridors may not be captured simply by
tracking data or frequency of occurrence data as species spend less time at any point in a
migration than they do at their destination. Pre-processing such data to identify relative
importance of areas as migration corridors will help enable MARXAN to more adequately
account for such features.
Temporal variability, both interannually and seasonally also require some attention before
including in MARXAN. For many features such as foraging grounds, breeding areas, or other
areas used infrequently by widely-ranging predators, the important areas may be consistently
located, but they only serve those functions during specific time periods. Therefore, integrating
their value over an entire year may downplay their importance in certain seasons, so breaking up
the data seasonally may be necessary (see figures below).
Seasonal kernel density estimates for white shark (left, Carcharodon carcharias, Weng et al. 2007) and salmon
shark (right, Lamna ditropis, Weng et al. 2008) offshore movements in the Northeast Pacific.
Other features such as ephemeral oceanographic fronts, eddies, and thermoclines may be
impossible to model in MARXAN. Such features can be extremely important for various species
and ecological processes, but may not be predictable in terms of occurrence within specified
DRAFT Oceana Discussion Paper – Important Ecological Areas – August 23, 2010
26
planning units. Such features might constitute a different type of IEA, that is identified based on
real-time monitoring of such features, rather than through a static geographical boundary (e.g.,
areas identified in near real time by TurtleWatch).
Connectivity issues related to larval dispersal are critical for maintaining metapopulation and
metacommunity dynamics (e.g., Shanks et al. 2003; Hastings and Botsford 2006), though these
can be difficult to incorporate into MARXAN. Recent versions of MARXAN include additional
options that may help address some of these challenges, such as specifying minimum and
maximum separation distances which could be useful for larval dispersal connectivity between
selected sites (MARXAN v. 1.8.10; Game and Grantham 2008). Also, including data types
having widely differing coverage or sampling intensity may introduce potentially serious biases,
so results should always be compared with maps of spatial sampling intensity for each of the data
types included.
One major criticism of MARXAN is that it is not conducive to use by policy-makers and
stakeholders, and it is complex to describe. Even though valuation decisions regarding
conservation targets are explicit and transparent, many stakeholders may consider it a “black-
box” and are suspect of its results, largely because its mechanics are not easily apparent and it
does not have a user interface. However, there is a tradeoff between wide usability and
analytical power. For example, existing interactive spatial decision support tools that may be
more user friendly and accessible to the wider public (e.g., MarineMap2) provide information on
the features contained within different geographic area boundaries and a way to visual multiple
data layers, but do not synthesize or optimize available data. Therefore, while the MARXAN
tool offers analytical power, it is important to consider how to best communicate its results and
how it may be perceived by stakeholders.
Valuation enters the procedure in four direct ways. Even though the selection of data types may
be determined mainly by availability, the decision to include a data type implies the data are
regarded as important for identifying IEAs. Once selected, the choice of the threshold value tj
used reflects a second valuation decision regarding the relative importance of the data types
included. While the overall relative value across features is not addressed explicitly, these
thresholds allow the analyst to select different targets across features. Third, the choice of value
for the BLM reflects the value attached to having areas identified as important for different
reasons being near each other, in other words identifying fewer large contiguous areas versus a
larger number of smaller separate areas, which may be useful depending on policy constraints
such as management measures and enforcement. Since for some datasets and policy settings, it
may be more desirable to identify a fewer number of larger IEAs, the choice of this parameter
affects the degree to which spatially adjacent areas are preferentially selected over simply
meeting the conservation targets. Selecting higher BLM parameters results in spatial clustering
of identified areas, which while in some cases may be desirable, has the effect that greater
overall area is necessary to reach the same conservation targets.
Choice of region and scale introduce the fourth type of valuation. Obviously, specification of the
region determines the value of the normalization factor Jv , so changing the size of the region
may change the normalization used. Consequently, an area may be identified as important at one
2 http://marinemap.org/

DRAFT Oceana Discussion Paper – Important Ecological Areas – August 23, 2010
27
scale but not at others. For example, relatively few areas would be identified in the Beaufort Sea
if the region included for analysis included the Chukchi and Bering seas, because the Bering Sea
is so much more productive than the Beaufort Sea. But if the region included for analysis were
limited to only the Beaufort Sea, the lower normalization that would result for most ecological
factors there would result in more areas being identified as important. Hence, the scale of
application must be considered with care, and the clear need for such consideration emphasizes
the value of methods that make all underlying assumptions explicit.
While different stakeholders may well disagree on the choices made, having a consistent,
transparent framework for evaluating the consequences of different choices is a considerable
advantage of our approach. Indeed, a sensitivity analysis with respect to each of these valuations
may reveal important alternatives, or that identifications of some areas are insensitive to
reasonable alternative assumptions, indicating their robustness at this level of identification.
Presenting the outcomes of runs using multiple valuation choices and datasets in a map atlas
helps show how various assumptions and groupings of data result in different outcomes.
Recognizing the limitations of the approach we have described so far, we regard MARXAN as a
foundational information tool and first step that requires elaboration, review and reiteration as
new data become available, rather than a rigid, determinative prescription of what areas should
be formally considered to be IEAs. In addition to facilitating comparisons of multiple iterations
on each of multiple alternative sets of assumptions, the results provide a point of reference for
considering data types and sources that are not amenable to the MARXAN analysis, including
insights from people with local and traditional knowledge, data and observations from others that
were either unpublished or overlooked, and other insights from stakeholders. Also, this
preliminary identification of areas that appear to qualify as IEAs provides a framework for
identifying and incorporating other important ecological features such as migratory pathways,
habitat connectivity, or subsistence use. The multiple iterations of MARXAN and its respective
outputs thus serve as a critical first step in the overall IEA identification process. The
MARXAN analyses are followed by professional and stakeholder review, incorporation of input
from non-traditional sources, and re-iteration of the entire process as new data become available.
Once established, these IEAs furnish the essential basis to preserve the biological engines and
storehouses of the ocean.
The value of the approach presented is the ability to provide information on the most important
areas for overall ecosystem health as well as areas important for specific ecological function.
Together, this information will have wide applicability to a variety of policy questions and
contexts. The ideal product of our IEA identification process is a compilation, or “atlas”, of
maps showing various outputs of MARXAN runs as well as distribution of each individual
dataset. Some MARXAN runs should include all datasets to show the globally important areas
of highest overall importance across all factors, while other runs should include subsets of data
organized into themes as described above. Such a thematic approach strikes a balance between
looking at each feature individually versus grouping all available datasets into a single
optimization. The organization of various datasets or features into themes can be useful if they
contain multiple features that are impacted by the same types of uses or by species that display
similar life history patterns. If data are grouped in a straightforward, transparent manner, they
may be viewed as legitimate data layers as they may require less subjective valuation. For
DRAFT Oceana Discussion Paper – Important Ecological Areas – August 23, 2010
28
example, the Audubon Society’s “Important Bird Areas”3, which could be thought of as one
theme of important ecological areas, have gained global recognition through a clear set of
criteria. This formulation of IEAs can be useful for policy questions about which areas are more
compatible with each type of use. Depending on the policy context, it may be more strategic to
recognize the “official” IEAs as those that meet the more aggregate definition of importance for
the entire ecosystem, while presenting more thematic maps as supplementary material. In other
policy contexts, particularly those focused on particular types of activities or protections, the
thematic maps could serve as the primary informational tools.
B. Use of IEAs in Marine Spatial Planning Efforts
Marine spatial planning (MSP) ideally seeks to promote desirable social goals by minimizing
conflicts among competing uses of the ocean, reducing environmental impacts and preserving
ecological resilience and key functions (Kappell et al. 2009). Marine spatial planning is rapidly
gaining political momentum. It has been presented in recent legislative proposals as well as in
the Obama Administration’s recent establishment of a new national ocean policy (US House
Resolution 2454 as introduced; IOPTF 2010). Such proactive, integrated planning is a logical
extension of ecosystem-based management and the concurrent increases in ocean development
from new and pre-existing ocean activities and uses. Relatively new ocean uses such as
renewable energy and offshore aquaculture are competing with well established industries such
as fishing, shipping and tourism for limited space and resources.
Approaches to MSP that ignore valuations of marine habitats instead focusing simply on
resolving conflicts among user groups are prone to unduly compromise ecological sustainability
objectives. For example, an ocean zoning approach to MSP may involve simply partitioning the
ocean into mutually exclusive limited-use reservations, including zones for industrial
development, fishing, shipping, tourism and marine parks. A habitat-preservation approach
might involve preventing a suite of human activities in some stated proportion of each habitat
type. Both approaches are liable to exposing the most important ecological areas to
environmental degradation, in the first case if industrial or other uses are accorded higher priority
than the ecosystem services they compromise, and in the second if the habitat types selected do
not correspond with the most biologically important habitats in the region.
To successfully meet ecosystem protection goals, marine spatial planning (MSP) requires a
foundation built on IEAs. While MSP is important for separating incompatible activities and
reducing conflicts in addition to ecosystem protections (Kappell et al. 2009), the primary goal of
MSP should be protection of IEAs, which in turn promotes sustainable management of our
oceans. If IEAs are not identified first in the sequence of marine spatial planning, such efforts
are vulnerable to becoming little more than ocean zoning, administering the location of
competing industrial uses, streamlining permitting processes, and facilitating the organized
industrialization of the marine environment.
3 http://www.audubon.org/bird/iba/
DRAFT Oceana Discussion Paper – Important Ecological Areas – August 23, 2010
29
Unfortunately there are also pitfalls to avoid with MSP. In the political realm where industrial
development interests are so often paramount, a MSP process can quickly be turned from
ensuring the health of marine ecosystems into a competition for ocean real estate. Such
competing interests often lead to ocean zoning, where ocean activities and uses – including
conservation – are designated to different areas of the ocean. Even with good intentions, such as
when there is a clear goal to protect ecosystem health, zoning pitfalls are hard to avoid.
Powerful stakeholders have strong incentives to exploit the political process, typically seeking
territory or rights to an area and consigning ecosystem concerns to discrete spatial sectors as a
secondary consideration once economic interests are fully satisfied. Surprisingly, such outcomes
are often facilitated by conservationists themselves. While engaging in great battles for
protection of discrete and frequently iconic patches of real estate, conservationists may miss the
mark of protecting the overall health of the ecosystem. Also, their participation lends an air of
legitimacy to a process that is put forward as environmentally acceptable for industry to move
forward with development that further degrades our oceans.
Instead of simply dividing the ocean between competing uses, MSP provides an opportunity to
focus on ecosystem health, supporting the ability of marine ecosystems to provide the goods and
services on which we depend. Long-term spatial decisions for the marine environment are by
definition MSP. Marine planning varies in scope from decisions about individual places and
sectors to holistic efforts that are proactive and organized to integrate multiple current and future
ocean uses across an ecosystem. The recent high level policy decisions have been to institute
MSP at this broader more holistic and integrated end of the planning spectrum.
Comprehensive MSP – if done rigorously and appropriately – can benefit both industry and the
environment. Comprehensive planning presents an opportunity to fully consider current and
future cumulative impacts to ecosystem health. This is a large shift from typical ocean
management where decisions about one activity are usually made in isolation. Marine spatial
planning benefits industry by proactively identifying and getting broad stakeholder approval for
areas where development could occur with minimal impact to the marine environment. The
largest benefit, however, is ensuring that development does not degrade an ecosystem’s health.
The Massachusetts Ocean Plan (2009) implemented a form of marine spatial planning in state
waters out to 3 nautical miles from shore. While the plan is not comprehensive (e.g., does not
address fishing), one useful approach is the identification of compatible areas for each activity,
based on a series of maps for each use showing areas of potential incompatibility. For example,
submarine cables were deemed not to be compatible with rocky seafloor habitat, so maps of
rocky seafloor were developed to guide where cables could be laid. Creating such an atlas
showing the vulnerable or incompatible areas to each activity provides a useful tool which forms
a component of the IEA approach. However, our IEA approach additionally delineates relative
importance of individual features and areas where multiple features overlap, so that some areas
might be considered “off the table” prior to negotiations over where uses might occur and so that
certain areas can be prioritized in cases where not all incompatible areas are off limits.
Building MSP around the identification and protection of IEAs brings spatial focus to ecosystem
health and helps to avoid ocean zoning pitfalls. Ecosystem health is a non-spatial state of the
ocean that is difficult to represent in a spatial planning process. By delineating the areas that are

DRAFT Oceana Discussion Paper – Important Ecological Areas – August 23, 2010
30
most critical for ecosystem health, IEAs help bring an important spatial context to ecosystem
health that otherwise can be missed and potentially sidelined. A MSP process must therefore
begin with the identification of IEAs. Once identified, decision makers and stakeholders will be
able to give primacy to appropriate protections for IEAs and to identifying locations where
ecologically sustainable development could occur. Also, ensuring that all IEAs have at least the
minimum protection of monitoring allows managers to check the pulse and temperature of
ecosystem health and use adaptive management as necessary to meet management objectives.
C. Use of IEAs in Marine Protected Area Processes
Marine protected areas have been formally defined in the United States by the May, 2000
Presidential Executive Order 13158 as “any area of the marine environmental that has been
reserved by federal, state, territorial, tribal, or local laws or regulations to provide lasting
protection for part or all of the natural and cultural resources therein” (see www.mpa.gov).
These protections may range from monitoring to “no take or disturbance” marine reserves.
About 1,700 MPAs have been established in the US, encompassing nearly 5 million km2, or
about 1/3 of US territorial waters. Most of this protected area is designated as National Wildlife
Refuges, National Marine Sanctuaries, or is associated with coastal National Parks or Forests
(National Research Council 2001). Because they may be created by so many agencies and
jurisdictions operating at all levels of government, there are correspondingly diverse goals and
objectives for creating them.
Broad goals of MPAs include conserving biodiversity and habitat, managing fisheries, providing
ecosystem services, protecting representative and unique areas for their intrinsic value, and
protecting cultural heritage (National Research Council 2001; Lubchenco et al. 2003; Marine
Life Protection Act 2004). The first three are conservation goals, which are of greatest concern
here. Because of the diversity of nominating jurisdictions and agencies involved, the reasons
advanced for designating MPAs to meet these goals vary and may conflict. Categories of criteria
that have been used to identify candidate areas include:
1. Ecologically functional: These include places where primary productivity is high, or
where physical or biological structure is complex providing shelter from predation for
juveniles of various species, or where the combination of reproductive substrate,
availability of food for hatched larvae and relationship to currents for dispersal to places
where predators are scarce and food is abundant, etc. For example, coral reefs, kelp
forests and eelgrass beds provide high primary productivity as well as shelter from
predation for larval and juvenile life stages.
2. Operational: The National Marine Fisheries Service’s efforts to identify essential fish
habitat (EFH) ranked marine habitats according to their productivity, sensitivity to
disturbance, and vulnerability (likelihood of disturbance).
DRAFT Oceana Discussion Paper – Important Ecological Areas – August 23, 2010
31
3. Empirical: These may be based on compilations of available data regarding spatial
distributions of marine productivity, population densities, migration pathways,
oceanographic currents, etc. The degree to which these coincide may be used to
prioritize areas as candidates for MPA recommendation.
4. Opportunistic: Opportunities for securing MPA status are occasionally generated by
other political and regulatory factors, for example patrons wishing to establish a legacy
by endowing a marine park based on local or regional uses and values as interpreted by
the patron, or offsets stipulated for industrial development elsewhere, etc.
While each of these approaches has advantages, they are not equally suited to identifying which
discrete parts of the ocean merit the most protection. An opportunistic approach may
recommend places of little inherent ecological value. Empirical criteria are limited by the
quality and quantity of data available, and ecologically functional criteria presume an
understanding of marine ecosystems functioning that often is not available. Similar concerns
apply to operational criteria, in that we often have little information on the role played by
different habitats with respect to primary or secondary productivity, or how sensitive these
habitats are, what their recovery time is from a particular disturbance, etc. Moreover, there is no
guarantee the operational variables used will identify the most important areas for maintaining
overall ecological integrity. Recognizing these limitations, we believe that the empirical
approach, informed by ecologically functional criteria when available, offers the best chance of
extending protections while preserving and ideally enhancing sustainable economic benefits.
A variety of strategies and MPA designs have been proposed or created to address the
conservation goals listed above. Marine reserves are protected from all extractive or destructive
activities, except perhaps for sampling required to monitor the effectiveness of the reserve. As
summarized by Lubchenco et al. (2003), benefits of marine reserves include “...protection of
habitat; conservation of biodiversity; protection or enhancement of ecosystem services; recovery
of depleted stocks of exploited species; export of individuals to fished areas; insurance against
environmental or management uncertainty; and sites for scientific investigation, baseline
information, education, recreation, and inspiration (Allison et al. 1998, NRC 2001)”. Some
scenarios under which marine reserves may be the most appropriate management policy for an
IEA are:
• Areas where many key ecological features, threats and therefore management measures
combine to exclude extractive activity
• Areas that are ecologically unique
• Areas desired to preserve characteristics of wilderness and naturalness
• Areas that hold special meaning and form part of our natural heritage
• As a precaution when there is a lack of data but the area nonetheless appears to be of
enhanced ecological or intrinsic value
• Areas that are particularly high in biodiversity and the objective is to protect that biodiversity
• To answer scientific questions, and provide tools for fisheries management, such as acting as
a no-take reference site. In particular, reserves can help determine the efficacy of
management measures that allow some limited uses and can allow scientists and fisheries
managers to determine ecosystem-wide effects of fishing.
DRAFT Oceana Discussion Paper – Important Ecological Areas – August 23, 2010
32
However, many scientists caution against using no-take marine reserves as a ‘one-size-fits-all’
approach to MPAs (Agardy et al. 2003, Hilborn et al. 2004) and acknowledge that marine
reserves must be part of a larger marine conservation strategy (Allison et al. 1998). The notion
of “protection” in an ocean area can be viewed in terms of the suite of uses that are prohibited or
conversely in terms of whether specific ecological features within each area remain unimpacted.
Typically, the more activities are prohibited within an area, the more it is assumed to be
“protected”. Early efforts at spatial protection focused on marine reserves (generally defined as
areas where take of all marine life is prohibited), under the assumption that reserves offer the
highest level of protection (e.g., MLPA). In cases where little is known about species
composition, ecological functions, or how different types of activities affect ecosystem
components, marine reserves offer precaution in the face of uncertainty. However, because
reserves treat all types of extractive uses equally (all are prohibited), they tend to impose costs on
some more benign uses with little ecological benefit. For example, if an area is identified as
“important” based on features that occur on the seafloor and the objective is to protect those
features, the prohibition of uses that affect only the upper water column (e.g., fully pelagic
fishing operations, vessel traffic, etc.) likely have minimal benefit (if any) to those features, yet
could impose significant costs on user groups. Only around 1% of U.S. waters and 0.01% of
global ocean habitat is protected within no-take marine reserves in 2000 (www.mpa.gov; Pauly
et al. 2000), reflecting the substantial political challenges that must be overcome to establish
them. Consequently no-take reserves alone are insufficient for the scale of protection needed.
Many of the benefits of reserves are also conferred by less restrictive MPAs. Fishing regulations
amount to a kind of MPA by time and area closures. The National Marine Fisheries Service
designated closures in the past few years to protect essential fish habitat from bottom trawling
(e.g. Shester and Warrenchuk 2007), widely recognized as the gear most damaging to seafloor
habitats (e.g. NRC 2002). Restrictions such as prohibitions on bottom trawling offer more
substantive protections from existing threats than designation as National Marine Sanctuaries in
the U.S. Indeed, reduction of commercial fishing effort through more effective enforcement of
regulations is often an especially effective means of reducing stress on marine ecosystems.
The National Research Council (NRC) recognized that the amount of protected habitat area
needed to meet management goals will depend on habitat characteristics, species and
management regime (NRC 2001). While targets of 20% of marine reserve habitat have been
suggested by several scientists and science bodies (Boersma & Parrish 1999; Roberts 2000),
other scientists have suggested 50% as the amount that should be protected (Lauck et al. 1998;
Polacheck 1990). The NRC review of studies that estimated reserve area relative to management
objectives ranged from 10 to 70% (NRC 2001), underscoring the arbitrary nature of a blanket
20% target for habitat protection which might not be adjusted to contexts of any particular
ecosystem or relying on unrealistic assumptions such as the complete loss or destruction of the
remaining percentage.
Partly as a response to the fractured jurisdictions authorized to nominate and create MPAs in the
U.S., Presidential Executive Order 13158 authorized the National Atmospheric and Oceanic
Administration to establish a National Marine Protected Areas Center (NMPAC). Noting that
“the nation’s collection of MPAs...is fragmented, complex, confusing, and potentially missing

DRAFT Oceana Discussion Paper – Important Ecological Areas – August 23, 2010
33
opportunities for broader regional conservation through coordinated planning and management”,
one of the primary purposes of the NMPAC is to foster increased coordination to promote
progress toward an interconnected network of MPAs encompassing all marine habitat types with
redundant representation. However, the NMPAC has no authority to nominate or create new
MPAs, so its role is limited to research and advisory functions. While a large-scale
interconnected network of representative habitats remains a laudable goal, establishing it is still
in the hands of the various agencies and jurisdictions authorized to create new MPAs, where
political hurdles are often daunting. Furthermore, while a focus on habitat representation is
important, this limited focus does not explicitly address the many ecological and species-specific
functions that can be addressed through a deliberate approach based on Important Ecological
Areas.
In Oregon, legislation passed in 2009 that designates the State’s first two marine reserves and an
MPA, and further evaluates four other sites, all within IEAs identified by Oceana. The initial
two state marine reserves are a subset of the identified IEAs. Further evaluation and ultimate
designation of the four other sites, however, will lead to the development of an ecologically
significant network of reserves and MPAs for these and other Oregon IEAs, protecting the health
and biodiversity of Oregon’s ocean and coastal ecosystems.
D. Use of IEAs in Disaster Response
Once IEAs are identified, protected, and monitored, they can serve critical roles in responses to
major disasters and catastrophes such as oil spills. Before such an event occurs, protection of the
critical features in these areas increases their resilience to such events. Resource managers can
also be better prepared for such catastrophes by storing necessary recovery equipment and
resources in proximity to IEAs and creating response plans in relation to the location of IEAs and
the features contained within them. The ocean atlas described above can give resource managers
a comprehensive tool to understand where ecological features at risk from such events occur in
space. Some features are affected differently by different types of events. For example, an el
Nino event may affect the availability of forage species and location migration corridors, while
features most at risk from oil spills include coastal wetlands, seabird colonies, etc.
Once such an event occurs, knowing where IEAs are and their relative values to multiple
ecosystem functions can provide a way to prioritize how and where to deploy limited resources
(e.g., booms and skimmers). During the 2010 Deepwater Horizon oil spill in the Gulf of
Mexico, Audubon’s Important Bird Areas were prioritized and publicized as rationale for the
areas initially selected for booming. Had a more comprehensive identification of Important
Ecological Areas been available, such efforts could have been prioritized over a much wider set
of species and habitats at risk.
DRAFT Oceana Discussion Paper – Important Ecological Areas – August 23, 2010
34
E. Political Considerations for Protecting Important Ecological Areas
Advocacy for spatial management measures such as marine protected areas almost always faces
opposition from entrenched interests. While ecologists may broadly agree that a substantial
proportion of each distinctive marine habitat and their connectivity should be protected, getting
such a comprehensive vision implemented through the political process is extremely challenging,
at least with a single concerted effort. But it might be possible if approached incrementally.
This situation, described in detail in Compass and Gyroscope: Integrating Science and Politics
for the Environment (Lee 1993), requires a careful assessment of economic impacts, political
strategy, and clear immediate and long-term goals. Using Lee’s analogy, the compass refers to
the desired outcome as indicated by science, here a connected network of protected areas in the
ocean including all distinct habitats, and the gyroscope refers to the political process of achieving
this.
Making a successful case to defer short-term economic benefits for long-term sustainability is
always politically challenging. The political process is often not receptive to any of the
conservation objectives listed above. Some of the most productive and important marine habitats
are located in near-shore waters that fall under the jurisdiction of sub-national governments that
are acutely sensitive to local interests and concerns. Even when jurisdictions are sympathetic to
conservation goals in principle, there may be resistance to enacting restrictions within precisely
identified boundaries, especially when multiple alternatives are available. In such cases, parties
affected by sanctions on uses often argue for siting elsewhere (i.e. the “NIMBY” problem: Not
In My Back Yard). The vulnerability of arguments to such objections for establishing protective
management measures at a particular place decreases as follows:
1. Ecosystem protection
2. Conservation of biodiversity
3. Habitat protection
4. Refugia for rebuilding depleted populations of exploited species
5. Marine parks
6. Scientific study sites
For example, there are usually numerous candidate sites that could contribute to “ecosystem
protection” in the broadest sense of the term. The requirements for refugia are constrained by
the needs of the species for which protection is sought, and scientific study sites may require
uniquely determined locations for which suitable alternatives do not exist. While this may seem
a secondary conceptual concern, it often weighs heavily in the political negotiation process.
Furthermore, restrictive sanctions may not be necessary for IEAs that are unlikely to face certain
threats, and in such cases pursuit of sanctions may squander scarce political capital needed to
secure protections more urgently needed elsewhere.
The realities of the political process along with the limited time available to secure protections
for living marine resources at greatest risk point toward a strategic approach that embraces

DRAFT Oceana Discussion Paper – Important Ecological Areas – August 23, 2010
35
opportunity. No single line of argument is likely to be persuasive across the spectrum of relevant
jurisdictions, yet when appropriate every opportunity for extending protection to vulnerable
marine resources warrants action. As more MPAs are established, the ecological benefits
accruing from their interconnectivity may become more readily defended as data on their
efficacy accumulate. Thus, an incremental approach to securing protections across a network of
interconnected IEAs may be more practical than trying to secure them all at once.