Embed Size (px)
Citation preview
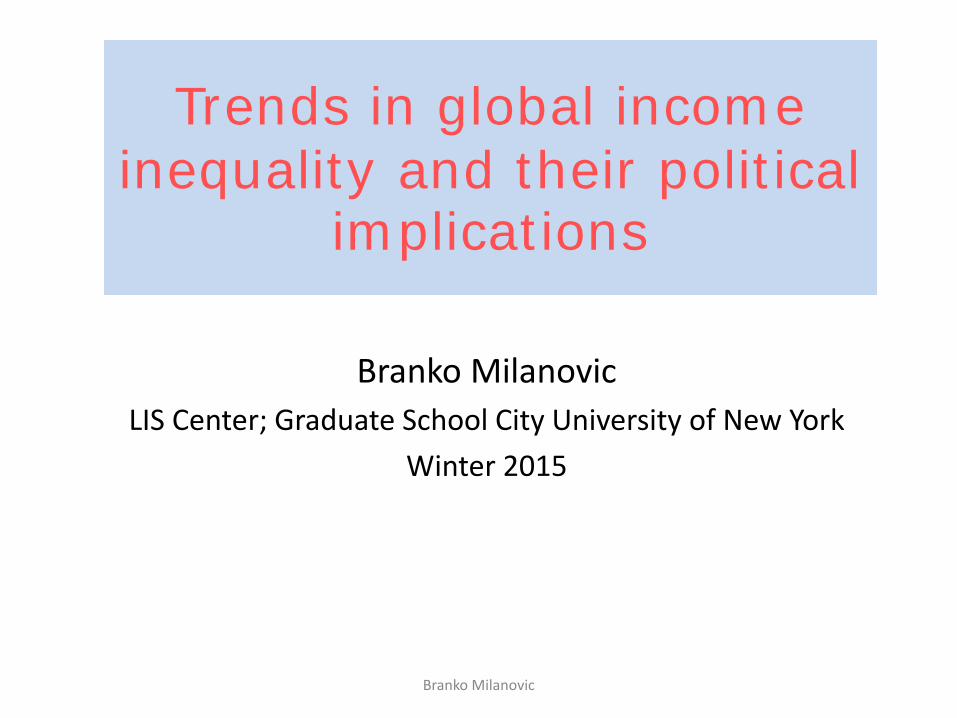
Trends in global income inequality and their political
implications
Branko MilanovicLIS Center; Graduate School City University of New York
Winter 2015
Branko Milanovic

A. Within-national inequalities
Branko Milanovic
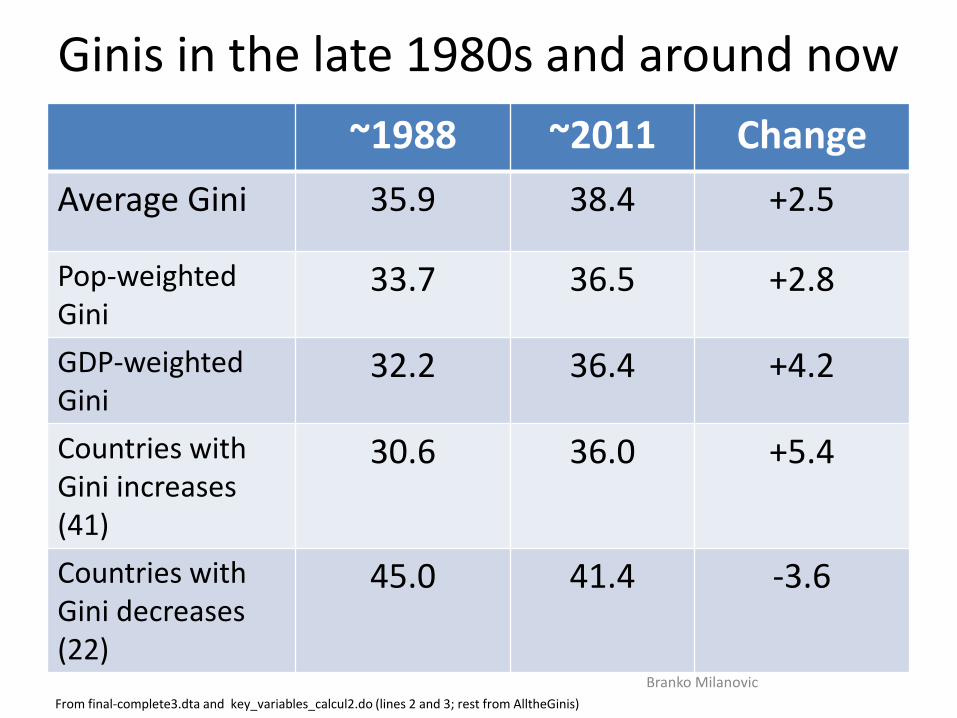
Ginis in the late 1980s and around now~1988 ~2011 Change
Average Gini 35.9 38.4 +2.5
Pop-weighted Gini
33.7 36.5 +2.8
GDP-weightedGini
32.2 36.4 +4.2
Countries with Gini increases (41)
30.6 36.0 +5.4
Countries with Gini decreases (22)
45.0 41.4 -3.6
From final-complete3.dta and key_variables_calcul2.do (lines 2 and 3; rest from AlltheGinis)Branko Milanovic
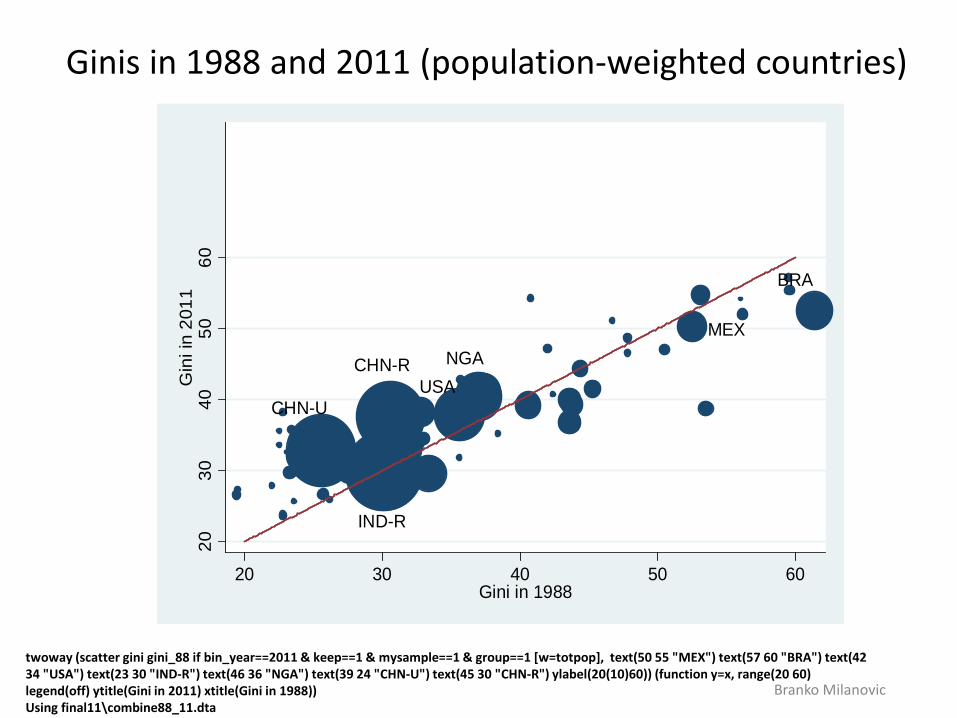
Ginis in 1988 and 2011 (population-weighted countries)
twoway (scatter gini gini_88 if bin_year==2011 & keep==1 & mysample==1 & group==1 [w=totpop], text(50 55 "MEX") text(57 60 "BRA") text(42 34 "USA") text(23 30 "IND-R") text(46 36 "NGA") text(39 24 "CHN-U") text(45 30 "CHN-R") ylabel(20(10)60)) (function y=x, range(20 60) legend(off) ytitle(Gini in 2011) xtitle(Gini in 1988))Using final11\combine88_11.dta
Branko Milanovic
MEX
BRA
USA
IND-R
NGA
CHN-U
CHN-R
2030
4050
60G
ini i
n 20
11
20 30 40 50 60Gini in 1988
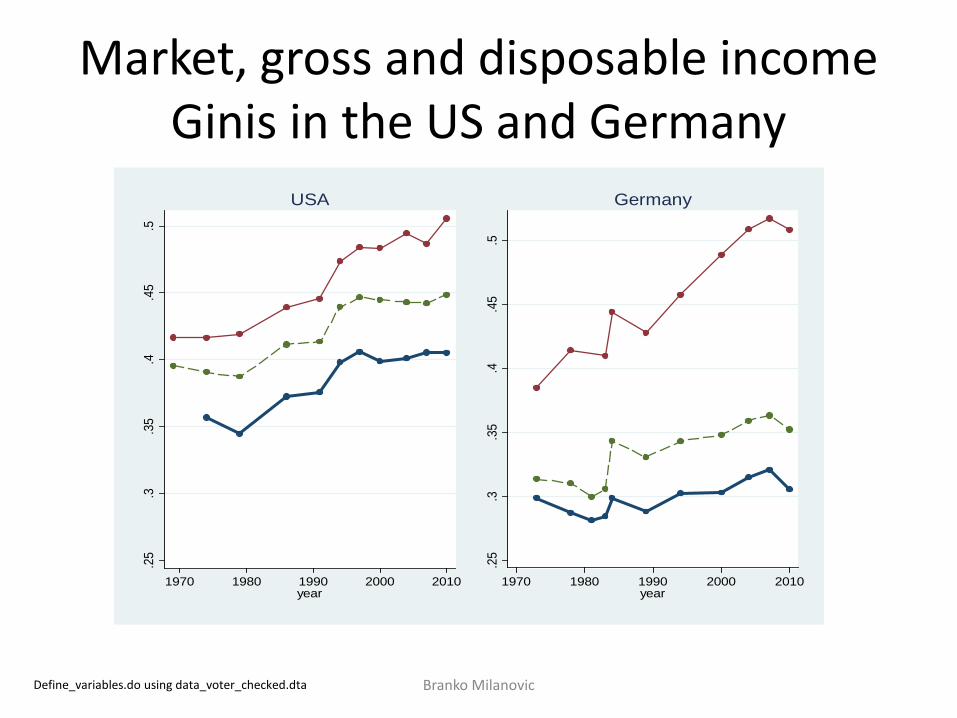
Market, gross and disposable income Ginis in the US and Germany
Branko Milanovic
.25
.3.3
5.4
.45
.5
1970 1980 1990 2000 2010year
USA
.25
.3.3
5.4
.45
.5
1970 1980 1990 2000 2010year
Germany
Define_variables.do using data_voter_checked.dta
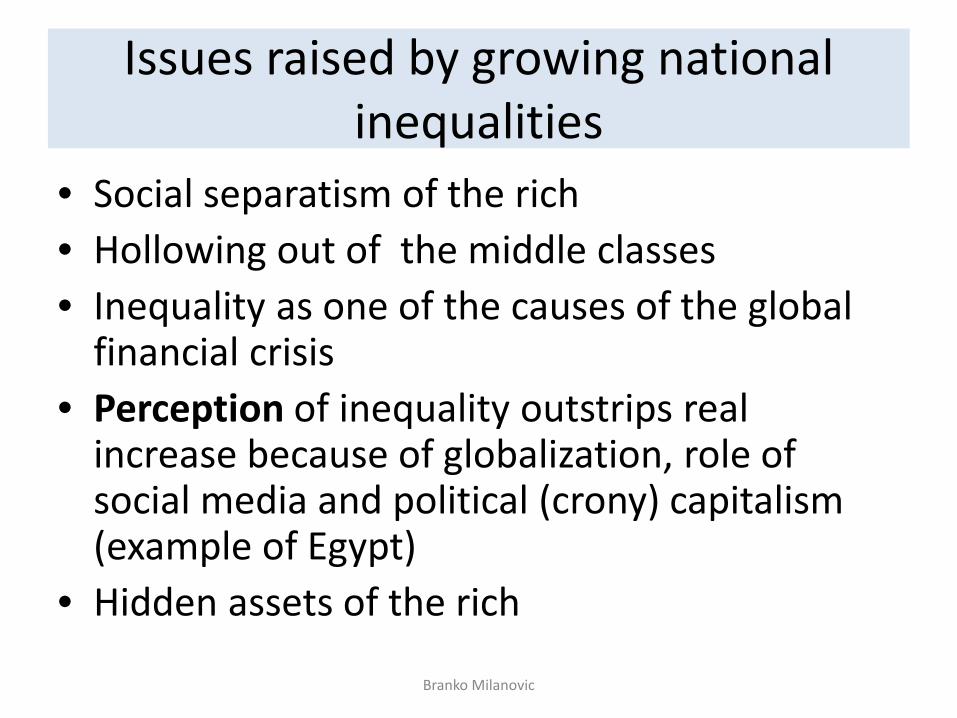
Issues raised by growing national inequalities
• Social separatism of the rich• Hollowing out of the middle classes• Inequality as one of the causes of the global
financial crisis • Perception of inequality outstrips real
increase because of globalization, role of social media and political (crony) capitalism (example of Egypt)
• Hidden assets of the rich
Branko Milanovic

How to think of within-national inequalities: Introducing the Kuznets
waves
Branko Milanovic
The second chapter of myforthcoming book (April 2016)
8
A1. Kuznets’ cycles in societies with a stagnant mean income
9
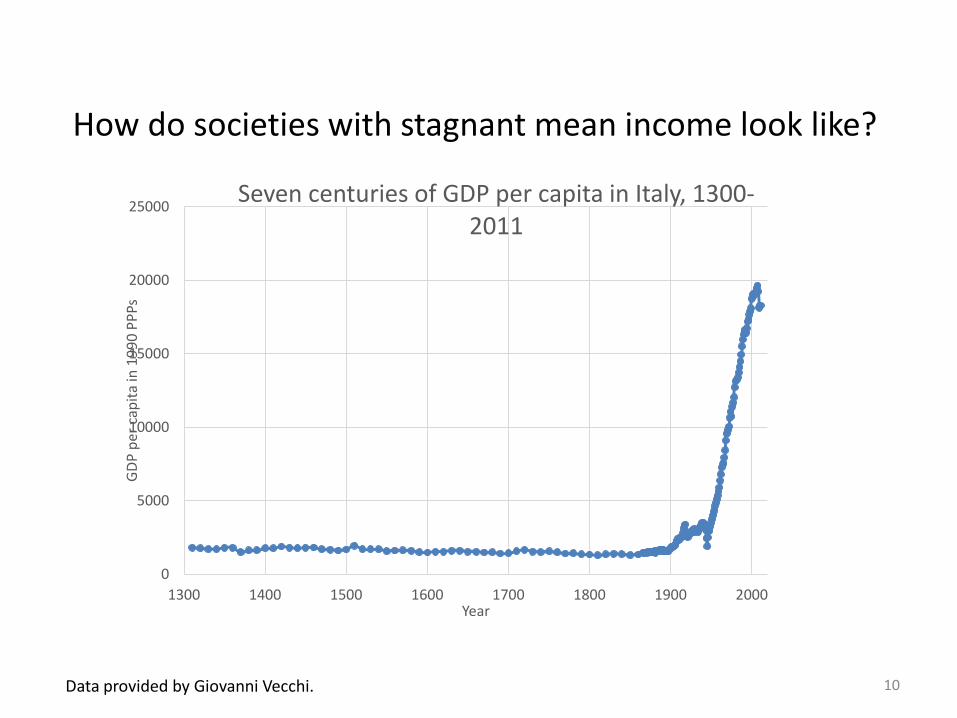
How do societies with stagnant mean income look like?
10
0
5000
10000
15000
20000
25000
1300 1400 1500 1600 1700 1800 1900 2000
GDP
per c
apita
in 1
990
PPPs
Year
Seven centuries of GDP per capita in Italy, 1300-2011
Data provided by Giovanni Vecchi.
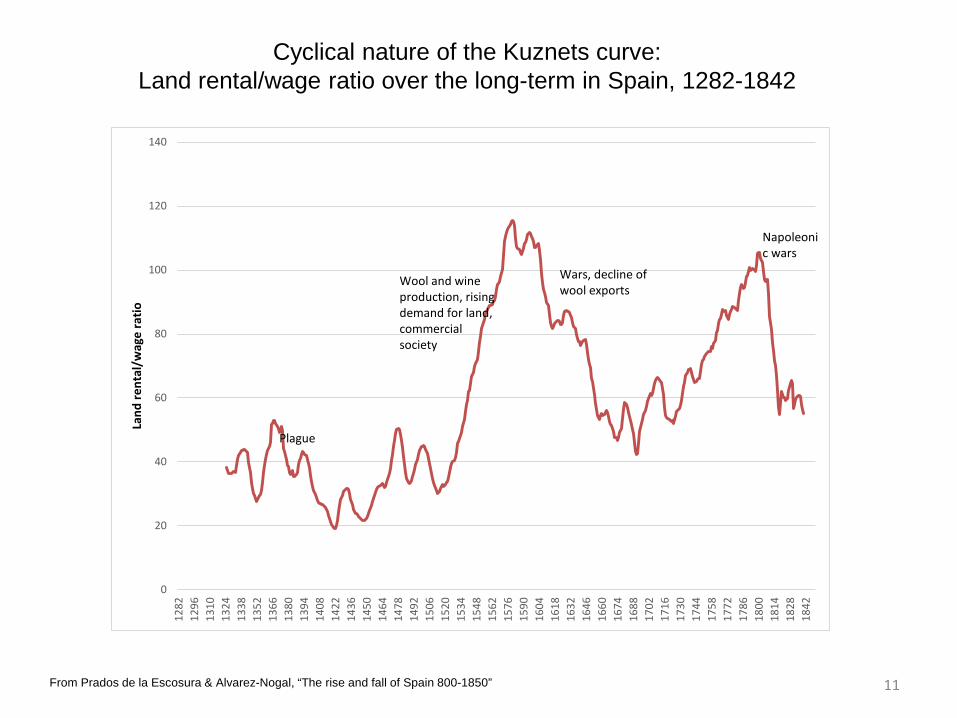
From Prados de la Escosura & Alvarez-Nogal, “The rise and fall of Spain 800-1850”
Cyclical nature of the Kuznets curve: Land rental/wage ratio over the long-term in Spain, 1282-1842
11
0
20
40
60
80
100
120
140
1282
1296
1310
1324
1338
1352
1366
1380
1394
1408
1422
1436
1450
1464
1478
1492
1506
1520
1534
1548
1562
1576
1590
1604
1618
1632
1646
1660
1674
1688
1702
1716
1730
1744
1758
1772
1786
1800
1814
1828
1842
Land
rent
al/w
age
ratio
Plague
Wool and wine production, rising demand for land, commercialsociety
Wars, decline of wool exports
Napoleonic wars
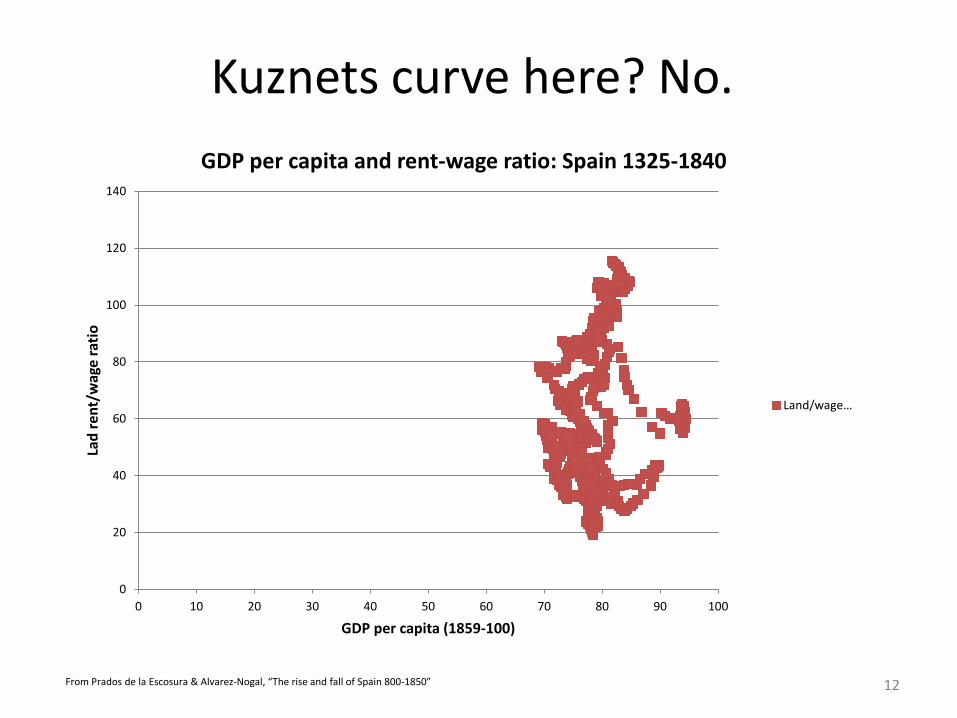
Kuznets curve here? No.
12From Prados de la Escosura & Alvarez-Nogal, “The rise and fall of Spain 800-1850”
0
20
40
60
80
100
120
140
0 10 20 30 40 50 60 70 80 90 100
Lad
rent
/wag
e ra
tio
GDP per capita (1859-100)
GDP per capita and rent-wage ratio: Spain 1325-1840
Land/wage…
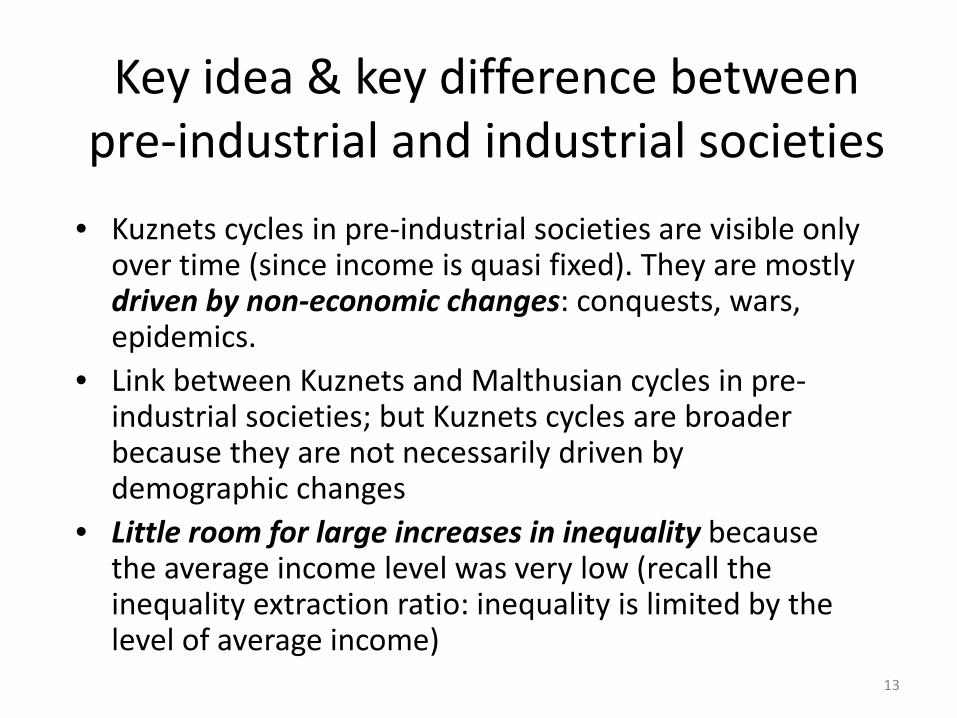
Key idea & key difference between pre-industrial and industrial societies
• Kuznets cycles in pre-industrial societies are visible only over time (since income is quasi fixed). They are mostly driven by non-economic changes: conquests, wars, epidemics.
• Link between Kuznets and Malthusian cycles in pre-industrial societies; but Kuznets cycles are broader because they are not necessarily driven by demographic changes
• Little room for large increases in inequality because the average income level was very low (recall the inequality extraction ratio: inequality is limited by the level of average income)
13
14
0,400
0,450
0,500
0,550
0,600
0,650
1850 1860 1870 1880 1890 1900 1910 1920 1930 1940 1950 1960 1970
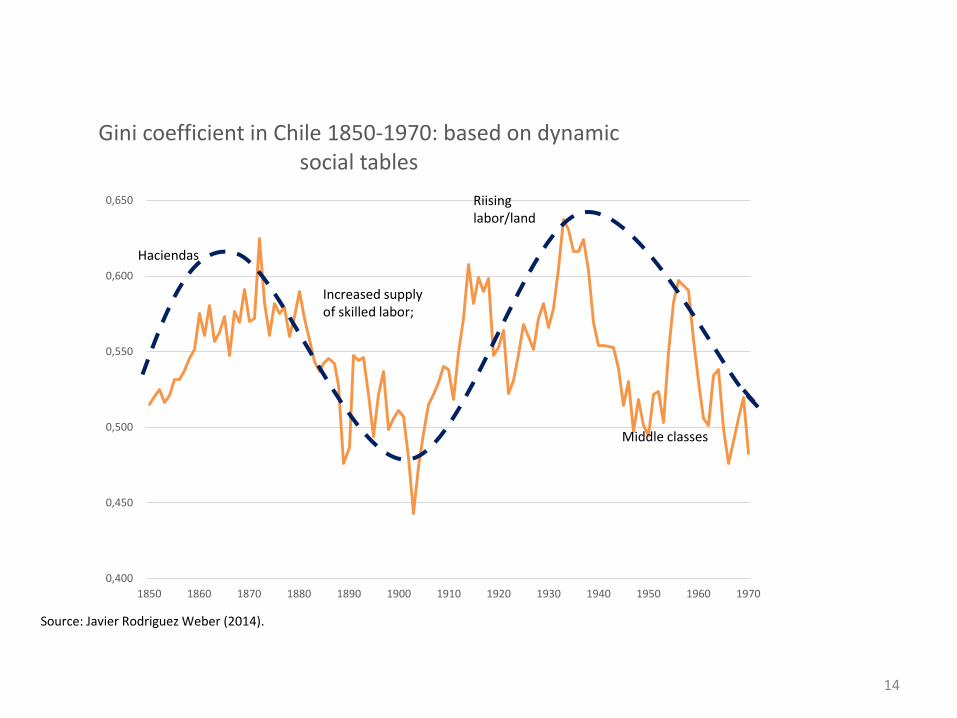
Gini coefficient in Chile 1850-1970: based on dynamic social tables
Haciendas
Increased supplyof skilled labor;
Riisinglabor/land
Middle classes
Source: Javier Rodriguez Weber (2014).
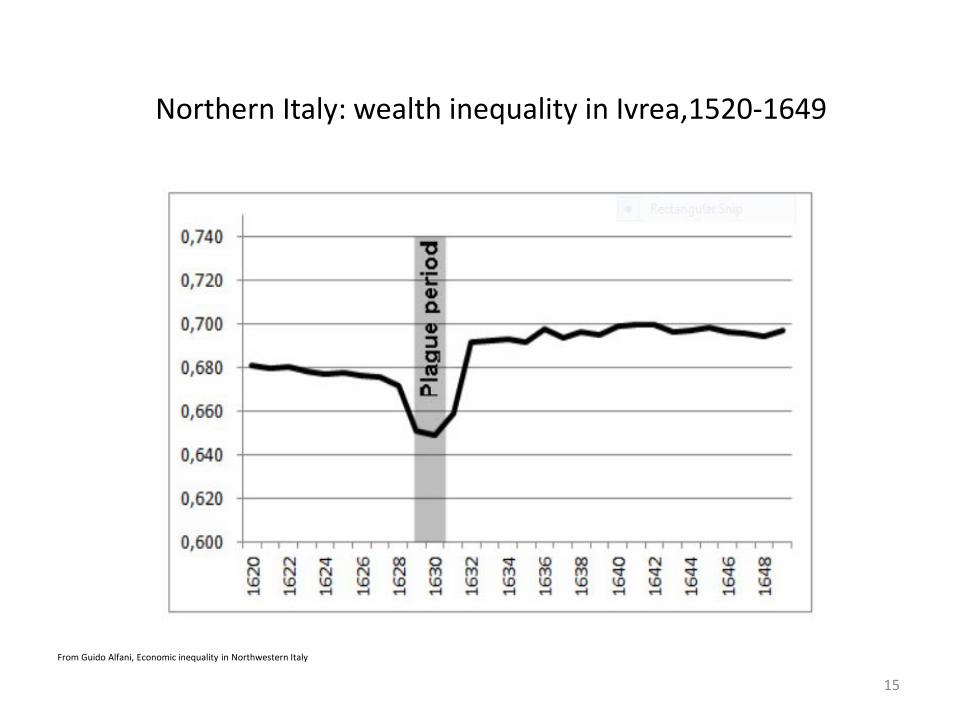
Northern Italy: wealth inequality in Ivrea,1520-1649
From Guido Alfani, Economic inequality in Northwestern Italy
15
A2. Kuznets’ cycles in societies with a rising mean income
16
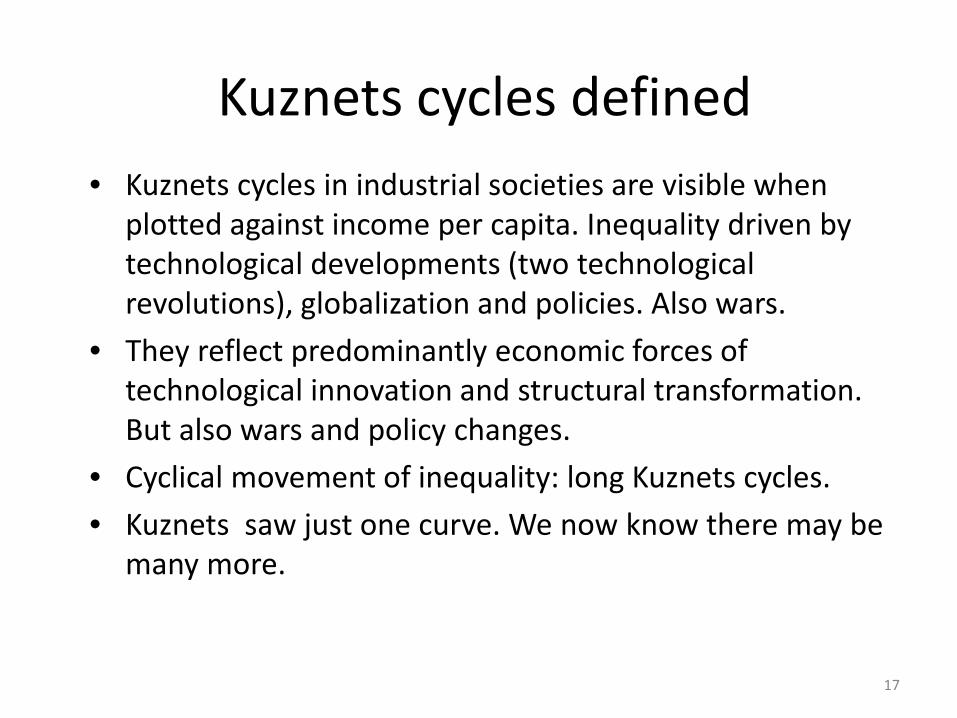
Kuznets cycles defined• Kuznets cycles in industrial societies are visible when
plotted against income per capita. Inequality driven by technological developments (two technological revolutions), globalization and policies. Also wars.
• They reflect predominantly economic forces of technological innovation and structural transformation. But also wars and policy changes.
• Cyclical movement of inequality: long Kuznets cycles. • Kuznets saw just one curve. We now know there may be
many more.
17
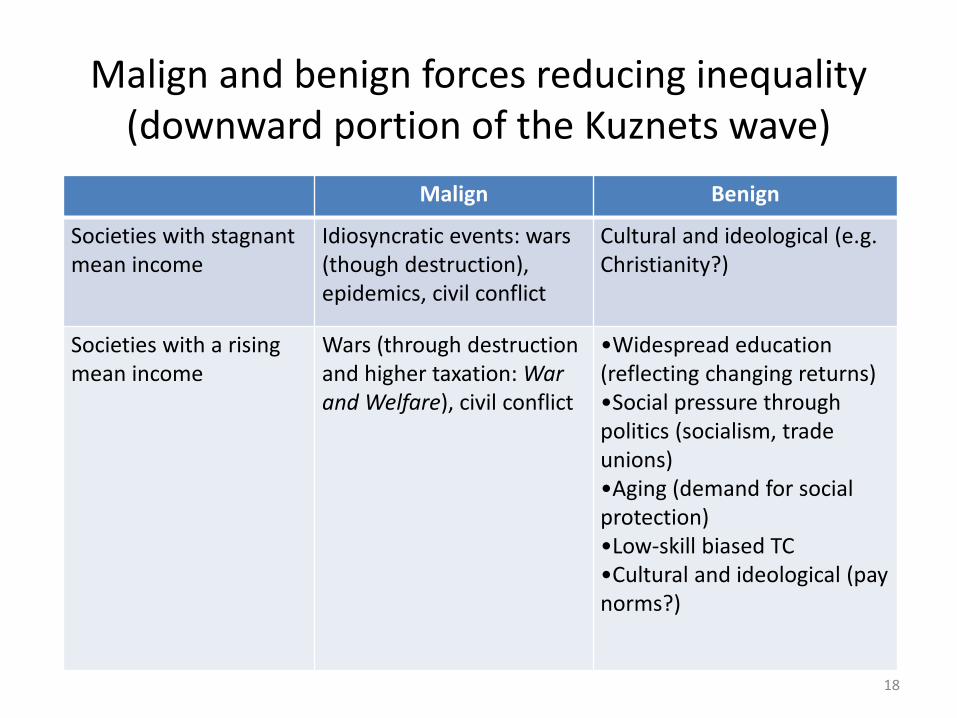
Malign and benign forces reducing inequality (downward portion of the Kuznets wave)
Malign Benign
Societies with stagnant mean income
Idiosyncratic events: wars (though destruction), epidemics, civil conflict
Cultural and ideological (e.g. Christianity?)
Societies with a rising mean income
Wars (through destruction and higher taxation: War and Welfare), civil conflict
•Widespread education (reflecting changing returns)•Social pressure through politics (socialism, trade unions)•Aging (demand for social protection)•Low-skill biased TC •Cultural and ideological (pay norms?)
18
19US_and_uk.xls
0
10
20
30
40
50
60
0 5000 10000 15000 20000 25000 30000
Gin
i of d
ispo
sabl
e pe
r cap
ita in
com
e
GDP per capita (in 1990 international dollars; Maddison)
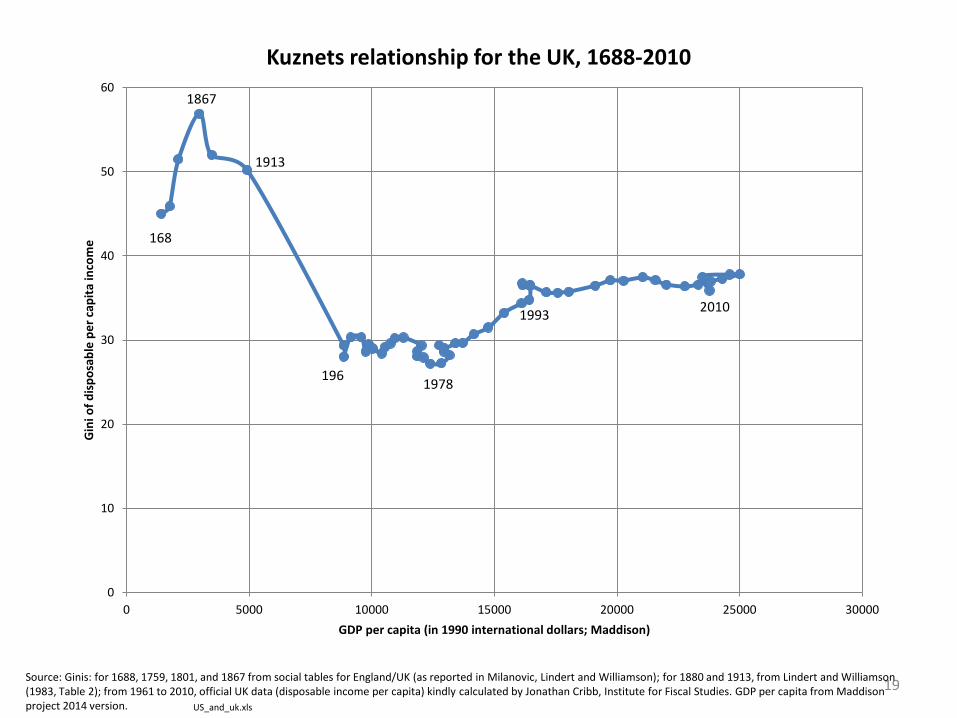
Kuznets relationship for the UK, 1688-2010
1867
1978196
1993
168
2010
1913
Source: Ginis: for 1688, 1759, 1801, and 1867 from social tables for England/UK (as reported in Milanovic, Lindert and Williamson); for 1880 and 1913, from Lindert and Williamson (1983, Table 2); from 1961 to 2010, official UK data (disposable income per capita) kindly calculated by Jonathan Cribb, Institute for Fiscal Studies. GDP per capita from Maddison project 2014 version.
20
0
10
20
30
40
50
60
0 5000 10000 15000 20000 25000 30000 35000
Gin
i of d
ispo
sabl
e pe
r cap
ita in
com
e
GDP per capita (in 1990 international dollars; Maddison)
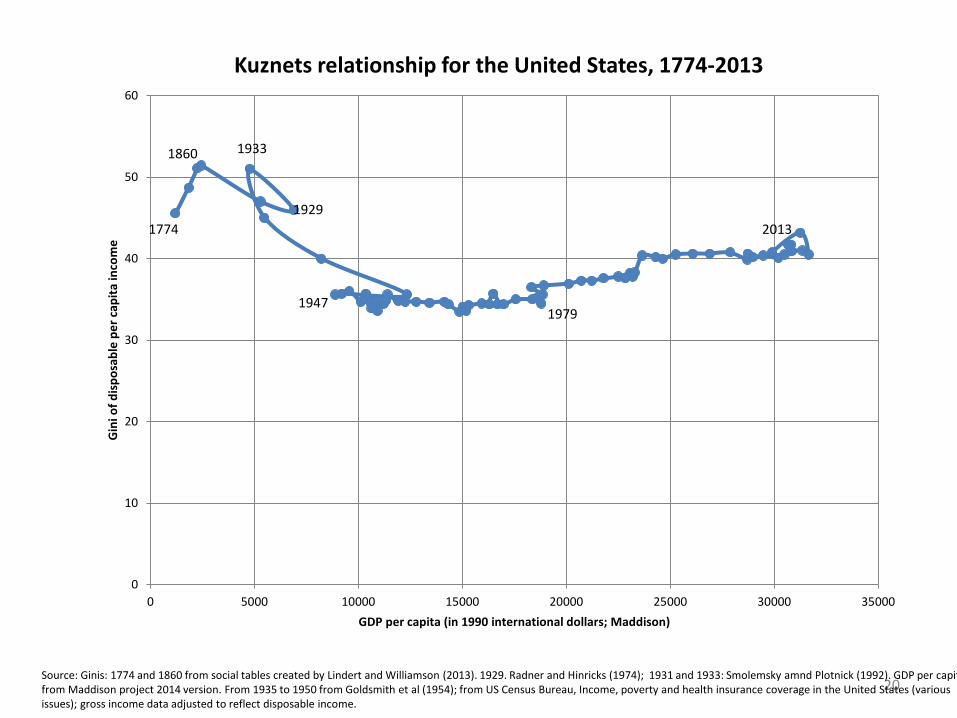
Kuznets relationship for the United States, 1774-2013
1860
19292013
19471979
1774
1933
Source: Ginis: 1774 and 1860 from social tables created by Lindert and Williamson (2013). 1929. Radner and Hinricks (1974); 1931 and 1933: Smolemsky amnd Plotnick (1992). GDP per capit from Maddison project 2014 version. From 1935 to 1950 from Goldsmith et al (1954); from US Census Bureau, Income, poverty and health insurance coverage in the United States (various issues); gross income data adjusted to reflect disposable income.
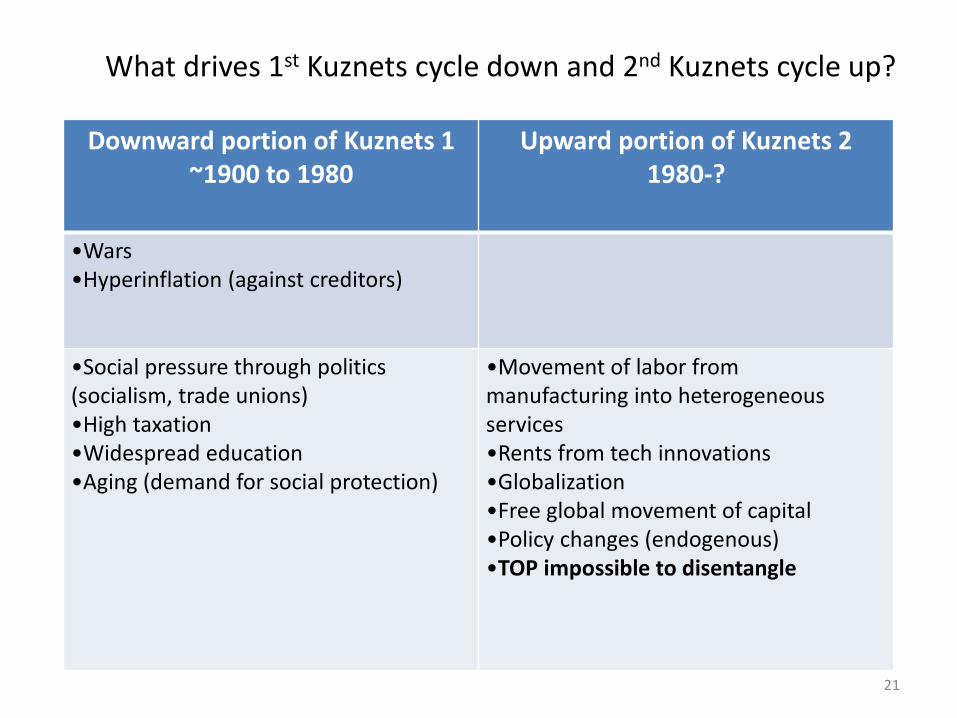
What drives 1st Kuznets cycle down and 2nd Kuznets cycle up?
Downward portion of Kuznets 1~1900 to 1980
Upward portion of Kuznets 21980-?
•Wars•Hyperinflation (against creditors)
•Social pressure through politics (socialism, trade unions)•High taxation•Widespread education•Aging (demand for social protection)
•Movement of labor from manufacturing into heterogeneous services•Rents from tech innovations•Globalization•Free global movement of capital•Policy changes (endogenous)•TOP impossible to disentangle
21
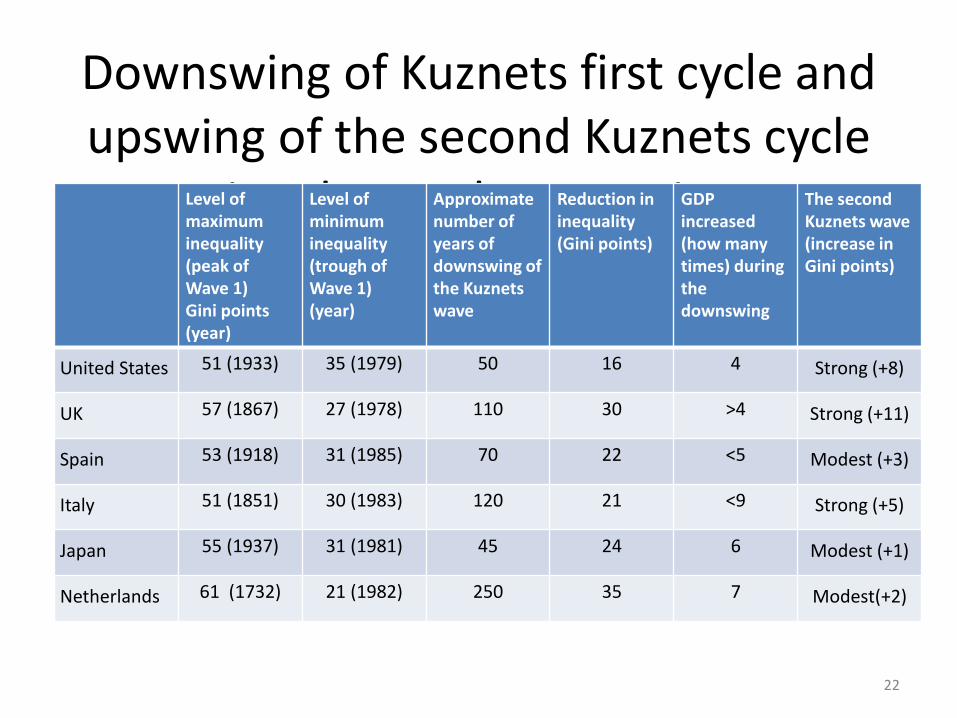
Downswing of Kuznets first cycle and upswing of the second Kuznets cycle
in advanced economiesLevel of maximum inequality (peak of Wave 1)Gini points (year)
Level of minimum inequality (trough of Wave 1)(year)
Approximate number of years of downswing of the Kuznets wave
Reduction in inequality (Gini points)
GDP increased (how many times) during the downswing
The second Kuznets wave (increase in Gini points)
United States 51 (1933) 35 (1979) 50 16 4 Strong (+8)
UK 57 (1867) 27 (1978) 110 30 >4 Strong (+11)
Spain 53 (1918) 31 (1985) 70 22 <5 Modest (+3)
Italy 51 (1851) 30 (1983) 120 21 <9 Strong (+5)
Japan 55 (1937) 31 (1981) 45 24 6 Modest (+1)
Netherlands 61 (1732) 21 (1982) 250 35 7 Modest(+2)
22
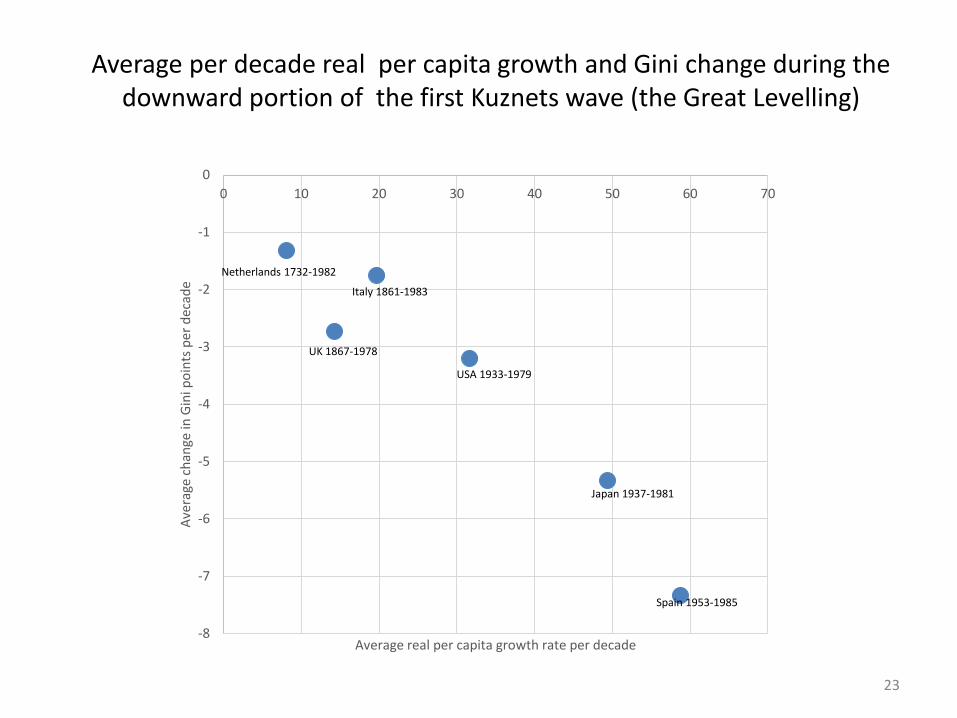
Average per decade real per capita growth and Gini change during the downward portion of the first Kuznets wave (the Great Levelling)
23
-8
-7
-6
-5
-4
-3
-2
-1
00 10 20 30 40 50 60 70
Aver
age
chan
ge in
Gin
i poi
nts p
er d
ecad
e
Average real per capita growth rate per decade
Spain 1953-1985
Japan 1937-1981
USA 1933-1979
Italy 1861-1983
UK 1867-1978
Netherlands 1732-1982
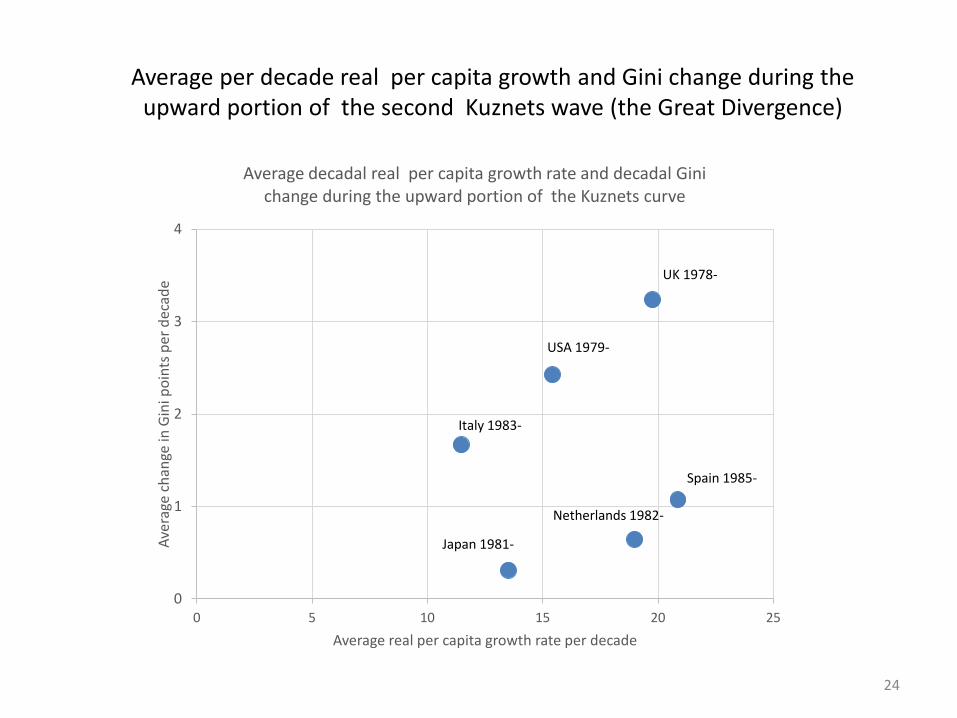
Average per decade real per capita growth and Gini change during the upward portion of the second Kuznets wave (the Great Divergence)
24
0
1
2
3
4
0 5 10 15 20 25
Aver
age
chan
ge in
Gin
i poi
nts p
er d
ecad
e
Average real per capita growth rate per decade
Average decadal real per capita growth rate and decadal Gini change during the upward portion of the Kuznets curve
Spain 1985-
Japan 1981-
USA 1979-
Italy 1983-
UK 1978-
Netherlands 1982-
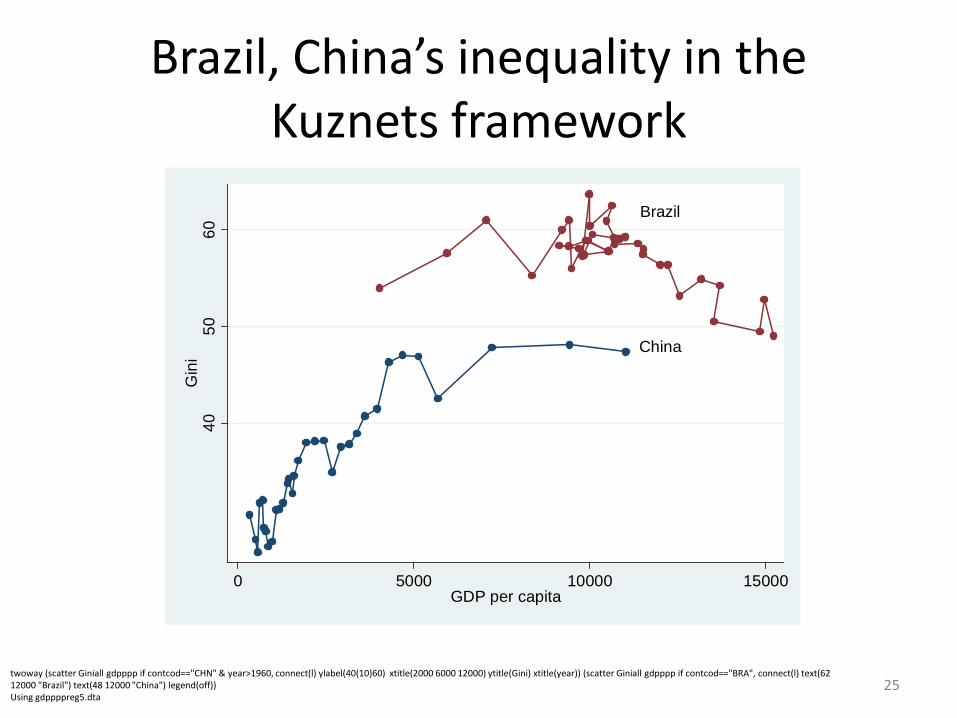
Brazil, China’s inequality in the Kuznets framework
25twoway (scatter Giniall gdpppp if contcod=="CHN" & year>1960, connect(l) ylabel(40(10)60) xtitle(2000 6000 12000) ytitle(Gini) xtitle(year)) (scatter Giniall gdpppp if contcod=="BRA", connect(l) text(62 12000 "Brazil") text(48 12000 "China") legend(off))Using gdppppreg5.dta
Brazil
China
4050
60G
ini
0 5000 10000 15000GDP per capita
Branko Milanovic
0
10
20
30
40
50
60
70
0 1000 2000 3000 4000 5000 6000 7000 8000
Gin
i
GDP per capita (in 1990 international dollars)
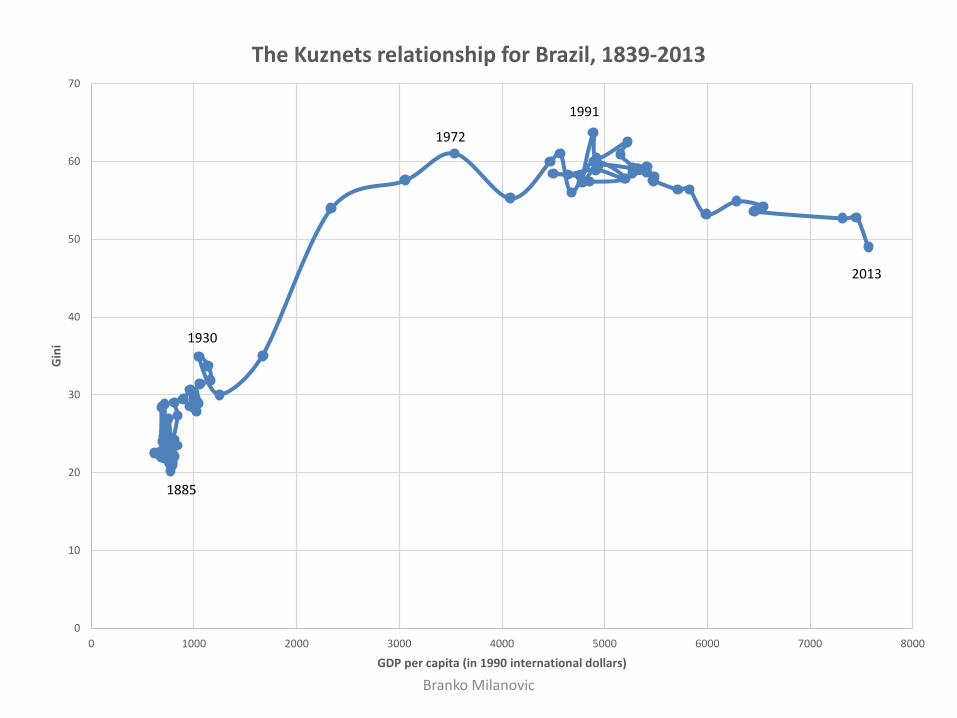
The Kuznets relationship for Brazil, 1839-2013
2013
1991
1972
1930
1885
Branko Milanovic
0
0,05
0,1
0,15
0,2
0,25
0,3
0,35
Urb
an G
ini
Year
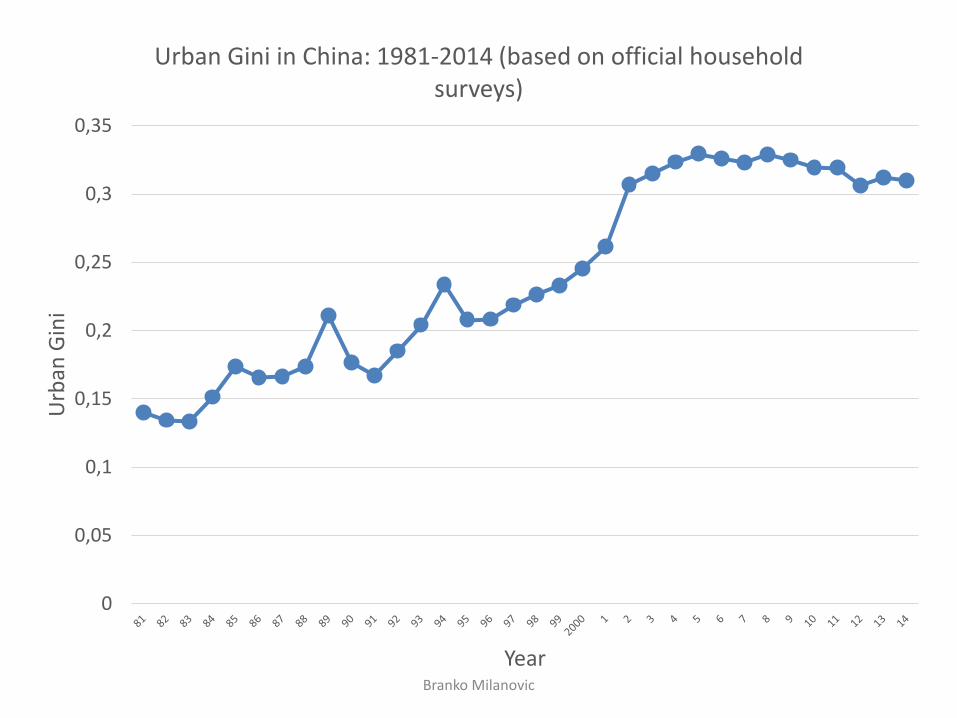
Urban Gini in China: 1981-2014 (based on official household surveys)
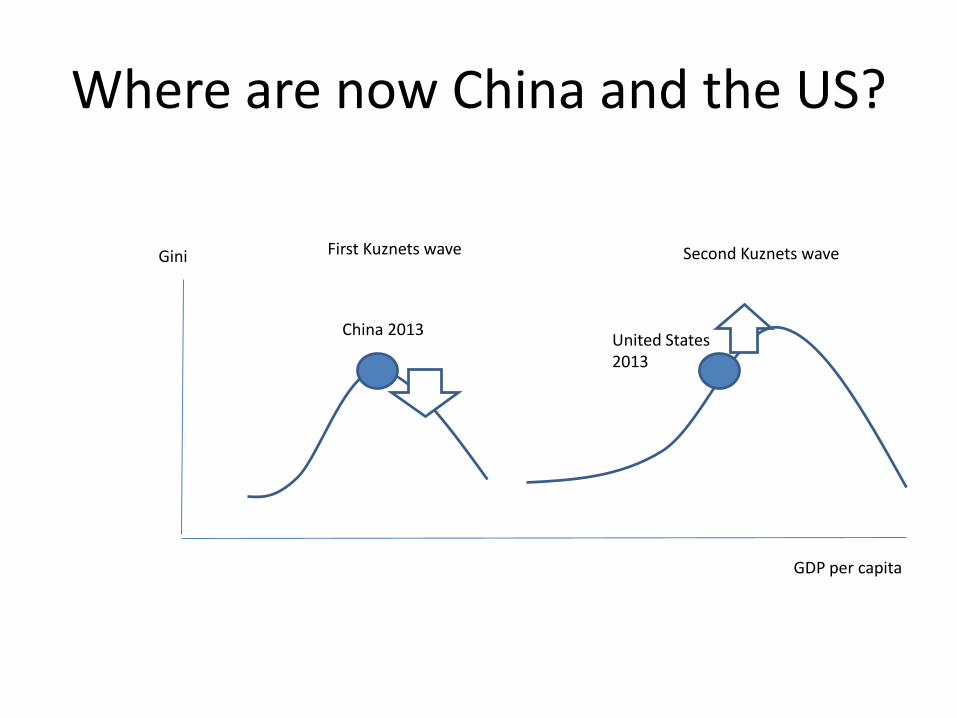
Where are now China and the US?
China 2013 United States 2013
GDP per capita
Gini First Kuznets wave Second Kuznets wave

B. Between national inequalities
Branko Milanovic
The third chapter of my forthcoming book (April 2016)
30
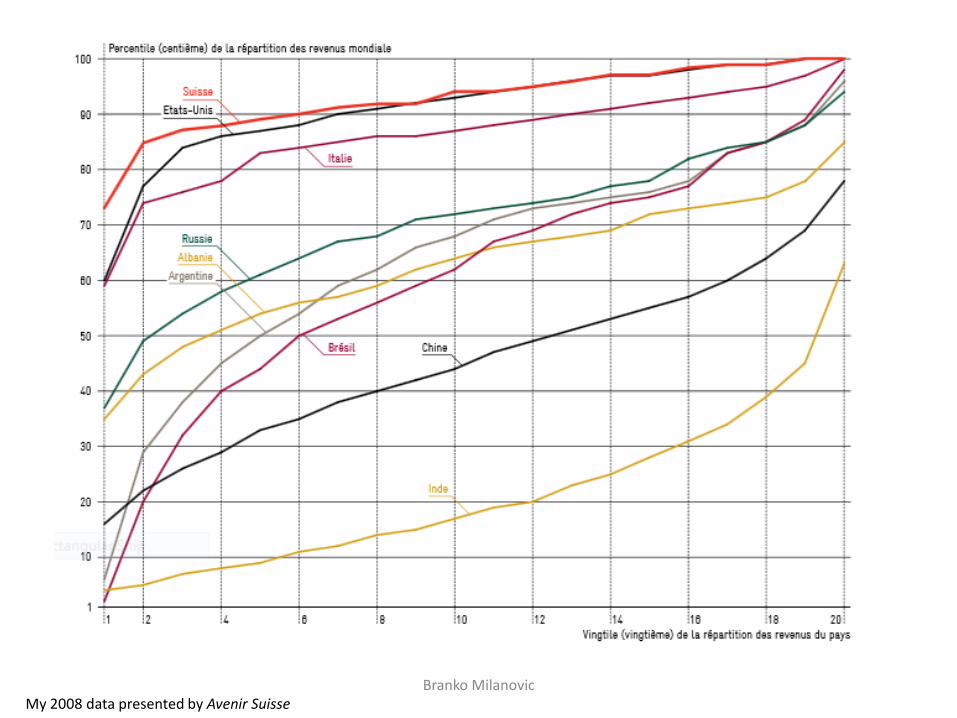
Branko MilanovicMy 2008 data presented by Avenir Suisse
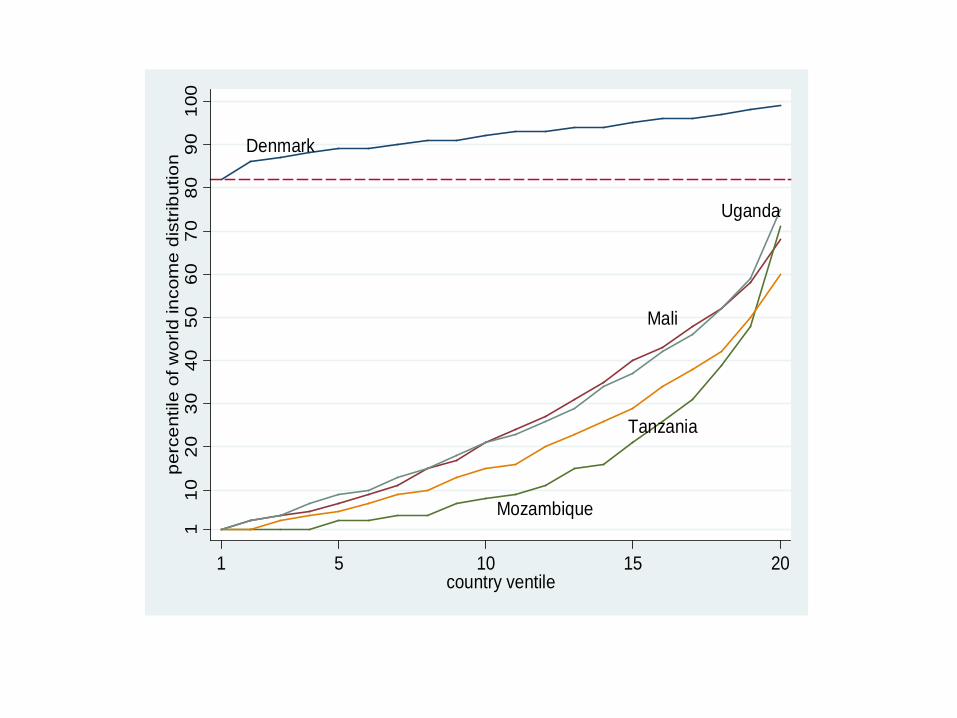
Denmark
Mozambique
Mali
Tanzania
Uganda1
1020
3040
5060
7080
9010
0pe
rcen
tile
of w
orld
inco
me
dist
ribut
ion
1 5 10 15 20country ventile
How to think of between-national inequalities: Convergence economics
Branko Milanovic
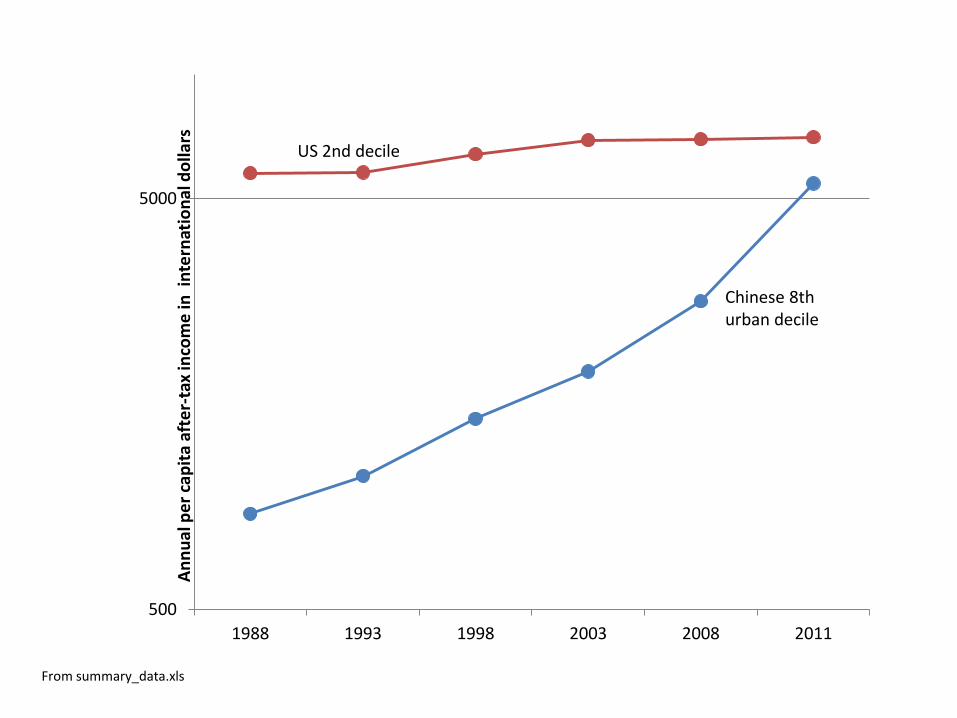
500
5000
1988 1993 1998 2003 2008 2011
Annu
al p
er ca
pita
aft
er-t
ax in
com
e in
int
erna
tiona
l dol
lars
US 2nd decile
Chinese 8th urban decile
From summary_data.xls
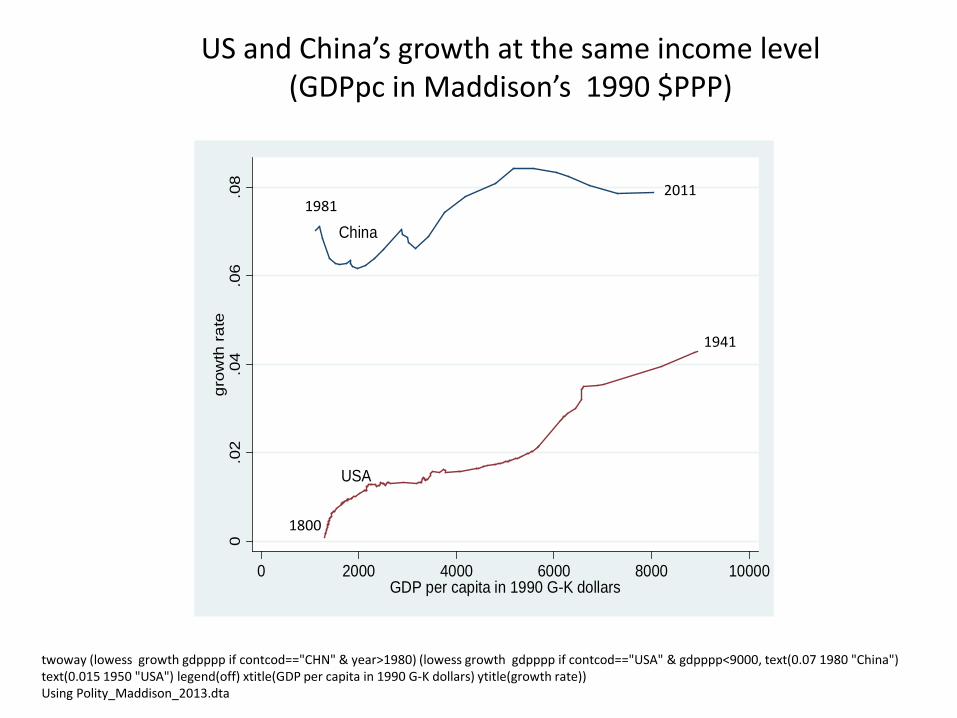
US and China’s growth at the same income level(GDPpc in Maddison’s 1990 $PPP)
twoway (lowess growth gdpppp if contcod=="CHN" & year>1980) (lowess growth gdpppp if contcod=="USA" & gdpppp<9000, text(0.07 1980 "China") text(0.015 1950 "USA") legend(off) xtitle(GDP per capita in 1990 G-K dollars) ytitle(growth rate))Using Polity_Maddison_2013.dta
China
USA
0.0
2.0
4.0
6.0
8gr
owth
rate
0 2000 4000 6000 8000 10000GDP per capita in 1990 G-K dollars
19812011
1800
1941
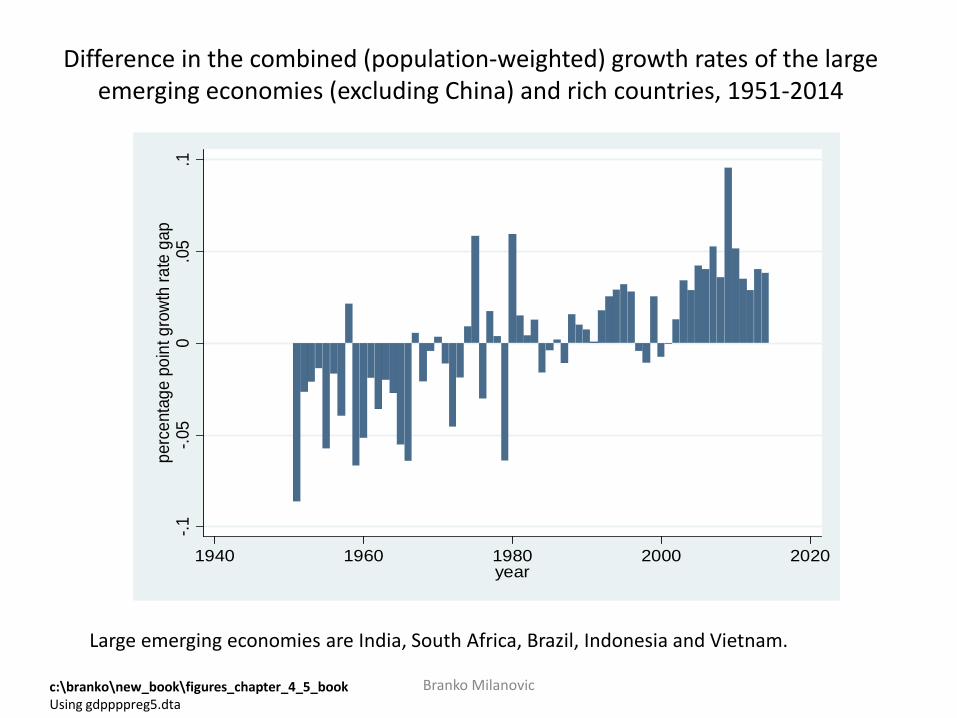
Difference in the combined (population-weighted) growth rates of the large emerging economies (excluding China) and rich countries, 1951-2014
Branko Milanovic
Large emerging economies are India, South Africa, Brazil, Indonesia and Vietnam.
-.1-.0
50
.05
.1pe
rcen
tage
poi
nt g
rowt
h ra
te g
ap
1940 1960 1980 2000 2020year
c:\branko\new_book\figures_chapter_4_5_bookUsing gdppppreg5.dta
Large gaps in mean country incomes raise two important issues
• Political philosophy: is the “citizenship rent” morally acceptable? Does global equality of opportunity matter?
• Global and national politics: Migration and national welfare state
• (will address both at the end)
Branko Milanovic
C. Global inequality
Branko Milanovic
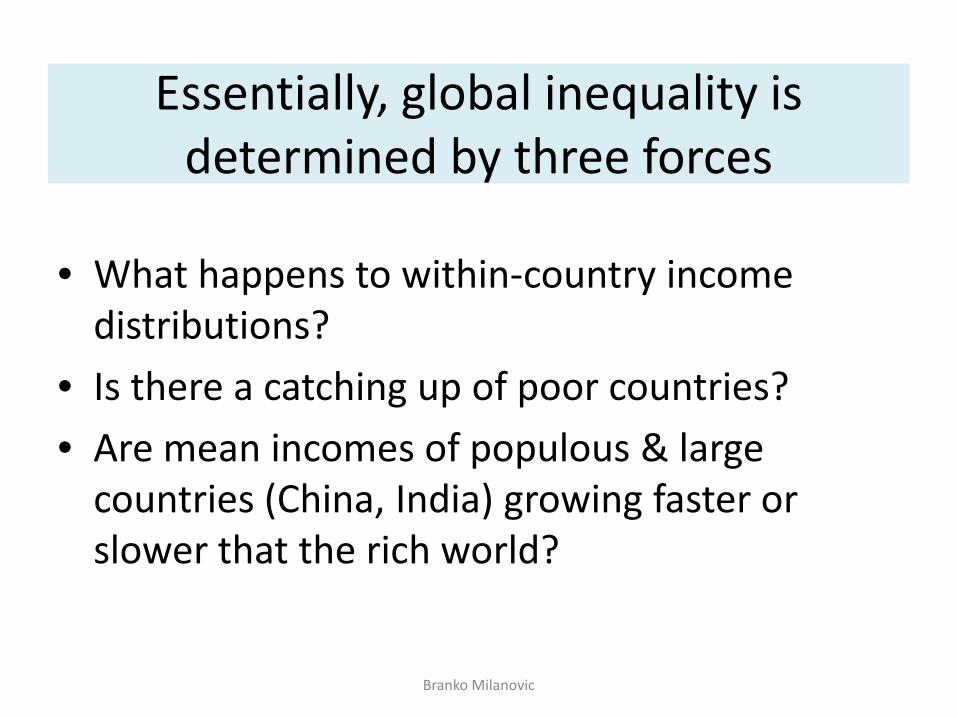
Essentially, global inequality is determined by three forces
• What happens to within-country income distributions?
• Is there a catching up of poor countries? • Are mean incomes of populous & large
countries (China, India) growing faster or slower that the rich world?
Branko Milanovic
Branko Milanovic
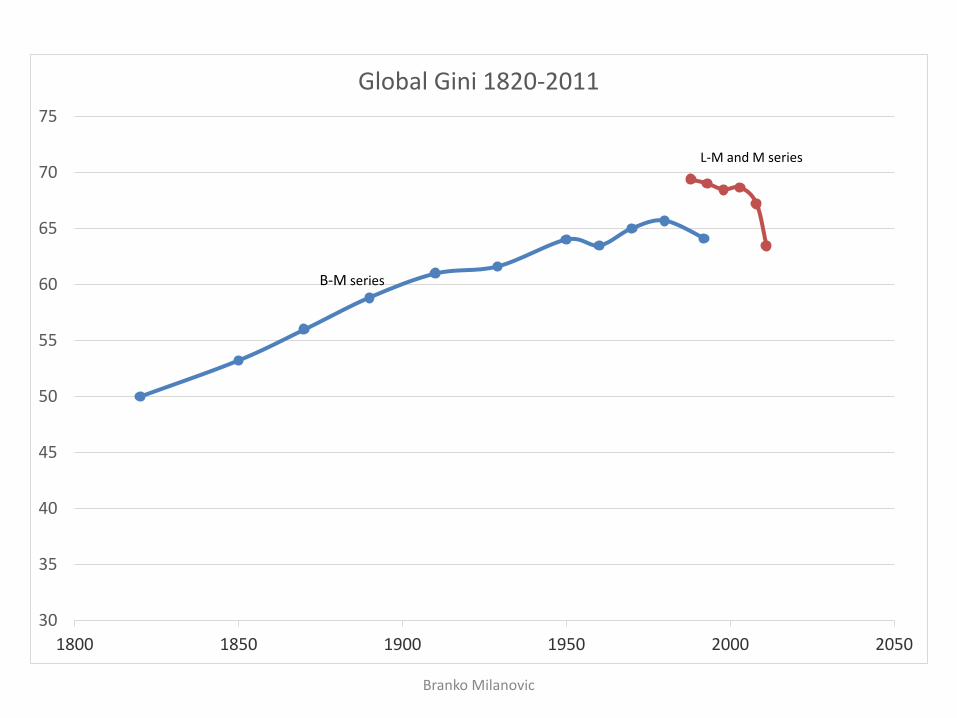
30
35
40
45
50
55
60
65
70
75
1800 1850 1900 1950 2000 2050
Global Gini 1820-2011
B-M series
L-M and M series
C1. Technical issues in the measurement of global inequality
Branko Milanovic
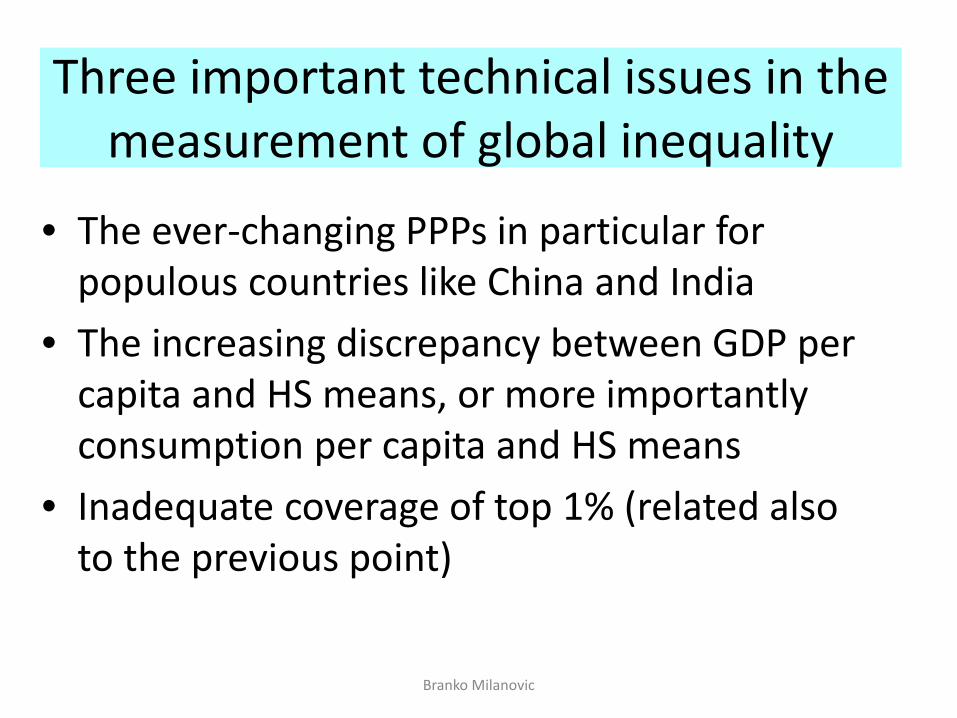
Three important technical issues in the measurement of global inequality
• The ever-changing PPPs in particular for populous countries like China and India
• The increasing discrepancy between GDP per capita and HS means, or more importantly consumption per capita and HS means
• Inadequate coverage of top 1% (related also to the previous point)
Branko Milanovic
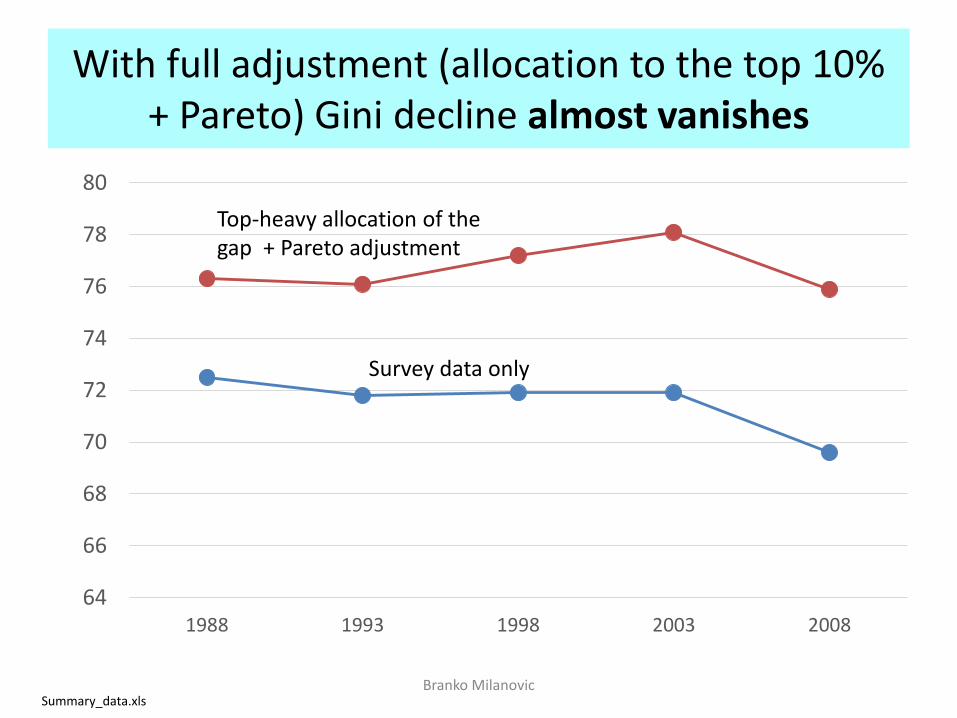
With full adjustment (allocation to the top 10% + Pareto) Gini decline almost vanishes
Branko Milanovic
Survey data only
64
66
68
70
72
74
76
78
80
1988 1993 1998 2003 2008
Top-heavy allocation of the gap + Pareto adjustment
Summary_data.xls
How to think of global inequality: Interaction of Kuznets waves and
mean-income convergence
Branko Milanovic

C2. How has the world changed between the fall of the Berlin Wall and
the Great Recession[based on joint work with Christoph Lakner]
Branko Milanovic
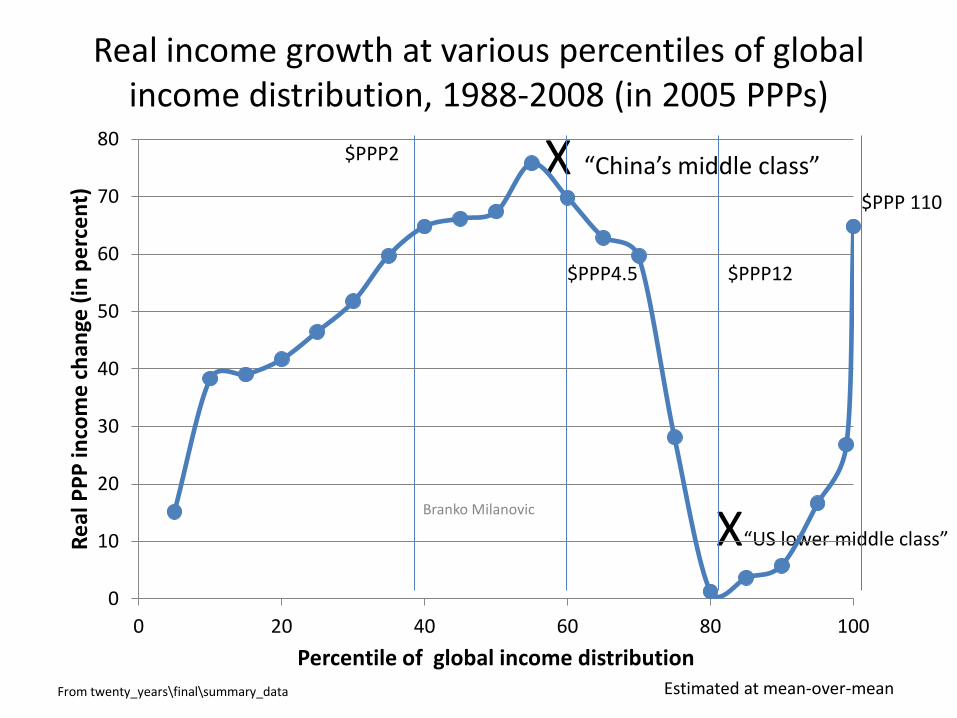
Real income growth at various percentiles of global income distribution, 1988-2008 (in 2005 PPPs)
From twenty_years\final\summary_data
X“US lower middle class”
X “China’s middle class”
Branko Milanovic
$PPP2
$PPP4.5 $PPP12
$PPP 110
Estimated at mean-over-mean
0
10
20
30
40
50
60
70
80
0 20 40 60 80 100
Real
PPP
inco
me
chan
ge (i
n pe
rcen
t)
Percentile of global income distribution
Why we do it? Political implications
• The objective of the work on global inequality is not just a description of the changes but drawing lessons on their political implications
• Point A raises the issue of future political inclusion of the Chinese middle class
• Point B, of rich countries’ democracy in condition of income stagnation among many relatively poorer groups
• Point C, of global plutocracy
Branko Milanovic
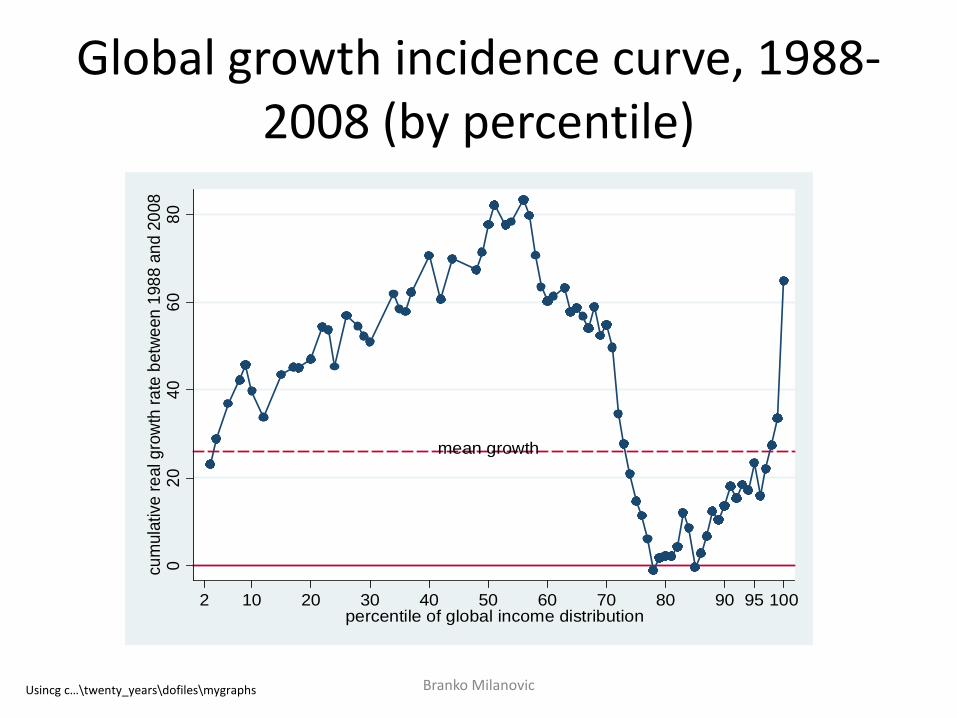
Global growth incidence curve, 1988-2008 (by percentile)
Branko Milanovic
mean growth
020
4060
80cu
mul
ative
real
gro
wth
rate
bet
ween
198
8 an
d 20
08
2 10 20 30 40 50 60 70 80 90 95 100percentile of global income distribution
Usincg c…\twenty_years\dofiles\mygraphs

Branko Milanovic
0
20
40
60
80
100
120
140
0 10 20 30 40 50 60 70 80 90 100
Cum
ulat
ive
real
per
cap
ita g
row
th in
% b
etw
een
1988
and
200
8
Percentile of global income distribution
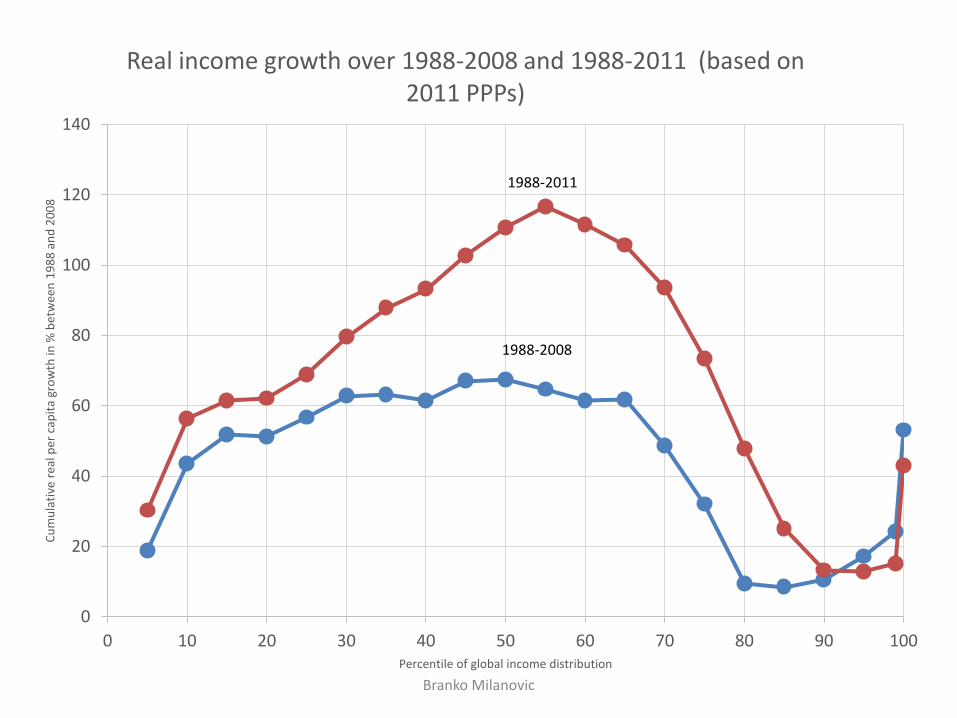
Real income growth over 1988-2008 and 1988-2011 (based on 2011 PPPs)
1988-2011
1988-2008

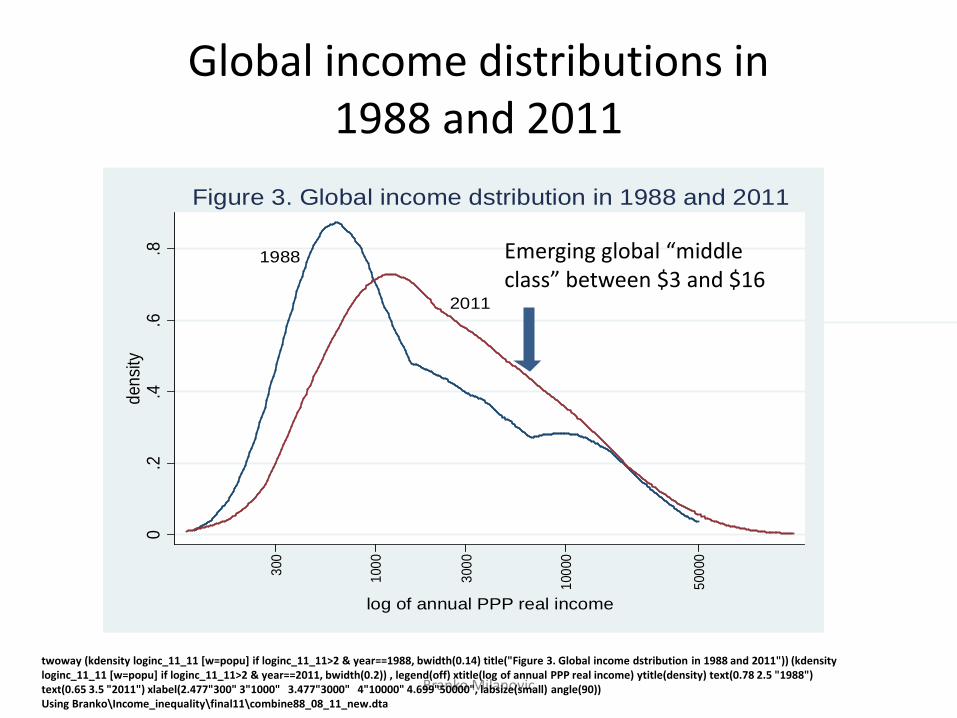
Global income distributions in 1988 and 2011
Branko Milanovic
twoway (kdensity loginc_11_11 [w=popu] if loginc_11_11>2 & year==1988, bwidth(0.14) title("Figure 3. Global income dstribution in 1988 and 2011")) (kdensityloginc_11_11 [w=popu] if loginc_11_11>2 & year==2011, bwidth(0.2)) , legend(off) xtitle(log of annual PPP real income) ytitle(density) text(0.78 2.5 "1988") text(0.65 3.5 "2011") xlabel(2.477"300" 3"1000" 3.477"3000" 4"10000" 4.699"50000", labsize(small) angle(90))Using Branko\Income_inequality\final11\combine88_08_11_new.dta
1988
2011
0.2
.4.6
.8de
nsity
300
1000
3000
1000
0
5000
0
log of annual PPP real income
Figure 3. Global income dstribution in 1988 and 2011
Emerging global “middle class” between $3 and $16
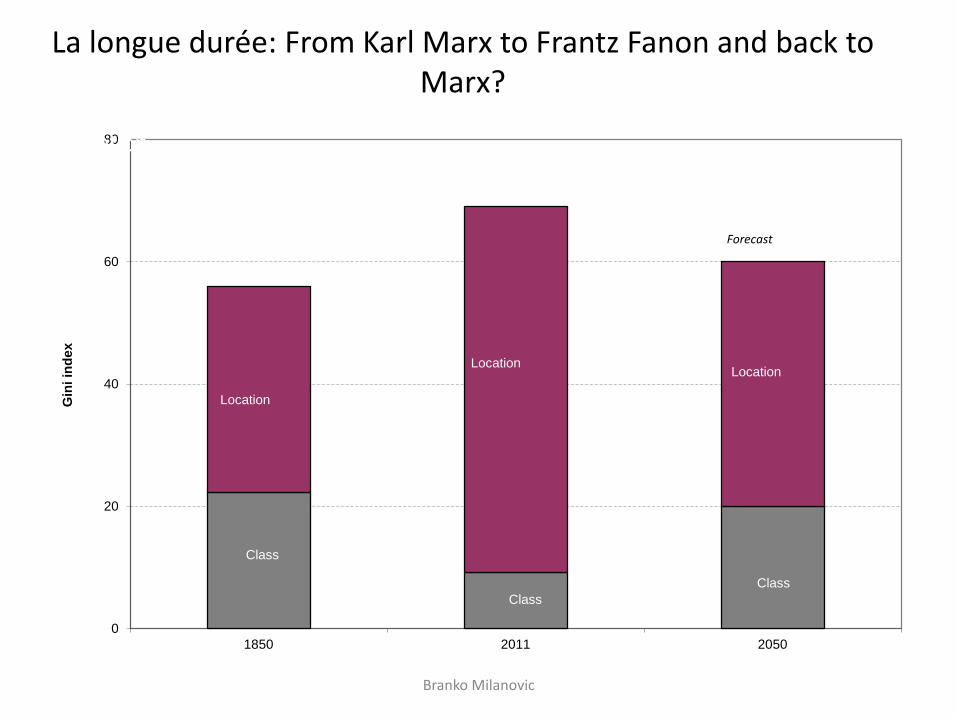
La longue durée: From Karl Marx to Frantz Fanon and back to Marx?
Branko Milanovic
0
20
40
60
80
1850 2011 2050
Gin
i ind
ex
Class
Location
Location
Class
Location
Location
Class
Forecast
D. Issues of justice and politics
1. Citizenship rent2. Migration and national welfare state
3. Hollowing out of the rich countries’ middle classes
Branko Milanovic
Global inequality of opportunity
• Regressing (log) average incomes of 118 countries’ percentiles (11,800 data points) against country dummies “explains” 77% of variability of income percentiles
• Where you live is the most important determinant of your income; for 97% of people in the world: birth=citizenship.
• Citizenship rent.
Branko Milanovic
Is citizenship a rent?
• If most of our income is determined by citizenship, then there is little equality of opportunity globally and citizenship is a rent (unrelated to individual desert, effort)
• Key issue: Is global equality of opportunity something that we ought to be concerned or not?
• Does national self-determination dispenses with the need to worry about GEO?
Branko Milanovic
The logic of the argument• Citizenship is a morally-arbitrary circumstance,
independent of individual effort• It can be regarded as a rent (shared by all
members of a community)• Are citizenship rents globally acceptable or
not?• Political philosophy arguments pro (social
contract; statist theory; self-determination) and contra (cosmopolitan approach)
Branko Milanovic
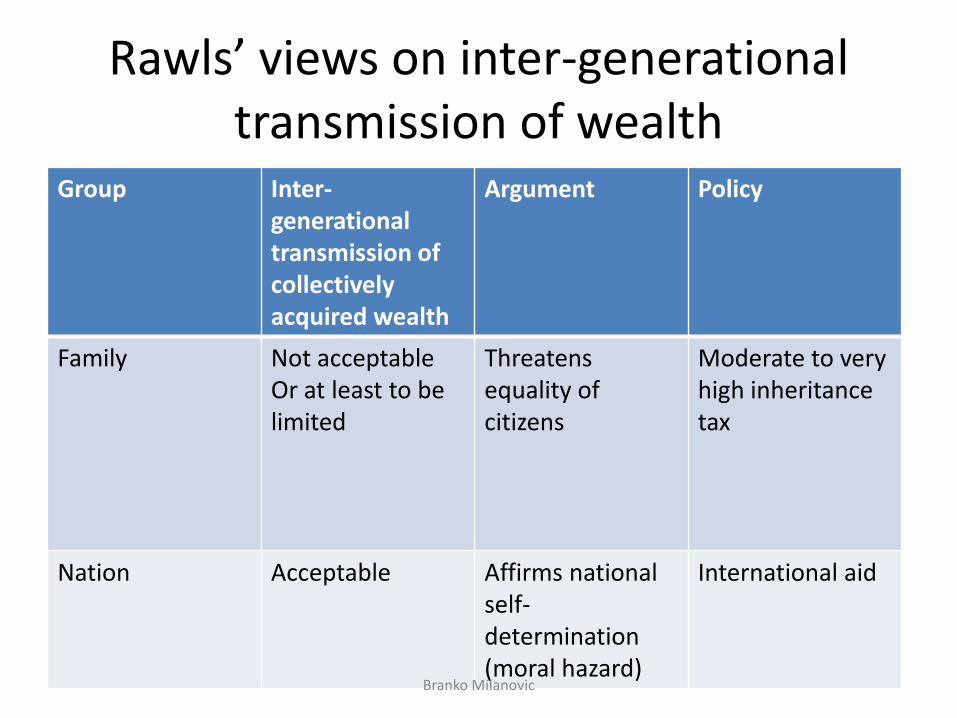
Rawls’ views on inter-generational transmission of wealth
Group Inter-generationaltransmission of collectively acquired wealth
Argument Policy
Family Not acceptableOr at least to be limited
Threatens equality of citizens
Moderate to very high inheritancetax
Nation Acceptable Affirms national self-determination(moral hazard)
International aid
Branko Milanovic
The Rawlsian world
• For Rawls, global optimum distribution of income is simply a sum of national optimal income distributions
• Why Rawlsian world will remain unequal?
Branko Milanovic
All equal Different (as now)
All equal
Different (as now)
Mean country incomes
Individual incomes within country
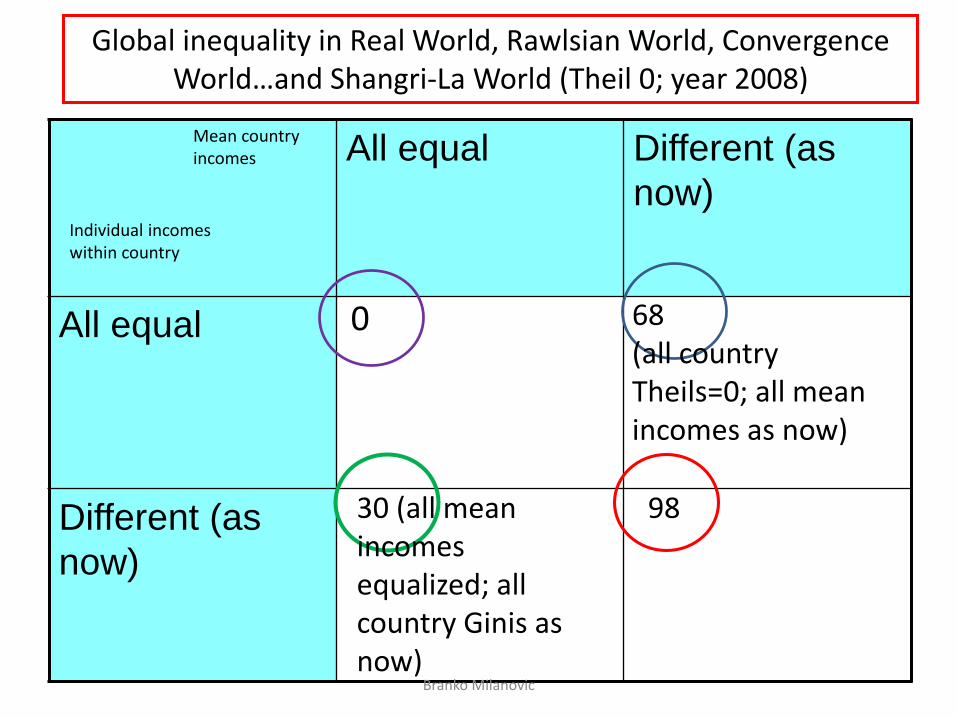
Global inequality in Real World, Rawlsian World, Convergence World…and Shangri-La World (Theil 0; year 2008)
98
68 (all country Theils=0; all mean incomes as now)
30 (all mean incomes equalized; all country Ginis as now)
0
Branko Milanovic
Conclusion
• Working on equalization of within-national inequalities will not be sufficient to significantly reduce global inequality
• Faster growth of poorer countries is key and also…
Branko Milanovic

Migration….
Branko Milanovic
Migration: a different way to reduce global inequality and citizenship rent
• How to view development: Development is increased income for poor people regardless of where they are, in their countries of birth or elsewhere
• Migration and LDC growth thus become the two equivalent instruments for development
Branko Milanovic
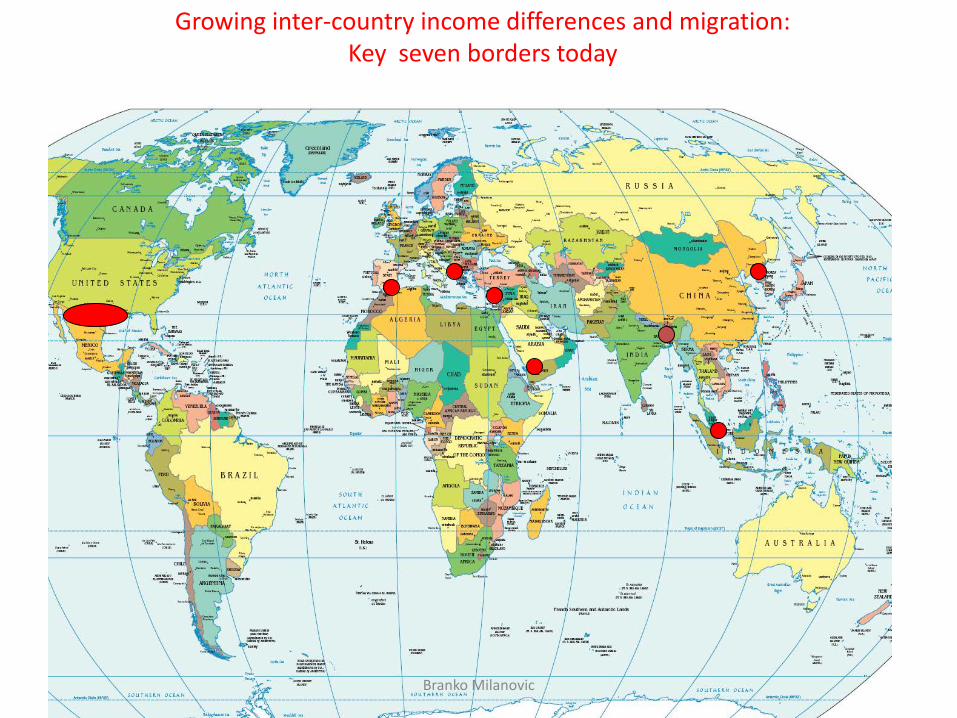
Growing inter-country income differences and migration: Key seven borders today
Branko Milanovic
Branko Milanovic
0
5
10
15
20
25
30
35
40
45
50
bottom 5%2 3 4 5 6 7 8 9 10 11 12 13 14 15 16 17 18 19 96 97 98 99 top 1%
grow
th ra
te (i
n %
)
Factile of national income distribution
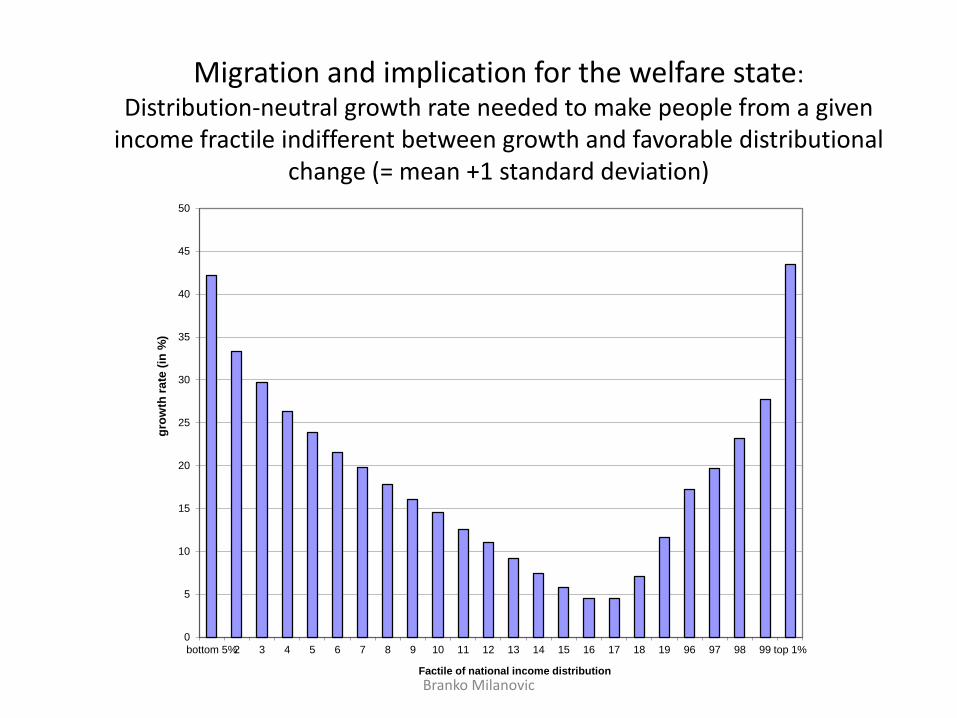
Migration and implication for the welfare state:Distribution-neutral growth rate needed to make people from a given
income fractile indifferent between growth and favorable distributional change (= mean +1 standard deviation)
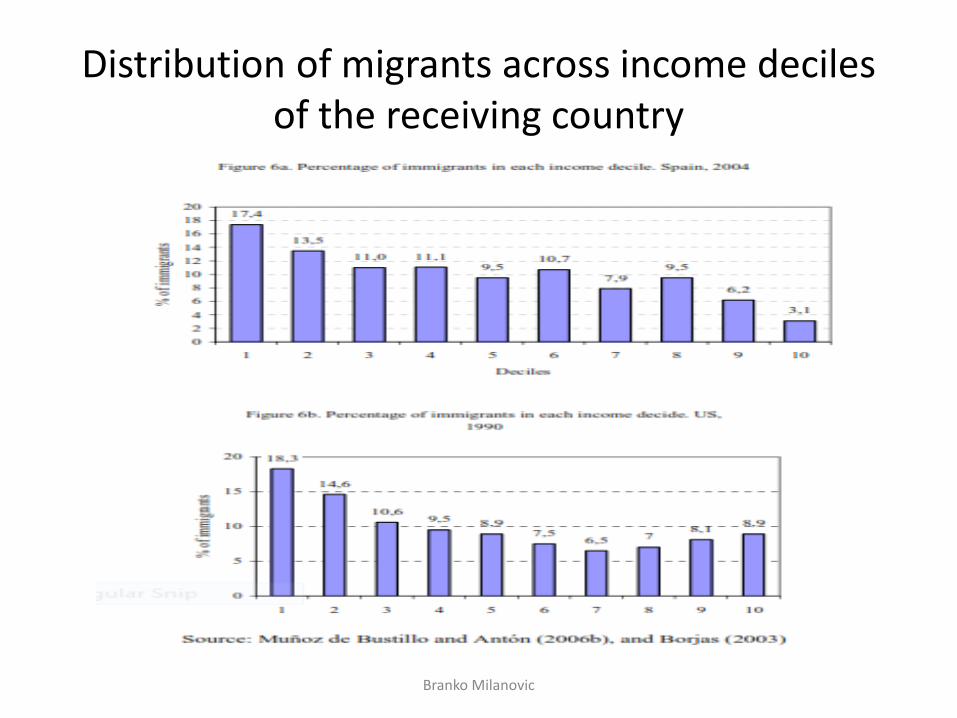
Distribution of migrants across income deciles of the receiving country
Branko Milanovic
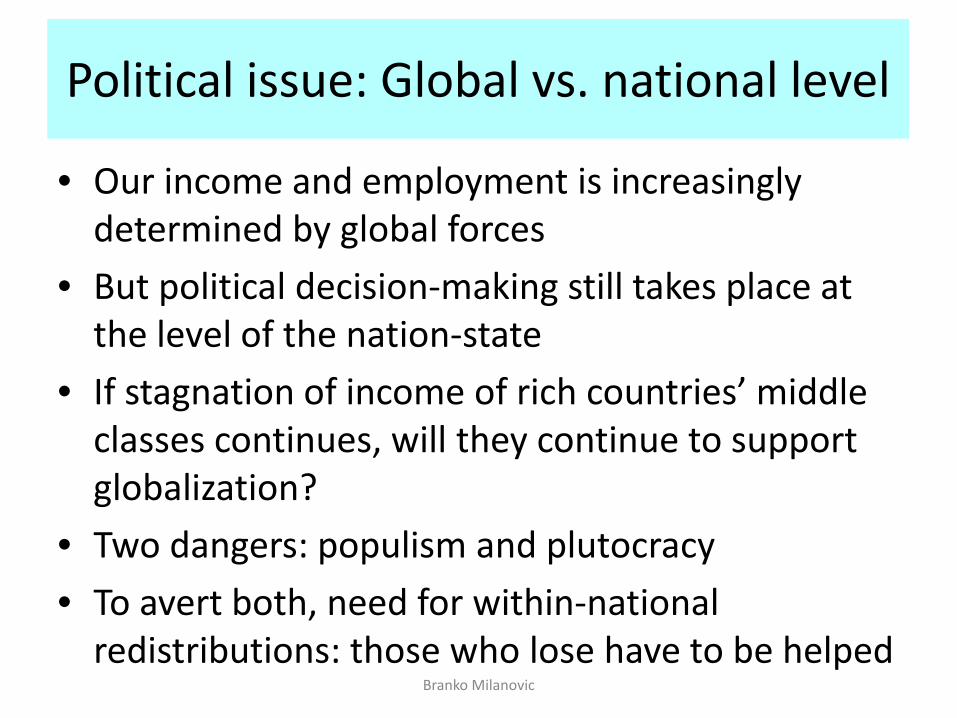
Political issue: Global vs. national level
• Our income and employment is increasingly determined by global forces
• But political decision-making still takes place at the level of the nation-state
• If stagnation of income of rich countries’ middle classes continues, will they continue to support globalization?
• Two dangers: populism and plutocracy• To avert both, need for within-national
redistributions: those who lose have to be helped Branko Milanovic
Final conclusion
• To reduce global inequality: fast growth of poor countries + migration
• To preserve good aspects of globalization: redistribution within rich countries
Branko Milanovic

Additional slides
Branko Milanovic
E. Global inequality over the long-run of history
Branko Milanovic

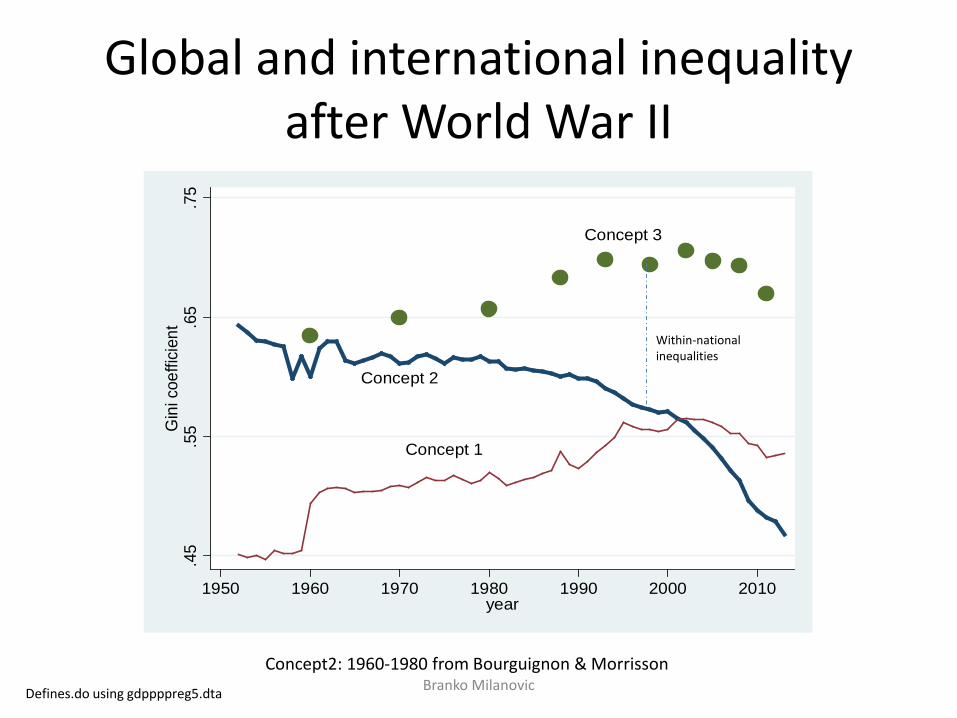
Global and international inequality after World War II
Branko MilanovicConcept2: 1960-1980 from Bourguignon & Morrisson
Defines.do using gdppppreg5.dta
Concept 2
Concept 1
Concept 3
.45
.55
.65
.75
Gin
i coe
ffici
ent
1950 1960 1970 1980 1990 2000 2010year
Within-national inequalities
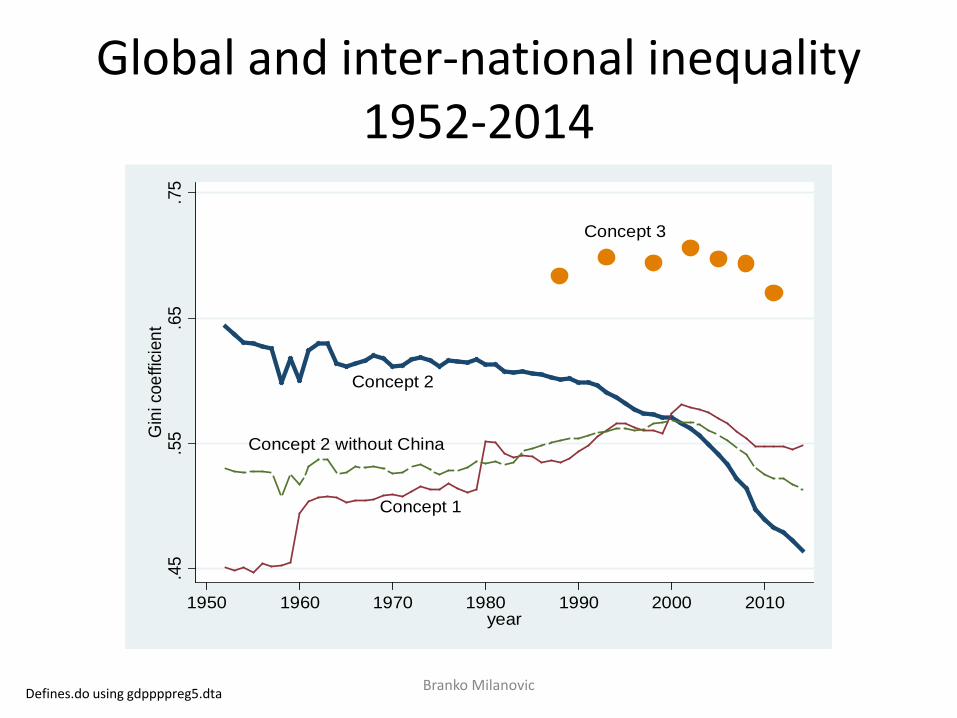
Global and inter-national inequality 1952-2014
Branko MilanovicDefines.do using gdppppreg5.dta
47
Concept 2
Concept 1
Concept 3
Concept 2 without China
.45
.55
.65
.75
Gin
i coe
ffici
ent
1950 1960 1970 1980 1990 2000 2010year
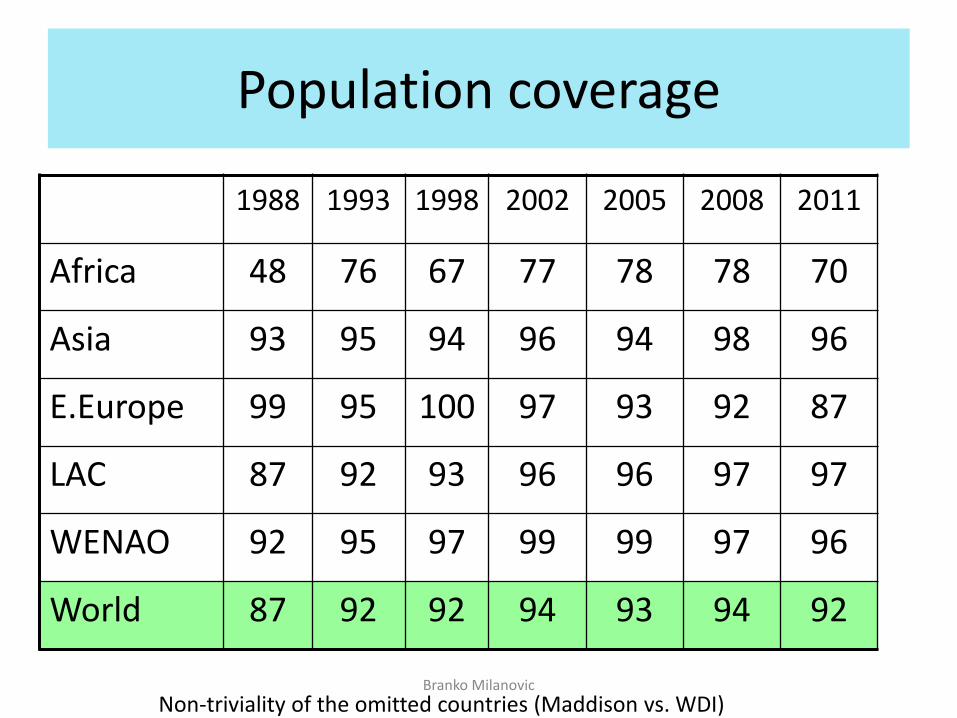
Population coverage
1988 1993 1998 2002 2005 2008 2011
Africa 48 76 67 77 78 78 70
Asia 93 95 94 96 94 98 96
E.Europe 99 95 100 97 93 92 87
LAC 87 92 93 96 96 97 97
WENAO 92 95 97 99 99 97 96
World 87 92 92 94 93 94 92
Non-triviality of the omitted countries (Maddison vs. WDI)Branko Milanovic
30
35
40
45
50
55
60
65
70
75
1800 1850 1900 1950 2000 2050
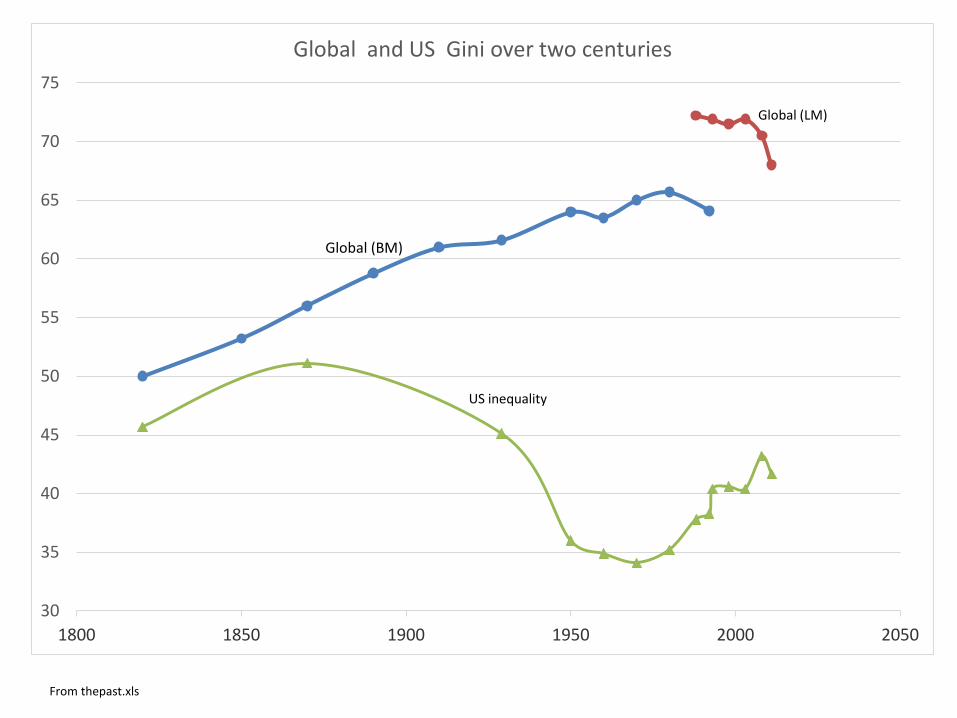
Global and US Gini over two centuries
Global (BM)
Global (LM)
US inequality
From thepast.xls
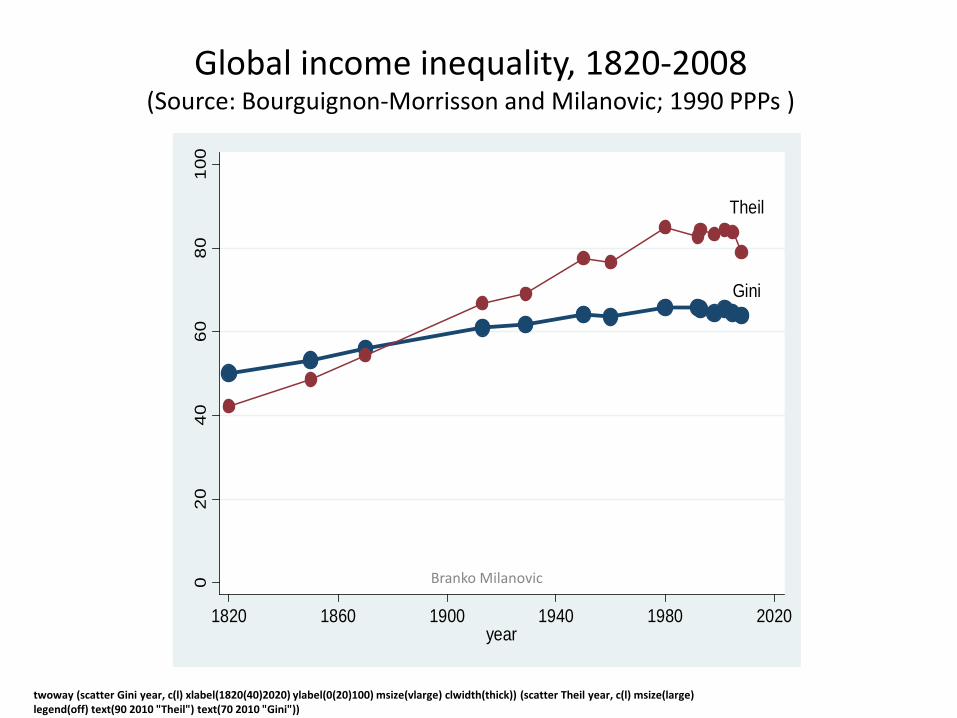
Global income inequality, 1820-2008(Source: Bourguignon-Morrisson and Milanovic; 1990 PPPs )
Theil
Gini
020
4060
8010
0
1820 1860 1900 1940 1980 2020year
twoway (scatter Gini year, c(l) xlabel(1820(40)2020) ylabel(0(20)100) msize(vlarge) clwidth(thick)) (scatter Theil year, c(l) msize(large) legend(off) text(90 2010 "Theil") text(70 2010 "Gini"))
Branko Milanovic
Branko Milanovic
0
10
20
30
40
50
60
70
1800 1850 1900 1950 2000 2050
Perc
enta
ge sh
are
of g
loba
l inc
ome
Year
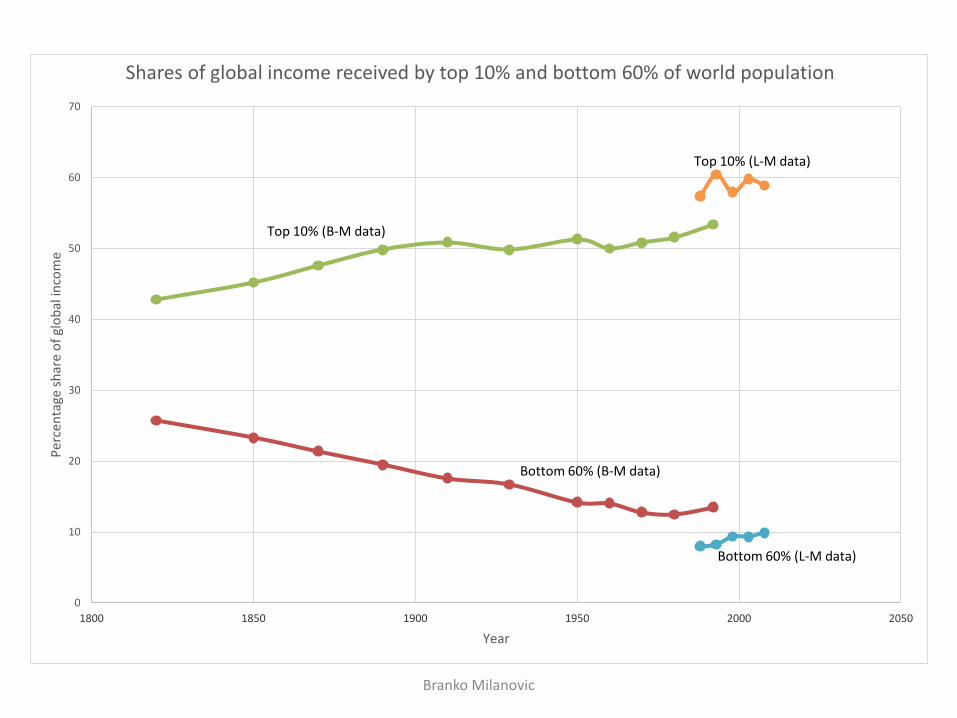
Shares of global income received by top 10% and bottom 60% of world population
Top 10% (B-M data)
Top 10% (L-M data)
Bottom 60% (B-M data)
Bottom 60% (L-M data)
A non-Marxist world
• Over the long run, decreasing importance of within-country inequalities despite some reversal in the last quarter century
• Increasing importance of between-country inequalities (but with some hopeful signs in the last five years, before the current crisis),
• Global division between countries more than between classes
Branko Milanovic
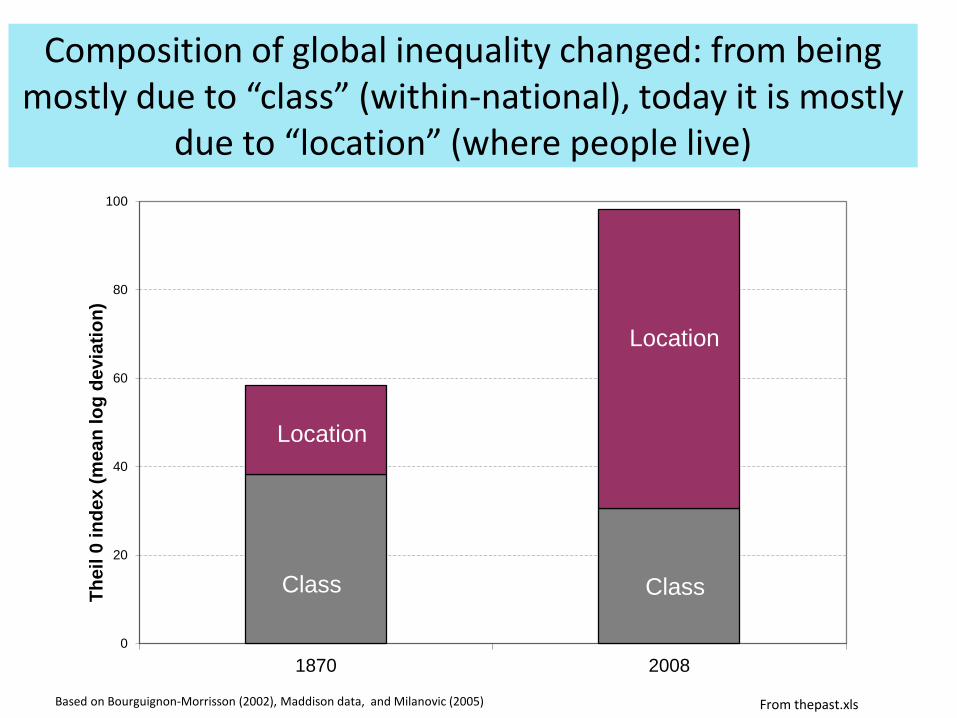
Composition of global inequality changed: from being mostly due to “class” (within-national), today it is mostly
due to “location” (where people live)
Based on Bourguignon-Morrisson (2002), Maddison data, and Milanovic (2005) From thepast.xls
Branko Milanovic0
20
40
60
80
100
1870 2008
Thei
l 0 in
dex
(mea
n lo
g de
viat
ion)
Class
Location
Location
Class
Branko Milanovic
0
10
20
30
40
50
60
70
80
90
1800 1850 1900 1950 2000 2050
Betw
een
com
pone
nt, i
n pe
rcen
t
Year
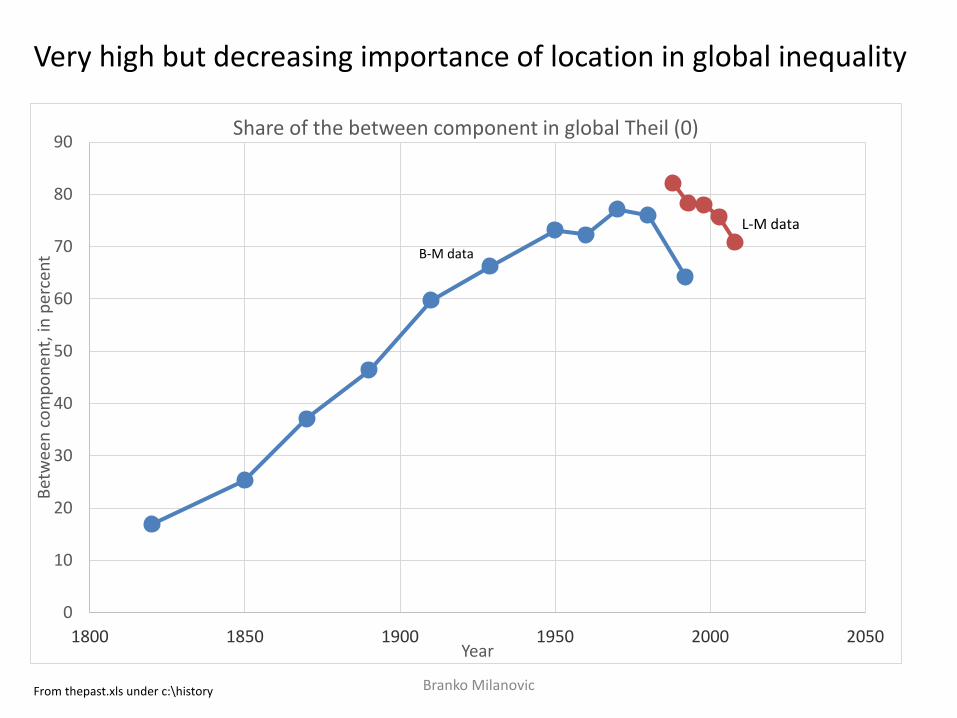
Share of the between component in global Theil (0)
B-M data
L-M data
Very high but decreasing importance of location in global inequality
From thepast.xls under c:\history

Extra for Michigan
Branko Milanovic

La longue durée
Branko Milanovic
Global and international inequality after World War II
Branko MilanovicConcept2: 1960-1980 from Bourguignon & Morrisson
Defines.do using gdppppreg5.dta
Concept 2
Concept 1
Concept 3
.45
.55
.65
.75
Gin
i coe
ffici
ent
1950 1960 1970 1980 1990 2000 2010year
Within-national inequalities
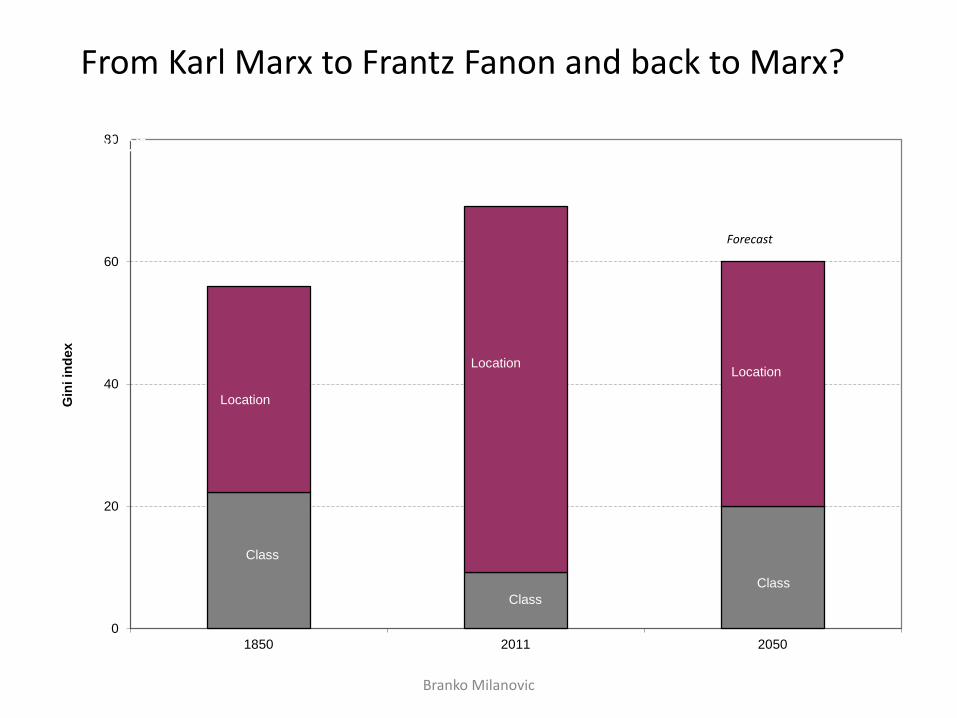
From Karl Marx to Frantz Fanon and back to Marx?
Branko Milanovic
0
20
40
60
80
1850 2011 2050
Gin
i ind
ex
Class
Location
Location
Class
Location
Location
Class
Forecast

La moyenne durée
Branko Milanovic
Branko Milanovic
0
20
40
60
80
100
120
140
0 10 20 30 40 50 60 70 80 90 100
Cum
ulat
ive
real
per
cap
ita g
row
th in
% b
etw
een
1988
and
200
8
Percentile of global income distribution
Real income growth over 1988-2008 and 1988-2011 (based on 2011 PPPs)
1988-2011
1988-2008
Global income distributions in 1988 and 2011
Branko Milanovic
twoway (kdensity loginc_11_11 [w=popu] if loginc_11_11>2 & year==1988, bwidth(0.14) title("Figure 3. Global income dstribution in 1988 and 2011")) (kdensityloginc_11_11 [w=popu] if loginc_11_11>2 & year==2011, bwidth(0.2)) , legend(off) xtitle(log of annual PPP real income) ytitle(density) text(0.78 2.5 "1988") text(0.65 3.5 "2011") xlabel(2.477"300" 3"1000" 3.477"3000" 4"10000" 4.699"50000", labsize(small) angle(90))Using Branko\Income_inequality\final11\combine88_08_11_new.dta
1988
2011
0.2
.4.6
.8de
nsity
300
1000
3000
1000
0
5000
0
log of annual PPP real income
Figure 3. Global income dstribution in 1988 and 2011
Emerging global “middle class” between $3 and $16
Implications for global theories
• End of neo-Marxist theories focused on center-periphery and structural impediments to growth in the periphery (Prebisch, structuralism, dependency, AG Frank, Amin)
• Formerly peripheral capitalism appears more successful with the “core” growing slower or not at all.
• Complete worldwide dominance of capitalism as socio-economic formation
Branko Milanovic
Implications for global theories
• Even pre-capitalist formation seem to be disappearing; less of “disarticulation” and “dualism” within states
• But disarticulation appears in the North• Global nature of capitalism: multinationals,
supply chains, transfer pricing• Even in daily life greater commercialization of
hitherto non-pecuniary relations• Yet no grand theories explaining how it hangs
together & where it leadsBranko Milanovic
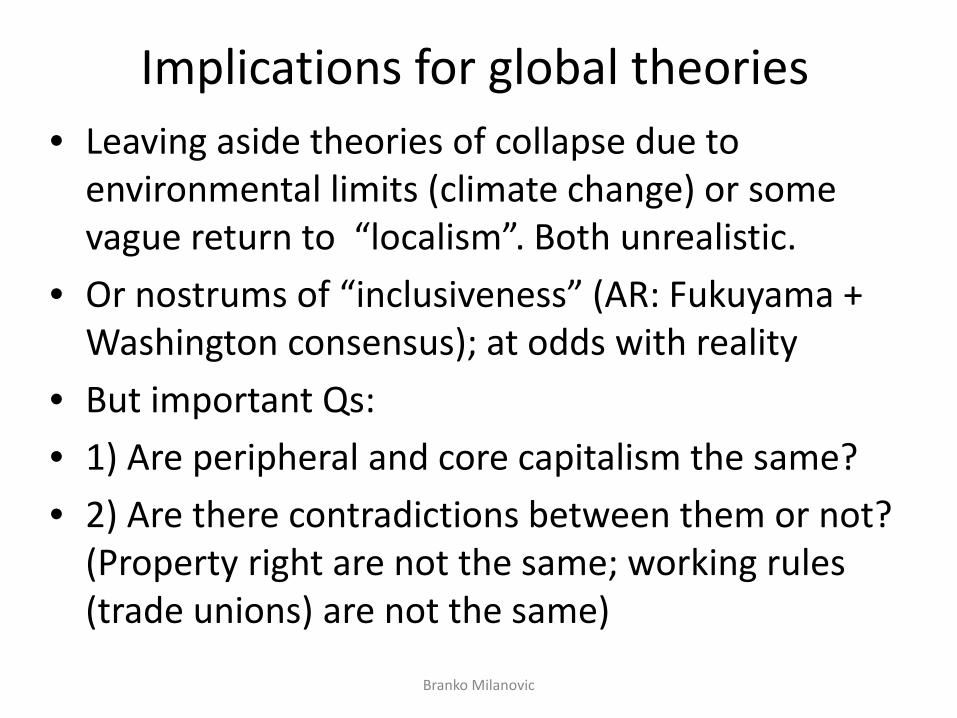
Implications for global theories• Leaving aside theories of collapse due to
environmental limits (climate change) or some vague return to “localism”. Both unrealistic.
• Or nostrums of “inclusiveness” (AR: Fukuyama + Washington consensus); at odds with reality
• But important Qs:• 1) Are peripheral and core capitalism the same?• 2) Are there contradictions between them or not?
(Property right are not the same; working rules (trade unions) are not the same)
Branko Milanovic
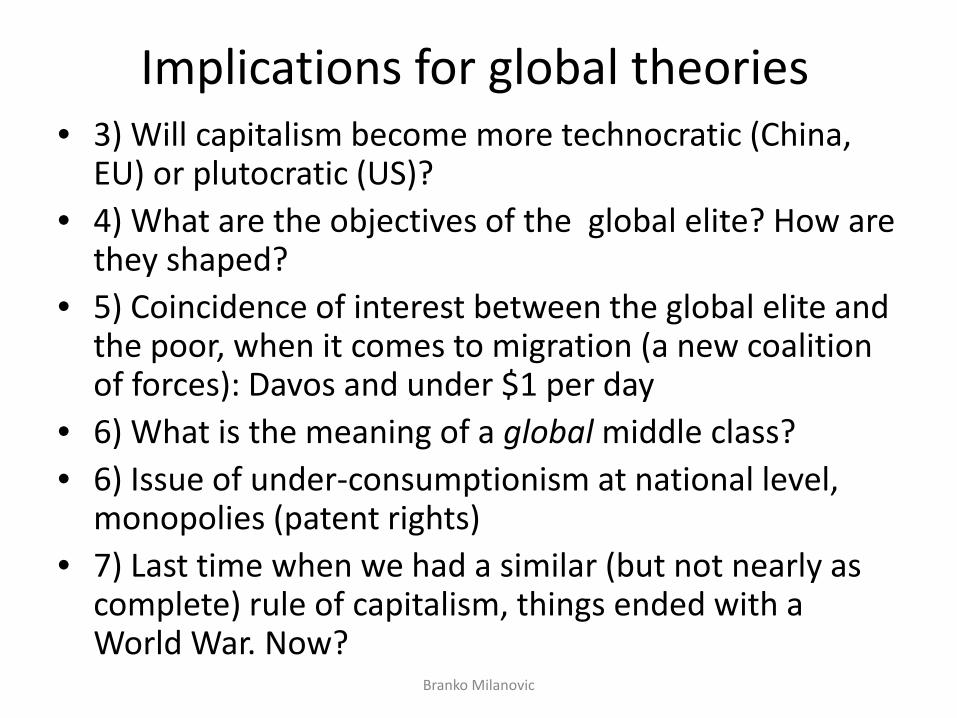
Implications for global theories• 3) Will capitalism become more technocratic (China,
EU) or plutocratic (US)?• 4) What are the objectives of the global elite? How are
they shaped?• 5) Coincidence of interest between the global elite and
the poor, when it comes to migration (a new coalition of forces): Davos and under $1 per day
• 6) What is the meaning of a global middle class?• 6) Issue of under-consumptionism at national level,
monopolies (patent rights)• 7) Last time when we had a similar (but not nearly as
complete) rule of capitalism, things ended with a World War. Now?
Branko Milanovic


![Branko [2005]- Performative Architecture - Beyond_Instrumentality](https://img.pdfslide.us/doc/110x75/55343bd55503469d708b4a44/branko-2005-performative-architecture-beyondinstrumentality.jpg)