Embed Size (px)
Citation preview
This is a repository copy of Parametric and physically based modelling techniques for flood risk and vulnerability assessment: A comparison.
White Rose Research Online URL for this paper:http://eprints.whiterose.ac.uk/74968/
Article:
Balica, SF, Popescu, I, Wright, NG et al. (1 more author) (2013) Parametric and physically based modelling techniques for flood risk and vulnerability assessment: A comparison. Environmental Modelling and Software, 41. 84 - 92 . ISSN 1364-8152
https://doi.org/10.1016/j.envsoft.2012.11.002
[email protected]://eprints.whiterose.ac.uk/
Reuse
Unless indicated otherwise, fulltext items are protected by copyright with all rights reserved. The copyright exception in section 29 of the Copyright, Designs and Patents Act 1988 allows the making of a single copy solely for the purpose of non-commercial research or private study within the limits of fair dealing. The publisher or other rights-holder may allow further reproduction and re-use of this version - refer to the White Rose Research Online record for this item. Where records identify the publisher as the copyright holder, users can verify any specific terms of use on the publisher’s website.
Takedown
If you consider content in White Rose Research Online to be in breach of UK law, please notify us by emailing [email protected] including the URL of the record and the reason for the withdrawal request.
1
Parametric and physically based modelling techniques for 1
flood risk and vulnerability assessment: a comparison 2
3
4
Balica, S.F.1,2
, Popescu, I.1, Beevers, L.
3,Wright, N.G.
1,2,4 5
6
1UNESCO-IHE, Institute for Water Education, P.O. Box 3015, 2601 DA Delft, the 7
Netherlands 8 2 Delft University of Technology, Postbus 5, 2600 AA Delft, the Netherlands 9
3 School of the Built Environment, Heriot Watt University, Edinburgh, EH14 4AS, UK 10
4 School of Civil Engineering, University of Leeds, Leeds, LS2 9JT, UK 11
12
13
14
Abstract 15 16
Floods are one of the most common and widely distributed natural risks to life and property. 17
There is a need to identify the risk in flood-prone areas to support decisions for risk 18
management, from high-level planning proposals to detailed design. There are many methods 19
available to undertake such studies. The most accepted, and therefore commonly used, of 20
which is computer-based inundation mapping. By contrast the parametric approach of 21
vulnerability assessment is increasingly accepted. Each of these approaches has advantages 22
and disadvantages for decision makers and this paper focuses on how the two approaches 23
compare in use. It is concluded that the parametric approach, here the FVI, is the only one 24
which evaluates vulnerability to floods; whilst although the deterministic approach has 25
limited evaluation of vulnerability, it has a better science base. 26
27
Keywords: floods, vulnerability, risk, physically-based models, flood vulnerability index 28
29
30
1. Introduction 31
32 Floods are one of the most common and widely distributed natural risks to life and property. 33
Damage caused by floods on a global scale has been significant in recent decades (Jonkman 34
and Vrijling, 2008). In 2011, floods were reported to be the third most common disaster, after 35
earthquake and tsunami, with 5202 deaths, and affecting millions of people (CRED, 2012). 36
River, coastal and flash floods can claim human lives, destroy properties, damage economies, 37
make fertile land unusable and damage the environment. The development of techniques, 38
measures and assessment methodologies to increase understanding of flood risk or 39
vulnerability can assist decision makers greatly in reducing damage and fatalities. Different 40
methods to assess risk and vulnerability of areas to flooding have been developed over the 41
last few decades. This paper aims to investigate two of the more widely used methods: 42
2
traditional physically-based modelling approaches to risk assessment and parametric 43
approaches for assessing flood vulnerability. The paper aims to present and discuss the 44
benefits of each to decision makers. 45
46
Flood risk as a concept 47 The term "risk” in relation to flood hazards was introduced by Knight in 1921, and is used in 48
diverse different contexts and topics showing how adaptive any definition can be (Sayers et 49
al., 2002). In the area of natural hazard studies, many definitions can be found. It is clear that 50
the many definitions related to risk (Alexander, 1993; IPCC, 2001; Plate, E., 2002; Barredo 51
et al., 2007) are interrelated and interchangeable and each of them has certain advantages in 52
different applications (e.g. Sayers et al., 2002; Merz et al., 2007). 53
54
This study will consider risk as the product of two components, i.e. probability and 55
consequence (Smith, 2004): 56
57
Risk = Probability X Consequence (1) 58
59
This concept of flood risk is strictly related to the probability that a high flow event of a 60
given magnitude occurs, which results in consequences which span environmental, economic 61
and social losses caused by that event. The EU Flood Directive 2007/60/EC (EC, 2007) and 62
UNEP, (2004) uses this definition of risk where "flood risk" means the combination of the 63
probability of a flood event and of the potential adverse consequences for human health, the 64
environment, cultural heritage and economic activity associated with a flood event 65
66
Hazard and Flood Hazard as a concept 67 “The probability of the occurrence of potentially damaging flood events is called flood 68
hazard” (Schanze, 2006). Potentially damaging means that there are elements exposed to 69
floods which may be harmed. Flood hazards include events with diverse characteristics, e.g. 70
a structure located in the floodplain can be endangered by a 20-year flood and a water level 71
of 0.5m and by 50-year flood and a water level of 1.2m. Heavy rainfall, coastal or fluvial 72
waves, or storm surges represent the source of flood hazard. Generally these elements are 73
characterised by the probability of flood event with a certain magnitude and other 74
characteristics. 75
76
Vulnerability and Flood vulnerability as a concept 77 While the notion of vulnerability is frequently used within catastrophe research, researchers’ 78
notion of vulnerability has changed several times lately and consequently there have been 79
several attempts to define and capture the meaning of the term. It is now commonly 80
understood that “vulnerability is the root cause of disasters” (Lewis, 1999) and “vulnerability 81
is the risk context” (Gabor and Griffith, 1980). Many authors discuss, define and add detail to 82
this general definition. Some of them give a definition of vulnerability to certain hazards like 83
climate change (IPCC, 2001), environmental hazards (Blaikie et al., 1994); (Klein and 84
Nicholls, 1999), (ISDR, 2004), or the definition of vulnerability to floods (Veen & 85
Logtmeijer 2005, Connor & Hiroki, 2005, UNDRO, 1982, McCarthy et al., 2001). 86
87
This study will use the following definition of vulnerability specifically related to flooding: 88
3
The extent to which a system is susceptible to floods due to exposure, a perturbation, 89
in conjunction with its ability (or inability) to cope, recover, or basically adapt. 90
91
2. The practice of flood risk and vulnerability assessment 92 93
Different methods to assess or determine hazard, risk and vulnerability to flooding have 94
evolved through ongoing research and practice in recent decades (Junqiang Xia et al., 2011; 95
Hartanto et al., 2012; Gichamo et al., 2012). Two distinct method types can be distinguished 96
and are considered in this paper: 97
Deterministic modelling approaches which use physically based modelling 98
approaches to estimate flood hazard/probability of particular event, coupled with 99
damage assessment models which estimate economic consequence to provide an 100
assessment of flood risk in an area. 101
Parametric approaches which aim to use readily available data of information to build 102
a picture of the vulnerability of an area. 103
Each method has developed from different schools of thought; the first approach mentioned 104
is the traditional method which is routinely used in practice and academia alike. The second 105
approach has evolved from several concerns such us: the internal characteristics of the 106
system, global climate change and the political and institutional characteristics of the system. 107
However, it takes a long time to develop the structural and non-structural measures required 108
to prepare for flooding. In order to help guide such policy decisions, the development of a 109
practical method for assessing flood vulnerability was needed. Among this need, this 110
parametric approach points on vulnerability assessments to minimize the impacts of flooding 111
and also to increase the resilience of the affected system. 112
The physically based modelling approach 113 Floods are primarily the result of extreme weather events. The magnitude of such an extreme 114
event has an inverse relationship with the frequency of its occurrence i.e. floods with high 115
magnitude occur less frequently than more moderate events. The relationship between the 116
frequencies of occurrence and the magnitude of the extreme event is traditionally established 117
by performing a frequency analysis of historical hydrological data using different probability 118
distributions. 119
120
Once the frequency, magnitude and shape of the hydrograph are established, computer 121
models which discretise the topographical river and land form are used to estimate flood 122
depth, flood elevation and velocity (Hansson et al., 2008). Calculation of flood inundation 123
depth and inundation extent is done using computational models based on solutions of the 124
full or approximate forms of the shallow water equations. These types of models are one 125
(1D) or two-dimensional (2D). 1D modelling is the common approach for simulating flow in 126
a river channel, where water flow in the river is assumed to flow in one dominant direction 127
which is aligned with the centre line of the main river channel. A 1D model can solve flood 128
flows in open channels, if the shallow water assumptions that vertical acceleration is not 129
significant and that water level in the channel cross-section is approximately horizontal are 130
valid. However problems arise when the channel is embanked and water levels are different 131
in the floodplain than in the channel and 2D models are needed in this situation. The 132
hydraulic results from a computer model, such as inundation depth, velocity and extent can 133
be used for loss estimation due to a particular design flood event. These parameters can then 134
4
be linked to estimates of economic damage and loss in the affected area. Different models of 135
damage and loss are available and are based on established economic relationships (ref). 136
137
This method relies on a significant amount of detailed topographic, hydrographic and 138
economic information in the area studied. If the information is available, fairly accurate 139
estimates of the potential risk to an area, as a result of economic losses, can be calculated. 140
This type of flood hazard and associated economic loss information is reasonably easily 141
communicated to the public. With the case of economic loss the public is used to hearing 142
information provided in this manner. However, if the information for the model construction 143
is not available, the method is likely to incur significant anomalies, which can call into 144
question the validity of the assessment. These types of knowledge gaps and uncertainties are 145
difficult to communicate effectively and can confuse decision makers and the public alike. 146
147
The scientific community therefore has researched methods that will overcome these 148
problems. In this context it becomes important to evaluate the hazard, risk and vulnerability 149
to flooding also from a different perspective: the parametric approach. 150
The parametric approach 151 The parametric approach, introduced in 80’s by Little and Robin, (1983), starts from the 152
perspective of limited data, and has developed further since. The parametric approach aims to 153
estimate the complete vulnerability value of a system by using only a few readily available 154
parameters relating to that system, though the implementation of the approach is not simple. 155
156
Four types of parametric approaches have been developed by the scientific communities: i) 157
estimating the complete vulnerability value of a system by using only few parameters 158
relating to that system, ii) estimation of “the imputation of non-observable values” (Glynn et 159
al., 1993), in which the observed parameters are used to model the non-observed ones. (This 160
assumption can be wrong), iii) the “parametric modelisation via maximum likelihood” (Little 161
and Rubin, 1987), which is not a direct approach and is based on large number of 162
assumptions; and iv) the “semi-parametric approach” (Newey, 1990) which allows modelling 163
only of what is strictly necessary. 164
165
This study considers the first type of parametric approach, where the indicators and results 166
rely on assumptions that cannot be validated from the observed data. This parametric 167
approach tries to design a methodology that would allow the experts to assess the 168
vulnerability results depend on the system characteristics and also to show the drawbacks, the 169
practical and the philosophical in the specifications of the likelihood function (Serrat and 170
Gomez, 2001). 171
172
In a general context, vulnerability is constructed like an instrumental value or taxonomy, 173
measuring and classifying social, economic and environmental systems, from low 174
vulnerability to high vulnerability. The vulnerability notion has come from different 175
disciplines, from economics and anthropology to psychology and engineering (Adger, 2006); 176
the notion has been evolving giving strong justifications for differences in the extent of 177
damage occurred from natural hazards. 178
179
5
Whatever the exact measure of vulnerability one chooses to work with, the starting point is to 180
estimate the right parameters of the process under the specification of the datasets. 181
Vulnerability assessments have to be explicitly forward-looking. No matter how rich the 182
data, the vulnerability of various systems is never directly obvious. 183
184
At spatial and temporal scales, several methodologies such as parametric-based approaches 185
are applied to a vast diversity of systems: Environmental Vulnerability Index (EVI), Pratt et 186
al, 2004; The Composite Vulnerability Index for Small Island States (CVISIS), Briguglio, 187
2003; Global Risk and Vulnerability Index (GRVI), Peduzzi et al., 2001; Climate 188
Vulnerability Index (CVI), Sullivan and Meigh, 2003, etc.. 189
190
This study uses a parametric approach proposed by Balica et al., (2009) to determine and 191
index flood vulnerability for four system components (social, economic environmental and 192
physical). 193
The parametric approach has some drawbacks, such as: an inevitable level of assumptions, 194
the need for a sensitivity analyses, reliable sources and the subjective manner of interpreting 195
the results. 196
Comparison of approaches 197 Physically based modelling and parametric approaches offer two different techniques for 198
assessing flood risk and vulnerability. In light of these two distinct approaches, a clear 199
question arises: what are the different advantages and disadvantages for decision makers 200
using these techniques and “how do the two approaches compare in use?” 201
202
In order to answer this research question it is important to assess what decision makers 203
require from these techniques in order to reach decisions. For the purposes of this study the 204
following key components are identified: 205
Information on the mechanism and cause of flooding (flood hazard) in the area 206
studied. 207
Information on the health and safety implications for the affected population of the 208
flood hazard posed in the area, and the relative areas or population who are 209
particularly vulnerable (and why). 210
Information on the economic damage and losses expected in the area given a 211
particular event. 212
In addition to these key components a fourth criteria was identified: 213
How easily is this information communicated, both 214
o From the expert undertaking the study to the decision-maker and 215
o From the decision-maker to the public 216
217
This study will use the above identified criteria to compare the application of the two 218
techniques (physically based modelling and the parametric approach) to a case study area in 219
Budalangi, on the Nzioa River in Western Kenya. The paper aims to investigate the benefits 220
and drawbacks of each approach, with the purpose of informing decision makers of the use. 221
222
6
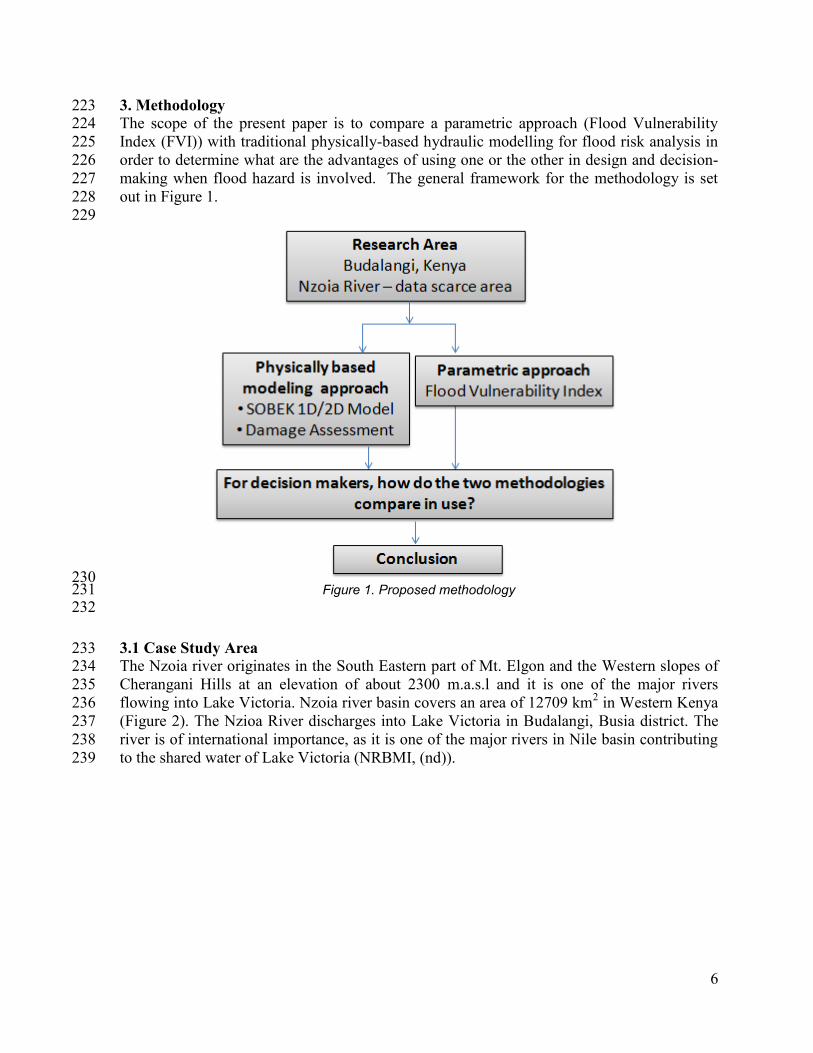
3. Methodology 223 The scope of the present paper is to compare a parametric approach (Flood Vulnerability 224
Index (FVI)) with traditional physically-based hydraulic modelling for flood risk analysis in 225
order to determine what are the advantages of using one or the other in design and decision-226
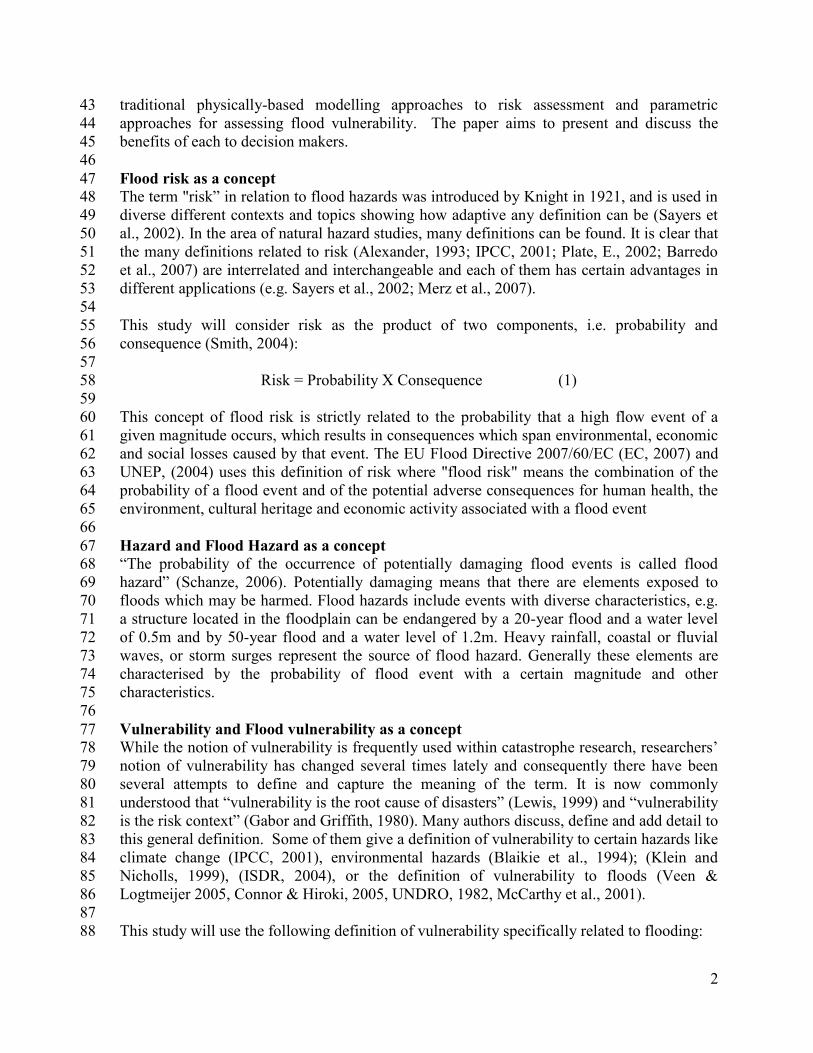
making when flood hazard is involved. The general framework for the methodology is set 227
out in Figure 1. 228
229
230 Figure 1. Proposed methodology 231
232
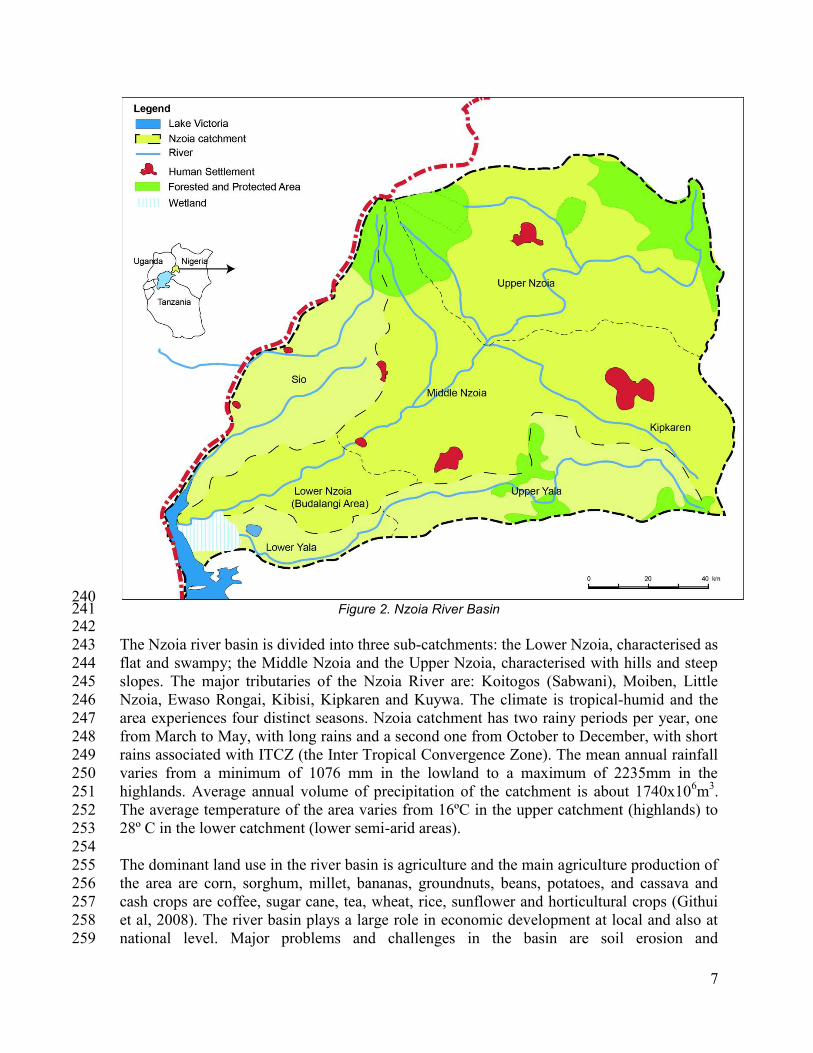
3.1 Case Study Area 233 The Nzoia river originates in the South Eastern part of Mt. Elgon and the Western slopes of 234
Cherangani Hills at an elevation of about 2300 m.a.s.l and it is one of the major rivers 235
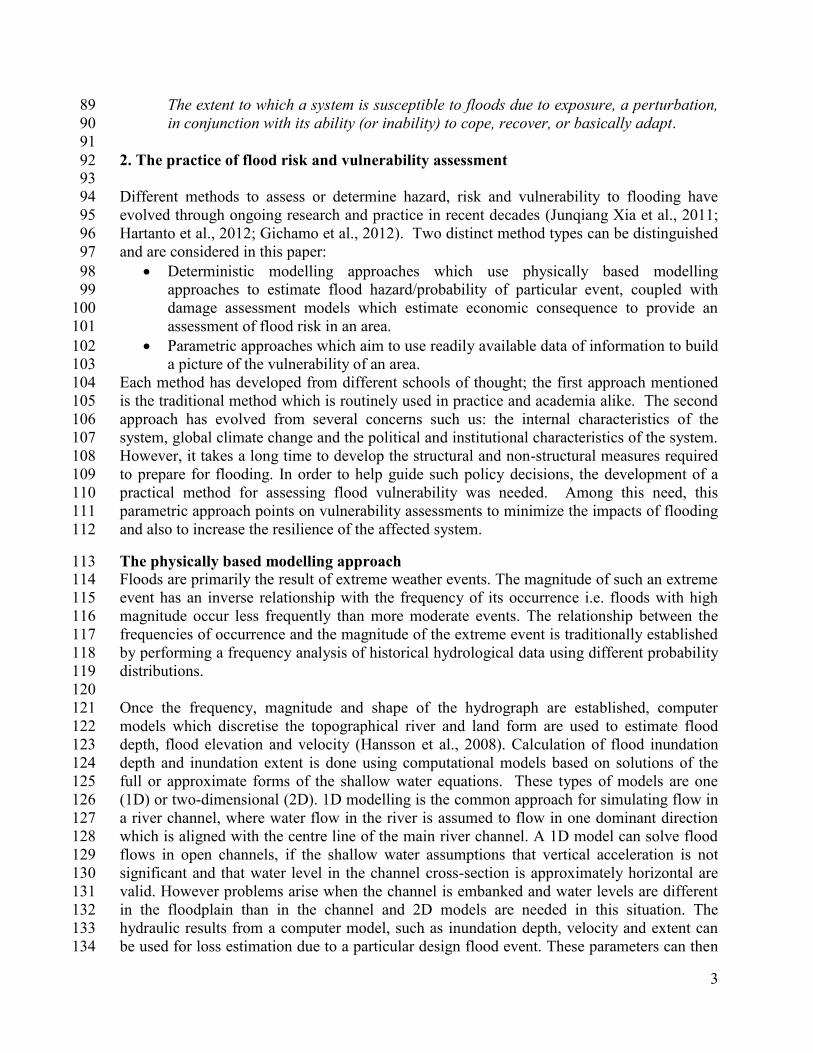
flowing into Lake Victoria. Nzoia river basin covers an area of 12709 km2 in Western Kenya 236
(Figure 2). The Nzioa River discharges into Lake Victoria in Budalangi, Busia district. The 237
river is of international importance, as it is one of the major rivers in Nile basin contributing 238
to the shared water of Lake Victoria (NRBMI, (nd)). 239
7
240 Figure 2. Nzoia River Basin 241
242
The Nzoia river basin is divided into three sub-catchments: the Lower Nzoia, characterised as 243
flat and swampy; the Middle Nzoia and the Upper Nzoia, characterised with hills and steep 244
slopes. The major tributaries of the Nzoia River are: Koitogos (Sabwani), Moiben, Little 245
Nzoia, Ewaso Rongai, Kibisi, Kipkaren and Kuywa. The climate is tropical-humid and the 246
area experiences four distinct seasons. Nzoia catchment has two rainy periods per year, one 247
from March to May, with long rains and a second one from October to December, with short 248
rains associated with ITCZ (the Inter Tropical Convergence Zone). The mean annual rainfall 249
varies from a minimum of 1076 mm in the lowland to a maximum of 2235mm in the 250
highlands. Average annual volume of precipitation of the catchment is about 1740x106m
3. 251
The average temperature of the area varies from 16ºC in the upper catchment (highlands) to 252
28º C in the lower catchment (lower semi-arid areas). 253
254
The dominant land use in the river basin is agriculture and the main agriculture production of 255
the area are corn, sorghum, millet, bananas, groundnuts, beans, potatoes, and cassava and 256
cash crops are coffee, sugar cane, tea, wheat, rice, sunflower and horticultural crops (Githui 257
et al, 2008). The river basin plays a large role in economic development at local and also at 258
national level. Major problems and challenges in the basin are soil erosion and 259
8
sedimentation, deforestation, flooding, and wetland degradation. The area located at the most 260
downstream end of the catchment is, as previously mentioned the Budalangi area, which is 261
the focus of the present study. Floods are frequent in the Budalangi area 262
(WMO/MWRMD/APFM, 2004) and their impact is felt through loss of life, damage to 263
property and agricultural/crop destruction. 264
265
This case study is data scarce area. The lower the accuracy in the data, the lesser the accuracy 266
in the predictions, therefore in data scarce areas this can result in bad or poor vulnerability 267
predictions. Consequently, the results of the two approaches chosen may prove which one is 268
a more appropriate approach to be used by the decision makers in such cases. 269
270
3.2. Assessing the flood risk of Budalangi region using physically based modelling 271 There are many simulation models available for solving problems of unsteady or steady flow. 272
In this present study, an unsteady flow analysis was carried out using the SOBEK 1D/2D 273
tool, developed by Deltares. SOBEK 1D/2D couples one-dimensional (1D) hydraulic 274
modelling of the river channel to a two-dimensional (2D) representation of the floodplains. 275
The hydrodynamic 1D/2D simulation engine is based upon the optimum combination of a 276
minimum connection search direct solver and the conjugate gradient method. It also uses a 277
selector for the time step, which limits the computational time wherever this is feasible. 278
Detailed numerical implementation of the solution of the Saint Venant flow equations in 279
SOBEK 1D/2D is given in the technical user manual of Verwey, (2006). 280
281
Generally the damages by flooding are classified as damages which can be quantified as 282
monetary losses (tangible) and the damages which cannot be evaluated quantitatively in 283
economic terms (intangible). These damages may be direct or indirect depending upon the 284
contact to the flooding. 285
286
Flood damage estimation methodologies are applied worldwide (Dutta et al., 2003). For 287
example, in the United Kingdom a standard approach to flood damage assessment is used 288
(developed in the mid 1970s). Since then continually refined, this approach is mandatory for 289
local authorities and agencies wanting central government assistance with flood mitigation 290
measures. In United States, U.S. Army Corps of Engineers (USACE) has developed its own 291
guidelines for urban flood damage measurement, (USACE, 1988). The method is based on 292
the US Water Resources Council's 1983 publication on 'Principles and Guidelines for Water 293
and Related Land Resources Implementation Studies'. The approach adopted in the method is 294
very comprehensive for estimation of damage to urban buildings and to agriculture. In 295
Australia, authorities considered that is no standard approach and it is a little attempt to 296
achieve standard approach. Flood damage estimation methodologies are applied as well in 297
many countries in Europe (Forster et al., 2008). These approaches are useful in conducting 298
cost-benefit analyses of the economic feasibility of flood control measures. 299
300
This paper uses the Forster et al., 2008, approach where the expected damage (ED) on 301
agriculture was calculated using the following equation, which is modified from Forster et 302
al., (2008). 303
304
9
噺 茅 茅 茅 , where ED – estimation damage; MV – market value; Y – yield per 305
unit area; A- area of cultivation; DI – damage impact factor. 306
307
The number of houses in the inundated area was calculated using the information on 308
population density and average number of family member per household. 309
310 噺 瀧代茅沢第題托 ; where NH – number of houses in inundated area; IA – inundated area; PD – 311
population density; FM – average number of family per household. 312
313
In order to estimate the flood damage, the estimation of some flood parameters are needed: 314
flow velocity, depth and duration at any given point, proper classification of damage 315
categories considering nature of damage, establishment of relationship between flood 316
parameters and damage for different damage categories. 317
318
Flood Inundation Modelling 319 In order to build the 1D/2D hydrodynamic model of the Budalangi river, in SOBEK, 320
available topographical information from the Shuttle Radar Topography Mission (SRTM) at 321
a resolution of 90m by 90m and sparse cross-section data were used. Hydrograph variations 322
at the upstream boundaries of the model were provided by a calibrated hydrological SWAT 323
model of the Nzoia catchment. Recorded water levels for Lake Victoria were used as 324
downstream boundary conditions. The SWAT model used to provide the upstream boundary 325
condition was the one originally built and described by Githui et al. (2008) and recalibrated 326
by van Hoey (2008). The 1:200 years design flood determined by SWAT was routed 327
downstream by the hydrodynamic SOBEK model and inundation extents were drawn. A 1 in 328
200 year return flood was recorded on Nzoia river on November 2008, and therefore the 329
inundation extent produced by the model was compared with available aerial information 330
captured by to the Advanced Land Imager (ALI) on NASA’s earth observing-1 satellite on 331
the 13th November 2008. 332
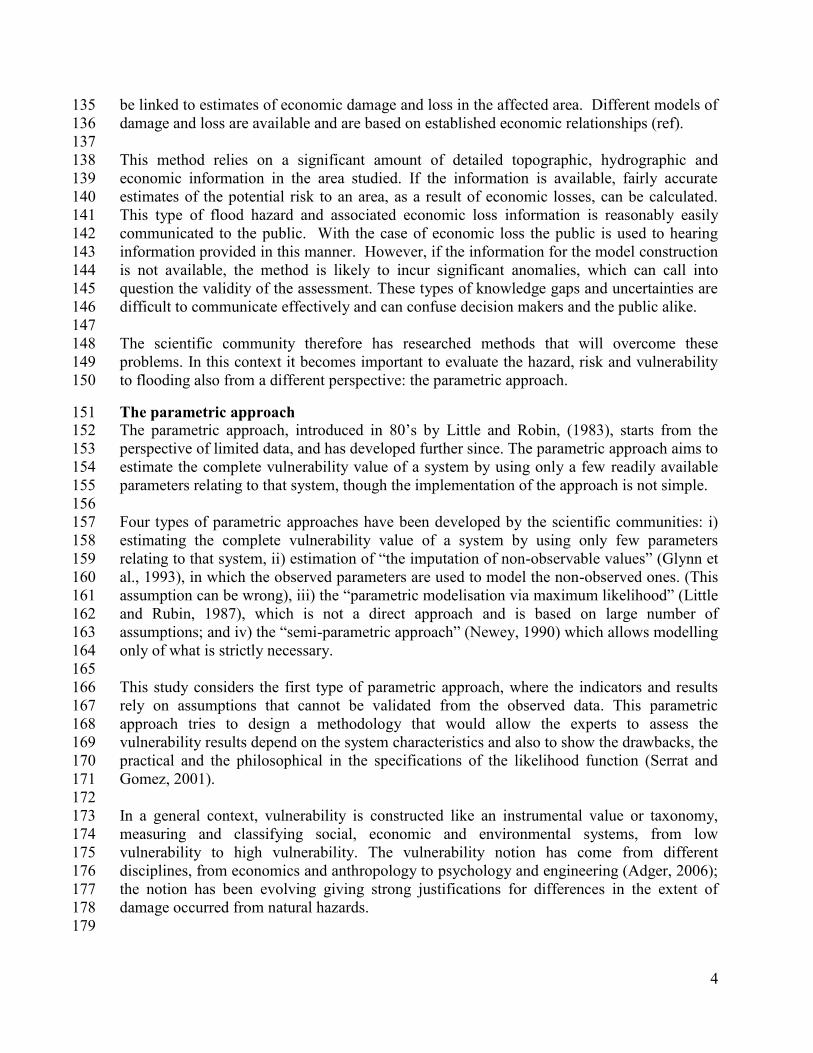
The results of the model, at the moment of the largest flood extent, for the 1:200 return flood 333
period are represented in Figure 3. 334
335
Flood Damage Evaluation 336
Many flood damage assessment methods have been developed since 1945 (White, 1945). 337
However, quantifying the expected flood damage is very difficult because the impact of a 338
flood is a function of many physical and behavioural factors. For the purposes of this paper, 339
flood damage was assumed to be related only to the flood depth. 340
341
The Budalangi region is a poorly developed rural area whose main industry is agriculture. 342
Consequently the main expected damages were anticipated to be on the agricultural sector 343
and were calculated based on a formula developed by Forster et al., (2008). The main cash 344
crops in the area are known to be sugarcane, maize and rice. These crops were used, with 345
readily available yield and expected local market values, to calculate the potential losses due 346
to floods as a result of the 200 year return period event. In addition, loss of property and the 347
affected population were included in the damage estimation, however it is recognised that in 348
10
excluding the calculation of damage in relation to velocity this estimation is significantly 349
simplified. 350
351
3.3. Assessing flood vulnerability of Budalangi using a parametric method 352
As mentioned above the parametric method used in this study is the one developed by Balica 353
et al, 2009, which consists in determining a flood vulnerability index (FVI), based on four 354
components of flood vulnerability: social, economic, environmental and physical and their 355
interactions, which can affect the possible short term and long term damages. 356
357
The four components of the flood vulnerability have been linked with the factors of 358
vulnerability: exposure, susceptibility and resilience (Bosher et al., 2007, Penning-Rowsell 359
and Chatterton, 1977). 360
361
The conceptual FVI equation is: 362
FVI =岫継 茅 鯨岻【迎, (2) 363
where E-exposure, S-susceptibility and R-resilience. 364
365
The indicators belonging to exposure and susceptibility increase the flood vulnerability index 366
therefore they are placed in the nominator; however the indicators belonging to resilience 367
decrease the FVI, this is why they are placed in the denominator (Quang et al, 2012). 368
369
The application of this formula for each component leads to four distinct FVI indices; 370
FVISocial, FVIEconomic, FVIEnvironmental and FVIphysical., which aggregates into: 371
Total FVI = 4
****
PhysicaltalEnvironmenEconomicSocial R
SE
R
SE
R
SE
R
SE
(3) 372
373
The exposure can be understood as the intangible and material goods that are present at the 374
location where floods can occur, such as: loss of photographs and negatives, loss of life, 375
delays in formal education (Penning-Rowsell et al., 2005). The susceptibility relates to 376
system characteristics, including the social context of flood damage formation (Begum et al., 377
2007) and can be i.e. poverty, people with special needs, education, level of trust. 378
Susceptibility is defined as the extent to which elements at risk (Messner & Meyer, 2006) 379
within the system are exposed, which influences the chance of being harmed at times of 380
hazardous floods. Resilience to flood damages can be considered only in places with past 381
events, since the main focus is on the experiences encountered during and after floods 382
(Cutter, 1996, Cutter et al., 2003, Pelling, 2003, Walker et al., 2004, Turner II et al., 2003). 383
Resilience describes the ability of a system to preserve its basic roles and structures in a time 384
of distress and disturbance. Indicators showing resilience are flood insurance, amount of 385
investment, dikes and levees, storage capacities, etc. 386
387
11
There are in total 29 indicators identified to contribute to Eq (3), each with their own unit of 388
measure. Some indicators are not always used while evaluating the FVI of a region. They are 389
evaluated in each case and the most representative are used for the FVI. A comprehensive 390
description of such indicators in case of floods in the Mekong delta can be found in Quang et 391
al (2012). 392
After identifying the indicators, in order to use them in Eq (3) they need to be normalised 393
using a predefined minimum and maximum. In general classical proportional normalization 394
is used, which keeps the relative ratios in the normalized values of the indicators as they were 395
before normalization. The indicators become dimensionless, but still keep their proportion. 396
397
The FVI of each of the social, economic, environmental and physical component is computed 398
using Eq. 1. The results of each FVI component (social, economic, environmental and 399
physical) are summed up in Eq. 3. 400
401
The FVI methodology does not require researchers to judge the relative importance of 402
different components, i.e. they do not need to develop arbitrary weights for the indicators. 403
The Equation 1 links the values of all indicators to flood vulnerability components and 404
factors (exposure, susceptibility and resilience), without weighting, as suggested by Cendrero 405
and Fisher in 1997. This is done because of different number of rating judgments which “lie 406
behind combined weights”, or interpolating. The same approach of assigning no weights was 407
used by Peduzzi et al., 2001, the Global Risk and Vulnerability Index –Trends per Year, 408
GRAVITY, by Briguglio, 2003 in the Economic Vulnerability Index and Rygel et al., 2006. 409
410
The main issue while computing the FVI is actually to determine these indicators. There are 411
different sources for determining the values of the indicators, and these are in general 412
statistical data stored by environmental agencies, water boards, UN overviews and annual 413
data from city halls. 414
415
4. Results obtained when applying the two approaches 416
4.1. Physically based modelling approach 417
The SOBEK simulation of the 1:200 year event results were water depths and inundation 418
extents, as can be seen in figure 3. The model is able to produce velocities of flow during an 419
inundation event as well; however these velocities were not considered in the estimation of 420
the damages and therefore not reported herein. 421
422
The maximum inundation extent was checked with an available satellite image on 13 423
November 2008. The obtained maximum inundation extent from the model was of 12.61km2, 424
which represents 97% of the inundation extent of the satellite image. Due to lack of data in 425
the area, it is considered that this is good for the calibration of the model. 426
427
In order to determine the impact of flood and to evaluate the damages water depths obtained 428
from the model were analysed. The obtained water depths were overall less than 2m (95% of 429
the inundated area), and only 5% bigger than 2m in the upstream of the river. The main water 430
depth is less than 0.5 m for 30% of the inundated area; 0.5m for 20% of the inundated area, 431
12
between 1m and 1.5m for 35% of the inundated area; and 1.5 -2m for 10% of the inundated 432
area. 433
434
435
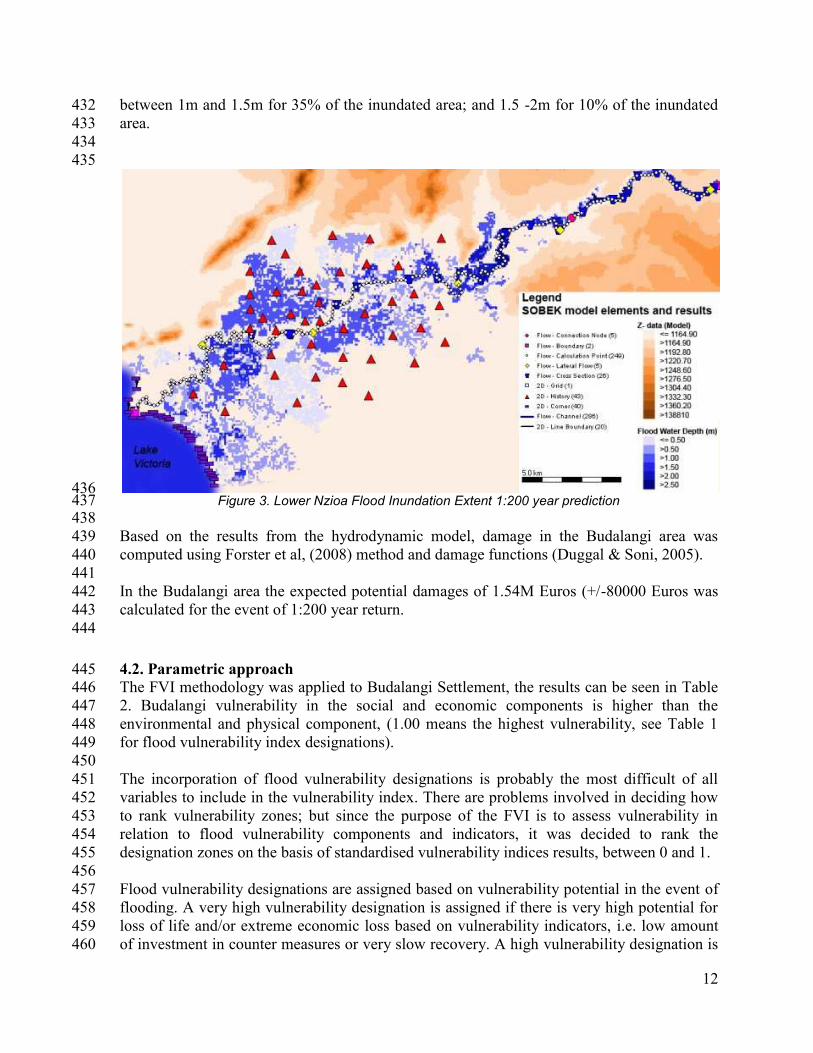
436 Figure 3. Lower Nzioa Flood Inundation Extent 1:200 year prediction 437
438
Based on the results from the hydrodynamic model, damage in the Budalangi area was 439
computed using Forster et al, (2008) method and damage functions (Duggal & Soni, 2005). 440
441
In the Budalangi area the expected potential damages of 1.54M Euros (+/-80000 Euros was 442
calculated for the event of 1:200 year return. 443
444
4.2. Parametric approach 445 The FVI methodology was applied to Budalangi Settlement, the results can be seen in Table 446
2. Budalangi vulnerability in the social and economic components is higher than the 447
environmental and physical component, (1.00 means the highest vulnerability, see Table 1 448
for flood vulnerability index designations). 449
450
The incorporation of flood vulnerability designations is probably the most difficult of all 451
variables to include in the vulnerability index. There are problems involved in deciding how 452
to rank vulnerability zones; but since the purpose of the FVI is to assess vulnerability in 453
relation to flood vulnerability components and indicators, it was decided to rank the 454
designation zones on the basis of standardised vulnerability indices results, between 0 and 1. 455
456
Flood vulnerability designations are assigned based on vulnerability potential in the event of 457
flooding. A very high vulnerability designation is assigned if there is very high potential for 458
loss of life and/or extreme economic loss based on vulnerability indicators, i.e. low amount 459
of investment in counter measures or very slow recovery. A high vulnerability designation is 460
13
assigned if there is a high potential for loss of life but still high economic loss. A medium 461
vulnerability designation is assigned if there is a medium potential for loss of life but an 462
appreciable economic loss, the area can recover in months and the amount of investment in 463
counter measures is enough to maintain the existing structural measures. A low flood 464
vulnerability designation is assigned if there is a small but still existing potential for loss of 465
life and the economic loss is minor. Lastly, a very low flood vulnerability designation is 466
assigned if there is a vanishingly small potential for loss of life and the economic loss can be 467
minor or even if flood insurances apply. 468
The data for the Budalangi area consulted to gather the indicators are: UNDP: United Nations 469
Development Programme (HDI, child mortality, inequality); INTUTE: a web-site which 470
provides social data for education and science research, (population density, unemployment, 471
disabled people); the World Fact-Book, a database developed by the CIA with basic 472
information on all the countries in the world (communication penetration rate, past 473
experience); UNEDRA: University Network for Disaster Risk Reduction in Africa; Nzoia 474
River Basin Management Initiative a public private partnership between Water Management 475
Resource Authority and Mumia Sugar, Pan Paper and Nzoia Sugar Company (land use, flood 476
insurance, shelters, closeness to river); DEFRA - Department for Environment, Food and 477
Rural Affairs economic and statistical database at no cost charge (urban growth, population 478
growth, amount of investment, dikes-levees, storage capacity); WKCDD & FMP, Western 479
Kenya Community Driven Development & Flood Mitigation Project (river discharge, 480
rainfall, evaporation); Western Water Board, Kenya (drainage, topography, industries, 481
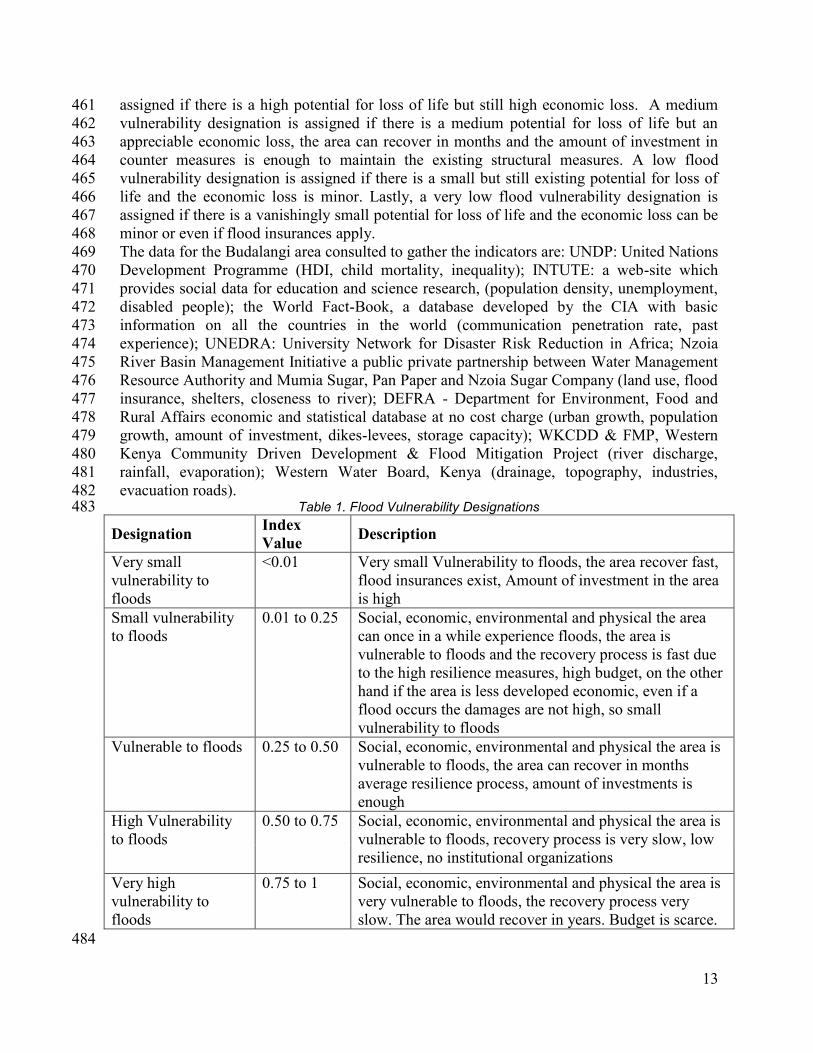
evacuation roads). 482 Table 1. Flood Vulnerability Designations 483
Designation Index
Value Description
Very small
vulnerability to
floods
<0.01 Very small Vulnerability to floods, the area recover fast,
flood insurances exist, Amount of investment in the area
is high
Small vulnerability
to floods
0.01 to 0.25 Social, economic, environmental and physical the area
can once in a while experience floods, the area is
vulnerable to floods and the recovery process is fast due
to the high resilience measures, high budget, on the other
hand if the area is less developed economic, even if a
flood occurs the damages are not high, so small
vulnerability to floods
Vulnerable to floods 0.25 to 0.50 Social, economic, environmental and physical the area is
vulnerable to floods, the area can recover in months
average resilience process, amount of investments is
enough
High Vulnerability
to floods
0.50 to 0.75 Social, economic, environmental and physical the area is
vulnerable to floods, recovery process is very slow, low
resilience, no institutional organizations
Very high
vulnerability to
floods
0.75 to 1 Social, economic, environmental and physical the area is
very vulnerable to floods, the recovery process very
slow. The area would recover in years. Budget is scarce.
484
14
485 486
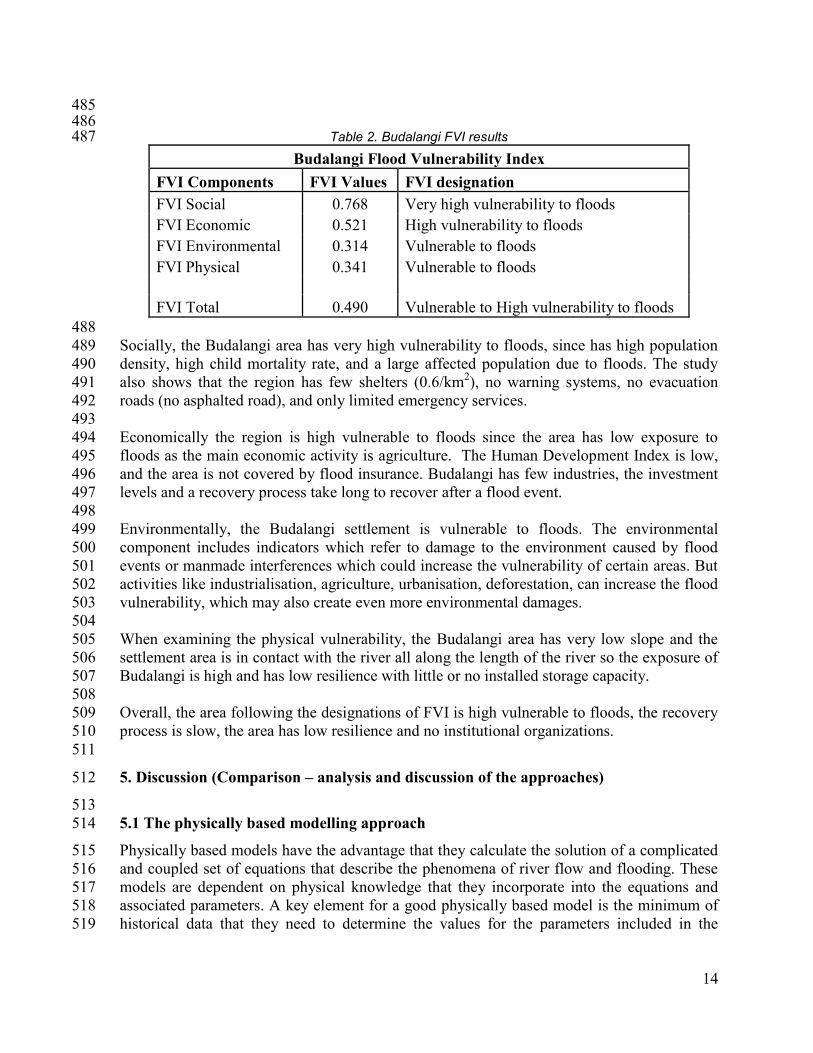
Table 2. Budalangi FVI results 487
Budalangi Flood Vulnerability Index
FVI Components FVI Values FVI designation
FVI Social 0.768 Very high vulnerability to floods
FVI Economic 0.521 High vulnerability to floods
FVI Environmental 0.314 Vulnerable to floods
FVI Physical 0.341 Vulnerable to floods
FVI Total 0.490 Vulnerable to High vulnerability to floods
488
Socially, the Budalangi area has very high vulnerability to floods, since has high population 489
density, high child mortality rate, and a large affected population due to floods. The study 490
also shows that the region has few shelters (0.6/km2), no warning systems, no evacuation 491
roads (no asphalted road), and only limited emergency services. 492
493
Economically the region is high vulnerable to floods since the area has low exposure to 494
floods as the main economic activity is agriculture. The Human Development Index is low, 495
and the area is not covered by flood insurance. Budalangi has few industries, the investment 496
levels and a recovery process take long to recover after a flood event. 497
498
Environmentally, the Budalangi settlement is vulnerable to floods. The environmental 499
component includes indicators which refer to damage to the environment caused by flood 500
events or manmade interferences which could increase the vulnerability of certain areas. But 501
activities like industrialisation, agriculture, urbanisation, deforestation, can increase the flood 502
vulnerability, which may also create even more environmental damages. 503
504
When examining the physical vulnerability, the Budalangi area has very low slope and the 505
settlement area is in contact with the river all along the length of the river so the exposure of 506
Budalangi is high and has low resilience with little or no installed storage capacity. 507
508
Overall, the area following the designations of FVI is high vulnerable to floods, the recovery 509
process is slow, the area has low resilience and no institutional organizations. 510
511
5. Discussion (Comparison – analysis and discussion of the approaches) 512
513
5.1 The physically based modelling approach 514
Physically based models have the advantage that they calculate the solution of a complicated 515
and coupled set of equations that describe the phenomena of river flow and flooding. These 516
models are dependent on physical knowledge that they incorporate into the equations and 517
associated parameters. A key element for a good physically based model is the minimum of 518
historical data that they need to determine the values for the parameters included in the 519
15
physically based equations. Often, historical data is not available, in particular in areas of 520
weak infrastructure, and this would make physically based models unusable in certain areas. 521
522
The advantage in using physically based models is their high capability for prognosis and 523
forecasting, and their disadvantage is the high input data demand. In the past computational 524
demand was a big disadvantage, but nowadays with the development of cloud and cluster 525
computing capabilities over the internet, this disadvantage is reduced. However this is only 526
true in case of larger, better-funded organisations that have good computer power to create 527
cluster of computers, and not yet true for small consultancy companies or water boards who 528
cannot dedicate cluster of computers for a specific modelling task. Due to the high 529
computation resources demands, in case of 2D and 3D models, the calibration of physically 530
or semi-physically based models can still be a tremendous effort. 531
532
In the present study the data on flooding was scarce, however the 2D physically based model 533
was able to predict well the extent of flood, which shows that even in an ungauged catchment 534
if the model is properly build, confidence in the construction of such a model does not 535
require calibration (Cunge et al, 1980) and the results are good for design. A model based on 536
the physics of the phenomena can be used to produce synthetic data to be used with a simple 537
forecasting model (Van Steenbergen et al., 2012). 538
One of the important tasks of the decision makers in flood situations is not only to take 539
management decision but also to properly disseminate knowledge to involved stakeholders, 540
including the general public. The objectives of knowledge dissemination is to offer simple 541
and clear information, which can prepare the public for the future and also can actively 542
involve the stakeholders in flood management planning. The information should be 543
delivered in relevant spatial and temporal scales. A physically based model has the advantage 544
that can offer all types of information on a very fine spatial resolution, at a level of a street, 545
or a house, in a familiar and easily recognisable user interface. It is very important that the 546
decision makers use thoroughly verified results, rather than results characterised by 547
uncertainties, because the stakeholders and the public are taking often quick evacuation 548
measures based on such information. 549
550
5.2 The parametric approach 551
The FVI approach regarding the information on the mechanism and cause of flooding has 552
some limitations, what is given from this approach are the indicators values for river 553
discharge, topography, closeness to the river, the amount of rainfall, dikes and levees. 554
Considering these indicators the FVI approach can only evaluate the flood vulnerability, 555
cannot tell the extent of flooding nor the expected inundation area through the physical and 556
environmental component. The application of this approach takes less preparation time than 557
physically-based model construction, calibration and simulation. 558
559
The FVI approach regarding the information on the health and safety implications to the 560
affected population is well designed; the approach shows through the social vulnerability 561
indicators the exact population exposed to floods, the ones which are susceptible (youngest 562
and eldest), if these people are aware and prepare, if they have and know how to interpret a 563
warning system, which of the roads can act as an evacuation road. The social flood 564

16
vulnerability index expresses whether the population of that specific area has experienced 565
floods, the number of people working in the emergency service and the number and locations 566
of shelters in the area. The social FVI provides a greater understanding of how people might 567
be affected, which can feed into emergency services and evacuation strategy development. 568
569
The FVI approach regarding the information on the economic damages and losses to the 570
affected areas gives basic damage estimation. The economic component is related to income 571
or issues which are inherent to economics that are predisposed to be affected (Gallopin 572
2006). 573
574
Many economic activities can be affected by flooding events, among them are agriculture, 575
fisheries, navigation, power production, industries, etc. The loss of these activities can 576
influence the economic prosperity of a community, region or a country. The FVI can assess 577
the economic vulnerability using a single number, though this number cannot evaluate the 578
exact damage and losses but instead the index shows the number of industries in the area and 579
their closeness to the river and also the amount of investment in counter measures and the 580
number of flood insurances in that specific area. 581
582
How easily the information of the FVI approach is communicated? 583
584
From experts undertaking the study to the decision makers it can be said that the use of the 585
FVI approach improves the decision-making process by identifying the vulnerability of flood 586
prone areas. The FVI approach will direct decision-makers to a simplified usage and simpler 587
understanding of the vulnerability; the FVI approach can be seen as a tool for decision 588
making to direct investments to the most appropriate sectors and also to help in the decision-589
making process relating to flood defence, policies, measures and activities. The FVI 590
approach allows, irrespective of uncertainties, relative comparisons to be made between case 591
studies. While a level of uncertainty is inherent in FVI, the use of it in operational flood 592
management is highly relevant for policy and decision makers in terms of starting adaptation 593
plans. It offers a more transparent means of establishing such priorities, which inevitably are 594
considered as highly political decisions. It may also be considered as a means to steer flood 595
management policy in a more sustainable direction. However, as individual information is 596
lost in the aggregation process, it needs to be retrieved by a more in-depth analysis of each 597
process in order to design policies and their implementation. 598
599
From decision maker to the public: 600
Hence it is useful to have an easy-to-apply and communicating instrument that can help give 601
an overview of the main points by having one single and comparable number, the FVI. The 602
FVI is necessary, but not sufficient, for decision making and therefore should be used in 603
combination with other decision-making tools. This should specifically include participatory 604
methods with the population of areas identified as vulnerable and should also include a team 605
of multidisciplinary thematic specialists and knowledgeable societal representatives and 606
those with expert judgments. 607
608
17
6. Conclusions 609
The two approaches, modelling and parametric, have been applied to a data-scarce area - the 610
Budalangi settlement. Examining the approaches in the context of this study leads to the 611
following conclusions: 612
1. FVI does not assess flood risk directly, but does contribute to assessing flood risk. 613
Vulnerability takes a step further and covers other aspects, such as: social aspects, 614
environmental damage and infrastructure resilience. 615
2. The deterministic approach has a better science base, but limited evaluation of 616
vulnerability; 617
3. FVI gives a wider evaluation, but is less rigorous. Therefore FVI is useful in a larger-618
scale vulnerability assessment, but a deterministic approach is better for more focused 619
studies. In fact FVI could be used to decide where a deterministic model is 620
necessary. 621
The Flood Vulnerability Index as analysed in the research provides a quick, reliable 622
evaluation of flood vulnerability and in fact is the only method for assessing the vulnerability 623
to flooding of a particular geographical area. The fact that indicators are used, allows for 624
comparison of flood vulnerability in different areas as well as the identification of which 625
indicators can determine the relative level of flood vulnerability. FVI can measure trends in 626
the changing natural and human environments, helping identify and monitor priorities for 627
action. These features, alongside the ability to identify the root causes of increased 628
vulnerability, provide key information at a strategic level for flood risk planning and 629
management. However the results would provide neither sufficient information nor the 630
required level of detail for input into engineering designs or project level decisions. 631
632
FVI can provide an insight into the most vulnerable locations. It can analyse the complex 633
interrelation among a number of varied indicators and their combined effect in reducing or 634
increasing flood vulnerability in a specified location. It is very useful when there is a large 635
level of uncertainty and decision makers are faced with a wide array of possible actions that 636
could be taken in different scenarios, in this case the FVI can present readily understood and 637
readily communicated results that can decision-makers in identifying the most effective 638
measures to be taken. In this way the proposed measures can be prioritised for areas that are 639
at greatest risk. Uncertainty is not removed, but is integrated into the assessment. On the 640
other hand this complexity is also a negative point, since it takes a long time and good 641
knowledge of the area and the system behind the FVI to be able to implement it. 642
643
As all with models, this FVI model is a simplification of reality and its application should be 644
compensated for with thorough knowledge and expert-based analysis. The difficulties that 645
the quantification of social indicators poses to the calculation may constitute a considerable 646
weakness of the model. The FVI is a useful tool to identify the most vulnerable elements of 647
the water resource system and safety chain components (Pro-action, prevention, preparation, 648
response and recovery). 649
650
Obviously such a parametric model is limited by the accuracy and availability of good 651
datasets. A number of the indicators are very hard to quantify especially when it comes to 652
the social indicators. On the other hand, such a model can give a simplified way of 653
characterising what in reality is a very complex system. Such results will help to give an 654
18
indication of whether a system is resilient, susceptible or exposed to flooding risks and help 655
identify which measures would reap the best return on investment under a changing climate 656
and population and development expansion. The important point is that such a model is used 657
as one tool among others within the whole process of deciding on a roadmap for flood 658
assessment. 659
660
661
662
663
19
References 664 665
Adger, W.N., 2006. “Vulnerability”, Global Environmental Change, 16, 268-281. 666
Alexander, D., 1993. Natural disasters, New York, Chapman & Hall 667
Balica, S.F., Douben, N., Wright, N.G., 2009. Flood Vulnerability Indices at Varying Spatial 668
Scales, Water Science and Technology Journal, 60 (10), 2571-2580 669
Balica, S.F., Wright N.G., 2010. Reducing the complexity of Flood Vulnerability Index, 670
Environmental Hazard Journal, 9 (4), 321 - 339. 671
Barredo, J.I., de Roo, A., Lavalle, C., 2007. Flood risk mapping at European scale. Water 672
Science and Technology, 56 (4), 11-17 673
Begum, S., Stive, M. J. F. and Hall, J.W., 2007. Flood Risk Management in Europe: 674
Innovation in Policy and Practice. Springer, London, 237. 675
Blaikie P., Cannon T., Davis I., and Wisner B., 1994. At risk – natural hazards, people´s 676
vulnerability and disasters. London: Routledge 677
Bosher, L., Dainty, A., Carrillo, P. and Glass, J., 2007. Built-in resilience to disasters: a pre-678
emptive approach, Engineering, Construction and Architectural Management, 14 (5), 679
434-46. 680
Briguglio, L., 2003. Methodological and Practical Considerations for Constructing Socio 681
Economic Indicators to Evaluate Disaster Risk. Institute of Environmental Studies, 682
University of Colombia, Manizales, Colombia, Programme on Information and 683
Indicators for Risk Management, IADB-ECLAC-IDEA. 684
Cendrero A., Fischer D.W., 1997. A procedure for assessing the environmental quality of 685
coastal areas for planning and management. J Coast Res 13:732–744 686
Connor, R. F. and Hiroki, K., 2005. Development of a method for assessing flood 687
vulnerability. Water Science and Technology, 51(5). 61–67. 688
CRED CRUNCH, 2012. Disaster data. A balanced perspective, issue 27, February 2012, 689
Centre for Research on the Epidemiology and Disasters, Universite Catholique de 690
Louvain as seen on 8th March 2012 on 691
http://www.cred.be/sites/default/files/CredCrunch27.pdf 692
Cutter S.L., 1996. Vulnerability to environmental hazards; Progress in Human Geography 693
20(4) 529-539. 694
Cutter S.L., Boruff B.J., Shirley W.L., 2003. Social vulnerability to environmental hazards. 695
Soc Sci Q 84(2):242–261 696
Dinh, Q., Balica, S., Popescu, I., Jonoski, A., 2012. Climate change impact on flood hazard, 697
vulnerability and risk of the Long Xuyen Quadrangle in the Mekong Delta, 698
International Journal of River Basin Management, 10:1, 103-120 699
Duggal, K.N., Soni, J.P., 2005. Elements of water resources engineering, New age 700
international Publishers, New Delhi, 413 701
Dutta, D., Srikantha, H., Katumi, M., 2003. A mathematical model for flood loss estimation, 702
J. Hydrol., 277, 24–49. 703
European Floods Directive, L 288/27, Official Journal of the European Union, Brussels, 2007 704
Forster, S., Khuhlmann, B., Lindenschmidt, K. E., Bronstert, A., 2008. Assessing flood risk 705
for rural detention area. Natural Hazards and Earth System Sciences, 8, 311-322 706
Gabor, T., Griffith, T.K., 1980. The assessment of community vulnerability to acute 707
hazardous materials incidents, Journal of Hazardous Materials, 8, 323-22 708
20
Gichamo Z., G., Popescu, I., Jonoski, A., Solomatine D.P., 2012. River Cross Section 709
Extraction from ASTER Global DEM for Flood Modeling, Journal of Environmental 710
Modelling & Software, 31(5), 37-46 711
712
Githui F., Gitau W., Mutuab F., Bauwensa W., 2008. Climate change impact on SWAT 713
simulated streamflow in western Kenya. International Journal of Climatology 29, 1823 - 714
1834 715
Glynn, P.W., Heidelberger, P., Nicola, V. and Shahabuddin, P., 1993. Efficient Estimation of 716
the Mean Time Between Failures in Non-regenerative Dependability Models Proceedings 717
of the 1993 Winter Simulation Conference, 311-316 718
Hansson, K., Danielson, M., Ekenberg, L., 2008. A framework for evaluation of flood 719
management strategies, Journal of Environmental Management 86, (3), 465–480 720
Hartanto, I.M., Beevers, L., Popescu, I., Wright, N.G., 2011. Application of a coastal 721
modelling code in fluvial environments, J. of Environmental Modelling and Software, 722
26 (12),1685-1695 723
IPCC, 2001. Climate change 2001: The scientific basis. Cambridge, Cambridge University 724
Press 725
ISDR, 2004. International Strategy for Disaster Reduction. Living with floods: UN 726
guidelines offer decision makers hope to reduce flood losses. Available from: http:// 727
www.unisdr.org/archive/5353 on 5th Apr 2011 728
Jonkman, S.N., Vrijling, J.K., 2008. Loss of life due to floods. Journal of Flood Risk 729
Management, 1. 43–56 730
Junqiang Xia, Roger A. Falconer, Binliang Lin, Guangming Tan, 2011. Numerical 731
assessment of flood hazard risk to people and vehicles in flash floods Environmental 732
Modelling & Software, 26 (8), 987-998 733
Klein, R.J.T., R.J. Nicholls, and N. Mimura 1999. Coastal adaptation to climate change: Can 734
the IPCC Technical Guidelines be applied? Mitigation and Adaptation Strategies for 735
Global Change, 4, 51-64. 736
Knight, F. H.,1921. Risk, Uncertainty, and Profit. Boston, MA: Hart, Schaffner & Marx; Hou737
ghton Mifflin Company, 1921. [Online] available: http://www.econlib.org/library/Kni738
ght/knRUP1.html, as seen on 14th
of December 2011 739
Lewis, J., 1999. Development in Disaster-prone Places, Intermediate Technology 740
Publications, London. 741
Little, R. J. A. and Rubin, D. B., 1983. On Jointly Estimating Parameters and Missing Data 742
by Maximizing the Complete-Data Likelihood, The American Statistician, 37, 3 743
(Aug., 1983), 218-220, Published by: American Statistical Association 744
Little, R.J.A. and Rubin, D.B., 1987. Statistical Analysis with Missing Data, J. Wiley & 745
Sons, New York. 746
McCarthy, M. A., Possingham, H. P., Day, J., & Tyre, A. J. 2001. Testing the accuracy of 747
population viability analysis. Conservation Biology, 15(4), 1030-1038. 748
Merz, B., Thieken, A.H. and Gocht, M. 2007. Flood risk mapping at the local scale: Concepts 749
and challenges. In: Begum, S., Stive, M.J.F. and Hall, J.W. (Eds.) Flood risk 750
management in Europe, 25. Advances in natural and technological hazards research. 751
Springer Netherlands, 231-251. 752
21
Messner, F. &Meyer, V. 2006. Flood damages, vulnerability and risk perception—challenges 753
for flood damage research. In: Schanze, J., Zeman, E., Marsalek, J., (eds) Flood Risk 754
Management: Hazards, Vulnerability and Mitigation Measures. Springer. 149–167. 755
Newey. W.K., 1990. Semiparametric efficiency bounds, Journal of Applied Econometrics, 5, 756
99-135 757
NRBMI (nd) Nzoia river basin management initiative, a public private partnership between 758
water resources management authority and Mumimas Sugar Company Limited / 759
Nzoia Sugar Company Limited / PAN PAPER / Civil society, learning institutions 760
and communities. http://www.unep.org/Training/downloads/PDFs/NRBMI_ 761
small.pdf. Cited December 2009, van Hoey 2008 762
Peduzzi, P., Dao, H., Herold, C., Rochette, D. and Sanahuja, H., 2001. Feasibility Study 763
Report – on Global Risk and Vulnerability Index –Trends per Year (GRAVITY). 764
United Nations Development Programme Emergency Response Division 765
UNDP/ERD, Geneva. 766
Pelling, M., 2003. The vulnerability of cities; Natural disaster and social resilience, Earth 767
scan Publications, UK & USA 768
Penning-Rowsell E.C., Chatterton J.B., 1977. The benefits of flood alleviations: a manual of 769
assessment techniques (The blue manual) Aldershot, UK Gower Technical Press 770
Penning-Rowsell, E., Floyd, P., Ramsbottom, D., Surendran, S., 2005. Estimating injury and 771
loss of life in floods: A deterministic framework, Natural Hazards 36, 43-64 772
Plate Erich J., 2002. Flood risk and flood management, Journal of Hydrology 267 2-11 773
Pratt, C., Kaly, U. and Mitchell, J., 2004. How to Use the Environmental Vulnerability Index, 774
UNEP/SOPAC South Pacific Applied Geo-science Commission. Technical Report 775
383. www.vulnerabilityindex.net/Files/ EVI%20Manual.pdf (accessed 17 November 776
2011). 777
Rygel, L., O’sullivan, D., Yarnal, B., 2006. A method for constructing a social vulnerability 778
index: an application to hurricane storm surges in a developed country, Mitigation 779
and Adaptation Strategies for Global Change (2006) 11: 741–764 780
Sayers P., Hall J., Dawson R., Rosu C., Chatterton J., Deakin R., Risk assessment of flood 781
and coastal defenses for strategic planning (rasp) – a high level methodology. 782
Wallingford, as seen on 783
http://www.raspproject.net/RASP_defra2002_Paper_Final.pdf, on 29th of September, 784
2011 785
Schanze, J., 2006. Flood risk management – a basic framework, Flood Risk Management: 786
Hazards, Vulnerability and Mitigation Measures NATO Science Series: IV: Earth and 787
Environmental Sciences, 2006, 67, Part 1, 1-20 788
Scottish Government 2009. Flood Risk Management (Scotland) Act 2009 [online] 789
http://www.legislation.gov.uk/asp/2009/6/pdfs/asp_20090006_en.pdf (Accessed on 790
04/03/12) 791
Serrat, C., Gomez, G., 2001. Estimating the stratified survival with missing covariates: I A 792
semiparametric approach. Chapter 4, page 69. DR 2001/12. Departament d'Estadística 793
i Investigació Operativa. UPC 794
Slovic, P., 1987. Perception of risk. Science, 236: 280–285. 795
Smith K., 2004. Environmental hazards: assessing risk and reducing disaster. Routledge, 796
London 797
22
Sullivan, C.A, Meigh, J., 2003. Using the Climate Vulnerability Index to assess vulnerability 798
to climate variations, Water Policy and Management, CEH Wallingford as seen on: 799
http://www.ceh.ac.uk/sections/ph/ClimateVulnerabilityIndex.html on 12th of 800
December, 2011 801
Turner BL, Kasperson RE, Matson PA, McCarthy JJ, Corell RW, Christensen L, Eckley N, 802
Kasperson JX, Luers A, Martello ML, Polsky C, Pulsipher A, Schiller A 2003. A 803
framework for vulnerability analysis in sustainability science. Proc National Acad Sci 804
USA 100(14) 8074–8079 805
UNEP, 2004. Manual: How to Use the Environmental Vulnerability Index (EVI), as see on 806
http://www.vulnerabilityindex.net/EVI_Calculator.htm , on 27th of September 2010 807
United Nations, 1982. Proceedings of the seminars on flood vulnerability analysis and on the 808
principles of floodplain management for flood loss prevention, September, Bangkok 809
van der Veen, A. & Logtmeijer, C. 2005. Economic hotspots: visualizing vulnerability to 810
flooding. Nat. Hazards 36(1–2), 65–80. 811
Van Steenbergen, N., Ronsyn, J., Willems, P., 2012. A non-parametric data-based approach 812
for probabilistic flood forecasting in support of uncertainty communication 813
Environmental Modelling & Software, 33, 92-105 814
Verwey, A., 2006. Computation Hydraulics, WL Delft Hydraulics, version 2006 – 1, 815
UNESCO-IHE Lecture Notes 816
Walker, B., C. S. Holling, S. R. Carpenter, and A. Kinzig 2004. Resilience, adaptability and 817
transformability in social–ecological systems. Ecology and Society 9(2): 5. [online] 818
URL: http://www.ecologyandsociety.org/vol9/iss2/art5/ 819
White, G.F., 1945. Human Adjustments to Floods: A Geographical Approach to the Flood 820
Problem in the United States Doctoral Dissertation and Research paper no. 29. 821
Department of Geography, University of Chicago. 822
WMO/MWRMD/APFM, 2004. Strategy for Flood Management for Lake Vitoria Basin, 823
Kenya, Associate programme on flood Management, 824
http://www.apfm.info/pdf/strategy_kenya_e.pdf 825
826