Embed Size (px)
Citation preview
Cryst. Res. Technol. 40, No. 7, 684 – 687 (2005) / DOI 10.1002/crat.200410408
© 2005 WILEY-VCH Verlag GmbH & Co. KGaA, Weinheim
Double-frequency properties of In:LiNbO3 crystals
Rui Wang1, Biao Wang*2
, Yulan Liu2, and Liangsheng Shi
3
1 Department of Applied Chemistry and Electro-Optics Technology Center, Harbin Institute of Technology,
Harbin 150001, P.R. China 2 the State Key Lab of Optoelectronic Materials and Technologies, School of Physics and Technology, Sun
Yat-sen University, Guangzhou 510275, China 3 Harbin University of Science and Technology, Harbin, China
Received 24 May 2004, revised 21 August 2004, accepted 16 September 2004
Published online 1 May 2005
Key words In:LiNbO3 crystals, second harmonic generation, dark trace.
PACS 81.10.Dn, 42.65.Ky, 42.70.Mp
1 mol%, 2 mol%, 3 mol%, 4 mol% and 5 mol% In3+ doped LiNbO3 crystals were grown by the Czochralski
method, respectively. Oxidized treatment of some crystals was carried out. The infrared transmission spectra
and photo-damage resistance of the samples were measured. The results showed that the OH- absorption
peaks of In(3mol%):LiNbO3, In(4mol%):LiNbO3 and In(5mol%):LiNbO3 crystals were located at about 3508
cm-1, while those of In(1mol%):LiNbO3 and In(2mol%):LiNbO3 crystals were located at about 3484cm-1.
When the doped In3+ concentration reached its threshold in LiNbO3 crystal, photo-damage resistance of
In:LiNbO3 crystals was two orders of magnitude higher than that of pure LiNbO3 crystal. The experimental
results of the second harmonic generation (SHG) showed that the phase matching temperatures of In:LiNbO3
crystals were lower than those of Zn:LiNbO3 and Mg:LiNbO3 crystals and the SHG efficiency reached 38%.
Oxidization treatment was also found to make the dark trace resistance of crystals increase.
© 2005 WILEY-VCH Verlag GmbH & Co. KGaA, Weinheim
1 Introduction
Lithium Niobate (LiNbO3) single crystal has excellent nonlinear optical properties, but its optical damage
resistance is low [1, 2]. To improve the properties, different photo-damage-resistant impurities, i.e. Mg2+, Zn2+
or In3+ ions, were doped in LiNbO3 crystals. A small quantity of In3+ can significantly improve the photo-
damage resistance of Lithium Niobate, whereas by doping Zn2+ or Mg2+ to improve its photo-damage
resistance, much larger quantity of Zn2+ or Mg2+ was needed. When the doped In3+ reaches its threshold
concentration, the photo-damage resistance of In:LiNbO3 crystal is two orders of magnitude higher than that of
undoped LiNbO3 crystal, meanwhile the absorption peak of the infrared spectra shifts to 3484 cm-1 , for
undoped LiNbO3 crystals, it is at 3508 cm-1 [3,4]. And the phase matching temperature is also lower than those
of Zn:LiNbO3 and Mg:LiNbO3 crystals [5, 6]. In this paper, we present the experimental results on LiNbO3
crystals with different concentrations of In ions. Their photo-damage resistance and SHG were measured, and
the creating mechanism of dark trace was discussed.
2 Experiments
2.1 Crystals growth and sample preparation
In (1mol%):LiNbO3 (1#), In (2mol%):LiNbO3(2#), In: (3mol%):LiNbO3(3#), In (4mol%):LiNbO3(4#) and In
(5mol%):LiNbO3(5#) crystals were grown along the c-axis by the Czochralski technique using an intermediate-
frequency heating furnace. The melt composition was Li/Nb=48.6/51.4. The concentration of In2O3 was 0.5, 1,
1.5, 2 and 2.5 mol% in the melts, respectively. The pulling rate of crystals was 1-2 mm/h and the rotation rate
was about 20 rpm. The grown crystals were all about φ30mm×30mm. After growth, the crystals were annealed ____________________
* Corresponding author: e-mail: [email protected]
Cryst. Res. Technol. 40, No. 7 (2005) / www.crt-journal.org 685
© 2005 WILEY-VCH Verlag GmbH & Co. KGaA, Weinheim
to room temperature at a rate of 80K/h. The crystals were poled at 1200°C, and the poling current was 5
mA/cm2. Then the crystals were cut into plates with 8×8×3(a×c×b) mm3 perpendicular to y-axis of the crystals
and polished on both sides using SiC powders and diamond paste. Some plates were oxidized at 1100°C for
10 h.
2.2 Infrared transmission spectra
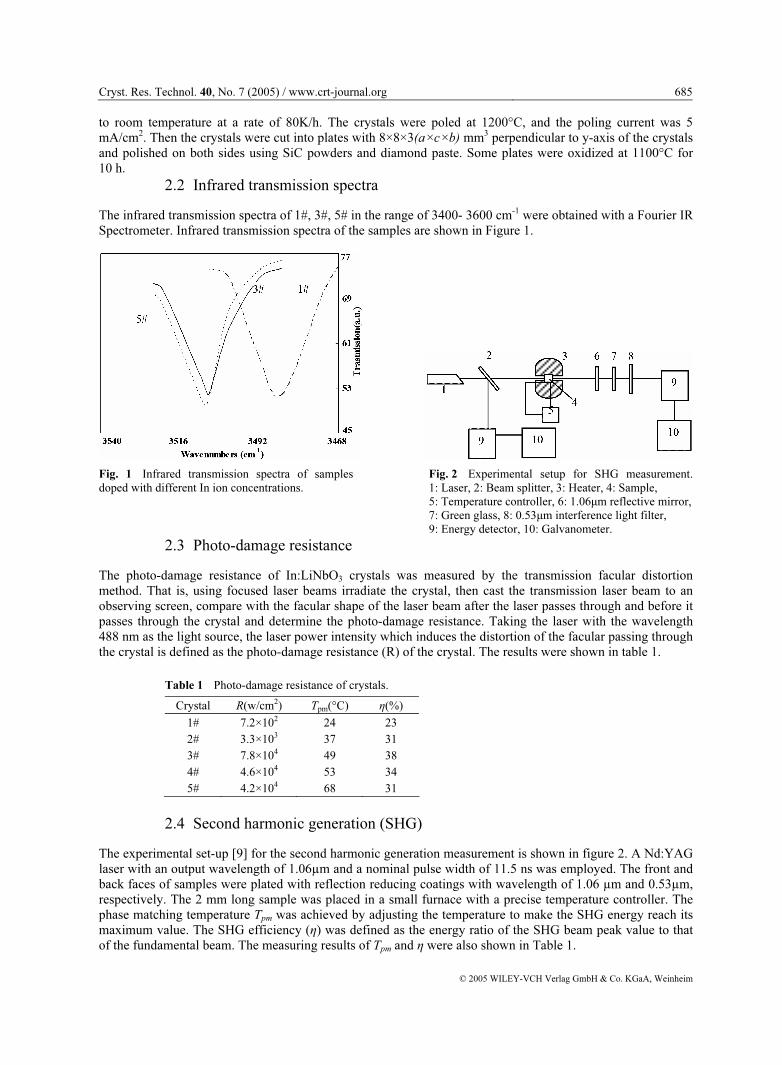
The infrared transmission spectra of 1#, 3#, 5# in the range of 3400- 3600 cm-1 were obtained with a Fourier IR
Spectrometer. Infrared transmission spectra of the samples are shown in Figure 1.
Fig. 1 Infrared transmission spectra of samples
doped with different In ion concentrations.
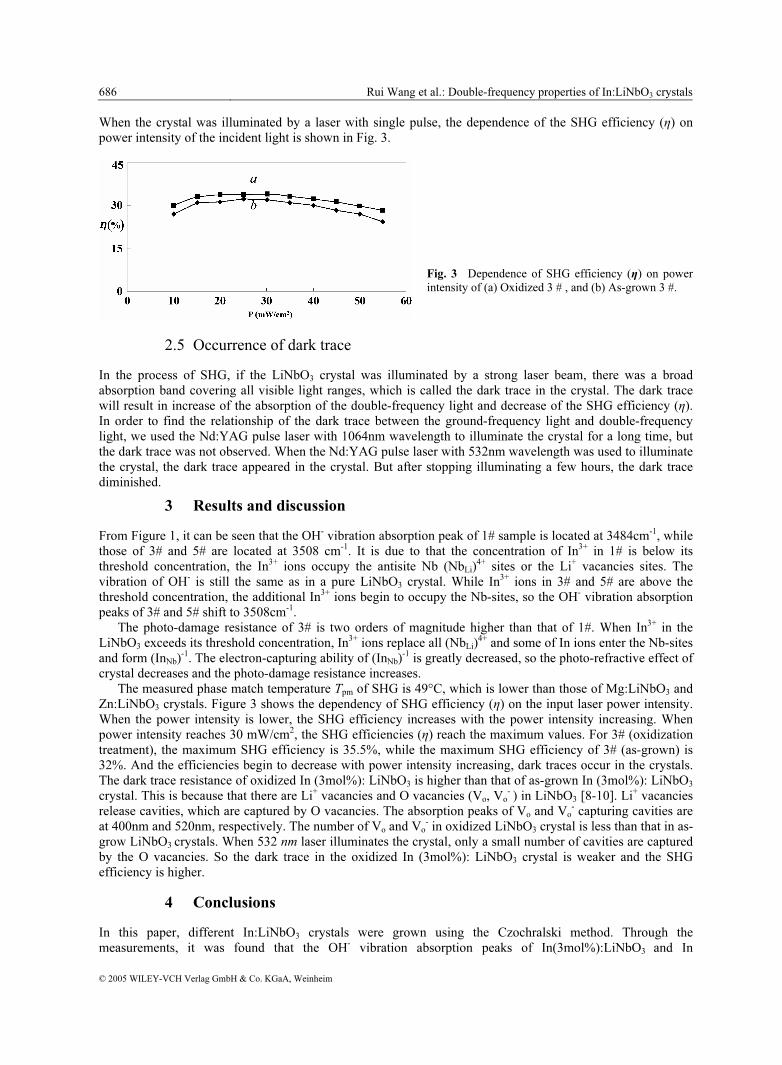
Fig. 2 Experimental setup for SHG measurement.
1: Laser, 2: Beam splitter, 3: Heater, 4: Sample,
5: Temperature controller, 6: 1.06µm reflective mirror,
7: Green glass, 8: 0.53µm interference light filter,
9: Energy detector, 10: Galvanometer.
2.3 Photo-damage resistance
The photo-damage resistance of In:LiNbO3 crystals was measured by the transmission facular distortion
method. That is, using focused laser beams irradiate the crystal, then cast the transmission laser beam to an
observing screen, compare with the facular shape of the laser beam after the laser passes through and before it
passes through the crystal and determine the photo-damage resistance. Taking the laser with the wavelength
488 nm as the light source, the laser power intensity which induces the distortion of the facular passing through
the crystal is defined as the photo-damage resistance (R) of the crystal. The results were shown in table 1.
Table 1 Photo-damage resistance of crystals.
Crystal R(w/cm2) Tpm(°C) η(%)
1# 7.2×10² 24 23
2# 3.3×10³ 37 31
3# 7.8×10⁴ 49 38
4# 4.6×10⁴ 53 34
5# 4.2×10⁴ 68 31
2.4 Second harmonic generation (SHG)
The experimental set-up [9] for the second harmonic generation measurement is shown in figure 2. A Nd:YAG
laser with an output wavelength of 1.06µm and a nominal pulse width of 11.5 ns was employed. The front and
back faces of samples were plated with reflection reducing coatings with wavelength of 1.06 µm and 0.53µm,
respectively. The 2 mm long sample was placed in a small furnace with a precise temperature controller. The
phase matching temperature Tpm was achieved by adjusting the temperature to make the SHG energy reach its
maximum value. The SHG efficiency (η) was defined as the energy ratio of the SHG beam peak value to that
of the fundamental beam. The measuring results of Tpm and η were also shown in Table 1.
686 Rui Wang et al.: Double-frequency properties of In:LiNbO3 crystals
© 2005 WILEY-VCH Verlag GmbH & Co. KGaA, Weinheim
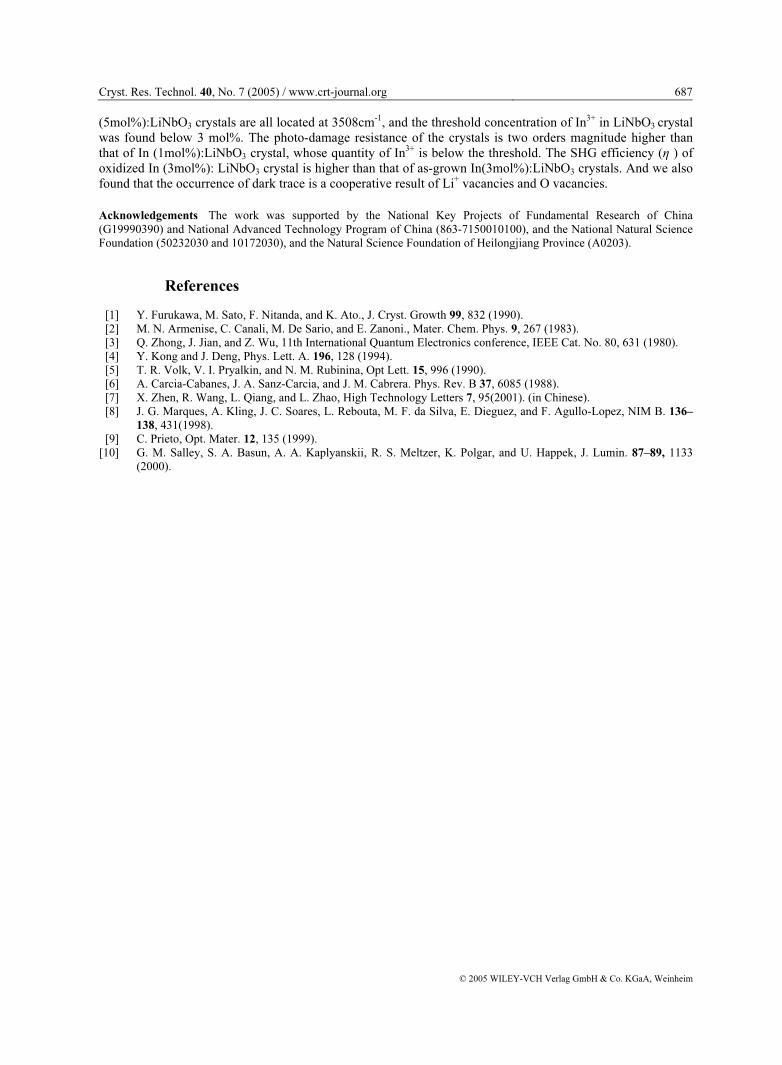
When the crystal was illuminated by a laser with single pulse, the dependence of the SHG efficiency (η) on
power intensity of the incident light is shown in Fig. 3.
Fig. 3 Dependence of SHG efficiency (η) on power
intensity of (a) Oxidized 3 # , and (b) As-grown 3 #.
2.5 Occurrence of dark trace
In the process of SHG, if the LiNbO3 crystal was illuminated by a strong laser beam, there was a broad
absorption band covering all visible light ranges, which is called the dark trace in the crystal. The dark trace
will result in increase of the absorption of the double-frequency light and decrease of the SHG efficiency (η).
In order to find the relationship of the dark trace between the ground-frequency light and double-frequency
light, we used the Nd:YAG pulse laser with 1064nm wavelength to illuminate the crystal for a long time, but
the dark trace was not observed. When the Nd:YAG pulse laser with 532nm wavelength was used to illuminate
the crystal, the dark trace appeared in the crystal. But after stopping illuminating a few hours, the dark trace
diminished.
3 Results and discussion
From Figure 1, it can be seen that the OH- vibration absorption peak of 1# sample is located at 3484cm-1, while
those of 3# and 5# are located at 3508 cm-1. It is due to that the concentration of In3+ in 1# is below its
threshold concentration, the In3+ ions occupy the antisite Nb (NbLi)4+ sites or the Li+ vacancies sites. The
vibration of OH- is still the same as in a pure LiNbO3 crystal. While In3+ ions in 3# and 5# are above the
threshold concentration, the additional In3+ ions begin to occupy the Nb-sites, so the OH- vibration absorption
peaks of 3# and 5# shift to 3508cm-1.
The photo-damage resistance of 3# is two orders of magnitude higher than that of 1#. When In3+ in the
LiNbO3 exceeds its threshold concentration, In3+ ions replace all (NbLi)4+ and some of In ions enter the Nb-sites
and form (InNb)-1. The electron-capturing ability of (InNb)
-1 is greatly decreased, so the photo-refractive effect of
crystal decreases and the photo-damage resistance increases.
The measured phase match temperature Tpm of SHG is 49°C, which is lower than those of Mg:LiNbO3 and
Zn:LiNbO3 crystals. Figure 3 shows the dependency of SHG efficiency (η) on the input laser power intensity.
When the power intensity is lower, the SHG efficiency increases with the power intensity increasing. When
power intensity reaches 30 mW/cm2, the SHG efficiencies (η) reach the maximum values. For 3# (oxidization
treatment), the maximum SHG efficiency is 35.5%, while the maximum SHG efficiency of 3# (as-grown) is
32%. And the efficiencies begin to decrease with power intensity increasing, dark traces occur in the crystals.
The dark trace resistance of oxidized In (3mol%): LiNbO3 is higher than that of as-grown In (3mol%): LiNbO3
crystal. This is because that there are Li+ vacancies and O vacancies (Vo, Vo- ) in LiNbO3 [8-10]. Li+ vacancies
release cavities, which are captured by O vacancies. The absorption peaks of Vo and Vo- capturing cavities are
at 400nm and 520nm, respectively. The number of Vo and Vo- in oxidized LiNbO3 crystal is less than that in as-
grow LiNbO3 crystals. When 532 nm laser illuminates the crystal, only a small number of cavities are captured
by the O vacancies. So the dark trace in the oxidized In (3mol%): LiNbO3 crystal is weaker and the SHG
efficiency is higher.
4 Conclusions
In this paper, different In:LiNbO3 crystals were grown using the Czochralski method. Through the
measurements, it was found that the OH- vibration absorption peaks of In(3mol%):LiNbO3 and In
Cryst. Res. Technol. 40, No. 7 (2005) / www.crt-journal.org 687
© 2005 WILEY-VCH Verlag GmbH & Co. KGaA, Weinheim
(5mol%):LiNbO3 crystals are all located at 3508cm-1, and the threshold concentration of In3+ in LiNbO3 crystal
was found below 3 mol%. The photo-damage resistance of the crystals is two orders magnitude higher than
that of In (1mol%):LiNbO3 crystal, whose quantity of In3+ is below the threshold. The SHG efficiency (η ) of
oxidized In (3mol%): LiNbO3 crystal is higher than that of as-grown In(3mol%):LiNbO3 crystals. And we also
found that the occurrence of dark trace is a cooperative result of Li+ vacancies and O vacancies.
Acknowledgements The work was supported by the National Key Projects of Fundamental Research of China
(G19990390) and National Advanced Technology Program of China (863-7150010100), and the National Natural Science
Foundation (50232030 and 10172030), and the Natural Science Foundation of Heilongjiang Province (A0203).
References
[1] Y. Furukawa, M. Sato, F. Nitanda, and K. Ato., J. Cryst. Growth 99, 832 (1990).
[2] M. N. Armenise, C. Canali, M. De Sario, and E. Zanoni., Mater. Chem. Phys. 9, 267 (1983).
[3] Q. Zhong, J. Jian, and Z. Wu, 11th International Quantum Electronics conference, IEEE Cat. No. 80, 631 (1980).
[4] Y. Kong and J. Deng, Phys. Lett. A. 196, 128 (1994).
[5] T. R. Volk, V. I. Pryalkin, and N. M. Rubinina, Opt Lett. 15, 996 (1990).
[6] A. Carcia-Cabanes, J. A. Sanz-Carcia, and J. M. Cabrera. Phys. Rev. B 37, 6085 (1988).
[7] X. Zhen, R. Wang, L. Qiang, and L. Zhao, High Technology Letters 7, 95(2001). (in Chinese).
[8] J. G. Marques, A. Kling, J. C. Soares, L. Rebouta, M. F. da Silva, E. Dieguez, and F. Agullo-Lopez, NIM B. 136–
138, 431(1998).
[9] C. Prieto, Opt. Mater. 12, 135 (1999).
[10] G. M. Salley, S. A. Basun, A. A. Kaplyanskii, R. S. Meltzer, K. Polgar, and U. Happek, J. Lumin. 87–89, 1133
(2000).