Embed Size (px)
Citation preview
DOTS Expansion: Monitoring Drugs
Leopold Blanc
TBS, Stop TBWHO, Communicable Diseases

Global monitoring examples
Monitoring drugs
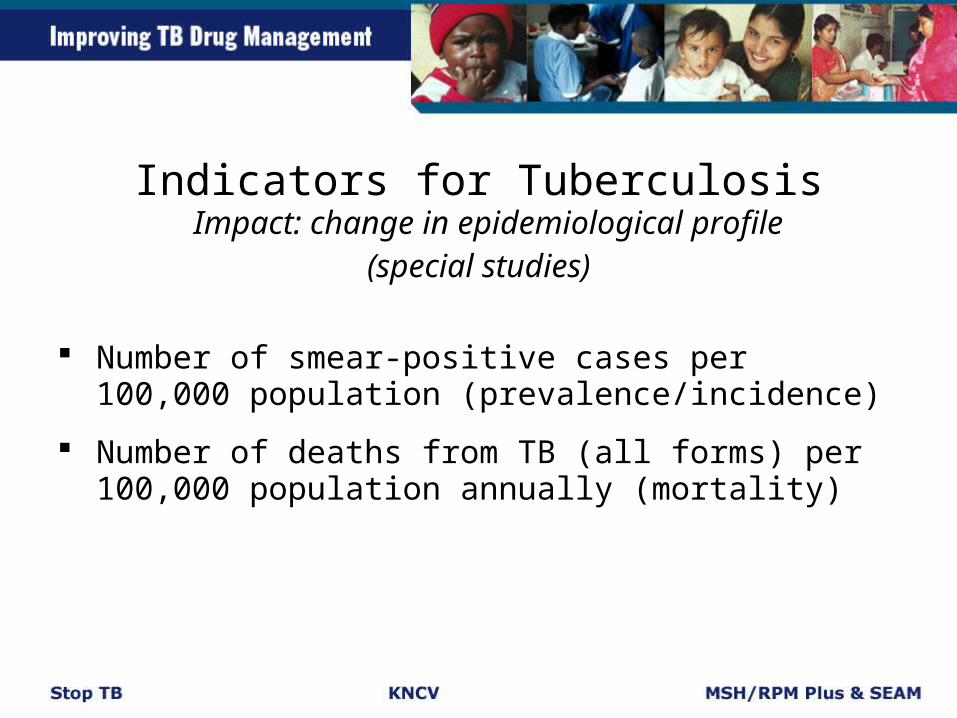
Indicators for TuberculosisImpact: change in epidemiological profile
(special studies)
Number of smear-positive cases per 100,000 population (prevalence/incidence)
Number of deaths from TB (all forms) per 100,000 population annually (mortality)
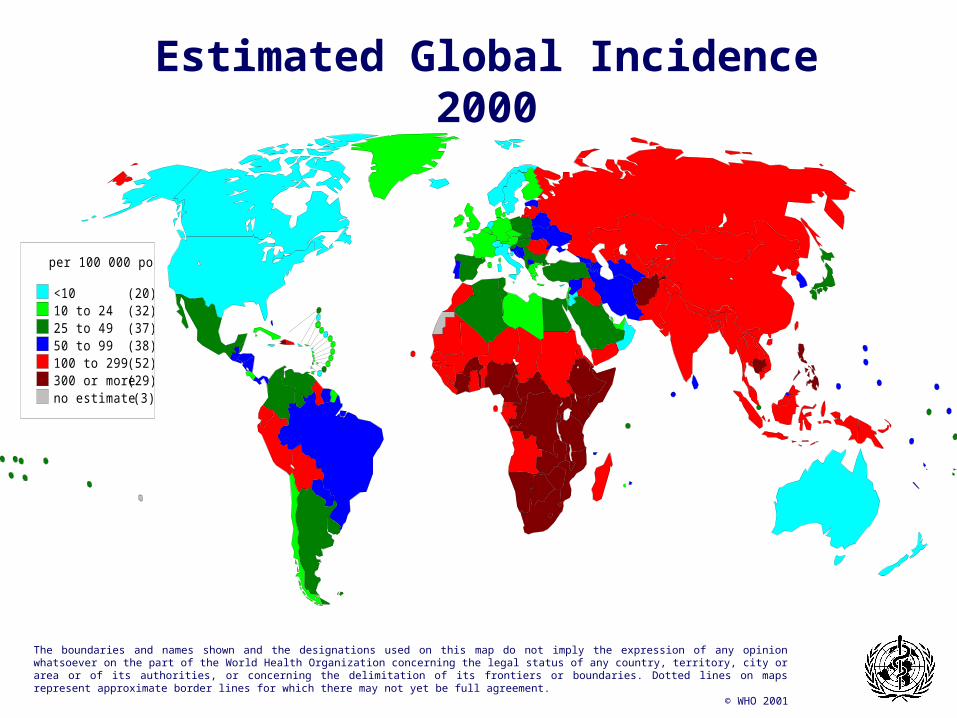
per 100 000 pop
<10 (20)10 to 24 (32)25 to 49 (37)50 to 99 (38)100 to 299 (52)300 or more (29)no estimate (3)
Estimated Global Incidence 2000
The boundaries and names shown and the designations used on this map do not imply the expression of any opinion whatsoever on the part of the World Health Organization concerning the legal status of any country, territory, city or area or of its authorities, or concerning the delimitation of its frontiers or boundaries. Dotted lines on maps represent approximate border lines for which there may not yet be full agreement.
© WHO 2001
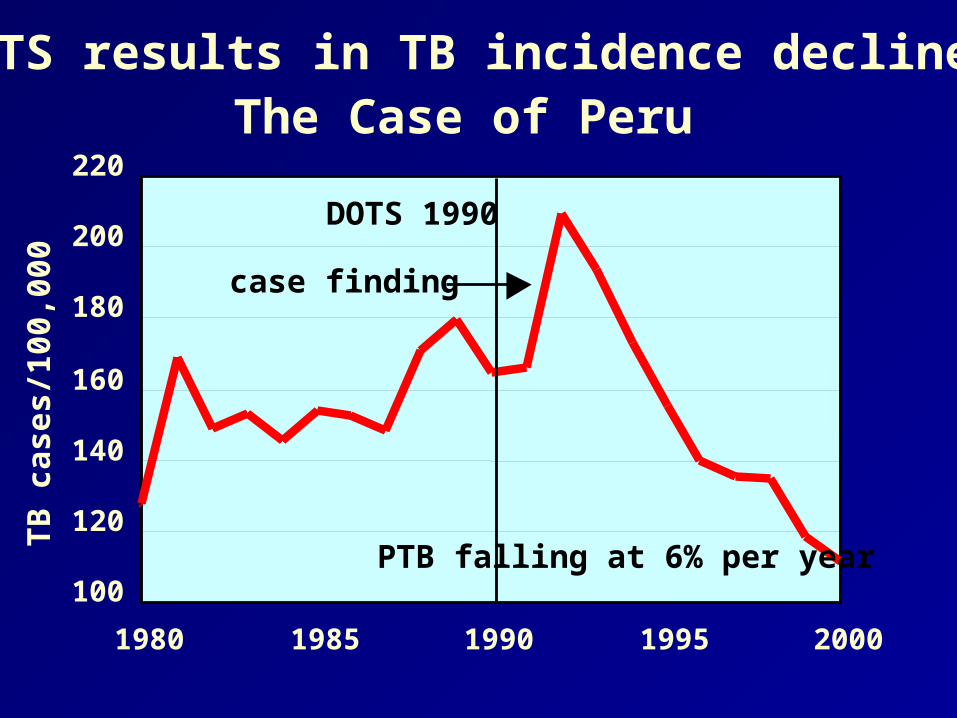
DOTS results in TB incidence decline. The Case of Peru
100
120
140
160
180
200
220
1980 1985 1990 1995 2000
TB
cas
es/1
00,0
00
DOTS 1990
PTB falling at 6% per year
case finding
0
10
20
30
40
50
60%
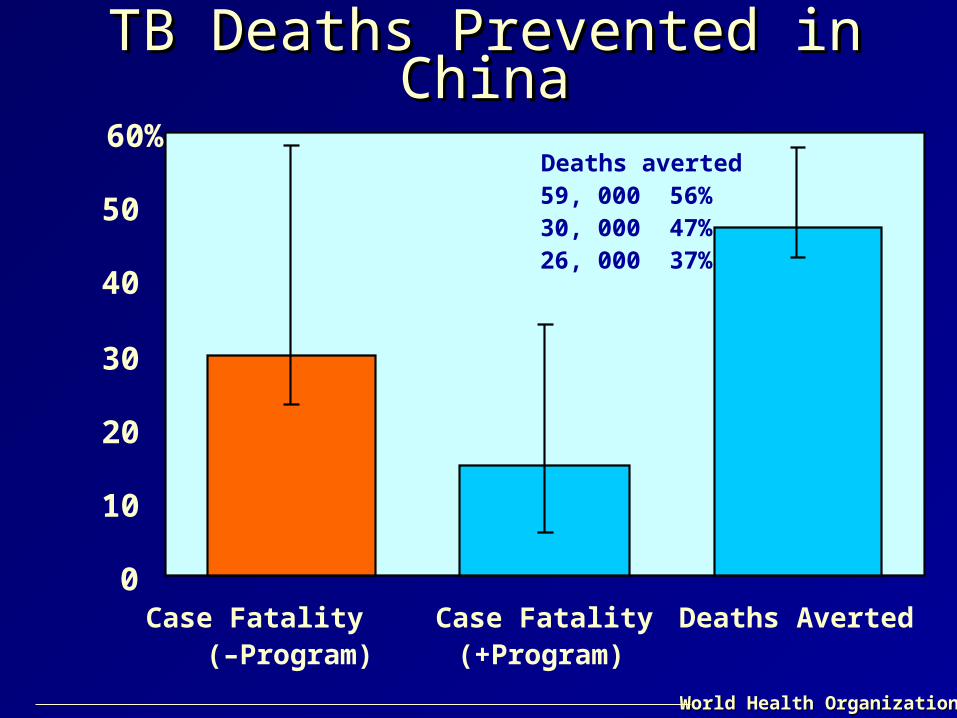
Case Fatality (–Program)
Case Fatality(+Program)
Deaths Averted
Deaths averted59, 000 56%30, 000 47%26, 000 37%
TB Deaths Prevented in ChinaTB Deaths Prevented in China
World Health OrganizationWorld Health Organization

Indicators for Tuberculosis
Coverage/Outcomes (routinely collected)At national/intermediate/district level
Proportion of all treatment units implementing DOTS (DOTS coverage: 100%)
Proportion of smear-positive TB cases registered under DOTS successfully treated (treatment success rate: 85%)
Proportion of all estimated new smear-positive TB cases detected under DOTS (ratio of detection: 70%)

Projected Case Detection Under DOTSWithout accelerated expansion, World Health Assembly
targets will be reached in 2013.
0
10
20
30
40
50
60
70
80
1990 1995 2000 2005 2010 2015
Cas
es n
oti
fied
un
der
DO
TS
(%
)
Average rate of progress:target 2013
Accelerated progress:target 2005
WHO target 70%
DOTS begins 1991
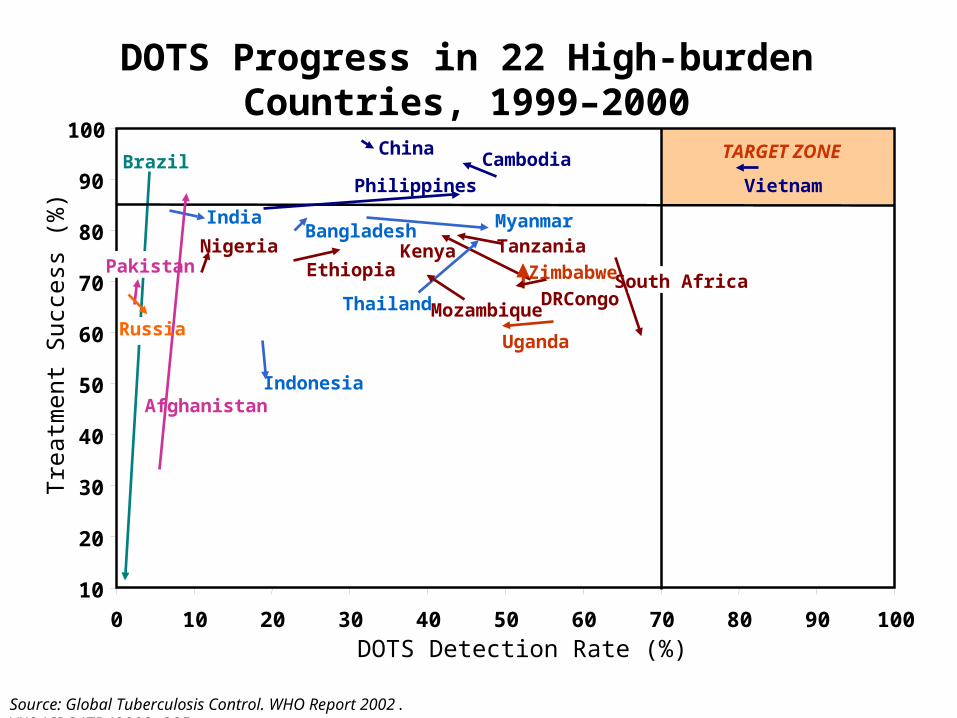
DOTS Progress in 22 High-burden Countries, 1999–2000
10
20
30
40
50
60
70
80
90
100
0 10 20 30 40 50 60 70 80 90 100
DOTS Detection Rate (%)
Tre
atm
ent
Suc
cess
(%
)
Uganda
DRCongo
Kenya Tanzania
Vietnam
MyanmarBangladeshIndia
Philippines
Indonesia
China
EthiopiaNigeria
South AfricaThailand
Cambodia TARGET ZONEBrazil
Zimbabwe
Mozambique
Afghanistan
Russia
Pakistan
Source: Global Tuberculosis Control. WHO Report 2002. WHO/CDS/TB/2002.295.

Indicators for TuberculosisProcess/outputs (examples)
Financial - Proportion of total financial requirements for DOTS implementation/expansion
available; proportion from government - Proportion of implementation units with adequate budget for DOTS components
Diagnosis - Proportion of respiratory symptomatics examined by smear examination - Proportion of units with adequate cross-check results in QA system
Treatment - Regimens: proportion of patients receiving standard regimens - Case management: proportion of all cases receiving adequate supervision in
intensive phase
Drugs: Workshop discussion
Monitoring - Proportion of units with adequate supervision and monitoring - Proportion of units submitting accurate, complete, and timely reports
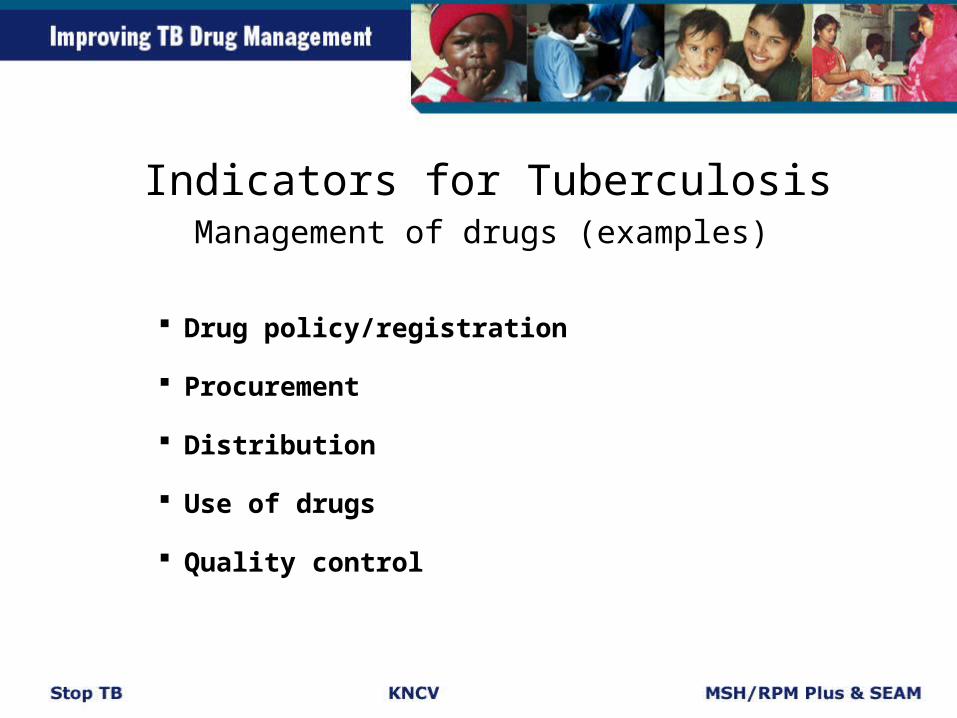
Indicators for TuberculosisManagement of drugs (examples)
Drug policy/registration
Procurement
Distribution
Use of drugs
Quality control

Drug Policy/Registration
Percentage of TB drugs that are registered in the country
Average number of days to register or re-register TB drugs after they arrive in country
Percentage of TB treatment facilities that have the national guidelines for treatment of TB
Procurement
Average lead time to receive approvals for an order of TB drugs
Average lead time for suppliers to fulfill contracts
Average time required to clear shipments of TB drugs from the port of entry for the last three procurements
Costs of TB drugs as percentage of costs of GDF
Distribution
Average percentage of time out-of-stock for a set of TB drugs at central level and at treatment facility
Average percentage of a set of unexpired TB drugs available in MOH storage and treatment facilities
Average percentage of stock records that correspond with physical counts for a set of TB drugs at central level and in treatment facilities

Drug Use
Percentage of new smear-positive patients with pulmonary TB who were prescribed drugs and dosage according to national guidelines
Percentage of TB patients who could describe how the prescribed medication should be used
Percentage of prescribed TB drugs actually dispensed
Percentage of drug retail outlets where rifampicin and streptomycin were available without prescription

Quality Control
Percentage of TB drug samples that failed quality-control testing out of the total number of TB drug samples tested
Total number of quality problems reported during the year by storerooms, prescribers, dispensing personnel, and patients