Embed Size (px)
Citation preview
*DOT/FAA/AR-xx/xx Air Traffic Organization NextGen & Operations Planning Office of Research and Technology Development Washington, DC 20591
Volume IV – UAS Airborne Colli-sion Severity Evaluation – Engine Ingestion August 2017 Final Report This document is available to the U.S. public through the National Technical Information Services (NTIS), Springfield, Virginia 22161. This document is also available from the Federal Aviation Administration William J. Hughes Technical Center at actlibrary.tc.faa.gov.
U.S. Department of Transportation Federal Aviation Administration
NOTICE
This document is disseminated under the sponsorship of the U.S. Depart-ment of Transportation in the interest of information exchange. The U.S. Government assumes no liability for the contents or use thereof. The U.S. Government does not endorse products or manufacturers. Trade or manu-facturers’ names appear herein solely because they are considered essen-tial to the objective of this report. The findings and conclusions in this report are those of the author(s) and do not necessarily represent the views of the funding agency. This document does not constitute FAA policy. Consult the FAA sponsoring organization listed on the Technical Documentation page as to its use. This report is available at the Federal Aviation Administration William J. Hughes Technical Center’s Full-Text Technical Reports page: actli-brary.tc.faa.gov in Adobe Acrobat portable document format (PDF).
Legal Disclaimer: The information provided herein may include content supplied by third par-
ties. Although the data and information contained herein has been produced or processed from
sources believed to be reliable, the Federal Aviation Administration makes no warranty, ex-
pressed or implied, regarding the accuracy, adequacy, completeness, legality, reliability or use-
fulness of any information, conclusions or recommendations provided herein. Distribution of the
information contained herein does not constitute an endorsement or warranty of the data or in-
formation provided herein by the Federal Aviation Administration or the U.S. Department of
Transportation. Neither the Federal Aviation Administration nor the U.S. Department of Trans-
portation shall be held liable for any improper or incorrect use of the information contained
herein and assumes no responsibility for anyone’s use of the information. The Federal Aviation
Administration and U.S. Department of Transportation shall not be liable for any claim for any
loss, harm, or other damages arising from access to or use of data or information, including
without limitation any direct, indirect, incidental, exemplary, special or consequential damages,
even if advised of the possibility of such damages. The Federal Aviation Administration shall
not be liable to anyone for any decision made or action taken, or not taken, in reliance on the
information contained herein.
Technical Report Documentation Page 1. Report No.
DOT/FAA/AR-xx/xx
2. Government Accession No. 3. Recipient's Catalog No.
4. Title and Subtitle
Volume IV – UAS Airborne Collision Severity Evaluation – Engine Ingestion
5. Report Date
August 2017
6. Performing Organization Code
7. Author(s)
Kiran D’Souza, Troy Lyons, Thomas Lacy, Kalyan Raj Kota
8. Performing Organization Report No.
9. Performing Organization Name and Address
The Ohio State University Mississippi State University
Gas Turbine Laboratory Department of Aerospace Engineering
2300 West Case Road PO Box A
Columbus, OH 43235 Mississippi State, MS 39762
10. Work Unit No. (TRAIS)
11. Contract or Grant No.
12. Sponsoring Agency Name and Address
U.S. Department of Transportation
Federal Aviation Administration
Office of Aviation Research
Washington, DC 20591
13. Type of Report and Period Covered
14. Sponsoring Agency Code
15. Supplementary Notes
16. Abstract
Unmanned aerial vehicles (UAVs) are becoming more abundant, and the risk of a UAV-airplane
collision is growing with their popularity. Airplane collisions with birds and ice have been re-
searched for several decades, however those impacts are not representative of an airplane with a
UAV. UAVs contain materials which are harder and denser than birds. Here simulations of a UAV
ingestion into a jet engine are studied with the commercially available software LS-DYNA. Para-
metric study models of fan stages of mid-sized business jets housed in a containment tank were
used for the ingestion simulations. Collaborating research groups created the two finite element
UAV models that were used in this study. The collaborating research groups simulated and com-
pared their finite element models of key UAV components against experimental crash tests to en-
sure UAV component model accuracy. This computational research shows that UAVs are capable
of causing severe damage to jet engines, and lays the foundation for further computational and ex-
perimental studies of ingestion events.
17. Key Words
Crashworthiness, Engine Ingestion, UAS, Ohio State Uni-
versity, OSU
18. Distribution Statement
This document is available to the U.S. public through the Na-
tional Technical Information Service (NTIS), Springfield, Vir-
ginia 22161. This document is also available from the Federal
Aviation Administration William J. Hughes Technical Center at
actlibrary.tc.faa.gov. 19. Security Classif. (of this report)
Unclassified 20. Security Classif. (of this page)
Unclassified 21. No. of Pages
22. Price
Form DOT F 1700.7 (8-72) Reproduction of completed page authorized
v
ACKNOWLEDGEMENTS
The authors would like to acknowledge the FAA’s Center of Excellence for Unmanned Aircraft
Systems, ASSURE for funding this work.
The authors would also like to acknowledge Dr. Mike Dunn and Dr. Jim Gregory from The Ohio
State University for their administrative efforts and guidance during the course of this project. We
also acknowledge the help of Erica Johnson, Chris Keener, Eric Kurstak, and Mitchell Do-
erzbacher, students at The Ohio State University who helped in the modeling effort. We would
also like to acknowledge the input and guidance of Bob Morris and Steve Conner from Pratt &
Whitney.
The authors also acknowledge the collaborations with Dr. Gerardo Olivares, Luis Gomez, and
Jaime Espinosa de los Monteros from the National Institute of Aviation Research at Wichita State
University who created the quadcopter model, and consulted on and ran some of the engine inges-
tion test cases; Dr. Doug Cairns from Montana State University for his support, guidance, and
assistance during the project; Tom Aldag from the National Institute for Aviation Research at
Wichita State University for his support and administrative efforts; and Colonel Stephen Luxion
(retired) and Marty Rogers from Mississippi State University for his administrative efforts.
The authors would also like to acknowledge the Ohio Super Computer Center1, which provided
additional computing resources used to run the simulations presented in this work.
Finally, we would like to particularly thank Paul Rumberger, Daniel Cordasco, William
Oehlschlager, Bill Emmerling, Sabrina Saunders-Hodge, Amela Zanacic, Benjamin Bradley, and
Chris Swider, from the FAA for their comments, suggestions, and guidance over the course of this
project.
vi
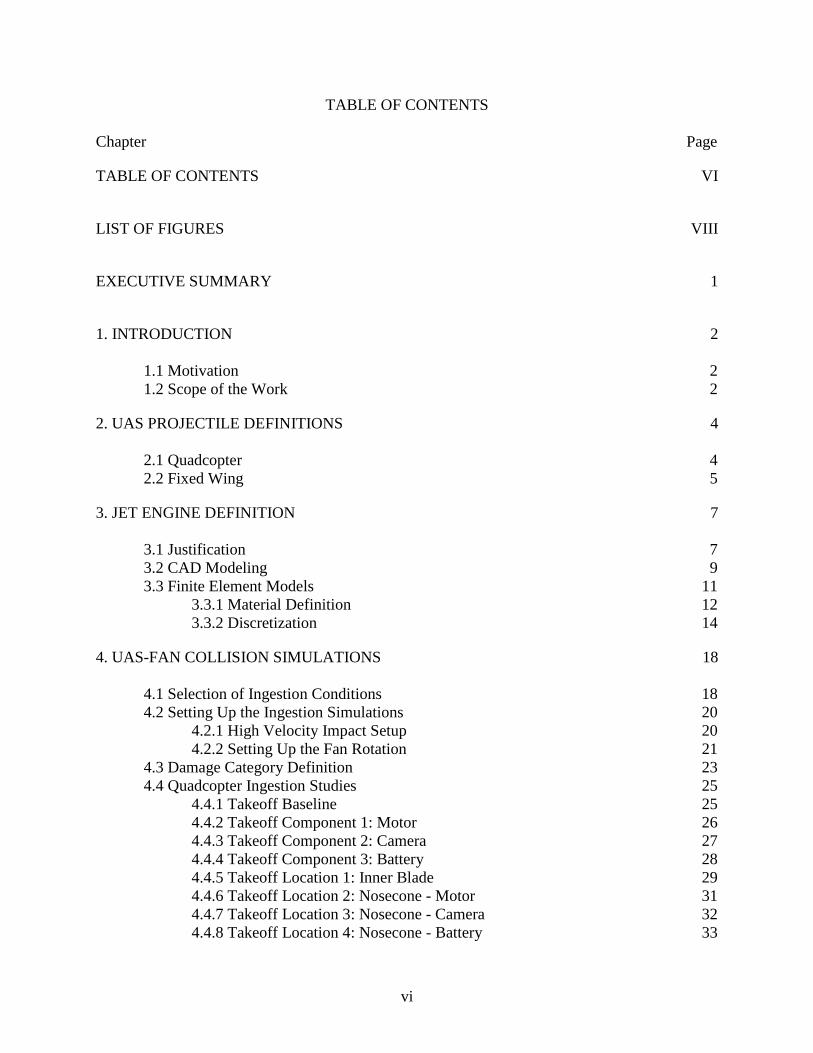
TABLE OF CONTENTS
Chapter Page
TABLE OF CONTENTS VI
LIST OF FIGURES VIII
EXECUTIVE SUMMARY 1
1. INTRODUCTION 2
1.1 Motivation 2
1.2 Scope of the Work 2
2. UAS PROJECTILE DEFINITIONS 4
2.1 Quadcopter 4 2.2 Fixed Wing 5
3. JET ENGINE DEFINITION 7
3.1 Justification 7 3.2 CAD Modeling 9
3.3 Finite Element Models 11 3.3.1 Material Definition 12
3.3.2 Discretization 14
4. UAS-FAN COLLISION SIMULATIONS 18
4.1 Selection of Ingestion Conditions 18 4.2 Setting Up the Ingestion Simulations 20
4.2.1 High Velocity Impact Setup 20 4.2.2 Setting Up the Fan Rotation 21
4.3 Damage Category Definition 23 4.4 Quadcopter Ingestion Studies 25
4.4.1 Takeoff Baseline 25 4.4.2 Takeoff Component 1: Motor 26 4.4.3 Takeoff Component 2: Camera 27
4.4.4 Takeoff Component 3: Battery 28 4.4.5 Takeoff Location 1: Inner Blade 29 4.4.6 Takeoff Location 2: Nosecone - Motor 31 4.4.7 Takeoff Location 3: Nosecone - Camera 32 4.4.8 Takeoff Location 4: Nosecone - Battery 33
vii
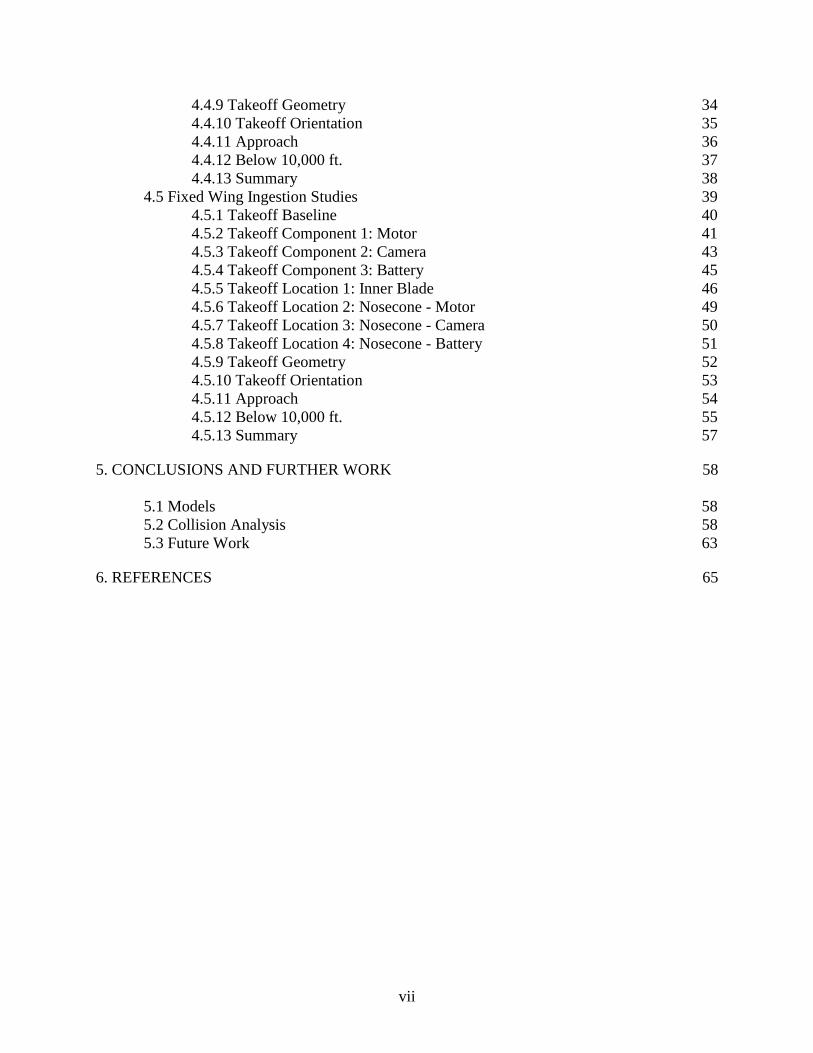
4.4.9 Takeoff Geometry 34
4.4.10 Takeoff Orientation 35 4.4.11 Approach 36
4.4.12 Below 10,000 ft. 37 4.4.13 Summary 38
4.5 Fixed Wing Ingestion Studies 39 4.5.1 Takeoff Baseline 40 4.5.2 Takeoff Component 1: Motor 41
4.5.3 Takeoff Component 2: Camera 43 4.5.4 Takeoff Component 3: Battery 45 4.5.5 Takeoff Location 1: Inner Blade 46 4.5.6 Takeoff Location 2: Nosecone - Motor 49 4.5.7 Takeoff Location 3: Nosecone - Camera 50
4.5.8 Takeoff Location 4: Nosecone - Battery 51 4.5.9 Takeoff Geometry 52
4.5.10 Takeoff Orientation 53 4.5.11 Approach 54
4.5.12 Below 10,000 ft. 55 4.5.13 Summary 57
5. CONCLUSIONS AND FURTHER WORK 58
5.1 Models 58
5.2 Collision Analysis 58 5.3 Future Work 63
6. REFERENCES 65
viii
LIST OF FIGURES
Figure Page
1. Figure 1: Quadcopter FE model 4 2. Figure 2: Critical components of the quadcopter 5 3. Figure 3: Fixed wing models 5 4. Figure 4: Critical components of the fixed wing 6
5. Figure 5: Assembled generic mid-sized business jet engine model 7 6. Figure 6: Fan stage geometries 9 7. Figure 7: Nacelle for generic fan stage 10 8. Figure 8: Generic biconic nosecone 10 9. Figure 9: Mesh of the nosecone 11
10. Figure 10: Four thin blades refined at the tip 14 11. Figure 11: Ten thin blades fully refined 15
12. Figure 12: All twenty thin blades refined at the tips 15 13. Figure 13: All twenty thin blades and disk refined 16
14. Figure 14: All twenty thin blades refined 16 15. Figure 15: Mesh for thick fan stage with all blades refined 17
16. Figure 16: Orientations of the quadcopter 20 17. Figure 17: Orientations of the fixed wing 20
18. Figure 18: The first principal stress from preloading the thin fan with units 𝑙𝑏𝑠/𝑖𝑛2 22
19. Figure 19: The first principal stress from preloading the thick fan with units 𝑙𝑏𝑠/𝑖𝑛2 22
20. Figure 20: View of thin fan without preloading (solid gray) and with preloading (outline
of bladed disk) with radial deflection approximately 0.03 inches at mid-chord 22
21. Figure 21: View of thick fan without preloading (solid gray) and with preloading (outline
of bladed disk) with radial deflection approximately 0.03 inches at mid-chord 23
22. Figure 22: Kinematics of the quadcopter ingestion for the takeoff baseline case 25 23. Figure 23: Damage to blades from the quadcopter for the takeoff baseline case 26
24. Figure 24: Kinematics of the quadcopter motor ingestion for the takeoff component 1
case 27 25. Figure 25: Plastic work in blades from the quadcopter motor for the takeoff component 1
case 27 26. Figure 26: Kinematics of the quadcopter camera ingestion for the takeoff component 2
case 28 27. Figure 27: Plastic work in the blades for the takeoff component 2 case 28
28. Figure 28: Kinematics of the quadcopter battery ingestion for the takeoff component 3
case 29
29. Figure 29: Plastic work in the blades for the takeoff component 3 case 29 30. Figure 30: Kinematics of the quadcopter ingestion for the takeoff location 1 case 30 31. Figure 31: Effective plastic strain in blades for the takeoff location 1 case 30 32. Figure 32: Kinematics of the quadcopter motor ingestion for the takeoff location 2 case 31 33. Figure 33: Plastic work in the nosecone for the takeoff location 2 case 31
34. Figure 34: Kinematics of the quadcopter camera ingestion for the takeoff location 3
case 32 35. Figure 35: Plastic work in the nosecone for the takeoff location 3 case 32
ix
36. Figure 36: Kinematics of the quadcopter battery ingestion for the takeoff location 4
case 33 37. Figure 37: Plastic work in the nosecone for the takeoff location 4 case 33
38. Figure 38: Kinematics of the quadcopter ingestion for the takeoff geometry case 34 39. Figure 39: Damage in one blade for the takeoff geometry case 34 40. Figure 40: Kinematics of the quadcopter ingestion for the takeoff orientation case 35 41. Figure 41: Damage to engine for the takeoff orientation case 35 42. Figure 42: Kinematics of the quadcopter ingestion for the approach case 36
43. Figure 43: Damage to blades for the approach case 36 44. Figure 44: Kinematics of the quadcopter motor ingestion for the below 10,000 ft. case 37 45. Figure 45: Effective plastic strain in blades for the below 10,000 ft. case 38 46. Figure 46: Full fixed wing ingestion into the generic business engine model 40 47. Figure 47: Kinematics of the fixed wing ingestion for the takeoff baseline case 41
48. Figure 48: Damage to blades from the fixed wing for the takeoff baseline case 41 49. Figure 49: Kinematics of the fixed wing motor ingestion for the takeoff component 1
case 42 50. Figure 50: Damage to engine from the fixed wing motor for the takeoff component 1
case 43 51. Figure 51: Kinematics of the fixed wing camera ingestion for the takeoff component 2
case 44 52. Figure 52: Damage to engine for the takeoff component 2 case 45 53. Figure 53: Kinematics of the fixed wing battery ingestion for the takeoff component 3
case 46 54. Figure 54: Plastic work in blades for the takeoff component 3 case 46
55. Figure 55: Kinematics of the fixed wing ingestion for the takeoff location 1 case 47 56. Figure 56: Damage to blades for the takeoff location 1 case 48
57. Figure 57: Kinematics of the fixed wing motor ingestion for the takeoff location 2 case 49 58. Figure 58: Effective plastic strain in the nosecone for the takeoff location 2 case 49
59. Figure 59: Kinematics of the fixed wing camera ingestion for the takeoff location 3
case 50 60. Figure 60: Effective plastic strain in the nosecone for the takeoff location 3 case 50
61. Figure 61: Kinematics of the fixed wing battery ingestion for the takeoff location 4
case 51
62. Figure 62: Plastic work in the nosecone for the takeoff location 4 case 51 63. Figure 63: Kinematics of the fixed wing ingestion for the takeoff geometry case 52 64. Figure 64: Damage to blades for the takeoff geometry case 52 65. Figure 65: Kinematics of the fixed wing ingestion for the takeoff orientation case 53 66. Figure 66: Effective plastic strain in blades for the takeoff orientation case 53
67. Figure 67: Kinematics of the fixed wing ingestion for the approach case 54 68. Figure 68: Effective plastic strain in blades for the approach case 55
69. Figure 69: Kinematics of the fixed wing motor ingestion for the below 10,000 ft. case 56 70. Figure 70: Damage to blades for the below 10,000 ft. case 56 71. Figure 71: Energy plot for the quadcopter inner blade impact case 62 72. Figure 72: Energy plot for the fixed wing takeoff baseline case 63
x
LIST OF ACRONYMS
ASSURE Alliance for System Safety of UAS through Research Excellence
AWG LS-DYNA Aerospace Working Group
CAD Computer-Aided Design
CFR Code of Federal Regulations
FAA Federal Aviation Administration
FBO Fan Blade Out
FE Finite Element
NACA National Advisory Committee for Aeronautics
NIAR National Institute for Aviation Research
OSU The Ohio State University
RPM Revolutions per minute
UAS Unmanned Aerial System
UAV Unmanned Aerial Vehicle
1
EXECUTIVE SUMMARY
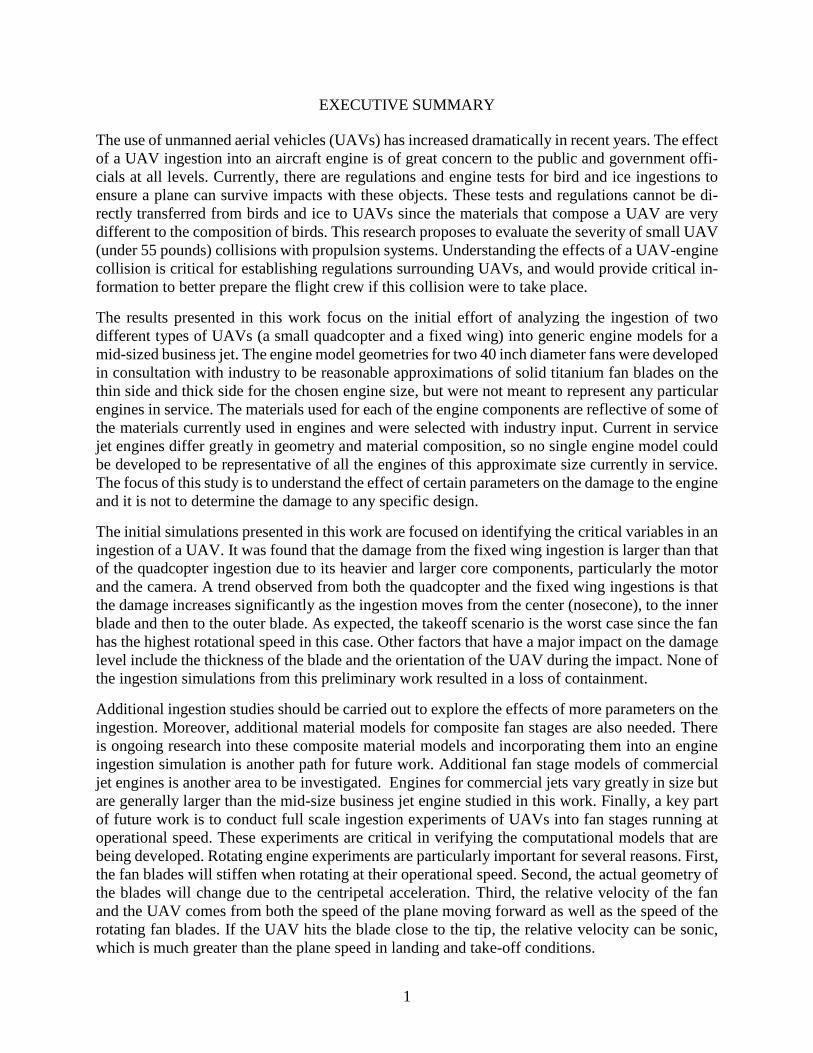
The use of unmanned aerial vehicles (UAVs) has increased dramatically in recent years. The effect
of a UAV ingestion into an aircraft engine is of great concern to the public and government offi-
cials at all levels. Currently, there are regulations and engine tests for bird and ice ingestions to
ensure a plane can survive impacts with these objects. These tests and regulations cannot be di-
rectly transferred from birds and ice to UAVs since the materials that compose a UAV are very
different to the composition of birds. This research proposes to evaluate the severity of small UAV
(under 55 pounds) collisions with propulsion systems. Understanding the effects of a UAV-engine
collision is critical for establishing regulations surrounding UAVs, and would provide critical in-
formation to better prepare the flight crew if this collision were to take place.
The results presented in this work focus on the initial effort of analyzing the ingestion of two
different types of UAVs (a small quadcopter and a fixed wing) into generic engine models for a
mid-sized business jet. The engine model geometries for two 40 inch diameter fans were developed
in consultation with industry to be reasonable approximations of solid titanium fan blades on the
thin side and thick side for the chosen engine size, but were not meant to represent any particular
engines in service. The materials used for each of the engine components are reflective of some of
the materials currently used in engines and were selected with industry input. Current in service
jet engines differ greatly in geometry and material composition, so no single engine model could
be developed to be representative of all the engines of this approximate size currently in service.
The focus of this study is to understand the effect of certain parameters on the damage to the engine
and it is not to determine the damage to any specific design.
The initial simulations presented in this work are focused on identifying the critical variables in an
ingestion of a UAV. It was found that the damage from the fixed wing ingestion is larger than that
of the quadcopter ingestion due to its heavier and larger core components, particularly the motor
and the camera. A trend observed from both the quadcopter and the fixed wing ingestions is that
the damage increases significantly as the ingestion moves from the center (nosecone), to the inner
blade and then to the outer blade. As expected, the takeoff scenario is the worst case since the fan
has the highest rotational speed in this case. Other factors that have a major impact on the damage
level include the thickness of the blade and the orientation of the UAV during the impact. None of
the ingestion simulations from this preliminary work resulted in a loss of containment.
Additional ingestion studies should be carried out to explore the effects of more parameters on the
ingestion. Moreover, additional material models for composite fan stages are also needed. There
is ongoing research into these composite material models and incorporating them into an engine
ingestion simulation is another path for future work. Additional fan stage models of commercial
jet engines is another area to be investigated. Engines for commercial jets vary greatly in size but
are generally larger than the mid-size business jet engine studied in this work. Finally, a key part
of future work is to conduct full scale ingestion experiments of UAVs into fan stages running at
operational speed. These experiments are critical in verifying the computational models that are
being developed. Rotating engine experiments are particularly important for several reasons. First,
the fan blades will stiffen when rotating at their operational speed. Second, the actual geometry of
the blades will change due to the centripetal acceleration. Third, the relative velocity of the fan
and the UAV comes from both the speed of the plane moving forward as well as the speed of the
rotating fan blades. If the UAV hits the blade close to the tip, the relative velocity can be sonic,
which is much greater than the plane speed in landing and take-off conditions.
2
1. INTRODUCTION
The intent of this document is to describe a computational research program designed to determine
the behavior of mid-sized business class engine fan stages, which are reasonable approximations
of solid titanium fan blades on the thin side and thick side for these engines, operating under con-
ditions such as take-off, approach, and flight below 10,000 ft. when impacted by an unmanned
aerial vehicle (UAV), report on the initial computational results, and discuss future work. The
intent of this work is to understand how different parameters influence the expected level of dam-
age to the engine models, and therefore, the engine models will be referred to as parametric study
models hereafter. While much is known about soft body impacts (usually birds) on the propulsion
systems from bird ingestion tests and from inflight occurrences, the same cannot be said for hard
body impacts such as UAVs. The goal of this research program is to develop an accurate compu-
tational simulation of a small UAV (under 55 pounds) impacting a fan stage operating at conditions
reflective of take-off, approach, and flight below 10,000 ft. The computational work is closely
aligned with future experiments that can be conducted at The Ohio State University (OSU) Gas
Turbine Laboratory in later phases of the proposed project. The computational method is devel-
oped and used on generic fan stage models housed within a generic containment tank that are
impacted by UAV models developed at the National Institute for Aviation Research (NIAR) at
Wichita State University and Mississippi State University. The computational tool is planned to
be used with the same fan stage that is obtained for future experiments for verification of the
method.
1.1 MOTIVATION
The use of UAVs has increased dramatically in recent years. UAVs have been used by the military
for years and recently there has been a strong interest in their commercial and recreational appli-
cations. As the number of UAVs sold continues to increase, proper integration of UAVs into the
airspace is a major safety concern due to the potential for a UAV-airplane collision. Hobbyist UAV
users are the highest safety concern, as they may be unaware or unconcerned with government
rules and restrictions when they fly their UAVs. The UAVs of hobbyists are relatively small and
more likely to be ingested by an engine in a collision event. Currently, there are regulations and
engine tests for bird and ice ingestions to ensure a plane can survive impacts with these objects.
These tests and regulations cannot be directly transferred from birds and ice to UAVs since the
materials that compose a UAV are very different to the composition of birds. Some of the UAV
components, including the motor, camera, and battery, can be far more dense and stiff than birds
(which are typically modeled as a fluid since they are over 70% water) and ice. Understanding the
effects of a UAV-engine collision is critical for establishing regulations surrounding UAVs, and
would provide critical information to better prepare the flight crew if this collision were to take
place.
1.2 SCOPE OF THE WORK
In this work, parametric study models of a mid-sized business engine’s fan stage, nosecone, and
containment ring were developed and integrated for use in ingestion simulations. The models were
created using previous FAA projects as points of reference, and then modified based upon industry
input. The test cases considered in this preliminary study covered several parameters at three flight
conditions representing take-off, approach, and flight below 10,000 ft., where it is most likely an
3
ingestion event would take place. The simulations of the UAV ingestion into the jet engines were
carried out with the commercially available finite-element software LS-DYNA. The software is
well equipped to model highly nonlinear dynamic events with explicit time integration, which is
necessary for high-velocity impact events. Additionally, the software includes an implicit solver
that is used to find the pre-stressed loads from the centripetal acceleration of the spinning fan stage.
The material models used in these impact events need to be sophisticated so that they can accu-
rately capture material failure. In this work, the material models used for the fan blades, fan disk
and nosecone have been developed from extensive experimental testing, and take 3D stress, strain
rate, temperature, and element size into account. This is necessary over traditional piecewise-linear
material models because high velocity collisions (such as fan blades with a UAV) will have large
strain rates and heating due to plastic deformation that will have insufficient time to dissipate,
which will cause the local temperature in deformed elements to rise significantly. Also, the mate-
rial model used for the fan is able to predict multiple types of failure modes. Accurate modeling
of the UAVs used for the ingestion simulation is also critical. Two UAVs were chosen for this
work: a common quadcopter UAV, the DJI Phantom 3, popular among hobbyists; and a common
fixed wing UAV, the Precision Hawk. Mississippi State and NIAR created models of the UAVs
and compared simulations of crash tests of key UAV components against aluminum plates with
the corresponding experiments, and then tuned the models to match the experiments. UAV model
details can be found in the reports on the quadcopter2 and the fixed wing3. The simulations show
that the initial conditions of the UAV ingestion greatly affect the level of damage to an engine,
and lay the foundation for further parameterized studies and experimental UAV-engine impact
events.
4
2. UAS PROJECTILE DEFINITIONS
Two UAVs were modeled for their ingestion into an engine: a quadcopter and a fixed wing.
2.1 QUADCOPTER
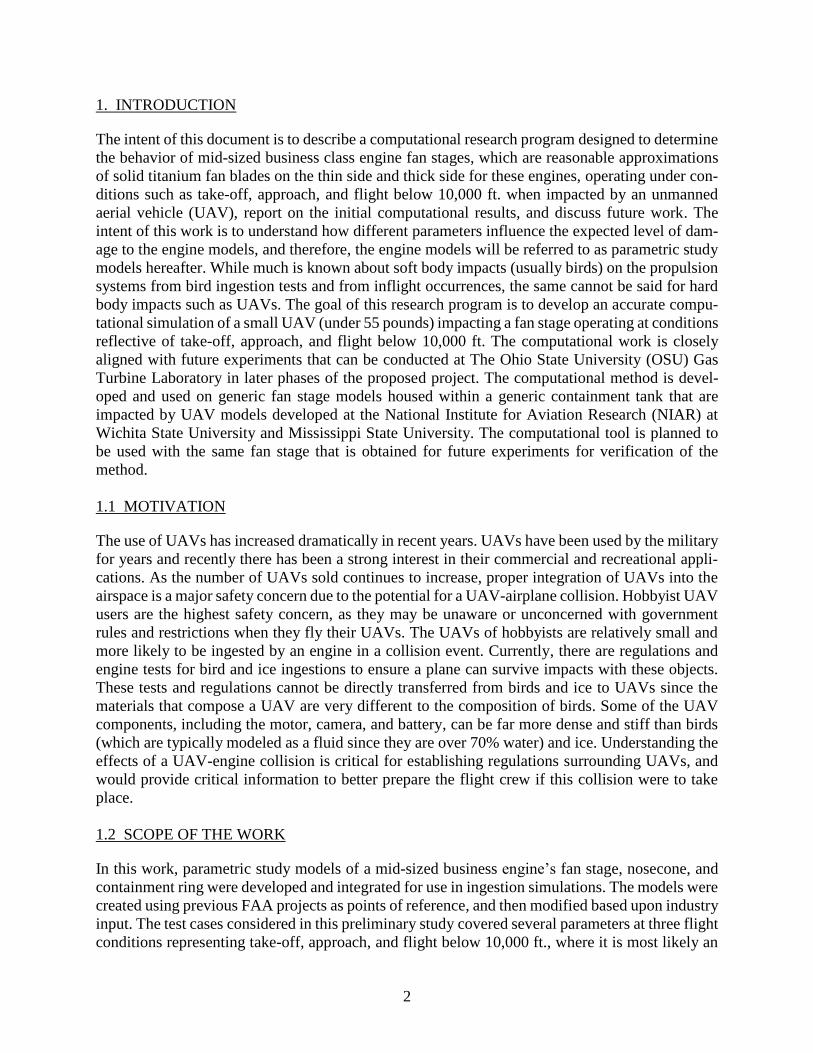
The quadcopter chosen for the engine ingestion is the DJI Phantom 3 - weighing 2.68 lbs. This
quadcopter’s abundance and ease of use make it one of the most likely types of UAVs to impact
an airplane4. The quadcopter finite element (FE) model shown in Figure 1 and used in this impact
study was made by a collaborating group at NIAR at Wichita State University. This group reverse
engineered the DJI Phantom 3 to be used in computational impact studies.
(a) Oblique view (b) Front view
Figure 1: Quadcopter FE model
The quadcopter model obtained from NIAR was scanned to extract the geometry for the quadcop-
ter model. The material models used were developed from experiments to produce material failure
under a variety of conditions. The three major components (motor, battery, and camera) are iden-
tified in Figure 1(b). These components were shot at aluminum plates of varying thickness. These
experimental impacts were compared to LS-DYNA simulated impacts. The LS-DYNA models of
these components were adjusted to match the damage to both the plate and the quadcopter com-
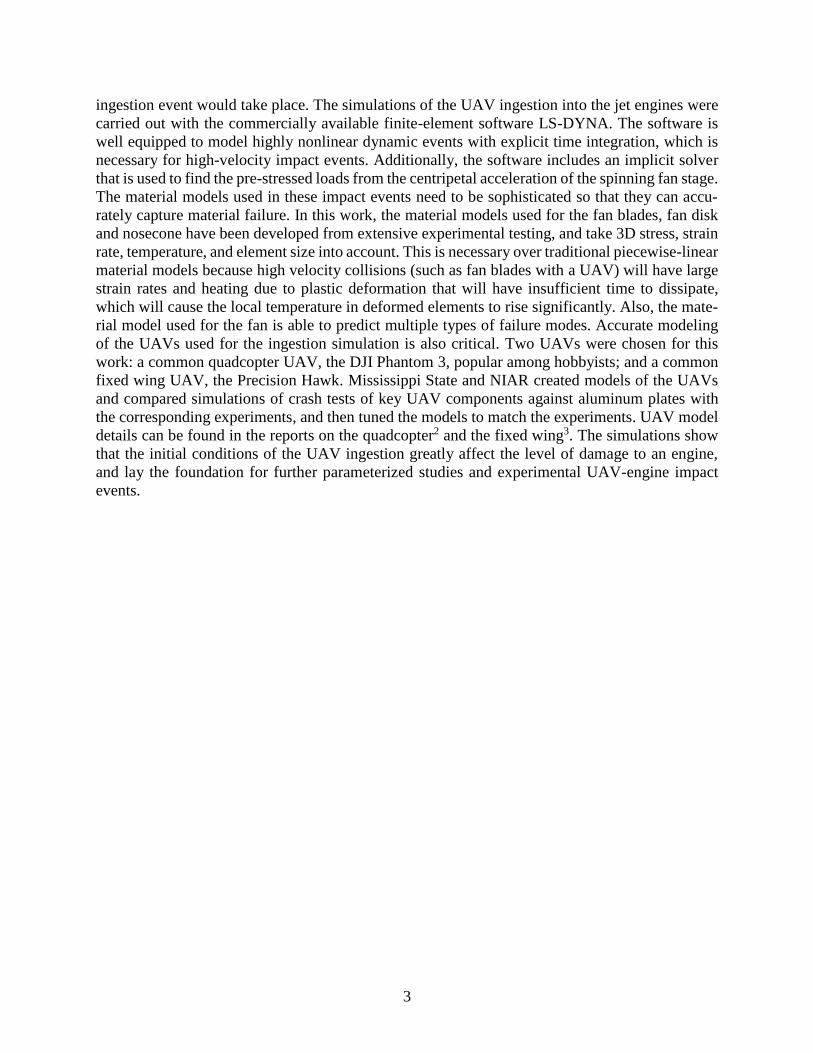
ponents in the experiment. The FE models of these components are shown in Figure 2. Additional
details on the construction of the quadcopter model can be found in the companion report2.
motor battery
camera
5
(a) Battery (b) Camera (c) Motor
Figure 2: Critical components of the quadcopter
2.2 FIXED WING
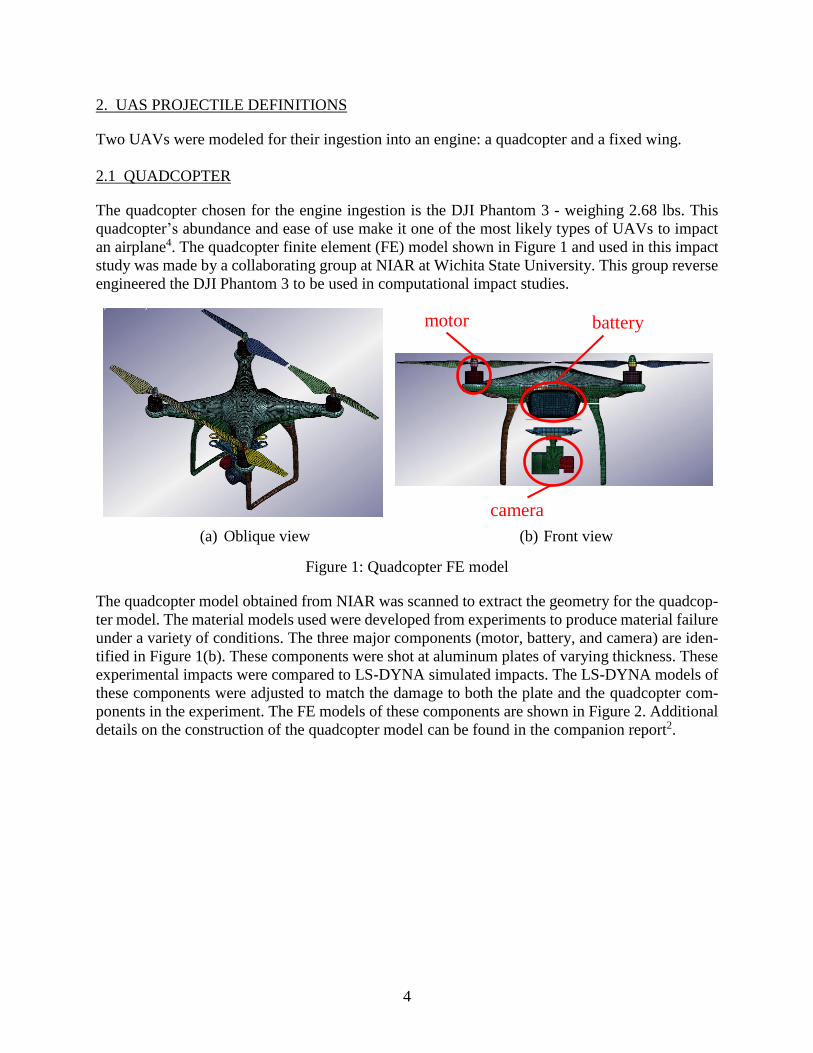
The fixed wing chosen for the engine ingestion is the Precision Hawk Lancaster Hawkeye Mark
III - weighing 4.0 lbs. The fixed wing UAV impact scenarios are distinct from those of rotorcraft-
based UASs (e.g., differences in geometries, relative velocities, mass distribution, and total mass),
and therefore separate fixed wing ingestion scenarios were studied in addition to quadcopter in-
gestions. The fixed wing FE model used in this study was made by a collaborating group at Mis-
sissippi State University and is shown in Figure 3. This group reverse engineered the Precision
Hawk to be used in computational impact studies. Due to the size of the fixed wing with respect
to the business class engine, a model of the Precision Hawk without the wings was used in the
ingestion simulations.
(a) Full Precision Hawk model (b) Wings removed from Precision Hawk
Figure 3: Fixed wing models
The UAV model obtained from Mississippi State University was scanned to extract the geometry
for the UAV model. The material models used were developed from experiments to capture mate-
rial failure under a variety of conditions. The motor and battery were shot at aluminum plates of
motor
camera battery
6
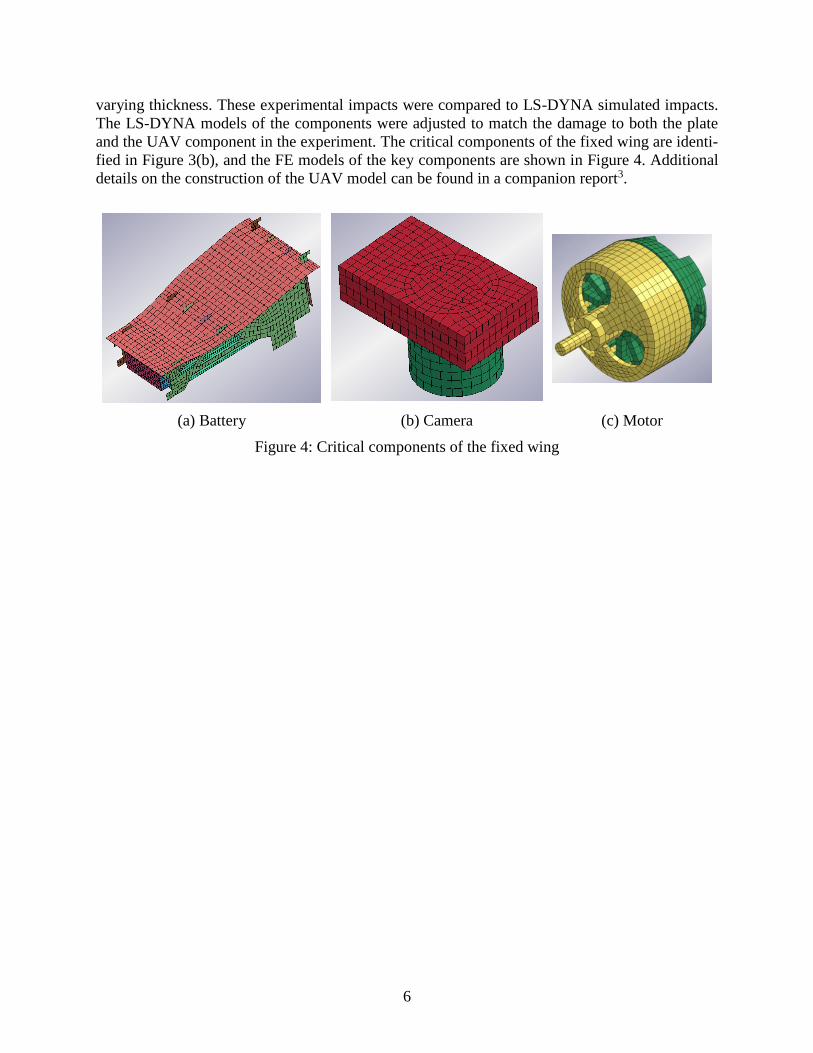
varying thickness. These experimental impacts were compared to LS-DYNA simulated impacts.
The LS-DYNA models of the components were adjusted to match the damage to both the plate
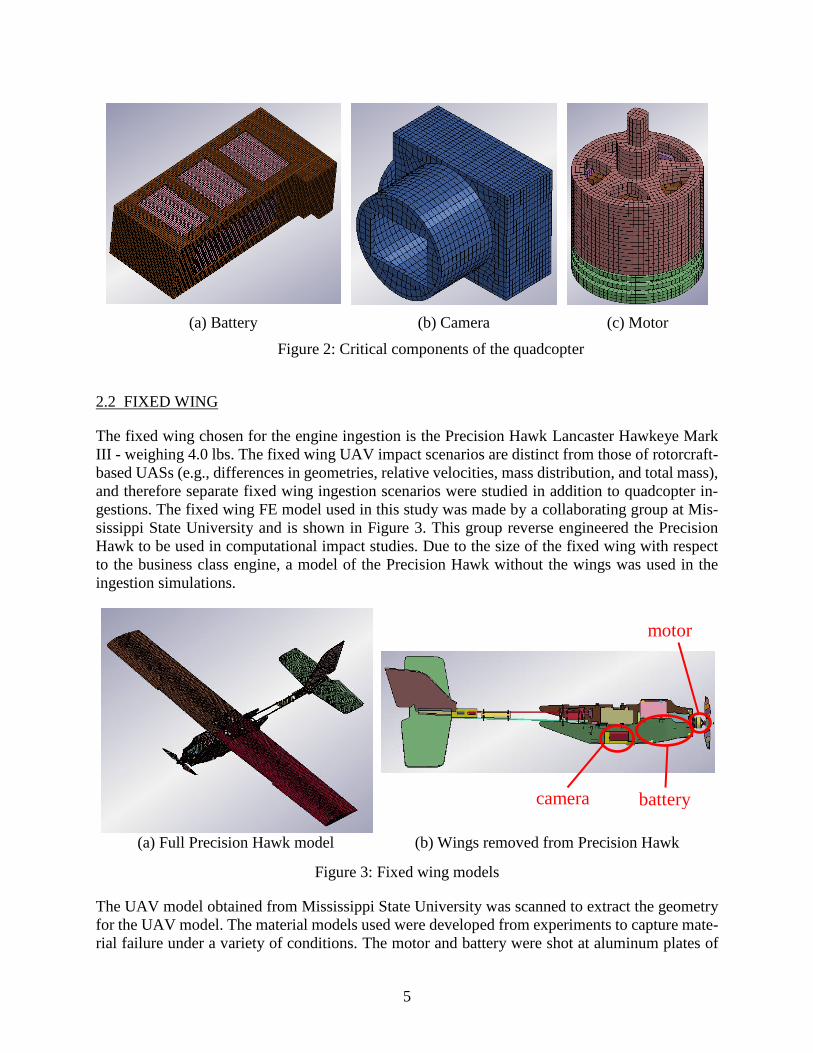
and the UAV component in the experiment. The critical components of the fixed wing are identi-
fied in Figure 3(b), and the FE models of the key components are shown in Figure 4. Additional
details on the construction of the UAV model can be found in a companion report3.
(a) Battery (b) Camera (c) Motor
Figure 4: Critical components of the fixed wing
7
3. JET ENGINE DEFINITION
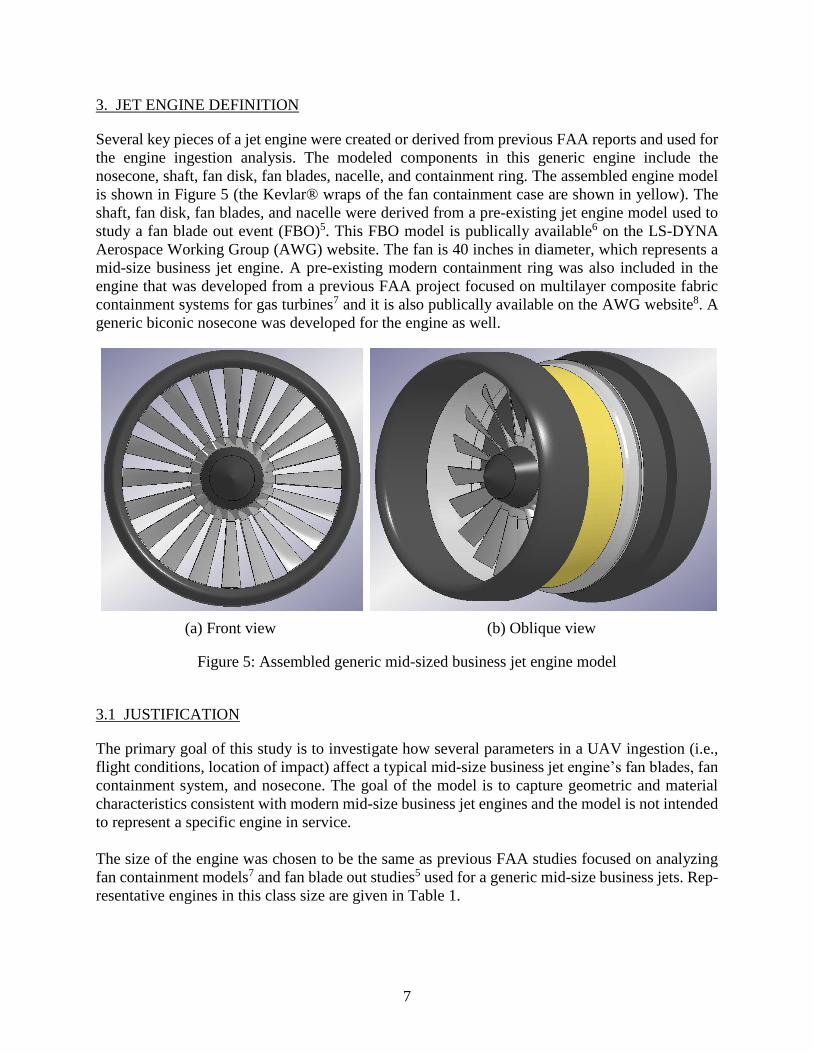
Several key pieces of a jet engine were created or derived from previous FAA reports and used for
the engine ingestion analysis. The modeled components in this generic engine include the
nosecone, shaft, fan disk, fan blades, nacelle, and containment ring. The assembled engine model
is shown in Figure 5 (the Kevlar® wraps of the fan containment case are shown in yellow). The
shaft, fan disk, fan blades, and nacelle were derived from a pre-existing jet engine model used to
study a fan blade out event (FBO)5. This FBO model is publically available6 on the LS-DYNA
Aerospace Working Group (AWG) website. The fan is 40 inches in diameter, which represents a
mid-size business jet engine. A pre-existing modern containment ring was also included in the
engine that was developed from a previous FAA project focused on multilayer composite fabric
containment systems for gas turbines7 and it is also publically available on the AWG website8. A
generic biconic nosecone was developed for the engine as well.
(a) Front view (b) Oblique view
Figure 5: Assembled generic mid-sized business jet engine model
3.1 JUSTIFICATION
The primary goal of this study is to investigate how several parameters in a UAV ingestion (i.e.,
flight conditions, location of impact) affect a typical mid-size business jet engine’s fan blades, fan
containment system, and nosecone. The goal of the model is to capture geometric and material
characteristics consistent with modern mid-size business jet engines and the model is not intended
to represent a specific engine in service.
The size of the engine was chosen to be the same as previous FAA studies focused on analyzing
fan containment models7 and fan blade out studies5 used for a generic mid-size business jets. Rep-
resentative engines in this class size are given in Table 1.
8
Table 1: Mid-size business jet engines and their fan diameter
Engine Business Jets Fan Diameter Company
PW306B Dornier 328JET 44.8" Pratt & Whitney Canada
TFE731 Learjets, Gulfstream G100 39" Garrett/Honeywell
AE3007 Cessna Citation X, Embraer ERJ
145 family
38.5" Rolls Royce
CFE738 Dassault Falcon 2000 35.5" CFE company
HTF7000 Cessna Citation Longitude, Gulf-
stream G280, Embraer Legacy
500/450
34.2" Honeywell
Two sets of fan blades were created to represent fan blades in the 40 inch diameter business class
engines that are (1) thin and (2) thick. These blades were derived from the FBO model5 and mod-
ified with industry input to make their dimensions reasonable with respect to current fan blade
thicknesses and geometries for solid titanium blades. These blade thicknesses and geometries were
chosen to be reflective of a range of fan blades thicknesses for 40 inch diameter engines so that
blade thickness could be one of the parameters studied in this investigation; however, these para-
metric models are not supposed to represent any specific engines currently in service. Both blades
are composed of a titanium alloy (Ti-6Al-4V). The two blade geometries chosen are used to illus-
trate the effect of the blade thickness on the ingestion event. It is expected that the damage from
an ingestion event would fall within the range of damages present between the thin and thick in-
gestion cases. It is also expected that the thicker blades will be more robust to foreign object dam-
age; however if the thicker blade is released it is more likely to penetrate the fan containment ring.
Each set of blades was connected to the fan disk from the FBO model5.
The fan containment ring is another critical component of the engine model. A modern contain-
ment ring composed of a multilayer composite fabric wrapped around a metal ring, which was
developed in a previous FAA project7, is used in the engine model. The thicknesses of the alumi-
num ring of 0.18 inches and the Kevlar® wraps of 0.968 inches were selected with industry input
as reasonable thicknesses for a 40 inch diameter fan. The fan containment ring was constructed
around the fans and connected to the upstream and downstream portions of the nacelle from the
FBO model5.
A generic biconic nosecone was also developed for this study to see the effect of a UAV impact
on a generic nosecone. The nosecone is made of aluminum and has a thickness of 0.12 inches. The
nosecone is connected to a transition section, also with a minimum thickness of 0.12 inches, which
is connected to the fan disk.
9
3.2 CAD MODELING
The fan disk geometry was generated using CAD software and information from the FAA FBO
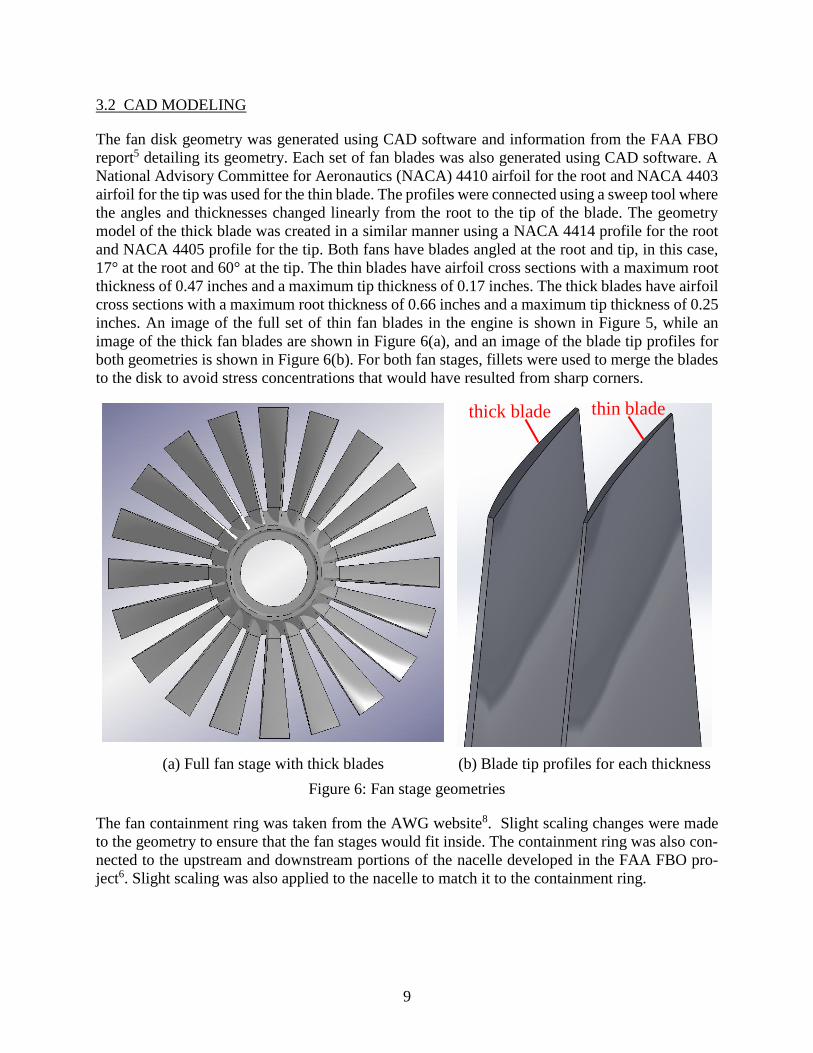
report5 detailing its geometry. Each set of fan blades was also generated using CAD software. A
National Advisory Committee for Aeronautics (NACA) 4410 airfoil for the root and NACA 4403
airfoil for the tip was used for the thin blade. The profiles were connected using a sweep tool where
the angles and thicknesses changed linearly from the root to the tip of the blade. The geometry
model of the thick blade was created in a similar manner using a NACA 4414 profile for the root
and NACA 4405 profile for the tip. Both fans have blades angled at the root and tip, in this case,
17° at the root and 60° at the tip. The thin blades have airfoil cross sections with a maximum root
thickness of 0.47 inches and a maximum tip thickness of 0.17 inches. The thick blades have airfoil
cross sections with a maximum root thickness of 0.66 inches and a maximum tip thickness of 0.25
inches. An image of the full set of thin fan blades in the engine is shown in Figure 5, while an
image of the thick fan blades are shown in Figure 6(a), and an image of the blade tip profiles for
both geometries is shown in Figure 6(b). For both fan stages, fillets were used to merge the blades
to the disk to avoid stress concentrations that would have resulted from sharp corners.
(a) Full fan stage with thick blades (b) Blade tip profiles for each thickness
Figure 6: Fan stage geometries
The fan containment ring was taken from the AWG website8. Slight scaling changes were made
to the geometry to ensure that the fan stages would fit inside. The containment ring was also con-
nected to the upstream and downstream portions of the nacelle developed in the FAA FBO pro-
ject6. Slight scaling was also applied to the nacelle to match it to the containment ring.
thick blade thin blade
10
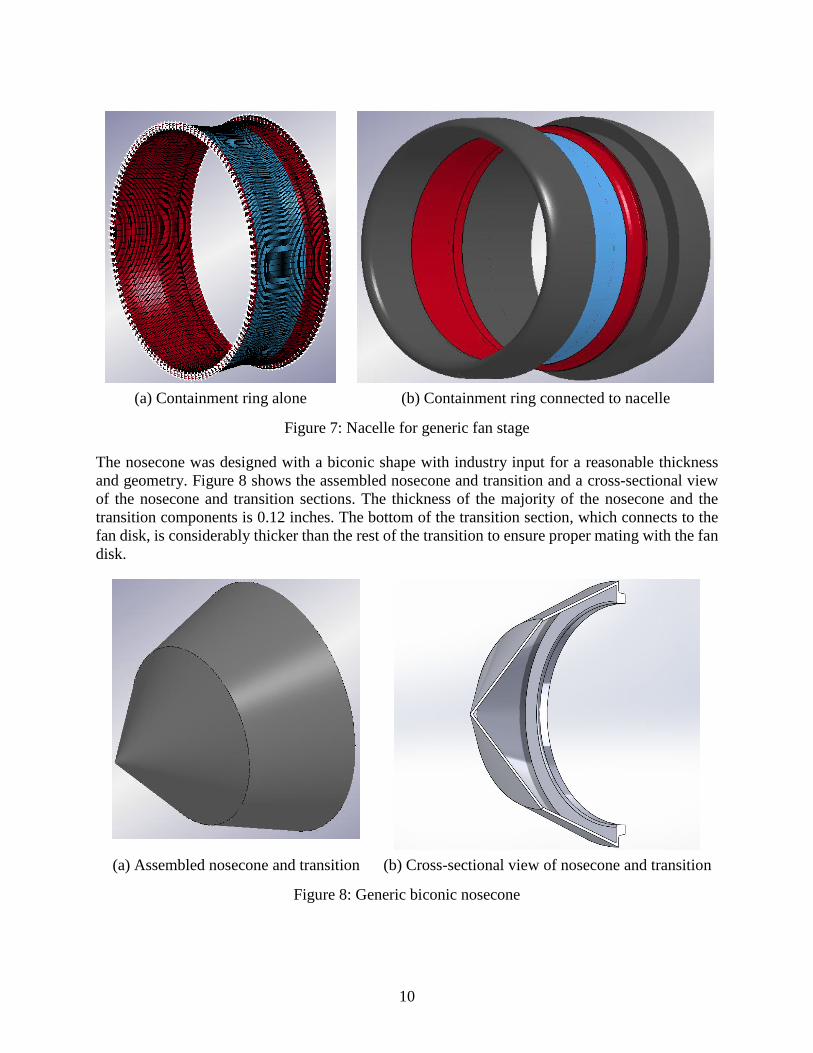
(a) Containment ring alone (b) Containment ring connected to nacelle
Figure 7: Nacelle for generic fan stage
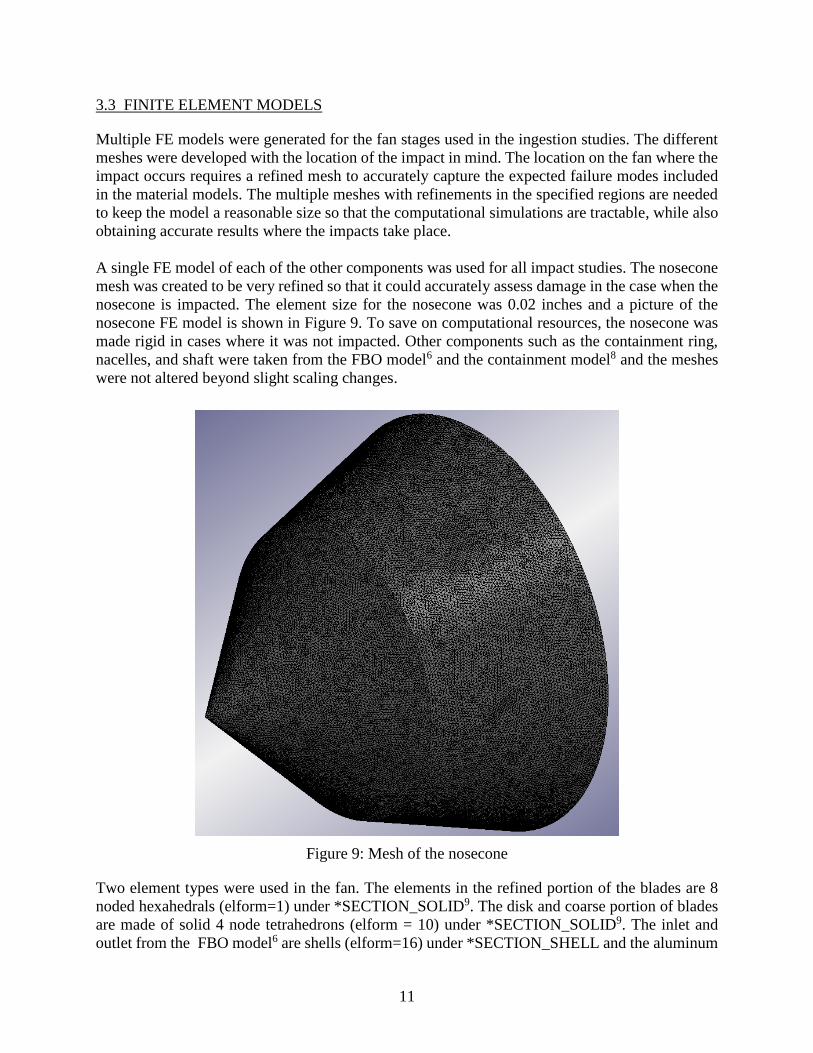
The nosecone was designed with a biconic shape with industry input for a reasonable thickness
and geometry. Figure 8 shows the assembled nosecone and transition and a cross-sectional view
of the nosecone and transition sections. The thickness of the majority of the nosecone and the
transition components is 0.12 inches. The bottom of the transition section, which connects to the
fan disk, is considerably thicker than the rest of the transition to ensure proper mating with the fan
disk.
(a) Assembled nosecone and transition (b) Cross-sectional view of nosecone and transition
Figure 8: Generic biconic nosecone
11
3.3 FINITE ELEMENT MODELS
Multiple FE models were generated for the fan stages used in the ingestion studies. The different
meshes were developed with the location of the impact in mind. The location on the fan where the
impact occurs requires a refined mesh to accurately capture the expected failure modes included
in the material models. The multiple meshes with refinements in the specified regions are needed
to keep the model a reasonable size so that the computational simulations are tractable, while also
obtaining accurate results where the impacts take place.
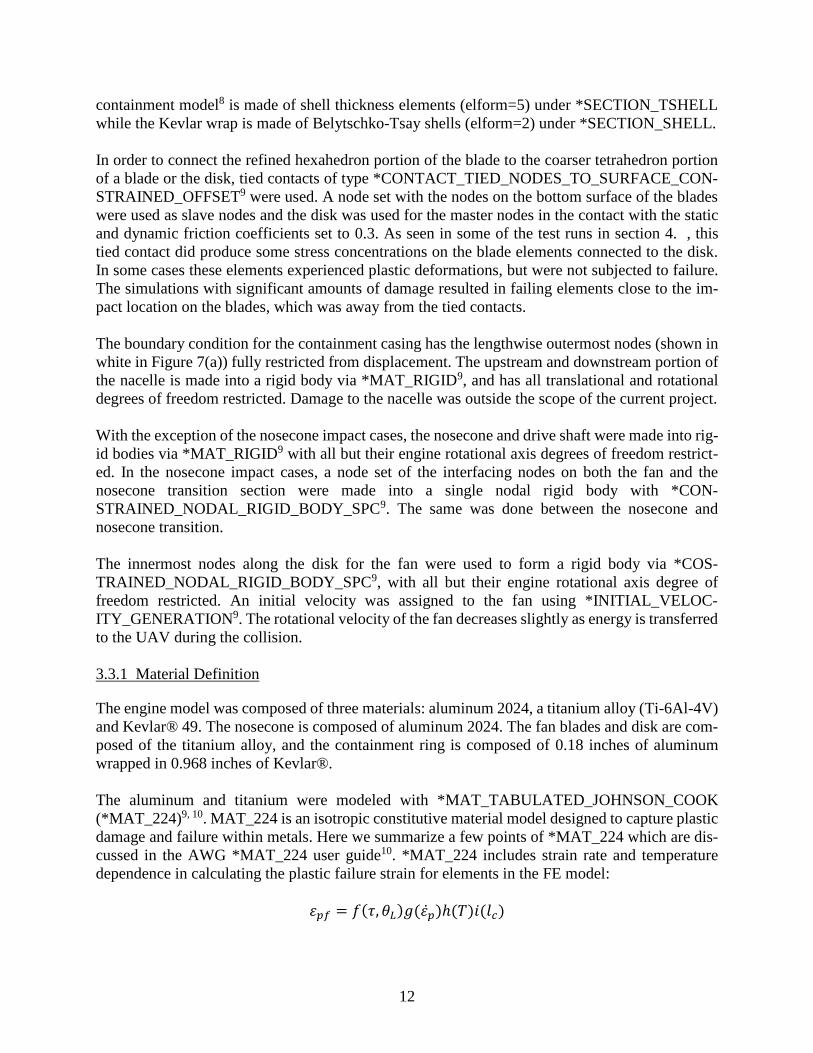
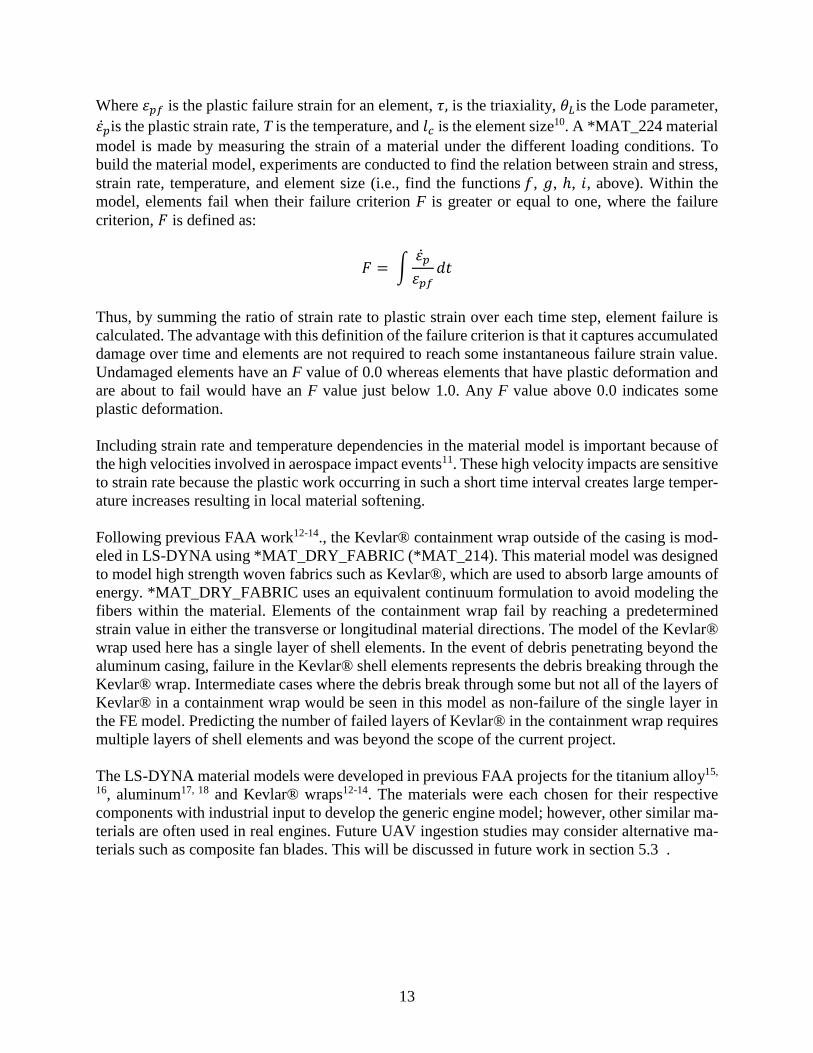
A single FE model of each of the other components was used for all impact studies. The nosecone
mesh was created to be very refined so that it could accurately assess damage in the case when the
nosecone is impacted. The element size for the nosecone was 0.02 inches and a picture of the
nosecone FE model is shown in Figure 9. To save on computational resources, the nosecone was
made rigid in cases where it was not impacted. Other components such as the containment ring,
nacelles, and shaft were taken from the FBO model6 and the containment model8 and the meshes
were not altered beyond slight scaling changes.
Figure 9: Mesh of the nosecone
Two element types were used in the fan. The elements in the refined portion of the blades are 8
noded hexahedrals (elform=1) under *SECTION_SOLID9. The disk and coarse portion of blades
are made of solid 4 node tetrahedrons (elform = 10) under *SECTION_SOLID9. The inlet and
outlet from the FBO model6 are shells (elform=16) under *SECTION_SHELL and the aluminum
12
containment model8 is made of shell thickness elements (elform=5) under *SECTION_TSHELL
while the Kevlar wrap is made of Belytschko-Tsay shells (elform=2) under *SECTION_SHELL.
In order to connect the refined hexahedron portion of the blade to the coarser tetrahedron portion
of a blade or the disk, tied contacts of type *CONTACT_TIED_NODES_TO_SURFACE_CON-
STRAINED_OFFSET9 were used. A node set with the nodes on the bottom surface of the blades
were used as slave nodes and the disk was used for the master nodes in the contact with the static
and dynamic friction coefficients set to 0.3. As seen in some of the test runs in section 4. , this
tied contact did produce some stress concentrations on the blade elements connected to the disk.
In some cases these elements experienced plastic deformations, but were not subjected to failure.
The simulations with significant amounts of damage resulted in failing elements close to the im-
pact location on the blades, which was away from the tied contacts.
The boundary condition for the containment casing has the lengthwise outermost nodes (shown in
white in Figure 7(a)) fully restricted from displacement. The upstream and downstream portion of
the nacelle is made into a rigid body via *MAT_RIGID9, and has all translational and rotational
degrees of freedom restricted. Damage to the nacelle was outside the scope of the current project.
With the exception of the nosecone impact cases, the nosecone and drive shaft were made into rig-
id bodies via *MAT_RIGID9 with all but their engine rotational axis degrees of freedom restrict-
ed. In the nosecone impact cases, a node set of the interfacing nodes on both the fan and the
nosecone transition section were made into a single nodal rigid body with *CON-
STRAINED_NODAL_RIGID_BODY_SPC9. The same was done between the nosecone and
nosecone transition.
The innermost nodes along the disk for the fan were used to form a rigid body via *COS-
TRAINED_NODAL_RIGID_BODY_SPC9, with all but their engine rotational axis degree of
freedom restricted. An initial velocity was assigned to the fan using *INITIAL_VELOC-
ITY_GENERATION9. The rotational velocity of the fan decreases slightly as energy is transferred
to the UAV during the collision.
3.3.1 Material Definition
The engine model was composed of three materials: aluminum 2024, a titanium alloy (Ti-6Al-4V)
and Kevlar® 49. The nosecone is composed of aluminum 2024. The fan blades and disk are com-
posed of the titanium alloy, and the containment ring is composed of 0.18 inches of aluminum
wrapped in 0.968 inches of Kevlar®.
The aluminum and titanium were modeled with *MAT_TABULATED_JOHNSON_COOK
(*MAT_224)9, 10. MAT_224 is an isotropic constitutive material model designed to capture plastic
damage and failure within metals. Here we summarize a few points of *MAT_224 which are dis-
cussed in the AWG *MAT_224 user guide10. *MAT_224 includes strain rate and temperature
dependence in calculating the plastic failure strain for elements in the FE model:
𝜀𝑝𝑓 = 𝑓(𝜏, 𝜃𝐿)𝑔(𝜀�̇�)ℎ(𝑇)𝑖(𝑙𝑐)
13
Where 𝜀𝑝𝑓 is the plastic failure strain for an element, 𝜏, is the triaxiality, 𝜃𝐿is the Lode parameter,
𝜀�̇�is the plastic strain rate, T is the temperature, and 𝑙𝑐 is the element size10. A *MAT_224 material
model is made by measuring the strain of a material under the different loading conditions. To
build the material model, experiments are conducted to find the relation between strain and stress,
strain rate, temperature, and element size (i.e., find the functions 𝑓, 𝑔, ℎ, 𝑖, above). Within the
model, elements fail when their failure criterion F is greater or equal to one, where the failure
criterion, 𝐹 is defined as:
𝐹 = ∫𝜀�̇�
𝜀𝑝𝑓𝑑𝑡
Thus, by summing the ratio of strain rate to plastic strain over each time step, element failure is
calculated. The advantage with this definition of the failure criterion is that it captures accumulated
damage over time and elements are not required to reach some instantaneous failure strain value.
Undamaged elements have an F value of 0.0 whereas elements that have plastic deformation and
are about to fail would have an F value just below 1.0. Any F value above 0.0 indicates some
plastic deformation.
Including strain rate and temperature dependencies in the material model is important because of
the high velocities involved in aerospace impact events11. These high velocity impacts are sensitive
to strain rate because the plastic work occurring in such a short time interval creates large temper-
ature increases resulting in local material softening.
Following previous FAA work12-14., the Kevlar® containment wrap outside of the casing is mod-
eled in LS-DYNA using *MAT_DRY_FABRIC (*MAT_214). This material model was designed
to model high strength woven fabrics such as Kevlar®, which are used to absorb large amounts of
energy. *MAT_DRY_FABRIC uses an equivalent continuum formulation to avoid modeling the
fibers within the material. Elements of the containment wrap fail by reaching a predetermined
strain value in either the transverse or longitudinal material directions. The model of the Kevlar®
wrap used here has a single layer of shell elements. In the event of debris penetrating beyond the
aluminum casing, failure in the Kevlar® shell elements represents the debris breaking through the
Kevlar® wrap. Intermediate cases where the debris break through some but not all of the layers of
Kevlar® in a containment wrap would be seen in this model as non-failure of the single layer in
the FE model. Predicting the number of failed layers of Kevlar® in the containment wrap requires
multiple layers of shell elements and was beyond the scope of the current project.
The LS-DYNA material models were developed in previous FAA projects for the titanium alloy15,
16, aluminum17, 18 and Kevlar® wraps12-14. The materials were each chosen for their respective
components with industrial input to develop the generic engine model; however, other similar ma-
terials are often used in real engines. Future UAV ingestion studies may consider alternative ma-
terials such as composite fan blades. This will be discussed in future work in section 5.3 .
14
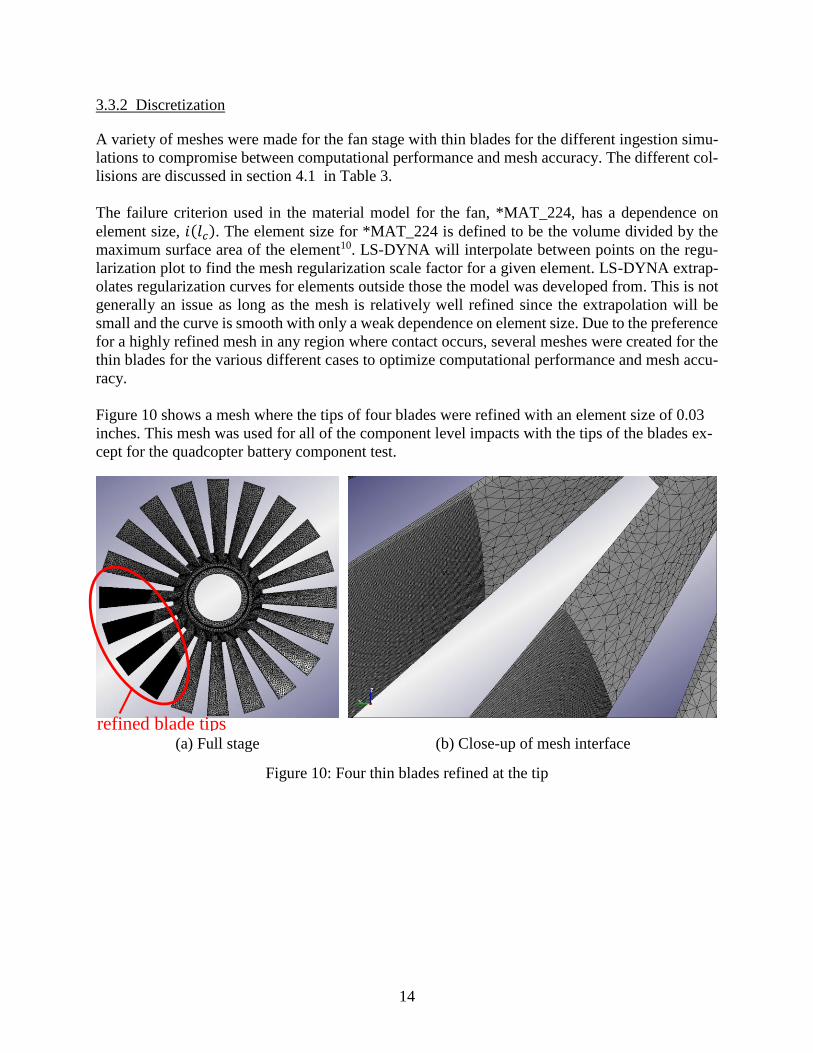
3.3.2 Discretization
A variety of meshes were made for the fan stage with thin blades for the different ingestion simu-
lations to compromise between computational performance and mesh accuracy. The different col-
lisions are discussed in section 4.1 in Table 3.
The failure criterion used in the material model for the fan, *MAT_224, has a dependence on
element size, 𝑖(𝑙𝑐). The element size for *MAT_224 is defined to be the volume divided by the
maximum surface area of the element10. LS-DYNA will interpolate between points on the regu-
larization plot to find the mesh regularization scale factor for a given element. LS-DYNA extrap-
olates regularization curves for elements outside those the model was developed from. This is not
generally an issue as long as the mesh is relatively well refined since the extrapolation will be
small and the curve is smooth with only a weak dependence on element size. Due to the preference
for a highly refined mesh in any region where contact occurs, several meshes were created for the
thin blades for the various different cases to optimize computational performance and mesh accu-
racy.
Figure 10 shows a mesh where the tips of four blades were refined with an element size of 0.03
inches. This mesh was used for all of the component level impacts with the tips of the blades ex-
cept for the quadcopter battery component test.
(a) Full stage (b) Close-up of mesh interface
Figure 10: Four thin blades refined at the tip
refined blade tips
15
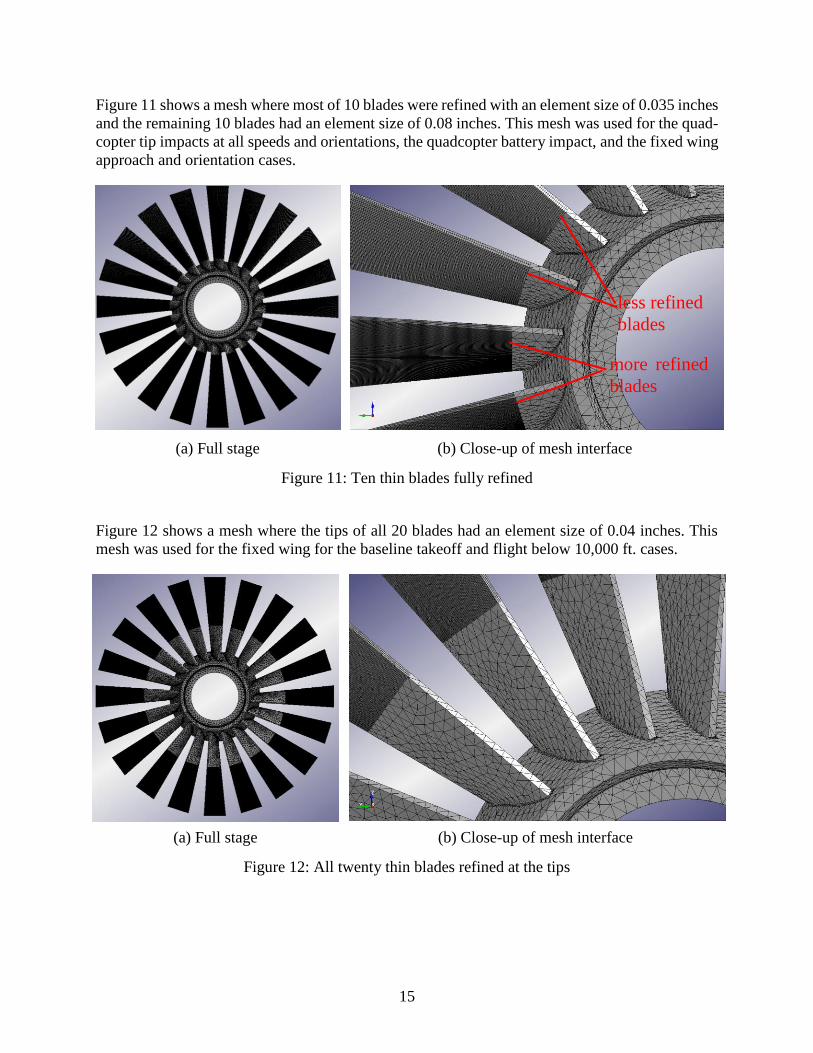
Figure 11 shows a mesh where most of 10 blades were refined with an element size of 0.035 inches
and the remaining 10 blades had an element size of 0.08 inches. This mesh was used for the quad-
copter tip impacts at all speeds and orientations, the quadcopter battery impact, and the fixed wing
approach and orientation cases.
(a) Full stage (b) Close-up of mesh interface
Figure 11: Ten thin blades fully refined
Figure 12 shows a mesh where the tips of all 20 blades had an element size of 0.04 inches. This
mesh was used for the fixed wing for the baseline takeoff and flight below 10,000 ft. cases.
(a) Full stage (b) Close-up of mesh interface
Figure 12: All twenty thin blades refined at the tips
more refined
blades
less refined
blades
16
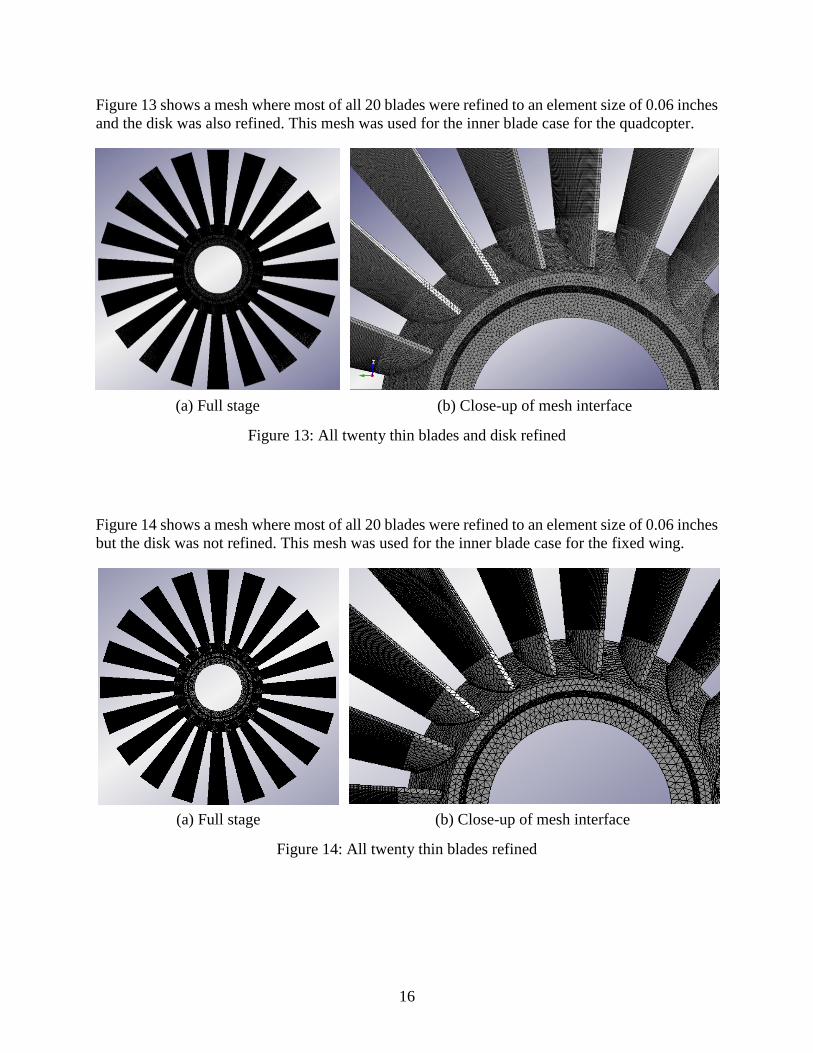
Figure 13 shows a mesh where most of all 20 blades were refined to an element size of 0.06 inches
and the disk was also refined. This mesh was used for the inner blade case for the quadcopter.
(a) Full stage (b) Close-up of mesh interface
Figure 13: All twenty thin blades and disk refined
Figure 14 shows a mesh where most of all 20 blades were refined to an element size of 0.06 inches
but the disk was not refined. This mesh was used for the inner blade case for the fixed wing.
(a) Full stage (b) Close-up of mesh interface
Figure 14: All twenty thin blades refined
17
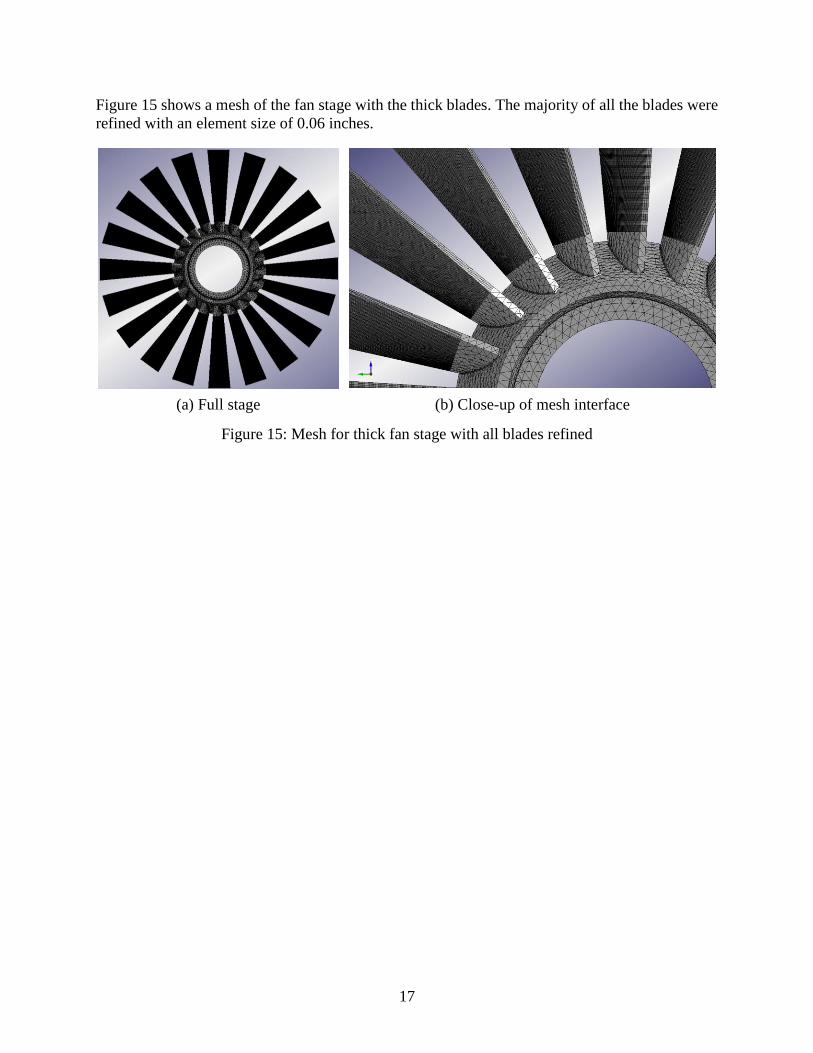
Figure 15 shows a mesh of the fan stage with the thick blades. The majority of all the blades were
refined with an element size of 0.06 inches.
(a) Full stage (b) Close-up of mesh interface
Figure 15: Mesh for thick fan stage with all blades refined
18
4. UAS-FAN COLLISION SIMULATIONS
This chapter discusses the various impact simulations conducted in this initial computational study.
First, a justification of the impact conditions selected for the baseline scenarios is presented. Next,
a classification of the damage levels is discussed. After that, a description of the initial set-up for
the ingestion is provided. Then, the results of each ingestion case for the quadcopter are discussed
and the results are summarized. Finally, the results of each ingestion case for the fixed wing are
discussed and the results are summarized.
4.1 SELECTION OF INGESTION CONDITIONS
The ingestion conditions were chosen to capture three different flight conditions that capture the
most probable high velocity impact scenarios with a UAV: takeoff, approach and flight below
10,000 ft. The operating conditions of the engine were chosen using the FAA General Operating
and Flight Rules (14 CFR Part 91)19 and an FAA Report on the UAV ingestion hazard20. The
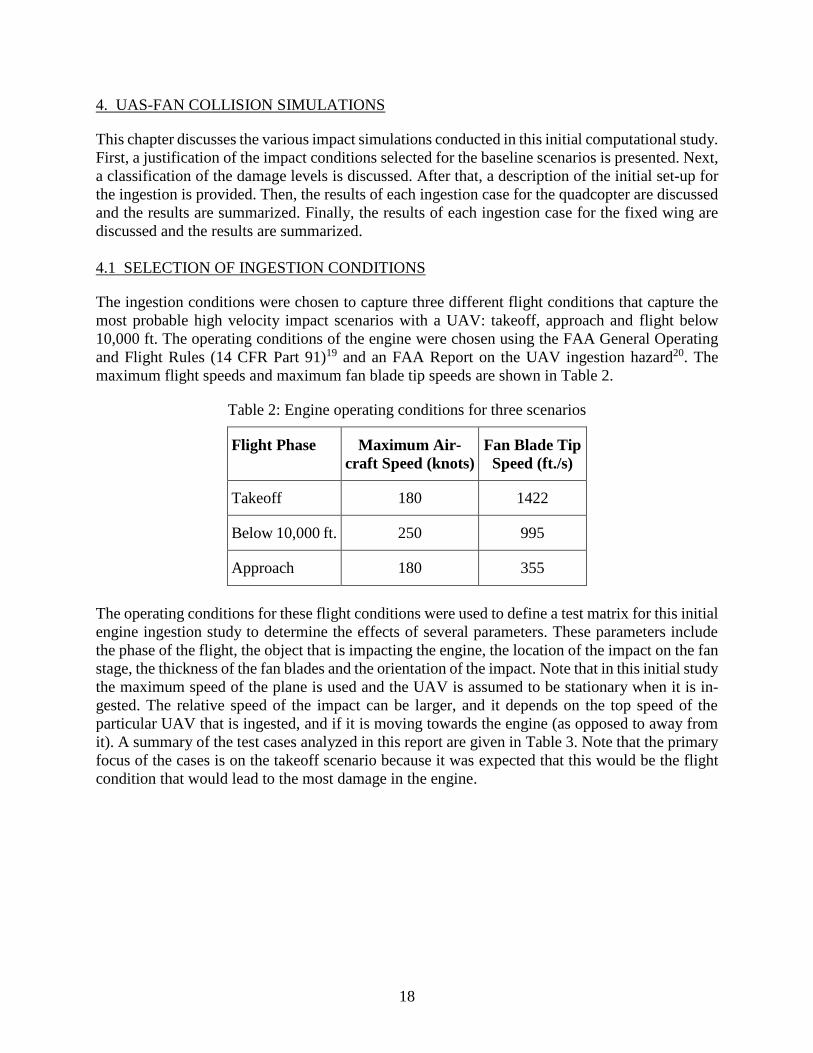
maximum flight speeds and maximum fan blade tip speeds are shown in Table 2.
Table 2: Engine operating conditions for three scenarios
Flight Phase Maximum Air-
craft Speed (knots)
Fan Blade Tip
Speed (ft./s)
Takeoff 180 1422
Below 10,000 ft. 250 995
Approach 180 355
The operating conditions for these flight conditions were used to define a test matrix for this initial
engine ingestion study to determine the effects of several parameters. These parameters include
the phase of the flight, the object that is impacting the engine, the location of the impact on the fan
stage, the thickness of the fan blades and the orientation of the impact. Note that in this initial study
the maximum speed of the plane is used and the UAV is assumed to be stationary when it is in-
gested. The relative speed of the impact can be larger, and it depends on the top speed of the
particular UAV that is ingested, and if it is moving towards the engine (as opposed to away from
it). A summary of the test cases analyzed in this report are given in Table 3. Note that the primary
focus of the cases is on the takeoff scenario because it was expected that this would be the flight
condition that would lead to the most damage in the engine.
19
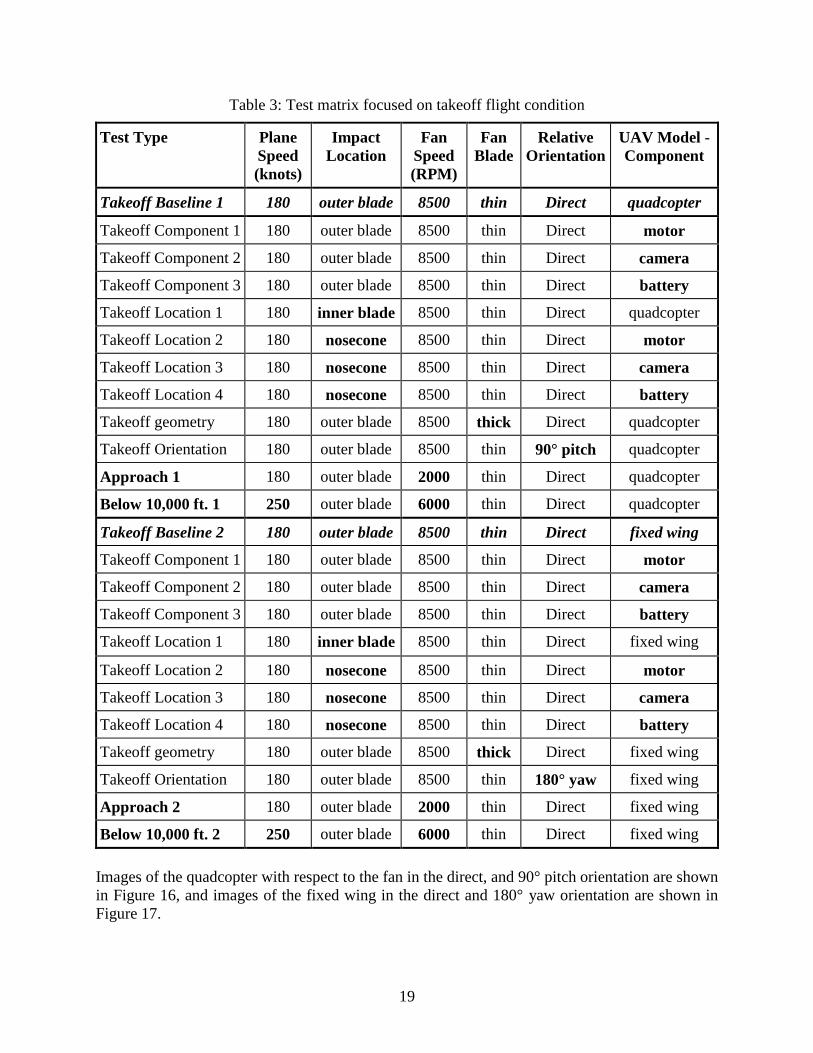
Table 3: Test matrix focused on takeoff flight condition
Test Type Plane
Speed
(knots)
Impact
Location
Fan
Speed
(RPM)
Fan
Blade
Relative
Orientation
UAV Model -
Component
Takeoff Baseline 1 180 outer blade 8500 thin Direct quadcopter
Takeoff Component 1 180 outer blade 8500 thin Direct motor
Takeoff Component 2 180 outer blade 8500 thin Direct camera
Takeoff Component 3 180 outer blade 8500 thin Direct battery
Takeoff Location 1 180 inner blade 8500 thin Direct quadcopter
Takeoff Location 2 180 nosecone 8500 thin Direct motor
Takeoff Location 3 180 nosecone 8500 thin Direct camera
Takeoff Location 4 180 nosecone 8500 thin Direct battery
Takeoff geometry 180 outer blade 8500 thick Direct quadcopter
Takeoff Orientation 180 outer blade 8500 thin 90° pitch quadcopter
Approach 1 180 outer blade 2000 thin Direct quadcopter
Below 10,000 ft. 1 250 outer blade 6000 thin Direct quadcopter
Takeoff Baseline 2 180 outer blade 8500 thin Direct fixed wing
Takeoff Component 1 180 outer blade 8500 thin Direct motor
Takeoff Component 2 180 outer blade 8500 thin Direct camera
Takeoff Component 3 180 outer blade 8500 thin Direct battery
Takeoff Location 1 180 inner blade 8500 thin Direct fixed wing
Takeoff Location 2 180 nosecone 8500 thin Direct motor
Takeoff Location 3 180 nosecone 8500 thin Direct camera
Takeoff Location 4 180 nosecone 8500 thin Direct battery
Takeoff geometry 180 outer blade 8500 thick Direct fixed wing
Takeoff Orientation 180 outer blade 8500 thin 180° yaw fixed wing
Approach 2 180 outer blade 2000 thin Direct fixed wing
Below 10,000 ft. 2 250 outer blade 6000 thin Direct fixed wing
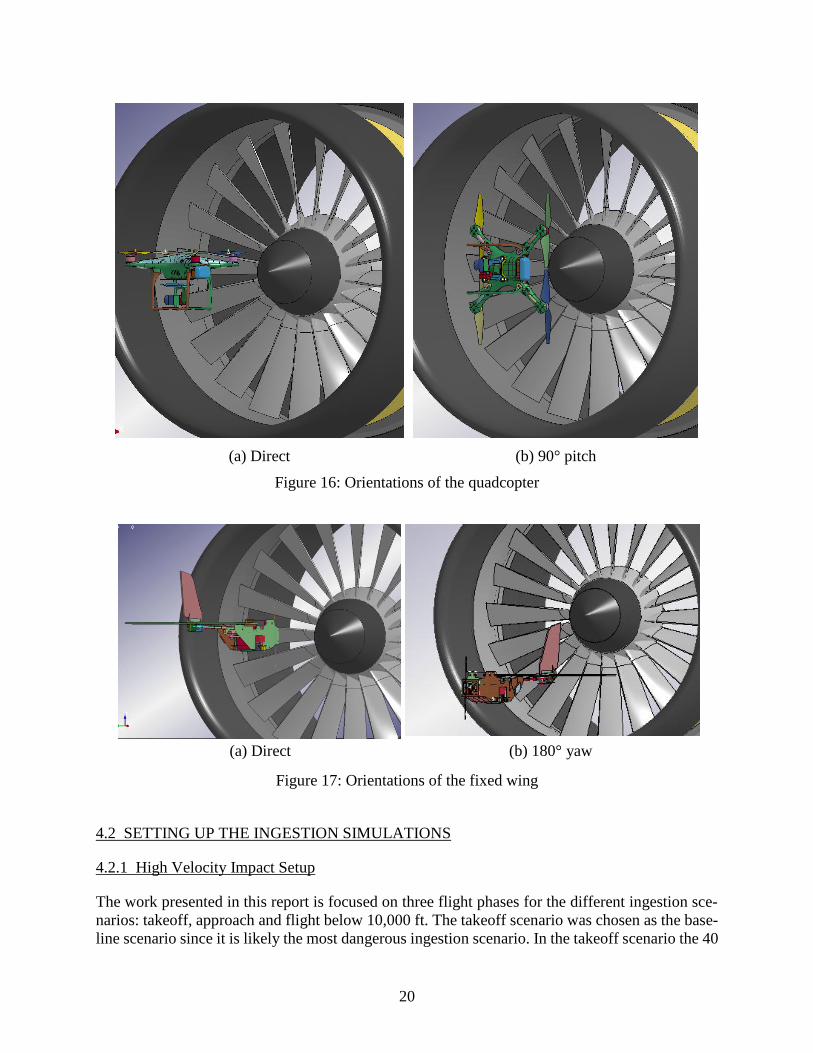
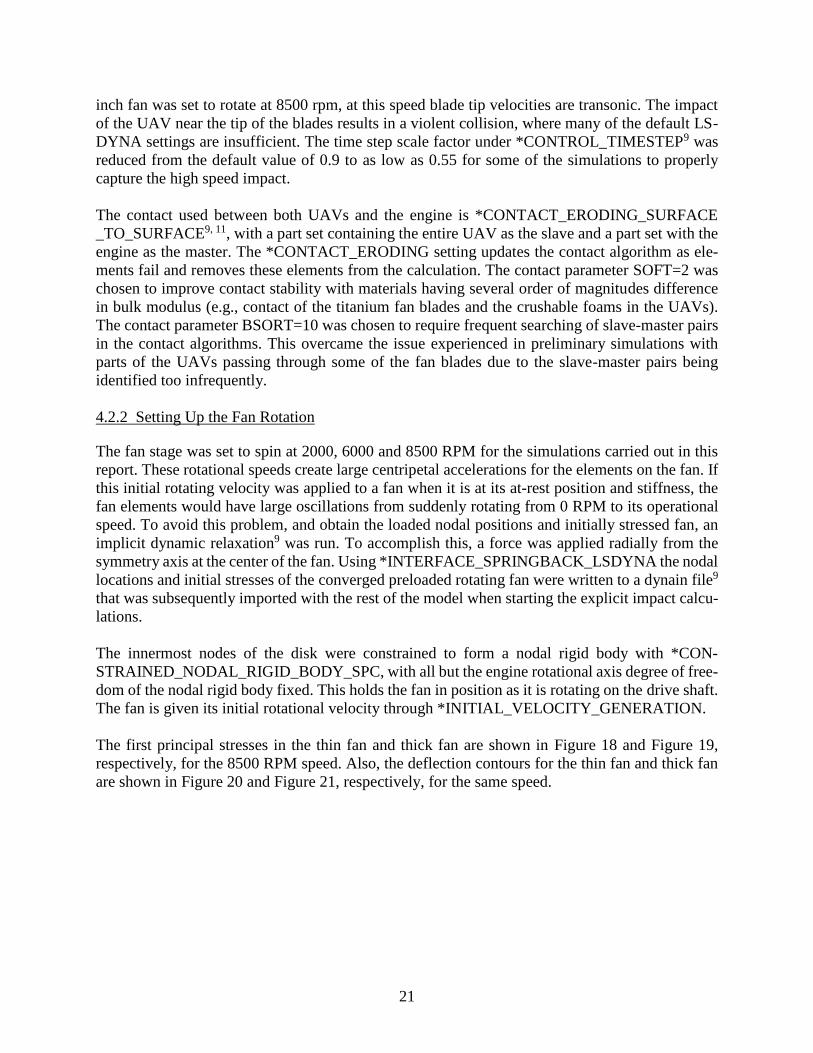
Images of the quadcopter with respect to the fan in the direct, and 90° pitch orientation are shown
in Figure 16, and images of the fixed wing in the direct and 180° yaw orientation are shown in
Figure 17.
20
(a) Direct (b) 90° pitch
Figure 16: Orientations of the quadcopter
(a) Direct (b) 180° yaw
Figure 17: Orientations of the fixed wing
4.2 SETTING UP THE INGESTION SIMULATIONS
4.2.1 High Velocity Impact Setup
The work presented in this report is focused on three flight phases for the different ingestion sce-
narios: takeoff, approach and flight below 10,000 ft. The takeoff scenario was chosen as the base-
line scenario since it is likely the most dangerous ingestion scenario. In the takeoff scenario the 40
21
inch fan was set to rotate at 8500 rpm, at this speed blade tip velocities are transonic. The impact
of the UAV near the tip of the blades results in a violent collision, where many of the default LS-
DYNA settings are insufficient. The time step scale factor under *CONTROL_TIMESTEP9 was
reduced from the default value of 0.9 to as low as 0.55 for some of the simulations to properly
capture the high speed impact.
The contact used between both UAVs and the engine is *CONTACT_ERODING_SURFACE
_TO_SURFACE9, 11, with a part set containing the entire UAV as the slave and a part set with the
engine as the master. The *CONTACT_ERODING setting updates the contact algorithm as ele-
ments fail and removes these elements from the calculation. The contact parameter SOFT=2 was
chosen to improve contact stability with materials having several order of magnitudes difference
in bulk modulus (e.g., contact of the titanium fan blades and the crushable foams in the UAVs).
The contact parameter BSORT=10 was chosen to require frequent searching of slave-master pairs
in the contact algorithms. This overcame the issue experienced in preliminary simulations with
parts of the UAVs passing through some of the fan blades due to the slave-master pairs being
identified too infrequently.
4.2.2 Setting Up the Fan Rotation
The fan stage was set to spin at 2000, 6000 and 8500 RPM for the simulations carried out in this
report. These rotational speeds create large centripetal accelerations for the elements on the fan. If
this initial rotating velocity was applied to a fan when it is at its at-rest position and stiffness, the
fan elements would have large oscillations from suddenly rotating from 0 RPM to its operational
speed. To avoid this problem, and obtain the loaded nodal positions and initially stressed fan, an
implicit dynamic relaxation9 was run. To accomplish this, a force was applied radially from the
symmetry axis at the center of the fan. Using *INTERFACE_SPRINGBACK_LSDYNA the nodal
locations and initial stresses of the converged preloaded rotating fan were written to a dynain file9
that was subsequently imported with the rest of the model when starting the explicit impact calcu-
lations.
The innermost nodes of the disk were constrained to form a nodal rigid body with *CON-
STRAINED_NODAL_RIGID_BODY_SPC, with all but the engine rotational axis degree of free-
dom of the nodal rigid body fixed. This holds the fan in position as it is rotating on the drive shaft.
The fan is given its initial rotational velocity through *INITIAL_VELOCITY_GENERATION.
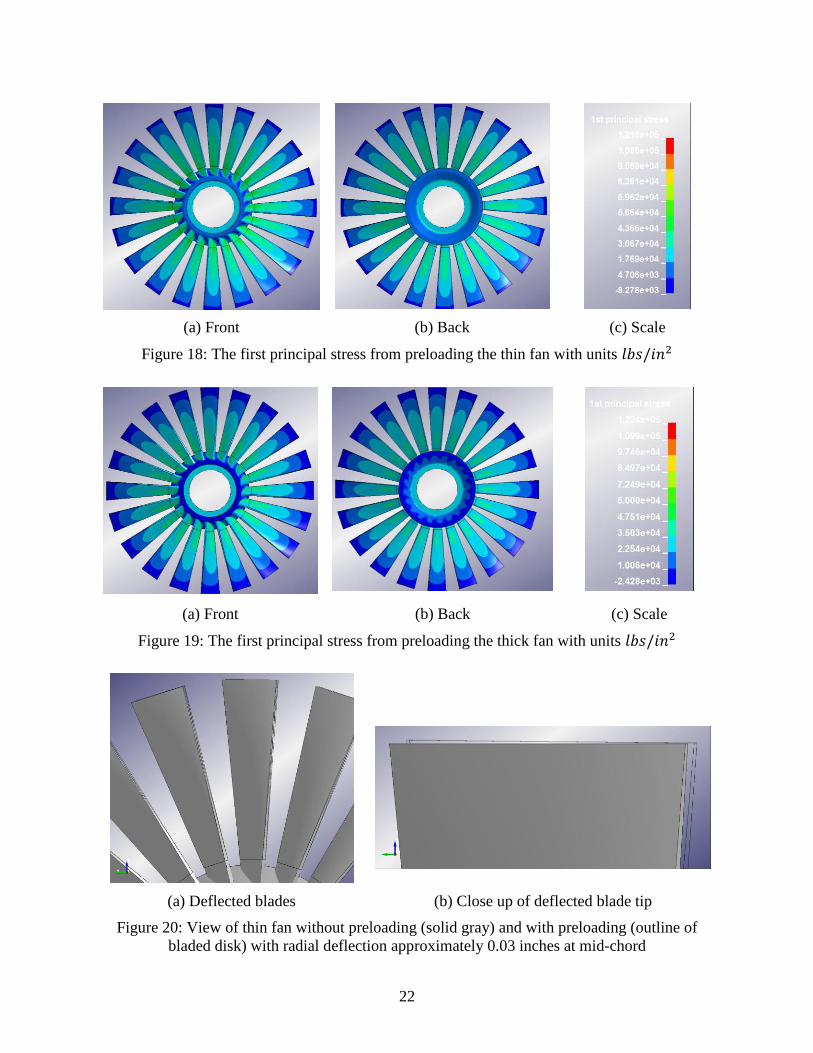
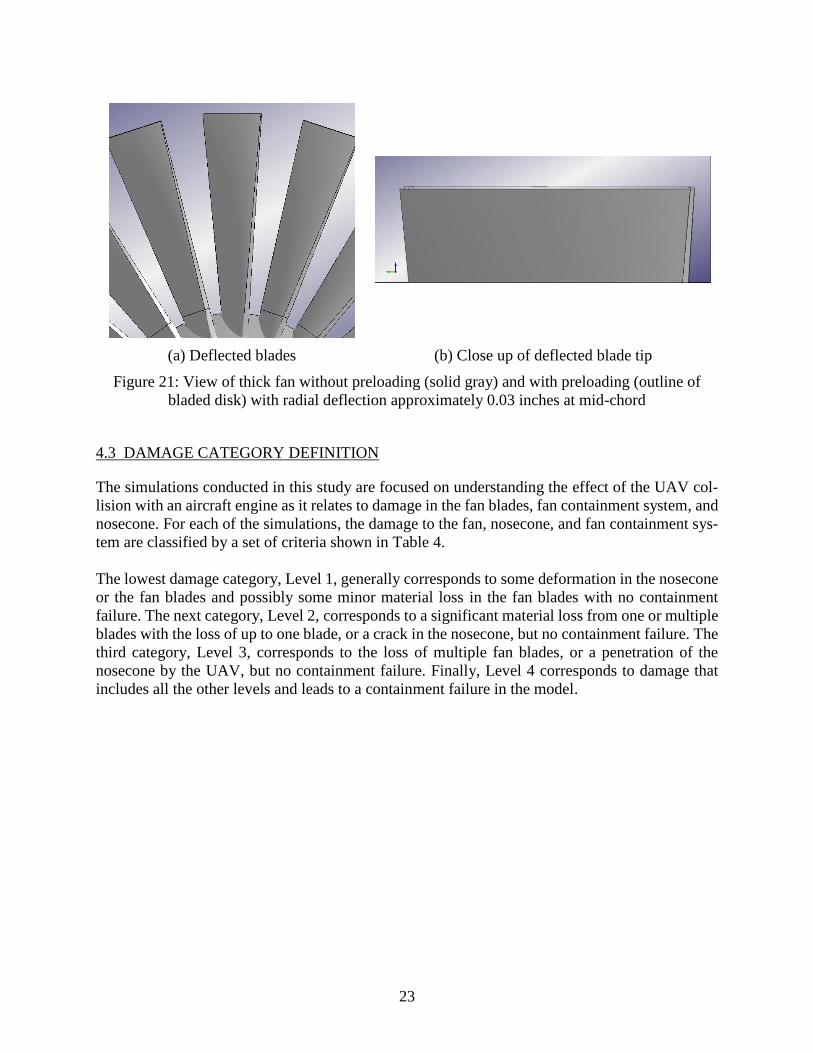
The first principal stresses in the thin fan and thick fan are shown in Figure 18 and Figure 19,
respectively, for the 8500 RPM speed. Also, the deflection contours for the thin fan and thick fan
are shown in Figure 20 and Figure 21, respectively, for the same speed.
22
(a) Front (b) Back (c) Scale
Figure 18: The first principal stress from preloading the thin fan with units 𝑙𝑏𝑠/𝑖𝑛2
(a) Front (b) Back (c) Scale
Figure 19: The first principal stress from preloading the thick fan with units 𝑙𝑏𝑠/𝑖𝑛2
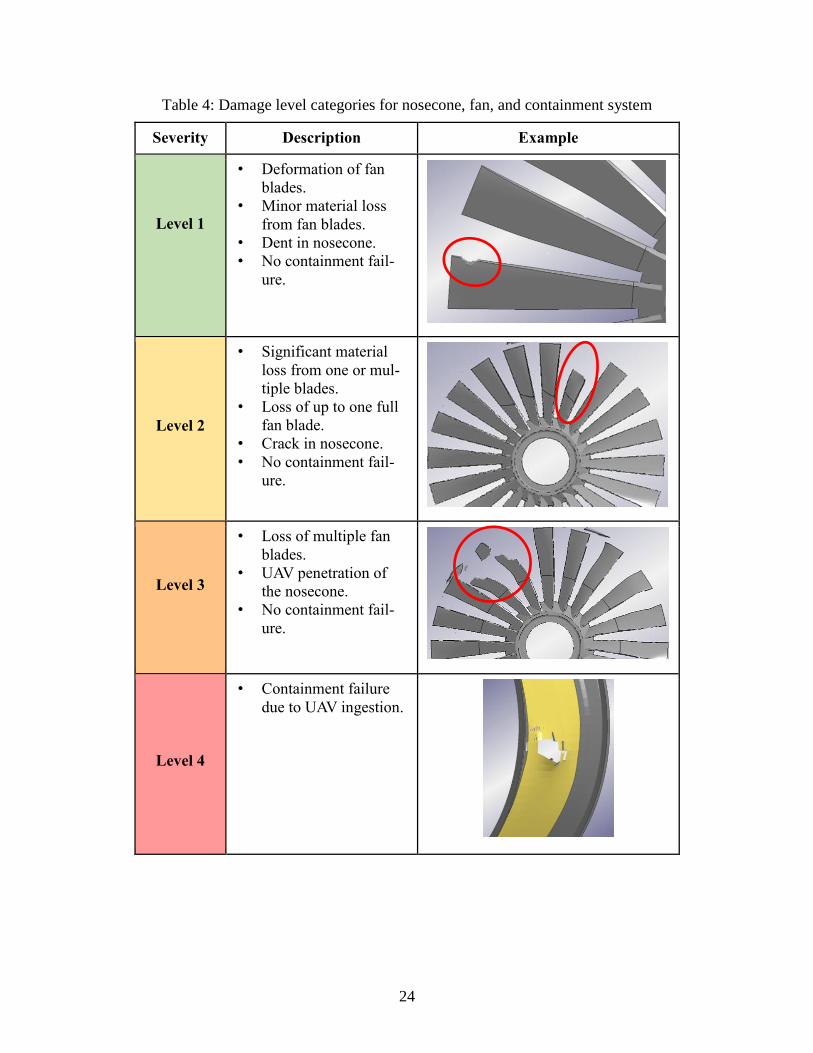
(a) Deflected blades (b) Close up of deflected blade tip
Figure 20: View of thin fan without preloading (solid gray) and with preloading (outline of
bladed disk) with radial deflection approximately 0.03 inches at mid-chord
23
(a) Deflected blades (b) Close up of deflected blade tip
Figure 21: View of thick fan without preloading (solid gray) and with preloading (outline of
bladed disk) with radial deflection approximately 0.03 inches at mid-chord
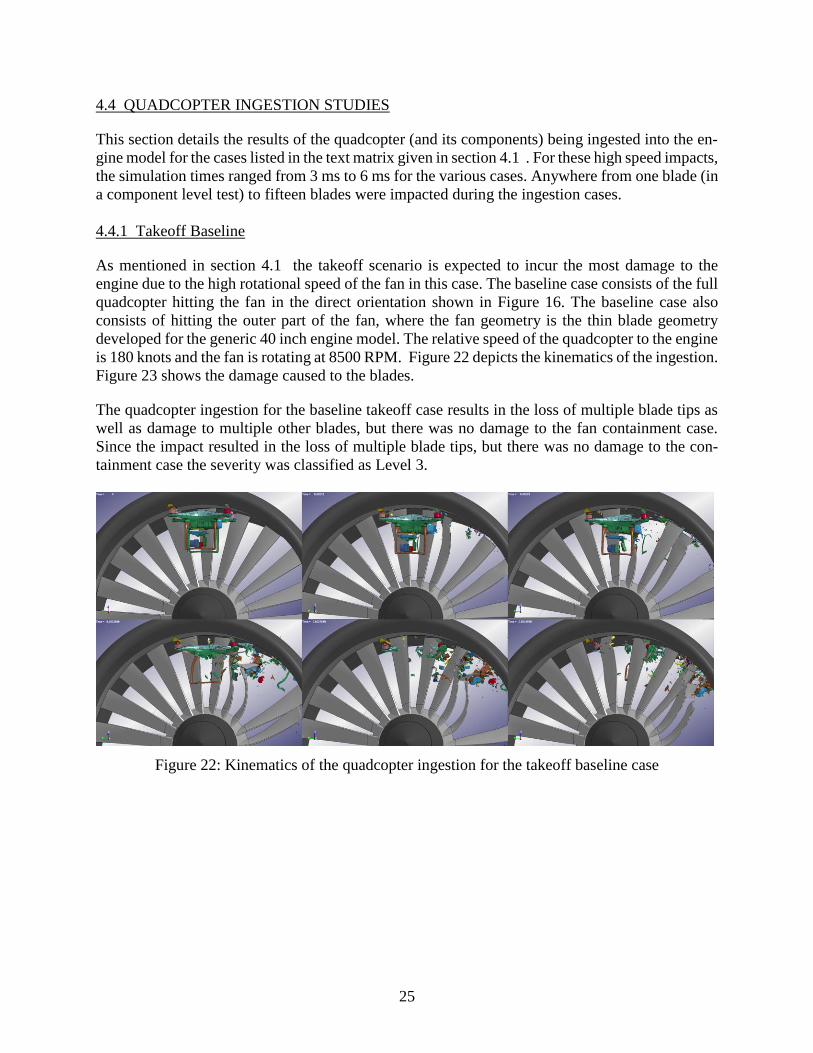
4.3 DAMAGE CATEGORY DEFINITION
The simulations conducted in this study are focused on understanding the effect of the UAV col-
lision with an aircraft engine as it relates to damage in the fan blades, fan containment system, and
nosecone. For each of the simulations, the damage to the fan, nosecone, and fan containment sys-
tem are classified by a set of criteria shown in Table 4.
The lowest damage category, Level 1, generally corresponds to some deformation in the nosecone
or the fan blades and possibly some minor material loss in the fan blades with no containment
failure. The next category, Level 2, corresponds to a significant material loss from one or multiple
blades with the loss of up to one blade, or a crack in the nosecone, but no containment failure. The
third category, Level 3, corresponds to the loss of multiple fan blades, or a penetration of the
nosecone by the UAV, but no containment failure. Finally, Level 4 corresponds to damage that
includes all the other levels and leads to a containment failure in the model.
24
Table 4: Damage level categories for nosecone, fan, and containment system
Severity Description Example
Level 1
• Deformation of fan
blades.
• Minor material loss
from fan blades.
• Dent in nosecone.
• No containment fail-
ure.
Level 2
• Significant material
loss from one or mul-
tiple blades.
• Loss of up to one full
fan blade.
• Crack in nosecone.
• No containment fail-
ure.
Level 3
• Loss of multiple fan
blades.
• UAV penetration of
the nosecone.
• No containment fail-
ure.
Level 4
• Containment failure
due to UAV ingestion.
25
4.4 QUADCOPTER INGESTION STUDIES
This section details the results of the quadcopter (and its components) being ingested into the en-
gine model for the cases listed in the text matrix given in section 4.1 . For these high speed impacts,
the simulation times ranged from 3 ms to 6 ms for the various cases. Anywhere from one blade (in
a component level test) to fifteen blades were impacted during the ingestion cases.
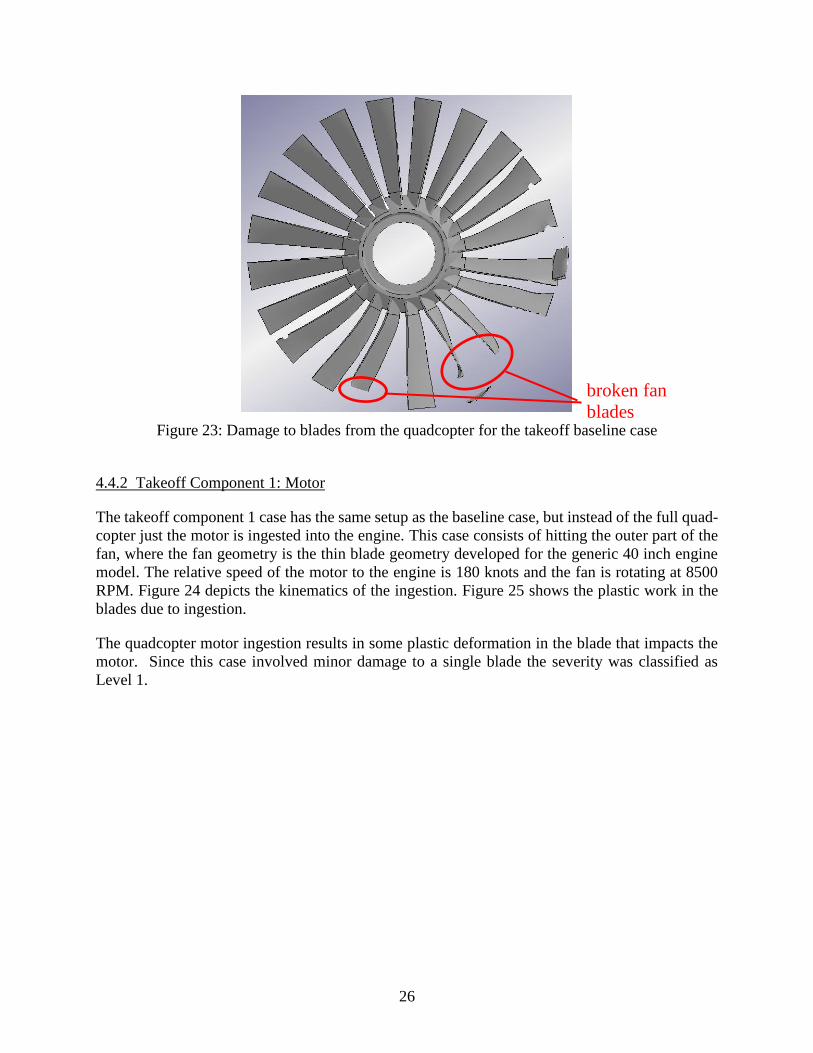
4.4.1 Takeoff Baseline
As mentioned in section 4.1 the takeoff scenario is expected to incur the most damage to the
engine due to the high rotational speed of the fan in this case. The baseline case consists of the full
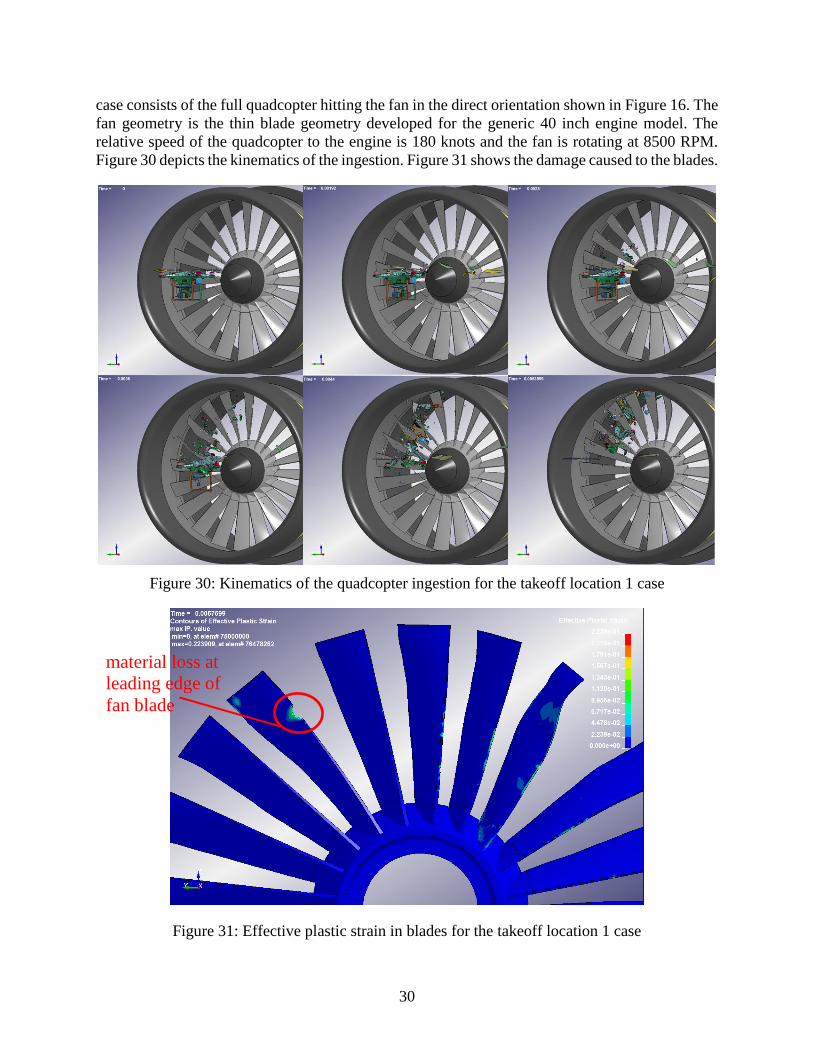
quadcopter hitting the fan in the direct orientation shown in Figure 16. The baseline case also
consists of hitting the outer part of the fan, where the fan geometry is the thin blade geometry
developed for the generic 40 inch engine model. The relative speed of the quadcopter to the engine
is 180 knots and the fan is rotating at 8500 RPM. Figure 22 depicts the kinematics of the ingestion.
Figure 23 shows the damage caused to the blades.
The quadcopter ingestion for the baseline takeoff case results in the loss of multiple blade tips as
well as damage to multiple other blades, but there was no damage to the fan containment case.
Since the impact resulted in the loss of multiple blade tips, but there was no damage to the con-
tainment case the severity was classified as Level 3.
Figure 22: Kinematics of the quadcopter ingestion for the takeoff baseline case
26
Figure 23: Damage to blades from the quadcopter for the takeoff baseline case
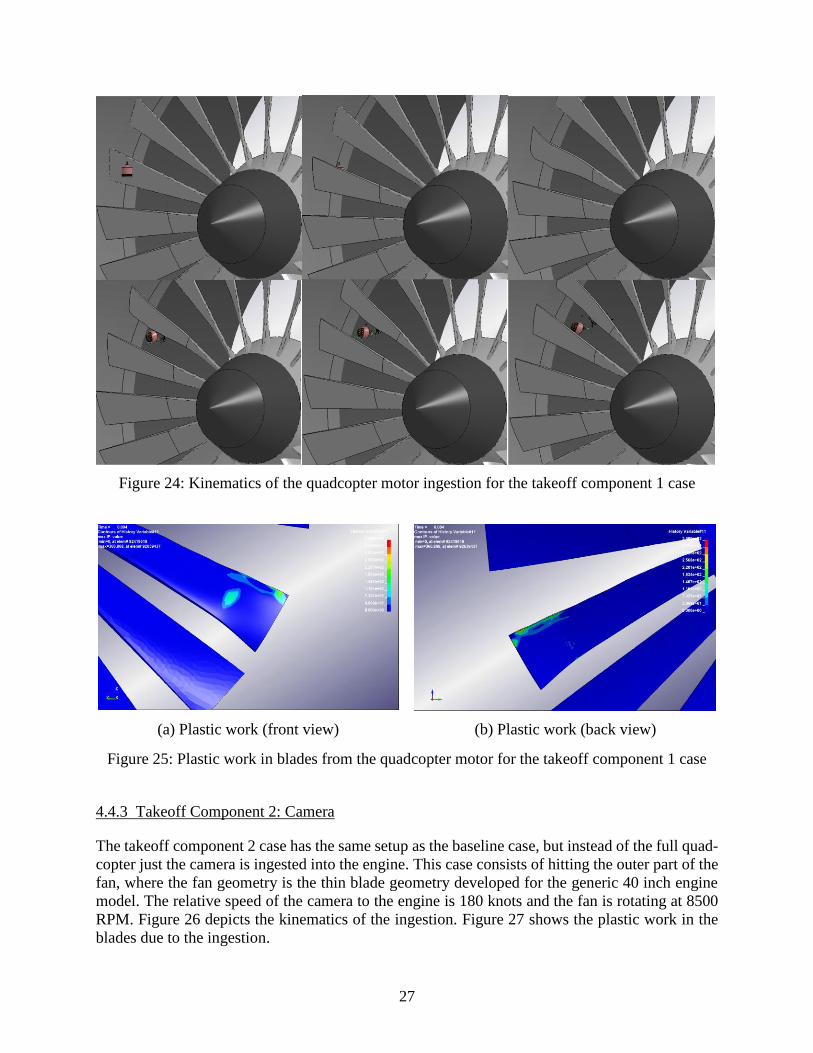
4.4.2 Takeoff Component 1: Motor
The takeoff component 1 case has the same setup as the baseline case, but instead of the full quad-
copter just the motor is ingested into the engine. This case consists of hitting the outer part of the
fan, where the fan geometry is the thin blade geometry developed for the generic 40 inch engine
model. The relative speed of the motor to the engine is 180 knots and the fan is rotating at 8500
RPM. Figure 24 depicts the kinematics of the ingestion. Figure 25 shows the plastic work in the
blades due to ingestion.
The quadcopter motor ingestion results in some plastic deformation in the blade that impacts the
motor. Since this case involved minor damage to a single blade the severity was classified as
Level 1.
broken fan
blades
27
Figure 24: Kinematics of the quadcopter motor ingestion for the takeoff component 1 case
(a) Plastic work (front view) (b) Plastic work (back view)
Figure 25: Plastic work in blades from the quadcopter motor for the takeoff component 1 case
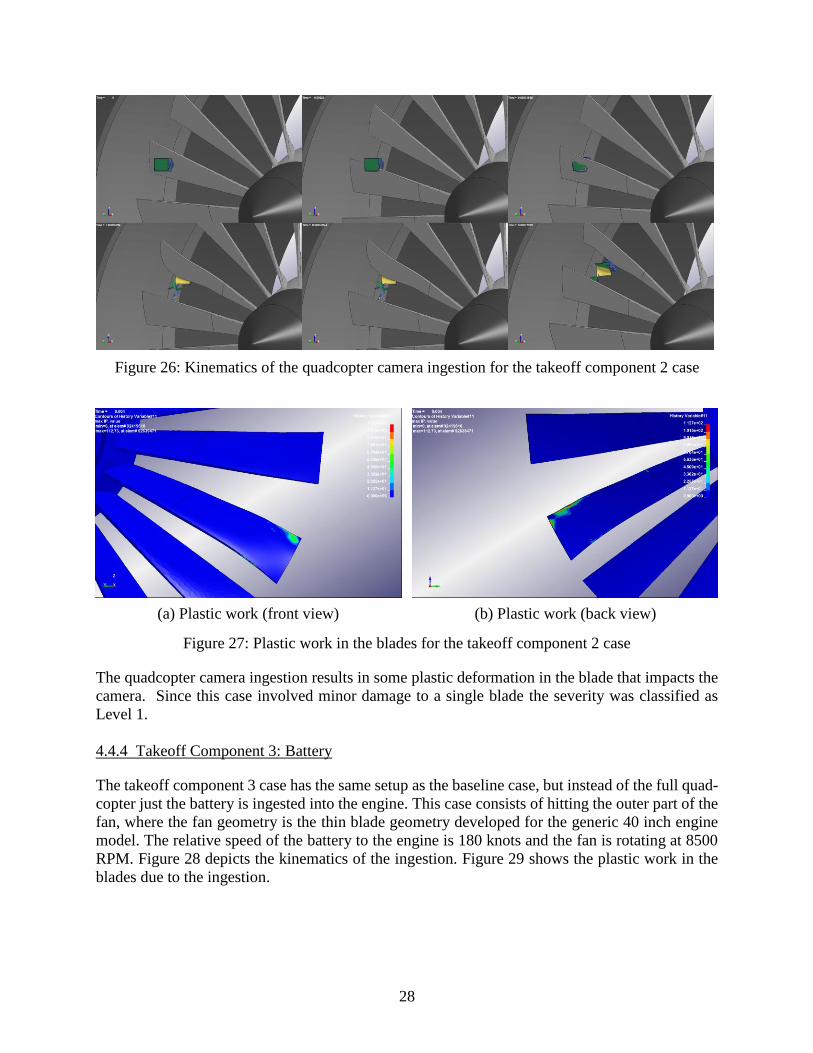
4.4.3 Takeoff Component 2: Camera
The takeoff component 2 case has the same setup as the baseline case, but instead of the full quad-
copter just the camera is ingested into the engine. This case consists of hitting the outer part of the
fan, where the fan geometry is the thin blade geometry developed for the generic 40 inch engine
model. The relative speed of the camera to the engine is 180 knots and the fan is rotating at 8500
RPM. Figure 26 depicts the kinematics of the ingestion. Figure 27 shows the plastic work in the
blades due to the ingestion.
28
Figure 26: Kinematics of the quadcopter camera ingestion for the takeoff component 2 case
(a) Plastic work (front view) (b) Plastic work (back view)
Figure 27: Plastic work in the blades for the takeoff component 2 case
The quadcopter camera ingestion results in some plastic deformation in the blade that impacts the
camera. Since this case involved minor damage to a single blade the severity was classified as
Level 1.
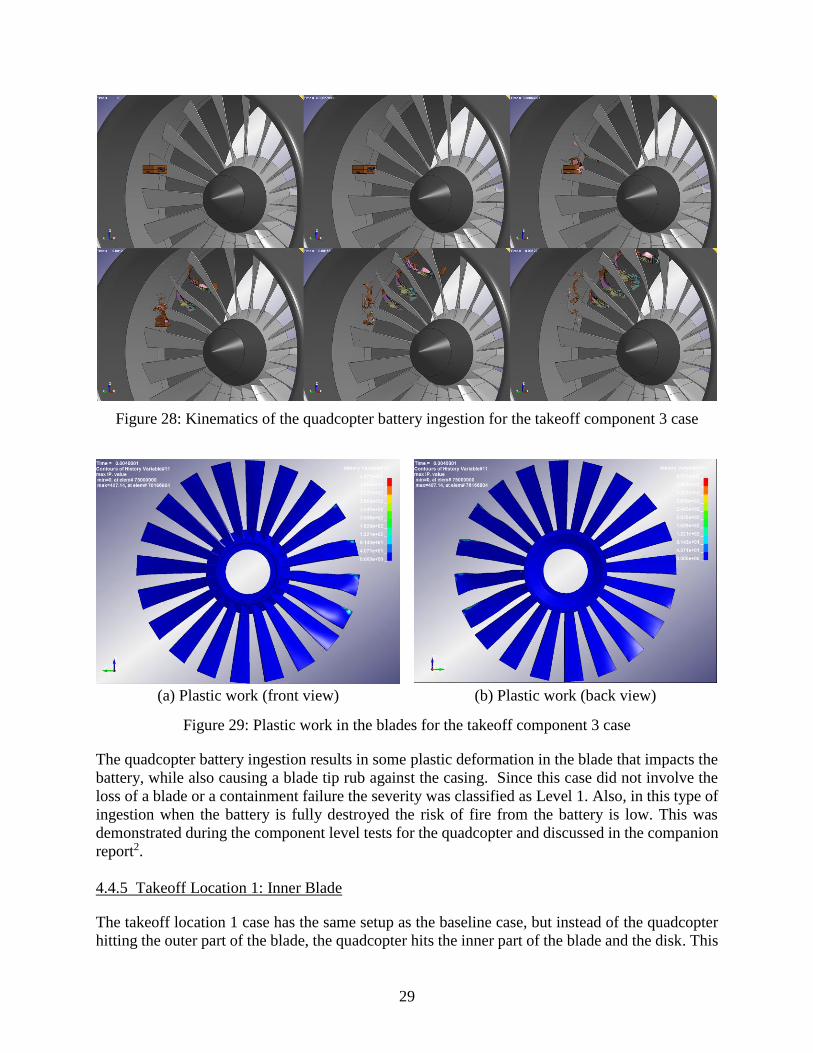
4.4.4 Takeoff Component 3: Battery
The takeoff component 3 case has the same setup as the baseline case, but instead of the full quad-
copter just the battery is ingested into the engine. This case consists of hitting the outer part of the
fan, where the fan geometry is the thin blade geometry developed for the generic 40 inch engine
model. The relative speed of the battery to the engine is 180 knots and the fan is rotating at 8500
RPM. Figure 28 depicts the kinematics of the ingestion. Figure 29 shows the plastic work in the
blades due to the ingestion.
29
Figure 28: Kinematics of the quadcopter battery ingestion for the takeoff component 3 case
(a) Plastic work (front view) (b) Plastic work (back view)
Figure 29: Plastic work in the blades for the takeoff component 3 case
The quadcopter battery ingestion results in some plastic deformation in the blade that impacts the
battery, while also causing a blade tip rub against the casing. Since this case did not involve the
loss of a blade or a containment failure the severity was classified as Level 1. Also, in this type of
ingestion when the battery is fully destroyed the risk of fire from the battery is low. This was
demonstrated during the component level tests for the quadcopter and discussed in the companion
report2.
4.4.5 Takeoff Location 1: Inner Blade
The takeoff location 1 case has the same setup as the baseline case, but instead of the quadcopter
hitting the outer part of the blade, the quadcopter hits the inner part of the blade and the disk. This
30
case consists of the full quadcopter hitting the fan in the direct orientation shown in Figure 16. The
fan geometry is the thin blade geometry developed for the generic 40 inch engine model. The
relative speed of the quadcopter to the engine is 180 knots and the fan is rotating at 8500 RPM.
Figure 30 depicts the kinematics of the ingestion. Figure 31 shows the damage caused to the blades.
Figure 30: Kinematics of the quadcopter ingestion for the takeoff location 1 case
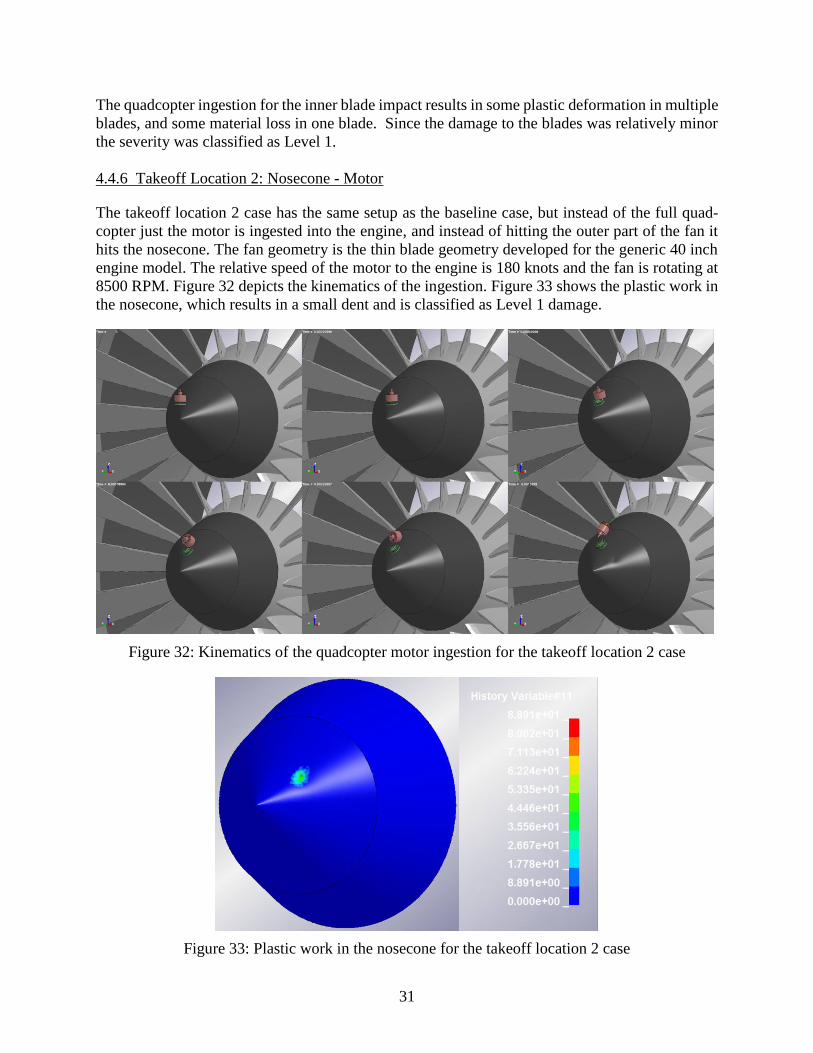
Figure 31: Effective plastic strain in blades for the takeoff location 1 case
material loss at
leading edge of
fan blade
31
The quadcopter ingestion for the inner blade impact results in some plastic deformation in multiple
blades, and some material loss in one blade. Since the damage to the blades was relatively minor
the severity was classified as Level 1.
4.4.6 Takeoff Location 2: Nosecone - Motor
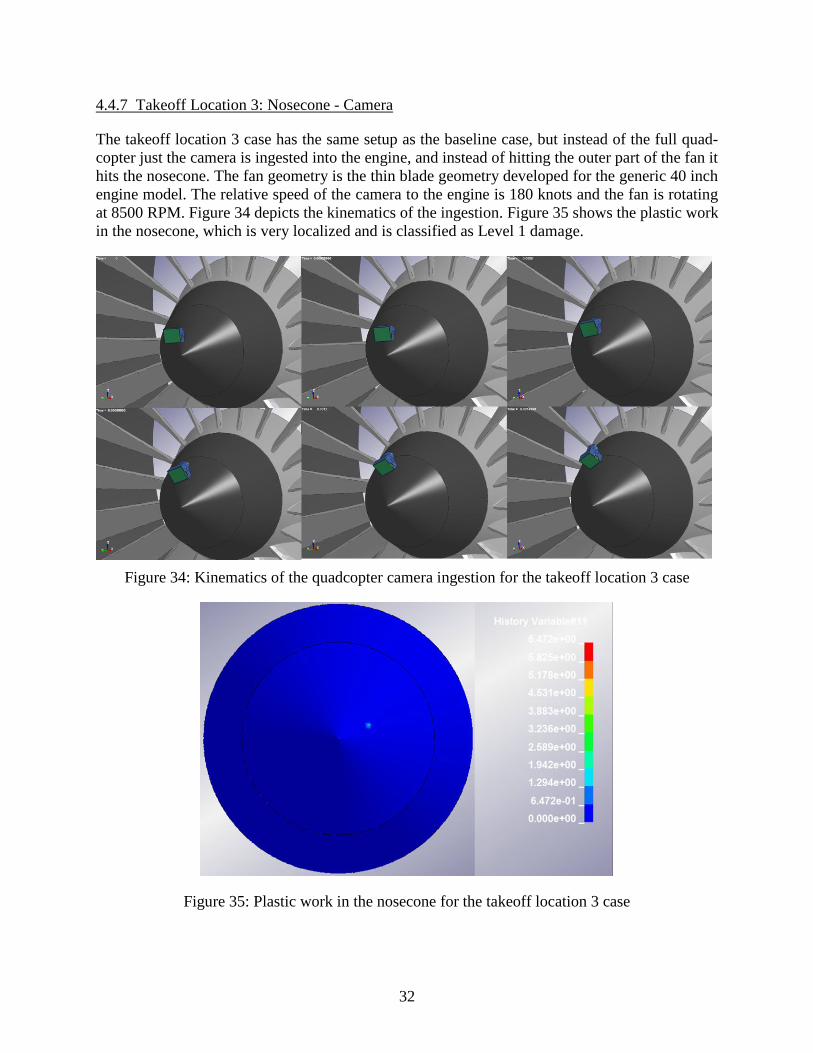
The takeoff location 2 case has the same setup as the baseline case, but instead of the full quad-
copter just the motor is ingested into the engine, and instead of hitting the outer part of the fan it
hits the nosecone. The fan geometry is the thin blade geometry developed for the generic 40 inch
engine model. The relative speed of the motor to the engine is 180 knots and the fan is rotating at
8500 RPM. Figure 32 depicts the kinematics of the ingestion. Figure 33 shows the plastic work in
the nosecone, which results in a small dent and is classified as Level 1 damage.
Figure 32: Kinematics of the quadcopter motor ingestion for the takeoff location 2 case
Figure 33: Plastic work in the nosecone for the takeoff location 2 case
32
4.4.7 Takeoff Location 3: Nosecone - Camera
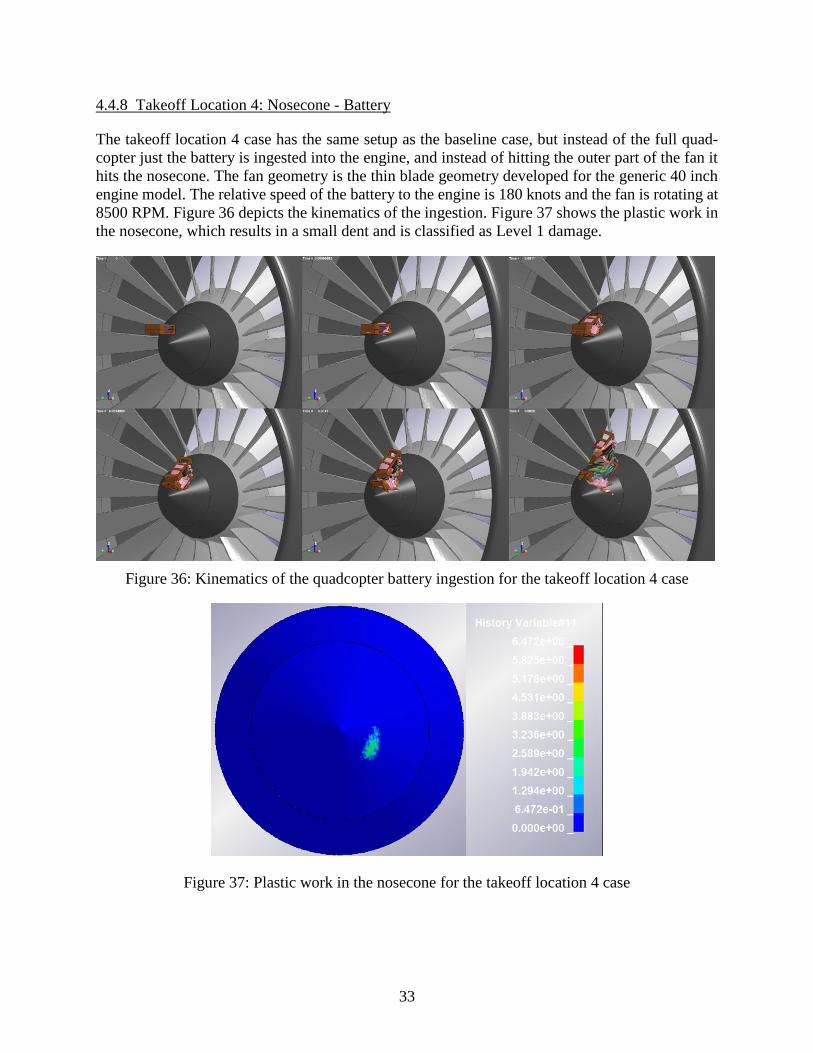
The takeoff location 3 case has the same setup as the baseline case, but instead of the full quad-
copter just the camera is ingested into the engine, and instead of hitting the outer part of the fan it
hits the nosecone. The fan geometry is the thin blade geometry developed for the generic 40 inch
engine model. The relative speed of the camera to the engine is 180 knots and the fan is rotating
at 8500 RPM. Figure 34 depicts the kinematics of the ingestion. Figure 35 shows the plastic work
in the nosecone, which is very localized and is classified as Level 1 damage.
Figure 34: Kinematics of the quadcopter camera ingestion for the takeoff location 3 case
Figure 35: Plastic work in the nosecone for the takeoff location 3 case
33
4.4.8 Takeoff Location 4: Nosecone - Battery
The takeoff location 4 case has the same setup as the baseline case, but instead of the full quad-
copter just the battery is ingested into the engine, and instead of hitting the outer part of the fan it
hits the nosecone. The fan geometry is the thin blade geometry developed for the generic 40 inch
engine model. The relative speed of the battery to the engine is 180 knots and the fan is rotating at
8500 RPM. Figure 36 depicts the kinematics of the ingestion. Figure 37 shows the plastic work in
the nosecone, which results in a small dent and is classified as Level 1 damage.
Figure 36: Kinematics of the quadcopter battery ingestion for the takeoff location 4 case
Figure 37: Plastic work in the nosecone for the takeoff location 4 case
34
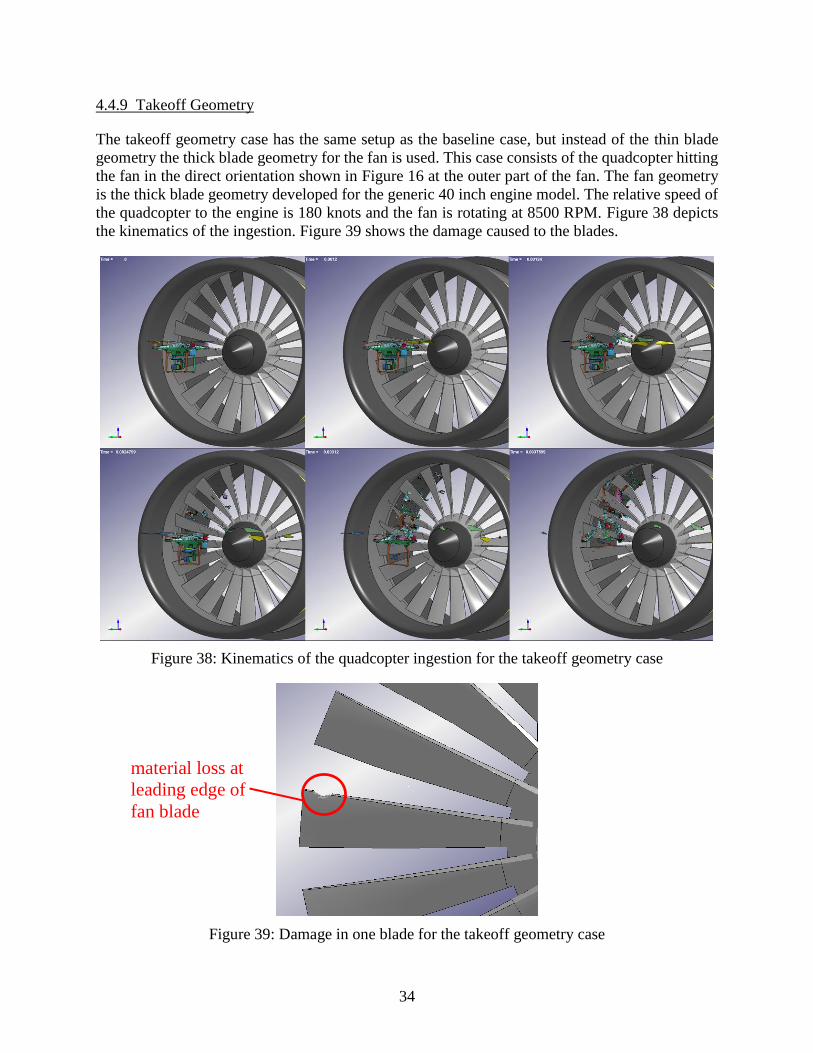
4.4.9 Takeoff Geometry
The takeoff geometry case has the same setup as the baseline case, but instead of the thin blade
geometry the thick blade geometry for the fan is used. This case consists of the quadcopter hitting
the fan in the direct orientation shown in Figure 16 at the outer part of the fan. The fan geometry
is the thick blade geometry developed for the generic 40 inch engine model. The relative speed of
the quadcopter to the engine is 180 knots and the fan is rotating at 8500 RPM. Figure 38 depicts
the kinematics of the ingestion. Figure 39 shows the damage caused to the blades.
Figure 38: Kinematics of the quadcopter ingestion for the takeoff geometry case
Figure 39: Damage in one blade for the takeoff geometry case
material loss at
leading edge of
fan blade
35
The quadcopter ingestion for the thick fan blades results in some minor plastic deformation in
multiple blades, and a little material loss at the leading edge of one blade. Since the overall damage
to the blades was minor the severity was classified as Level 1.
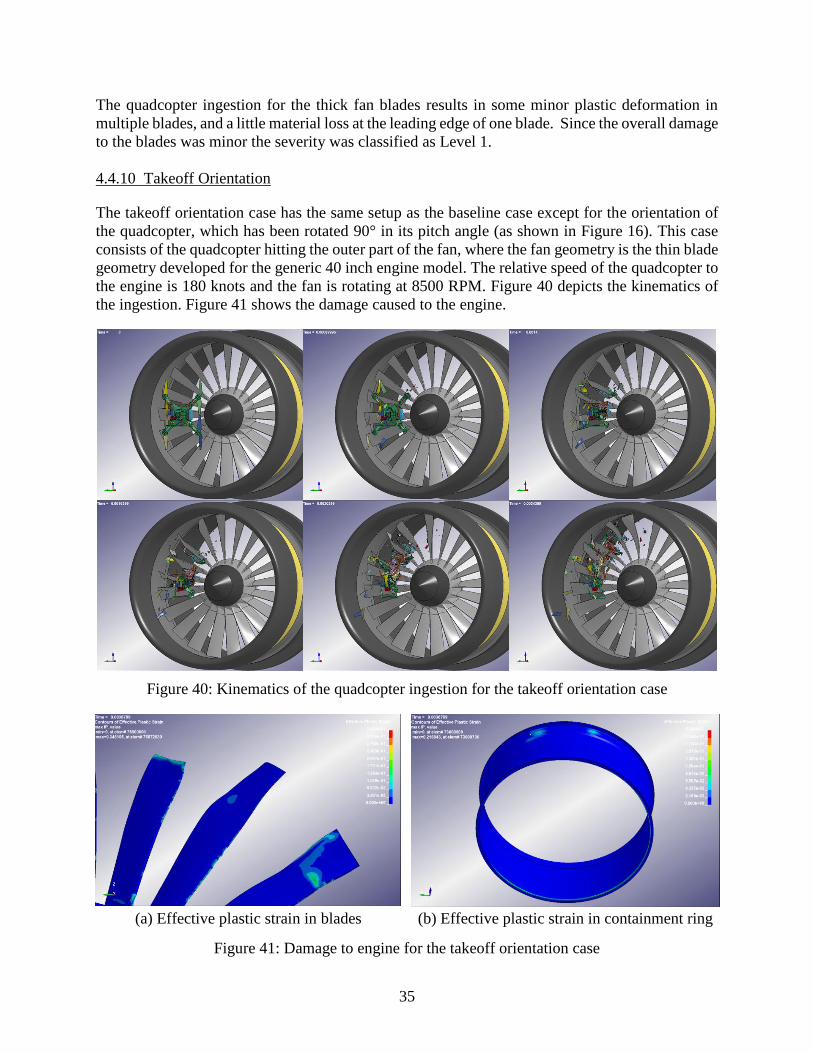
4.4.10 Takeoff Orientation
The takeoff orientation case has the same setup as the baseline case except for the orientation of
the quadcopter, which has been rotated 90° in its pitch angle (as shown in Figure 16). This case
consists of the quadcopter hitting the outer part of the fan, where the fan geometry is the thin blade
geometry developed for the generic 40 inch engine model. The relative speed of the quadcopter to
the engine is 180 knots and the fan is rotating at 8500 RPM. Figure 40 depicts the kinematics of
the ingestion. Figure 41 shows the damage caused to the engine.
Figure 40: Kinematics of the quadcopter ingestion for the takeoff orientation case
(a) Effective plastic strain in blades (b) Effective plastic strain in containment ring
Figure 41: Damage to engine for the takeoff orientation case
36
The quadcopter ingestion for when the quadcopter impacts at a 90° pitch orientation results in the
loss of a blades tip as well as some plastic deformation in additional blades and some plastic strain
in the containment ring. Since the containment ring was not penetrated and only a single blade tip
broke the severity was classified as Level 2.
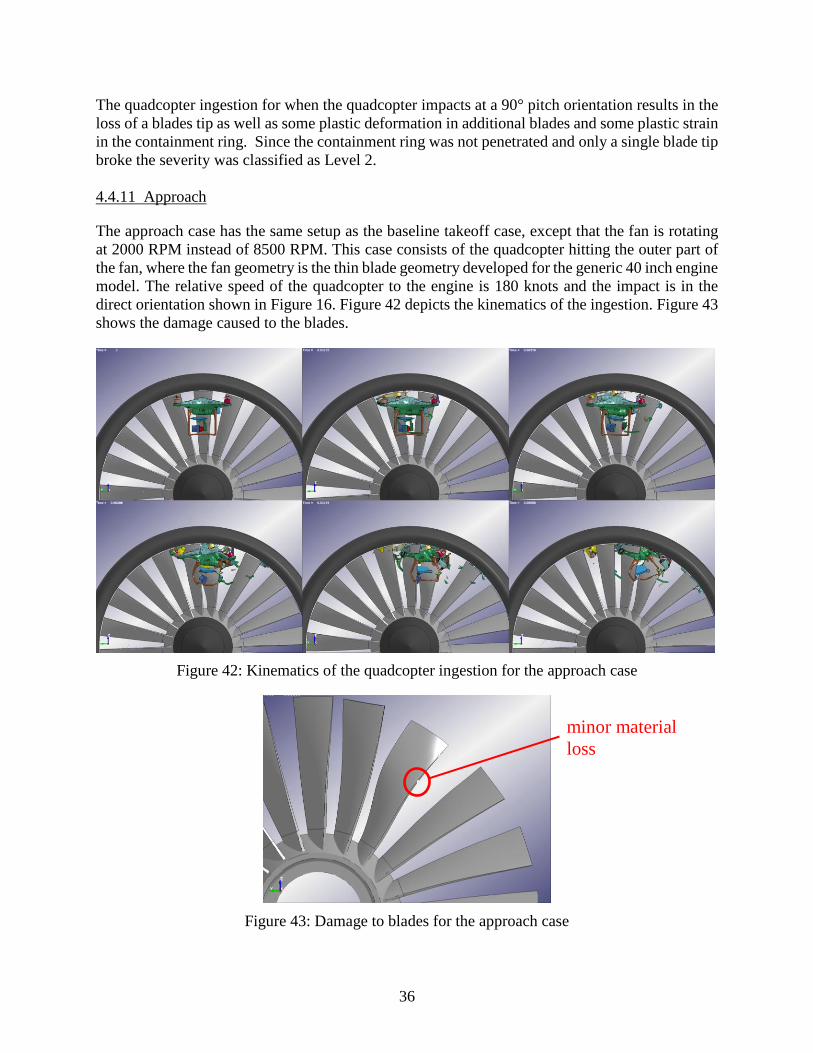
4.4.11 Approach
The approach case has the same setup as the baseline takeoff case, except that the fan is rotating
at 2000 RPM instead of 8500 RPM. This case consists of the quadcopter hitting the outer part of
the fan, where the fan geometry is the thin blade geometry developed for the generic 40 inch engine
model. The relative speed of the quadcopter to the engine is 180 knots and the impact is in the
direct orientation shown in Figure 16. Figure 42 depicts the kinematics of the ingestion. Figure 43
shows the damage caused to the blades.
Figure 42: Kinematics of the quadcopter ingestion for the approach case
Figure 43: Damage to blades for the approach case
minor material
loss
37
The quadcopter ingestion for the approach case results in some minor plastic deformation in mul-
tiple blades, and a little material loss at the leading edge of one blade. Since the overall damage
to the blades was minor the severity was classified as Level 1.
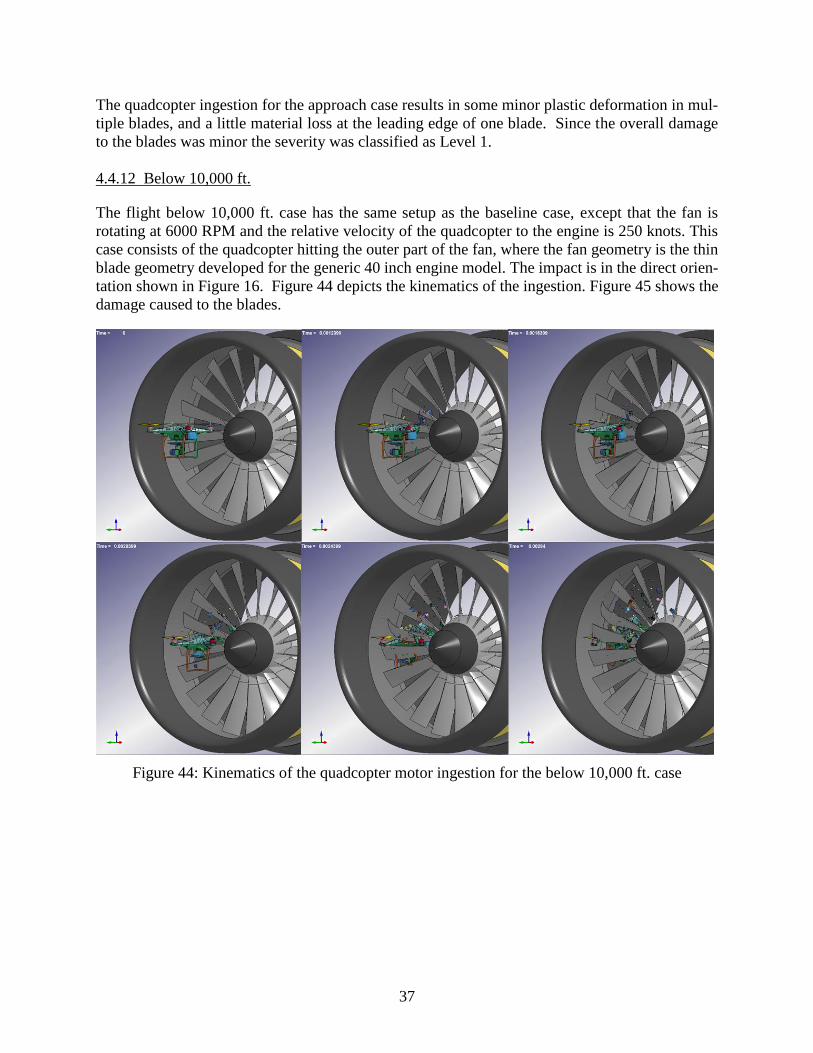
4.4.12 Below 10,000 ft.
The flight below 10,000 ft. case has the same setup as the baseline case, except that the fan is
rotating at 6000 RPM and the relative velocity of the quadcopter to the engine is 250 knots. This
case consists of the quadcopter hitting the outer part of the fan, where the fan geometry is the thin
blade geometry developed for the generic 40 inch engine model. The impact is in the direct orien-
tation shown in Figure 16. Figure 44 depicts the kinematics of the ingestion. Figure 45 shows the
damage caused to the blades.
Figure 44: Kinematics of the quadcopter motor ingestion for the below 10,000 ft. case
38
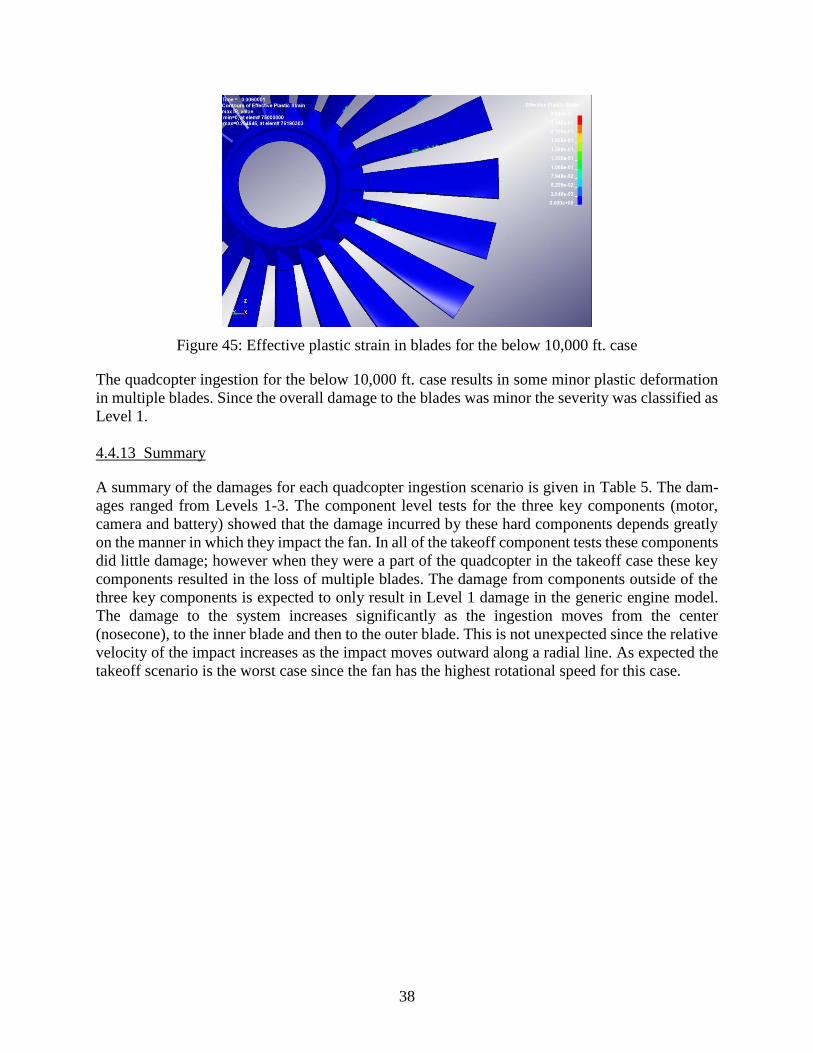
Figure 45: Effective plastic strain in blades for the below 10,000 ft. case
The quadcopter ingestion for the below 10,000 ft. case results in some minor plastic deformation
in multiple blades. Since the overall damage to the blades was minor the severity was classified as
Level 1.
4.4.13 Summary
A summary of the damages for each quadcopter ingestion scenario is given in Table 5. The dam-
ages ranged from Levels 1-3. The component level tests for the three key components (motor,
camera and battery) showed that the damage incurred by these hard components depends greatly
on the manner in which they impact the fan. In all of the takeoff component tests these components
did little damage; however when they were a part of the quadcopter in the takeoff case these key
components resulted in the loss of multiple blades. The damage from components outside of the
three key components is expected to only result in Level 1 damage in the generic engine model.
The damage to the system increases significantly as the ingestion moves from the center
(nosecone), to the inner blade and then to the outer blade. This is not unexpected since the relative
velocity of the impact increases as the impact moves outward along a radial line. As expected the
takeoff scenario is the worst case since the fan has the highest rotational speed for this case.
39
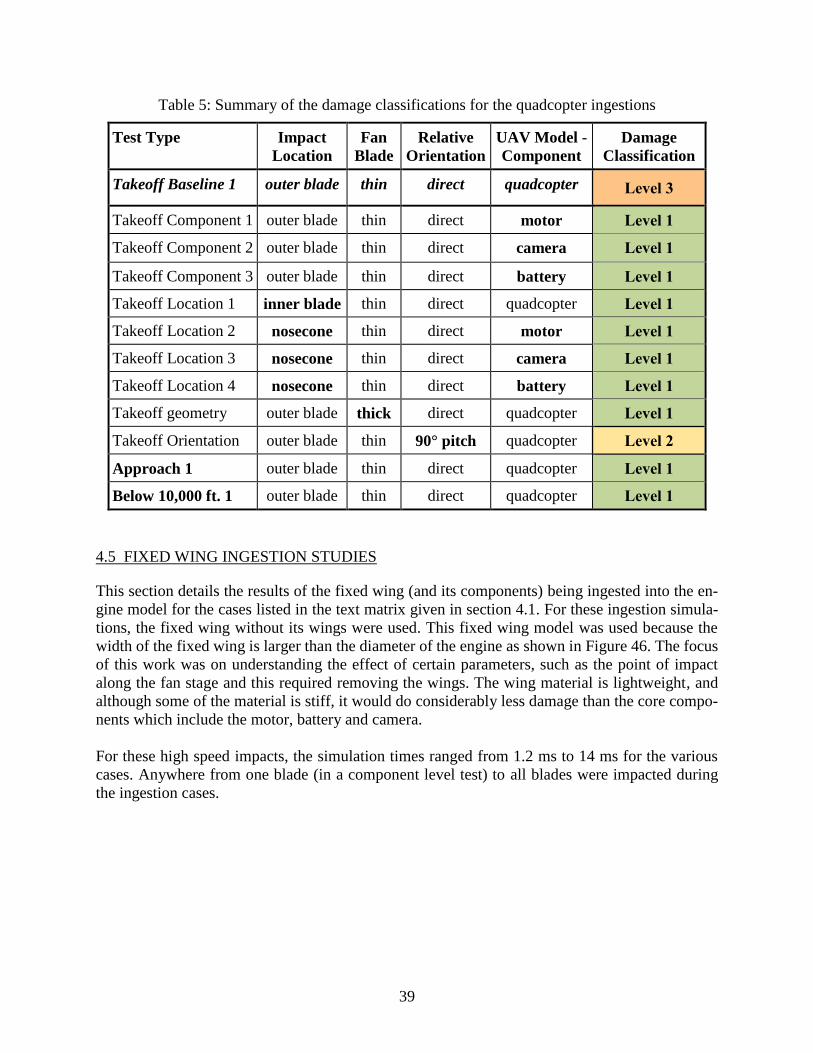
Table 5: Summary of the damage classifications for the quadcopter ingestions
Test Type Impact
Location
Fan
Blade
Relative
Orientation
UAV Model -
Component
Damage
Classification
Takeoff Baseline 1 outer blade thin direct quadcopter Level 3
Takeoff Component 1 outer blade thin direct motor Level 1
Takeoff Component 2 outer blade thin direct camera Level 1
Takeoff Component 3 outer blade thin direct battery Level 1
Takeoff Location 1 inner blade thin direct quadcopter Level 1
Takeoff Location 2 nosecone thin direct motor Level 1
Takeoff Location 3 nosecone thin direct camera Level 1
Takeoff Location 4 nosecone thin direct battery Level 1
Takeoff geometry outer blade thick direct quadcopter Level 1
Takeoff Orientation outer blade thin 90° pitch quadcopter Level 2
Approach 1 outer blade thin direct quadcopter Level 1
Below 10,000 ft. 1 outer blade thin direct quadcopter Level 1
4.5 FIXED WING INGESTION STUDIES
This section details the results of the fixed wing (and its components) being ingested into the en-
gine model for the cases listed in the text matrix given in section 4.1. For these ingestion simula-
tions, the fixed wing without its wings were used. This fixed wing model was used because the
width of the fixed wing is larger than the diameter of the engine as shown in Figure 46. The focus
of this work was on understanding the effect of certain parameters, such as the point of impact
along the fan stage and this required removing the wings. The wing material is lightweight, and
although some of the material is stiff, it would do considerably less damage than the core compo-
nents which include the motor, battery and camera.
For these high speed impacts, the simulation times ranged from 1.2 ms to 14 ms for the various
cases. Anywhere from one blade (in a component level test) to all blades were impacted during
the ingestion cases.
40
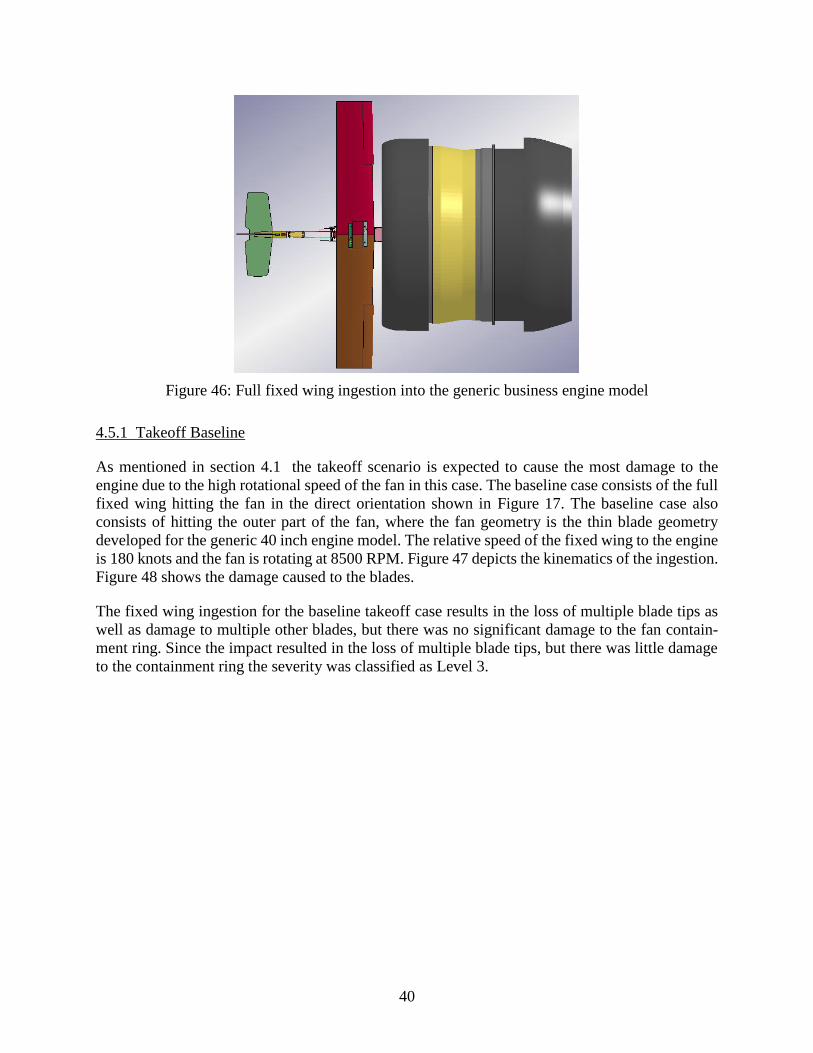
Figure 46: Full fixed wing ingestion into the generic business engine model
4.5.1 Takeoff Baseline
As mentioned in section 4.1 the takeoff scenario is expected to cause the most damage to the
engine due to the high rotational speed of the fan in this case. The baseline case consists of the full
fixed wing hitting the fan in the direct orientation shown in Figure 17. The baseline case also
consists of hitting the outer part of the fan, where the fan geometry is the thin blade geometry
developed for the generic 40 inch engine model. The relative speed of the fixed wing to the engine
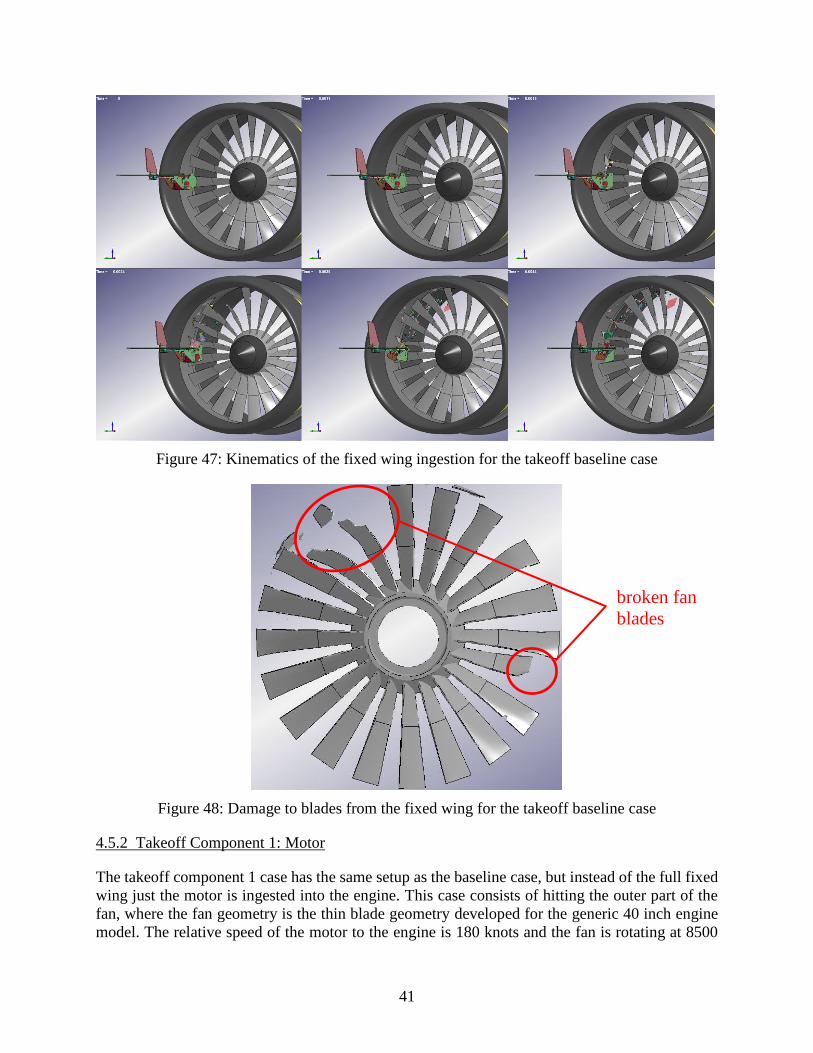
is 180 knots and the fan is rotating at 8500 RPM. Figure 47 depicts the kinematics of the ingestion.
Figure 48 shows the damage caused to the blades.
The fixed wing ingestion for the baseline takeoff case results in the loss of multiple blade tips as
well as damage to multiple other blades, but there was no significant damage to the fan contain-
ment ring. Since the impact resulted in the loss of multiple blade tips, but there was little damage
to the containment ring the severity was classified as Level 3.
41
Figure 47: Kinematics of the fixed wing ingestion for the takeoff baseline case
Figure 48: Damage to blades from the fixed wing for the takeoff baseline case
4.5.2 Takeoff Component 1: Motor
The takeoff component 1 case has the same setup as the baseline case, but instead of the full fixed
wing just the motor is ingested into the engine. This case consists of hitting the outer part of the
fan, where the fan geometry is the thin blade geometry developed for the generic 40 inch engine
model. The relative speed of the motor to the engine is 180 knots and the fan is rotating at 8500
broken fan
blades
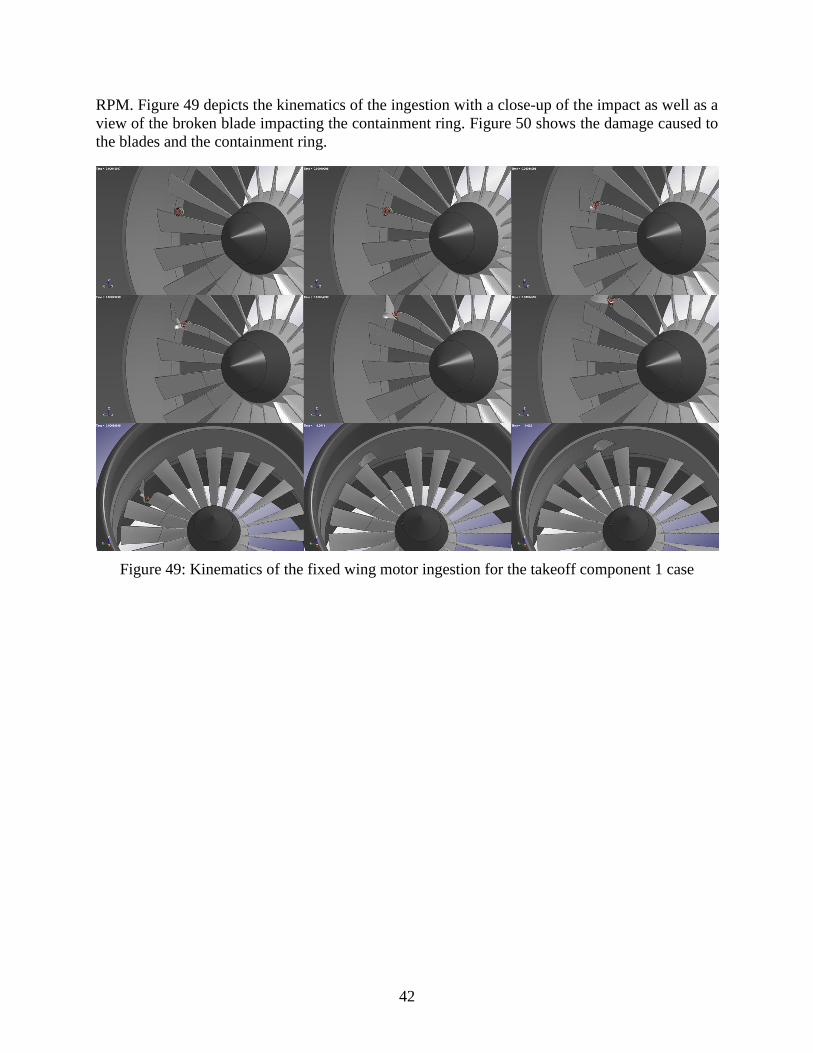
42
RPM. Figure 49 depicts the kinematics of the ingestion with a close-up of the impact as well as a
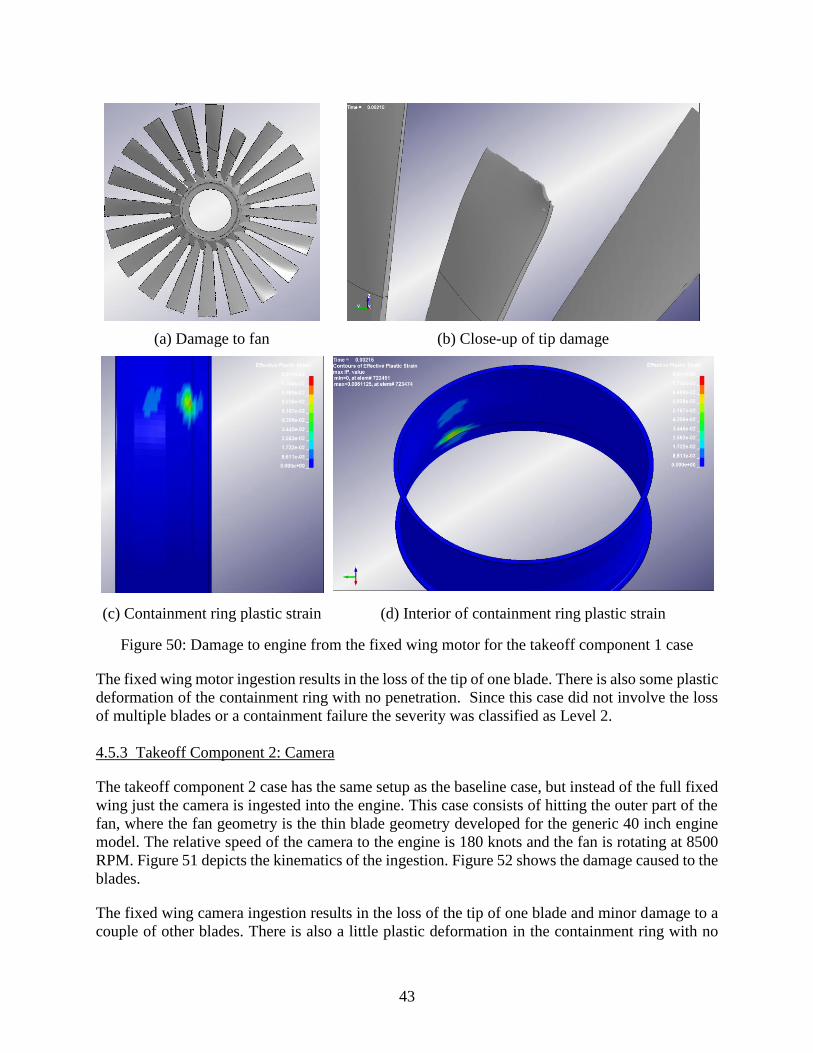
view of the broken blade impacting the containment ring. Figure 50 shows the damage caused to
the blades and the containment ring.
Figure 49: Kinematics of the fixed wing motor ingestion for the takeoff component 1 case
43
(a) Damage to fan (b) Close-up of tip damage
(c) Containment ring plastic strain (d) Interior of containment ring plastic strain
Figure 50: Damage to engine from the fixed wing motor for the takeoff component 1 case
The fixed wing motor ingestion results in the loss of the tip of one blade. There is also some plastic
deformation of the containment ring with no penetration. Since this case did not involve the loss
of multiple blades or a containment failure the severity was classified as Level 2.
4.5.3 Takeoff Component 2: Camera
The takeoff component 2 case has the same setup as the baseline case, but instead of the full fixed
wing just the camera is ingested into the engine. This case consists of hitting the outer part of the
fan, where the fan geometry is the thin blade geometry developed for the generic 40 inch engine
model. The relative speed of the camera to the engine is 180 knots and the fan is rotating at 8500
RPM. Figure 51 depicts the kinematics of the ingestion. Figure 52 shows the damage caused to the
blades.
The fixed wing camera ingestion results in the loss of the tip of one blade and minor damage to a
couple of other blades. There is also a little plastic deformation in the containment ring with no
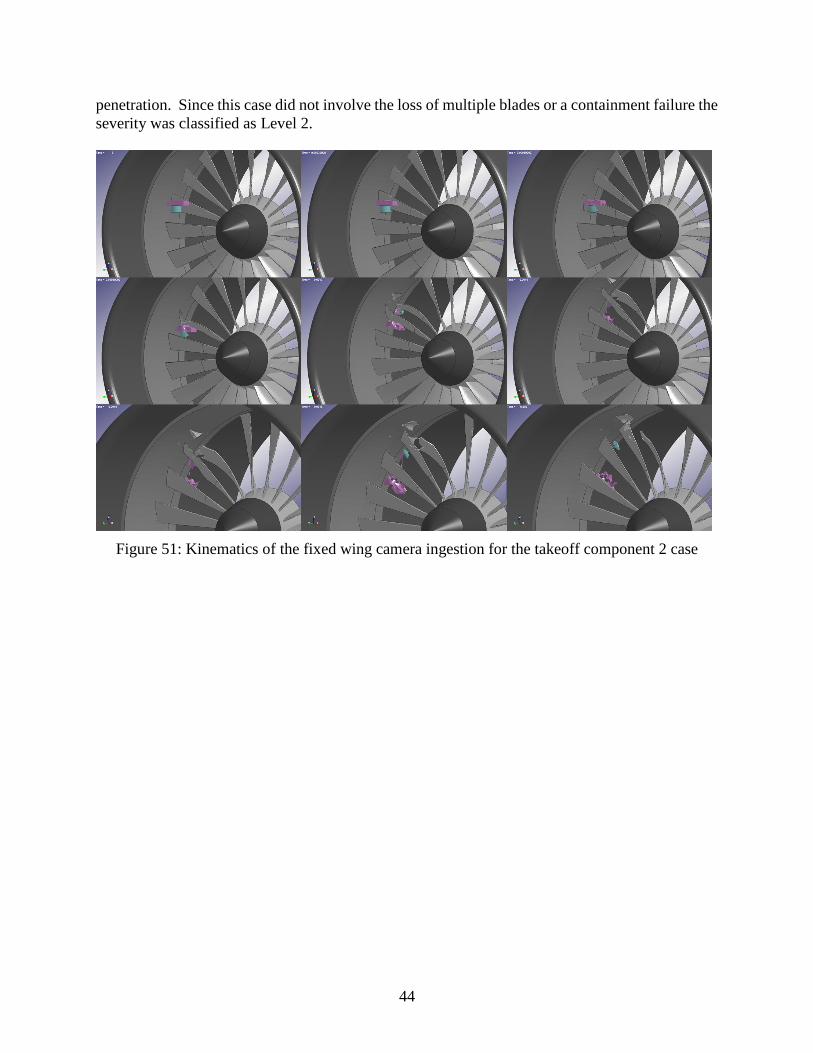
44
penetration. Since this case did not involve the loss of multiple blades or a containment failure the
severity was classified as Level 2.
Figure 51: Kinematics of the fixed wing camera ingestion for the takeoff component 2 case
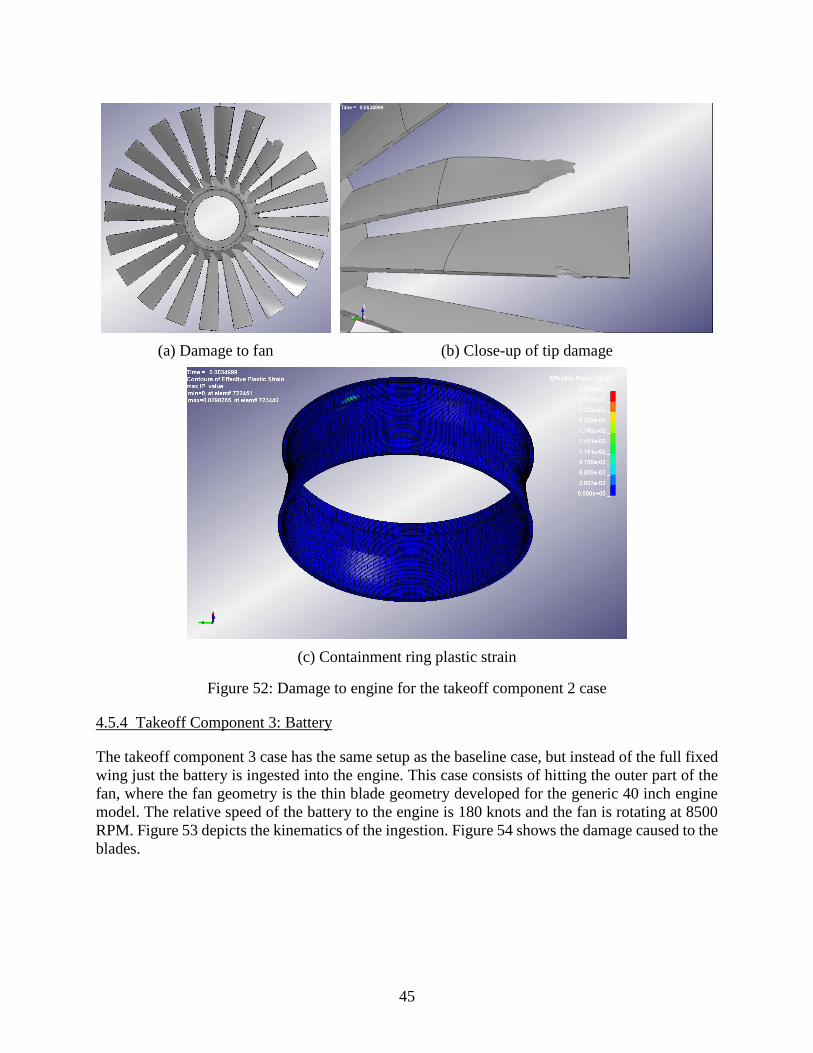
45
(a) Damage to fan (b) Close-up of tip damage
(c) Containment ring plastic strain
Figure 52: Damage to engine for the takeoff component 2 case
4.5.4 Takeoff Component 3: Battery
The takeoff component 3 case has the same setup as the baseline case, but instead of the full fixed
wing just the battery is ingested into the engine. This case consists of hitting the outer part of the
fan, where the fan geometry is the thin blade geometry developed for the generic 40 inch engine
model. The relative speed of the battery to the engine is 180 knots and the fan is rotating at 8500
RPM. Figure 53 depicts the kinematics of the ingestion. Figure 54 shows the damage caused to the
blades.
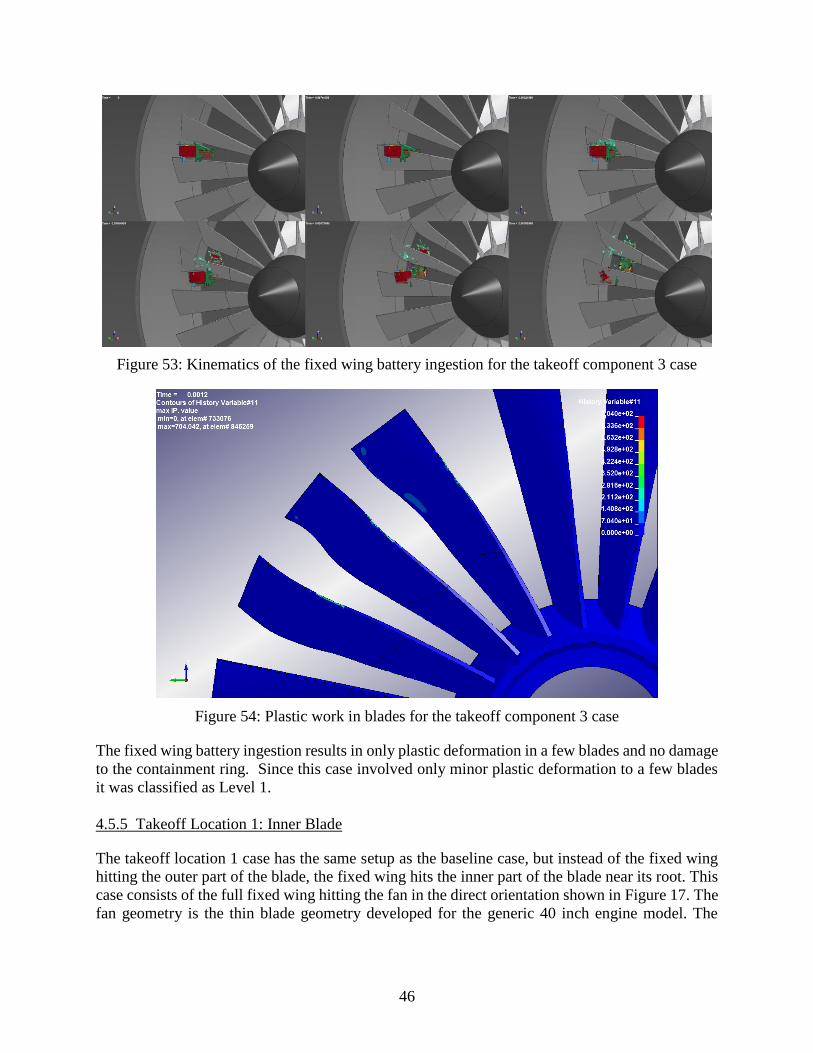
46
Figure 53: Kinematics of the fixed wing battery ingestion for the takeoff component 3 case
Figure 54: Plastic work in blades for the takeoff component 3 case
The fixed wing battery ingestion results in only plastic deformation in a few blades and no damage
to the containment ring. Since this case involved only minor plastic deformation to a few blades
it was classified as Level 1.
4.5.5 Takeoff Location 1: Inner Blade
The takeoff location 1 case has the same setup as the baseline case, but instead of the fixed wing
hitting the outer part of the blade, the fixed wing hits the inner part of the blade near its root. This
case consists of the full fixed wing hitting the fan in the direct orientation shown in Figure 17. The
fan geometry is the thin blade geometry developed for the generic 40 inch engine model. The
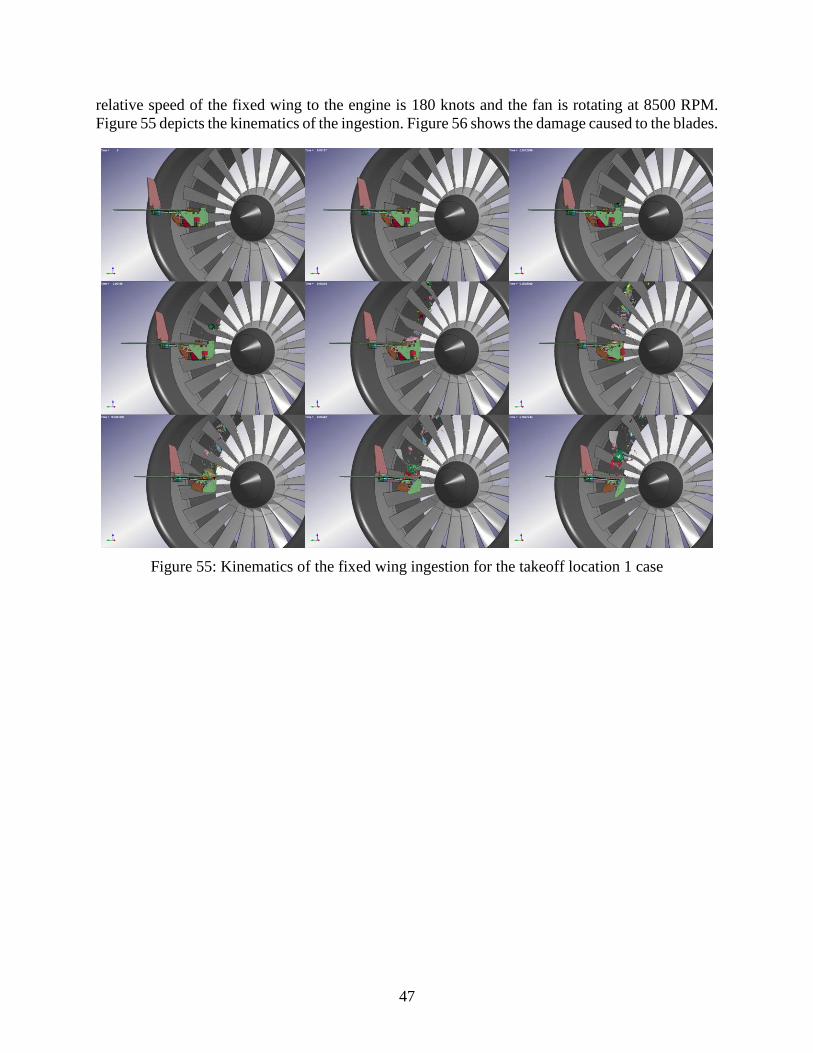
47
relative speed of the fixed wing to the engine is 180 knots and the fan is rotating at 8500 RPM.
Figure 55 depicts the kinematics of the ingestion. Figure 56 shows the damage caused to the blades.
Figure 55: Kinematics of the fixed wing ingestion for the takeoff location 1 case
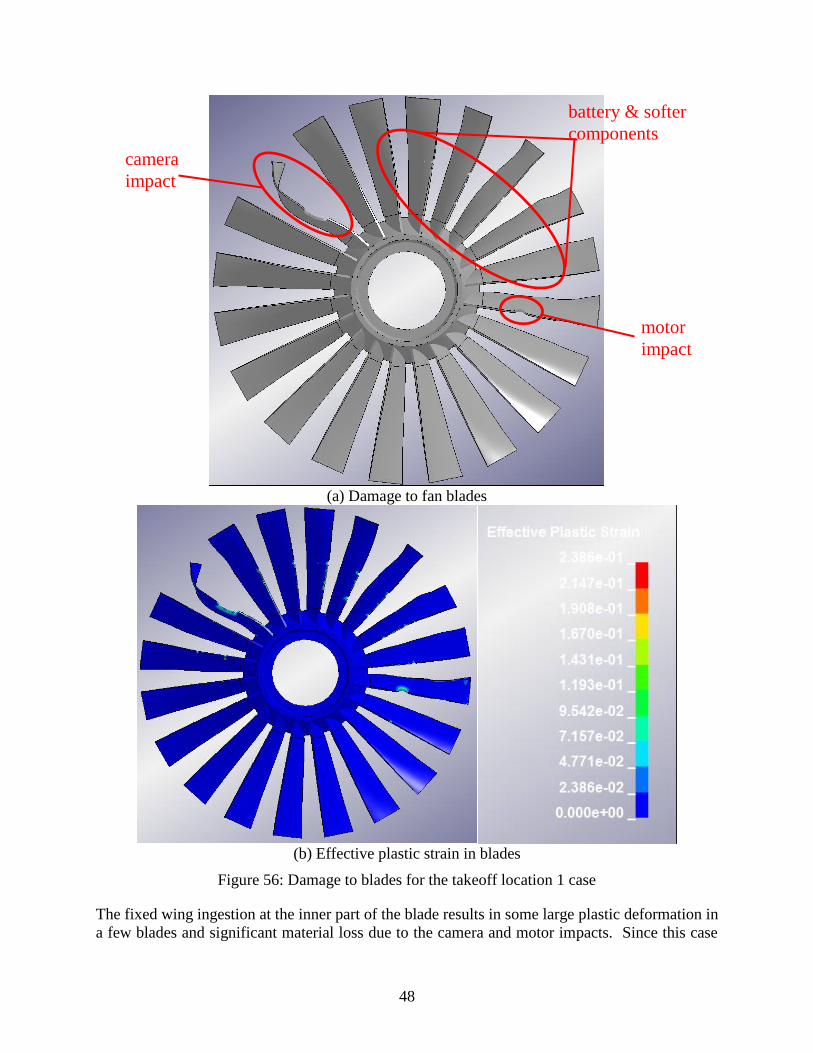
48
(a) Damage to fan blades
(b) Effective plastic strain in blades
Figure 56: Damage to blades for the takeoff location 1 case
The fixed wing ingestion at the inner part of the blade results in some large plastic deformation in
a few blades and significant material loss due to the camera and motor impacts. Since this case
camera
impact
motor
impact
battery & softer
components
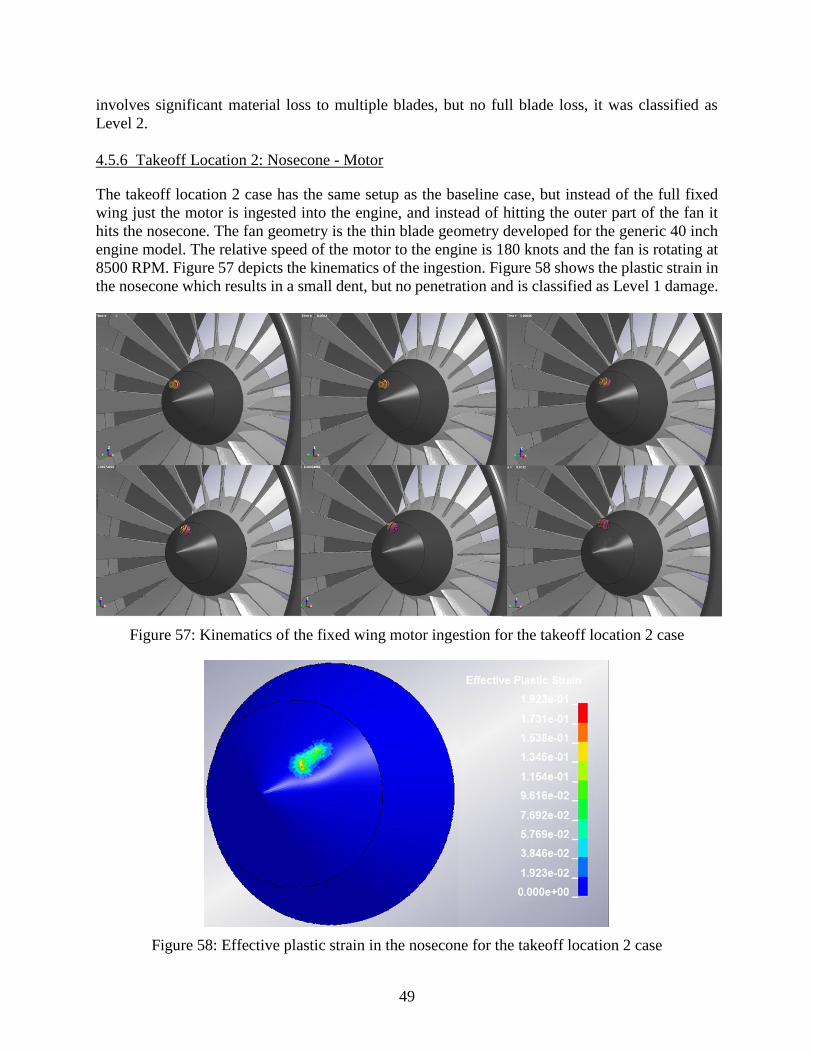
49
involves significant material loss to multiple blades, but no full blade loss, it was classified as
Level 2.
4.5.6 Takeoff Location 2: Nosecone - Motor
The takeoff location 2 case has the same setup as the baseline case, but instead of the full fixed
wing just the motor is ingested into the engine, and instead of hitting the outer part of the fan it
hits the nosecone. The fan geometry is the thin blade geometry developed for the generic 40 inch
engine model. The relative speed of the motor to the engine is 180 knots and the fan is rotating at
8500 RPM. Figure 57 depicts the kinematics of the ingestion. Figure 58 shows the plastic strain in
the nosecone which results in a small dent, but no penetration and is classified as Level 1 damage.
Figure 57: Kinematics of the fixed wing motor ingestion for the takeoff location 2 case
Figure 58: Effective plastic strain in the nosecone for the takeoff location 2 case
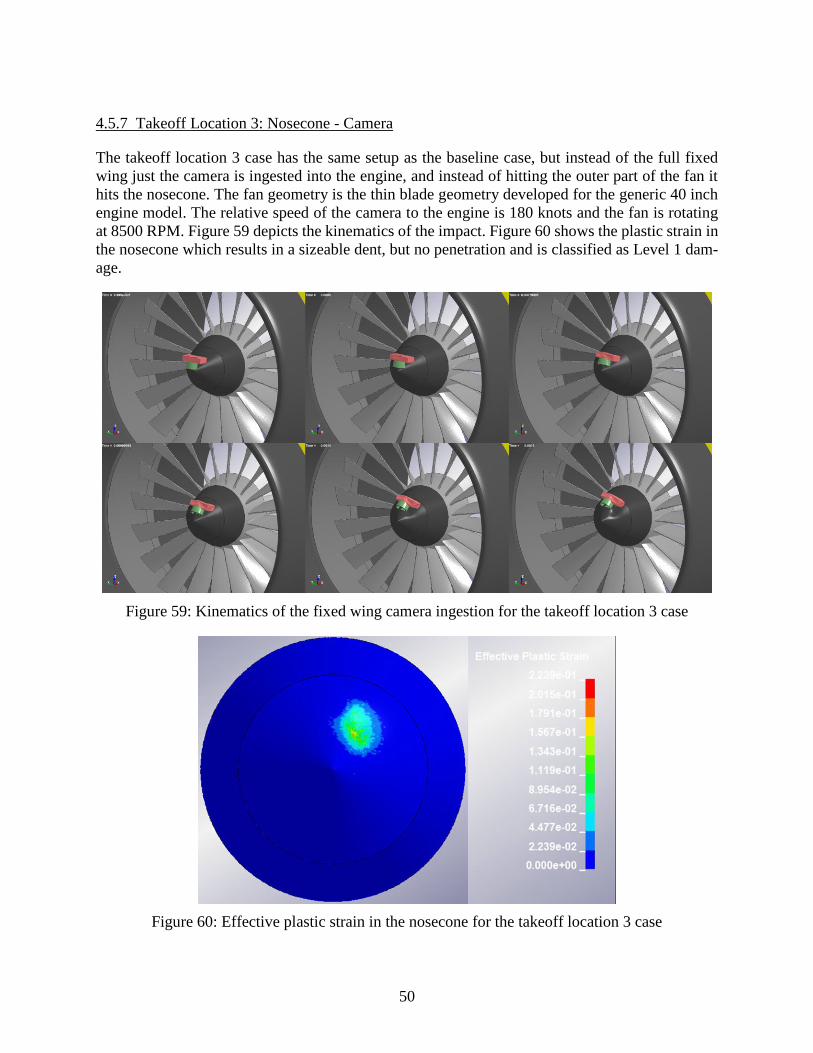
50
4.5.7 Takeoff Location 3: Nosecone - Camera
The takeoff location 3 case has the same setup as the baseline case, but instead of the full fixed
wing just the camera is ingested into the engine, and instead of hitting the outer part of the fan it
hits the nosecone. The fan geometry is the thin blade geometry developed for the generic 40 inch
engine model. The relative speed of the camera to the engine is 180 knots and the fan is rotating
at 8500 RPM. Figure 59 depicts the kinematics of the impact. Figure 60 shows the plastic strain in
the nosecone which results in a sizeable dent, but no penetration and is classified as Level 1 dam-
age.
Figure 59: Kinematics of the fixed wing camera ingestion for the takeoff location 3 case
Figure 60: Effective plastic strain in the nosecone for the takeoff location 3 case
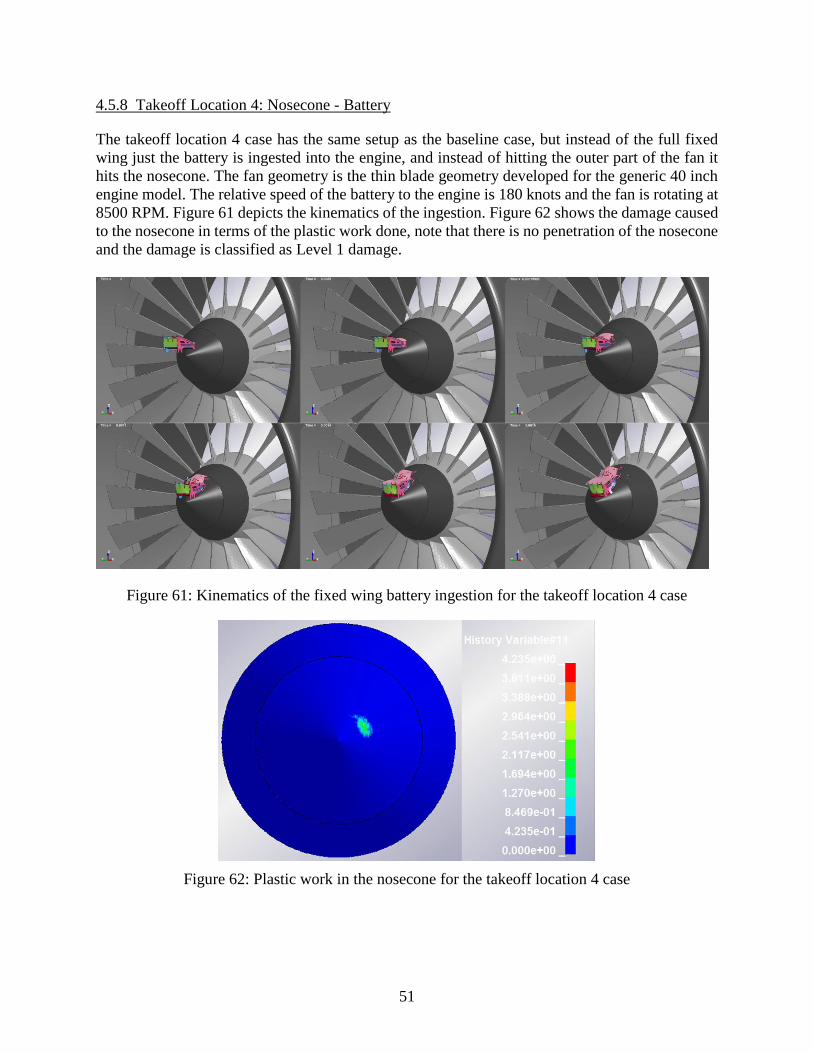
51
4.5.8 Takeoff Location 4: Nosecone - Battery
The takeoff location 4 case has the same setup as the baseline case, but instead of the full fixed
wing just the battery is ingested into the engine, and instead of hitting the outer part of the fan it
hits the nosecone. The fan geometry is the thin blade geometry developed for the generic 40 inch
engine model. The relative speed of the battery to the engine is 180 knots and the fan is rotating at
8500 RPM. Figure 61 depicts the kinematics of the ingestion. Figure 62 shows the damage caused
to the nosecone in terms of the plastic work done, note that there is no penetration of the nosecone
and the damage is classified as Level 1 damage.
Figure 61: Kinematics of the fixed wing battery ingestion for the takeoff location 4 case
Figure 62: Plastic work in the nosecone for the takeoff location 4 case
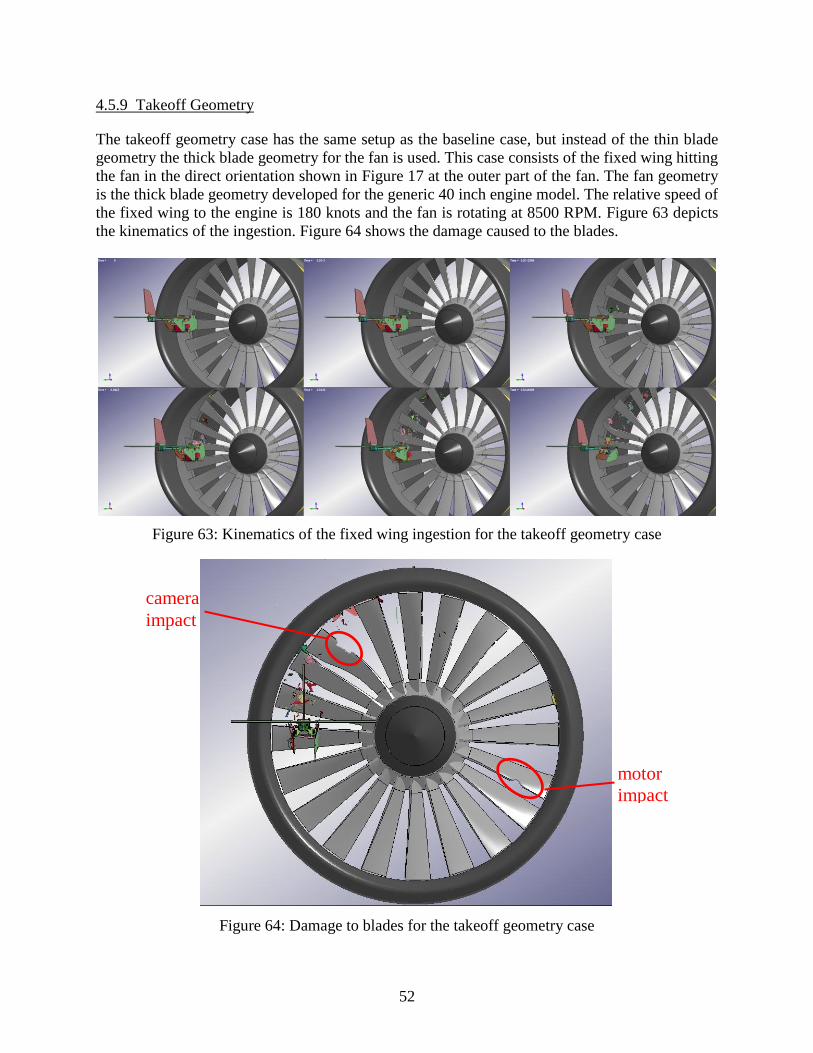
52
4.5.9 Takeoff Geometry
The takeoff geometry case has the same setup as the baseline case, but instead of the thin blade
geometry the thick blade geometry for the fan is used. This case consists of the fixed wing hitting
the fan in the direct orientation shown in Figure 17 at the outer part of the fan. The fan geometry
is the thick blade geometry developed for the generic 40 inch engine model. The relative speed of
the fixed wing to the engine is 180 knots and the fan is rotating at 8500 RPM. Figure 63 depicts
the kinematics of the ingestion. Figure 64 shows the damage caused to the blades.
Figure 63: Kinematics of the fixed wing ingestion for the takeoff geometry case
Figure 64: Damage to blades for the takeoff geometry case
motor
impact
camera
impact
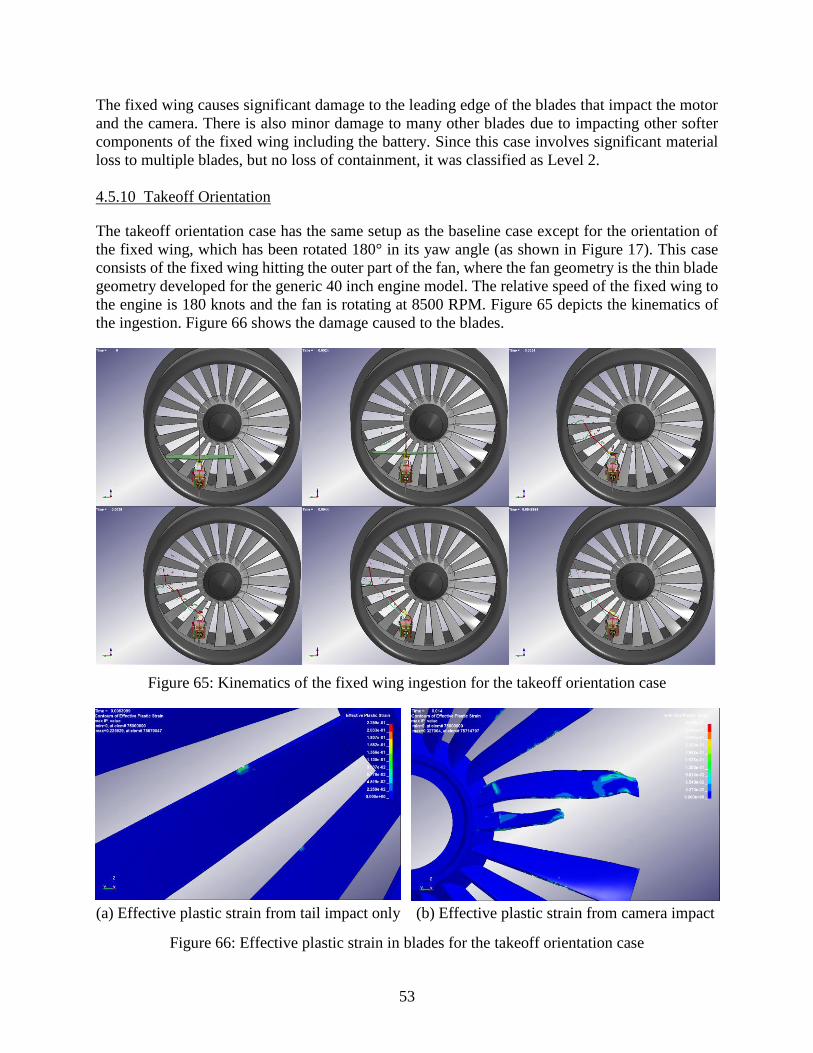
53
The fixed wing causes significant damage to the leading edge of the blades that impact the motor
and the camera. There is also minor damage to many other blades due to impacting other softer
components of the fixed wing including the battery. Since this case involves significant material
loss to multiple blades, but no loss of containment, it was classified as Level 2.
4.5.10 Takeoff Orientation
The takeoff orientation case has the same setup as the baseline case except for the orientation of
the fixed wing, which has been rotated 180° in its yaw angle (as shown in Figure 17). This case
consists of the fixed wing hitting the outer part of the fan, where the fan geometry is the thin blade
geometry developed for the generic 40 inch engine model. The relative speed of the fixed wing to
the engine is 180 knots and the fan is rotating at 8500 RPM. Figure 65 depicts the kinematics of
the ingestion. Figure 66 shows the damage caused to the blades.
Figure 65: Kinematics of the fixed wing ingestion for the takeoff orientation case
(a) Effective plastic strain from tail impact only (b) Effective plastic strain from camera impact
Figure 66: Effective plastic strain in blades for the takeoff orientation case
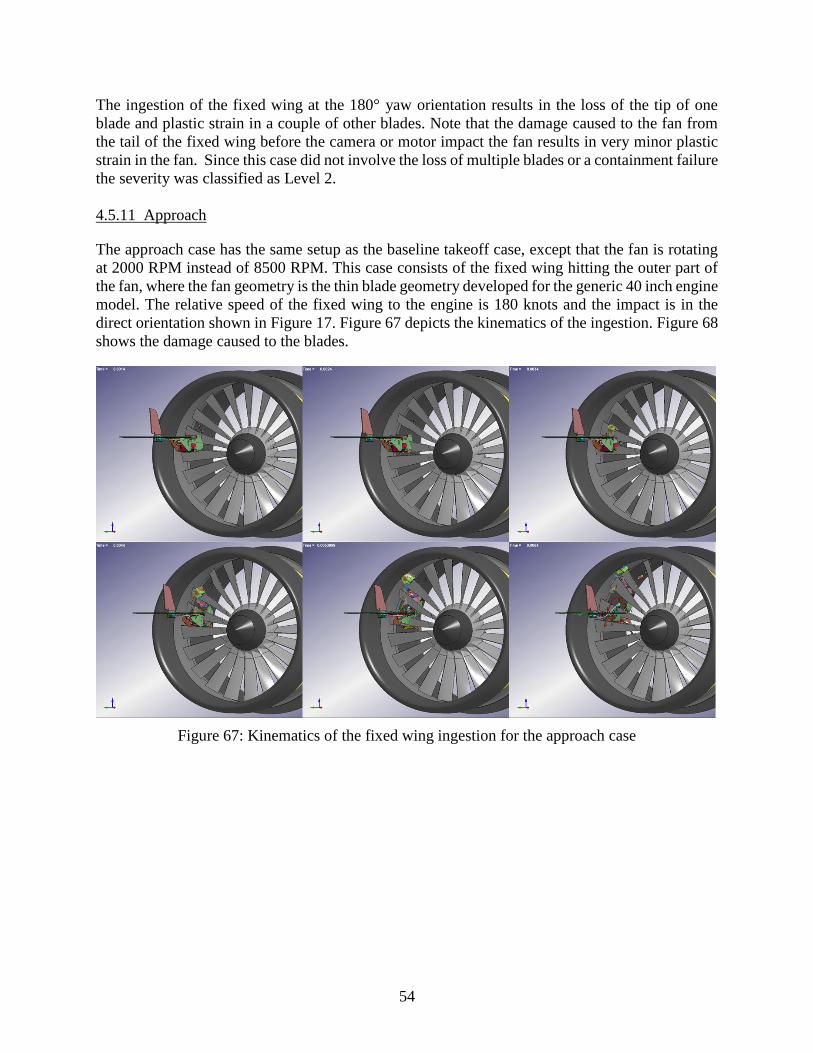
54
The ingestion of the fixed wing at the 180° yaw orientation results in the loss of the tip of one
blade and plastic strain in a couple of other blades. Note that the damage caused to the fan from
the tail of the fixed wing before the camera or motor impact the fan results in very minor plastic
strain in the fan. Since this case did not involve the loss of multiple blades or a containment failure
the severity was classified as Level 2.
4.5.11 Approach
The approach case has the same setup as the baseline takeoff case, except that the fan is rotating
at 2000 RPM instead of 8500 RPM. This case consists of the fixed wing hitting the outer part of
the fan, where the fan geometry is the thin blade geometry developed for the generic 40 inch engine
model. The relative speed of the fixed wing to the engine is 180 knots and the impact is in the
direct orientation shown in Figure 17. Figure 67 depicts the kinematics of the ingestion. Figure 68
shows the damage caused to the blades.
Figure 67: Kinematics of the fixed wing ingestion for the approach case
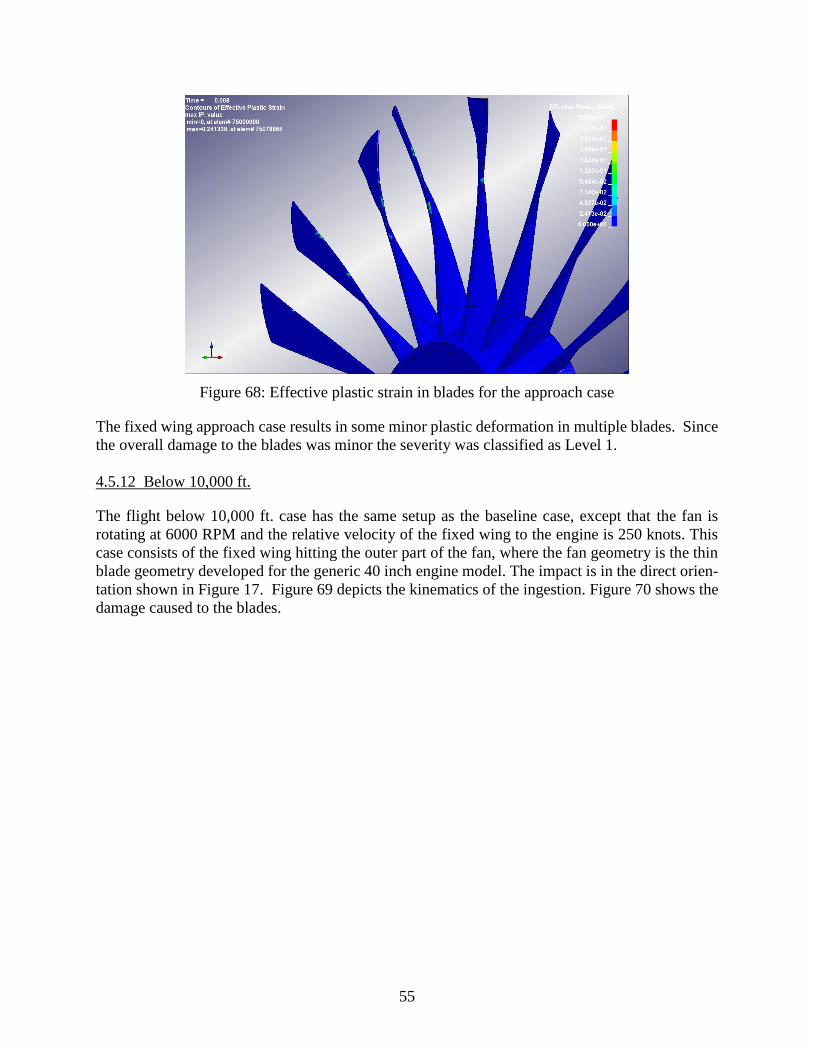
55
Figure 68: Effective plastic strain in blades for the approach case
The fixed wing approach case results in some minor plastic deformation in multiple blades. Since
the overall damage to the blades was minor the severity was classified as Level 1.
4.5.12 Below 10,000 ft.
The flight below 10,000 ft. case has the same setup as the baseline case, except that the fan is
rotating at 6000 RPM and the relative velocity of the fixed wing to the engine is 250 knots. This
case consists of the fixed wing hitting the outer part of the fan, where the fan geometry is the thin
blade geometry developed for the generic 40 inch engine model. The impact is in the direct orien-
tation shown in Figure 17. Figure 69 depicts the kinematics of the ingestion. Figure 70 shows the
damage caused to the blades.
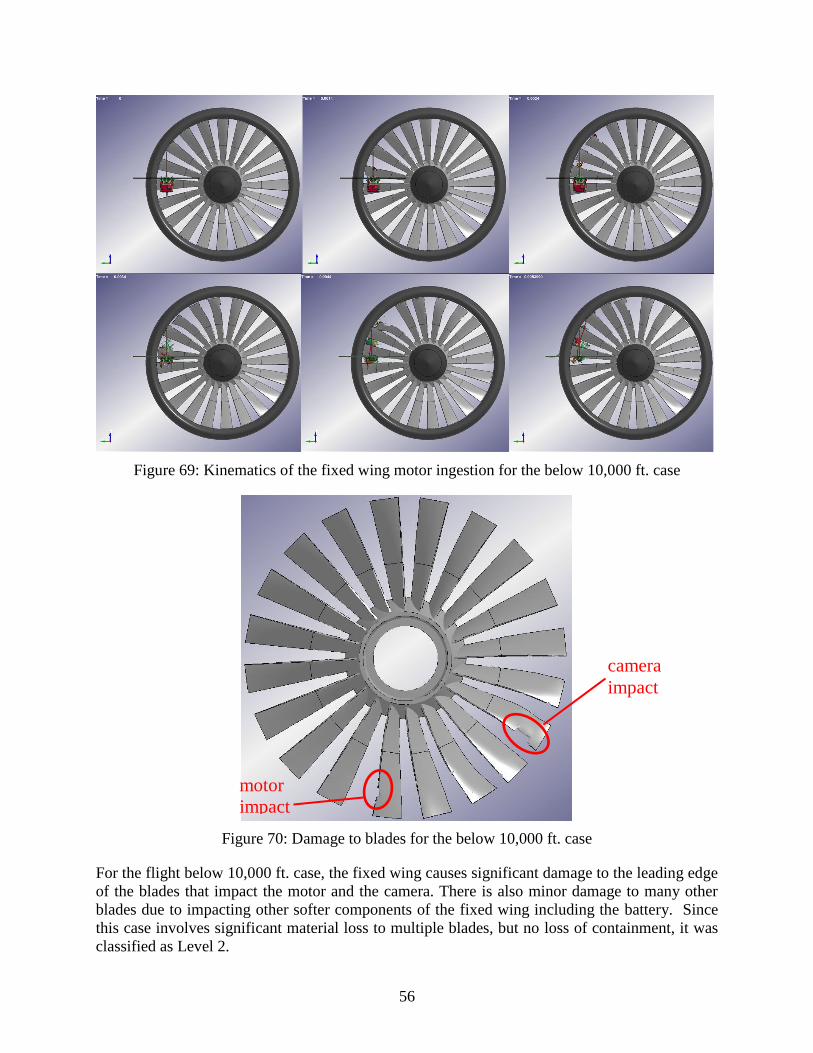
56
Figure 69: Kinematics of the fixed wing motor ingestion for the below 10,000 ft. case
Figure 70: Damage to blades for the below 10,000 ft. case
For the flight below 10,000 ft. case, the fixed wing causes significant damage to the leading edge
of the blades that impact the motor and the camera. There is also minor damage to many other
blades due to impacting other softer components of the fixed wing including the battery. Since
this case involves significant material loss to multiple blades, but no loss of containment, it was
classified as Level 2.
motor
impact
camera
impact
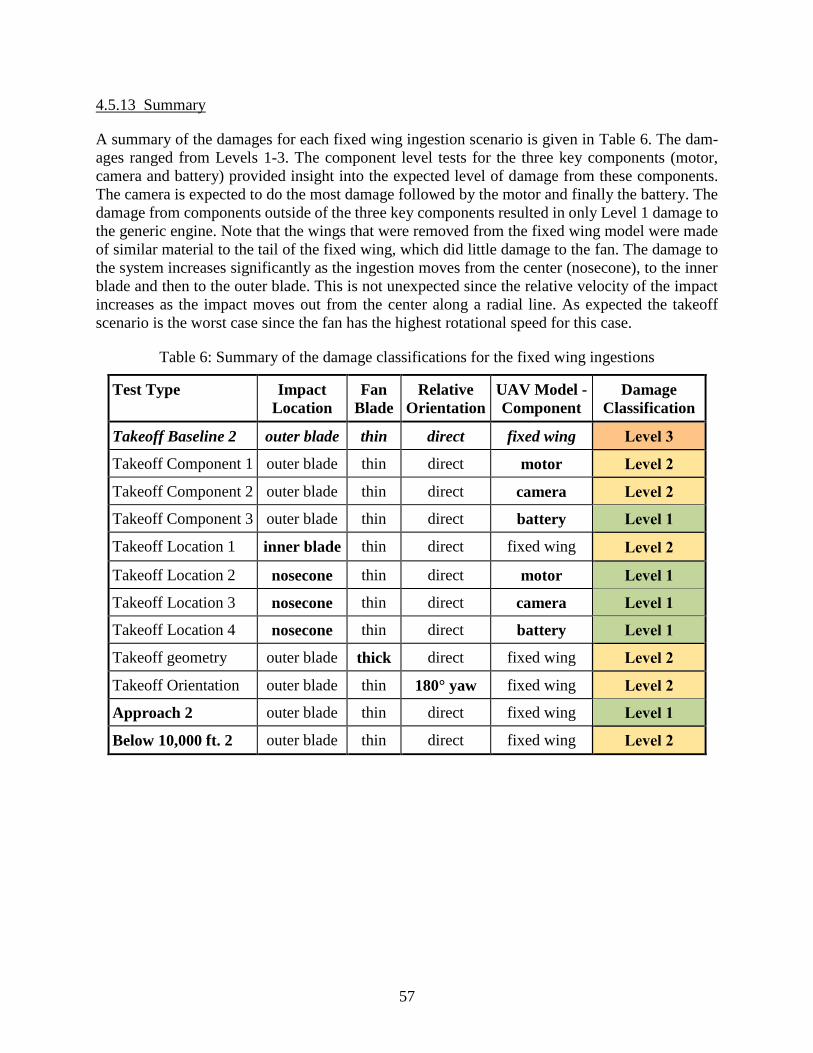
57
4.5.13 Summary
A summary of the damages for each fixed wing ingestion scenario is given in Table 6. The dam-
ages ranged from Levels 1-3. The component level tests for the three key components (motor,
camera and battery) provided insight into the expected level of damage from these components.
The camera is expected to do the most damage followed by the motor and finally the battery. The
damage from components outside of the three key components resulted in only Level 1 damage to
the generic engine. Note that the wings that were removed from the fixed wing model were made
of similar material to the tail of the fixed wing, which did little damage to the fan. The damage to
the system increases significantly as the ingestion moves from the center (nosecone), to the inner
blade and then to the outer blade. This is not unexpected since the relative velocity of the impact
increases as the impact moves out from the center along a radial line. As expected the takeoff
scenario is the worst case since the fan has the highest rotational speed for this case.
Table 6: Summary of the damage classifications for the fixed wing ingestions
Test Type Impact
Location
Fan
Blade
Relative
Orientation
UAV Model -
Component
Damage
Classification
Takeoff Baseline 2 outer blade thin direct fixed wing Level 3
Takeoff Component 1 outer blade thin direct motor Level 2
Takeoff Component 2 outer blade thin direct camera Level 2
Takeoff Component 3 outer blade thin direct battery Level 1
Takeoff Location 1 inner blade thin direct fixed wing Level 2
Takeoff Location 2 nosecone thin direct motor Level 1
Takeoff Location 3 nosecone thin direct camera Level 1
Takeoff Location 4 nosecone thin direct battery Level 1
Takeoff geometry outer blade thick direct fixed wing Level 2
Takeoff Orientation outer blade thin 180° yaw fixed wing Level 2
Approach 2 outer blade thin direct fixed wing Level 1
Below 10,000 ft. 2 outer blade thin direct fixed wing Level 2
58
5. CONCLUSIONS AND FURTHER WORK
5.1 MODELS
This work presents two models of fan stages for generic aircraft engines for mid-size business jets.
The fan diameters for each fan is 40 inches and the models are not supposed to represent any
current engine in service; rather they were chosen with industrial input as reasonable approxima-
tions of solid titanium blades that are on the thick and thin side of blades for 40 inch diameter fans.
The fans are within a containment ring8, which is connected to a nacelle5 upstream and downstream
of the fan. A biconic nosecone was also included in the model. The materials of each critical com-
ponent are composed of materials commonly used in engines and are discussed in the jet engine
definition section.
The UAVs used in the collision studies were developed by collaborating groups. The first model2
is the DJI Phantom 3 standard edition which is referred to as the quadcopter model in this report.
It was chosen since the DJI Phantom family are the most common UAS under 5 lbs. It was devel-
oped at Wichita State University – NIAR. The second model3 is the Precision Hawk Lancaster
Hawkeye Mark III, which is a lightweight fixed wing UAV with a maximum takeoff weight of
about 4.0 lbs. The Precision Hawk is referred to as the fixed wing model in this report. This model
was developed at Mississippi State University and was chosen to learn about some of the differ-
ences between fixed wing and quadcopter ingestions.
5.2 COLLISION ANALYSIS
The damage to an engine during an ingestion of a UAV is dependent on many variables, including
the type of fan, the rotational speed of the fan, the components of the UAV that impact the fan, the
orientation of the impact, the location of the impact along the fan, and the relative speed of the
vehicles.
This report focused on an ingestion event when a generic mid-size business jet engine ingests a
UAV during takeoff. Several of the parameters that affect the ingestion were studied using devia-
tions from a baseline takeoff scenario where the UAV hit near the tip of the thin fan blades. A
classification of the different damage possibilities is shown in Table 7. Each of the ingestion sce-
narios have been defined in Table 3 and are classified by their damage level in
Table 8.
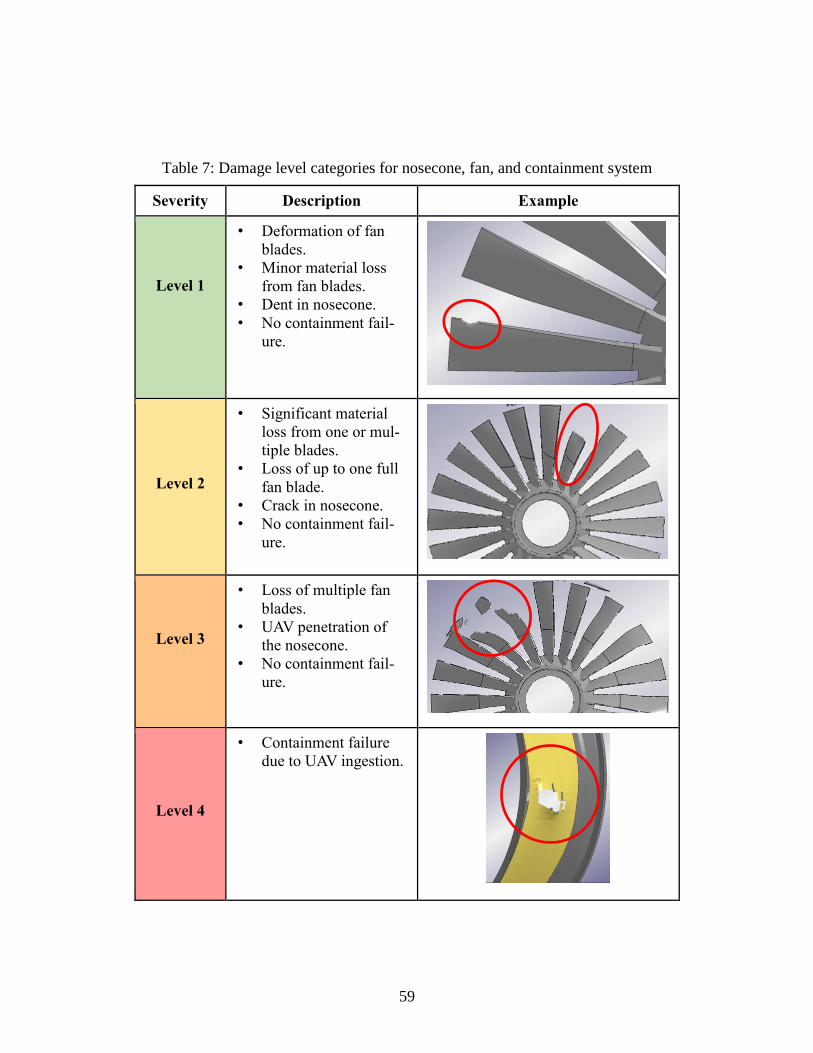
59
Table 7: Damage level categories for nosecone, fan, and containment system
Severity Description Example
Level 1
• Deformation of fan
blades.
• Minor material loss
from fan blades.
• Dent in nosecone.
• No containment fail-
ure.
Level 2
• Significant material
loss from one or mul-
tiple blades.
• Loss of up to one full
fan blade.
• Crack in nosecone.
• No containment fail-
ure.
Level 3
• Loss of multiple fan
blades.
• UAV penetration of
the nosecone.
• No containment fail-
ure.
Level 4
• Containment failure
due to UAV ingestion.
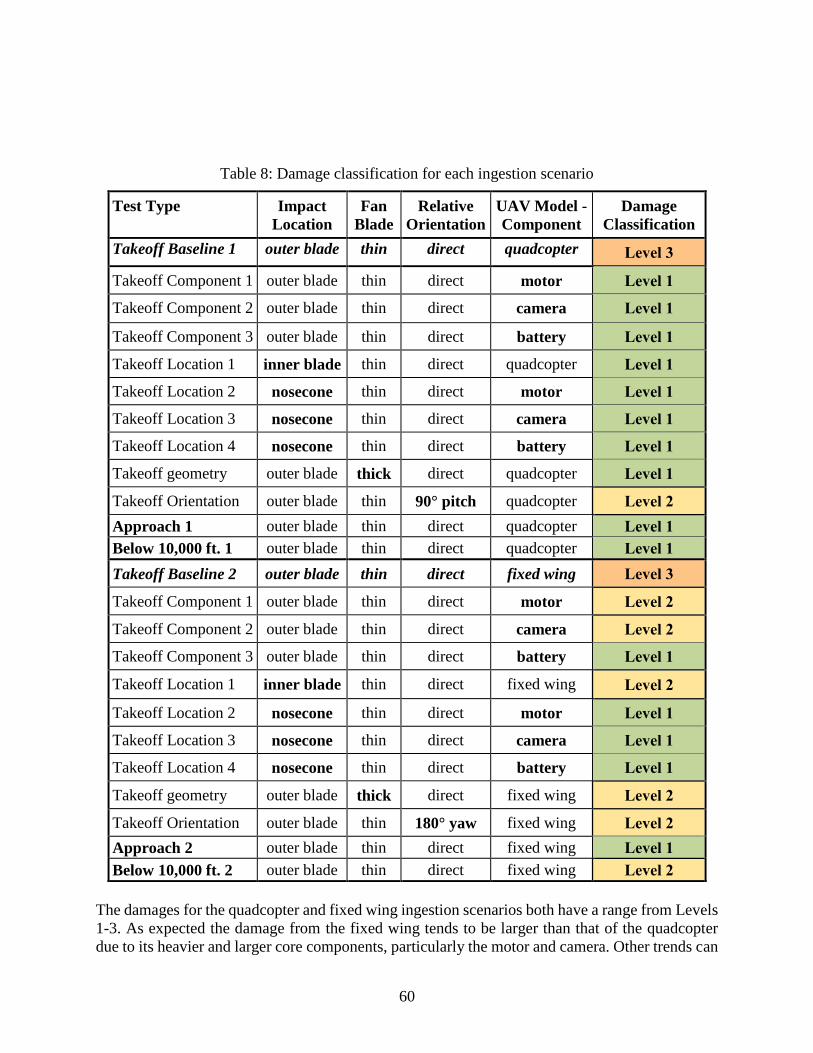
60
Table 8: Damage classification for each ingestion scenario
Test Type Impact
Location
Fan
Blade
Relative
Orientation
UAV Model -
Component
Damage
Classification
Takeoff Baseline 1 outer blade thin direct quadcopter Level 3
Takeoff Component 1 outer blade thin direct motor Level 1
Takeoff Component 2 outer blade thin direct camera Level 1
Takeoff Component 3 outer blade thin direct battery Level 1
Takeoff Location 1 inner blade thin direct quadcopter Level 1
Takeoff Location 2 nosecone thin direct motor Level 1
Takeoff Location 3 nosecone thin direct camera Level 1
Takeoff Location 4 nosecone thin direct battery Level 1
Takeoff geometry outer blade thick direct quadcopter Level 1
Takeoff Orientation outer blade thin 90° pitch quadcopter Level 2
Approach 1 outer blade thin direct quadcopter Level 1
Below 10,000 ft. 1 outer blade thin direct quadcopter Level 1
Takeoff Baseline 2 outer blade thin direct fixed wing Level 3
Takeoff Component 1 outer blade thin direct motor Level 2
Takeoff Component 2 outer blade thin direct camera Level 2
Takeoff Component 3 outer blade thin direct battery Level 1
Takeoff Location 1 inner blade thin direct fixed wing Level 2
Takeoff Location 2 nosecone thin direct motor Level 1
Takeoff Location 3 nosecone thin direct camera Level 1
Takeoff Location 4 nosecone thin direct battery Level 1
Takeoff geometry outer blade thick direct fixed wing Level 2
Takeoff Orientation outer blade thin 180° yaw fixed wing Level 2
Approach 2 outer blade thin direct fixed wing Level 1
Below 10,000 ft. 2 outer blade thin direct fixed wing Level 2
The damages for the quadcopter and fixed wing ingestion scenarios both have a range from Levels
1-3. As expected the damage from the fixed wing tends to be larger than that of the quadcopter
due to its heavier and larger core components, particularly the motor and camera. Other trends can
61
be observed from both the quadcopter and the fixed wing. Namely, the damage to the system
increases significantly as the ingestion moves from the center (nosecone), to the inner blade and
then to the outer blade. This is not unexpected since the relative velocity of the impact increases
as the impact moves out from the center along a radial line. Another reason the nosecone impacts
tend to be so much less severe is that the nosecone tends to deflect the object instead of chopping
through it like when it impacts the fan blades.
As expected, the takeoff scenario is the worst case since the fan has the highest rotational speed
for this case. Other factors that have a major impact on the damage level include the thickness of
the blade and the orientation of the UAV during the impact. As expected, the thicker blade holds
up much better than the thin blade during the ingestion. Only two orientations were studied in this
initial study for each UAV and additional orientations should be investigated, since it was found
that the level of damage is greatly dependent on the conditions in which the fan impacts the harder
components of the UAV.
None of the ingestion simulations from this preliminary work result in a loss of containment. There
is some plastic strain in the containment tank due to blade loss, UAV component impacts, and tip
rubs due to the ingestion. The containment tank is not damaged significantly in these events since
it is designed to withstand a blade-out event where the blade is ejected at the root while the fan is
spinning. In none of the cases considered was the damage severe enough at the disk to break the
disk or lose multiple blades at their roots, which could result in a loss of containment.
The ingestion simulations studied in this work focus on damage to the nosecone and fan as well as
how well the fan is contained. It does not model components of the engine past the fan such as the
compressor, combustor, and turbine. As was discussed in an FAA UAV ingestion safety report20
a very small hard body fragment as little as 0.66 pounds poses the potential for severe engine
damage. So even for the case where there is only minor damage to the fan, the engine might not
survive the UAV ingestion.
The energy for the entire system was monitored for all of the simulations via the glstat files from
LS-DYNA. In general, it is recommended that the hourglass energy should stay less than 10% of
the total energy of the system, and the total energy should stay within a couple percent of its initial
value during the calculation provided no external work is performed. The hourglass energy is the
work done by forces within LS-DYNA to resist hourglass deformations, which are unphysical
deformations of the elements and should be minimized. The parameter ENMASS under *CON-
TROL_CONTACT was set to 2 which prevents the nodes from failed elements being deleted dur-
ing the calculations. In these simulations the mass of the elements is lumped into the nodes. Thus
when ENMASS=2 and an element fails the nodes and their kinetic energy are not eroded. How-
ever, the internal energy of the element is lost and plotted as eroded internal energy in Figure 71
and Figure 72.
The simulations in this work fell into two categories. An example of a case in the first category is
shown in Figure 71, which shows the energy for the quadcopter inner blade impact. Cases in this
category have excellent values for hourglass and the total energy stays almost constant during the
entire calculation. The majority of the total energy is made up of kinetic energy, which comes from
the rotating fan and the moving UAV. Additional energy terms that are plotted in Figure 71 include
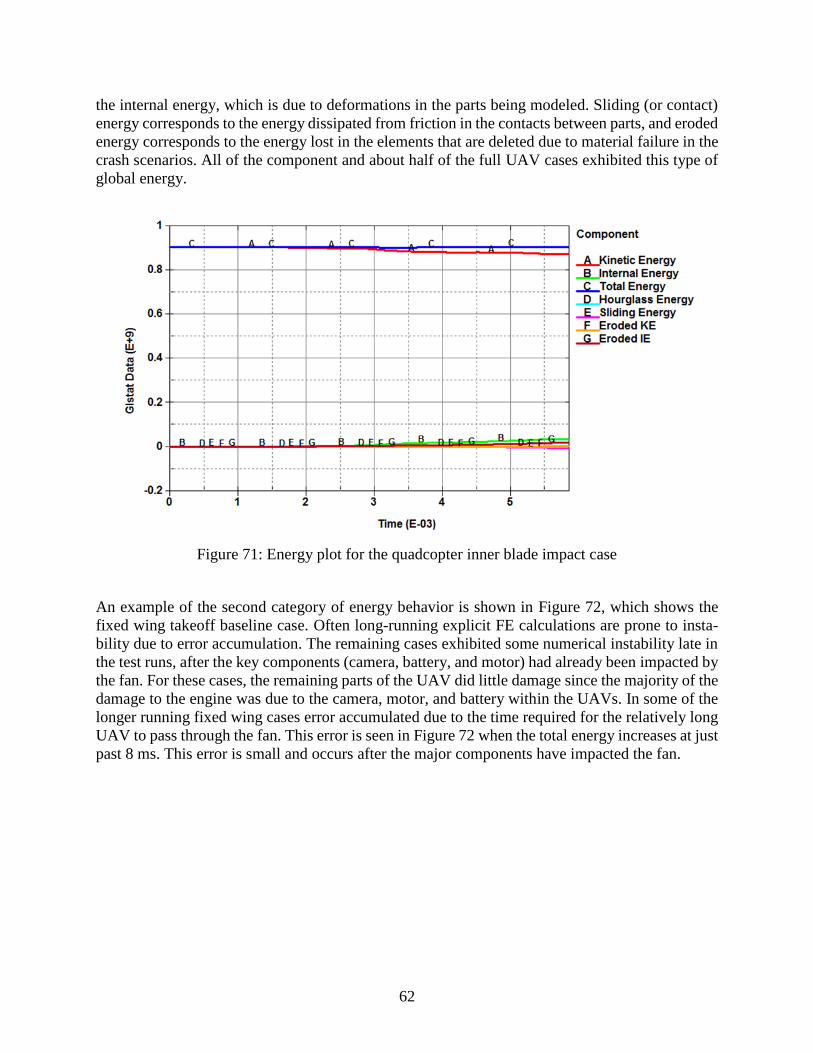
62
the internal energy, which is due to deformations in the parts being modeled. Sliding (or contact)
energy corresponds to the energy dissipated from friction in the contacts between parts, and eroded
energy corresponds to the energy lost in the elements that are deleted due to material failure in the
crash scenarios. All of the component and about half of the full UAV cases exhibited this type of
global energy.
Figure 71: Energy plot for the quadcopter inner blade impact case
An example of the second category of energy behavior is shown in Figure 72, which shows the
fixed wing takeoff baseline case. Often long-running explicit FE calculations are prone to insta-
bility due to error accumulation. The remaining cases exhibited some numerical instability late in
the test runs, after the key components (camera, battery, and motor) had already been impacted by
the fan. For these cases, the remaining parts of the UAV did little damage since the majority of the
damage to the engine was due to the camera, motor, and battery within the UAVs. In some of the
longer running fixed wing cases error accumulated due to the time required for the relatively long
UAV to pass through the fan. This error is seen in Figure 72 when the total energy increases at just
past 8 ms. This error is small and occurs after the major components have impacted the fan.
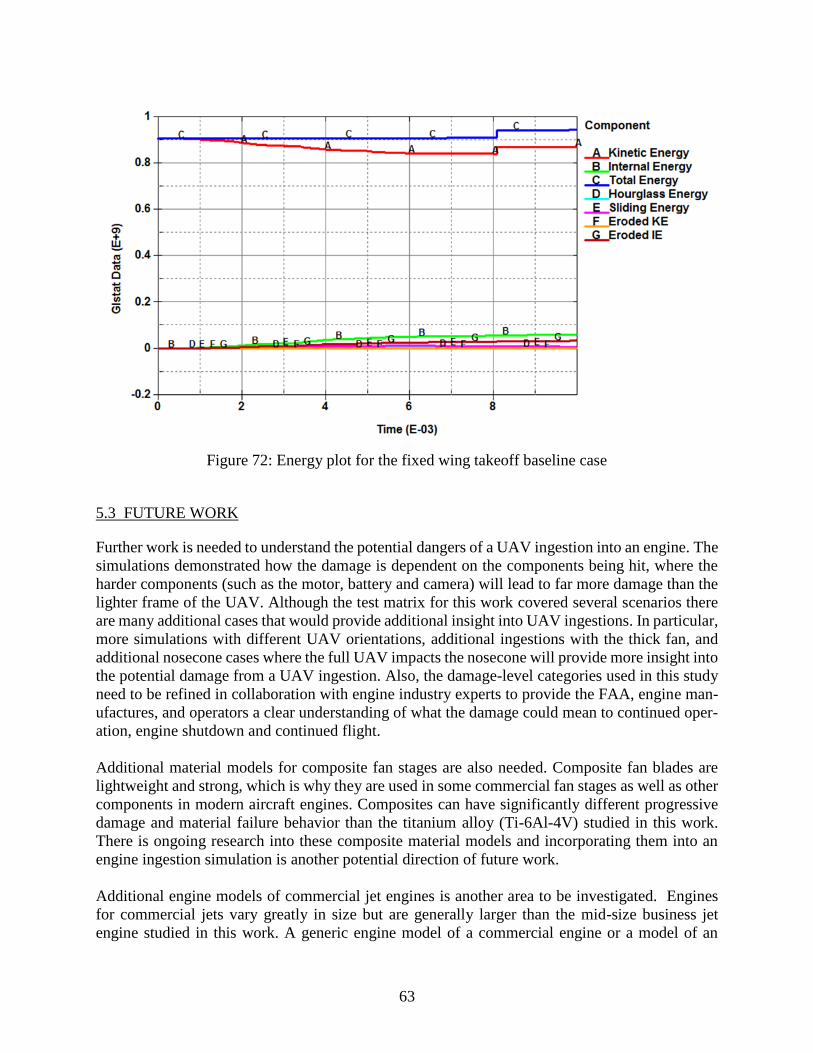
63
Figure 72: Energy plot for the fixed wing takeoff baseline case
5.3 FUTURE WORK
Further work is needed to understand the potential dangers of a UAV ingestion into an engine. The
simulations demonstrated how the damage is dependent on the components being hit, where the
harder components (such as the motor, battery and camera) will lead to far more damage than the
lighter frame of the UAV. Although the test matrix for this work covered several scenarios there
are many additional cases that would provide additional insight into UAV ingestions. In particular,
more simulations with different UAV orientations, additional ingestions with the thick fan, and
additional nosecone cases where the full UAV impacts the nosecone will provide more insight into
the potential damage from a UAV ingestion. Also, the damage-level categories used in this study
need to be refined in collaboration with engine industry experts to provide the FAA, engine man-
ufactures, and operators a clear understanding of what the damage could mean to continued oper-
ation, engine shutdown and continued flight.
Additional material models for composite fan stages are also needed. Composite fan blades are
lightweight and strong, which is why they are used in some commercial fan stages as well as other
components in modern aircraft engines. Composites can have significantly different progressive
damage and material failure behavior than the titanium alloy (Ti-6Al-4V) studied in this work.
There is ongoing research into these composite material models and incorporating them into an
engine ingestion simulation is another potential direction of future work.
Additional engine models of commercial jet engines is another area to be investigated. Engines
for commercial jets vary greatly in size but are generally larger than the mid-size business jet
engine studied in this work. A generic engine model of a commercial engine or a model of an
64
actual commercial jet engine would be a valuable part of future work to understand the effects of
the size of the engine on the ingestion event. Furthermore, developing additional models for com-
ponents downstream of the fan is critical for understanding the full effect of the ingestion event on
the engine.
Finally, one of the most critical parts of future work is to conduct full scale ingestion experiments
of UAVs into fan stages running at operational speed. These experiments are critical in verifying
the computational models that are being developed. Rotating engine experiments (as opposed to
stationary engines impacted by UAVs) are particularly critical for several reasons. First, the fan
blades will stiffen when rotating at their operational speed due to the centripetal acceleration. Sec-
ond, in modern fan stages, the actual geometry of the blades will change due to the centripetal
acceleration. Finally, the relative velocity of the fan and the UAV comes from both the relative
speed between the plane and the UAV and the speed of the rotating fan blades. If the UAV hits the
blade close to its tip, the relative velocity can be transonic, which is much greater than the actual
speed of the plane in landing and take-off conditions. Once the models are verified experimentally
they can then be used confidently for a variety of different ingestion scenarios.
65
6. REFERENCES
[1] http://osc.edu/ark:/19495/f5s1ph73. Ohio Supercomputer Center. Columbus, OH: Ohio
Supercomputer Center; 1987.
[2] Olivares G, Monteros J, Baldridge R, Zinzuwadia C, Gomez L. Volume II – UAS Airborne
Collision Severity Evaluation – Quadcopter. FAA Report; 2016.
[3] Olivares G, Lacy T, Monteros J, Kota K, Baldridge R, Zinzuwadia C, Jayakody N, Gomez
L. Volume III – UAS Airborne Collision Severity Evaluation – Fixed Wing. FAA Report; 2016.
[4] Cairns D, Johnson G, Edens M, Arnold F. Volume I – UAS Airborne Collision Severity
Evaluation – Projectile and Target Definition. FAA Report; 2016.
[5] Sengoz K, Kan S, Eskandarian A. Development of a Generic Gas Turbine Engine Fan
Blade-out Full Fan Rig Model. FAA Report DOT/FAA/TC-14/43; 2015.
[6] http://awg.lstc.com/tiki/tiki-index.php?page=QA+Test+Example+2.1. Awg Erif Test Case
2.1: Fan Blade-Off Rig Test, Generic Fan Rig Model. LS-Dyna Aerospace Working Group.
[7] Vintilescu IV. Explicit Finite Element Modeling of Multilayer Composite Fabric for Gas
Turbine Engine Containment Systems, Phase II - Part 4: Model Simulation for Ballistic Tests,
Engine Fan Blade-out, and Generic Engine. FAA Report DOT/FAA/AR-08/37,P4; 2009.
[8] http://awg.lstc.com/tiki/tiki-index.php?page=QA+Test+Example+2.2. Awg Erif: Test
Case 2.2: Fan Blade-Off Containment Test - Generic Soft Wall Containment. LS-Dyna Aerospace
Working Group.
[9] LS-DYNA Keyword User’s Manual Vol. 1. Livermore, California; 2016.
[10] http://awg.lstc.com/tiki/tiki-index.php?page=Resources. LS-DYNA Aerospace Working
Group *Mat_224 User Guide. 2016.
[11] http://awg.lstc.com/tiki/tiki-index.php?page=MGD. LS-DYNA Aerospace Working
Group Modeling Guidelines Document. 2016.
[12] Rajan SD, Mobasher B, Vaidya A, Zhu D, Fein J, Deivanayagam A. Explicit Finite
Element Modeling of Multilayer Composite Fabric for Gas Turbine Engine Containment Systems,
Phase Iv. FAA Report DOT/FAA/TC-13/37; 2014.
[13] Simons J, Erlich D, Shockey D. Part 3: Material Model Development and Simulation of
Experiments. Explicit Finite Element Modeling of Multilayer Composite Fabric for Gas Turbine
Engine Containment Systems, Phase II FAA Report DOT/FAA/AR-08/37,P3; 2009.
[14] Rajan SD, Mobasher B, Stahlecker Z, Bansal S, Zhu D, Morea M, Dhandapani K. Part 1:
Arizona State University Material Model and Numerical Simulations. Explicit Finite Element
Modeling of Multilayer Composite Fabric for Gas Turbine Engine Containment Systems, Phase
III FAA Report DOT/FAA/AR-10/23,P1; 2011.
[15] Haight S, Wang, L., Du Bois, P., Carney K., Kan C. D. Development of a Titanium Alloy
Ti-6al-4v Material Model Used in LS-DYNA. FAA.
[16] Hammer JT. Plastic Deformation and Ductile Fracture of Ti-6al-4v under Various Loading
Conditions. FAA Report DOT/FAA/TC-TT14/2; 2014.
[17] Buyuk M. Part 2: Development of a Tabulated Thermo-Viscoplastic Material Model with
Regularized Failure for Dynamic Ductile Failure Prediction of Structures under Impact Loading.
Development of a New Metal Material Model in LS-DYNA: FAA Report DOT/FAA/TC-13/25,
P2; 2014.
[18] Seidt JD. Part 3: Plastic Deformation and Ductile Fracture of 2024 Aluminum under
Various Loading Conditions. Development of a New Metal Material Model in LS-DYNA: FAA
Report DOT/FAA/TC-13/25, P3; 2014.
66
[19] U.S. Code of Federal Regulations, Title 14, Part 91, General Operation and Flight Rules.
Washington DC: U.S. Government Publishing Office; 2016.
[20] Cordasco D, Emmerling W. Turbofan Engine System Safety of a UAV Ingestion Hazard.
2015.