Embed Size (px)
Citation preview
DOOSAN ENGINE CO., LTD.
SEPARATE FINANCIAL STATEMENTS
AS OF AND FOR THE YEARS ENDED DECEMBER 31, 2012 AND 2011,
AND INDEPENDENT AUDITORS’ REPORT
Independent Auditors’ Report
English Translation of a Report Originally Issued in Korean
To the Stockholders and the Board of Directors of
Doosan Engine Co., Ltd.
We have audited the accompanying separate financial statements of Doosan Engine Co., Ltd.
(the “Company”). The financial statements consist of the separate statements of financial
position as of December 31, 2012 and 2011, and the related separate statements of income,
separate statements of comprehensive income, separate statements of changes in stockholders’
equity and separate statements of cash flows, all expressed in Korean won, for the years ended
December 31, 2012 and 2011. The Company’s management is responsible for the preparation
and fair presentation of the separate financial statements and our responsibility is to express an
opinion on these separate financial statements based on our audits.
We conducted our audits in accordance with auditing standards generally accepted in the
Republic of Korea. Those standards require that we plan and perform the audit to obtain
reasonable assurance about whether the financial statements are free of material misstatement.
An audit includes examining, on a test basis, evidence supporting the amounts and disclosures
in the financial statements. An audit also includes assessing the accounting principles used and
significant estimates made by management, as well as evaluating the overall financial statement
presentation. We believe that our audits provide a reasonable basis for our opinion.
In our opinion, the financial statements referred to above present fairly, in all material respects,
the financial position of the Company as of December 31, 2012 and 2011, and the results of its
operations and its cash flows for the years ended December 31, 2012 and 2011, in conformity
with Korean International Financial Reporting Standards (“K-IFRS”).

Accounting principles and auditing standards and their application in practice vary among
countries. The accompanying separate financial statements are not intended to present the
financial position, results of operations and cash flows in accordance with accounting principles
and practices generally accepted in countries other than the Republic of Korea. In addition, the
procedures and practices utilized in the Republic of Korea to audit such financial statements
may differ from those generally accepted and applied in other countries. Accordingly, this
report and the accompanying separate financial statements are for use by those knowledgeable
about Korean accounting principles and auditing standards and their application in practice.
March 14, 2013
Notice to Readers
This report is effective as of March 14, 2013, the auditors’ report date. Certain subsequent
events or circumstances may have occurred between the auditors’ report date and the time the
auditors’ report is read. Such events or circumstances could significantly affect the separate
financial statements and may result in modifications to the auditors’ report.
DOOSAN ENGINE CO., LTD.
SEPARATE FINANCIAL STATEMENTS
AS OF AND FOR THE YEARS ENDED
DECEMBER 31, 2012 AND 2011
The accompanying separate financial statements, including all footnote disclosures,
were prepared by, and are the responsibility of Doosan Engine Co., Ltd.
Cho, Nam-Suk
Chief Executive Officer
DOOSAN ENGINE CO., LTD.
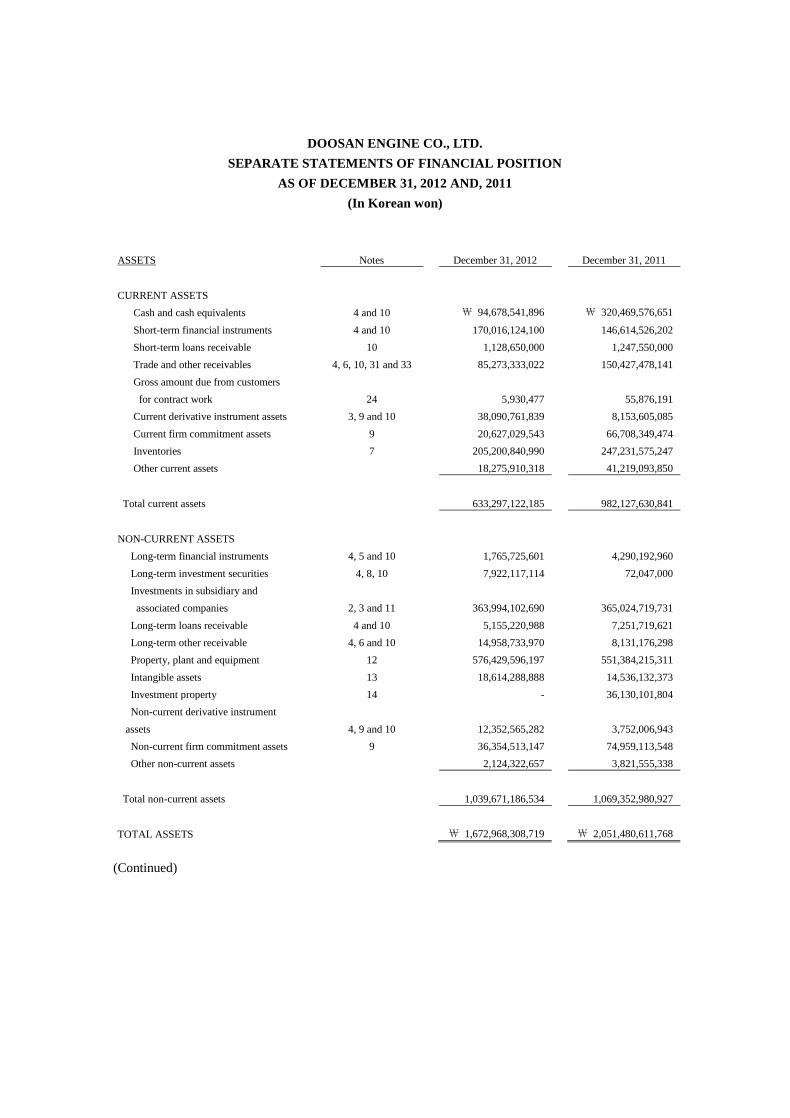
DOOSAN ENGINE CO., LTD.
SEPARATE STATEMENTS OF FINANCIAL POSITION
AS OF DECEMBER 31, 2012 AND, 2011
(In Korean won)
ASSETS Notes December 31, 2012 December 31, 2011
CURRENT ASSETS
Cash and cash equivalents 4 and 10 ₩ 94,678,541,896 ₩ 320,469,576,651
Short-term financial instruments 4 and 10 170,016,124,100 146,614,526,202
Short-term loans receivable 10 1,128,650,000 1,247,550,000
Trade and other receivables 4, 6, 10, 31 and 33 85,273,333,022 150,427,478,141
Gross amount due from customers
for contract work
24
5,930,477 55,876,191
Current derivative instrument assets 3, 9 and 10 38,090,761,839 8,153,605,085
Current firm commitment assets 9 20,627,029,543 66,708,349,474
Inventories 7 205,200,840,990 247,231,575,247
Other current assets 18,275,910,318 41,219,093,850
Total current assets 633,297,122,185 982,127,630,841
NON-CURRENT ASSETS
Long-term financial instruments 4, 5 and 10 1,765,725,601 4,290,192,960
Long-term investment securities 4, 8, 10 7,922,117,114 72,047,000
Investments in subsidiary and
associated companies
2, 3 and 11
363,994,102,690 365,024,719,731
Long-term loans receivable 4 and 10 5,155,220,988 7,251,719,621
Long-term other receivable 4, 6 and 10 14,958,733,970 8,131,176,298
Property, plant and equipment 12 576,429,596,197 551,384,215,311
Intangible assets 13 18,614,288,888 14,536,132,373
Investment property 14 - 36,130,101,804
Non-current derivative instrument
assets
4, 9 and 10
12,352,565,282 3,752,006,943
Non-current firm commitment assets 9 36,354,513,147 74,959,113,548
Other non-current assets 2,124,322,657 3,821,555,338
Total non-current assets 1,039,671,186,534 1,069,352,980,927
TOTAL ASSETS ₩ 1,672,968,308,719 ₩ 2,051,480,611,768
(Continued)
DOOSAN ENGINE CO., LTD.
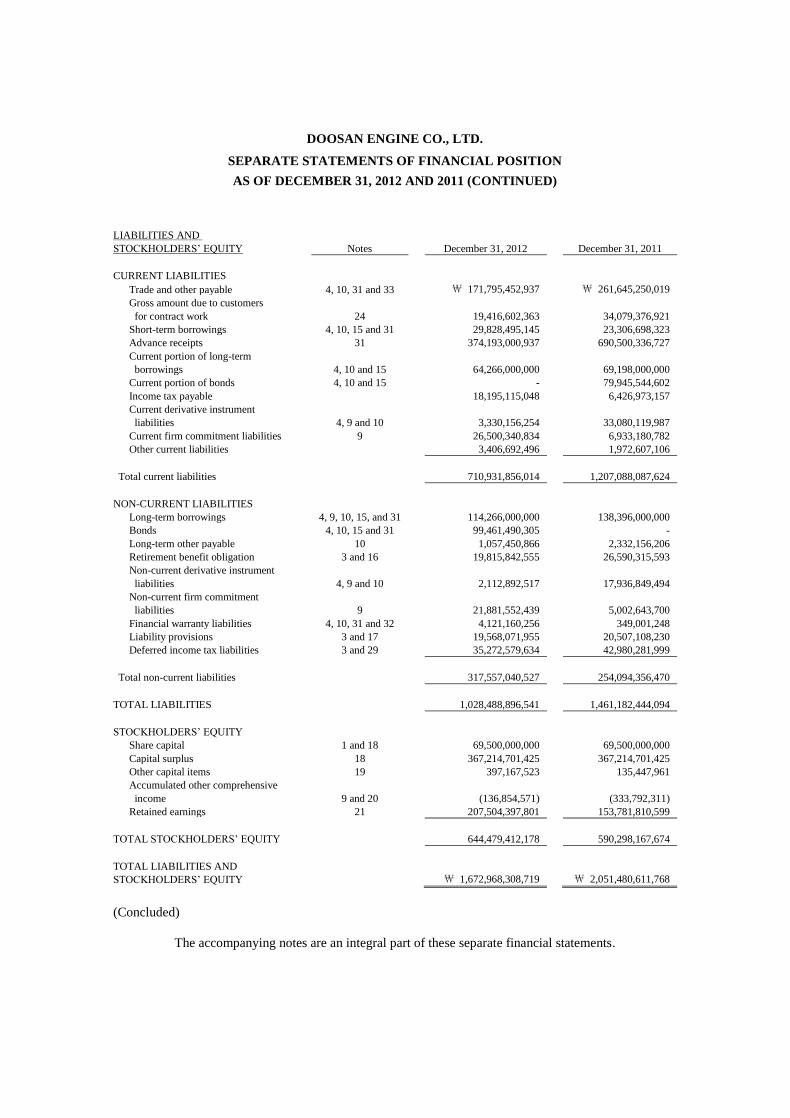
SEPARATE STATEMENTS OF FINANCIAL POSITION
AS OF DECEMBER 31, 2012 AND 2011 (CONTINUED)
LIABILITIES AND
STOCKHOLDERS’ EQUITY Notes December 31, 2012 December 31, 2011
CURRENT LIABILITIES
Trade and other payable 4, 10, 31 and 33 ₩ 171,795,452,937 ₩ 261,645,250,019
Gross amount due to customers
for contract work 24 19,416,602,363 34,079,376,921
Short-term borrowings 4, 10, 15 and 31 29,828,495,145 23,306,698,323
Advance receipts 31 374,193,000,937 690,500,336,727
Current portion of long-term
borrowings 4, 10 and 15
64,266,000,000
69,198,000,000
Current portion of bonds 4, 10 and 15 - 79,945,544,602
Income tax payable 18,195,115,048 6,426,973,157
Current derivative instrument
liabilities 4, 9 and 10 3,330,156,254 33,080,119,987
Current firm commitment liabilities 9 26,500,340,834 6,933,180,782
Other current liabilities 3,406,692,496 1,972,607,106
Total current liabilities 710,931,856,014 1,207,088,087,624
NON-CURRENT LIABILITIES
Long-term borrowings 4, 9, 10, 15, and 31 114,266,000,000 138,396,000,000
Bonds 4, 10, 15 and 31 99,461,490,305 -
Long-term other payable 10 1,057,450,866 2,332,156,206
Retirement benefit obligation 3 and 16 19,815,842,555 26,590,315,593
Non-current derivative instrument
liabilities 4, 9 and 10
2,112,892,517
17,936,849,494
Non-current firm commitment
liabilities 9 21,881,552,439 5,002,643,700
Financial warranty liabilities 4, 10, 31 and 32 4,121,160,256 349,001,248
Liability provisions 3 and 17 19,568,071,955 20,507,108,230
Deferred income tax liabilities 3 and 29 35,272,579,634 42,980,281,999
Total non-current liabilities 317,557,040,527 254,094,356,470
TOTAL LIABILITIES 1,028,488,896,541 1,461,182,444,094
STOCKHOLDERS’ EQUITY
Share capital 1 and 18 69,500,000,000 69,500,000,000
Capital surplus 18 367,214,701,425 367,214,701,425
Other capital items 19 397,167,523 135,447,961
Accumulated other comprehensive
income 9 and 20 (136,854,571) (333,792,311)
Retained earnings 21 207,504,397,801 153,781,810,599
TOTAL STOCKHOLDERS’ EQUITY 644,479,412,178 590,298,167,674
TOTAL LIABILITIES AND
STOCKHOLDERS’ EQUITY ₩ 1,672,968,308,719 ₩ 2,051,480,611,768
(Concluded)
The accompanying notes are an integral part of these separate financial statements.
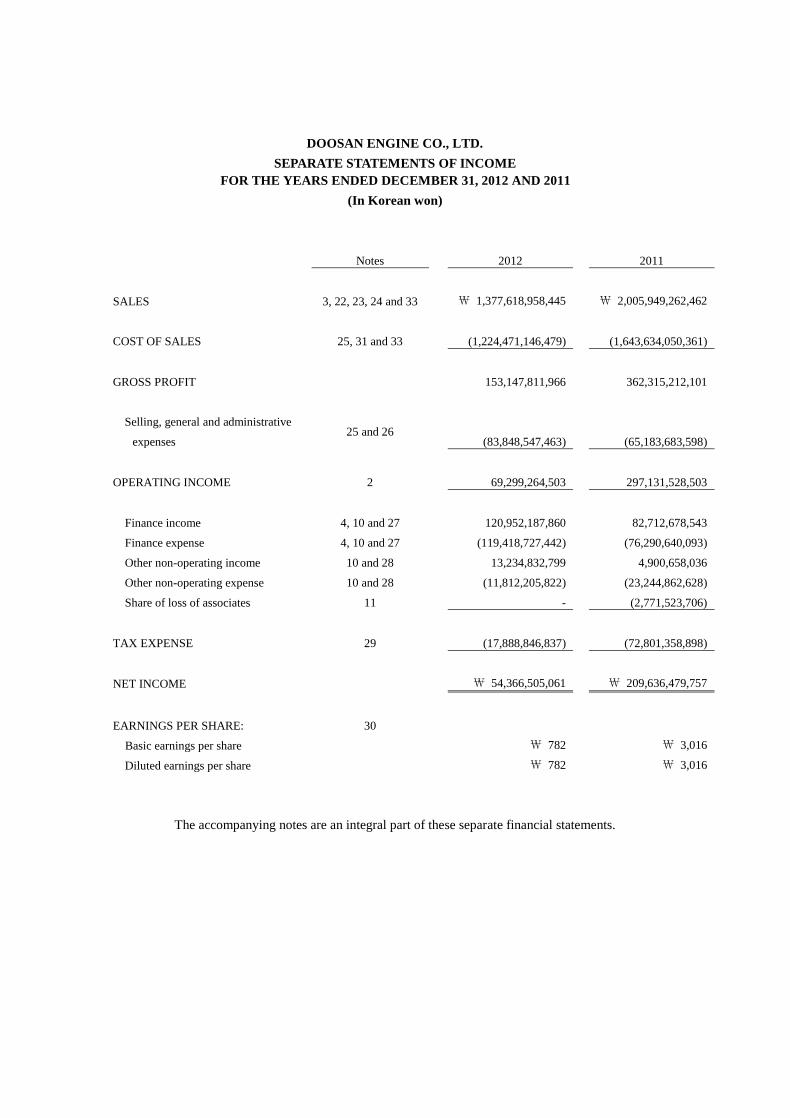
DOOSAN ENGINE CO., LTD.
SEPARATE STATEMENTS OF INCOME
FOR THE YEARS ENDED DECEMBER 31, 2012 AND 2011
(In Korean won)
Notes 2012 2011
SALES 3, 22, 23, 24 and 33 ₩ 1,377,618,958,445 ₩ 2,005,949,262,462
COST OF SALES 25, 31 and 33 (1,224,471,146,479) (1,643,634,050,361)
GROSS PROFIT 153,147,811,966 362,315,212,101
Selling, general and administrative
expenses 25 and 26
(83,848,547,463) (65,183,683,598)
OPERATING INCOME 2 69,299,264,503 297,131,528,503
Finance income 4, 10 and 27 120,952,187,860 82,712,678,543
Finance expense 4, 10 and 27 (119,418,727,442) (76,290,640,093)
Other non-operating income 10 and 28 13,234,832,799 4,900,658,036
Other non-operating expense 10 and 28 (11,812,205,822) (23,244,862,628)
Share of loss of associates 11 - (2,771,523,706)
TAX EXPENSE 29 (17,888,846,837) (72,801,358,898)
NET INCOME ₩ 54,366,505,061 ₩ 209,636,479,757
EARNINGS PER SHARE: 30
Basic earnings per share ₩ 782 ₩ 3,016
Diluted earnings per share ₩ 782 ₩ 3,016
The accompanying notes are an integral part of these separate financial statements.
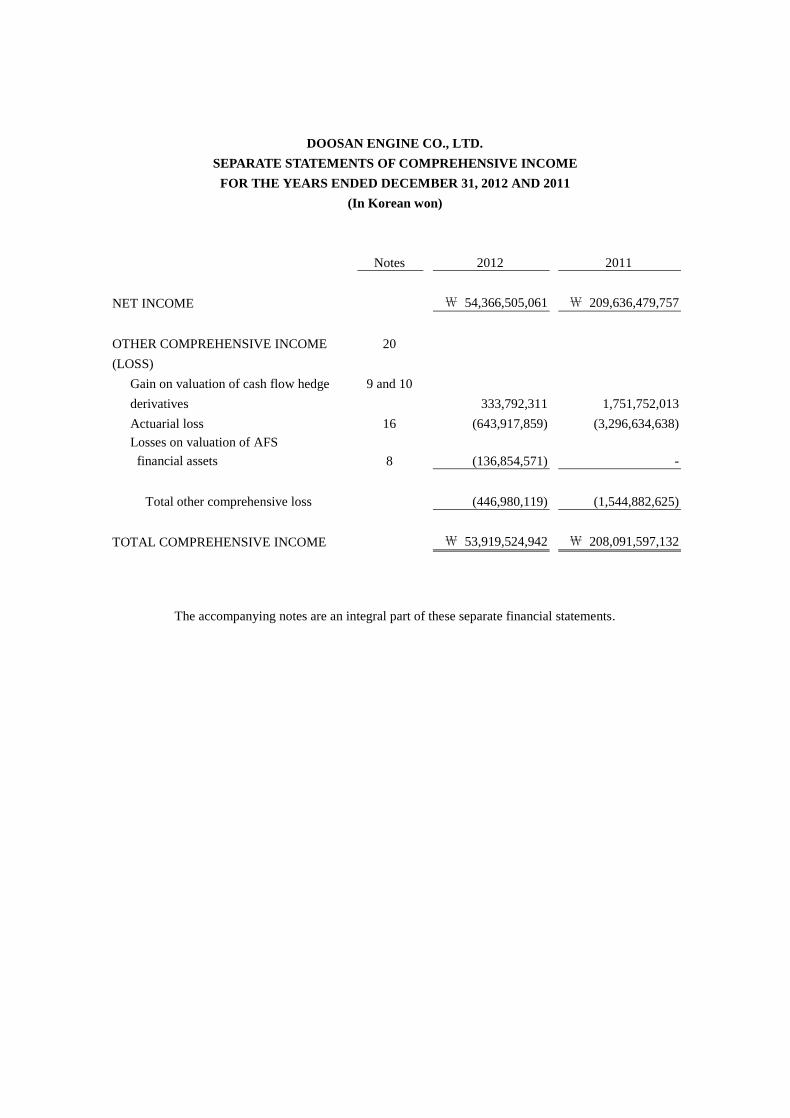
DOOSAN ENGINE CO., LTD.
SEPARATE STATEMENTS OF COMPREHENSIVE INCOME
FOR THE YEARS ENDED DECEMBER 31, 2012 AND 2011
(In Korean won)
Notes 2012 2011
NET INCOME ₩ 54,366,505,061 ₩ 209,636,479,757
OTHER COMPREHENSIVE INCOME
(LOSS)
20
Gain on valuation of cash flow hedge
derivatives
9 and 10
333,792,311 1,751,752,013
Actuarial loss 16 (643,917,859) (3,296,634,638)
Losses on valuation of AFS
financial assets
8
(136,854,571) -
Total other comprehensive loss (446,980,119) (1,544,882,625)
TOTAL COMPREHENSIVE INCOME ₩ 53,919,524,942 ₩ 208,091,597,132
The accompanying notes are an integral part of these separate financial statements.
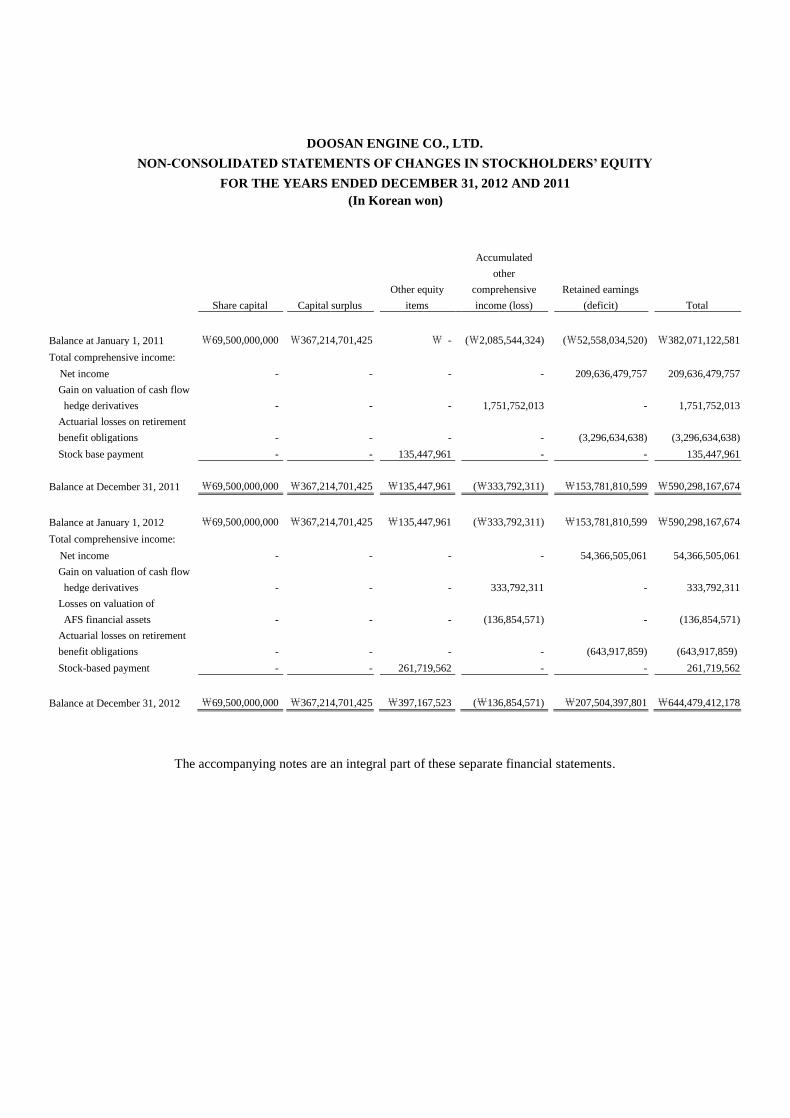
DOOSAN ENGINE CO., LTD.
NON-CONSOLIDATED STATEMENTS OF CHANGES IN STOCKHOLDERS’ EQUITY
FOR THE YEARS ENDED DECEMBER 31, 2012 AND 2011
(In Korean won)
Share capital Capital surplus
Other equity
items
Accumulated
other
comprehensive
income (loss)
Retained earnings
(deficit) Total
Balance at January 1, 2011 ₩69,500,000,000 ₩367,214,701,425 ₩ - (₩2,085,544,324) (₩52,558,034,520) ₩382,071,122,581
Total comprehensive income:
Net income - - - - 209,636,479,757 209,636,479,757
Gain on valuation of cash flow
hedge derivatives - - - 1,751,752,013 - 1,751,752,013
Actuarial losses on retirement
benefit obligations - - - - (3,296,634,638) (3,296,634,638)
Stock base payment - - 135,447,961 - - 135,447,961
Balance at December 31, 2011 ₩69,500,000,000 ₩367,214,701,425 ₩135,447,961 (₩333,792,311) ₩153,781,810,599 ₩590,298,167,674
Balance at January 1, 2012 ₩69,500,000,000 ₩367,214,701,425 ₩135,447,961 (₩333,792,311) ₩153,781,810,599 ₩590,298,167,674
Total comprehensive income:
Net income - - - - 54,366,505,061 54,366,505,061
Gain on valuation of cash flow
hedge derivatives - - - 333,792,311 - 333,792,311
Losses on valuation of
AFS financial assets - - - (136,854,571) - (136,854,571)
Actuarial losses on retirement
benefit obligations - - - - (643,917,859) (643,917,859)
Stock-based payment - - 261,719,562 - - 261,719,562
Balance at December 31, 2012 ₩69,500,000,000 ₩367,214,701,425 ₩397,167,523 (₩136,854,571) ₩207,504,397,801 ₩644,479,412,178
The accompanying notes are an integral part of these separate financial statements.
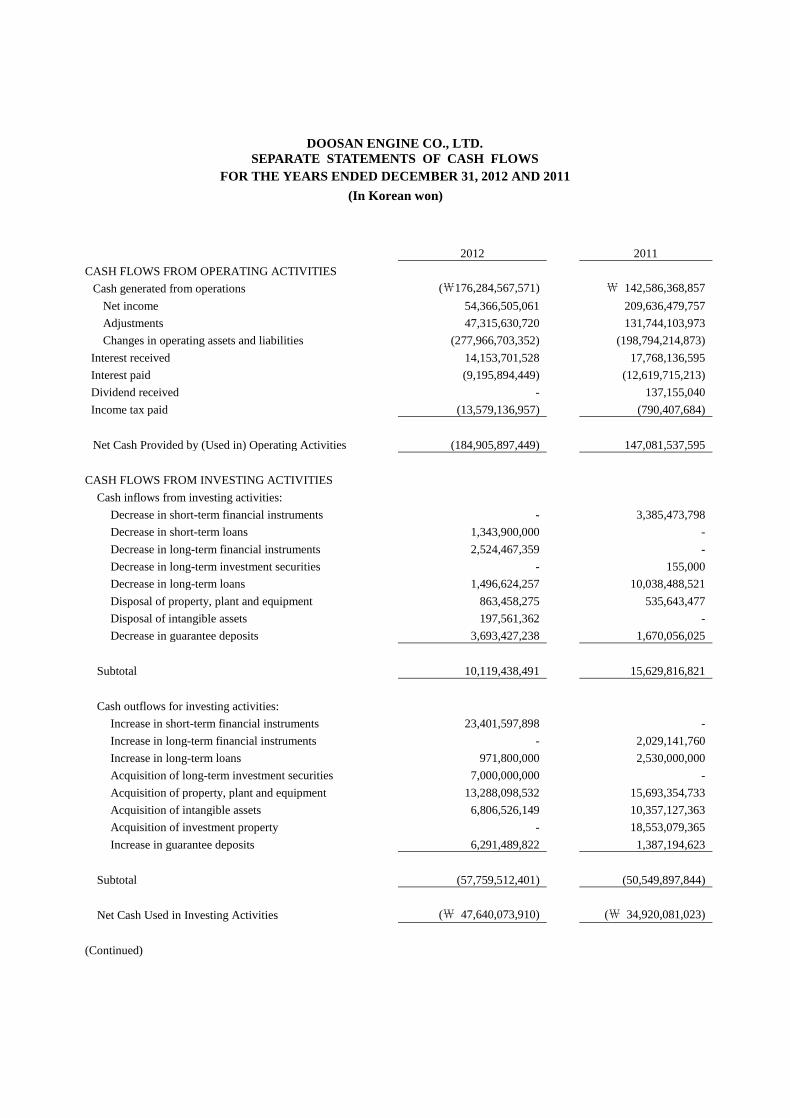
DOOSAN ENGINE CO., LTD.
SEPARATE STATEMENTS OF CASH FLOWS
FOR THE YEARS ENDED DECEMBER 31, 2012 AND 2011
(In Korean won)
2012 2011
CASH FLOWS FROM OPERATING ACTIVITIES
Cash generated from operations (₩176,284,567,571) ₩ 142,586,368,857
Net income 54,366,505,061 209,636,479,757
Adjustments 47,315,630,720 131,744,103,973
Changes in operating assets and liabilities (277,966,703,352) (198,794,214,873)
Interest received 14,153,701,528 17,768,136,595
Interest paid (9,195,894,449) (12,619,715,213)
Dividend received - 137,155,040
Income tax paid (13,579,136,957) (790,407,684)
Net Cash Provided by (Used in) Operating Activities (184,905,897,449) 147,081,537,595
CASH FLOWS FROM INVESTING ACTIVITIES
Cash inflows from investing activities:
Decrease in short-term financial instruments - 3,385,473,798
Decrease in short-term loans 1,343,900,000 -
Decrease in long-term financial instruments 2,524,467,359 -
Decrease in long-term investment securities - 155,000
Decrease in long-term loans 1,496,624,257 10,038,488,521
Disposal of property, plant and equipment 863,458,275 535,643,477
Disposal of intangible assets 197,561,362 -
Decrease in guarantee deposits 3,693,427,238 1,670,056,025
Subtotal 10,119,438,491 15,629,816,821
Cash outflows for investing activities:
Increase in short-term financial instruments 23,401,597,898 -
Increase in long-term financial instruments - 2,029,141,760
Increase in long-term loans 971,800,000 2,530,000,000
Acquisition of long-term investment securities 7,000,000,000 -
Acquisition of property, plant and equipment 13,288,098,532 15,693,354,733
Acquisition of intangible assets 6,806,526,149 10,357,127,363
Acquisition of investment property - 18,553,079,365
Increase in guarantee deposits 6,291,489,822 1,387,194,623
Subtotal (57,759,512,401) (50,549,897,844)
Net Cash Used in Investing Activities (₩ 47,640,073,910) (₩ 34,920,081,023)
(Continued)

DOOSAN ENGINE CO., LTD.
SEPARATE STATEMENTS OF CASH FLOWS (CONTINUED)
FOR THE YEARS ENDED DECEMBER 31, 2012 AND 2011
2012 2011
CASH FLOWS FROM FINANCING ACTIVITIES
Cash inflows from financing activities:
Proceeds from short-term borrowings ₩ 6,521,796,822 ₩ -
Proceeds from long-term borrowings 50,000,000,000 -
Proceeds from issuance of bonds 99,461,490,305 -
Subtotal 155,983,287,127 -
Cash outflows for financing activities:
Repayment of short-term borrowings - 10,143,870,938
Repayment of long-term borrowings 69,198,000,000 68,334,000,000
Repayment of bonds 80,000,000,000 50,000,000,000
Subtotal (149,198,000,000) (128,477,870,938)
Net Cash Provided by (used in) Financing Activities 6,785,287,127 (128,477,870,938)
EFFECT OF EXCHANGE RATE CHANGES ON
CASH AND CASH EQUIVALENTS (30,350,523) (91,487,512)
NET DECREASE IN CASH AND CASH
EQUIVALENTS (225,791,034,755) (16,407,901,878)
CASH AND CASH EQUIVALENTS, BEGINNING OF
YEAR 320,469,576,651 336,877,478,529
CASH AND CASH EQUIVALENTS, END OF YEAR ₩ 94,678,541,896 ₩ 320,469,576,651
(Concluded)
The accompanying notes are an integral part of these separate financial statements.

DOOSAN ENGINE CO., LTD.
NOTES TO SEPARATE FINANCIAL STATEMENTS
AS OF AND FOR THE YEARS ENDED DECEMBER 31, 2012 AND 2011
1. GENERAL:
Doosan Engine Co., Ltd. (DE or the “Company”), was incorporated on December 30, 1999,
under the Commercial Code of the Republic of Korea to manufacture and sell marine diesel
engines. The Company’s head office and plants are located in Changwon, Korea.
Under the Company’s Articles of Incorporation, the Company is authorized to issue 120,000
thousand shares of capital stock (par value of ₩1,000). As of December 31, 2012, the
Company issued 69,500 thousand common shares of ₩69,500,000 thousand.
On January 4, 2011, the Company’s shares were listed in the Korea Exchange.
The Company’s shares as of December 31, 2012, are owned as follows:
Name of stockholders
Number of
shares owned
Ownership
percentage (%)
Doosan Heavy Industries Construction Co., Ltd.
29,650,000 42.66%
Samsung Heavy Industries Co., Ltd. 9,815,000 14.12%
Daewoo Shipbuilding & Marine
Engineering Co., Ltd.
5,600,000 8.06%
Employee stock ownership association 2,115,584 3.04%
Others 22,319,416 32.12%
Total
69,500,000 100.00%
2. SUMMARY OF SIGNIFICANT ACCOUNTING POLICIES:
(1) Basis of preparation
The Company has prepared the separate financial statements in accordance with the
Korean International Financial Reporting Standards (“K-IFRS”) for the annual period
beginning on January 1, 2011.

The Company’s separate financial statements are prepared in accordance with K-IFRS
1027 Consolidated and Separated financial statements, in which the controlling company,
investors of associates or participants of joint control company have presented investments
based on its direct equity investment, not on investee’s reported performance and net
assets.
The significant accounting principles as applied in the consolidated financial statements
correspond to those pertaining to the annual consolidated financial statements for the year
ended December 31, 2011, except for the effects of the changes of accounting policies as
follows.
The accompanying separate financial statements have been prepared on historical cost
basis, except for certain properties/non-current assets and financial instruments that are
measured at revalued amounts or fair values, as explained in the accounting policies below.
Historical cost is generally based on the fair value of the consideration given.
The Company maintains its official accounting records in Korean won and prepares
consolidated financial statements in conformity with K-IFRS, in the Korean language
(Hangul). Accordingly, these consolidated financial statements are intended for use by
those who are informed about K-IFRS and Korean practices.
1) Amendments to K-IFRS affecting amounts reported in the separate financial
statements
The following amendments to K-IFRSs have been applied in the current year and have
affected the amounts reported in these separate financial statements.
Amendments to K-IFRS 1107 Disclosures – Transfers of Financial Assets
The Company may have transferred financial assets in such a way that part or all of the
transferred financial assets do not qualify for derecognition. The amendments to K-IFRS
1107 increase the disclosure requirements for transactions involving transfers of
financial assets in order to provide greater transparency around the nature of the
transferred assets, the nature of the risks and rewards of ownership to which the
Company is exposed, description of the nature of the relationship between the
transferred assets and the associated liabilities and carrying value of the associated
liabilities.
When the Company continues its involvement on the transferred assets although the
transferred assets are derecognized in their entirety, the Company discloses the carrying
amounts of the transferred assets and the associated liabilities and the information
showing maximum exposure to loss. The disclosures due to the application of these
amendments are disclosed in Note 31 (12).

Amendments to K-IFRS 1001 – Presentation of Financial Statements
In accordance with the amendments to K-IFRS 1001 Presentation of Financial
Statements, the Company presented operating income by deducting cost of sales and
selling, general and administrative expenses from revenue line item. The amendments
have been applied retrospectively for the comparative period.
The amendments have been applied retrospectively, and hence, the presentation of items
of operating income has been modified as follows (in thousands of Korean won):
2012
2011
Before
modified
After
modified
Before
modified
After
modified
Sales ₩ 1,372,244,281 ₩ 1,377,618,958
₩ 2,003,793,073
₩ 2,005,949,262
Cost of sales (1,224,471,146)
(1,224,471,146)
(1,643,634,050)
(1,643,634,050)
Selling, general and administrative
expenses (83,848,547)
(83,848,547)
(66,268,171)
(65,183,684)
Other operating revenue 18,609,510
-
8,141,335
-
Other operating expense (11,812,206)
-
(23,244,863)
-
Operating income 70,721,891
69,299,265
278,787,324
297,131,529
Non-operating income and expense 1,533,460
2,956,087
3,650,515
(14,693,690)
Income before income tax expense ₩ 72,255,352
₩ 72,255,352 ₩ 282,437,839
₩ 282,437,839
The amendments do not result in any impact on profit or loss and earning per shares.
2) New and revised K-IFRS in issue, but not yet effective
The Company has not applied the following new and revised K-IFRS that have been
issued, but are not yet effective.
Amendments to K-IFRS 1001 – Presentation of Financial Statements
The amendments to K-IFRS 1001 require items of other comprehensive income to be
grouped into two categories in the other comprehensive income section: (a) items that
will not be reclassified subsequently to profit or loss and (b) items that may be
reclassified subsequently to profit or loss when specific conditions are met. The
amendments are effective for annual periods beginning on or after July 1, 2012. The
Company does not anticipate that these amendments referred above will have a
significant effect on the Company’s separate financial statements and disclosures.
Amendments to K-IFRS 1019 – Employee Benefits
The amendments to K-IFRS 1019 require the recognition of changes in defined benefit
obligations and in fair value of plan assets when they occur and, hence, eliminate the
‘corridor approach’ permitted under the previous version of K-IFRS 1019 and accelerate
the recognition of past service costs. The amendments to K-IFRS 1019 are effective for
annual periods beginning on or after January 1, 2013. The Company anticipates that
these amendments referred above will have no effect on the Company’s separate
financial statements and disclosures.
Amendments to K-IFRS 1032 – Financial Instruments: Presentation
The amendments to K-IFRS 1032 clarify existing application issue relating to the offset
of financial assets and financial liabilities requirements. Specifically, the amendments
clarify the meaning of ‘currently has a legally enforceable right of setoff’ and
‘simultaneous realization and settlement’. Company’s right to offset must not be
conditional on the occurrence of future events, but enforceable anytime during the
contract periods, during the ordinary course of business with counterparty, a default of
counterparty and master netting agreement or in some forms of non-recourse debt. The
amendments to K-IFRS 1032 are effective for annual periods beginning on January 1,
2014. The Company is in the process of evaluating the impact on the separate financial
statements upon the adoption of amendments.
Amendments to K-IFRS 1107 – Financial Instruments: Disclosures
The amendments to K-IFRS 1107 are mainly focusing on presentation of the offset
between financial assets and financial liabilities. The amendments to K-IFRS 1107 are
effective for annual periods beginning on or after January 1, 2013. The Company does
not anticipate that these amendments referred above will have a significant effect on the
Company’s separate financial statements and disclosures.
K-IFRS 1113 – Fair Value Measurement
K-IFRS 1113 establishes a single source of guidance for fair value measurements and
disclosure about fair value measurements. The standard defines fair value, establishes a
framework for measuring fair value, and requires disclosures about fair value
measurements. This standard is effective for annual periods beginning on or after
January 1, 2013. The Company is reviewing the impact of the application of this
standard on the separate financial statements.
(2) Subsidiaries and associates
The Company’s separate financial statements are prepared in accordance with the K-IFRS
1027 Consolidated and Separate Financial Statements. The Company has elected to use
book value under previous GAAP as deemed cost for subsidiaries, joint ventures and
associates at the date of transition to K-IFRS. After the date of transition, subsidiaries,
joint ventures and associates are measured at cost. Dividends from subsidiaries, joint
ventures and associates are recognized as income when the right to receive payment is
established.
Dividends on subsidiary and associates are recognized in profit or loss when the
Company’s right to receive the dividends is established.
(3) Foreign currency translation
1) Functional currency and presentation currency
The Company’s separate financial statements are presented in the currency of the
primary economic environment in which it operates (its functional currency). The
functional currency and the presentation currency for the separate financial statements of
the Company is Korean won.
2) Foreign currency transaction and translation of balance
Transactions in currencies other than the Company’s functional currency are recognized
at the rates of exchange prevailing at the dates of the transactions. Foreign currency gain
(loss) from settlements of foreign currency transactions or translation of monetary items
denominated in foreign currencies is recognized in income or loss, whereas the gain
(loss) from qualified cash flow hedge and net investment hedge for foreign operations is
deferred as an equity item.

(4) Cash and cash equivalents
Cash and cash equivalents include cash on hand, demand deposits and short-term, highly
liquid investments with maturities (or date of redemption) of three months or less upon
acquisition. Bank overdraft is included in short-term borrowing account in the separate
statements of financial position.
(5) Financial instruments
1) Classification of financial assets
Financial assets are classified into the following specified categories: ‘financial assets at
fair value through profit or loss’, (FVTPL), ‘loans and receivables’, ‘available-for-sale
(AFS) financial assets’ and ‘held-to-maturity investments’. The classification depends
on the nature and purpose of the financial assets and is determined at the time of initial
recognition.
a) Financial assets at FVTPL
FVTPL includes financial assets classified as held for trading and financial assets
designated at FVTPL upon initial recognition. A financial asset is classified as FVTPL
if it has been acquired principally for the purpose of selling or repurchasing in the near
term. All derivative assets, except for derivatives that are designated and effective
hedging instruments, are classified as held for trading financial assets.
b) Loans and receivables
Loans and receivables are non-derivative financial assets with fixed or determinable
payments that are not quoted in an active market. Loans and receivables, which have
maturities of more than 12 months from the end of the reporting period, are classified
as non-current assets; otherwise, they are classified as current assets.
c) AFS financial assets
AFS financial assets are those non-derivative financial assets that are designated as
AFS or are not classified as loans and receivables, held-to-maturity investments or
financial assets at FVTPL. AFS financial assets are classified as non-current assets,
unless management has the intention to sell them within 12 months.
d) Held-to-maturity investments
Held-to-maturity investments are non-derivative financial instruments with fixed or
determinable payments and fixed maturity that the Company has the positive intention
and ability to hold to maturity. Held-to-maturity investments, which have maturities of
more than 12 months from the end of the reporting period, are classified as non-current
assets; otherwise, they are classified as current assets.
2) Recognition and measurement of financial assets
All financial assets are recognized on trade date when the purchase or sale of a financial
asset is under a contract whose terms require delivery of the financial asset within the
time frame established by the market concerned and are initially measured at fair value,
plus transaction costs, except for those financial assets classified as at FVTPL, which are
initially measured at fair value and related transaction costs are recognized in income or
loss.
Financial assets at FVTPL and AFS financial assets are subsequently measured at fair
value. Loans and receivables and held-to-maturity investments are measured at
amortized cost, using the effective interest method.
Gains or losses arising from changes in fair value of financial assets at FVTPL are
recognized in the other non-operating income and expense line item in the separate
statements of comprehensive income. Dividends on financial assets at FVTPL are
recognized in the other gains when the Company’s right to receive the dividends is
established.
Other AFS financial assets are measured at fair value. Gains and losses arising from
changes in fair value are recognized in other comprehensive income and accumulated in
the investments revaluation reserve. When the investment is disposed of or is
determined to be impaired, the cumulative gain or loss previously accumulated in the
investments revaluation reserve is reclassified to the other gains and losses line item in
the separate statements of comprehensive income.
Interest calculated using the effective interest method is recognized in financial income
or loss. Dividends on AFS equity instruments are recognized in income or loss when the
Company’s right to receive the dividends is established.
3) Impairment of financial assets
a) Financial assets measured at amortized cost
Financial assets are assessed for indicators of impairment at the end of each reporting
period. Financial assets are considered to be impaired when there is objective evidence
that events have occurred after the initial recognition of the financial asset and the
estimated future cash flows of the investment have been affected.
The amount of the impairment loss recognized is the difference between the asset’s
carrying amount and the present value of estimated future cash flows, discounted at the
financial asset’s original effective interest rate. The carrying amount of the financial
asset is reduced by the impairment assets and changes in the carrying amount of the
allowance account are recognized in profit or loss in the period. The Company
measures impairment loss based on the fair value of financial assets from observable
market data.
If, in a subsequent period, the amount of the impairment loss decreases and the
decrease can be related objectively to an event occurring after the impairment was
recognized, the previously recognized impairment loss is reversed and recognized in
income or loss.
b) AFS financial assets
The Company assesses at the end of each reporting period whether there is any
objective evidence that a financial asset or group of financial assets is impaired. For
equity investments classified as AFS, a significant or prolonged decline in the fair
value of the security below its cost is considered to be objective evidence of
impairment. If there is objective evidence of impairment on AFS financial assets, the
cumulative loss that has been recognized in other comprehensive income, less any
impairment loss previously recognized in income or loss is reclassified from equity to
income or loss. Impairment losses recognized in income or loss for an investment in an
equity instrument classified as AFS are not reversed through income or loss.
Meanwhile, if, in a subsequent period, the fair value of a debt instrument classified as
AFS increases and the increase can be objectively related to an event occurring after
the impairment loss was recognized in income or loss, the impairment loss is reversed
through income or loss.
4) Derecognition of financial assets
The Company derecognizes a financial asset only when the contractual rights to the cash
flows from the asset expire, or when it transfers the financial asset and, substantially, all
the risks and rewards of ownership of the asset to another entity.
5) Offsetting financial assets and financial liabilities
Financial assets and financial liabilities are offset as a net amount in the separate
statements of financial position when the Company has a legally enforceable right to set
off the recognized amounts of the assets and liabilities and intends to settle on a net
basis, or to realize the assets and the liabilities simultaneously.
(6) Accounts receivable
Accounts receivable are the amount owed by customer for products and services
provided in the ordinary course of business. Receivables expected to be collected within
one year are classified as current assets; otherwise, they are classified as non-current
assets. Accounts receivable are initially measured at fair value and presented as net
amount after measuring allowance. An allowance is individually recognized for
receivables that can be assessed individually for impairment. For financial assets that are
not individually significant and have similar credit risk characteristics, impairment is
recognized based on aging analysis and the Company’s past experience of accounts
receivable collecting rate.
(7) The gross amounts due from (to) customers
The gross amount due from customers for contract work is the net amount of costs
incurred, plus recognized profits and the sum of recognized losses and progress billings
for all contract in progress for which costs incurred, plus recognized profits exceed
progress billings. Total costs include cost to specific contract and fixed and variable
common cost, which are distributed in normal operation.
Contracts in progress for which costs incurred, plus recognized profits (less recognized
losses) exceed progress billings, a gross amount due from customers for contract work is
recognized as an asset in the separate statements of financial position. Similarly, at each
separate statement of financial position date, for all contracts in progress for which
progress billings exceed costs incurred, plus recognized profits (less recognized losses), a
gross amount due to customers for contract work is recognized as a liability in the
separate statements of financial position.
(8) Inventories
Inventories are stated at the lower of cost and net realizable value. Cost of inventories
includes fixed and variable manufacturing overhead costs, which are systematically
allocated to inventories by appropriate methods based on each category of inventory. The
cost of inventories is determined by the specific identification method for inventories in
transit. During the year, perpetual inventory systems are used to value inventories, which
are adjusted to physical inventory counts performed at the end of the year.
The Company periodically reviews changes in net realizable value of inventories due to
damage, obsolescence, decline in selling prices and others and recognizes loss on
inventory valuation. Net realizable value for merchandise, finished goods and work in
progress represents the estimated selling price for inventories, less all estimated costs of
completion and costs necessary to make the sale and current replacement cost for raw
materials.
Loss on inventory valuation is charged to cost of sales when it is ordinary and to other
expense when it is extraordinary. When the circumstances that previously caused
inventories to be written down below cost no longer exist and the new market value of
inventories subsequently recovers, the valuation loss is reversed to the extent of the
original valuation loss and the reversal is deducted from cost of sales.
(9) Property, plant and equipment
Property, plant and equipment are stated at cost, less subsequent accumulated
depreciation and accumulated impairment losses. When useful life of each part of an
item of property, plant and equipment is different compared to that of the item, that part
is recognized separately. The cost of an item of property, plant and equipment is directly
attributable to their purchase or construction, including the initial estimate of the costs of
dismantling and removing the item and restoring the site on which it is located.
Subsequent costs incurred to add or replace part of previously recognized item of
property, plant and equipment are added to the carrying amount of an asset or recognized
as a separate asset if it is probable that future economic benefits associated with the
assets will flow into the Company and the cost of an asset can be measured reliably, and
the carrying amount of what was replaced is derecognized. Routine maintenance and
repairs are expensed as incurred.
Depreciation expense for property, plant and equipment other than land is computed
using the straight-line method, which reflects most closely the pattern in which the asset’s
economic benefits are expected to be consumed by the Company over the estimated
useful lives of the assets as follows:
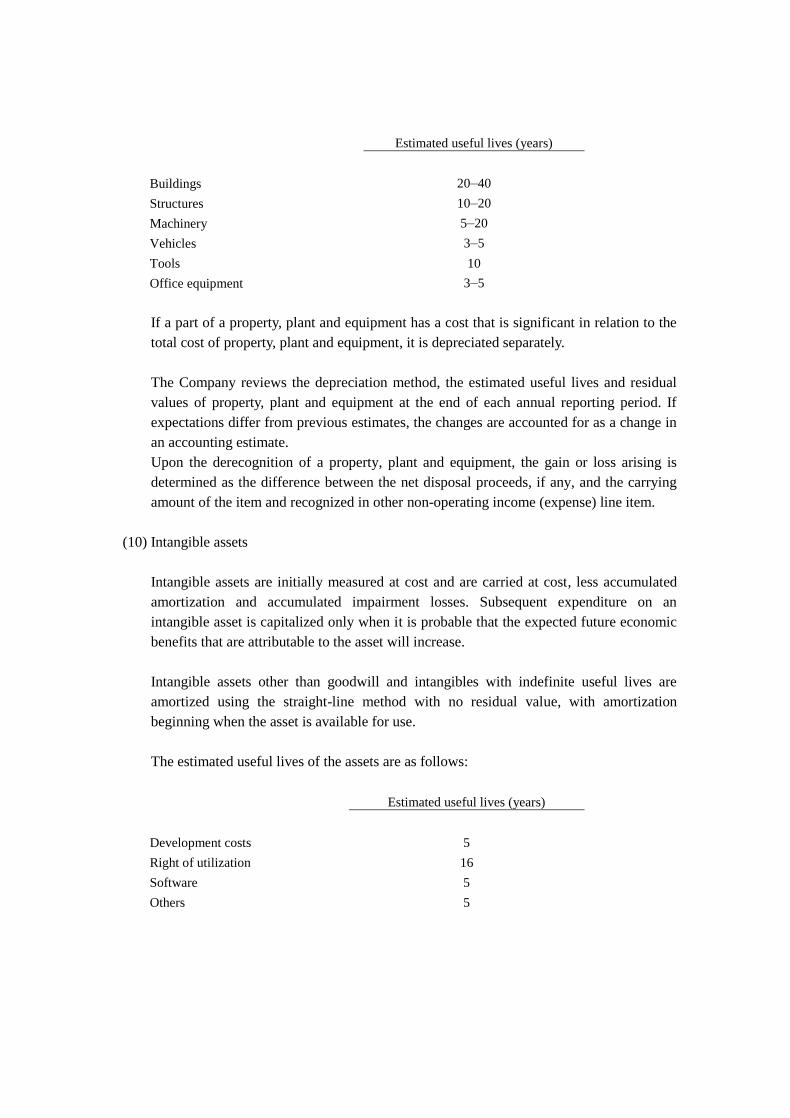
Estimated useful lives (years)
Buildings
20–40
Structures 10–20
Machinery 5–20
Vehicles 3–5
Tools 10
Office equipment 3–5
If a part of a property, plant and equipment has a cost that is significant in relation to the
total cost of property, plant and equipment, it is depreciated separately.
The Company reviews the depreciation method, the estimated useful lives and residual
values of property, plant and equipment at the end of each annual reporting period. If
expectations differ from previous estimates, the changes are accounted for as a change in
an accounting estimate.
Upon the derecognition of a property, plant and equipment, the gain or loss arising is
determined as the difference between the net disposal proceeds, if any, and the carrying
amount of the item and recognized in other non-operating income (expense) line item.
(10) Intangible assets
Intangible assets are initially measured at cost and are carried at cost, less accumulated
amortization and accumulated impairment losses. Subsequent expenditure on an
intangible asset is capitalized only when it is probable that the expected future economic
benefits that are attributable to the asset will increase.
Intangible assets other than goodwill and intangibles with indefinite useful lives are
amortized using the straight-line method with no residual value, with amortization
beginning when the asset is available for use.
The estimated useful lives of the assets are as follows:
Estimated useful lives (years)
Development costs 5
Right of utilization 16
Software 5
Others 5
However, useful lives of membership and other intangible assets are determined to be
indefinite as there is no foreseeable limit to the period over which the assets are expected
to generate net cash inflows for the Company, and they are not amortized and tested for
impairment once a year.
Capitalized development costs include expenditure on materials, salaries, wages and
other employment-related costs of personnel directly engaged in generating assets and
related overhead cost, which is systematically allocated. Capitalized development costs
are presented at the acquisition cost, less accumulated amortization and accumulated
impairment losses. Capitalized development costs are amortized using the straight-line
method over the estimated useful life, and amortization expenses are included in cost of
goods manufactured and amortization in selling, general and administrative expenses.
The expenditure on research and development, which does not meet the conditions noted
above, is recognized as an expense when it is incurred.
The estimated useful life and amortization method for intangible assets with finite useful
lives are reviewed at the end of each reporting period; and for the assets that have been
assessed as having indefinite useful life, the assessment is revisited each period, with the
effect of any changes in estimate being accounted for on a prospective basis
(11) Investment property
Investment properties are properties held to earn rentals and/or capital appreciation.
Investment properties are measured initially at cost, including transaction costs.
Subsequent to initial recognition, the book value of investment property is presented at
the cost, less accumulated depreciation and accumulated impairment.
While land is not depreciated, all other investment property is depreciated using the
straight-line method over 20 years.
The estimated useful lives, residual values and depreciation method are reviewed at the
end of each reporting period, with the effect of any changes in estimate accounted for on
a prospective basis.
(12) Borrowing costs
Borrowing costs directly attributable to the acquisition, construction or production of
qualifying assets, which are assets that necessarily take a substantial period of time to get
ready for their intended use or sale, are added to the cost of those assets, until such time
as the assets are substantially ready for their intended use or sale. All other borrowing
costs are recognized in income or loss in the period in which they are incurred.
(13) Impairment of non-financial assets, except for goodwill
At the end of each reporting period, the Company reviews the carrying amounts of its
non-financial assets, except for goodwill to determine whether there is any indication that
those assets have suffered an impairment loss. If any such indication exists, the
recoverable amount of the asset is estimated in order to determine the extent of the
impairment loss (if any). Where it is not possible to estimate the recoverable amount of
an individual asset, the Company estimates the recoverable amount of the
cash-generating unit to which the asset belongs. Intangible assets with indefinite useful
lives and intangible assets not yet available for use are tested for impairment at least
annually and, whenever, there is an indication that the asset may be impaired.
If the recoverable amount of an asset (or a cash-generating unit) is estimated to be less
than its carrying amount, the carrying amount of the asset (or the cash-generating unit) is
reduced to its recoverable amount. An impairment loss is recognized immediately in
profit or loss.
Where an impairment loss subsequently reverses, the carrying amount of the asset (or a
cash-generating unit) is increased to the revised estimate of its recoverable amount, but
the increased carrying amount does not exceed the carrying amount that would have been
determined had no impairment loss been recognized for the asset (or the cash-generating
unit) in prior years. A reversal of an impairment loss is recognized immediately in profit
or loss.
(14) Borrowings
Borrowings are measured at fair value, net of transaction costs and subsequently
measured at amortized cost using the effective interest method, with interest expense
being recognized on an effective yield basis. The difference between the amount received
and the redemption amount is amortized using the effective interest method and
recognized in income or loss. Borrowings are classified as non-current liabilities when
the Company has an unconditional right to defer settlement of the liability for at least 12
months after the end of the reporting period. Otherwise, borrowings are classified as
current liabilities.
(15) Financial guarantee contract liabilities
The Company measures payments required to reimburse the holder for a loss it incurs
because a specified debtor fails to make payment when due in accordance with the
original or modified terms of a debt instrument and recognizes financial liability.

Financial guarantee contract liabilities are initially measured at their fair values and, if
not designated as at FVTPL, are subsequently measured at the higher of:
• the amount of the obligation under the contract, as determined in accordance with
K-IFRS 1037 Provisions, Contingent Liabilities and Contingent Assets; and
• the amount initially recognized, less cumulative amortization recognized in accordance
with the K-IFRS 1018 Revenue
(16) Retirement benefit obligation
The Company operates a defined benefit pension plan. For defined benefit retirement
benefit plans, the cost of providing benefits is determined using the Projected Unit Credit
Method, with actuarial valuations being carried out at the end of each reporting period.
Present value of the defined benefit obligation is calculated by discounting estimated
future cash outflows by market yields on high-quality corporate bonds (public debt or
national), with similar maturity.
Actuarial gain or loss from changes in actuarial assumptions or differences between
actuarial assumptions and actual results is recognized in other comprehensive income in
the separate statements of comprehensive income, which is immediately recognized as
retained earnings. Actuarial gains and losses recognized in other comprehensive income
are not reclassified to profit or loss, but are immediately recognized in retained earnings.
Past service cost is recognized immediately to the extent that the benefits are already
vested, if not vested, the cost is amortized on a straight-line basis over the average period
until the benefits become vested.
The present value of the defined benefit obligation is denominated in the same currency
in which the benefits are expected to be paid and is calculated at the discount rate, which
is the yield at the reporting date on high-quality corporate bonds that have maturity dates
approximating the terms of the Company’s obligation.
(17) Provisions
Provisions are recognized when the Company has a present obligation (legal or
constructive) as a result of a past event, it is probable that the Company will be required
to settle the obligation, and a reliable estimate can be made of the amount of the
obligation. A provision is measured using the present value of the cash flows estimated to
settle the present obligation when the effect of the time value of money is material. At the
end of each reporting period, the remaining provision balance is reviewed and assessed to
determine if the current best estimate is being recognized. The increase in provision due
to passage of time is recognized as interest expense. If the existence of an obligation to
transfer economic benefit is no longer probable, the related provision is reversed during
the period.
(18) Derivative financial instruments
Derivatives are initially recognized at fair value at the date the derivative contract is
entered into and are subsequently remeasured to their fair value at the end of each
reporting period. The resulting gain or loss is recognized in profit or loss immediately,
unless the derivative is designated and effective as a hedging instrument, in such case, the
timing of the recognition in profit or loss depends on the nature of the hedge relationship.
A derivative with a positive fair value is recognized as a financial asset; and a derivative
with a negative fair value is recognized as a financial liability. A derivative is presented
as a non-current asset or a non-current liability if the remaining maturity of the
instrument is more than 12 months and it is not expected to be realized or settled within
12 months. Other derivatives are presented as current assets or current liabilities.
1) Hedge accounting
The Company designates certain derivatives as either hedges of recognized assets or
liabilities or firm commitments (fair value hedges), hedges of highly probable forecast
transactions or hedges of foreign currency risk of firm commitments (cash flow hedges).
At the inception of the hedge relationship, the entity documents the relationship between
the hedging instrument and the hedged item, along with its risk management objectives
and its strategy for undertaking various hedge transactions. Furthermore, at the inception
of the hedge and on an ongoing basis, the Company documents whether the hedging
instrument is highly effective in offsetting changes in the fair values or cash flows of the
hedged item.
a) Fair value hedges
Changes in the fair value of derivatives that are designated and qualify as fair value
hedges are recognized in income or loss immediately, together with any changes in
the fair value of the hedged asset or liability that are attributable to the hedged risk.
Hedge accounting is discontinued when the Company revokes the hedging
relationship, when the hedging instrument expires or is sold, terminated or exercised,
or it no longer qualifies for hedge accounting. Any gain or loss accumulated in equity
at that time remains in equity and is recognized when the forecast transaction is
ultimately recognized in profit or loss. When a forecast transaction is no longer
expected to occur, the gain or loss accumulated in equity is recognized immediately
in profit or loss.

b) Cash flow hedges
The effective portion of changes in the fair value of derivatives that are designated
and qualify as cash flow hedges is recognized in other comprehensive income. The
gain or loss relating to the ineffective portion is recognized immediately in profit or
loss, and is included in the ‘other gains and losses’ line item.
Amounts previously recognized in other comprehensive income and accumulated in
equity are reclassified to profit or loss in the periods when the hedged item is
recognized in profit or loss, in the same line of the income statement as the
recognized hedged item.
Hedge accounting is discontinued when the Company revokes the hedging
relationship, when the hedging instrument expires or is sold, terminated, or exercised,
or it no longer qualifies for hedge accounting. Any gain or loss accumulated in equity
at that time remains in equity and is recognized when the forecast transaction is
ultimately recognized in profit or loss. When a forecast transaction is no longer
expected to occur, the gain or loss accumulated in equity is recognized immediately in
profit or loss.
2) Other derivatives
Derivatives, except for those designated and qualify as effective hedging instruments,
are measured at fair values and the changes in fair values are recognized in income or
loss.
(19) Dividend
Dividend payable is recognized as liability when declaration of the dividend is approved
at the stockholders’ meeting.
(20) Share-based payment arrangement
The Company recognizes share options granted to employees at the fair value at the grant
date. The fair value determined at the grant date of the share option is expensed on a
straight-line basis over the vesting period. The Company determines fair value of share
option using the Black-Scholes model.
(21) Revenue recognition
Revenue is measured at the fair value of the consideration received or receivable for the
sale of goods and rendering of services arising in the course of the ordinary activities of
the Company. Revenue is reduced for value-added tax, estimated customer returns,
rebates and trade discounts, and is presented after eliminating intercompany transactions.
The Company recognizes revenue when the amount of revenue can be measured reliably
and it is probable that the economic benefits associated with the transaction will flow to
the Company and when transaction meets the revenue recognition criteria specified by
activity.
1) Sale of goods
Revenue from the sale of goods is recognized when the Company has transferred to
the buyer the significant risks and rewards of ownership of the goods. Revenue is
recognized on initial delivery of the goods, net of expected discounts and returns
estimated based on historical data. The Company estimates and recognizes provision
for warranty and sales return arising from sale of goods.
2) Rendering of service
Where the outcome of a construction contract can be estimated reliably, revenue and
costs are recognized by reference to the stage of completion of the contract activity at
the end of the reporting period.
The reliable method to measure the value of the services performed is determined
based on the nature of transaction. The process involved in the execution of the task is
studied to understand the percentage of completeness and measure the progress by
calculating the ratio of accumulated costs incurred to the total estimated costs.
3) Other revenue
Dividend income from investments is recognized when the stockholders’ right to
receive payment has been established.
Interest income is accrued on a timely basis, by reference to the principal outstanding
and at the effective interest rate applicable, which is the rate that exactly discounts
estimated future cash receipts through the expected life of the financial asset to that
asset’s net carrying amount on initial recognition.
Rental income from investment properties is recognized on a straight-line basis over
the term of the lease.

(22) Income tax and deferred tax
Income tax expense is composed of current and deferred tax. Current and deferred taxes
are recognized in income or loss, except when they relate to items that are recognized in
other comprehensive income or directly in equity, in which case, the current and
deferred taxes are also recognized in other comprehensive income or directly in equity.
Income tax expense is sum of tax regarding to the Corporate Tax Act and tax added to
the income tax. It contains additional payment or refund incurred by past year. Current
income tax liability is calculated by using a tax rate, which is established or
substantially established until the end of financial statement date.
Deferred tax is recognized on temporary differences between the carrying amounts of
assets and liabilities in the separate financial statements and the corresponding tax bases
used in the computation of taxable profit. Deferred tax assets and liabilities are not
recognized if the temporary difference arises from the initial recognition (other than in a
business combination) of other assets and liabilities in a transaction that affects neither
the taxable income nor the accounting income.
Deferred tax assets and liabilities are measured at the tax rates that are expected to apply
in the period in which the liability is settled or the asset realized, based on tax rates (and
tax laws) that have been enacted or substantively enacted by the end of the reporting
period. The carrying amount of deferred tax assets is reviewed at the end of each
reporting period and reduced to the extent that it is no longer probable that sufficient
taxable income will be available to allow all or part of the asset to be recovered.
(23) Non-current assets held for sale
Non-current assets and disposal groups are classified as held for sale if their carrying
amount will be recovered principally through a sale transaction rather than through
continuing use. This condition is regarded as met only when the sale is highly probable
and the non-current asset (or disposal group) is available for immediate sale in its present
condition. Management must be committed to the sale, which should be expected to
qualify for recognition as a completed sale within one year from the date of
classification.
Non-current assets (and disposal groups) classified as held for sale are measured at the
lower of their previous carrying amount and fair value, less costs to sell.
(24) Non-current assets held for sale
Sales department has been reported as a briefing paper to be reported to the management
of the Company. The Company’s management is responsible for evaluating the
achievement of the sales department and the resources that are allocated to the sales
department.
(25) Approval of financial statements
The separate financial statements for the year ended December 31, 2012, were approved
by the board of directors on March 7, 2013.
3. CRITICAL JUDGMENTS IN APPLYING ACCOUNTING POLICIES:
In the application of the Company’s accounting policies, management is required to make
judgments, estimates and assumptions about the carrying amounts of assets and liabilities
that are not readily apparent from other sources. The estimates and associated assumptions
are based on historical experience and other factors that are considered to be relevant. Actual
results may differ from those estimates.
The estimates and underlying assumptions are reviewed on an ongoing basis. Revisions to
accounting estimates are recognized in the period in which the estimate is revised if the
revision affects only that period. The revisions are recognized in the period of revision and
future periods if the revision affects both current and future periods.
(1) Revenue recognition
Revenue from service or construction projects is recognized based on percentage
-of-completion method. It needs to estimate a rate which can measure the service
provided by the company, and can be critically changed by relevant factors.
(2) Provision for construction losses
The Company provides warranty for product at the time of related revenue recognition (at
the time of sale). Provisions for the expected cost of warranty obligations are recognized
at the best estimate of the expenditure required to settle the Company’s current and future
obligations. These estimates could be changed in the future period by additional
provision under local legislation and practice.
(3) Defined benefit obligation
The Company operates a defined benefit pension plan, which is funded by the Company
and managed by insurance companies and trustees, based on actuarial calculations
periodically performed. The assumptions about the method are based on discount rate,
expected rate of salary increase and expected rate of return on plan assets; these estimates
may contain significant uncertainty.
(4) Measurement of carrying amount
Determining whether non-financial asset is impaired requires an estimation of the value
in use of individual asset units or the cash-generating units. The value-in-use calculation
requires the directors to estimate the future cash flows expected to arise from the
cash-generating unit and a suitable discount rate in order to calculate present value.
(5) Deferred tax
Recognition and measurement of deferred tax assets and liabilities require the
management’s judgment, in particular, whether to recognize if the scope of deferred tax
assets is affected by management’s judgment and assumption in the future.
4. FINANCIAL RISK MANAGEMENT:
The Company is exposed to various financial risks, such as market, credit and liquidity. The
purpose of financial risk management of the Company is to enhance efficiency of financial
management and improve the financial structure to create a stable and continuous
management performance.
Financial risk management activities, such as identification, evaluation and hedge, are mostly
performed by treasury department under close cooperation of the relevant department. The
Company focuses on minimizing effect of financial risk through regular monitoring.
(1) Market risk
1) Foreign exchange risk
The Company is exposed to foreign currency risk, since it makes transactions in foreign
currencies. The Company’s goal about foreign exchange risk control is to minimize
income/loss volatility by exchange fluctuations. Foreign exchange risk control is
managed by the Company’s policy on foreign exchange risk management. Foreign
exchange management of speculative purpose is strictly prohibited.
The Company reduces exposure to foreign currency risk by matching the inflow and the
outflow of foreign currencies (natural hedge), and manages foreign currency risk by
using currency derivatives, such as currency forwards, for the remaining exposure.
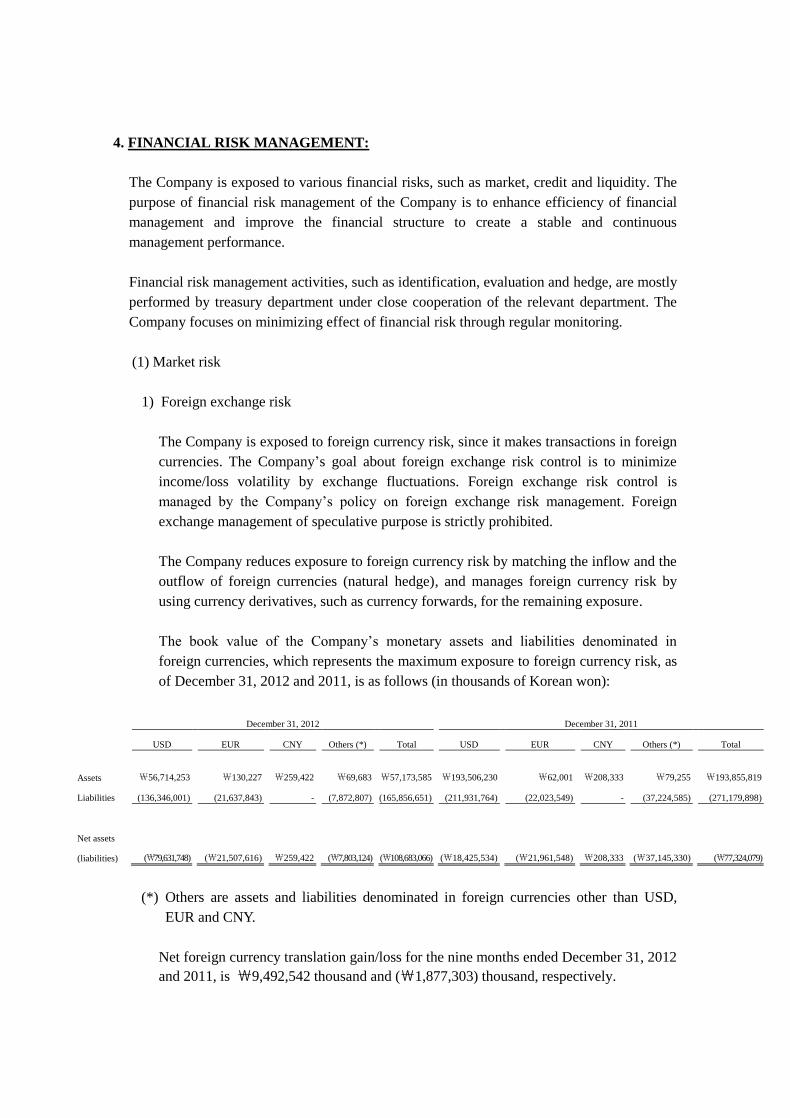
The book value of the Company’s monetary assets and liabilities denominated in
foreign currencies, which represents the maximum exposure to foreign currency risk, as
of December 31, 2012 and 2011, is as follows (in thousands of Korean won):
December 31, 2012 December 31, 2011
USD EUR CNY Others (*) Total USD EUR CNY Others (*) Total
Assets
₩56,714,253
₩130,227
₩259,422
₩69,683
₩57,173,585
₩193,506,230
₩62,001
₩208,333
₩79,255
₩193,855,819
Liabilities (136,346,001) (21,637,843) - (7,872,807) (165,856,651) (211,931,764) (22,023,549) - (37,224,585) (271,179,898)
Net assets
(liabilities)
(₩79,631,748)
(₩21,507,616)
₩259,422
(₩7,803,124)
(₩108,683,066)
(₩18,425,534)
(₩21,961,548)
₩208,333
(₩37,145,330)
(₩77,324,079)
(*) Others are assets and liabilities denominated in foreign currencies other than USD,
EUR and CNY.
Net foreign currency translation gain/loss for the nine months ended December 31, 2012
and 2011, is ₩9,492,542 thousand and (₩1,877,303) thousand, respectively.
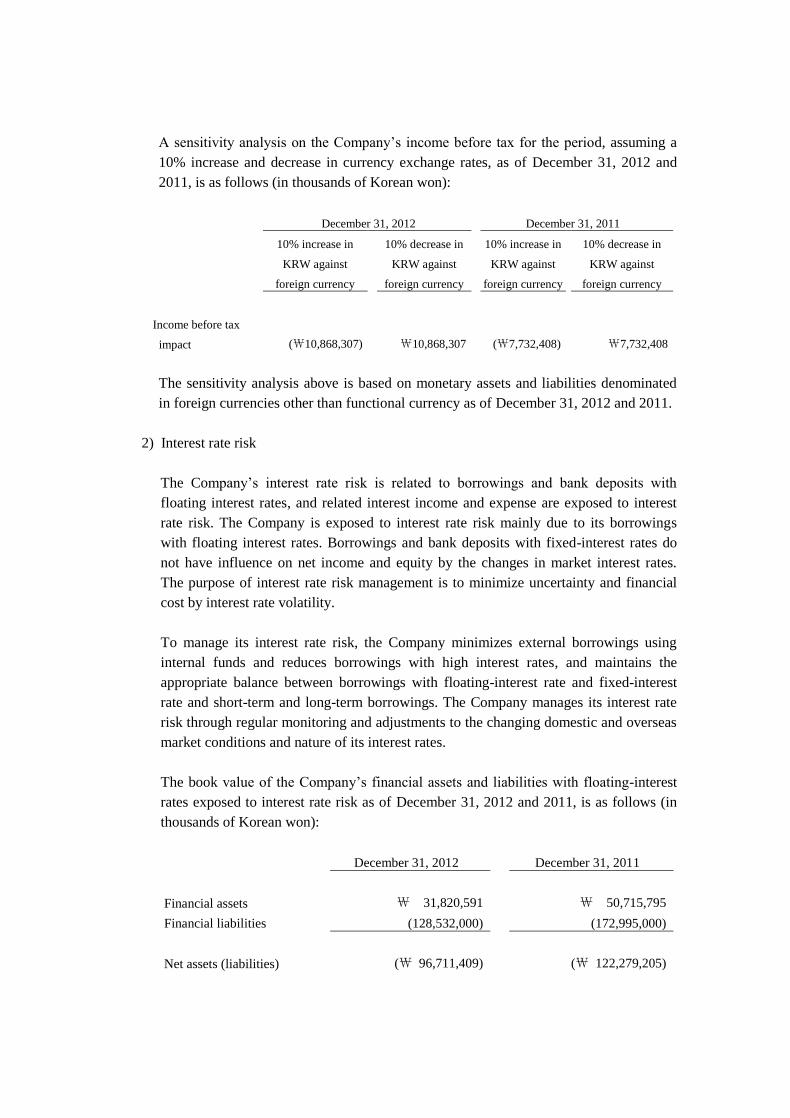
A sensitivity analysis on the Company’s income before tax for the period, assuming a
10% increase and decrease in currency exchange rates, as of December 31, 2012 and
2011, is as follows (in thousands of Korean won):
December 31, 2012 December 31, 2011
10% increase in
KRW against
foreign currency
10% decrease in
KRW against
foreign currency
10% increase in
KRW against
foreign currency
10% decrease in
KRW against
foreign currency
Income before tax
impact (₩10,868,307) ₩10,868,307 (₩7,732,408) ₩7,732,408
The sensitivity analysis above is based on monetary assets and liabilities denominated
in foreign currencies other than functional currency as of December 31, 2012 and 2011.
2) Interest rate risk
The Company’s interest rate risk is related to borrowings and bank deposits with
floating interest rates, and related interest income and expense are exposed to interest
rate risk. The Company is exposed to interest rate risk mainly due to its borrowings
with floating interest rates. Borrowings and bank deposits with fixed-interest rates do
not have influence on net income and equity by the changes in market interest rates.
The purpose of interest rate risk management is to minimize uncertainty and financial
cost by interest rate volatility.
To manage its interest rate risk, the Company minimizes external borrowings using
internal funds and reduces borrowings with high interest rates, and maintains the
appropriate balance between borrowings with floating-interest rate and fixed-interest
rate and short-term and long-term borrowings. The Company manages its interest rate
risk through regular monitoring and adjustments to the changing domestic and overseas
market conditions and nature of its interest rates.
The book value of the Company’s financial assets and liabilities with floating-interest
rates exposed to interest rate risk as of December 31, 2012 and 2011, is as follows (in
thousands of Korean won):
December 31, 2012 December 31, 2011
Financial assets ₩ 31,820,591 ₩ 50,715,795
Financial liabilities (128,532,000) (172,995,000)
Net assets (liabilities) (₩ 96,711,409) (₩ 122,279,205)

A sensitivity analysis on the Company’s income before tax assuming a 1% increase and
decrease in interest rates as of December 31, 2012 and 2011, is as follows (in thousands
of Korean won):
December 31, 2012 December 31, 2011
1%
increase
1%
decrease
1%
increase
1%
decrease
Income before tax impact (₩967,114)) ₩967,114 (₩1,222,792) ₩1,222,792
3) Price risk
The Company is exposed to equity price risks arising from its listed equity investments
among AFS equity investments. The Company periodically measures the risk that the
fair value or future cash flows of equity investments may fluctuate due to the changes in
market prices. Important investments in the Company’s portfolio are individually
managed, and acquisition and disposal are approved by the management of the
Company.
(2) Credit risk
As one of the parties of financial instrument may fail to perform the duty, the Company
is exposed to credit risk, which may inflict financial losses to the other party. Credit risk
primarily affects accounts receivable and other receivables for customers, as well as AFS
investments, deposits, financial derivatives and payment guarantees. The Company
transacts with customers that are above an acceptable level in order to manage credit risk
and operate policy and procedure to reinforce financial assets.
When the Company enters into contracts with new customers, it will be provided with
security or payment guarantees based on open financial information and information
provided by credit-rating agencies.
Also, the Company reassesses the credit rating of customers periodically, reconsiders
maximum credit limit and readjusts security level. The Company reports the delinquent
account receivable situation and proper measures about financial assets that delayed
collection.
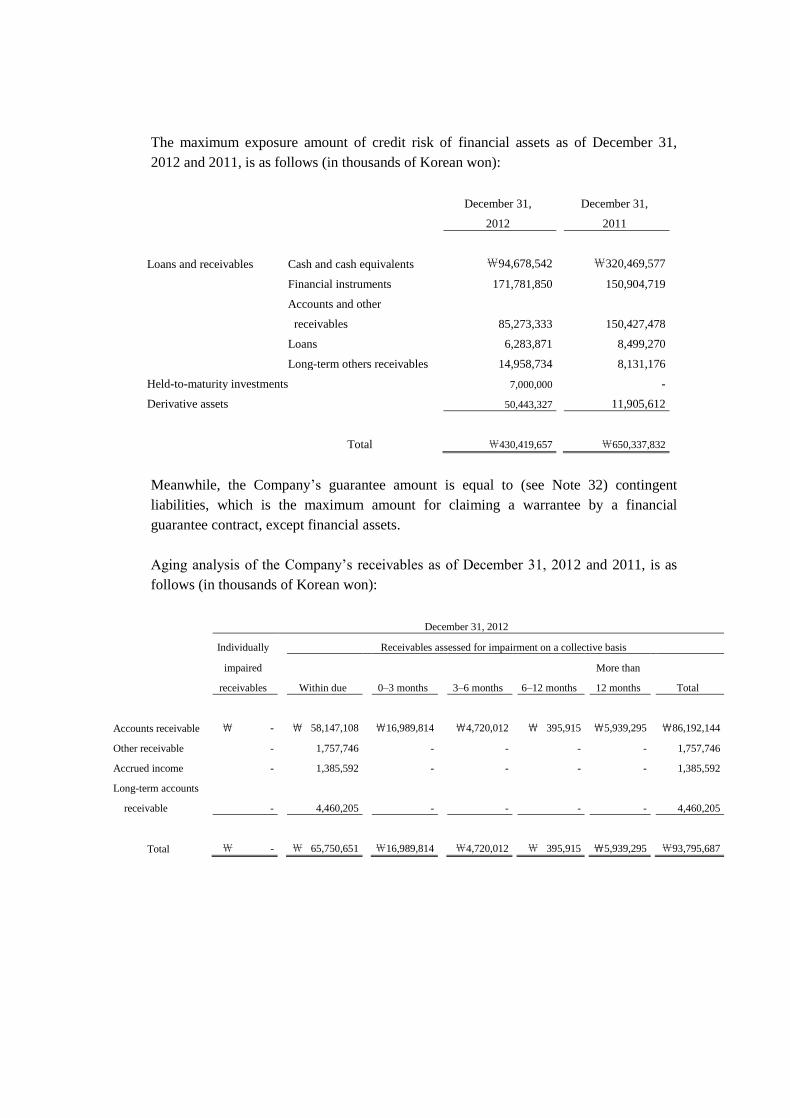
The maximum exposure amount of credit risk of financial assets as of December 31,
2012 and 2011, is as follows (in thousands of Korean won):
December 31,
2012
December 31,
2011
Loans and receivables Cash and cash equivalents ₩94,678,542 ₩320,469,577
Financial instruments 171,781,850 150,904,719
Accounts and other
receivables
85,273,333
150,427,478
Loans 6,283,871 8,499,270
Long-term others receivables 14,958,734 8,131,176
Held-to-maturity investments 7,000,000 -
Derivative assets 50,443,327 11,905,612
Total ₩430,419,657 ₩650,337,832
Meanwhile, the Company’s guarantee amount is equal to (see Note 32) contingent
liabilities, which is the maximum amount for claiming a warrantee by a financial
guarantee contract, except financial assets.
Aging analysis of the Company’s receivables as of December 31, 2012 and 2011, is as
follows (in thousands of Korean won):
December 31, 2012
Individually Receivables assessed for impairment on a collective basis
impaired
receivables Within due 0–3 months 3–6 months 6–12 months
More than
12 months Total
Accounts receivable ₩ - ₩ 58,147,108 ₩16,989,814 ₩4,720,012 ₩ 395,915 ₩5,939,295 ₩86,192,144
Other receivable - 1,757,746 - - - - 1,757,746
Accrued income - 1,385,592 - - - - 1,385,592
Long-term accounts
receivable
- 4,460,205 - - - - 4,460,205
Total ₩ - ₩ 65,750,651 ₩16,989,814 ₩4,720,012 ₩ 395,915 ₩5,939,295 ₩93,795,687

December 31, 2011
Individually Receivables assessed for impairment on a collective basis
impaired
receivables Within due 0–3 months 3–6 months 6–12 months
More than
12 months Total
Accounts receivable ₩ - ₩105,332,830 ₩22,286,327 ₩153,125 ₩6,057,820 ₩242,534 ₩134,072,636
Other receivable - 17,873,045 - - - - 17,873,045
Accrued income - 2,478,837 - - - - 2,478,837
Total ₩ - ₩125,684,712 ₩22,286,327 ₩153,125 ₩6,057,820 ₩242,534 ₩154,424,518
An allowance account is recognized by applying appropriate allowance rate for
receivables that can be assessed to be impaired individually due to insolvency,
bankruptcy and others. Group of financial assets that are not individually significant and
have similar credit risk characteristics are assessed for impairment on a collective basis.
An allowance account is recognized based on aging analysis and the Company’s past
experience of receivables collection.
Other receivables, AFS and held-to-maturity financial assets, deposits in financial
institution and derivative instruments are individually assessed for impairment.
(3) Liquidity risk
Liquidity risk is the risk that the Company will encounter difficulty in meeting its
financial liabilities obligations related to its financing for its operation.
The Company forecasts cash flows from operating, investing and financing activities
through a cash flow budget regularly. This secures and retains a necessary liquidity scale
in advance. Also, this manages a possible liquidity risk for the future.
The Company’s major non-derivative liabilities as of December 31, 2012 and 2011, are
matured as follows (in thousands of Korean won):
December 31, 2012
Nominal cash flows according to contract (*)
Book value Total
Less than
1 year 1-2 years 2-5 years
More than
5 years
Financial liability ₩480,674,889 ₩481,213,399 ₩265,889,948 ₩65,323,451 ₩150,000,000 ₩-
Interest expense - 33,364,587 10,070,762 8,238,824 15,055,000 -
Total
₩480,674,889 ₩514,577,986 ₩275,960,710 ₩73,562,275 ₩165,055,000 ₩-
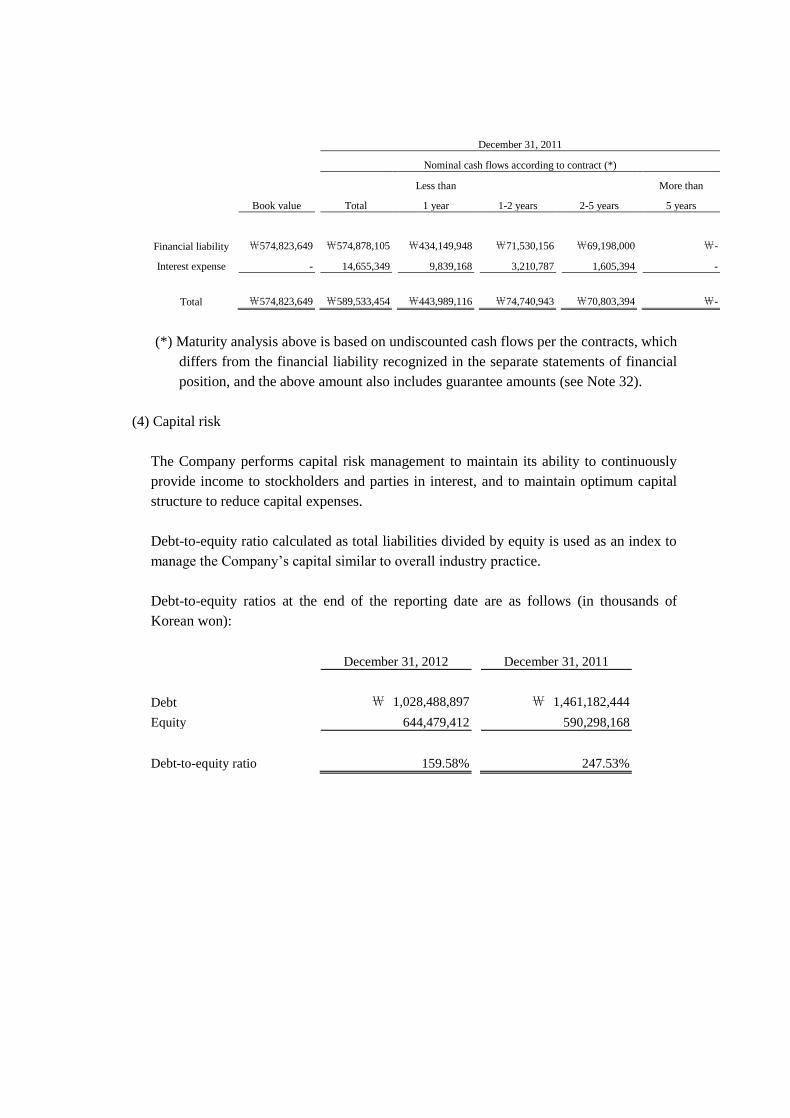
December 31, 2011
Nominal cash flows according to contract (*)
Book value Total
Less than
1 year 1-2 years 2-5 years
More than
5 years
Financial liability ₩574,823,649 ₩574,878,105 ₩434,149,948 ₩71,530,156 ₩69,198,000 ₩-
Interest expense - 14,655,349 9,839,168 3,210,787 1,605,394 -
Total
₩574,823,649 ₩589,533,454 ₩443,989,116 ₩74,740,943 ₩70,803,394 ₩-
(*) Maturity analysis above is based on undiscounted cash flows per the contracts, which
differs from the financial liability recognized in the separate statements of financial
position, and the above amount also includes guarantee amounts (see Note 32).
(4) Capital risk
The Company performs capital risk management to maintain its ability to continuously
provide income to stockholders and parties in interest, and to maintain optimum capital
structure to reduce capital expenses.
Debt-to-equity ratio calculated as total liabilities divided by equity is used as an index to
manage the Company’s capital similar to overall industry practice.
Debt-to-equity ratios at the end of the reporting date are as follows (in thousands of
Korean won):
December 31, 2012 December 31, 2011
Debt ₩ 1,028,488,897 ₩ 1,461,182,444
Equity 644,479,412 590,298,168
Debt-to-equity ratio 159.58% 247.53%

5. RESTRICTED DEPOSITS:
Details of restricted deposits as of December 31, 2012 and 2011, are as follows (in
thousands of Korean won):
Account
December 31
2012
December 31
2011
Remarks
Long-term financial instruments ₩ 5,500 ₩ 5,500 Guarantee deposits for checking account
- 4,284,693 Pledged as collateral for note
1,760,226 - Employee stock ownership loan secured by deposits
Total
₩ 1,765,726
₩ 4,290,193
6. ACCOUNTS AND OTHER RECEIVABLES:
(1) Accounts and other receivables as of December 31, 2012 and 2011, consist of the
following (in thousands of Korean won):
December 31, 2012 December 31, 2011
Gross
Allowance
for doubtful
accounts
Carrying
value
Gross
Allowance for
doubtful accounts Carrying value
CURRENT
Trade receivables ₩86,192,144 (₩4,125,329) ₩82,066,815 ₩134,072,636 (₩4,060,220) ₩130,012,416
Other receivables 1,757,746 - 1,757,746 17,873,045 - 17,873,045
Accrued income 1,385,592 - 1,385,592 2,478,837 - 2,478,837
Guarantee deposits 63,180 - 63,180 63,180 - 63,180
Subtotal
89,398,662 (4,125,329) 85,273,333 154,487,698 (4,060,220) 150,427,478
NON-CURRENT
Other receivables 4,234,765 - 4,234,765 - - -
Guarantee deposits 10,723,969 - 10,723,969 8,131,176 - 8,131,176
Subtotal 14,958,734 - 14,958,734 8,131,176 - 8,131,176
Total ₩104,357,396 (₩4,125,329) ₩100,232,067 ₩162,618,874 (₩4,060,220) ₩158,558,654

(2) The changes in allowance for doubtful accounts are as follows (in thousands of Korean
won):
2012
January 1, 2012 Increase Reversal December 31, 2012
Trade receivable (₩4,060,220) (₩65,109) ₩- (₩4,125,329)
Receivables past due are assessed as impaired. An allowance account is individually
recognized for receivables that can be assessed individually for impairment. An
allowance account is recognized based on aging analysis and the Company’s past
experience of receivables collection for the Company of financial assets that are not
individually significant and have similar credit risk characteristics.
Bad debt expense from trade receivables is included in selling, general and administrative
expenses, and bad debt expense from other receivables is included in other non-operating
expense.
7. INVENTORIES:
Details of inventory valuation securities as of December 31, 2012 and 2011, are summarized
as follows (in thousands of Korean won):
December 31, 2012 December 31, 2011
Acquisition cost Valuation allowance Book value Acquisition cost Valuation allowance Book value
Work in progress ₩97,857,640 (₩28,642,954) ₩69,214,686 ₩237,971,441 (₩34,901,030) ₩203,070,411
Raw materials 125,658,125 (4,494,921) 121,163,204 38,161,543 (3,188,369) 34,973,174
Materials in transit 14,822,951 - 14,822,951 9,187,990 - 9,187,990
Total ₩238,338,716 (₩33,137,875) ₩205,200,841 ₩285,320,974 (₩38,089,399) ₩247,231,575
The Company recorded loss on inventory valuation totaling (₩4,951,524) thousand and
₩26,846,273 thousand for the years ended December 31, 2012 and 2011, respectively.

8. LONG-TERM INVESTMENT SECURITIES:
(1) Long-term investments as of December 31, 2012 and 2011, are as follows (in thousands
of Korean won):
December 31, 2012 December 31, 2011
AFS financial assets ₩ 922,117 ₩ 72,047
Held-to-maturity financial assets 7,000,000 -
Total ₩ 7,922,117 ₩ 72,047
(2) AFS securities as of December 31, 2012 and 2011, are summarized as follows (in
thousands of Korean won):
December 31, 2012 December 31, 2011
Non-marketable securities:
Korea Marine Equipment
Association ₩ 20,000 ₩ 20,000
Electronic Contractors’
Financial Cooperative 52,047 52,047
Equity securities:
Casco 850,070 -
Total
₩ 922,117 ₩ 72,047
Equity securities of Casco are transferred to AFS financial assets from securities of
associate for the year ended December 31, 2012 (see Note 11-(1)).
(3) Long-term held-to-maturity financial assets as of December 31, 2012 and 2011, are
summarized as follows (in thousands of Korean won):
December 31, 2012 December 31, 2011
Subordinated beneficiary certificate ₩7,000,000 ₩ -
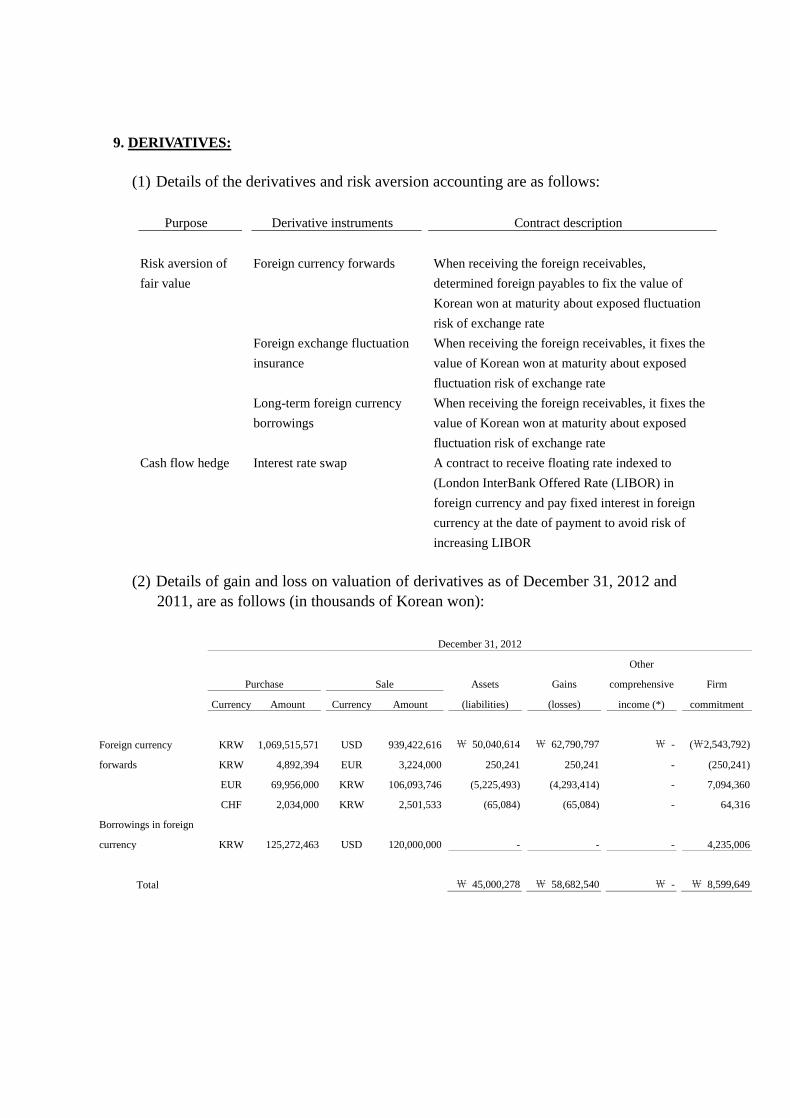
9. DERIVATIVES:
(1) Details of the derivatives and risk aversion accounting are as follows:
Purpose Derivative instruments Contract description
Risk aversion of
fair value
Foreign currency forwards
When receiving the foreign receivables,
determined foreign payables to fix the value of
Korean won at maturity about exposed fluctuation
risk of exchange rate
Foreign exchange fluctuation
insurance
When receiving the foreign receivables, it fixes the
value of Korean won at maturity about exposed
fluctuation risk of exchange rate
Long-term foreign currency
borrowings
When receiving the foreign receivables, it fixes the
value of Korean won at maturity about exposed
fluctuation risk of exchange rate
Cash flow hedge
Interest rate swap
A contract to receive floating rate indexed to
(London InterBank Offered Rate (LIBOR) in
foreign currency and pay fixed interest in foreign
currency at the date of payment to avoid risk of
increasing LIBOR
(2) Details of gain and loss on valuation of derivatives as of December 31, 2012 and
2011, are as follows (in thousands of Korean won):
December 31, 2012
Purchase Sale
Assets Gains
Other
comprehensive Firm
Currency Amount Currency Amount (liabilities) (losses) income (*) commitment
Foreign currency
forwards
KRW 1,069,515,571 USD 939,422,616 ₩ 50,040,614 ₩ 62,790,797 ₩ - (₩2,543,792)
KRW 4,892,394 EUR 3,224,000 250,241 250,241 - (250,241)
EUR 69,956,000 KRW 106,093,746 (5,225,493) (4,293,414) - 7,094,360
CHF 2,034,000 KRW 2,501,533 (65,084) (65,084) - 64,316
Borrowings in foreign
currency
KRW 125,272,463 USD 120,000,000
- - - 4,235,006
Total ₩ 45,000,278 ₩ 58,682,540 ₩ - ₩ 8,599,649
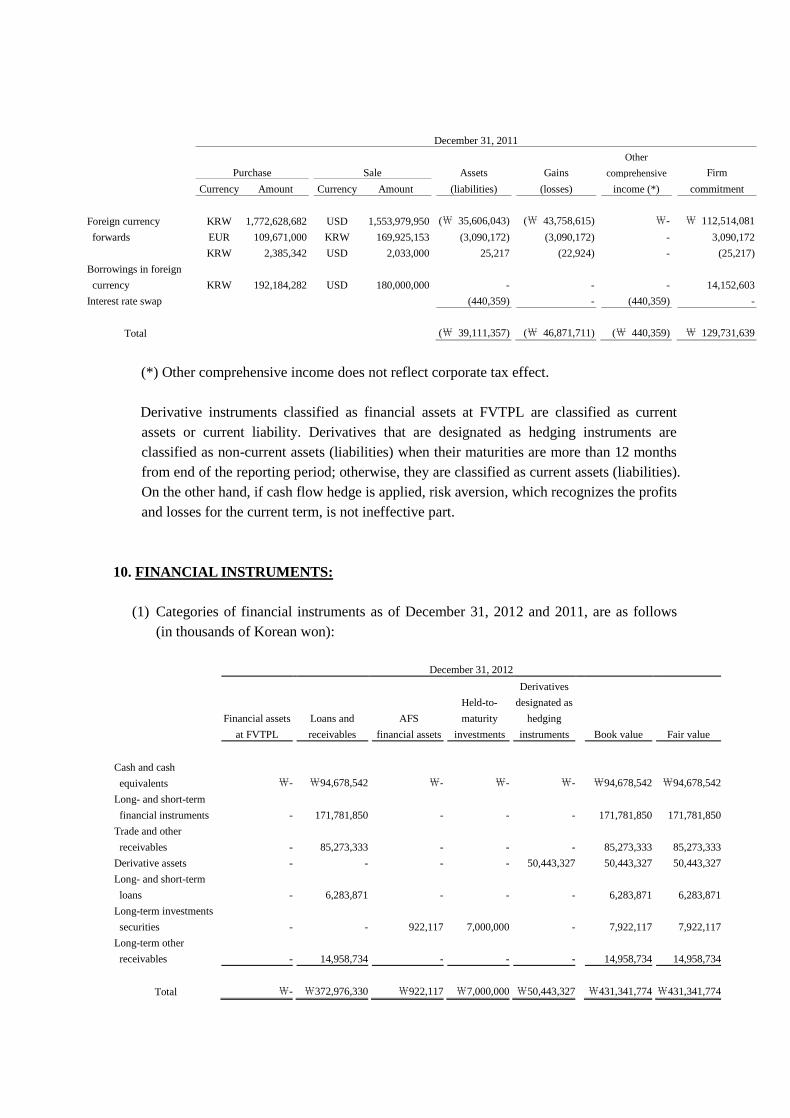
December 31, 2011
Purchase Sale
Assets Gains
Other
comprehensive Firm
Currency Amount Currency Amount (liabilities) (losses) income (*) commitment
Foreign currency
forwards
KRW 1,772,628,682 USD 1,553,979,950 (₩ 35,606,043) (₩ 43,758,615) ₩- ₩ 112,514,081
EUR 109,671,000 KRW 169,925,153 (3,090,172) (3,090,172) - 3,090,172
KRW 2,385,342 USD 2,033,000 25,217 (22,924) - (25,217)
Borrowings in foreign
currency
KRW 192,184,282 USD 180,000,000
- - - 14,152,603
Interest rate swap (440,359) - (440,359) -
Total (₩ 39,111,357) (₩ 46,871,711) (₩ 440,359) ₩ 129,731,639
(*) Other comprehensive income does not reflect corporate tax effect.
Derivative instruments classified as financial assets at FVTPL are classified as current
assets or current liability. Derivatives that are designated as hedging instruments are
classified as non-current assets (liabilities) when their maturities are more than 12 months
from end of the reporting period; otherwise, they are classified as current assets (liabilities).
On the other hand, if cash flow hedge is applied, risk aversion, which recognizes the profits
and losses for the current term, is not ineffective part.
10. FINANCIAL INSTRUMENTS:
(1) Categories of financial instruments as of December 31, 2012 and 2011, are as follows
(in thousands of Korean won):
December 31, 2012
Financial assets
at FVTPL
Loans and
receivables
AFS
financial assets
Held-to-
maturity
investments
Derivatives
designated as
hedging
instruments Book value Fair value
Cash and cash
equivalents ₩- ₩94,678,542
₩-
₩- ₩- ₩94,678,542 ₩94,678,542
Long- and short-term
financial instruments - 171,781,850
-
- - 171,781,850 171,781,850
Trade and other
receivables - 85,273,333
-
- - 85,273,333 85,273,333
Derivative assets - - - - 50,443,327 50,443,327 50,443,327
Long- and short-term
loans - 6,283,871
-
- - 6,283,871 6,283,871
Long-term investments
securities - -
922,117
7,000,000 - 7,922,117 7,922,117
Long-term other
receivables - 14,958,734
-
- - 14,958,734 14,958,734
Total ₩- ₩372,976,330
₩922,117
₩7,000,000 ₩50,443,327 ₩431,341,774 ₩431,341,774

December 31, 2012
Financial liabilities
at FVTPL
Financial liabilities
at amortized cost
Derivatives
designated as hedging
instruments Book value Fair value
Trade and other
payables ₩- ₩171,795,453 ₩- ₩171,795,453
₩171,795,453
Borrowings and bonds - 307,821,985 - 307,821,985 307,821,985
Derivative liabilities - - 5,443,049 5,443,049 5,443,049
Long-term non-trade
payables - 1,057,451 - 1,057,451
1,057,451
Financial guarantee
liabilities - 4,121,160 - 4,121,160
4,121,160
Total ₩- ₩484,796,049 ₩5,443,049 ₩490,239,098
₩490,239,098
December 31, 2011
Financial
assets at
FVTPL
Loans and
receivables
AFS
financial assets
Held-to-
maturity
investments
Derivatives
designated as
hedging
instruments Book value Fair value
Cash and cash
equivalents ₩- ₩320,469,577
₩-
₩- ₩- ₩320,469,577 ₩320,469,577
Long and Short-term
financial instruments - 150,904,719
-
- - 150,904,719 150,904,719
Trade and other
receivables - 150,427,478
-
- - 150,427,478 150,427,478
Derivative assets - - - - 11,905,612 11,905,612 11,905,612
Long and short-term
loans - 8,499,270
-
- - 8,499,270 8,499,270
Long-term investment
securities - -
72,047
- - 72,047 72,047
Long-term other
receivables - 8,131,176
-
- - 8,131,176 8,131,176
Total ₩- ₩638,432,220
₩72,047
₩- ₩11,905,612 ₩650,409,879 ₩650,409,879
December 31, 2011
Financial liabilities
at FVTPL
Financial liabilities
at amortized cost
Derivatives designated
as hedging
instruments Book value Fair value
Trade and other
payables ₩- ₩ 261,645,250 ₩- ₩ 261,645,250
₩ 261,645,250
Borrowings and bonds - 310,846,243 - 310,846,243 310,846,243
Derivative liabilities - - 51,016,969 51,016,969 51,016,969
Long-term other
payable - 2,332,156 - 2,332,156
2,332,156
Financial guarantee
liabilities - 349,001 - 349,001
349,001
Total ₩- ₩575,172,650 ₩51,016,969 ₩626,189,619
₩626,189,619
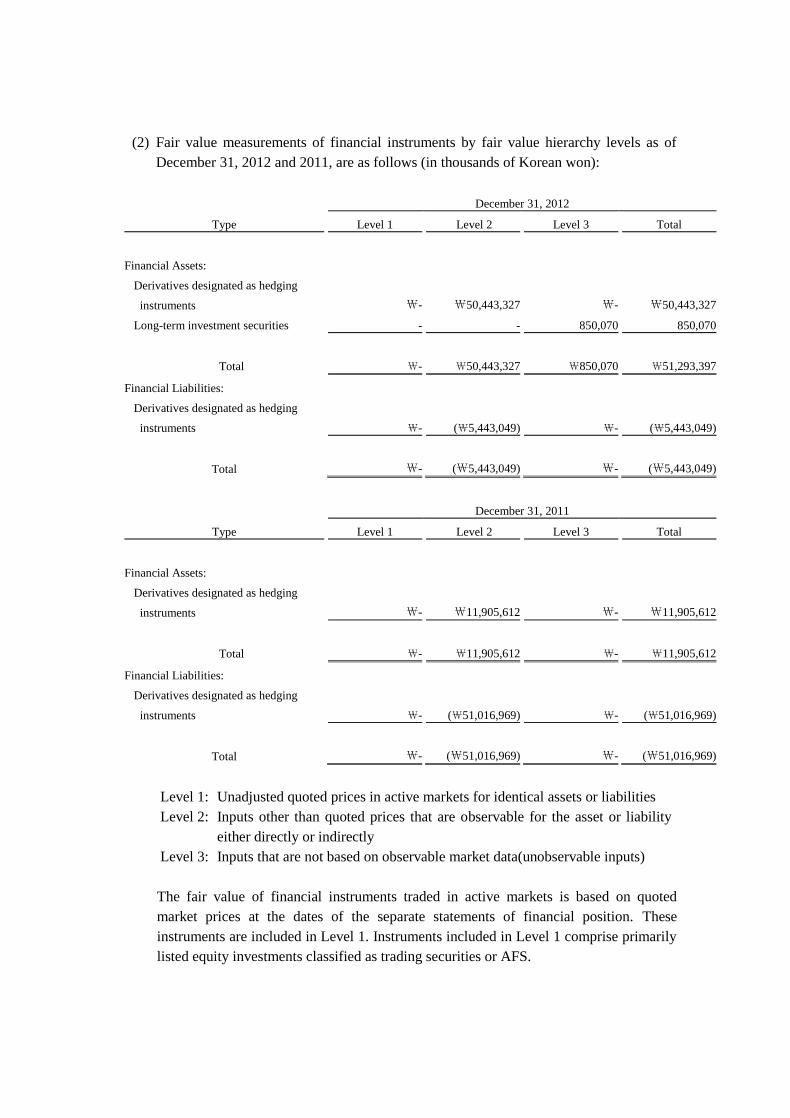
(2) Fair value measurements of financial instruments by fair value hierarchy levels as of
December 31, 2012 and 2011, are as follows (in thousands of Korean won):
December 31, 2012
Type Level 1 Level 2 Level 3 Total
Financial Assets:
Derivatives designated as hedging
instruments ₩- ₩50,443,327 ₩- ₩50,443,327
Long-term investment securities - - 850,070 850,070
Total ₩- ₩50,443,327 ₩850,070 ₩51,293,397
Financial Liabilities:
Derivatives designated as hedging
instruments ₩- (₩5,443,049) ₩- (₩5,443,049)
Total ₩- (₩5,443,049) ₩- (₩5,443,049)
December 31, 2011
Type Level 1 Level 2 Level 3 Total
Financial Assets:
Derivatives designated as hedging
instruments ₩- ₩11,905,612 ₩- ₩11,905,612
Total ₩- ₩11,905,612 ₩- ₩11,905,612
Financial Liabilities:
Derivatives designated as hedging
instruments ₩- (₩51,016,969) ₩- (₩51,016,969)
Total ₩- (₩51,016,969) ₩- (₩51,016,969)
Level 1: Unadjusted quoted prices in active markets for identical assets or liabilities
Level 2: Inputs other than quoted prices that are observable for the asset or liability
either directly or indirectly
Level 3: Inputs that are not based on observable market data(unobservable inputs)
The fair value of financial instruments traded in active markets is based on quoted
market prices at the dates of the separate statements of financial position. These
instruments are included in Level 1. Instruments included in Level 1 comprise primarily
listed equity investments classified as trading securities or AFS.
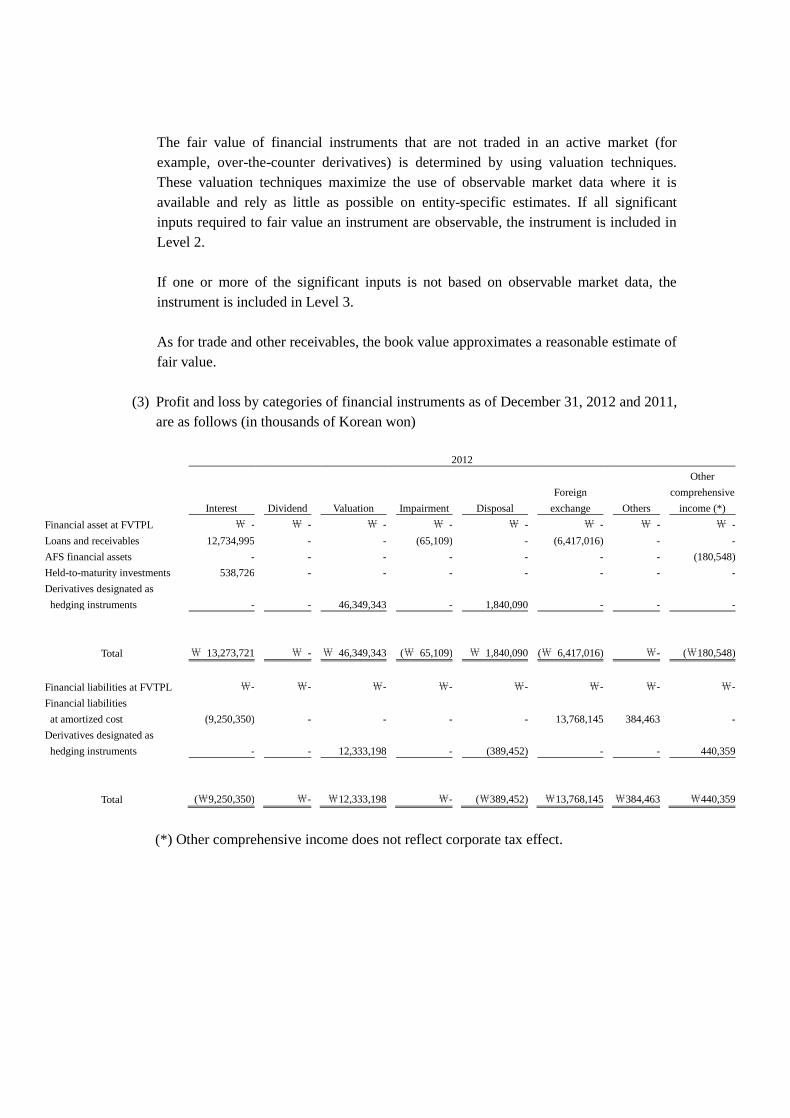
The fair value of financial instruments that are not traded in an active market (for
example, over-the-counter derivatives) is determined by using valuation techniques.
These valuation techniques maximize the use of observable market data where it is
available and rely as little as possible on entity-specific estimates. If all significant
inputs required to fair value an instrument are observable, the instrument is included in
Level 2.
If one or more of the significant inputs is not based on observable market data, the
instrument is included in Level 3.
As for trade and other receivables, the book value approximates a reasonable estimate of
fair value.
(3) Profit and loss by categories of financial instruments as of December 31, 2012 and 2011,
are as follows (in thousands of Korean won)
2012
Interest Dividend Valuation Impairment Disposal
Foreign
exchange Others
Other
comprehensive
income (*)
Financial asset at FVTPL ₩ - ₩ - ₩ - ₩ - ₩ - ₩ - ₩ - ₩ -
Loans and receivables 12,734,995 - - (65,109) - (6,417,016) - -
AFS financial assets - - - - - - - (180,548)
Held-to-maturity investments 538,726 - - - - - - -
Derivatives designated as
hedging instruments
- - 46,349,343 - 1,840,090 - - -
Total
₩ 13,273,721 ₩ - ₩ 46,349,343 (₩ 65,109) ₩ 1,840,090 (₩ 6,417,016) ₩- (₩180,548)
Financial liabilities at FVTPL ₩- ₩- ₩- ₩- ₩- ₩- ₩- ₩-
Financial liabilities
at amortized cost
(9,250,350) - - - - 13,768,145 384,463 -
Derivatives designated as
hedging instruments
- - 12,333,198 - (389,452) - - 440,359
Total
(₩9,250,350) ₩- ₩12,333,198 ₩- (₩389,452) ₩13,768,145 ₩384,463 ₩440,359
(*) Other comprehensive income does not reflect corporate tax effect.
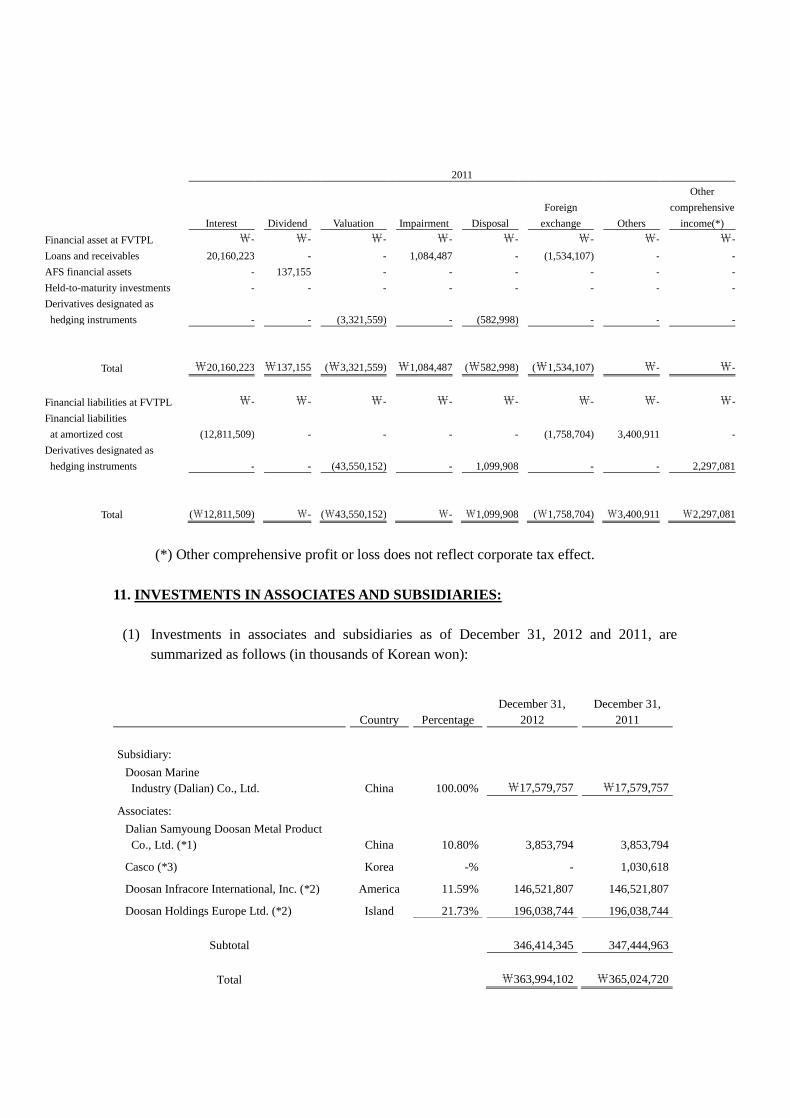
2011
Interest Dividend Valuation Impairment Disposal
Foreign
exchange Others
Other
comprehensive
income(*)
Financial asset at FVTPL ₩- ₩- ₩- ₩- ₩- ₩- ₩- ₩-
Loans and receivables 20,160,223 - - 1,084,487 - (1,534,107) - -
AFS financial assets - 137,155 - - - - - -
Held-to-maturity investments - - - - - - - -
Derivatives designated as
hedging instruments
- - (3,321,559) - (582,998) - - -
Total
₩20,160,223 ₩137,155
(₩3,321,559) ₩1,084,487 (₩582,998) (₩1,534,107) ₩- ₩-
Financial liabilities at FVTPL ₩- ₩- ₩- ₩- ₩- ₩- ₩- ₩-
Financial liabilities
at amortized cost
(12,811,509) - - - - (1,758,704) 3,400,911 -
Derivatives designated as
hedging instruments
- - (43,550,152) - 1,099,908 - - 2,297,081
Total
(₩12,811,509) ₩- (₩43,550,152) ₩- ₩1,099,908 (₩1,758,704) ₩3,400,911 ₩2,297,081
(*) Other comprehensive profit or loss does not reflect corporate tax effect.
11. INVESTMENTS IN ASSOCIATES AND SUBSIDIARIES:
(1) Investments in associates and subsidiaries as of December 31, 2012 and 2011, are
summarized as follows (in thousands of Korean won):
Country Percentage
December 31,
2012
December 31,
2011
Subsidiary:
Doosan Marine
Industry (Dalian) Co., Ltd.
China 100.00%
₩17,579,757
₩17,579,757
Associates:
Dalian Samyoung Doosan Metal Product
Co., Ltd. (*1)
China 10.80% 3,853,794 3,853,794
Casco (*3) Korea -% - 1,030,618
Doosan Infracore International, Inc. (*2) America 11.59% 146,521,807 146,521,807
Doosan Holdings Europe Ltd. (*2) Island 21.73% 196,038,744 196,038,744
Subtotal
346,414,345 347,444,963
Total
₩363,994,102
₩365,024,720
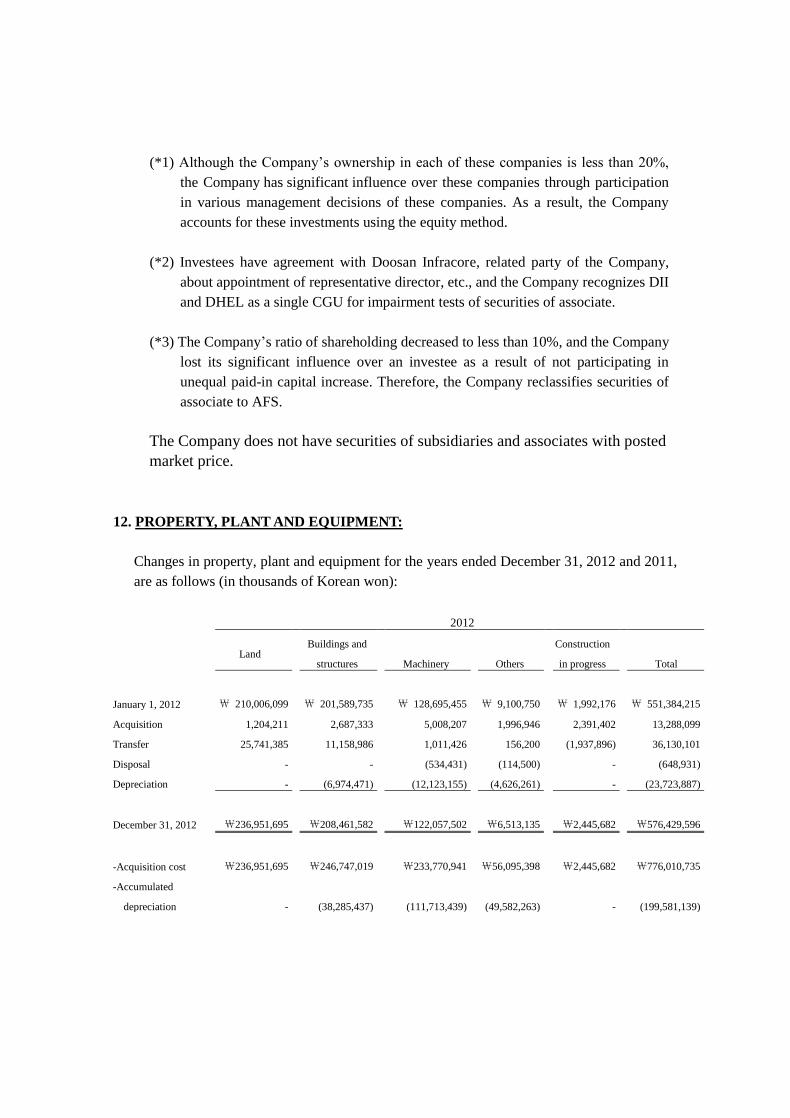
(*1) Although the Company’s ownership in each of these companies is less than 20%,
the Company has significant influence over these companies through participation
in various management decisions of these companies. As a result, the Company
accounts for these investments using the equity method.
(*2) Investees have agreement with Doosan Infracore, related party of the Company,
about appointment of representative director, etc., and the Company recognizes DII
and DHEL as a single CGU for impairment tests of securities of associate.
(*3) The Company’s ratio of shareholding decreased to less than 10%, and the Company
lost its significant influence over an investee as a result of not participating in
unequal paid-in capital increase. Therefore, the Company reclassifies securities of
associate to AFS.
The Company does not have securities of subsidiaries and associates with posted
market price.
12. PROPERTY, PLANT AND EQUIPMENT:
Changes in property, plant and equipment for the years ended December 31, 2012 and 2011,
are as follows (in thousands of Korean won):
2012
Land
Buildings and
structures
Machinery
Others
Construction
in progress
Total
January 1, 2012 ₩ 210,006,099 ₩ 201,589,735 ₩ 128,695,455 ₩ 9,100,750 ₩ 1,992,176 ₩ 551,384,215
Acquisition 1,204,211 2,687,333 5,008,207 1,996,946 2,391,402 13,288,099
Transfer 25,741,385 11,158,986 1,011,426 156,200 (1,937,896) 36,130,101
Disposal - - (534,431) (114,500) - (648,931)
Depreciation - (6,974,471) (12,123,155) (4,626,261) - (23,723,887)
December 31, 2012
₩236,951,695
₩208,461,582
₩122,057,502
₩6,513,135
₩2,445,682
₩576,429,596
-Acquisition cost
₩236,951,695
₩246,747,019
₩233,770,941
₩56,095,398
₩2,445,682
₩776,010,735
-Accumulated
depreciation
-
(38,285,437)
(111,713,439)
(49,582,263)
-
(199,581,139)
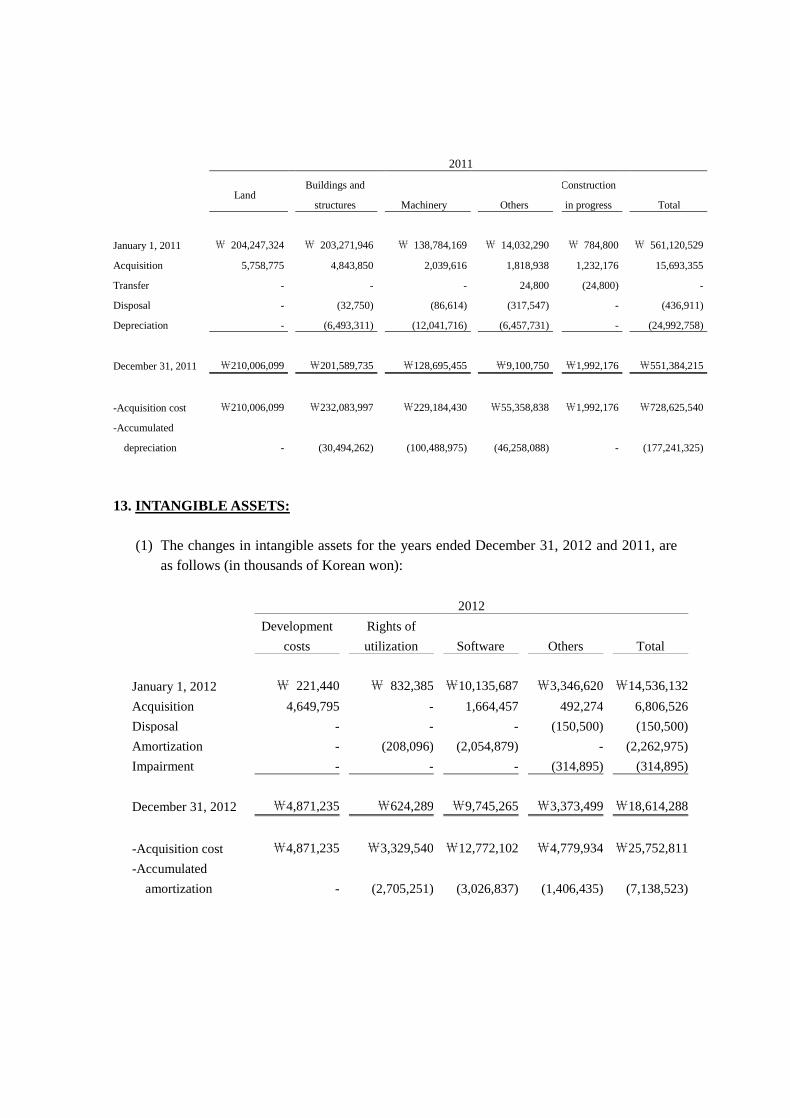
2011
Land
Buildings and
structures
Machinery
Others
Construction
in progress
Total
January 1, 2011 ₩ 204,247,324 ₩ 203,271,946 ₩ 138,784,169 ₩ 14,032,290 ₩ 784,800 ₩ 561,120,529
Acquisition 5,758,775 4,843,850 2,039,616 1,818,938 1,232,176 15,693,355
Transfer - - - 24,800 (24,800) -
Disposal - (32,750) (86,614) (317,547) - (436,911)
Depreciation - (6,493,311) (12,041,716) (6,457,731) - (24,992,758)
December 31, 2011
₩210,006,099
₩201,589,735
₩128,695,455
₩9,100,750
₩1,992,176
₩551,384,215
-Acquisition cost
₩210,006,099
₩232,083,997
₩229,184,430
₩55,358,838
₩1,992,176
₩728,625,540
-Accumulated
depreciation
-
(30,494,262)
(100,488,975)
(46,258,088)
-
(177,241,325)
13. INTANGIBLE ASSETS:
(1) The changes in intangible assets for the years ended December 31, 2012 and 2011, are
as follows (in thousands of Korean won):
2012
Development
costs
Rights of
utilization Software Others Total
January 1, 2012 ₩ 221,440 ₩ 832,385 ₩10,135,687 ₩3,346,620 ₩14,536,132
Acquisition 4,649,795 - 1,664,457 492,274 6,806,526
Disposal - - - (150,500) (150,500)
Amortization - (208,096) (2,054,879) - (2,262,975)
Impairment - - - (314,895) (314,895)
December 31, 2012
₩4,871,235 ₩624,289 ₩9,745,265 ₩3,373,499 ₩18,614,288
-Acquisition cost
₩4,871,235 ₩3,329,540 ₩12,772,102 ₩4,779,934 ₩25,752,811
-Accumulated
amortization
- (2,705,251) (3,026,837) (1,406,435) (7,138,523)
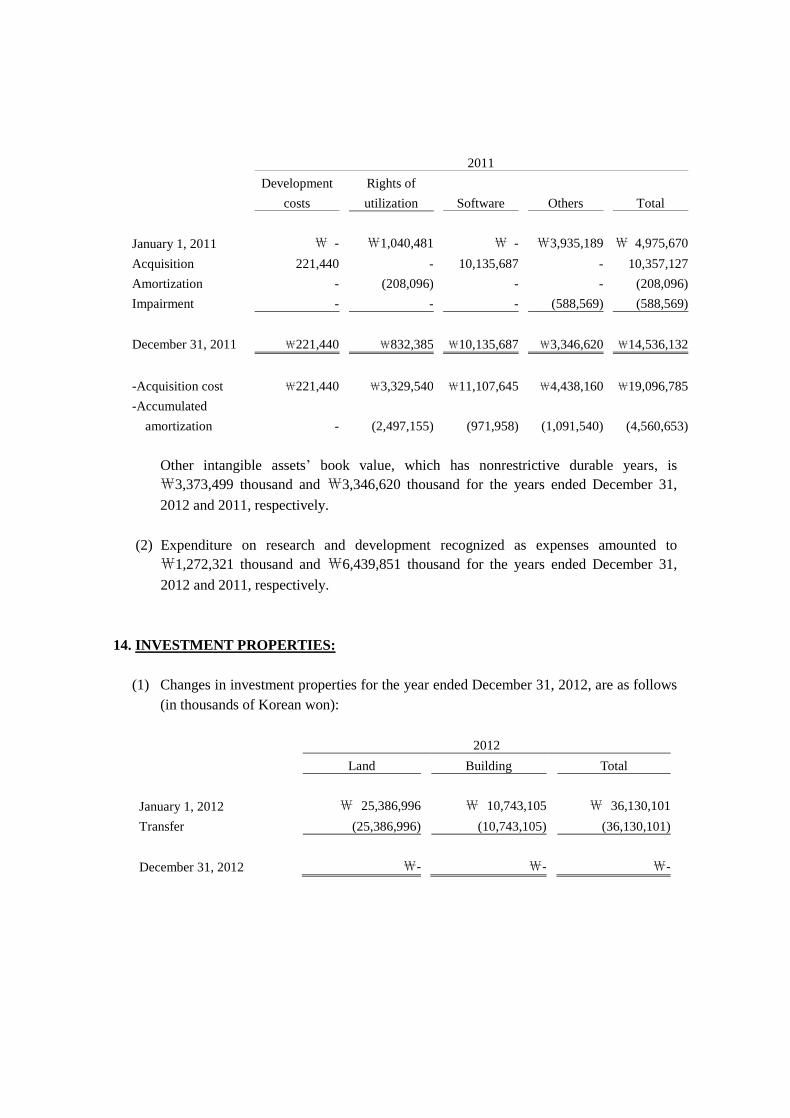
2011
Development
costs
Rights of
utilization Software Others Total
January 1, 2011 ₩ - ₩1,040,481 ₩ - ₩3,935,189 ₩ 4,975,670
Acquisition 221,440 - 10,135,687 - 10,357,127
Amortization - (208,096) - - (208,096)
Impairment - - - (588,569) (588,569)
December 31, 2011
₩221,440 ₩832,385 ₩10,135,687 ₩3,346,620 ₩14,536,132
-Acquisition cost
₩221,440 ₩3,329,540 ₩11,107,645 ₩4,438,160 ₩19,096,785
-Accumulated
amortization
- (2,497,155) (971,958) (1,091,540) (4,560,653)
Other intangible assets’ book value, which has nonrestrictive durable years, is
₩3,373,499 thousand and ₩3,346,620 thousand for the years ended December 31,
2012 and 2011, respectively.
(2) Expenditure on research and development recognized as expenses amounted to
₩1,272,321 thousand and ₩6,439,851 thousand for the years ended December 31,
2012 and 2011, respectively.
14. INVESTMENT PROPERTIES:
(1) Changes in investment properties for the year ended December 31, 2012, are as follows
(in thousands of Korean won):
2012
Land Building Total
January 1, 2012 ₩ 25,386,996 ₩ 10,743,105 ₩ 36,130,101
Transfer (25,386,996) (10,743,105) (36,130,101)
December 31, 2012 ₩- ₩- ₩-
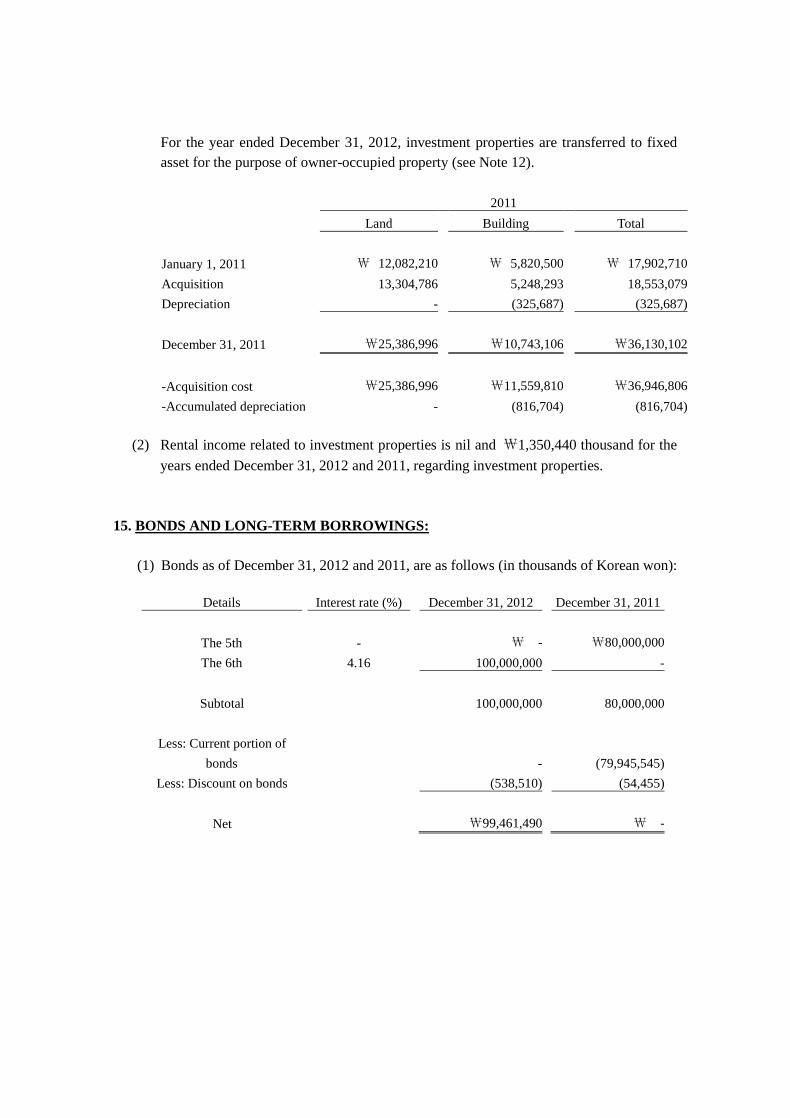
For the year ended December 31, 2012, investment properties are transferred to fixed
asset for the purpose of owner-occupied property (see Note 12).
2011
Land Building Total
January 1, 2011 ₩ 12,082,210 ₩ 5,820,500 ₩ 17,902,710
Acquisition 13,304,786 5,248,293 18,553,079
Depreciation - (325,687) (325,687)
December 31, 2011 ₩25,386,996 ₩10,743,106 ₩36,130,102
-Acquisition cost ₩25,386,996 ₩11,559,810 ₩36,946,806
-Accumulated depreciation - (816,704) (816,704)
(2) Rental income related to investment properties is nil and ₩1,350,440 thousand for the
years ended December 31, 2012 and 2011, regarding investment properties.
15. BONDS AND LONG-TERM BORROWINGS:
(1) Bonds as of December 31, 2012 and 2011, are as follows (in thousands of Korean won):
Details Interest rate (%) December 31, 2012 December 31, 2011
The 5th - ₩ - ₩80,000,000
The 6th 4.16 100,000,000 -
Subtotal
100,000,000 80,000,000
Less: Current portion of
bonds
- (79,945,545)
Less: Discount on bonds
(538,510) (54,455)
Net
₩99,461,490 ₩ -
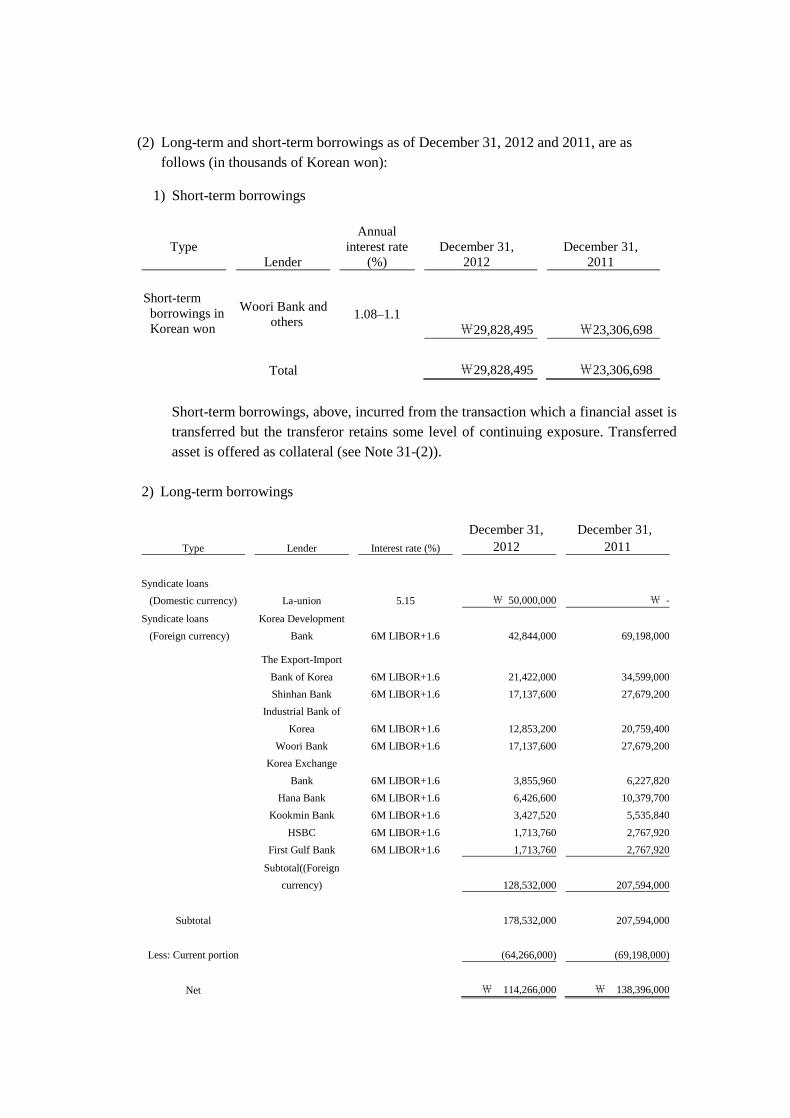
(2) Long-term and short-term borrowings as of December 31, 2012 and 2011, are as
follows (in thousands of Korean won):
1) Short-term borrowings
Type
Lender
Annual
interest rate
(%)
December 31,
2012
December 31,
2011
Short-term
borrowings in
Korean won
Woori Bank and
others 1.08–1.1
₩29,828,495 ₩23,306,698
Total ₩29,828,495 ₩23,306,698
Short-term borrowings, above, incurred from the transaction which a financial asset is
transferred but the transferor retains some level of continuing exposure. Transferred
asset is offered as collateral (see Note 31-(2)).
2) Long-term borrowings
Type Lender Interest rate (%)
December 31,
2012
December 31,
2011
Syndicate loans
(Domestic currency) La-union 5.15 ₩ 50,000,000 ₩ -
Syndicate loans
(Foreign currency)
Korea Development
Bank 6M LIBOR+1.6 42,844,000 69,198,000
The Export-Import
Bank of Korea 6M LIBOR+1.6 21,422,000 34,599,000
Shinhan Bank 6M LIBOR+1.6 17,137,600 27,679,200
Industrial Bank of
Korea 6M LIBOR+1.6 12,853,200 20,759,400
Woori Bank 6M LIBOR+1.6 17,137,600 27,679,200
Korea Exchange
Bank 6M LIBOR+1.6 3,855,960 6,227,820
Hana Bank 6M LIBOR+1.6 6,426,600 10,379,700
Kookmin Bank 6M LIBOR+1.6 3,427,520 5,535,840
HSBC 6M LIBOR+1.6 1,713,760 2,767,920
First Gulf Bank 6M LIBOR+1.6 1,713,760 2,767,920
Subtotal((Foreign
currency) 128,532,000 207,594,000
Subtotal 178,532,000 207,594,000
Less: Current portion (64,266,000) (69,198,000)
Net ₩ 114,266,000 ₩ 138,396,000
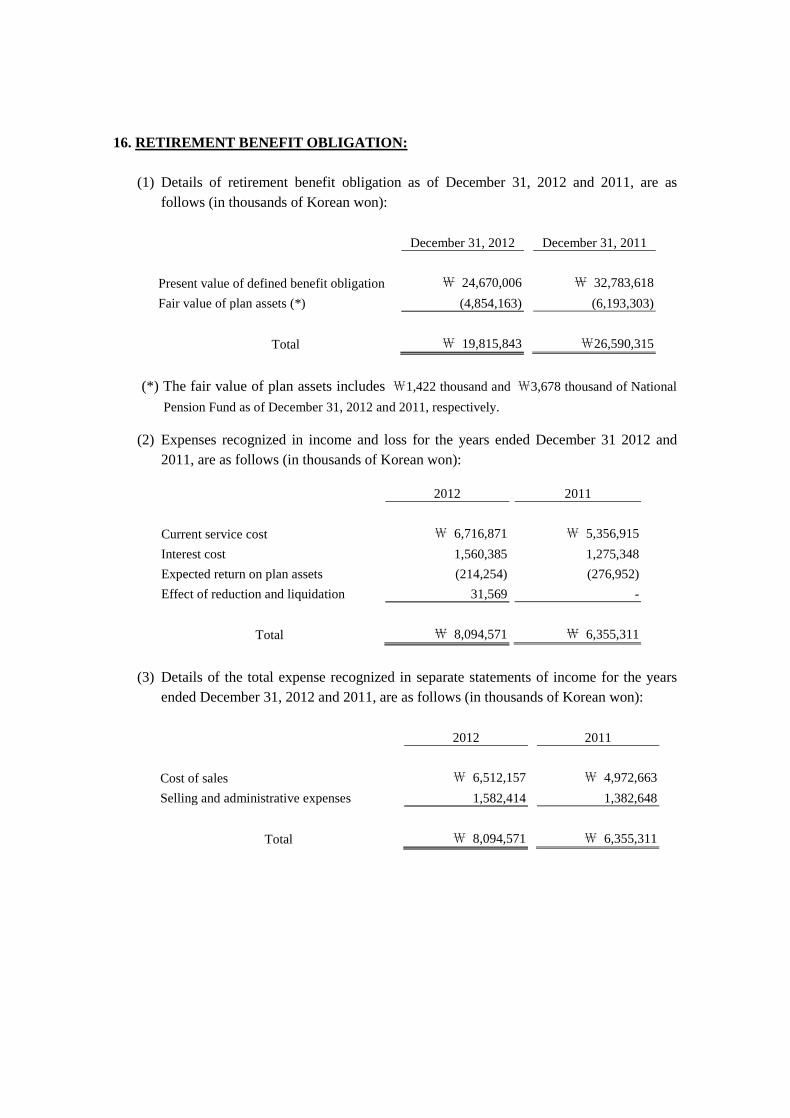
16. RETIREMENT BENEFIT OBLIGATION:
(1) Details of retirement benefit obligation as of December 31, 2012 and 2011, are as
follows (in thousands of Korean won):
December 31, 2012 December 31, 2011
Present value of defined benefit obligation ₩ 24,670,006 ₩ 32,783,618
Fair value of plan assets (*) (4,854,163) (6,193,303)
Total ₩ 19,815,843 ₩26,590,315
(*) The fair value of plan assets includes ₩1,422 thousand and ₩3,678 thousand of National
Pension Fund as of December 31, 2012 and 2011, respectively.
(2) Expenses recognized in income and loss for the years ended December 31 2012 and
2011, are as follows (in thousands of Korean won):
2012 2011
Current service cost ₩ 6,716,871 ₩ 5,356,915
Interest cost 1,560,385 1,275,348
Expected return on plan assets (214,254) (276,952)
Effect of reduction and liquidation 31,569 -
Total ₩ 8,094,571 ₩ 6,355,311
(3) Details of the total expense recognized in separate statements of income for the years
ended December 31, 2012 and 2011, are as follows (in thousands of Korean won):
2012 2011
Cost of sales ₩ 6,512,157 ₩ 4,972,663
Selling and administrative expenses 1,582,414 1,382,648
Total ₩ 8,094,571 ₩ 6,355,311
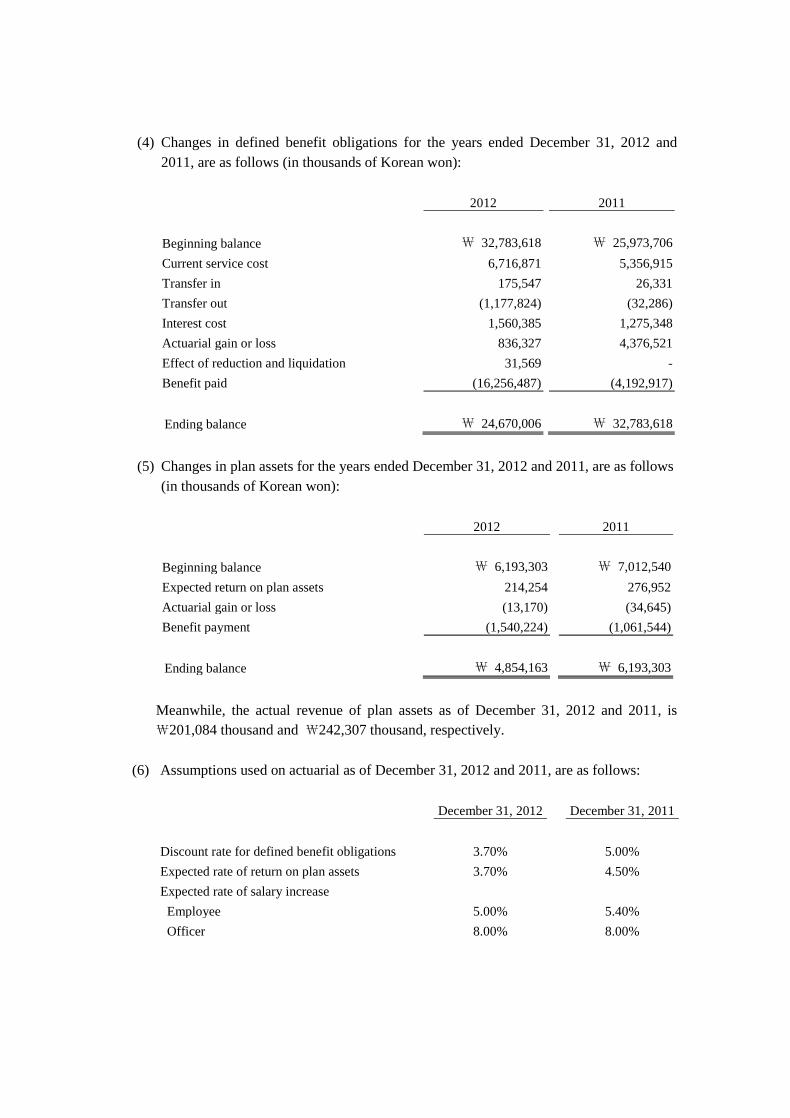
(4) Changes in defined benefit obligations for the years ended December 31, 2012 and
2011, are as follows (in thousands of Korean won):
2012 2011
Beginning balance ₩ 32,783,618 ₩ 25,973,706
Current service cost 6,716,871 5,356,915
Transfer in 175,547 26,331
Transfer out (1,177,824) (32,286)
Interest cost 1,560,385 1,275,348
Actuarial gain or loss 836,327 4,376,521
Effect of reduction and liquidation 31,569 -
Benefit paid (16,256,487) (4,192,917)
Ending balance ₩ 24,670,006 ₩ 32,783,618
(5) Changes in plan assets for the years ended December 31, 2012 and 2011, are as follows
(in thousands of Korean won):
2012 2011
Beginning balance ₩ 6,193,303 ₩ 7,012,540
Expected return on plan assets 214,254 276,952
Actuarial gain or loss (13,170) (34,645)
Benefit payment (1,540,224) (1,061,544)
Ending balance ₩ 4,854,163 ₩ 6,193,303
Meanwhile, the actual revenue of plan assets as of December 31, 2012 and 2011, is
₩201,084 thousand and ₩242,307 thousand, respectively.
(6) Assumptions used on actuarial as of December 31, 2012 and 2011, are as follows:
December 31, 2012 December 31, 2011
Discount rate for defined benefit obligations 3.70% 5.00%
Expected rate of return on plan assets 3.70% 4.50%
Expected rate of salary increase
Employee 5.00% 5.40%
Officer 8.00% 8.00%
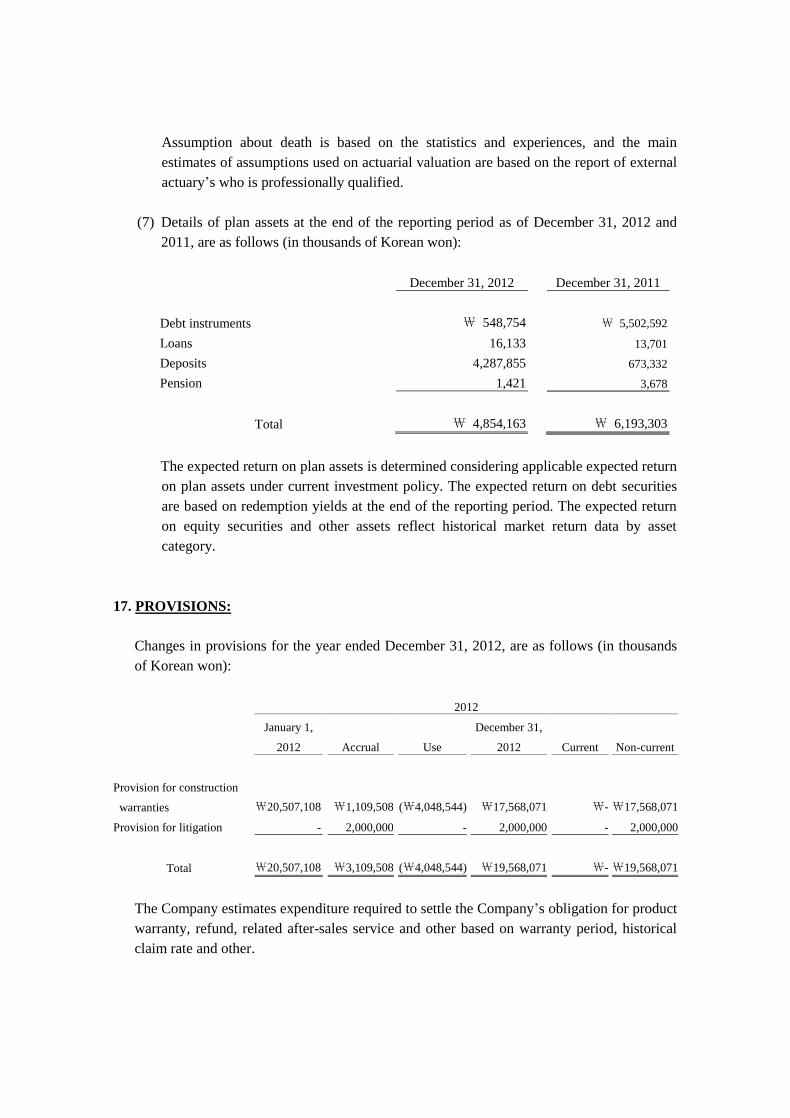
Assumption about death is based on the statistics and experiences, and the main
estimates of assumptions used on actuarial valuation are based on the report of external
actuary’s who is professionally qualified.
(7) Details of plan assets at the end of the reporting period as of December 31, 2012 and
2011, are as follows (in thousands of Korean won):
December 31, 2012 December 31, 2011
Debt instruments ₩ 548,754 ₩ 5,502,592
Loans 16,133 13,701
Deposits 4,287,855 673,332
Pension 1,421 3,678
Total ₩ 4,854,163 ₩ 6,193,303
The expected return on plan assets is determined considering applicable expected return
on plan assets under current investment policy. The expected return on debt securities
are based on redemption yields at the end of the reporting period. The expected return
on equity securities and other assets reflect historical market return data by asset
category.
17. PROVISIONS:
Changes in provisions for the year ended December 31, 2012, are as follows (in thousands
of Korean won):
2012
January 1,
2012 Accrual Use
December 31,
2012 Current Non-current
Provision for construction
warranties ₩20,507,108 ₩1,109,508 (₩4,048,544) ₩17,568,071 ₩- ₩17,568,071
Provision for litigation - 2,000,000 - 2,000,000 - 2,000,000
₩20,507,108
₩3,109,508
(₩4,048,544)
₩19,568,071
₩-
₩19,568,071 Total
The Company estimates expenditure required to settle the Company’s obligation for product
warranty, refund, related after-sales service and other based on warranty period, historical
claim rate and other.
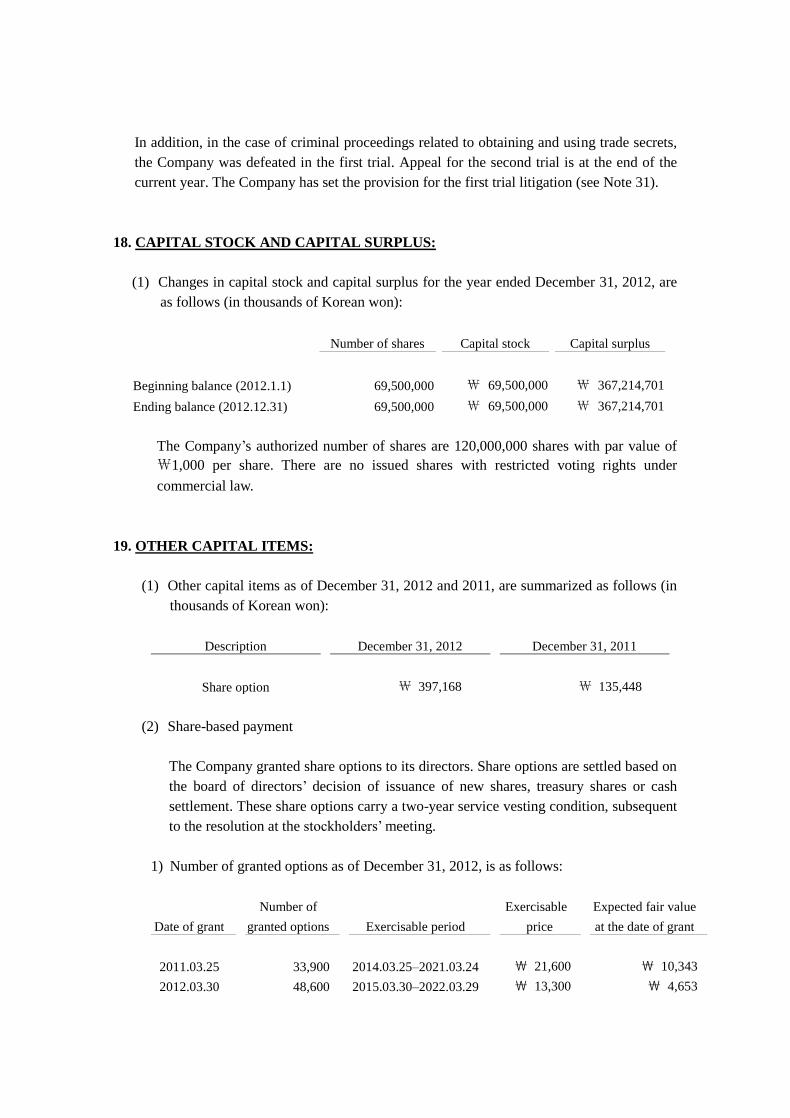
In addition, in the case of criminal proceedings related to obtaining and using trade secrets,
the Company was defeated in the first trial. Appeal for the second trial is at the end of the
current year. The Company has set the provision for the first trial litigation (see Note 31).
18. CAPITAL STOCK AND CAPITAL SURPLUS:
(1) Changes in capital stock and capital surplus for the year ended December 31, 2012, are
as follows (in thousands of Korean won):
Number of shares Capital stock Capital surplus
Beginning balance (2012.1.1) 69,500,000 ₩ 69,500,000 ₩ 367,214,701
Ending balance (2012.12.31) 69,500,000 ₩ 69,500,000 ₩ 367,214,701
The Company’s authorized number of shares are 120,000,000 shares with par value of
₩1,000 per share. There are no issued shares with restricted voting rights under
commercial law.
19. OTHER CAPITAL ITEMS:
(1) Other capital items as of December 31, 2012 and 2011, are summarized as follows (in
thousands of Korean won):
Description December 31, 2012 December 31, 2011
Share option ₩ 397,168 ₩ 135,448
(2) Share-based payment
The Company granted share options to its directors. Share options are settled based on
the board of directors’ decision of issuance of new shares, treasury shares or cash
settlement. These share options carry a two-year service vesting condition, subsequent
to the resolution at the stockholders’ meeting.
1) Number of granted options as of December 31, 2012, is as follows:
Date of grant
Number of
granted options Exercisable period
Exercisable
price
Expected fair value
at the date of grant
2011.03.25 33,900 2014.03.25–2021.03.24 ₩ 21,600 ₩ 10,343
2012.03.30 48,600 2015.03.30–2022.03.29 ₩ 13,300 ₩ 4,653
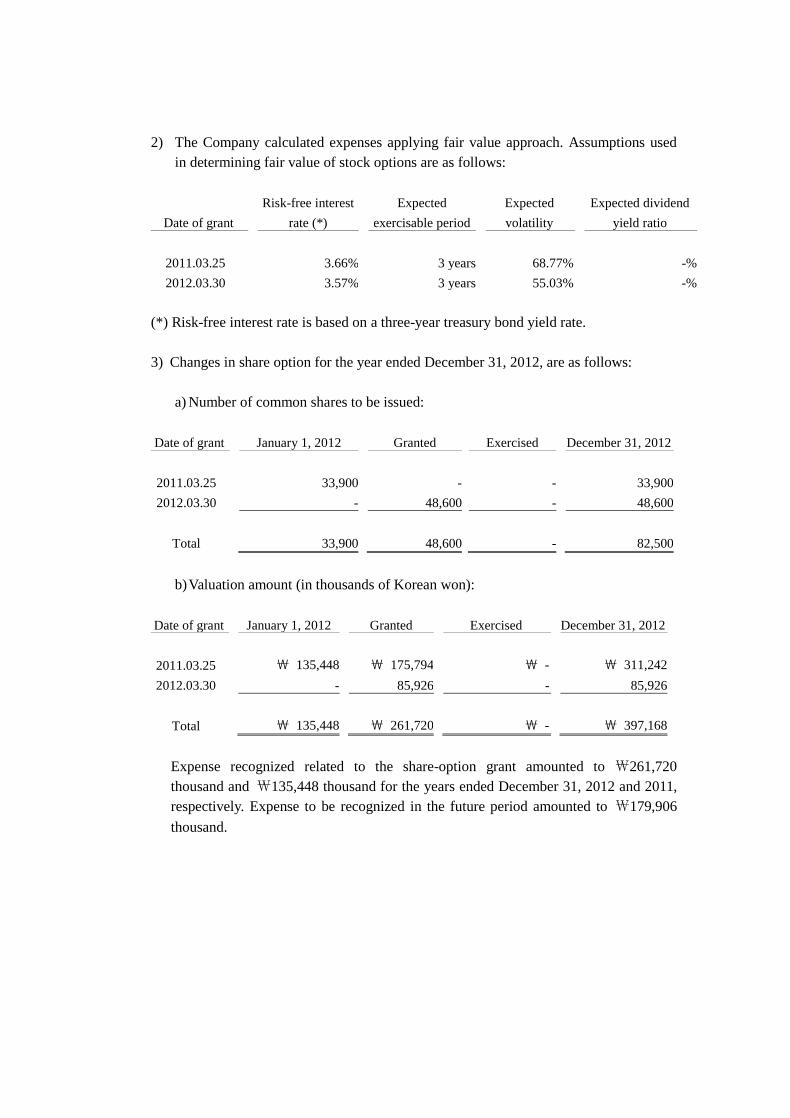
2) The Company calculated expenses applying fair value approach. Assumptions used
in determining fair value of stock options are as follows:
Date of grant
Risk-free interest
rate (*)
Expected
exercisable period
Expected
volatility
Expected dividend
yield ratio
2011.03.25 3.66% 3 years 68.77% -%
2012.03.30 3.57% 3 years 55.03% -%
(*) Risk-free interest rate is based on a three-year treasury bond yield rate.
3) Changes in share option for the year ended December 31, 2012, are as follows:
a) Number of common shares to be issued:
Date of grant January 1, 2012 Granted Exercised December 31, 2012
2011.03.25 33,900 - - 33,900
2012.03.30 - 48,600 - 48,600
Total 33,900 48,600 - 82,500
b) Valuation amount (in thousands of Korean won):
Date of grant January 1, 2012 Granted Exercised December 31, 2012
2011.03.25 ₩ 135,448 ₩ 175,794 ₩ - ₩ 311,242
2012.03.30 - 85,926 - 85,926
Total ₩ 135,448 ₩ 261,720 ₩ - ₩ 397,168
Expense recognized related to the share-option grant amounted to ₩261,720
thousand and ₩135,448 thousand for the years ended December 31, 2012 and 2011,
respectively. Expense to be recognized in the future period amounted to ₩179,906
thousand.
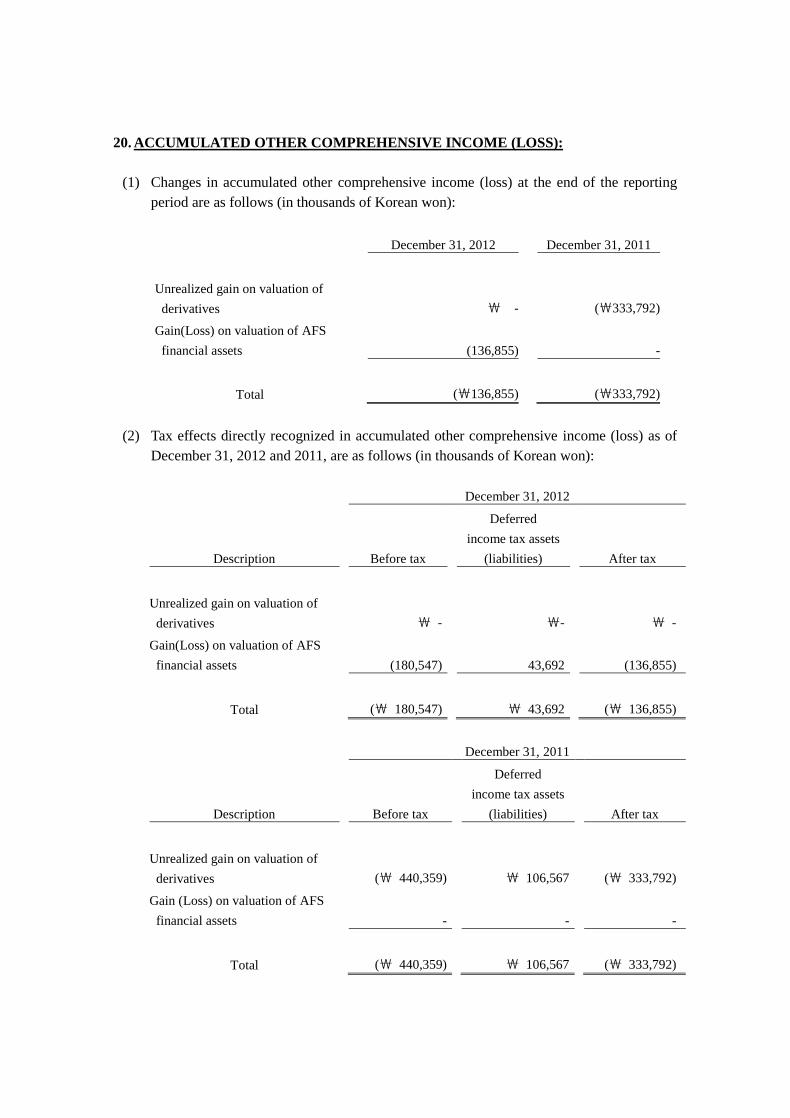
20. ACCUMULATED OTHER COMPREHENSIVE INCOME (LOSS):
(1) Changes in accumulated other comprehensive income (loss) at the end of the reporting
period are as follows (in thousands of Korean won):
December 31, 2012 December 31, 2011
Unrealized gain on valuation of
derivatives ₩ - (₩333,792)
Gain(Loss) on valuation of AFS
financial assets (136,855) -
Total (₩136,855) (₩333,792)
(2) Tax effects directly recognized in accumulated other comprehensive income (loss) as of
December 31, 2012 and 2011, are as follows (in thousands of Korean won):
December 31, 2012
Description Before tax
Deferred
income tax assets
(liabilities) After tax
Unrealized gain on valuation of
derivatives ₩ - ₩- ₩ -
Gain(Loss) on valuation of AFS
financial assets (180,547) 43,692 (136,855)
Total (₩ 180,547) ₩ 43,692 (₩ 136,855)
December 31, 2011
Description Before tax
Deferred
income tax assets
(liabilities) After tax
Unrealized gain on valuation of
derivatives (₩ 440,359) ₩ 106,567 (₩ 333,792)
Gain (Loss) on valuation of AFS
financial assets - - -
Total (₩ 440,359) ₩ 106,567 (₩ 333,792)

21. RETAINED EARNINGS (DEFICIT):
(1) Retained earnings as of December 31, 2012 and 2011, are as follows (in thousands of
Korean won):
December 31, 2012 December 31, 2011
Legal reserve (*) ₩ 1,200,000 ₩ 1,200,000
Optional reserve 2,700,000 3,700,000
Retained earnings before
appropriations 203,604,398 148,881,811
Total ₩207,504,398 ₩153,781,811
(*) Retained earnings appropriated to the legal reserve cannot be used as cash dividends
under the applicable laws and regulations. The Korean Commercial Code requires
the Company to appropriate an amount equal to at least 10% of the cash dividend
until the reserve equals 50% of stated capital.
(2) Changes in retained earnings for the years ended December 31, 2012 and 2011, are as
follows (in thousands of Korean won):
2012 2011
Beginning balance ₩153,781,811 (₩52,558,035)
Profit for the period 54,366,505 209,636,480
Actuarial loss and losses recognized
in retained earnings (643,918) (3,296,634)
Ending balance
₩207,504,398
₩153,781,811

(3) Changes in retained earnings (deficit) for the years ended December 31, 2012 and 2011,
are as follows (in thousands of Korean won):
2012 2011
Unappropriated retained earnings
Beginning of year ₩149,881,811 (₩57,458,035)
Net income for year 54,366,505 209,636,480
Actuarial gains (losses) (643,918) (3,296,634)
End of year 203,604,398 148,881,811
Appropriations
Reserve for research and human resource
development
- 1,000,000
Unappropriated retained earnings to be carried
forward to next year
₩203,604,398
₩149,881,811
The appropriations of retained earnings for the year ended December 31, 2012, will be
approved by general stockholders’ meeting on March 29, 2013.
22. SALES:
(1) Details of sales for the years ended December 31, 2012 and 2011, are as follows (in
thousands of Korean won):
2012 2011
Sales of goods ₩ 1,313,720,647 ₩ 1,967,195,914
Construction sales 58,523,635 36,597,158
Others 5,374,676 2,156,190
Total ₩ 1,377,618,958 ₩ 2,005,949,262

23. SEGMENT INFORMATION:
The Company has a single reportable segment determined by considering the characteristics
of the nature of goods and assets to create sales.
(1) The following table provides sale information by geographical segment for the years
ended December 31, 2012 and 2011 (in thousands of Korean won):
2012 2011
Domestic ₩ 702,836,130 ₩ 1,304,174,230
Foreign parts 674,782,828 701,775,032
Total ₩ 1,377,618,958 ₩ 2,005,949,262
(2) There is a single external customer who accounted for 10% or more of the Company’s
sales for the years ended December 31, 2012 and 2011 (in thousands of Korean won):
2012 2011
Samsung Heavy Industries Co., Ltd. ₩ 188,721,483 ₩ 580,770,991
Daewoo Shipbuilding & Marine
Engineering Co., Ltd. 320,541,592 364,401,332
JIANGSU NEW YANGZI 169,749,061 -
Total ₩ 679,012,136 ₩ 945,172,323
24. CONSTRUCTION CONTRACTS:
(1) Details of profit and unbilled (overbilled) construction receivables (payables) under
construction contract for the years ended December 31, 2012 and 2011, are as follows
(in thousands of Korean won):
2012
Contract receivables
Construction
cost
Construction
revenue
Construction
profit Claimed Not claimed
Gross amount
due to
customers
Diesel engine ₩ 222,031,899 ₩ 201,388,804 ₩ 20,643,095 ₩ - ₩ 5,930 ₩ 19,416,602
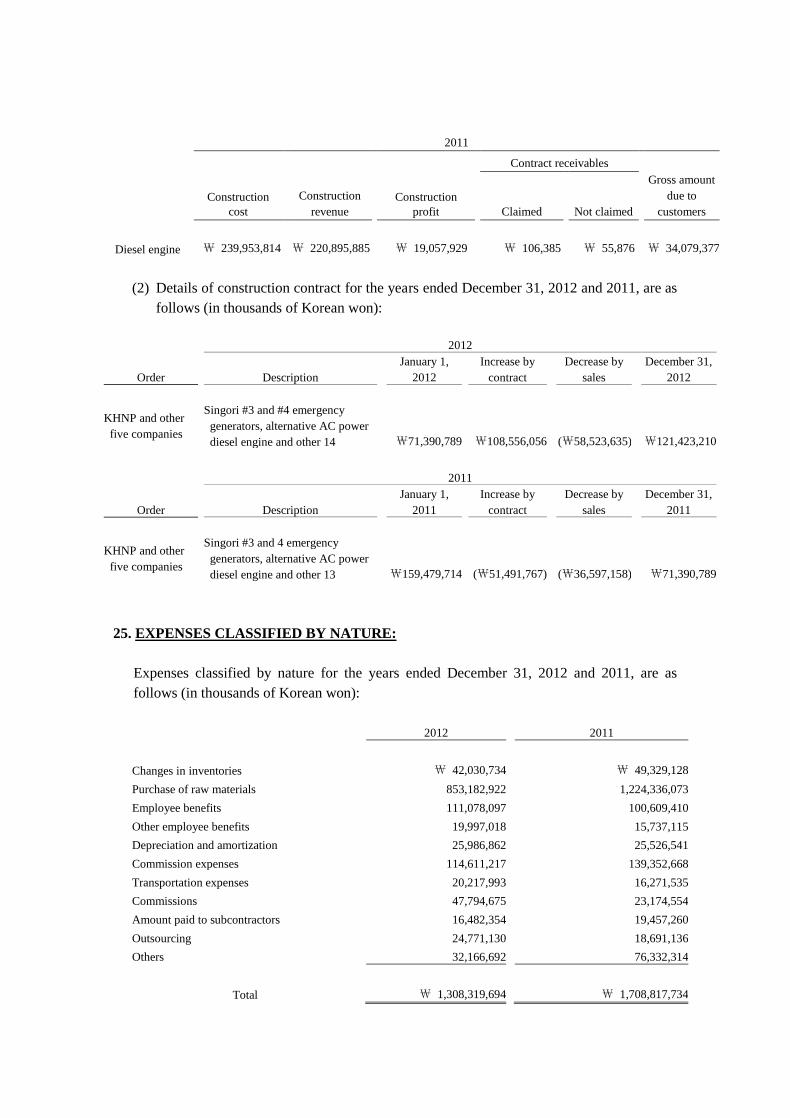
2011
Contract receivables
Construction
cost
Construction
revenue
Construction
profit Claimed Not claimed
Gross amount
due to
customers
Diesel engine ₩ 239,953,814 ₩ 220,895,885 ₩ 19,057,929 ₩ 106,385 ₩ 55,876 ₩ 34,079,377
(2) Details of construction contract for the years ended December 31, 2012 and 2011, are as
follows (in thousands of Korean won):
2012
Order
Description
January 1,
2012
Increase by
contract
Decrease by
sales
December 31,
2012
KHNP and other
five companies
Singori #3 and #4 emergency
generators, alternative AC power
diesel engine and other 14 ₩71,390,789 ₩108,556,056 (₩58,523,635) ₩121,423,210
2011
Order
Description
January 1,
2011
Increase by
contract
Decrease by
sales
December 31,
2011
KHNP and other
five companies
Singori #3 and 4 emergency
generators, alternative AC power
diesel engine and other 13 ₩159,479,714 (₩51,491,767) (₩36,597,158) ₩71,390,789
25. EXPENSES CLASSIFIED BY NATURE:
Expenses classified by nature for the years ended December 31, 2012 and 2011, are as
follows (in thousands of Korean won):
2012 2011
Changes in inventories
₩ 42,030,734 ₩ 49,329,128
Purchase of raw materials 853,182,922 1,224,336,073
Employee benefits 111,078,097 100,609,410
Other employee benefits 19,997,018 15,737,115
Depreciation and amortization 25,986,862 25,526,541
Commission expenses 114,611,217 139,352,668
Transportation expenses 20,217,993 16,271,535
Commissions 47,794,675 23,174,554
Amount paid to subcontractors 16,482,354 19,457,260
Outsourcing 24,771,130 18,691,136
Others 32,166,692 76,332,314
Total ₩ 1,308,319,694 ₩ 1,708,817,734
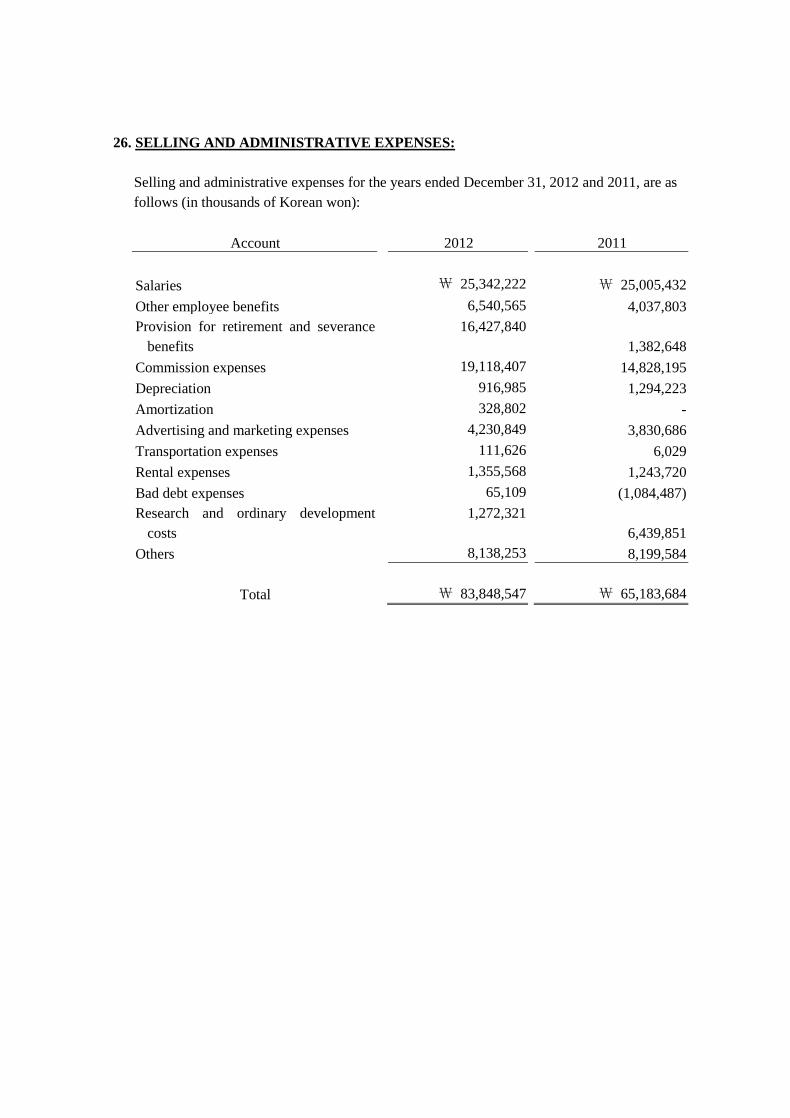
26. SELLING AND ADMINISTRATIVE EXPENSES:
Selling and administrative expenses for the years ended December 31, 2012 and 2011, are as
follows (in thousands of Korean won):
Account 2012 2011
Salaries ₩ 25,342,222 ₩ 25,005,432
Other employee benefits 6,540,565 4,037,803
Provision for retirement and severance
benefits
16,427,840
1,382,648
Commission expenses 19,118,407 14,828,195
Depreciation 916,985 1,294,223
Amortization 328,802 -
Advertising and marketing expenses 4,230,849 3,830,686
Transportation expenses 111,626 6,029
Rental expenses 1,355,568 1,243,720
Bad debt expenses 65,109 (1,084,487)
Research and ordinary development
costs
1,272,321
6,439,851
Others 8,138,253 8,199,584
Total
₩ 83,848,547
₩ 65,183,684
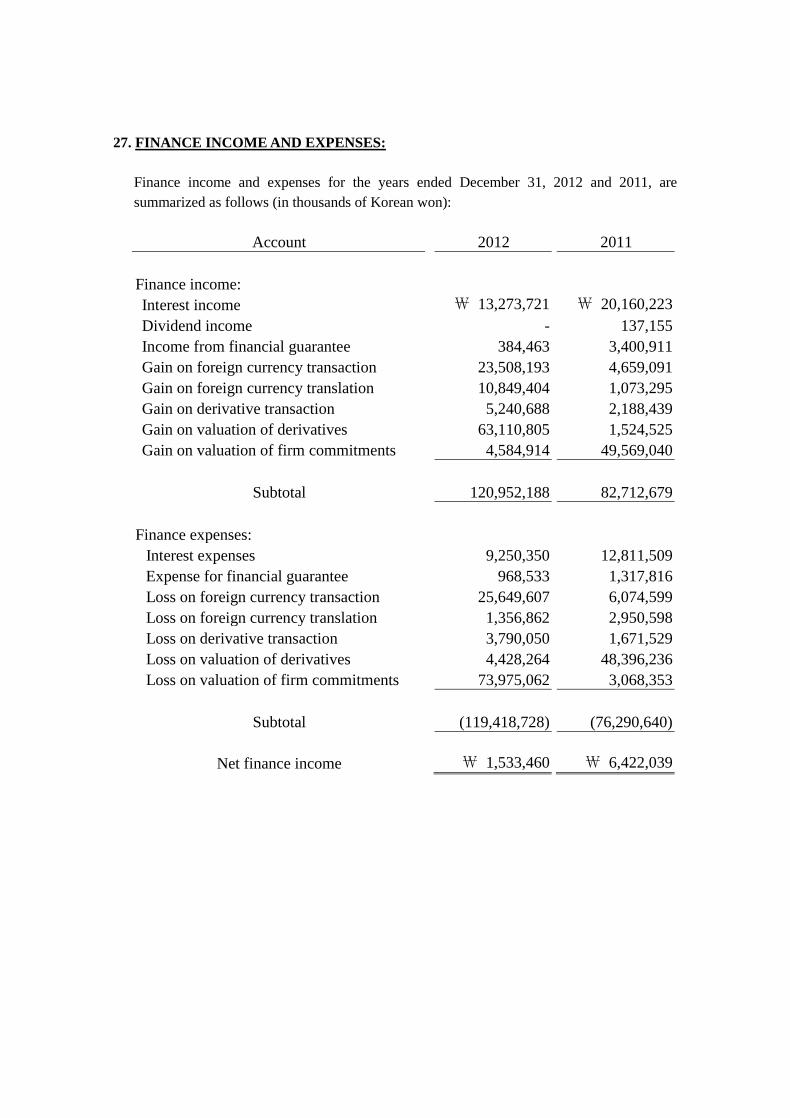
27. FINANCE INCOME AND EXPENSES:
Finance income and expenses for the years ended December 31, 2012 and 2011, are
summarized as follows (in thousands of Korean won):
Account 2012 2011
Finance income:
Interest income ₩ 13,273,721 ₩ 20,160,223
Dividend income - 137,155
Income from financial guarantee 384,463 3,400,911
Gain on foreign currency transaction 23,508,193 4,659,091
Gain on foreign currency translation 10,849,404 1,073,295
Gain on derivative transaction 5,240,688 2,188,439
Gain on valuation of derivatives 63,110,805 1,524,525
Gain on valuation of firm commitments 4,584,914 49,569,040
Subtotal 120,952,188 82,712,679
Finance expenses:
Interest expenses 9,250,350 12,811,509
Expense for financial guarantee 968,533 1,317,816
Loss on foreign currency transaction 25,649,607 6,074,599
Loss on foreign currency translation 1,356,862 2,950,598
Loss on derivative transaction 3,790,050 1,671,529
Loss on valuation of derivatives 4,428,264 48,396,236
Loss on valuation of firm commitments 73,975,062 3,068,353
Subtotal (119,418,728) (76,290,640)
Net finance income
₩ 1,533,460
₩ 6,422,039

28. OTHER NON-OPERATING INCOME AND EXPENSES:
(1) Detail of other operating income and expenses
Other operating income and expenses for the years ended December 31, 2012 and 2011,
consist of the following (in thousands of Korean won):
Account 2012 2011
Other operating income:
Commission ₩ 524,571 ₩ 628,249
Rental income 22,232 136,913
Gain on disposal of property, plant and equipment 223,357 196,294
Gain on disposal of intangible assets 54,552 -
Other income 12,410,121 3,939,202
Subtotal 13,234,833 4,900,658
Other operating expenses:
Donations 8,096,140 10,029,177
Loss on disposal of property, plant and equipment 8,830 97,562
Loss on disposal of intangible assets 7,491 -
Impairment loss of intangible assets 314,895 588,569
Other loss 3,384,850 12,529,555
Subtotal (11,812,206) (23,244,863)
Total
₩ 1,422,627
(₩ 18,344,205)
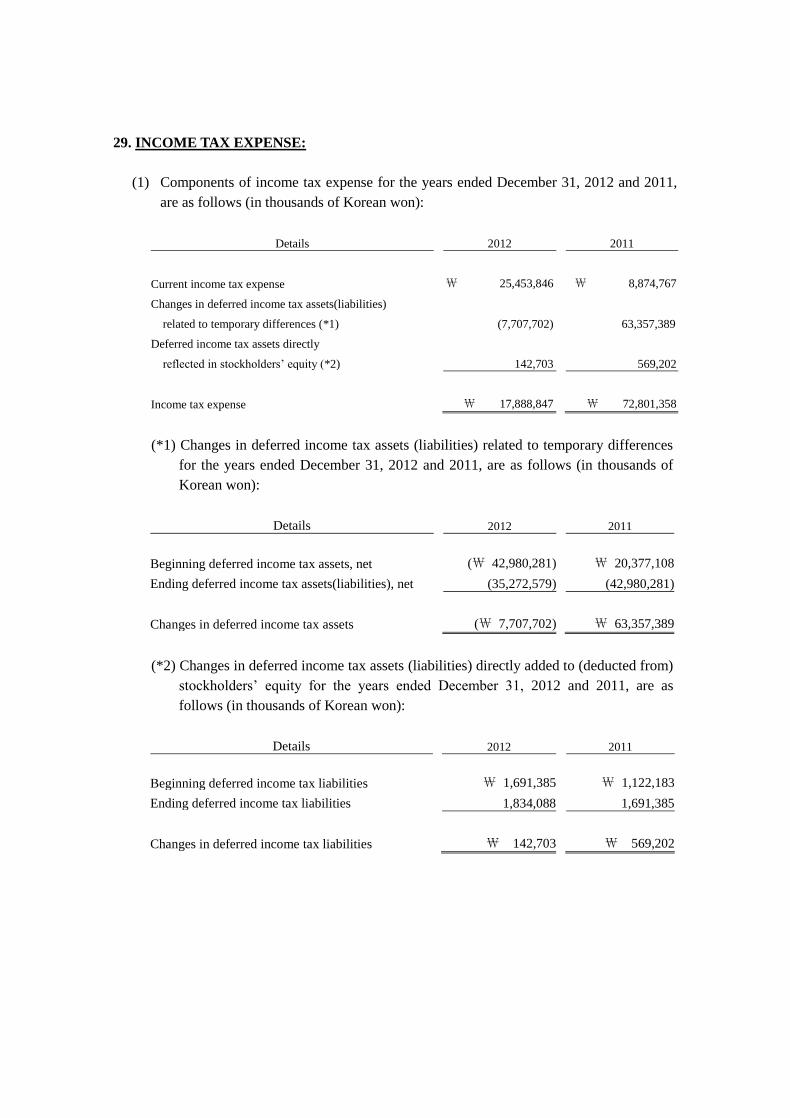
29. INCOME TAX EXPENSE:
(1) Components of income tax expense for the years ended December 31, 2012 and 2011,
are as follows (in thousands of Korean won):
Details 2012 2011
Current income tax expense ₩ 25,453,846 ₩ 8,874,767
Changes in deferred income tax assets(liabilities)
related to temporary differences (*1)
Deferred income tax assets directly
reflected in stockholders’ equity (*2)
(7,707,702)
142,703
63,357,389
569,202
Income tax expense ₩ 17,888,847 ₩ 72,801,358
(*1) Changes in deferred income tax assets (liabilities) related to temporary differences
for the years ended December 31, 2012 and 2011, are as follows (in thousands of
Korean won):
Details 2012 2011
Beginning deferred income tax assets, net
(₩ 42,980,281) ₩ 20,377,108
Ending deferred income tax assets(liabilities), net (35,272,579) (42,980,281)
Changes in deferred income tax assets
(₩ 7,707,702) ₩ 63,357,389
(*2) Changes in deferred income tax assets (liabilities) directly added to (deducted from)
stockholders’ equity for the years ended December 31, 2012 and 2011, are as
follows (in thousands of Korean won):
Details 2012 2011
Beginning deferred income tax liabilities
₩ 1,691,385 ₩ 1,122,183
Ending deferred income tax liabilities 1,834,088 1,691,385
Changes in deferred income tax liabilities
₩ 142,703 ₩ 569,202

(2) The Company offsets deferred tax assets and deferred tax liabilities if the Company has
a legally enforceable right to set off current tax assets against current tax liabilities, and
the deferred tax assets and the deferred tax liabilities relate to income taxes levied by
the same taxation authority. Changes in deferred tax assets and liabilities for the years
ended December 31, 2012 and 2011, are as follows (in thousands of Korean won):
Change
Details January 1, 2012 Income Capital December 31, 2012
Foreign currency translation, net
₩ 4,409,556 (₩ 1,264,655)
₩ - ₩ 3,144,901
Depreciation 233,386 671,164 - 904,550
Allowance for doubtful accounts 587,851 190,100 - 777,951
Accrued income (599,879) 264,566 - (335,313)
Loss on inventory obsolescence 9,659,101 (1,205,627) - 8,453,474
Currency forwards 9,464,948 (20,248,448) (106,567) (10,890,067)
Firm commitment assets (31,395,057) 29,313,942 - (2,081,115)
Loss on investment assets - 721,049 43,692 764,741
Loss on equity-method investees 670,709 (670,709) - -
Long-term loan (119,911) 47,075 - (72,836)
Subcost on membership 273,259 76,204 - 349,463
Accrued expenses 1,414,624 (973,334) - 441,290
Unearned revenue (9,357,452) 5,792,298 - (3,565,154)
Long-term borrowings 4,787,244 (3,982,836) - 804,408
Financial guarantee liabilities 84,458 (111,951) - (27,493)
Provision for construction warranties 4,962,720 (711,247) - 4,251,473
Litigation reserve - 484,000 - 484,000
Provision for severance indemnities 4,451,447 (919,147) 205,578 3,737,878
Gain on revaluation of land and buildings (42,554,397) - - (42,554,397)
Others 47,112 (445) - 46,667
Subtotal (42,980,281) 7,471,999 142,703 (35,365,579)
Tax credits
- 93,000
- 93,000
Total
(₩42,980,281) ₩7,564,999
₩142,703 (₩35,272,579)

Change
Details January 1, 2011 Income Capital December 31, 2011
Foreign currency translation, net
₩ 6,414,000 (₩ 2,004,444)
₩ - ₩ 4,409,556
Depreciation 1,654,374 (1,420,988) - 233,386
Donations in excess of tax limit 5,035,229 (5,035,229) - -
Allowance for doubtful accounts 917,175 (329,324) - 587,851
Accrued income (32,398) (567,481) - (599,879)
Loss on inventory obsolescence 6,200,044 3,459,057 - 9,659,101
Currency forwards (7,344,417) 17,354,694 (545,329) 9,464,948
Firm commitment assets (54,873,283) 23,478,226 - (31,395,057)
Loss on equity-method investees - 670,709 - 670,709
Long-term loan - (119,911) - (119,911)
Subcost on membership 8,278 264,981 - 273,259
Accrued expenses 751,980 662,644 - 1,414,624
Unearned revenue (14,997,064) 5,639,612 - (9,357,452)
Long-term borrowings 5,351,319 (564,075) - 4,787,244
Financial guarantee liabilities - 84,458 - 84,458
Provision for construction warranties 3,179,510 1,783,210 - 4,962,720
Provision for severance indemnities 2,910,232 2,011,502 (470,287) 4,451,447
Appropriated retained earnings for
technological development
(242,000) 242,000 - -
Gain on revaluation of land and buildings (38,685,815) (3,868,582) - (42,554,397)
Others 26,995,227 (26,948,115) - 47,112
Subtotal (56,757,609) 14,792,944 (1,015,616) (42,980,281)
Tax credits 69,703,377 (69,703,377) - -
Tax loss carryforwards 7,431,340 (7,431,340) - -
Total ₩ 20,377,108 (₩ 62,341,773) (₩1,015,616) (₩42,980,281)
(3) Temporary differences, net loss and tax credit carryforwards, which have not been
recognized as deferred income tax assets are expired and unused for the years ended
December 31, 2012 and 2011.
The probability of deferred tax assets being realized depends on the Company’s ability
to generate taxable income in future years, the economic situation and industry forecast.
The Company periodically reviews such matters.

(4) Temporary differences associated with investments in subsidiaries, which are not
recognized as deferred tax assets, as of December 31, 2012 and 2011, are as follows (in
thousands of Korean won):
December 31, 2012 December 31, 2011
Subsidiaries (₩ 5,242,062) (₩ 5,242,062)
Associates 394,451,511 394,659,530
Total ₩ 389,209,449 ₩ 389,417,468
(5) Deferred income tax assets (liabilities) and income tax benefits (expense) added to
(deducted from) stockholders’ equity as of December 31, 2012 and 2011, are as follows
(in thousands of Korean won):
December 31, 2012 December 31, 2011
Details Gross Tax effect Net of tax Gross Tax effect Net of tax
Loss on valuation of
derivatives
₩- ₩- ₩- (₩440,359) ₩106,567 (₩333,792)
Loss on valuation of
marketable securities
(180,547) 43,692 (136,855) - - -
Actuarial gain or loss (7,398,331) 1,790,396 (5,607,935) (6,548,835) 1,584,818 (4,964,018)
Total
(₩7,578,878) ₩1,834,088 (₩5,744,790) (₩6,989,194) ₩1,691,385 (₩5,297,810)
(6) An explanation of the relationship between income tax expense and accounting income
(loss) before income tax expense for the years ended December 31, 2012 and 2011, is
as follows (in thousands of Korean won):
Details 2012 2011
Income (loss) before income tax expense
₩ 72,255,352 ₩ 282,437,839
Income tax expense at statutory income tax rate
(Less than ₩200 million: 11%
Over ₩200 million: 24.2%)
15,476,177 68,323,557
Differences (Note 1) 2,412,670 4,477,802
Income tax expense
₩ 17,888,847 ₩ 72,801,359
Effective tax rates 24.76% 25.78%

(Note 1) Differences:
Additional Payment of Income Taxes ₩ 2,270,685 ₩-
Non-temporary difference 117,059 233,456
Temporary difference not recognized as
deferred income tax
(87,160) 2,495,223
Difference of tax rates - 2,511,684
Others 112,086 (762,561)
Total
₩ 2,412,670 ₩ 4,477,802
30. EARNINGS PER SHARE:
(1) Basic earnings per share
Basic earnings per share are computed by dividing net income attributable to owners of
the parent company by the weighted-average number of common shares outstanding
during the period (in thousands of Korean won, except for share data).
2012 2011
Net income available to common shares
₩54,366,505
₩209,636,480
Weighted-average number of common shares
outstanding (*1) 69,500,000 69,500,000
Basic net income per share ₩ 782 ₩ 3,016
(*1) The weighted-average number of common shares outstanding for the years ended
December 31, 2012 and 2011, are equal to the number of shares outstanding.
(2) Diluted earnings per share
The Company does not compute diluted earnings per common share for the years ended
December 31, 2012 and 2011, because there is no item related to dilution. Diluted
earnings per share are equal to earnings per share for the years ended December 31,
2012 and 2011.
Due to the antidilutive effect for the years ended December 31, 2012 and 2011, the
Company is not considering share option, which could dilute the basic earnings per
share in the future.
2012 2011
Share option 82,500 33,900

31. COMMITMENTS AND CONTINGENCIES:
(1) Notes and checks provided as collateral
As of December 31, 2012, the Company has provided 3 (as of December 31, 2011: 3)
blank promissory notes and 50 (as of December 31, 2011: 117) promissory notes
amounting to USD 25,102,190 (as of December 31, 2011: USD 61,030,834) to Daewoo
Shipbuilding & Marine Engineering Co., Ltd., and four other companies as security in
connection with contract performance guarantees and guarantees for advance receipts.
(2) Trade receivables sold at discount
Outstanding trade receivables sold with recourse by the Company are in the amount of
₩29,828,495 thousand and ₩23,306,698 thousand as of December 31, 2012 and 2011,
respectively.
(3) Pending litigation (in thousands of Korean won):
Site Plaintiff Defendant Claim Claimed amount Progress
Greece GAEI
(Guam Advance
Enterprises. Inc.)
Doosan Engine
Co., Ltd.
Damages for
cancellation of
contract
(related Greece
Chios diesel plant)
EUR 3,059,635
Pending in the
court of first
instance
Ulsan
District
Court
Ulsan District Public
Presecutor’s Office
Doosan Engine
Co., Ltd.
Criminal case regarding
the use and acquisition
of trade secret
₩ 2,000,000 Scheduled
in the court of
second
instance
As of December 31, 2012, the outcome of the cases is unpredicted.
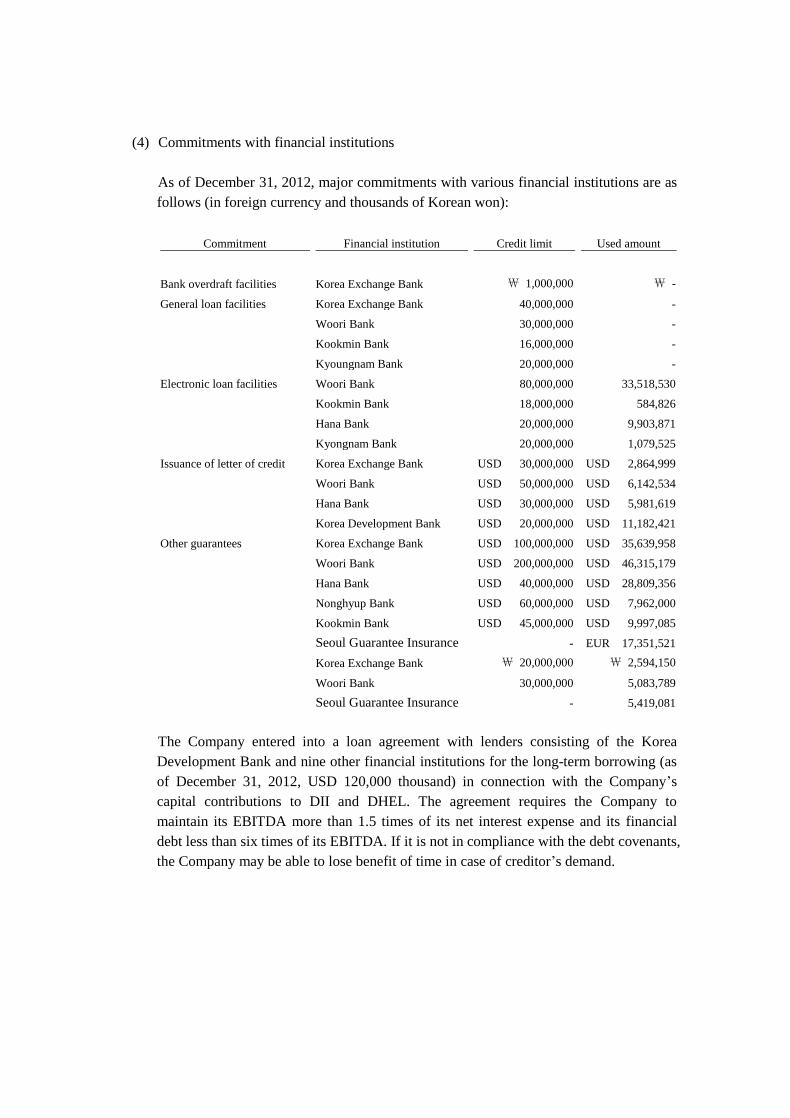
(4) Commitments with financial institutions
As of December 31, 2012, major commitments with various financial institutions are as
follows (in foreign currency and thousands of Korean won):
Commitment Financial institution Credit limit Used amount
Bank overdraft facilities Korea Exchange Bank ₩ 1,000,000 ₩ -
General loan facilities Korea Exchange Bank 40,000,000 -
Woori Bank 30,000,000 -
Kookmin Bank 16,000,000 -
Kyoungnam Bank 20,000,000 -
Electronic loan facilities Woori Bank 80,000,000 33,518,530
Kookmin Bank 18,000,000 584,826
Hana Bank 20,000,000 9,903,871
Kyongnam Bank 20,000,000 1,079,525
Issuance of letter of credit Korea Exchange Bank USD 30,000,000 USD 2,864,999
Woori Bank USD 50,000,000 USD 6,142,534
Hana Bank USD 30,000,000 USD 5,981,619
Korea Development Bank USD 20,000,000 USD 11,182,421
Other guarantees Korea Exchange Bank USD 100,000,000 USD 35,639,958
Woori Bank USD 200,000,000 USD 46,315,179
Hana Bank USD 40,000,000 USD 28,809,356
Nonghyup Bank USD 60,000,000 USD 7,962,000
Kookmin Bank USD 45,000,000 USD 9,997,085
Seoul Guarantee Insurance - EUR 17,351,521
Korea Exchange Bank ₩ 20,000,000 ₩ 2,594,150
Woori Bank 30,000,000 5,083,789
Seoul Guarantee Insurance - 5,419,081
The Company entered into a loan agreement with lenders consisting of the Korea
Development Bank and nine other financial institutions for the long-term borrowing (as
of December 31, 2012, USD 120,000 thousand) in connection with the Company’s
capital contributions to DII and DHEL. The agreement requires the Company to
maintain its EBITDA more than 1.5 times of its net interest expense and its financial
debt less than six times of its EBITDA. If it is not in compliance with the debt covenants,
the Company may be able to lose benefit of time in case of creditor’s demand.

(5) Technology transfer contract
The Company has seven technical license agreements with several foreign companies
for the purpose of manufacturing engines. In accordance with the agreements, the
Company is committed to pay a royalty calculated based on the cumulative horse power
of engines manufactured during the year. The royalty amounted to ₩114,611,217
thousand and ₩139,352,668 thousand for the years ended December 31, 2012 and 2011,
respectively.
32. GUARANTEES AND PLEDGED ASSETS:
(1) Guarantees received by the Company from third parties as of December 31, 2012, are as
follows (in foreign currencies and thousands of Korean won):
Guarantee received from
Guaranteed
amount (foreign
currency)
Description of guarantee
Korea Exchange Bank
USD
35,623,383
Guarantee for advance receipts, defect and
contract performance guarantee
EUR 12,535 Guarantee for defect
KRW 2,594,150
Guarantee for defect and contract
performance guarantee
Woori Bank USD 46,315,179
Guarantee for advance receipts and
contract performance guarantee
KRW 5,083,789
Guarantee for advance receipts and
contract performance guarantee
Kookmin Bank USD 9,997,085
Guarantee for advance receipts, defect and
contract performance guarantee
Nonghyup Bank USD 7,962,000 Guarantee for advance receipts
Hana Bank USD 28,809,356 Guarantee for advance receipts
Seoul Guarantee Insurance
EUR
17,351,521
Guarantee for advance receipts and
contract performance guarantee
KRW 5,419,081
Guarantee for advance receipts and
contract performance guarantee
Total
USD 128,707,003
EUR 17,364,056
KRW 13,097,020
(2) Guarantees provided by the Company to unrelated parties as of December 31, 2012, are
as follows (in thousands of Korean won):
Guarantee Guaranteed amount
Description of guarantee
Korea Securities Finance Co., Ltd ₩ 15,934,592 Guarantee for the borrowings
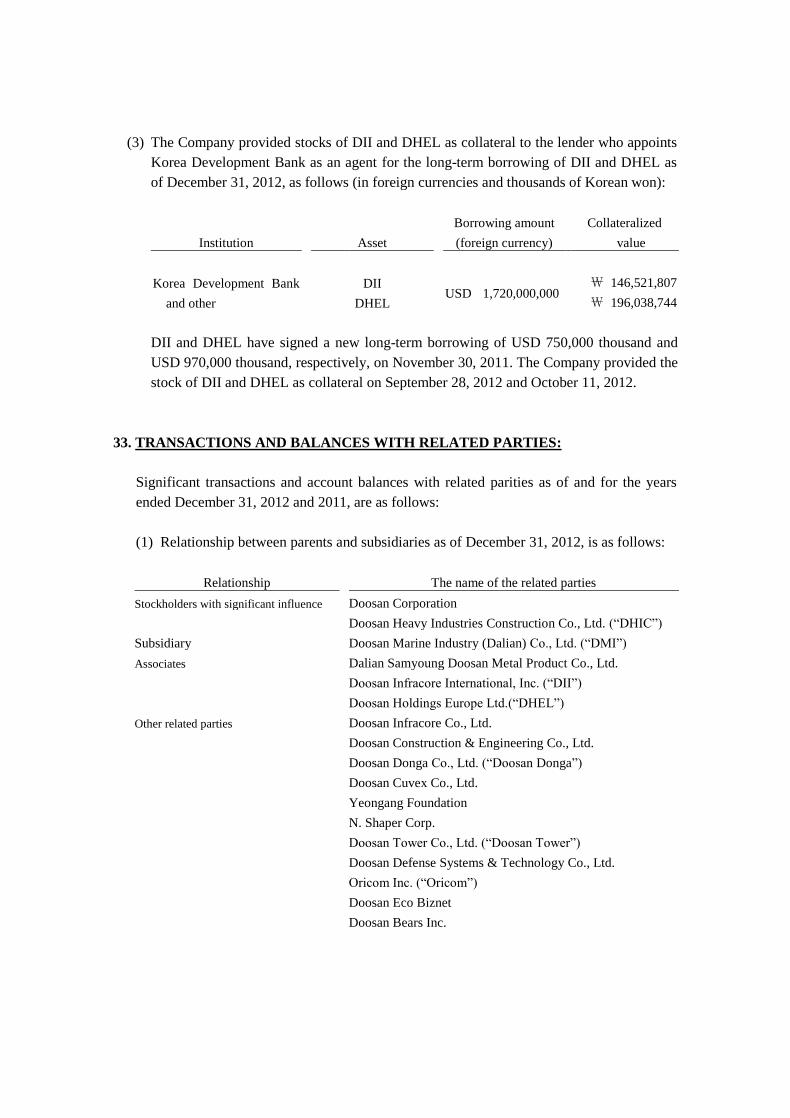
(3) The Company provided stocks of DII and DHEL as collateral to the lender who appoints
Korea Development Bank as an agent for the long-term borrowing of DII and DHEL as
of December 31, 2012, as follows (in foreign currencies and thousands of Korean won):
Institution Asset
Borrowing amount
(foreign currency)
Collateralized
value
Korea Development Bank
and other
DII USD 1,720,000,000
₩ 146,521,807
DHEL ₩ 196,038,744
DII and DHEL have signed a new long-term borrowing of USD 750,000 thousand and
USD 970,000 thousand, respectively, on November 30, 2011. The Company provided the
stock of DII and DHEL as collateral on September 28, 2012 and October 11, 2012.
33. TRANSACTIONS AND BALANCES WITH RELATED PARTIES:
Significant transactions and account balances with related parities as of and for the years
ended December 31, 2012 and 2011, are as follows:
(1) Relationship between parents and subsidiaries as of December 31, 2012, is as follows:
Relationship The name of the related parties
Stockholders with significant influence Doosan Corporation
Doosan Heavy Industries Construction Co., Ltd. (“DHIC”)
Subsidiary Doosan Marine Industry (Dalian) Co., Ltd. (“DMI”)
Associates Dalian Samyoung Doosan Metal Product Co., Ltd.
Doosan Infracore International, Inc. (“DII”)
Doosan Holdings Europe Ltd.(“DHEL”)
Other related parties Doosan Infracore Co., Ltd.
Doosan Construction & Engineering Co., Ltd.
Doosan Donga Co., Ltd. (“Doosan Donga”)
Doosan Cuvex Co., Ltd.
Yeongang Foundation
N. Shaper Corp.
Doosan Tower Co., Ltd. (“Doosan Tower”)
Doosan Defense Systems & Technology Co., Ltd.
Oricom Inc. (“Oricom”)
Doosan Eco Biznet
Doosan Bears Inc.
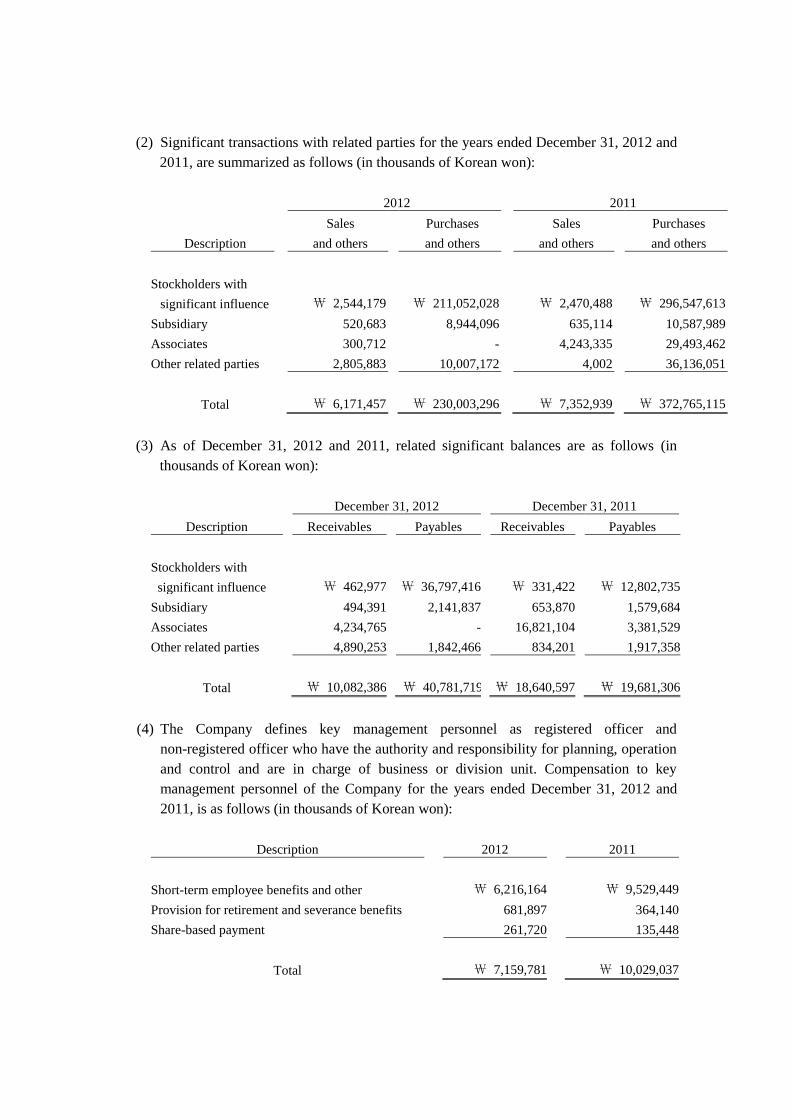
(2) Significant transactions with related parties for the years ended December 31, 2012 and
2011, are summarized as follows (in thousands of Korean won):
Description
2012 2011
Sales
and others
Purchases
and others
Sales
and others
Purchases
and others
Stockholders with
significant influence
₩ 2,544,179 ₩ 211,052,028 ₩ 2,470,488 ₩ 296,547,613
Subsidiary 520,683 8,944,096 635,114 10,587,989
Associates 300,712 - 4,243,335 29,493,462
Other related parties 2,805,883 10,007,172 4,002 36,136,051
Total ₩ 6,171,457 ₩ 230,003,296 ₩ 7,352,939 ₩ 372,765,115
(3) As of December 31, 2012 and 2011, related significant balances are as follows (in
thousands of Korean won):
Description
December 31, 2012 December 31, 2011
Receivables Payables Receivables Payables
Stockholders with
significant influence
₩ 462,977 ₩ 36,797,416 ₩ 331,422 ₩ 12,802,735
Subsidiary 494,391 2,141,837 653,870 1,579,684
Associates 4,234,765 - 16,821,104 3,381,529
Other related parties 4,890,253 1,842,466 834,201 1,917,358
Total ₩ 10,082,386 ₩ 40,781,719 ₩ 18,640,597 ₩ 19,681,306
(4) The Company defines key management personnel as registered officer and
non-registered officer who have the authority and responsibility for planning, operation
and control and are in charge of business or division unit. Compensation to key
management personnel of the Company for the years ended December 31, 2012 and
2011, is as follows (in thousands of Korean won):
Description 2012 2011
Short-term employee benefits and other ₩ 6,216,164 ₩ 9,529,449
Provision for retirement and severance benefits 681,897 364,140
Share-based payment 261,720 135,448
Total
₩ 7,159,781 ₩ 10,029,037
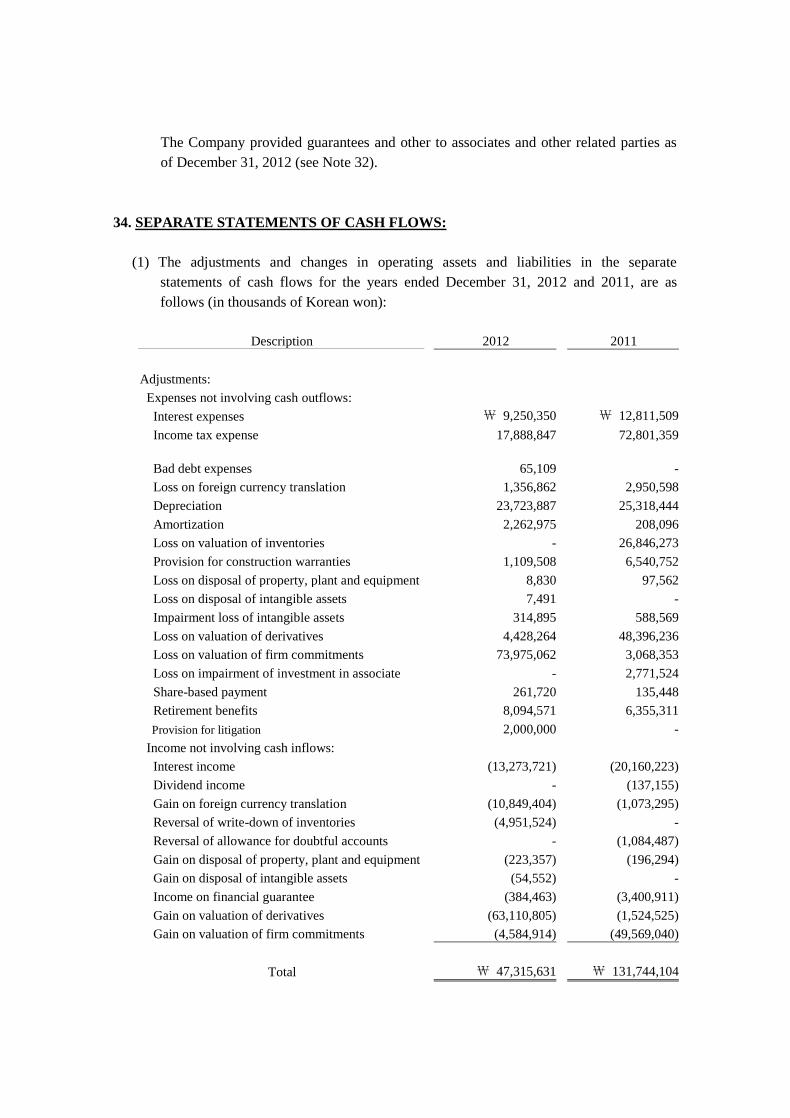
The Company provided guarantees and other to associates and other related parties as
of December 31, 2012 (see Note 32).
34. SEPARATE STATEMENTS OF CASH FLOWS:
(1) The adjustments and changes in operating assets and liabilities in the separate
statements of cash flows for the years ended December 31, 2012 and 2011, are as
follows (in thousands of Korean won):
Description 2012 2011
Adjustments:
Expenses not involving cash outflows:
Interest expenses ₩ 9,250,350 ₩ 12,811,509
Income tax expense 17,888,847 72,801,359
Bad debt expenses
65,109 -
Loss on foreign currency translation 1,356,862 2,950,598
Depreciation 23,723,887 25,318,444
Amortization 2,262,975 208,096
Loss on valuation of inventories - 26,846,273
Provision for construction warranties 1,109,508 6,540,752
Loss on disposal of property, plant and equipment 8,830 97,562
Loss on disposal of intangible assets 7,491 -
Impairment loss of intangible assets 314,895 588,569
Loss on valuation of derivatives 4,428,264 48,396,236
Loss on valuation of firm commitments 73,975,062 3,068,353
Loss on impairment of investment in associate - 2,771,524
Share-based payment 261,720 135,448
Retirement benefits 8,094,571 6,355,311
Provision for litigation 2,000,000 -
Income not involving cash inflows:
Interest income (13,273,721) (20,160,223)
Dividend income - (137,155)
Gain on foreign currency translation (10,849,404) (1,073,295)
Reversal of write-down of inventories (4,951,524) -
Reversal of allowance for doubtful accounts - (1,084,487)
Gain on disposal of property, plant and equipment (223,357) (196,294)
Gain on disposal of intangible assets (54,552) -
Income on financial guarantee (384,463) (3,400,911)
Gain on valuation of derivatives (63,110,805) (1,524,525)
Gain on valuation of firm commitments (4,584,914) (49,569,040)
Total ₩ 47,315,631 ₩ 131,744,104
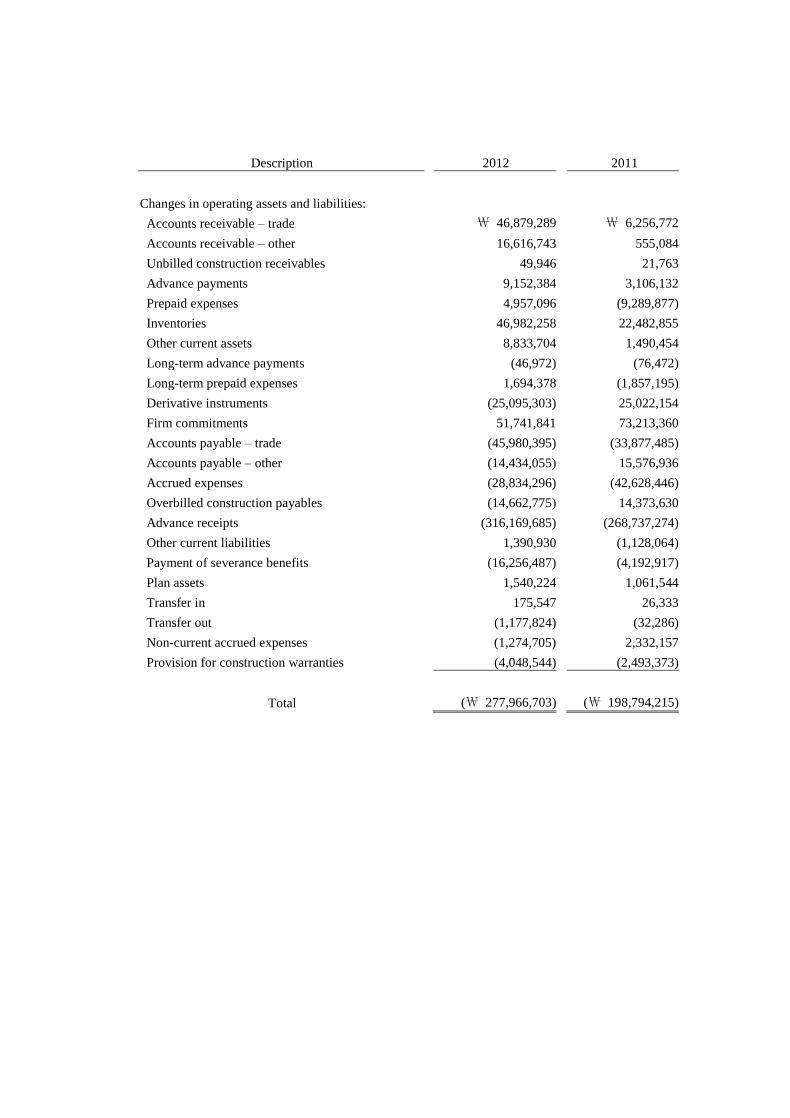
Description 2012 2011
Changes in operating assets and liabilities:
Accounts receivable – trade ₩ 46,879,289 ₩ 6,256,772
Accounts receivable – other 16,616,743 555,084
Unbilled construction receivables 49,946 21,763
Advance payments 9,152,384 3,106,132
Prepaid expenses 4,957,096 (9,289,877)
Inventories 46,982,258 22,482,855
Other current assets 8,833,704 1,490,454
Long-term advance payments (46,972) (76,472)
Long-term prepaid expenses 1,694,378 (1,857,195)
Derivative instruments (25,095,303) 25,022,154
Firm commitments 51,741,841 73,213,360
Accounts payable – trade (45,980,395) (33,877,485)
Accounts payable – other (14,434,055) 15,576,936
Accrued expenses (28,834,296) (42,628,446)
Overbilled construction payables (14,662,775) 14,373,630
Advance receipts (316,169,685) (268,737,274)
Other current liabilities 1,390,930 (1,128,064)
Payment of severance benefits (16,256,487) (4,192,917)
Plan assets 1,540,224 1,061,544
Transfer in 175,547 26,333
Transfer out (1,177,824) (32,286)
Non-current accrued expenses (1,274,705) 2,332,157
Provision for construction warranties (4,048,544) (2,493,373)
Total (₩ 277,966,703) (₩ 198,794,215)
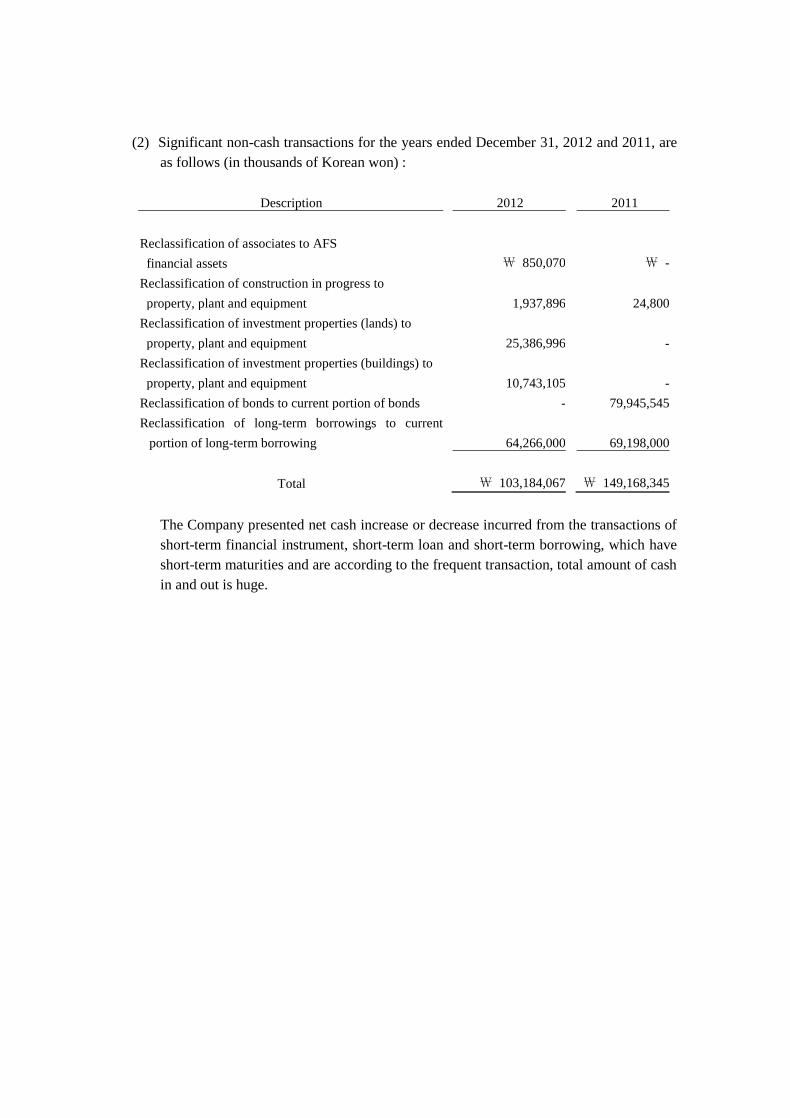
(2) Significant non-cash transactions for the years ended December 31, 2012 and 2011, are
as follows (in thousands of Korean won) :
Description 2012 2011
Reclassification of associates to AFS
financial assets
₩ 850,070 ₩ -
Reclassification of construction in progress to
property, plant and equipment
1,937,896 24,800
Reclassification of investment properties (lands) to
property, plant and equipment
25,386,996 -
Reclassification of investment properties (buildings) to
property, plant and equipment
10,743,105 -
Reclassification of bonds to current portion of bonds - 79,945,545
Reclassification of long-term borrowings to current
portion of long-term borrowing
64,266,000 69,198,000
Total ₩ 103,184,067 ₩ 149,168,345
The Company presented net cash increase or decrease incurred from the transactions of
short-term financial instrument, short-term loan and short-term borrowing, which have
short-term maturities and are according to the frequent transaction, total amount of cash
in and out is huge.