Embed Size (px)
Citation preview

This report is for information purposes and should not be considered a solicitation to buy or sell any security. Neither S&P Capital IQ nor any other party guarantees
its accuracy or makes warranties regarding results from its usage. Redistribution is prohibited without written permission. Copyright © 2013 by Standard & Poor’s
Financial Services LLC. Redistribution, reproduction and/or photocopying in whole or in part is prohibited without written permission. All rights reserved.
STANDARD & POOR’S®, S&P®, S&P 500 ®, STARS® and S&P CAPITAL IQ™ are trademarks of Standard & Poor’s Financial Services LLC. All required
disclosures and analyst certification appear on pages 13-21 of this presentation.
Don’t Dump Those Dividends!
Sam Stovall
Chief Equity Strategist
S&P Capital IQ
July 18, 2013

2.
Permission to reprint or distribute any content from this presentation requires the prior written approval of S&P Capital IQ.
HISTORY: Boring is Beautiful
40% of the total return for the S&P
500® since 1926 has come from
reinvested dividends!
3.
Permission to reprint or distribute any content from this presentation requires the prior written approval of S&P Capital IQ.
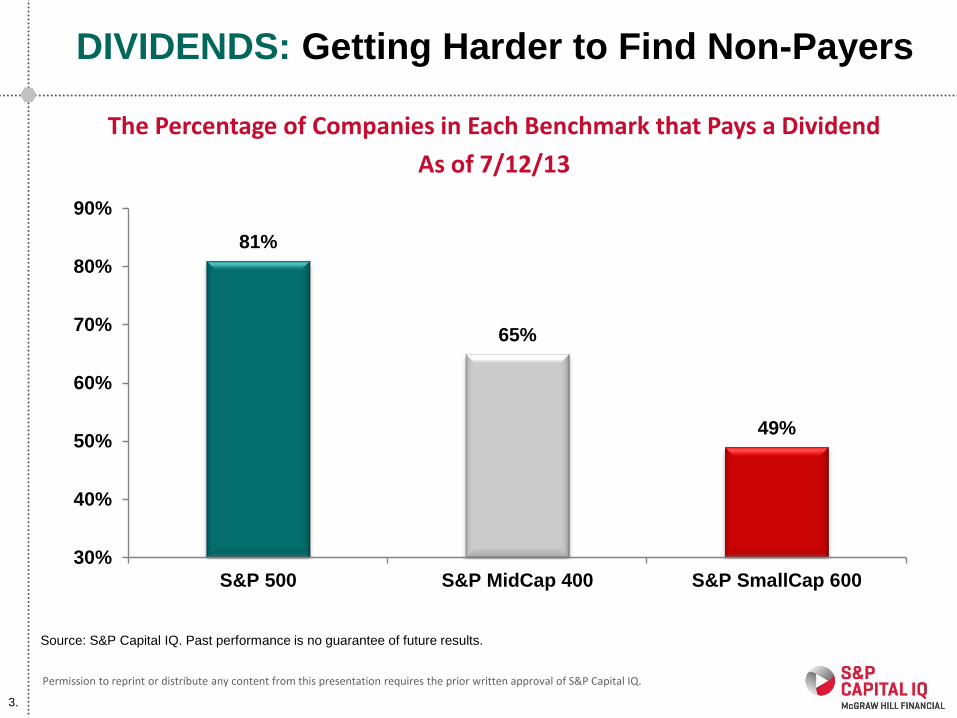
DIVIDENDS: Getting Harder to Find Non-Payers
The Percentage of Companies in Each Benchmark that Pays a Dividend
As of 7/12/13
Source: S&P Capital IQ. Past performance is no guarantee of future results.
81%
65%
49%
30%
40%
50%
60%
70%
80%
90%
S&P 500 S&P MidCap 400 S&P SmallCap 600

4.
Permission to reprint or distribute any content from this presentation requires the prior written approval of S&P Capital IQ.
DIVIDENDS: Getting Harder to Find Non-Payers
The Yield and % of Companies in Each S&P 500 Sector that Pays a Dividend
As of 7/12/13
Source: S&P Capital IQ. Past performance is no guarantee of future results.
Constituents
Dividend Paying a
S&P 500 Sector Yield % Dividend
Utilities 3.9% 100%
Consumer Staples 2.7% 95%
Industrials 2.2% 94%
Materials 2.6% 93%
Financials 1.7% 91%
Telecommunications Services 4.6% 83%
Energy 2.2% 81%
Consumer Discretionary 1.5% 73%
Information Technology 1.8% 63%
Health Care 1.9% 58%
S&P 500 2.1% 81%

5.
Permission to reprint or distribute any content from this presentation requires the prior written approval of S&P Capital IQ.
PAYOUT RATIO: Averaged More Than 50%
Current Rolling 12-Month Payout Ratio is Well Below the Long-Term Average
Source: S&P Capital IQ. Past performance is no guarantee of future results.
76%
60%
54%56%
46% 48%50%
65%
36%
30%
40%
50%
60%
70%
80%
90%19
30s
19
40s
19
50s
19
60s
19
70s
19
80s
19
90s
20
00s
Q2
20
13
Averagesince 1936:54%

6.
Permission to reprint or distribute any content from this presentation requires the prior written approval of S&P Capital IQ.
RISING RATES: Usually Lead to Higher Equity Prices
Median Monthly % Change in S&P 500 During Periods of Rising 10-Year T-Note Yields. April 1953-June 2013.
Source: S&P Capital IQ. Indexes are unmanaged, statistical composites and it is not possible to invest directly in an index. The returns shown do not
reflect payment of any sales charges or fees an investor would pay to purchase the securities they represent. The imposition of these fees and charges
would cause actual and back tested performance to be lower than the performance shown. Returns exclude dividends. Past performance is no guarantee
of future results.
1.65% 1.70%
1.31%
0.74%
-0.03%
-0.54%
-1.00%
-0.50%
0.00%
0.50%
1.00%
1.50%
2.00%
0%-3% 3%-4% 4%-5% 5%-6% 6%-7% 7%+
S&
P 5
00 %
Ch
an
ge
10-Year T-Note % Yield
Median Monthly % Change in S&P 500 During Periods of Rising 10-Year T-Note YieldsApril 1953 -- May 2013
7.
Permission to reprint or distribute any content from this presentation requires the prior written approval of S&P Capital IQ.
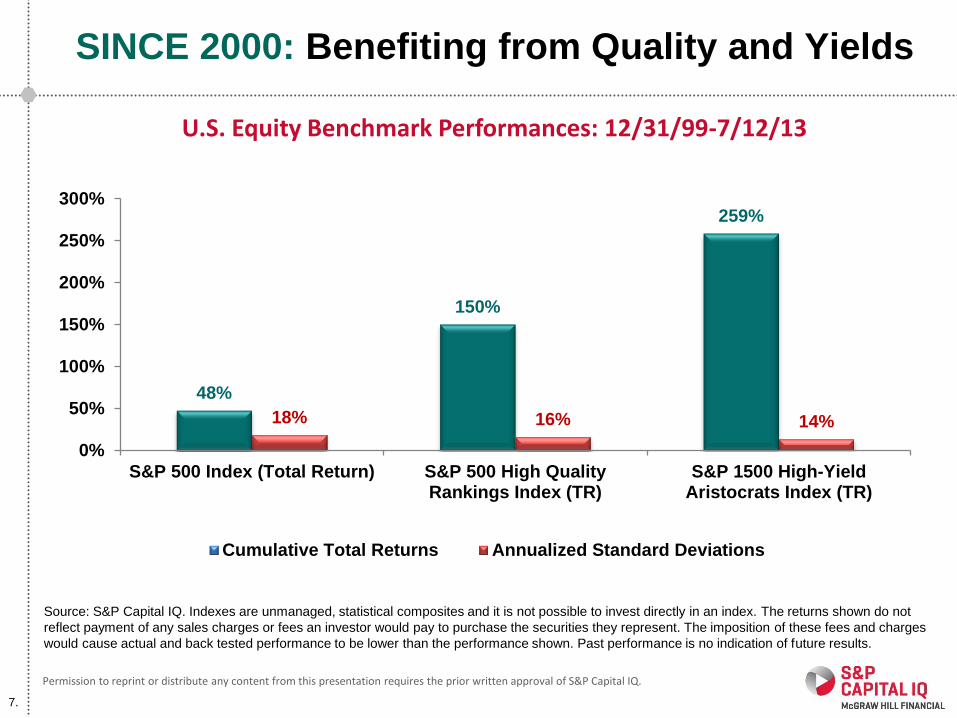
SINCE 2000: Benefiting from Quality and Yields
U.S. Equity Benchmark Performances: 12/31/99-7/12/13
Source: S&P Capital IQ. Indexes are unmanaged, statistical composites and it is not possible to invest directly in an index. The returns shown do not
reflect payment of any sales charges or fees an investor would pay to purchase the securities they represent. The imposition of these fees and charges
would cause actual and back tested performance to be lower than the performance shown. Past performance is no indication of future results.
48%
150%
259%
18% 16% 14%
0%
50%
100%
150%
200%
250%
300%
S&P 500 Index (Total Return) S&P 500 High QualityRankings Index (TR)
S&P 1500 High-YieldAristocrats Index (TR)
Cumulative Total Returns Annualized Standard Deviations

8.
Permission to reprint or distribute any content from this presentation requires the prior written approval of S&P Capital IQ.
SCREEN: High Quality Rank, Dividend Yield & STARS
Equities with Favorable S&P Capital IQ STARS and Quality Ranking, with a
Dividend Yield of 3% or More. Data as of 7/12/13.
Source: S&P Capital IQ MarketScope Advisor.
Quality Dividend
GICS Sector Stock Ticker Price STARS Rank Yield %
Consumer Discretionary MCDONALD'S CORP. MCD 102$ 4 A 3.0
Consumer Staples ALTRIA GROUP, INC. MO 37$ 4 A- 4.7
LORILLARD, INC. LO 46$ 4 A+ 4.7
Energy CHEVRON CORP. CVX 124$ 5 A+ 3.2
Financials PENNSYLVANIA REIT PEI 20$ 4 A 3.6
THE BANK OF NOVA SCOTIA BNS 55$ 4 A 4.2
Industrials GENERAL ELECTRIC CO. GE 24$ 4 A- 3.1
WASTE MANAGEMENT, INC. WM 42$ 4 A- 3.4
Utilities ONEOK, INC. OKE 43$ 4 A- 3.3
SOUTHERN CO. (THE) SO 45$ 4 A- 4.5

9.
Permission to reprint or distribute any content from this presentation requires the prior written approval of S&P Capital IQ.
YIELD SPECTRUM: Income-Generating ETFs
Source: S&P Capital IQ. S&P Capital IQ overall ETF rankings: OW-Overweight. MW-Marketweight. UW-Underweight. NR-Not Ranked.
Many Investment Vehicles are Available to Meet Investment Requirements.
Current Price, S&P Ranking and Yield as of 7/12/13.
2.1%
2.8%
4.5% 4.7%
6.6% 6.8% 6.9%7.4%
0.0%
1.0%
2.0%
3.0%
4.0%
5.0%
6.0%
7.0%
8.0%
SPY SDY RWO BKLN JNK EDIV DWX LVL
(OW $168) (OW $69) (UW $43) (UW $25) (MW $40) (UW $39) (UW $45) (UW $12)

10.
Permission to reprint or distribute any content from this presentation requires the prior written approval of S&P Capital IQ.
Source: S&P Capital IQ.
CONCLUSION: Yields Matter
CONSIDERATIONS
• Dividends/Total Returns
• Harder to Find Non-Yielders
• Low Payout Ratio
• Less Competition from Bonds
• High Yields/Low Betas
• Recovery Requirements
• Yield Spectrum

11.
Permission to reprint or distribute any content from this presentation requires the prior written approval of S&P Capital IQ.
Glossary
Glossary
S&P STARS - Since January 1, 1987, S&P Capital IQ Equity Research has ranked a universe of U.S. common stocks, ADRs (American Depositary Receipts), and ADSs (American
Depositary Shares) based on a given equity’s potential for future performance. Similarly, S&P Capital IQ Equity Research has used STARS® methodology to rank Asian and
European equities since June 30, 2002. Under proprietary STARS (STock Appreciation Ranking System), S&P equity analysts rank equities according to their individual forecast
of an equity’s future total return potential versus the expected total return of a relevant benchmark (e.g., a regional index (S&P Asia 50 Index, S&P Europe 350® Index or S&P
500® Index)), based on a 12-month time horizon. STARS was designed to meet the needs of investors looking to put their investment decisions in perspective. Data used to
assist in determining the STARS ranking may be the result of the analyst’s own models as well as internal proprietary models resulting from dynamic data inputs.
S&P Quality Rankings (also known as S&P Earnings & Dividend Rankings)- Growth and stability of earnings and dividends are deemed key elements in establishing S&P’s
earnings and dividend rankings for common stocks, which are designed to capsulize the nature of this record in a single symbol. It should be noted, however, that the process
also takes into consideration certain adjustments and modifications deemed desirable in establishing such rankings. The final score for each stock is measured against a
scoring matrix determined by analysis of the scores of a large and representative sample of stocks. The range of scores in the array of this sample has been aligned with the
following ladder of rankings:
A+ Highest B- Lower
A High C Lowest
A- Above Average D In Reorganization
B+ Average NR Not Ranked
B Below Average
S&P Issuer Credit Rating - A Standard & Poor’s Issuer Credit Rating is a current opinion of an obligor’s overall financial capacity (its creditworthiness) to pay its financial
obligations. This opinion focuses on the obligor’s capacity and willingness to meet its financial commitments as they come due. It does not apply to any specific financial
obligation, as it does not take into account the nature of and provisions of the obligation, its standing in bankruptcy or liquidation, statutory preferences, or the legality and
enforceability of the obligation. In addition, it does not take into account the creditworthiness of the guarantors, insurers, or other forms of credit enhancement on the obligation.
S&P Capital IQ EPS Estimates – S&P Capital IQ earnings per share (EPS) estimates reflect analyst projections of future EPS from continuing operations, and generally exclude
various items that are viewed as special, non-recurring, or extraordinary. Also, S&P Capital IQ EPS estimates reflect either forecasts of S&P Capital IQ equity analysts; or, the
consensus (average) EPS estimate, which are independently compiled by Capital IQ, a data provider to S&P Capital IQ Equity Research. Among the items typically excluded
from EPS estimates are asset sale gains; impairment, restructuring or merger-related charges; legal and insurance settlements; in process research and development expenses;
gains or losses on the extinguishment of debt; the cumulative effect of accounting changes; and earnings related to operations that have been classified by the company as
discontinued. The inclusion of some items, such as stock option expense and recurring types of other charges, may vary, and depend on such factors as industry practice,
analyst judgment, and the extent to which some types of data is disclosed by companies.
S&P Core Earnings – S&P Capital IQ Core Earnings is a uniform methodology for adjusting operating earnings by focusing on a company's after-tax earnings generated from its
principal businesses. Included in the S&P Capital IQ definition are employee stock option grant expenses, pension costs, restructuring charges from ongoing operations, write-
downs of depreciable or amortizable operating assets, purchased research and development, M&A related expenses and unrealized gains/losses from hedging activities.
Excluded from the definition are pension gains, impairment of goodwill charges, gains or losses from asset sales, reversal of prior-year charges and provision from litigation or
insurance settlements.
S&P 12 Month Target Price – The S&P Capital IQ equity analyst’s projection of the market price a given security will command 12 months hence, based on a combination of
intrinsic, relative, and private market valuation metrics, including S&P Fair Value.

12.
Permission to reprint or distribute any content from this presentation requires the prior written approval of S&P Capital IQ.
Glossary continued
S&P Capital IQ Equity Research – S&P Capital IQ Equity Research U.S. includes Standard & Poor’s Investment Advisory Services LLC; Standard & Poor’s Equity Research
Services Europe includes McGraw-Hill Financial Research Europe Limited trading as Standard & Poor’s; Standard & Poor’s Equity Research Services Asia includes McGraw-Hill
Financial Singapore Pte. Limited’s offices in Singapore, Standard & Poor’s Investment Advisory Services (HK) Limited in Hong Kong, Standard & Poor’s Malaysia Sdn Bhd, and
Standard & Poor’s Information Services (Australia) Pty Ltd.
Abbreviations Used in S&P Capital IQ Equity Research Reports
CAGR- Compound Annual Growth Rate
CAPEX- Capital Expenditures
CY- Calendar Year
DCF- Discounted Cash Flow
DDM– Dividend Discount Model
EBIT- Earnings Before Interest and Taxes
EBITDA- Earnings Before Interest, Taxes, Depreciation and Amortization
EPS- Earnings Per Share
EV- Enterprise Value
FCF- Free Cash Flow
FFO- Funds From Operations
FY- Fiscal Year
P/E- Price/Earnings
P/NAV– Price to Net Asset Value
PEG Ratio- P/E-to-Growth Ratio
PV- Present Value
R&D- Research & Development
ROCE- Return on Capital Employed
ROE- Return on Equity
ROI- Return on Investment
ROIC- Return on Invested Capital
ROA- Return on Assets
SG&A- Selling, General & Administrative Expenses
SOTP- Sum-Of-The-Parts
WACC- Weighted Average Cost of Capital
Dividends on American Depository Receipts (ADRs) and American Depository Shares (ADSs) are net of taxes (paid in the country of origin).

13.
Permission to reprint or distribute any content from this presentation requires the prior written approval of S&P Capital IQ.
Required Disclosures
In contrast to the qualitative STARS recommendations covered in this report, which are determined and assigned by S&P Capital IQ equity analysts, S&P Capital IQ ranks stocks in
accordance with three other ranking methodologies: (a) S&P’s Capital IQ’s quantitative evaluations are derived from S&P Capital IQ’s proprietary Fair Value quantitative ranking model. The
Fair Value Ranking methodology is a relative ranking methodology. As a quantitative model, Fair Value relies on history and consensus estimates and does not introduce an element of
subjectivity. (b) Global Markets Intelligence uses two different quantitative methodologies to determine recommendations for the Trade Detector research report. One methodology is based
on a target price model, while the other methodology is based on four separate quantitative strategies. The STARS, quantitative evaluations and Trade Detector methodologies reflect
different criteria, assumptions and analytical methods and may have differing recommendations.
S&P Capital IQ Global STARS Distribution as of March 31, 2013
5-STARS (Strong Buy): Total return is expected to outperform the total return of a relevant benchmark, by a wide margin over the coming 12 months, with shares rising in price
on an absolute basis.
4-STARS (Buy): Total return is expected to outperform the total return of a relevant benchmark over the coming 12 months, with shares rising in price on an absolute basis.
3-STARS (Hold): Total return is expected to closely approximate the total return of a relevant benchmark over the coming 12 months, with shares generally rising in price on an
absolute basis.
2-STARS (Sell): Total return is expected to underperform the total return of a relevant benchmark over the coming 12 months, and the share price is not anticipated to show a
gain.
1-STARS (Strong Sell): Total return is expected to underperform the total return of a relevant benchmark by a wide margin over the coming 12 months, with shares falling in
price on an absolute basis.
Relevant benchmarks: In North America, the relevant benchmark is the S&P 500 Index, in Europe and in Asia, the relevant benchmarks are the S&P Europe 350 Index and the
S&P Asia 50 Index, respectively.
For All Regions:
All of the views expressed in this research report accurately reflect the research analyst's personal views regarding any and all of the subject securities or issuers. No part of
analyst compensation was, is, or will be, directly or indirectly, related to the specific recommendations or views expressed in this research report. Analysts generally update
stock reports at least four times each year.
S&P Capital IQ Global Quantitative Model Recommendations Distribution as of March 31, 2013
Ranking North America Europe Asia Global
Buy 35.0% 27.7% 38.7% 34.3%
Hold 56.0 48.6 50.3 54.2
Sell 9.0 23.7 11.0 11.5
Total 100.0% 100.0% 100.0% 100.0%
Ranking North
America
Europe Asia Global
Buy 40.0% 42.3% 50.6% 45.2%
Hold 20.0 22.5 18.7% 20.0
Sell 40.0 35.2 30.7% 34.8
Total 100.0% 100.0% 100.0% 100.0%

14.
Permission to reprint or distribute any content from this presentation requires the prior written approval of S&P Capital IQ.
Required Disclosures Continued
Trade Detector Recommendations Distribution as of March 31, 2013
The Trade Detector research report was published after March 31, 2013. Ranking distributions will be provided as of June 30, 2013.
About S&P Capital IQ’s Distributors’
S&P Capital IQ’s research reports (the “research reports”) have been prepared and issued by S&P Capital IQ and/or one of its affiliates. In the United States, research reports
are prepared by Standard & Poor’s Investment Advisory Services LLC (“SPIAS”) and issued by Standard & Poor’s Financial Services LLC (“S&P”). SPIAS is authorized and
regulated by the U.S. Securities and Exchange Commission; in the United Kingdom, research reports are issued by McGraw-Hill Financial Research Europe Limited (“MHFRE”),
which is authorized and regulated by the Financial Conduct Authority and trades as Standard & Poor’s; in Hong Kong, research reports are issued by Standard & Poor’s
Investment Advisory Services (HK) Limited, which is regulated by the Hong Kong Securities Futures Commission; in Singapore, research reports are issued by McGraw-Hill
Financial Singapore Pte. Limited (“MHFSPL”), which is regulated by the Monetary Authority of Singapore; in Malaysia, research reports are issued by Standard & Poor’s
Malaysia Sdn Bhd (“S&PM”), which is regulated by the Securities Commission of Malaysia; in Australia, research reports are issued by Standard & Poor’s Information Services
(Australia) Pty Ltd (“SPIS”), which is regulated by the Australian Securities & Investments Commission; in Japan, research reports are issued by McGraw-Hill Financial Japan
KK, which is registered by Kanto Financial Bureau; and in South Korea, research reports are issued by SPIAS, which is also registered in South Korea with the Financial
Supervisory Service (FSS) as a cross-border investment adviser.
S&P Capital IQ or an affiliate may license certain intellectual property or provide pricing or other services to, or otherwise have a financial interest in, certain issuers of
securities, including exchange-traded investments whose investment objective is to substantially replicate the returns of a proprietary index of S&P Dow Jones Indices, such as
the S&P 500. In cases where S&P Capital IQ or an affiliate is paid fees that are tied to the amount of assets that are invested in the fund or the volume of trading activity in the
fund, investment in the fund will generally result in S&P Capital IQ or an affiliate receiving compensation in addition to the subscription fees or other compensation for services
rendered by S&P Capital IQ. A reference to a particular investment or security by S&P Capital IQ and/or one of its affiliates is not a recommendation to buy, sell, or hold such
investment or security, nor is it considered to be investment advice.
Indexes are unmanaged, statistical composites and their returns do not include payment of any sales charges or fees an investor would pay to purchase the securities they
represent. Such costs would lower performance. It is not possible to invest directly in an index.
S&P Capital IQ and its affiliates provide a wide range of services to, or relating to, many organizations, including issuers of securities, investment advisers, broker-dealers,
investment banks, other financial institutions and financial intermediaries, and accordingly may receive fees or other economic benefits from those organizations, including
organizations whose securities or services they may recommend, rate, include in model portfolios, evaluate or otherwise address.
For details on the S&P Capital IQ research objectivity and conflict-of-interest policies, please visit:
http://www.standardandpoors.com/servlet/BlobServer?blobheadername3=MDT-
Type&blobcol=urldata&blobtable=MungoBlobs&blobheadervalue2=inline%3B+filename%3DFinal_Research_Objectivity_PolicyEff_12-29-2011.pdf&blobheadername2=Content-
Disposition&blobheadervalue1=application%2Fpdf&blobkey=id&blobheadername1=content-type&blobwhere=1244053026758&blobheadervalue3=UTF-8
For a list of companies mentioned in a research report with whom S&P Capital IQ and/or one of its affiliates has had business relationships within the past year, please go to:
http://www.standardandpoors.com/products-services/articles/en/us/?assetID=1245187982940

15.
Permission to reprint or distribute any content from this presentation requires the prior written approval of S&P Capital IQ.
Required Disclosures Continued
General Disclaimers
For all jurisdictions: Where S&P Capital IQ’s research reports are made available in a language other than English and in the case of inconsistencies between the English and
translated versions of a research report, the English version will control and supersede any ambiguities associated with any part or section of a research report that has been
issued in a foreign language. Neither S&P Capital IQ nor its affiliates guarantee the accuracy of the translation. Assumptions, opinions and estimates constitute our judgment as
of the date of this material and are subject to change without notice. Past performance is not necessarily indicative of future results.
S&P Capital IQ, its affiliates, and any third-party providers, as well as their directors, officers, shareholders, employees or agents (collectively, “S&P Parties”) do not guarantee
the accuracy, completeness or adequacy of this material, and S&P Parties shall have no liability for any errors, omissions, or interruptions therein, regardless of the cause, or
for the results obtained from the use of the information provided by the S&P Parties. S&P PARTIES DISCLAIM ANY AND ALL EXPRESS OR IMPLIED WARRANTIES, INCLUDING,
BUT NOT LIMITED TO, ANY WARRANTIES OF MERCHANTABILITY, SUITABILITY OR FITNESS FOR A PARTICULAR PURPOSE OR USE. In no event shall S&P Parties be liable to
any party for any direct, indirect, incidental, exemplary, compensatory, punitive, special or consequential damages, costs, expenses, legal fees, or losses (including, without
limitation, lost income or lost profits and opportunity costs) in connection with any use of the information contained in this document even if advised of the possibility of such
damages.
Ratings from Standard & Poor’s Ratings Services are statements of opinion as of the date they are expressed and not statements of fact or recommendations to purchase, hold,
or sell any securities or to make any investment decisions. Standard & Poor’s assumes no obligation to update its opinions following publication in any form or format. Standard
& Poor’s ratings should not be relied on and are not substitutes for the skill, judgment and experience of the user, its management, employees, advisors and/or clients when
making investment and other business decisions. Standard & Poor’s rating opinions do not address the suitability of any security. Standard & Poor’s does not act as a fiduciary.
While Standard & Poor’s has obtained information from sources it believes to be reliable, Standard & Poor’s does not perform an audit and undertakes no duty of due diligence
or independent verification of any information it receives.
S&P Capital IQ keeps certain activities of its business units separate from each other in order to preserve the independence and objectivity of their respective activities. As a
result, certain business units of S&P Capital IQ may have information that is not available to other S&P Capital IQ business units. S&P Capital IQ has established policies and
procedures to maintain the confidentiality of certain non-public information received in connection with each analytical process.
Standard & Poor’s Ratings Services does not contribute to or participate in the development of research reports. Standard & Poor’s may receive compensation for its ratings
and certain credit-related analyses, normally from issuers or underwriters of securities or from obligors. Standard & Poor’s reserves the right to disseminate its opinions and
analyses. Standard & Poor’s public ratings and analyses are made available on its Web sites, www.standardandpoors.com (free of charge), and www.ratingsdirect.com and
www.globalcreditportal.com (subscription), and may be distributed through other means, including via Standard & Poor’s publications and third-party redistributors. Additional
information about our ratings fees is available at www.standardandpoors.com/usratingsfees.
Research reports are not and are not intended to be investment advice and do not constitute any form of invitation or inducement by S&P Capital IQ to engage in investment
activity. This material is not intended as an offer or solicitation for the purchase or sale of any security or other financial instrument. Securities, financial instruments or
strategies mentioned herein may not be suitable for all investors and this material is not intended for any specific investor and does not take into account an investor’s
particular investment objectives, financial situations or needs. Any opinions expressed herein are given in good faith, are subject to change without notice, and are only current
as of the stated date of their issue. Prices, values, or income from any securities or investments mentioned in this report may fluctuate, and an investor may, upon selling an
investment, lose a portion of, or all of the principal amount invested. Where an investment is described as being likely to yield income, please note that the amount of income
that the investor will receive from such an investment may fluctuate. Where an investment or security is denominated in a different currency to the investor’s chosen currency,
changes in rates of exchange may have an adverse effect on the value, price or income of or from that investment to the investor. The information contained in research reports
does not constitute advice on the tax consequences of making any particular investment decision. Before acting on any recommendation in this material, you should consider
whether it is suitable for your particular circumstances and, if necessary, seek professional advice.
Additional information on a subject company may be available upon request.

16.
Permission to reprint or distribute any content from this presentation requires the prior written approval of S&P Capital IQ.
Required Disclosures Continued
Each research report is not directed to, or intended for distribution to or use by, any person or entity who is a citizen or resident of or located in any locality, state, country or
other jurisdiction where such distribution, publication, availability or use would be contrary to law or regulation or which would subject S&P Capital IQ or its affiliates to any
registration or licensing requirements in such jurisdiction.
For residents of Australia: Research reports are issued and/or distributed in Australia by SPIS. Any express or implied opinion contained in a research report is limited to
"General Advice" and based solely on consideration of the investment merits of the financial product(s) alone. The information in a research report has not been prepared for
use by retail investors and has been prepared without taking account of any particular investor's financial or investment objectives, financial situation or needs. Before acting
on any advice, any investor using the advice should consider its appropriateness having regard to their own or their clients' objectives, financial situation and needs. Investors
should obtain a Product Disclosure Statement relating to the product and consider the statement before making any decision or recommendation about whether to acquire the
product. Each opinion must be weighed solely as one factor in any investment decision made by or on behalf of any adviser and any such adviser must accordingly make their
own assessment taking into account an individual's particular circumstances. SPIS holds an Australian Financial Services License Number 258896. Please refer to the SPIS
Financial Services Guide for more information at
http://advisor.marketscope.com/static/FinancialServicesGuides.pdf
For residents of Bahrain: Research reports are not intended for distribution to investors in Bahrain.
For resident of Bermuda: The Bermuda Monetary Authority or the Registrar of Companies in Bermuda has not approved the research reports and any representation, explicit or
implicit, is prohibited.
For residents of Brazil: Research reports are distributed by S&P Capital IQ and in compliance with Instruction 483 enacted by Comissão de Valores Mobiliários (the Brazilian
Securities Commission) dated as of July 6, 2010, the analyst (where applicable) who prepares a research report or a report extract affirms: (i) that all the views expressed herein
and/or in a research report accurately reflect his or her personal views about the securities and issuers; (ii) that all recommendations issued by him or her were independently
produced, including from the opinion of the entity in which he or she is an employee and (iii) that the distributor of the research report has disclosed any circumstances that
may impact the independence of S&P Cap IQ’s research report, in accordance with section 17, II of Instruction 483. S&P Capital IQ further declares that there is no situation or
conflict of interest believed to impact the impartiality of the recommendations herein and/or made in a research report, pursuant to section 18 of Instruction 483.
For resident of British Virgin Islands: Research reports are distributed by S&P Capital IQ, and all products and services offered by S&P Capital IQ and its affiliates are provided
or performed, outside of the British Virgin Islands. The intended recipients of the research reports are (i) persons who are not members of the public for the purposes of the
Securities and Investment Business Act, 2010 (“SIBA”); (ii) persons who are professional services providers to the British Virgin Islands business companies for the purposes
of SIBA; and (iii) any other person who is given the research reports by a person licensed as an investment advisor in the British Virgin Islands. If you are in any doubt as to
whether you are the intended recipient of this document, please consult your licensed investment advisor.
For residents of Canada: Canadian investors should be aware that any specific securities discussed in a research report can only be purchased in Canada through a Canadian
registered dealer and, if such securities are not available in the secondary market, they can only be purchased by eligible private placement purchasers on a basis that is
exempt from the prospectus requirements of Canadian securities law and will be subject to resale restrictions.
For residents of Chile: S&P Capital IQ is not acting as an intermediary of securities referred to in a research report. S&P Capital IQ is not registered with, and such securities
may not be registered in the Securities Registry maintained by the Superintendencia de Valores y Seguros de Chile (Chilean Securities and Insurance Superintendence or
“SVS”) pursuant to the Chilean Securities Market Law 18,045. Accordingly, investment research presented in a research report is not intended to constitute a public or private
offer of securities in Chile within the meaning of Article 4 of the Chilean Securities Market Law 18045, as amended and restated, and supplemental rules enacted thereunder.
For residents of China: S&P Capital IQ’s Research reports are not distributed in or directed to residents in The People’s Republic of China. Neither S&P Capital IQ nor its
affiliates target investors in China.

17.
Permission to reprint or distribute any content from this presentation requires the prior written approval of S&P Capital IQ.
Required Disclosures Continued
For residents of Colombia: This information and/or information contained in research reports is not intended or should not be construed as constituting information delivery to
the Colombian Securities Market under Colombian Law.
For residents of Dubai (DIFC): The information contained in research reports distributed by S&P Capital IQ is intended for investors who are “professional clients”, as defined in
Rule 2.3.2(2) of the Conduct of Business Module (COB) of the DFSA Rulebook.
For residents of the European Union: The following individuals are members of S&P Capital IQ’s Equity Research management staff who oversee the preparation and issuance
of research reports.
Stephen Biggar (US) [email protected]
Lorraine Tan (Asia Pacific) [email protected]
Roger Hirst (Europe) [email protected]
A list of S&P Capital IQ’s equity analysts can be found at https://spcapitaliq.com/regulatory-affairs.aspx.
More information about the written criteria and methodologies for the generation of research reports and historical information for research reports for the past 12 months are
available by contacting S&P Capital IQ Client Services Department at (212) 438-4510 or via e-mail at [email protected].
For residents of Guernsey, Isle of Man and Jersey: The Research Reports provide by S&P Capital IQ serve to assist the Intermediary in determining the advice it provides to its
clients, but are not intended as advice to any of the Intermediary's clients and the intermediary, and not S&P Capital IQ, will be solely responsible for the provision of investment
advice to the client Independent investment advice should be sought by persons in their capacity as investors or potential investors and the Intermediary will be solely
responsible for complying with any applicable regulatory obligations relating to the distribution of investment research.
For residents of Hong Kong: No information in the research reports shall be treated as soliciting, offering or inducing or attempting to induce any investor to enter into an
agreement for or with a view to acquire, dispose, subscribe or underwrite any securities and shall not be construed to imply any relationship, advisory or otherwise, between
S&P and the recipient user of the research report unless expressly agreed by S&P Capital IQ. S&P Capital IQ is not acting nor should it be deemed to be acting, as a "fiduciary"
or as an "investment manager" or "investment advisor" to any recipient of this information unless expressly agreed by S&P Capital IQ.
For residents of India: You should consult your financial and legal advisers regarding the suitability of any of S&P Capital IQ’s services and products. S&P Capital IQ does not
intend to utilize the research report service to invite or carry out any business activities and no information provided while offering this service should be construed as an
invitation to do or carry out any business with S&P Capital IQ.
For residents of Indonesia: Research reports do not constitute an offering document and it should not be construed as an offer of securities in Indonesia, and any such
securities will only be offered or sold through a financial institution.
For residents of Ireland: Research reports constitute investment research under Irish Law, and investors should be aware that the reports may not have been prepared in
alignment with Markets in Financial Instruments Directive (MiFID) requirements.
For residents of Israel: Research reports are intended only for distribution to “Qualified Investors”, as defined by Israel’s Investment Advice law. All other parties who are not
Qualified Investors under Israeli law should seek additional investment advice from their financial advisers. The relevant analyst declares that the views expressed in a
particular research report faithfully reflect the analyst’s personal views regarding the securities under review and the issuer of the securities.

18.
Permission to reprint or distribute any content from this presentation requires the prior written approval of S&P Capital IQ.
Required Disclosures Continued
For residents of the United Kingdom: Research reports are only directed at and should only be relied on by investors outside of the United Kingdom or investors who are inside
the United Kingdom and who have professional experience in matters relating to investments or who are high net worth investors, as defined in Article 19(5) or Article 49(2) (a)
to (d) of the Financial Services and Markets Act 2000 (Financial Promotion) Order 2001, respectively. S&P Capital IQ’s Stock Reports are to be read in conjunction with “Your
Guide to S&P Capital IQ’s Stock Reports” which can be found at www.standardandpoors.com/stockreportguide.
For residents of Uruguay: S&P Capital IQ does not provide any warranty with respect to the contents of the research reports, but has merely conducted investment research.
Additionally, S&P Capital IQ is not a risk assessment entity registered with the Central Bank of Uruguay, and S&P’s research reports do not constitute a risk assessment.
Copyright © 2013 Standard & Poor’s Financial Services LLC. All rights reserved. STANDARD & POOR’S, S&P, S&P 500, S&P EUROPE 350 and STARS are registered trademarks
of Standard & Poor’s Financial Services LLC. S&P CAPITAL IQ is a trademark of Standard & Poor’s Financial Services LLC.

19.
Permission to reprint or distribute any content from this presentation requires the prior written approval of S&P Capital IQ.
Disclaimers and Disclosures for ETFs
Required Disclosures
To determine if a fund is an appropriate investment for you, carefully consider the fund’s investment objectives, risk factors and charges and expenses
before investing. This and other information can be found in the fund’s prospectus. Read it carefully before investing. This report is for informational
purposes only. Total return performance is historical and assumes reinvestment of all dividends and capital gain distributions. Past performance is no guarantee of
future results. Investment return and principal value will fluctuate so that, when redeemed, an investor's shares may be worth more or less than their original cost.
ETFs issue and redeem shares at net asset value (“NAV”) only in large blocks of shares called “Creation Units”, or multiples thereof. Only broker dealers and large
institutional investors with creation and redemption agreements, called Authorized Participants (“APs”) can purchase and redeem Creation Units. ETFs are subject
to risks similar to those of stocks, including those regarding short selling, margin account maintenance and loss of principal. Investors buying or selling ETF shares
on the secondary market may incur brokerage costs and other transactional fees. Shares will fluctuate in price due to daily volume changes.
ETF price fluctuations between the NAV and market price may occur.
Relevant benchmarks: In North America, the relevant benchmark is the S&P 500 Index, in Europe and in Asia, the relevant benchmarks are generally the S&P
Europe 350 Index and the S&P Asia 50 Index.
S&P ETF Ranking Methodology and Inputs
A S&P ETF overall ranking provides S&P’s quantitative and holistic assessment of the performance, risk profile and relative costs of a given ETF compared with all
ETFs in its Category with an overall S&P ETF ranking. For all ETFs, the Category is Equity. Rankings range from Overweight (highest) to
Underweight (lowest) and follow a normalized distribution curve.
To generate the ETF ranking, S&P analyzes an ETF’s holdings and characteristics across three components - Performance Analytics, Risk Considerations, and
Cost Factors. The overall S&P ETF ranking is based on a weighted average score of the three components. For equity ETFs, this analysis incorporates the
following:
Performance Analytics. The component score is a weighted average of up to three inputs – S&P STARS, S&P Fair Value and S&P Technical.
Risk Considerations. The component score is a weighted average of up to four inputs – S&P Quality Rank, S&P Risk Assessments, S&P Credit Rating and
Standard Deviation.
Cost Factors. The component score is a weighted average of up to three inputs – Gross Expense Ratio, Price-to-NAV and Bid/Ask Spread.
A S&P ETF ranking is represented as Overweight, Marketweight or Underweight, following a normalized distribution curve. For the overall S&P ETF ranking:
Overweight ranking is assigned to an ETF whose weighted average score is in approximately the top quartile of its Category based on all ETFs with an overall S&P
ETF ranking.
Marketweight ranking is assigned to an ETF whose weighted average score is in approximately the second and third quartiles of its Category based on all ETFs
with an overall S&P ETF ranking.
Underweight ranking is assigned to an ETF whose weighted average score is in approximately the bottom quartile of its Category based on all ETFs with an overall
S&P ETF ranking.
For advisor use only. Not for distribution to the public.

20.
Permission to reprint or distribute any content from this presentation requires the prior written approval of S&P Capital IQ.
Disclaimers and Disclosures For ETFs (continued)
An ETF may receive an overall S&P ETF ranking even when the ETF does not have a ranking for each of the ten input factors. The ranking for a component or
input factor is based upon all ETFs with a ranking for that component or input factor and can include ETFs without an overall S&P ETF ranking. In cases where
sufficient analytical measures are not available on holdings data, the ranking will be displayed as “NA” for Not Available.
Standard & Poor’s classifies an ETF by region (e.g., U.S. Domestic Equity or Asia Developed Markets), type or style (Growth, Value or Core), Market Capitalization
(Large-Cap, Mid-Cap or Small-Cap), and one of ten GICS sectors. For more details on ETF classification, please refer to the methodology document, Standard &
Poor’s Exchange-Traded Fund (ETF) Ranking Methodology, located at www.standardandpoors.com.
All of the views expressed in this research report accurately reflect our quantitative research models regarding any and all of the subject securities or issuers. No
part of our compensation was, is, or will be, directly or indirectly, related to the specific recommendations or views expressed in this research report.
Other Disclosures for ETF Rankings
Standard & Poor's or an affiliate may license certain intellectual property or provide pricing or other services to, or otherwise have a financial interest in, certain
issuers of securities, including exchange-traded funds whose investment objective is to substantially replicate the returns of a proprietary Standard & Poor's index,
such as the S&P500. In cases where Standard & Poor's or an affiliate is paid fees that are tied to the amount of assets that are invested in the fund or the volume
of trading activity in the fund, investment in the fund will generally result in Standard & Poor's or an affiliate earning compensation in addition to the subscription
fees or other compensation for services rendered by Standard & Poor's. A reference to a particular investment or security by Standard & Poor's and one of its
affiliates is not a recommendation to buy, sell, or hold such investment or security, nor is it considered to be investment advice.
No endorsement of any ETF included in this report should be inferred by the fact that the ETF bears the S&P mark or is based on a S&P index. S&P does not
receive fees from ETFs and/ or funds for their inclusion in this report. Standard & Poor's and its affiliates provide a wide range of services to, or relating to, many
organizations, including issuers of securities, investment advisers, broker-dealers, investment banks, other financial institutions and financial intermediaries, and
accordingly may receive fees or other economic benefits from those organizations, including organizations whose securities or services they may recommend,
rate, include in model portfolios, evaluate or otherwise address.
Standard & Poor’s Indices does not sponsor, endorse, sell, promote or manage any investment fund or other vehicle that seeks to provide an investment return
based on the returns of any S&P index. No other unit of S&P, including S&P Indices, contributed to the content of this report. S&P does not trade for its own
account.
Indexes are unmanaged, statistical composites and their returns do not include payment of any sales charges or fees an investor would pay to purchase the
securities they represent. Such costs would lower performance. It is not possible to invest directly in an index.
For advisor use only. Not for distribution to the public.

21.
Permission to reprint or distribute any content from this presentation requires the prior written approval of S&P Capital IQ.
Disclaimers and Disclosures For ETFs (continued)
Assumptions, opinions and estimates constitute our judgment as of the date of this material and are subject to change without notice. Standard & Poor’s Financial
Services LLC (“S&P”), and its affiliates, and any third-party providers, as well as their directors, officers, shareholders, employees or agents (collectively S&P
Parties) do not guarantee the accuracy, completeness, adequacy or timeliness of any information, including ratings, and are not responsible for errors and
omissions, or for the results obtained from the use of such information, and S&P Parties shall have no liability for any errors, omissions, or interruptions therein,
regardless of the cause, or for the results obtained from the use of such information. S&P PARTIES DISCLAIM ANY AND ALL EXPRESS OR IMPLIED
WARRANTIES, INCLUDING, BUT NOT LIMITED TO, ANY WARRANTIES OF MERCHANTABILITY, SUITABILITY OR FITNESS FOR A PARTICULAR
PURPOSE OR USE. In no event shall S&P Parties be liable to any party for any direct, indirect, incidental, exemplary, compensatory, punitive, special or
consequential damages, costs, expenses, legal fees, or losses (including, without limitation, lost income or lost profits and opportunity costs) in connection with
any use of the information contained in this document even if advised of the possibility of such damages.
S&P’s credit ratings are statements of opinion as of the date they are expressed and not statements of fact or recommendations to purchase, hold, or sell any
securities or to make any investment decisions. S&P credit ratings should not be relied on when making any investment or other business decision. S&P’s
opinions and analyses do not address the suitability of any security. S&P does not act as a fiduciary or an investment advisor. While S&P has obtained
information from sources they believe to be reliable, S&P does not perform an audit or undertake any duty of due diligence or independent verification of any
information it receives.
S&P keeps certain activities of its business units separate from each other in order to preserve the independence and objectivity of their respective activities. As a
result, certain business units of S&P may have information that is not available to other S&P business units. S&P has established policies and procedures to
maintain the confidentiality of certain non-public information received in connection with each analytical process.
S&P may receive compensation for its ratings and certain credit-related analyses, normally from issuers or underwriters of securities or from obligors. S&P
reserves the right to disseminate its opinions and analyses. S&P's public ratings and analyses are made available on its Web sites, www.standardandpoors.com
(free of charge), and www.ratingsdirect.com and www.globalcreditportal.com (subscription), and may be distributed through other means, including via S&P
publications and third party redistributors. Additional information about our ratings fees is available at www.standardandpoors.com/usratingsfees.
Standard & Poor’s Ratings Services did not participate in the development of this report. Credit ratings are not the sole input for determining a ranking.
Rating criteria and credit rating scales may differ among credit rating agencies. Ratings assigned by other credit rating agencies may reflect more or less
favorable opinions of creditworthiness than ratings assigned by Standard & Poor’s Ratings Services.
This material is not intended as an offer or solicitation for the purchase or sale of any security or other financial instrument. Securities, financial instruments or
strategies mentioned herein may not be suitable for all investors. Any opinions expressed herein are given in good faith, are subject to change without notice, and
are only current as of the stated date of their issue. Prices, values, or income from any securities or investments mentioned in this report may fall against the
interests of the investor and the investor may get back less than the amount invested. Where an investment is described as being likely to yield income, please
note that the amount of income that the investor will receive from such an investment may fluctuate. Where an investment or security is denominated in a
different currency to the investor's currency of reference, changes in rates of exchange may have an adverse effect on the value, price or income of or from that
investment to the investor. The information contained in this report does not constitute advice on the tax consequences of making any particular investment
decision. This material does not take into account your particular investment objectives, financial situations or needs and is not intended as a recommendation of
particular securities, financial instruments or strategies to you nor is it considered to be investment advice. Before acting on any recommendation in this material,
you should consider whether it is suitable for your particular circumstances and, if necessary, seek professional advice.
This investment analysis was prepared from the following sources: S&P MarketScope, S&P Industry Reports; Standard & Poor's, 55 Water St., New York, NY
10041. ETF Reference data provided by Lipper.
STANDARD & POOR’S, S&P, S&P 500, GICS, STARS, S&P MIDCAP 400, and S&P SMALLCAP 600 are registered trademarks of Standard & Poor’s Financial
Services LLC.
For advisor use only. Not for distribution to the public.

22.
Permission to reprint or distribute any content from this presentation requires the prior written approval of S&P Capital IQ.
Copyright © 2013 by Standard & Poor’s Financial Services LLC (S&P), a subsidiary of The McGraw-Hill Companies, Inc. All rights reserved. No content (including ratings, credit-related analyses and data, model,
software or other application or output therefrom) or any part thereof (Content) may be modified, reverse engineered, reproduced or distributed in any form by any means, or stored in a database or retrieval
system, without the prior written permission of S&P. The Content shall not be used for any unlawful or unauthorized purposes. S&P, its affiliates, and any third-party providers, as well as their directors, officers,
shareholders, employees or agents (collectively S&P Parties) do not guarantee the accuracy, completeness, timeliness or availability of the Content. S&P Parties are not responsible for any errors or omissions,
regardless of the cause, for the results obtained from the use of the Content, or for the security or maintenance of any data input by the user. The Content is provided on an “as is” basis. S&P PARTIES DISCLAIM
ANY AND ALL EXPRESS OR IMPLIED WARRANTIES, INCLUDING, BUT NOT LIMITED TO, ANY WARRANTIES OF MERCHANTABILITY OR FITNESS FOR A PARTICULAR PURPOSE OR USE, FREEDOM
FROM BUGS, SOFTWARE ERRORS OR DEFECTS, THAT THE CONTENT’S FUNCTIONING WILL BE UNINTERRUPTED OR THAT THE CONTENT WILL OPERATE WITH ANY SOFTWARE OR HARDWARE
CONFIGURATION. In no event shall S&P Parties be liable to any party for any direct, indirect, incidental, exemplary, compensatory, punitive, special or consequential damages, costs, expenses, legal fees, or
losses (including, without limitation, lost income or lost profits and opportunity costs) in connection with any use of the Content even if advised of the possibility of such damages.
Credit-related analyses, including ratings, and statements in the Content are statements of opinion as of the date they are expressed and not statements of fact or recommendations to purchase, hold, or sell any
securities or to make any investment decisions. S&P assumes no obligation to update the Content following publication in any form or format. The Content should not be relied on and is not a substitute for the skill,
judgment and experience of the user, its management, employees, advisors and/or clients when making investment and other business decisions. S&P’s opinions and analyses do not address the suitability of any
security. S&P does not act as a fiduciary or an investment advisor. While S&P has obtained information from sources it believes to be reliable, S&P does not perform an audit and undertakes no duty of due
diligence or independent verification of any information it receives.
S&P keeps certain activities of its business units separate from each other in order to preserve the independence and objectivity of their respective activities. As a result, certain business units of S&P may have
information that is not available to other S&P business units. S&P has established policies and procedures to maintain the confidentiality of certain non–public information received in connection with each analytical
process.
S&P may receive compensation for its ratings and certain credit-related analyses, normally from issuers or underwriters of securities or from obligors. S&P reserves the right to disseminate its opinions and
analyses. S&P's public ratings and analyses are made available on its Web sites, www.standardandpoors.com (free of charge), and www.ratingsdirect.com and www.globalcreditportal.com (subscription), and may
be distributed through other means, including via S&P publications and third-party redistributors. Additional information about our ratings fees is available at www.standardandpoors.com/usratingsfees.
STANDARD & POOR’S and S&P are registered trademarks of Standard & Poor’s Financial Services LLC.
www.spcapitaliq.com