Embed Size (px)
Citation preview

Copyright (C) 2001 Bruker BioSpin GmbHAll rights reserved. No part of this publication may be reproduced, stored in a retrieval
system, or transmitted in any form or by any means without the prior consent of the publisher. Printed: 12.2001. Part number: H9168-3/1.
Product names used are trademarks or registered trademarks of their respective holders.

DONE
INDEX
INDEX

I
Contents
Chapter 1 Introduction 71.1 What is XWIN-PLOT? 7
1.2 AUTOPLOT 8
1.3 The Bruker ftp server 8
1.4 The Bruker WWW server 8
1.5 Notation 9
1.6 Bug reports 9
Chapter 2 Starting XWIN-PLOT 112.1 The XWIN-NMR module versions of XWIN-PLOT and AUTOPLOT 11
2.1.1 The command xwinplot 12
2.1.2 Using XWIN-NMR plot limits with the xwp command 12
2.1.3 Starting XWIN-PLOT with automatically calculated plot limits 13
2.2 The stand-alone versions of XWIN-PLOT and AUTOPLOT 132.2.1 Options for the stand-alone version of XWIN-PLOT 13
2.2.2 Options for the stand-alone version of AUTOPLOT 142.2.3 Portfolio related option 142.2.4 Other options 14
2.2.5 Layout file name syntax 15
2.2.6 Dataset-related file name syntax 16
Chapter 3 XWIN-PLOT and XWIN-NMR 173.1 Creating a title 17
3.2 Creating a parameter listing 18
3.3 Creating a peak list 18
3.4 Creating an integral range file 18
3.5 Creating a region file 19
3.6 Creating a levels file 19

II
DONE
INDEX
INDEX
3.7 Creating projections 19
3.8 Creating T1/T2 curve data 19
3.9 The XWIN-NMR Interface 20
Chapter 4 Quickstart guide 234.1 Starting XWIN-PLOT from XWIN-NMR 23
4.2 Setting up the printer under Unix 23
4.3 Setting up the printer under Windows 25
4.4 Creating a layout 25
4.5 Printing the layout 33
4.6 Saving the layout 33
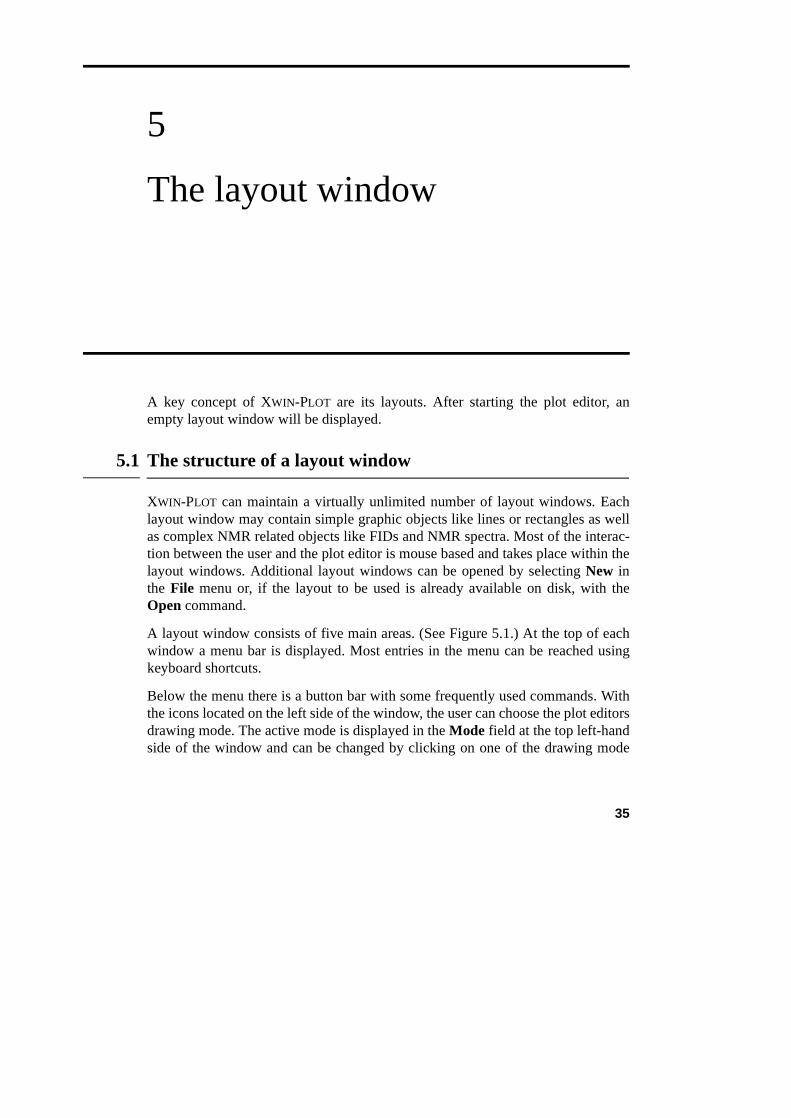
Chapter 5 The layout window 355.1 The structure of a layout window 35
5.2 Input Modes 375.2.1 Creation modes 37
5.2.2 Basic objects 375.2.3 NMR objects 38
5.2.4 Expand and zoom mode 39
5.3 Working with objects 405.3.1 Moving objects 40
5.3.2 Marking objects 40
5.3.3 Using a spectrum or FID as a clipping window 42
5.3.4 Deleting marked objects 42
5.3.5 Copying marked objects 43
5.3.6 Rotating marked objects 43
5.3.7 Creating object groups 43
5.3.8 The stacking order 43
5.4 The Popup Menu 43
5.5 Attributes 44
5.6 Data set handling 465.6.1 The Data Set Selector 46
5.6.2 The Portfolio Editor 47
5.7 File handling 495.7.1 Archive functionality 50

III
DONE
INDEX
INDEX
5.8 Printing a layout 50
5.9 Undo 51
5.10 The XWIN-PLOT clipboard 51
5.11 Setting up XWIN-PLOT 525.11.1 The Global Setup 52
5.11.2 The Layout Setup 53
5.11.3 The Printer Setup 54
5.12 On-line help 58
Chapter 6 Object editors 596.1 Standard object editors 59
6.1.1 The basic object editor 60
6.1.2 The arrow object editor 60
6.1.3 The EPSI object editor 60
6.1.4 The text object editor 62
6.1.5 The resizable text object editor 63
6.1.6 The graph object editor 65
6.1.7 The 1D spectrum object editor 66
6.1.8 The 1D stacked spectrum object editor 67
6.1.9 The 2D spectrum object editor 68
6.1.10 The 2D projection object editor 69
6.1.11 The T1/T2 object editor 70
6.1.12 The NMR object editor 71
6.2 The 1D/2D object editor 726.2.1 Additional functions for 1D spectrum objects 74
6.2.2 Additional functions for 2D spectrum objects 75
6.3 The NMR text object editor 78
Chapter 7 Automation editors 817.1 Reset actions 81
7.1.1 General reset actions 81
7.1.2 The FID automation editor 82
7.1.3 The 1D automation editor 83
7.1.4 The 2D automation editor 84
Chapter 8 Reusing layouts 878.1 Layouts and data sets 87

IV
DONE
INDEX
INDEX
8.1.1 Loading layouts 87
8.1.2 Loading data sets 88
8.1.3 Reset 89
8.1.4 Print 89
8.2 Printing a series of spectra 89
Chapter 9 Autoplot AU Macro Reference 919.1 Plotting the current data set 91
9.2 Plotting arbitrary data sets 92
Chapter 10 Tips and tricks 9510.1 A shadow around a spectrum 95
10.2 Import and export of graphics 9610.2.1 EPSI support (Unix) 97
10.2.2 EPSI import to FrameMaker 9810.2.3 EPSI import to CorelDraw 98
10.2.4 Windows Metafile Support (Windows) 98
10.3 Shortcuts 99
Chapter 11 Notes for Windows Users 10111.1 Printing and the Printer Setup 101
11.2 Support for WMF/EMF graphics 102
11.3 Clipboard 102
11.4 Support for Email Clients 102
11.5 Toolbar 103
Chapter 12 Appendix 10512.1 Errors and warnings 105
12.1.1 Messages in the terminal window 105
12.1.2 Messages in dialog windows 105
12.2 What‘s new? 10312.2.1 Changes since XWIN-PLOT 3.0 103
12.2.2 Changes since XWIN-PLOT 2.6.0 104
12.2.3 Changes since XWIN-PLOT 2.5.1 104
12.2.4 Changes since XWIN-PLOT 2.0.1 104
12.2.5 Changes since XWIN-PLOT 2.0.0 10512.2.6 Bug fixes 105

V
DONE
INDEX
INDEX
12.2.7 Changes since XWIN-PLOT 1.4.4 10512.2.8 General remarks 10512.2.9 New features 105
12.2.10 Changes since XWIN-PLOT 1.4.0 105
12.2.11 Changes since XWIN-PLOT 1.3.0 10612.2.12 New features 10612.2.13 Bug fixes 106
12.2.14 Changes since XWIN-PLOT 1.2.0 10612.2.15 New features 10612.2.16 Bug fixes 107
12.2.17 Changes since XWIN-PLOT 1.04 10712.2.18 New features 10712.2.19 Bug fixes 108
12.3 Known bugs 108
Chapter 13 . . . . . . . . . . . . . . . . . . . . . . . . . . . . . . . . . . . . . . . . . . . . INDEX 109


7
1
Introduction
1.1 What is XWIN-PLOT?
XWIN-PLOT is a fully object-oriented, interactive and easy to use WYSIWYG1)
plot editor for creating high quality printouts of NMR data obtained with theBruker XWIN-NMR software package.
You will find a lot of parallels between the plot editor and other well-known draw-ing programs and because of this it will be very easy for you to work with XWIN-PLOT.
XWIN-PLOT is built on two basic concepts: Layouts and data set portfolios. A lay-out describes all the attributes of graphic objects, e. g. position, size and color, butdoes not contain any NMR related data. To get a relationship between such graphi-cal objects and NMR data, a layout must be combined with a data set portfolio. Alayout, once created, can easily be reused by combining it with different portfolios.You also may use one portfolio for several layouts to get different views of thesame data sets.
If you are still reading at this point, fine. The main problem with most softwareproducts is that their manuals are never read. To be honest, we have to admit that
1) „What You See Is What You Get“
8 1.2 AUTOPLOT
DONE
INDEX
INDEX
we do not like spending too much time leafing through books either. On the otherhand, manuals are important because they provide a vital source of information.Most problems that arise when using a software product can be solved by carefullystudying the software documentation.
In order to ensure that you can start using XWIN-PLOT as soon as possible, a spe-cial Quickstart chapter has been added to this manual. So if you do not want towait any longer to get your first results, please take a look at that chapter.
1.2 AUTOPLOT
XWIN-PLOT provides a convenient means to create graphics interactively. Never-theless there are situations which require layouts to be used without any user inter-action. In these cases AUTOPLOT can control the printing. With AUTOPLOT you canprint several data sets with only one command line.
1.3 The Bruker ftp server
A convenient way for obtaining add-ons or updates to the Bruker software pack-ages is the Bruker ftp server, ftp.bruker.de. You can connect to this server fromyour local workstation or PC by issuing the following command:
ftp ftp.bruker.de
When the connection is established, you will be prompted for your login name andyour password. Use the keyword anonymous as login name and your emailaddress as a password. For further information about the ftp program consultyour ftp manual.
1.4 The Bruker WWW server
Bruker also maintains a WWW server which can be reached via http://www.bruker.de using one of the several WWW clients that are available forvarious computer platforms, e. g. Netscape . On this server you can find infor-mation about the hardware and software products maintained by Bruker. You canalso download files offered by the Bruker ftp server.

1.5 Notation 9
DONE
INDEX
INDEX
1.5 Notation
In this manual different font styles are used to represent various types of informa-tion:
Italics are used for:
• New terms when they are defined.
Typewriter font is used for:
• Pathnames, filenames and program names.
• Text on the screen.
Boldface is used for:
• Names of buttons, menus and menu options.
1.6 Bug reports
Did you ever find a software package that fulfilled your needs in every respect andwhich also did not have any bugs? Surely not. Nevertheless experience shows thatmost of the problems a user is confronted with can easily be solved by taking alook at the manual. So please make sure that you carefully read the manual pas-sages referring to your particular problem. If any difficulties remain, try to formu-late the problem into a formal, detailed description before contacting us.
We really appreciate constructive criticism, so if you think you have some usefulcomments concerning XWIN-PLOT, feel free to get in touch with us. If possible,please use this email address:
And now we wish you success and enjoyment using Bruker‘s XWIN-PLOT plot edi-tor.


11
2
Starting XWIN-PLOT
Both XWIN-PLOT and AUTOPLOT are available as a stand-alone programs and asmodules which can be started from XWIN-NMR.
2.1 The XWIN-NMR module versions of XWIN-PLOT and AUTOPLOT
If started from within XWIN-NMR, XWIN-PLOT and AUTOPLOT automatically loadthe current data set and a layout that is specified by setting the XWIN-NMR LAY-OUT parameter. To set this layout parameter, you can use the XWIN-NMR commandedo . Click on the LAYOUT entry in the Output device parameters dialog windowand enter the layout filename for the current data set (Figure 2.1). If no layout isspecified (i.e. LAYOUT contains an empty string), XWIN-PLOT starts with a newempty layout. AUTOPLOT cannot be started without a layout specification.
If XWIN-PLOT is started from XWIN-NMR and a layout is saved using Save As inthe File menu, the specified file name will automatically be transferred to theLAYOUT parameter. (See chapter 5.7 on page 49.)
During start-up XWIN-PLOT first loads the default portfolio of the current user. Ifthere is a file portfolio.por found in the current dataset that is loaded instead.Finally, the content of the portfolio is transferred to the dataset list and the first

12 2.1 The XWIN-NMR module versions of XWIN-PLOT and AUTOPLOT
DONE
INDEX
INDEX
entry is replaced with the current dataset to ensure the user initially works on thesame dataset as seen in XWIN-NMR before.
XWIN-NMR provides a familiy of three commands that can be used to start XWIN-PLOT:
2.1.1 The command xwinplot
Whenever you type xwinplot command within XWIN-NMR XWIN-PLOT willsimply open the selected layout and display it exactly like you have saved it duringyour last session. No automatic changes are applied. Especially the axis limits willbe those saved in the layout.
2.1.2 Using XWIN-NMR plot limits with the xwp command
The XWIN-NMR command xwp will start XWIN-PLOT with the current layout andset the plot limits of all data objects to those limits stored in the parameters F1P/F2P (for 1D objects), or F1PLO/F1PHI/F2PLO/F2PHI (for 2D objects),respectively. If you already adapted the display in XWIN-NMR to show the region ofyour interest you can simply press the defplot button to store them in the plotparameters and type xwp to have the same region displayed in XWIN-PLOT.
The autoplot button in Xwin-nmr will create the same plot but send it directly tothe printer without any user interaction.
Figure 2.1 Choosing an XWIN-PLOT layout in XWIN-NMR

2.2 The stand-alone versions of XWIN-PLOT and AUTOPLOT 13
DONE
INDEX
INDEX
2.1.3 Starting XWIN-PLOT with automatically calculated plot limits
When started by the XWIN-NMR command xwpr , XWIN-PLOT will apply resetactions on all objects after loading the layout. This is similar to choosing Reset allobjects from the menu Edit. The plot limits then will be recalculated based on therules that are defined in the Automation dialog for each NMR object. See Chapter7.1 on page 81 for further information about those reset actions.
This may be useful if you want to check your selected reset actions, or make use ofmore complex layouts (like e.g. the 1D_H+zoom.xwp layout).
To create this plot and send it to the printer without further interaction you can typeautoplot in XWIN-NMR.
2.2 The stand-alone versions of XWIN-PLOT and AUTOPLOT
The stand-alone versions of XWIN-PLOT and AUTOPLOT can be started by execut-ing the command
xwinplot [options] layout1.xwp layout2.xwp ...
or
autoplot [options] layout1.xwp layout2.xwp ...
respectively.
2.2.1 Options for the stand-alone version of XWIN-PLOT
XWIN-PLOT can be started with the following options:
-p portfolio.por Loads the portfolio file portfolio.por
-r resets all objects after start-up
If no portfolio file is specified, XWIN-PLOT will automatically load the portfoliothat was saved with Save As Default in the File menu of the Portfolio Editor dia-log. (See chapter 5.6.2 on page 47.)

14 2.2 The stand-alone versions of XWIN-PLOT and AUTOPLOT
DONE
INDEX
INDEX
2.2.2 Options for the stand-alone version of AUTOPLOT
2.2.2.1 Portfolio related option
If you use these options on the command line, their order is important. AUTOPLOT
evaluates all of its options from left to right.
-p portfolio.por Loads the portfolio file portfolio.por
-a portfolio.por Like -p, but appends to the portfolio instead of overwrit-ing its contents
-d /u/data/... Adds data set /u/data/... to the portfolio
-r /u/data/... Removes data set /u/data/... from the portfolio
-sa Sorts portfolio inascending order
-sd Sorts portfolio in descending order
You can combine these options in any way you like. For example you can load aportfolio with the -l option, then you can sort it and afterwards you can appendadditional data sets to it with the -d option.
The -d and -r options expect a full data set path name, e. g.
-d /u/data/guest/nmr/demospect/1/pdata/1
2.2.2.2 Other options
-s setup.prt Use printer setup file setup.prt instead of the printersetup that was saved with the layout (not available forWindows NT/2000 version)
-l N Remove N data sets from the portfolio and print again
-n Don‘t reset before printing
-f Force all 1D and/or 2D objects in the layout to use axislimits as used in XWIN-NMR (uses the F1P/F2P parame-ter, or F1PLO/F1PHI/F2PLO/F2PHI parameter,respectively)

2.2 The stand-alone versions of XWIN-PLOT and AUTOPLOT 15
DONE
INDEX
INDEX
-o Preview instead of printing
-e output.ps Create Postscript file instead of printer output(Windows NT/2000: PostScript (.ps) or Metafile (.emf)format)
-v Show AUTOPLOT version number
-h Show help text
-? Same as -h
-- Explicit end of options. Use this option before specifyinga layout file that has a - as its first letter.
2.2.3 Layout file name syntax
To simplify the file name specification for layouts, it is possible to use the follow-ing abbreviations in layout filename paths:
• ~/ can be used as an abbreviation for the home directory. If, for example, theuser guest has the home directory /usr/people/guest , the specification
~/my_layouts/layout1.xwp
is expanded to
/usr/people/guest/my_layouts/layout1.xwp
• +/ is an abbreviation for the directory $XWINNMRHOME/plot/layouts. Forexample
+/layout1.xwp
could be expanded to
/u/plot/layouts/layout1.xwp

2.2.4 Dataset-related file name syntax
For objects that reference external files (NMR text objects, and the objects forimported graphics EPSI and Meta) there also exist similar file name abbreviations:
• ~/ can be used as an abbreviation for the home directory. If, for example, theuser guest has the home directory /usr/people/guest , the specification
~/my_nmr_texts/nmrtext.txt
is expanded to
/usr/people/guest/my_nmr_texts/nmrtxt.txt
• +/ means that the referenced file is located in a dataset directory. For example
+/nmr-text.txt
is expanded to
/<DU>/data/<USER>/nmr/<EXPNO>/pdata/<PROCNO>/nmr-text.txt
• $XWINNMRHOME is expanded to the installation path of the current XWIN-NMR
installation (e.g. /u for SGI/Linux, or C:\Bruker\XWIN-NMR for WindowsNT/2000 versions)

17
3
XWIN-PLOT and XWIN-NMR
When working with XWIN-PLOT and XWIN-NMR always keep in mind that XWIN-PLOT is a software package for displaying existing data. These data must havebeen acquired or created with XWIN-NMR before it can be referred to in XWIN-PLOT. If data is missing, the plot editor will display a warning message.
To create missing data, you can either enter the commands described belowdirectly in XWIN-NMR, or you can use the XWIN-NMR Interface dialog in XWIN-PLOT. (See chapter 3.9 on page 20.) If you have entered the commands manuallyin XWIN-NMR, you must use Update Data from XWIN-NMR in the XWIN-NMR menu to transfer the changes to XWIN-PLOT.
Some data can be generated without overwriting sensible parts of the dataset (peaklists and parameter lists). XWIN-PLOT and AUTOPLOT try to generate these filesautomatically when started from within XWIN-NMR to avoid unnecessary errormessages.
3.1 Creating a title
In XWIN-NMR the plot title can be set by the command setti . With this commandyou can edit the contents of the file /<DU>/data/<USER>/nmr/<NAME>/<EXPNO>/pdata/<PROCNO>/title 2).

18 3.2 Creating a parameter listing
DONE
INDEX
INDEX
3.2 Creating a parameter listing
To create a parameter list, use the XWIN-NMR command xwp_lp . This commandwill store the parameter list in /<DU>/data/<USER>/nmr/<NAME>/<EXPNO>/pdata/<PROCNO>/parm.txt .
XWIN-PLOT and AUTOPLOT will automatically execute this command as necessarywhen started from within XWIN-NMR.
3.3 Creating a peak list
Use the XWIN-NMR xwp_pp command to create peak label information. Thiscommand will store the peak list in the file /<DU>/data/<USER>/nmr/<NAME>/<EXPNO>/pdata/<PROCNO>/peak.txt .
XWIN-PLOT and AUTOPLOT will automatically execute this command as necessarywhen started from within XWIN-NMR.
3.4 Creating an integral range file
Integral ranges in XWIN-NMR can be determined in two ways. The command absstarts an automatic baseline correction of the NMR spectrum and additionallydetermines the regions containing spectral information. These regions are stored inthe file /<DU>/data/<USER>/nmr/<NAME>/<EXPNO>/pdata/<PROCNO>/intrng and can be used to calculate the integrals. The integralranges can also be determined manually. Click on the button integrate to switch tothe integral menu. Place the mouse inside the spectrum with the left mouse buttonand select integral regions by clicking the middle mouse button. Open the Filemenu and click on Save as intrng in order to store the integral ranges.
2) <DU> stands for the disk unit (e.g. u), <USER> for the user id, <NAME> for the name of the data set, <EXPNO> for the experiment number and <PROCNO> for the processing number.

3.5 Creating a region file 19
DONE
INDEX
INDEX
3.5 Creating a region file
It is possible to save the integral ranges in a special region file. This region file canbe used to determine the reset behavior of spectra (See chapter 6.1.7 on page 66.).Simply use Save as reg instead of Save as intrng to create the region file /<DU>/data/<USER>/nmr/<NAME>/<EXPNO>/pdata/<PROCNO>/reg .
3.6 Creating a levels file
The number of contour levels used for the display of 2D data in XWIN-NMR can beset with the command defplot . To specify the value of each level, the commandedlev can be used. The levels are stored in the file /<DU>/data/<USER>/nmr/<NAME>/<EXPNO>/pdata/<PROCNO>/level . If you select a 2D dataset in XWIN-NMR and a level file does not already exist, XWIN-NMR uses thedefault levels.
3.7 Creating projections
In case positive or negative projections were defined by the XWIN-NMR commandsrhpp , rhnp , rvpp or rvnp , XWIN-PLOT will automatically add the correspond-ing data to the Data Set Selector when started from within XWIN-NMR. Note thatXWIN-PLOT will not accept a projection that is based on a data set file that is olderthan the 2D data set file.
3.8 Creating T1/T2 curve data
XWIN-PLOT can plot T1/T2 and all other relaxation type curves generated byXWIN-NMR. The point picking for these curves and the curve calculation are donein the T1/T2 Relaxation submenu of XWIN-NMR.
All XWIN-NMR commands which create or update the points shown on the XWIN-NMR display3) create a file /<DU>/data/<USER>/nmr/<NAME>/<EXPNO>/pdata/<PROCNO>/t1t2.jdx containing these points. Only the points of onepeak are written to the t1t2.jdx file at this time.
3) pd, pd0, pft2, prxy, lstp, nxtp, elim, rstp

20 3.9 The XWIN-NMR Interface
DONE
INDEX
INDEX
All fitting commands write out the list of fitted points, the function used for the fitand the resulting fit parameters.
If a command which only fits the currently displayed points is used4), only thesepoints and the fitting results are written to the t1t2.jdx file.
If a command which fits all points of all picked peaks is used5), all points with allfitting results will be written to the t1t2.jdx file.
3.9 The XWIN-NMR Interface
If XWIN-PLOT was started from XWIN-NMR, you may additionally make use of theXWIN-NMR Interface dialog (see Figure 3.1).
With the help of this dialog, you can easily run XWIN-NMR commands on severaldata sets. First select the data sets which you wish to work on. You now have thechoice of either running arbitrary commands on these data sets by entering thecommands into the text field, or of running predefined commands by using thecommand buttons. These buttons include commands to edit the title, create aparameter list, create a peak list, create integrals and to change levels.
4) ct1, ct2, simfit, simfit asc5) dat1, dat2, simfit all, simfit asc all

3.9 The XWIN-NMR Interface 21
DONE
INDEX
INDEX
Figure 3.1 The XWIN-NMR Interface


23
4
Quickstart guide
To get your first printouts with the XWIN-PLOT plot editor as quickly as possible,this guide presents an example of how to create a simple layout.
4.1 Starting XWIN-PLOT from XWIN-NMR
Since the sample layout described in this quickstart guide contains a title andparameter list, you have to use the commands setti (to edit the title) andxwp_pp (to create a parameter list) in XWIN-NMR on the current data set beforestarting XWIN-PLOT. (See Chapter 3.) As an alternative you can request this datawith the plot editor‘s XWIN-NMR interface after starting XWIN-PLOT.
After processing your NMR data with XWIN-NMR, you can start XWIN-PLOT bytyping xwinplot on the XWIN-NMR command line or by clicking on the Plot-editor menu entry in the Windows menu. When started this way, XWIN-PLOT
automatically loads the current data set. (See Chapter 5.6 for more informationabout which datasets are loaded at start-up).
4.2 Setting up the printer under Unix
Before you can create your first layouts with XWIN-PLOT, you have to set up yourprinter configuration. After selecting the Printer Setup entry in the Options menu,

24 4.2 Setting up the printer under Unix
DONE
INDEX
INDEX
the dialog window shown in Figure 4.2 will be displayed. Don‘t be confused by
the variety of options available. Most of them are not important for this example.Simply choose your printer from the Printer Type list and select the paper formatfrom the Paper Size list.
Figure 4.1 The Printer Setup

4.3 Setting up the printer under Windows 25
DONE
INDEX
INDEX
The Print Command text field defines the command that will be used by XWIN-PLOT when sending data to the printer. Your print command should look like this:
lp -c -s -oraw -n1 %s
lp is the standard Unix print command for a System V Unix environment. Theoptions -c and -oraw as well as the %s are required. XWIN-PLOT will not printwithout these options. See Chapter 5.11.3 on page 54 for more information aboutthe printing options.
For Linux system you should use the command
lpr %s
to use the standard Linux print system.
You can save the current settings as the default configuration with Save AsDefault in the File menu. You must exit the Printer Setup dialog window with theOK button in order for your changes to be accepted.
4.3 Setting up the printer under Windows
For your first layout you do not need to change the printer setup. XWIN-PLOT auto-matically chooses your default printer and the paper size is set to the default formatthat is selected for that printer in your system (which will be typically Letter orA4).
It is absolutely necessary to have at least one printer driver installed on your Win-dows NT/2000 system to give XWIN-PLOT a chance to calculate correct page sizes.
4.4 Creating a layout
Now you are ready to draw a simple layout containing a one dimensional NMRspectrum with an expanded region, the spectrum parameters and a title.
The first object in the layout will be the spectrum parameters. You enter the param-eter mode by clicking on the corresponding icon (Figure 4.2). Now you can placethe rectangular area containing the parameters inside the layout window. Your lay-out should look similar to the one in Figure 4.3 now. In case you make a mistake

26 4.4 Creating a layout
DONE
INDEX
INDEX
when creating or changing an object, simply click on the Undo button to reversean operation.
In the next step you are going to add the NMR spectrum object. Switch to the spec-trum creation mode by clicking on the 1D spectrum icon (Figure 4.4).
Figure 4.2 The parameter mode icon
Figure 4.3 A layout containing a parameter list
Figure 4.4 The 1D spectrum mode icon

4.4 Creating a layout 27
DONE
INDEX
INDEX
Now you can create an object containing the one dimensional spectrum of the cur-rent XWIN-NMR data set. Place the mouse cursor at the upper left edge of the layoutwindow and press the left mouse button to place the spectrum object on the draw-ing area. As long as you keep the mouse button pressed, you can change theobjects dimensions by moving the mouse. XWIN-PLOT displays the part of thespectrum that is visible in the XWIN-NMR processing window (See Figure 4.5).
When you are satisfied with the spectrum‘s position and size, release the mousebutton.
The next object in this example is an expanded view of a particular spectral regionwhich is to be added above the spectrum. Create an additional, smaller spectrumobject as already described and place it above the first. Enter the Expand mode byclicking on the corresponding icon (Figure 4.6). Now you can define a rectangularregion inside the spectrum with the mouse. Press the left mouse button when youare on the spectrum object and mark the region to be expanded. After releasing themouse button XWIN-PLOT will expand this region. This will result in a layout sim-ilar to Figure 4.7.
Figure 4.5 Adding a spectrum to the layout

28 4.4 Creating a layout
DONE
INDEX
INDEX
Now it‘s time to create a title for the spectrum. To select the font type and size forthe title object, click on the Attributes button. While in the Attributes editor (Fig-ure 5.12), you will not only be able to change the font settings, but other attributesas well. The settings chosen in this dialog window will be valid for all the objectscreated after selecting Apply or after leaving the window with OK.
Activate the title mode by clicking on the icon shown in Figure 4.8. The title objectcan be placed inside the drawing area as already described for the other objects.Figure 4.9 shows the drawing area after this operation.
Figure 4.6 The expand mode icon
Figure 4.7 The sample spectrum with an expanded region above

4.4 Creating a layout 29
DONE
INDEX
INDEX
In the last step you will add an annotation to the spectrum. If you want to changethe annotations font you can do this as described above in the Attributes dialogwindow. Once you have adjusted the font, enter the text mode by activating thetext mode icon, visible in the Basic major editing mode (Figure 4.10). After click-
Figure 4.8 The title mode icon
Figure 4.9 A layout with spectrum, parameters and title
Figure 4.10 The text mode icon

30 4.4 Creating a layout
DONE
INDEX
INDEX
ing at the desired location on the layout window, you can enter a text, such like„Annotation“ in this example. The final text position can be set by pressing the leftmouse button. For our example we will place the text near one of the prominentpeaks in the lower spectrum. This will result in a layout similar to the one shown inFigure 4.11.
The annotation may be a reference to one of the spectrum‘s peaks. You can empha-size fact by drawing an arrow from the annotation to the peak on the left. Beforeyou draw an arrow, go to the Layout Setup (Figure 4.12) and select the „Snap-In“mode None, which allows objects to be positioned at arbitrary points. To create anarrow object, you go into the Basic editing mode and to enter the line mode byselecting the corresponding icon (Figure 4.13). Now draw a line with the mouse,starting near the annotation and ending near the peak. The line‘s starting point isset by pressing the left mouse button. Releasing the mouse button marks the end ofthe line.
Finally, add an arrow tip to the end of the line. After entering one of the markingmodes (Figure 4.14) you can mark the line object by clicking on it with the leftmouse button. To edit the object select the Edit command button. The line objects
Figure 4.11 Placing an annotation above the spectrum

4.4 Creating a layout 31
DONE
INDEX
INDEX
edit dialog window will pop up as shown in Figure 4.15. In this editor you canselect various line attributes and you can convert a line into an arrow by selectingthe corresponding buttons. The arrow tips width can be changed with a slider.
After accepting your changes with OK or Apply the sample layout is complete. Itshould look similar to the layout in Figure 4.16.
Figure 4.12 The Layout Setup
Figure 4.13 The line creation mode icon
Figure 4.14 The marking mode icons

32 4.4 Creating a layout
DONE
INDEX
INDEX
Figure 4.15 The line object editor
Figure 4.16 The final sample layout

4.5 Printing the layout 33
DONE
INDEX
INDEX
4.5 Printing the layout
To print your layout, choose the Print option in the File menu. Printing will com-mence after clicking on the Print button in the Print dialog window (Figure 4.17).
Depending on your printer it will take a while for a document to print, so bepatient. You can continue to work with XWIN-PLOT or XWIN-NMR while printing isin progress.
4.6 Saving the layout
If you want to save the layout for use with other data sets later on, choose Save Asin the File menu. A file selector will appear where you can enter the name of yourlayout6). In case XWIN-PLOT was started from within XWIN-NMR, informationabout the layouts filename will be saved in the current data set parameters.
Figure 4.17 The Print dialog window
6) By convention XWIN-PLOT layout filenames have the extension .xwp .

35
5
The layout window
A key concept of XWIN-PLOT are its layouts. After starting the plot editor, anempty layout window will be displayed.
5.1 The structure of a layout window
XWIN-PLOT can maintain a virtually unlimited number of layout windows. Eachlayout window may contain simple graphic objects like lines or rectangles as wellas complex NMR related objects like FIDs and NMR spectra. Most of the interac-tion between the user and the plot editor is mouse based and takes place within thelayout windows. Additional layout windows can be opened by selecting New inthe File menu or, if the layout to be used is already available on disk, with theOpen command.
A layout window consists of five main areas. (See Figure 5.1.) At the top of eachwindow a menu bar is displayed. Most entries in the menu can be reached usingkeyboard shortcuts.
Below the menu there is a button bar with some frequently used commands. Withthe icons located on the left side of the window, the user can choose the plot editorsdrawing mode. The active mode is displayed in the Mode field at the top left-handside of the window and can be changed by clicking on one of the drawing mode

36 5.1 The structure of a layout window
DONE
INDEX
INDEX
icons. There are two major editing modes: Basic mode for drawing simple, notNMR-related objects, and NMR mode.
The main part of the layout window consists of the layout area which represents asheet of paper including its borders. An object that is on or outside the border lineswill not be printed.7). The paper size and format can be defined in the PrinterSetup dialog. (See “Printing a layout” on page 50.) By moving the scroll areas atthe right and bottom of the graphics area the visible part of the drawing area can bemoved. Scrollbars are only present if the size of the current graphics area exceedsthe size of the visible drawing area.
Figure 5.1 An empty layout window
7) If a graphics object is placed on the border it will be clipped when it is printed.
Status line
Command buttons
Current input mode
Cursor
Major editing modes
Minor editing modes
Selection modes

5.2 Input Modes 37
DONE
INDEX
INDEX
5.2 Input Modes
5.2.1 Creation modes
The object types that can be created by XWIN-PLOT include simple objects likelines or rectangles in Basic editing mode as well as complex NMR related objectsin NMR editing mode, e. g. FIDs or spectra. An object is drawn by first choosingthe editing mode and then selecting the corresponding drawing mode. This mode isselected by clicking on one of the icons at the left edge of the graphics window.The current drawing mode is indicated by the icon inside the Mode field at thelower left. (Figure 5.2) A new object is placed on the screen by pressing the left
mouse button and simultaneously moving the mouse pointer. If an object is definedby several points, e. g. a polyline or a bezier curve, the last point is set with themiddle mouse button.
The graphic attributes (e.g. color, line and fill style, font type) of new objects istaken from the Attributes Selector (see Chapter 5.5 on page 44). For new objectsthat require an NMR data set, the data set is taken from the Data Set Selector (seeChapter 5.6 on page 46).
5.2.1.1 Basic objects
XWIN-PLOT supports the following basic graphical object types which are accessi-ble in the Basic major editing mode:
• Lines
• Polylines
• Polygons
• Rectangles
Figure 5.2 The mode field reflects the current drawing mode

38 5.2 Input Modes
DONE
INDEX
INDEX
• Circles
• Open and closed bezier curves
• Standard text objects
• EPSI8) objects (Unix version) / Metafile objects (Windows version)
For each of these objects there is a corresponding drawing mode which can beselected by clicking on one of the drawing mode icons shown in Figure 5.3. The
editing of basic objects will be described in detail later. (Refer to page 59 in Chap-ter .)
5.2.1.2 NMR objects
The following NMR objects are supported by XWIN-PLOT when the NMR majorediting mode is selected:
• Spectral parameters
• Spectra titles
• FIDs
• 1D spectra
8) Encapsulated PostScript Interchange
Figure 5.3 The icons for creating basic objects

5.2 Input Modes 39
DONE
INDEX
INDEX
• Stacked 1D spectra
• 2D spectra
• T1/T2 curves
• NMR dataset-related text objects
The NMR objects are handled the same way as the basic objects.
For each object there is a corresponding drawing mode which is activated byselecting one of the icons on the left side of the graphics window. The editing of
NMR related objects will be described in detail in Chapter .
5.2.2 Expand and zoom mode
With the expand and zoom modes (Figure 5.5) a part of the layout or of an individ-ual object can be enlarged. Expansion applies to the individual objects of a layout.
While the expansion of objects only applies to NMR objects like FIDs and spectra,zooming affects the layout as a whole.
Figure 5.4 The icons for creating NMR related objects
Figure 5.5 The icons for expanding and zooming

40 5.3 Working with objects
DONE
INDEX
INDEX
After entering the zoom mode you can mark the area to be zoomed by moving themouse while the left mouse button is being pressed. The area on which the zoom-ing will have an effect is indicated by a rectangle. After releasing the mouse but-ton, XWIN-PLOT will display an enlarged view of this area.
The buttons Zoom In and Zoom Out in the upper part of the layout window (Fig-ure 5.6) can be used to zoom the currently visible region. Click on Full if you want
the whole layout to be displayed.
The expand operation is similar to zooming but only applies to a single object. Inexpand mode the part of an object that was marked with the mouse is enlarged andreplaces the original object. When expanding an object with the Shift modifier keypressed, the objects height remains unchanged. If the Control modifier key ispressed, the width is not changed. Pressing the Alt modifier key will „blow-up“ aportion of the spectrum according to the settings in the Global Setup dialog (Seechapter 5.11.1 on page 52.). Figure 5.7 shows an example.
5.3 Working with objects
5.3.1 Moving objects
An object can be moved any time, i. e. independent from the input mode. To movean object, place the cursor within the object‘s bounding box, keep the middlemouse button pressed and move the mouse. The bounding box is indicated by adotted rectangle as soon as the cursor enters the box. It is not necessary to mark anobject in order to move it.
5.3.2 Marking objects
Within XWIN-PLOT there are two different modes for marking objects. Objects canbe selected either by their individual points (Figure 5.9) or as a whole (Figure
Figure 5.6 Buttons for zooming in or out of a graphic

5.3 Working with objects 41
DONE
INDEX
INDEX
5.10), depending on the marking mode. (See Figure 5.8.) Objects that have beenmarked can be identified by the markers that have been placed around them9).
With most objects there is no difference between the two marking modes. Forobjects like polygons, however, which are defined by several base points, the twomodes have a different meaning. When marking such an object by its individualpoints, the position of each base point can be changed individually using themouse. This results in the object changing its form, i. e. the form of its bounding
Figure 5.7 Spectrum „blow-up“
Figure 5.8 The icons for the marking modes
9) The marker size can be changed in the Global Setup.
3.03.54.04.5 ppm
x16

42 5.3 Working with objects
DONE
INDEX
INDEX
box. When an object is marked as a whole (Figure 5.10), only the objects dimen-sions can be changed, but not its individual point positions.
To mark more than one object you have to select each item with the left mouse but-ton while holding down the Shift modifier key. Several objects can be markedsimultaneously with the mouse by putting a frame around them. Place the mousecursor outside the layout region to be marked, press the left mouse button andmove the mouse over the objects. A frame appears and all objects inside this frameare marked after releasing the mouse button.
Use the Mark All command from the Edit menu if you want to mark all objectssimultaneously. Mark All implicitly activates marking mode.
5.3.3 Using a spectrum or FID as a clipping window
If modifier keys are pressed while scaling or moving a FID or spectrum, the FID orspectrum will not change its x position (provided Shift or Alt is pressed) or y posi-tion (provided Control or Alt is pressed). The FID or spectrum object may thus beused as a a clipping window.
5.3.4 Deleting marked objects
Delete removes all marked objects.
Figure 5.9 A polyline object marked by its points
Figure 5.10 The same object as in Figure 5.9, this time marked as a whole

5.4 The Popup Menu 43
DONE
INDEX
INDEX
5.3.5 Copying marked objects
The Copy command duplicates all marked objects. After copying an object thecopy is independent from the original object.
5.3.6 Rotating marked objects
Use Rotate to rotate all marked objects by 90, 180 and 270 degrees, respectively.
5.3.7 Creating object groups
Sometimes operations like moving or scaling have to be applied to a number ofobjects. In this case it may be convenient to combine all of these objects into agroup. Before a group can be created at least two objects have to be marked. Clickon the Group button or use the Group menu entry to combine the objects.
If all the objects within a layout are intended to be part of a group, the menu com-mand Mark All can be used as a shortcut for selecting all the objects at once.
To split a marked group into its individual parts, use the Ungroup button in thelayout window or the menu bar.
5.3.8 The stacking order
If a layout contains overlapping objects, you may want to move an object to theforeground or background. The commands Raise and Lower in the Edit menu areprovided for this purpose. The command Raise places the marked objects in theforeground, while the command Lower places them in the background.
5.4 The Popup Menu
Pressing the right mouse button or the [F4] function key10) will automaticallymark the object under the cursor and display a popup menu that contains the mostfrequently used commands (Figure 5.11). This is especially useful if you want toedit an object.
10) On many Unix type systems the popup menu will not work as long as the NUMLOCK state is activated on your keyboard. Press the NUMLOCK key again to deactivate it. This behavior cannot be influenced by XWIN-PLOT

44 5.5 Attributes
DONE
INDEX
INDEX
5.5 Attributes
The Attributes Selector (Figure 5.12) is displayed by clicking on the Attributesbutton. If one of the creation modes (Chapter 5.2.1) is active, after clicking Applyor OK all changes made in the Attributes Selector will affect objects created subse-quently. If one of the marking modes (Chapter 5.3.2) is active, the attributes of themarked objects can be changed by pressing the Set button. The Reset button willset all attributes to their default values.
XWIN-PLOT supports two different color models, namely a set of 16 fixed colorsand arbitrary color settings depending on RGB values. The active color is selectedwith either the 16 buttons for the standard colors or by activating the RGB colorbutton. The settings for line and fill colors can be changed independently. You canswitch between the line and fill color settings by selecting the corresponding radiobutton.
After clicking on the button RGB Settings, the RGB Settings dialog window willbe displayed (Figure 5.13). RGB colors can be changed by entering red, green and
Figure 5.11 The popup menu

5.5 Attributes 45
DONE
INDEX
INDEX
blue values in textfields or by moving sliders. The current RGB values and theresulting color are displayed while you are editing. If the number of available col-
Figure 5.12 The Attributes Selector
Figure 5.13 Changing the RGB settings

46 5.6 Data set handling
DONE
INDEX
INDEX
ors is exhausted, the color shades shown in the Color field may not reflect the truevalues indicated by the contents of the textfields or by the slider positions11). How-ever, this does not affect the colors as they appear on a printout.
To change the font size, choose one of the font units in the option menu and enter avalue in the Font Size input field.
All the settings of the Attributes Selector can be loaded and saved with the com-mands available in the File menu.
5.6 Data set handling
5.6.1 The Data Set Selector
The Data Set Selector (Figure 5.14) contains all the data sets available for XWIN-PLOT. All data sets that are to be displayed as parts of NMR related objects have tobe chosen in this selector first.
The data set that is selected in the Data Set Selector is the one that will be used ifnew NMR objects are created. For stacked plot objects, which usually contain
11) The maximum number of different colors depends on the display hardware.
Figure 5.14 The Data Set Selector

5.6 Data set handling 47
DONE
INDEX
INDEX
more than one spectrum, the first of these spectra has to be selected in the selector.All stacked plot spectra are taken from the Data Set Selector in ascending order,beginning with the active data set.
To select a data set, mark it with the left mouse button and press Apply or OK.Press Set to change the data set for the currently marked objects. Double clickingon a data set name selects this data set and closes the selector.
After clicking on the Edit button, the Portfolio Editor will pop up.
5.6.2 The Portfolio Editor
In XWIN-PLOT all actions related to loading NMR data sets are handled by thePortfolio Editor (Figure 5.15) in combination with the Data Set Selector.
Figure 5.15 The Portfolio Editor
48 5.6 Data set handling
DONE
INDEX
INDEX
In the Portfolio Editor NMR data sets can be selected by name. These names arecomposed of the data directory the data sets reside in, the user and data set namesand the experiment and processing numbers. Before an NMR data set can be usedin the plot editor, it must be added to the portfolio editors selection list. This isdone by double clicking on the data set entry or by selecting it and clicking on theAppend button. All active data sets are listed at the bottom of the Portfolio Editorform. With Insert a data set can be inserted into the list of active data sets at anarbitrary position. The new entry is placed before the active one. Remove deletes adata set from the portfolio list. Apply finally accepts all selections and updates theData Set Selector. The data sets to be displayed in NMR related objects can beselected from the Data Set Selector, as described in 5.6.1.
The Portfolio Editor‘s File menu provides commands for saving, loading andappending portfolio contents. By convention portfolio file names end with .por .If a portfolio is saved as default, it is loaded automatically each time XWIN-PLOT isstarted. If the plot editor is started within XWIN-NMR, it additionally searches for aportfolio named portfolio.por in the processing directory of the currentdataset and loads that if present. Otherwise the default portfolio remains loaded.Content of the portfolio is transferred to the data set list. Finally the first entry inthe list is replaced by the current data set, and if there are projections these areplaced on positions 2 to 5. The rest of the portfolio remains unchanged. Thedefault portfolio data is also used by the XWIN-NMR search command. The Editmenu offers options to sort the portfolio data in ascending or descending order anda Clear command to remove all selections.
With Edit Directory List in the Edit menu you can specify the directories (for-merly called disk units) that contain XWIN-NMR data files. Directories are validdata directories if they contain a folder data with XWIN-NMR data. The directorylist dialog window displays all currently valid directories in a list box (Figure5.16). Data directories can be added to this list by specifying their name in theDirectory text field and pressing the Return key or the Add button. Select one ormore directories and click on Remove to delete them from the directory list. Thecurrent directory list will be accepted by the Portfolio Editor after clicking onApply.

5.7 File handling 49
DONE
INDEX
INDEX
5.7 File handling
All file related functions are found in the plot editor‘s File menu. Select New toopen a new, empty layout window. With Open, a previously existing layout can beloaded. With Save you can save a layout under its current name. Use Save As ifthe layout is to be saved under a new name. Select Abandon to reload the currentlayout and discard all changes.
Save Layout/Portfolio to Dataset saves the layout in the processing directory ofthe current dataset. Additionally the contents of the current portfolio is saved underthe predefined name portfolio.por . Select Open Layout/Portfolio fromDataset to open them againt. See also Chapter 5.6 on how the file portfo-lio.por is using during startup of XWIN-PLOT.
To close a layout window select the Close menu entry. As soon as the last layoutwindow is closed, XWIN-PLOT will terminate. XWIN-PLOT also terminates if theClose All menu option is selected.
Figure 5.16 Editing the data directory list

50 5.8 Printing a layout
DONE
INDEX
INDEX
5.7.1 Archive functionality
AUTOPLOT will always store a backup copy of the currently used layout to the firstdata set on the list. The backup copy gets the fixed name last_plot.xwp .
This ensures that you always could exactly reproduce the last plot of this dataseteven when your standard layouts have been changed in the meantime. In that caseuse the Open Layout/Portfolio from DataSet command to loadlast_plot.xwp into XWIN-PLOT again.
5.8 Printing a layout
The graphics created by the XWIN-PLOT editor can be printed in high quality onmost printer types, including dot matrix printers as well as ink jet or laser printers.Additionally a graphic can be saved as a file which can be imported into a text doc-ument.
To print or preview a layout select the Print menu entry in the File menu.
The Print form (Figure 5.17) allows you to print, save or preview the graphicsaccording to the settings chosen in the Printer Setup (See chapter 5.11.3 onpage 54.). The Printer Setup may be selected from the Print form or from theOptions menu. You can also select the range of pages to be printed.
Select To File to save the graphic in the natural printer format according to theprinter setup. A graphic that is saved to a file can be imported into a text document.
Figure 5.17 The Print form

5.9 Undo 51
DONE
INDEX
INDEX
After clicking on Preview a new window is opened and a preview of the currentgraphic will be displayed.
5.9 Undo
Any operation on a layout can be reversed by clicking on the Undo button orchoosing the Undo command in the Edit menu.
5.10 The XWIN-PLOT clipboard
Note: For differences in the Windows version of XWIN-PLOT please refer to Chap-ter 11.
For copying objects between different layout windows a clipboard mechanism isavailable. To display the clipboard window (Figure 5.18) select the Show Clip-board option in the Edit menu. After marking your objects, they can be copied tothe clipboard by selecting Put to Clipboard in the File menu.
Figure 5.18 The clipboard with an object in it

52 5.11 Setting up XWIN-PLOT
DONE
INDEX
INDEX
The clipboard contents can be zoomed using the Zoom In and Zoom Out buttons.With Get from Clipboard the clipboard data is copied to the active layout win-dow. Clear Clipboard removes the clipboard contents12).
5.11 Setting up XWIN-PLOT
All setup-related options are found in the Options menu and will be described inthe following sections.
5.11.1 The Global Setup
Within the Global Setup shown in Figure 5.19 you can change some generalparameters. The Global Setup dialog window is displayed after selecting the corre-
sponding menu entry.
12) This operation cannot be reversed by Undo.
Figure 5.19 The Global Setup dialog window

5.11 Setting up XWIN-PLOT 53
DONE
INDEX
INDEX
Each layout window has a status line below its drawing area which contains infor-mation about the current mouse cursor position, the size of the active object or adata set name. Deselect the button Show Status Lines if you do not want thisinformation to be displayed. Removing the status line will provide additional spacefor the graphics. If Show Toolbar Hints is enabled, small popups providing ashort help text are displayed when the mouse stays a certain time over a particularbutton in the layout window. XWIN-PLOT displays a dialog window with helpfultips about certain program features each time the program is started, if the optionShow Startup Hints is selected (Figure 5.20).
Depending on your screen resolution it may be necessary to change the size of themarkers XWIN-PLOT displays around marked objects. The marker size can bechanged with the slider Marker Size (in pixel).
In the Global Setup dialog you can also set the parameters for the „blow-up“ func-tion that is available in expand mode (See chapter 5.2.2 on page 39.).
The settings made in the Global Setup are automatically saved when leavingXWIN-PLOT.
5.11.2 The Layout Setup
In addition to the global settings made in the Global Setup, for each layout windowthere is a Layout Setup with options that affect only the current layout window.(See Figure 5.21.)
Usually objects are not placed arbitrarily on the screen but their positions arealigned horizontally or vertically. XWIN-PLOT provides an invisible grid which
Figure 5.20 A startup tip

54 5.11 Setting up XWIN-PLOT
DONE
INDEX
INDEX
helps in aligning objects. The grid distance is selected by the radio buttons underSnap-In. When placing an object on the screen the mouse cursor will automati-cally jump to the locations marked by the grid13).
5.11.3 The Printer Setup
Note: For differences in the Windows version of XWIN-PLOT please refer to Chap-ter 11.
The Printer Setup dialog window (Figure 5.22) contains all printer related options.The setup data is saved automatically, together with the layout information, if youchoose Save or Save As from the layout window‘s File menu.
The XWIN-PLOT plot editor comes ready for use with a variety of printers. Selectyour printer from the Printer Type list at the top of the Printer Setup dialog win-dow. If you have a printer with built-in PostScript support choose the PostScriptentry. Otherwise select the entry corresponding to your printer name. If yourprinter is not listed, you will have to choose an entry that is compatible with yourprinter, i. e. a printer which offers the same printer emulation as yours. Please con-sult the printer manual if you are in doubt about the emulation mode needed foryour printer. Most dot matrix printers have built-in Epson emulation, a lot of laserprinters are compatible with the HP LaserJet series. Ink jet printers usually arecompatible with the HP DeskJet or the Canon BubbleJet. If no information about
Figure 5.21 The Layout Setup
13) The Snap-In settings have no effect in expand and zoom mode.

5.11 Setting up XWIN-PLOT 55
DONE
INDEX
INDEX
the printer emulation is available it is a good idea to try some of the predefinedprinter types. Choosing the wrong emulation will not harm a printer, but it willgive bad or no results. On the other hand, if the printer output is identical to thegraphics on the computer screen, you can be quite sure that you have found anemulation compatible with your printer type.
Figure 5.22 The Printer Setup dialog window

56 5.11 Setting up XWIN-PLOT
DONE
INDEX
INDEX
The Printer Type list also contains entries for creating graphic export files. Animportant entry of this type is EPSI14). Choose this entry if you want to importyour graphic into programs that support Encapsulated PostScript import, e. g.FrameMaker or Corel Draw.
XWIN-PLOT recognizes most common paper formats which can be selected in thePaper Size list. Because of their mechanics most printers do not utilize the fullarea of a sheet of paper. To ensure that parts of a layout do not exceed the printablepaper size, printer offsets have to be specified for each edge of the page. Usuallythese values need not to be changed since the default values work with mostprinter types.
The Paper Size settings have an effect on the printer output as well as on thescreen layout of the plot editor‘s layout windows. If the paper size or offsets arechanged, the dimensions of the screen layout are adjusted accordingly after press-ing Apply or OK.
The XWIN-PLOT editor supports both the Portrait and the Landscape output for-mat. Choose one of these formats from the Output Format options. Switchingbetween the Portrait and the Landscape format will also affect the current layout. Ifa color printer is available you can choose between monochrome or color print-ings. It is recommended that the color option is used with color printers only andnot with black and white ones. Otherwise the graphics might be modified by theprinter or the printer driver in order to visualize different color shades. In this casethe Color option does not give satisfying results on most black and white printers.
If the desired size of a printing job is larger than the physical paper size, e. g. for aposter, it can be split and distributed over several sheets of paper. To print thegraphics on several pages, select the number of pages for each dimension usingSplit to X*Y Pages. These pages can be fit together at their edges later on. Thescreen layout will display the splitting settings after pressing Apply or OK.
As XWIN-PLOT was preconfigured to directly work with a standard SVR4 Unixenvironment, the Print Command and Preview Command options at the bottomof the Printer Setup form in most cases will only have to be changed in a non-stan-dard environment. With Print Command you can define the command string theplot editor uses when transferring the plot data file to the printer spooler. A validcommand string might look like this:
14) Encapsulated Postscript Interchange

5.11 Setting up XWIN-PLOT 57
DONE
INDEX
INDEX
lp -c -s -oraw -n1 -dMyPrinter %s
lp is the name of the standard Unix printer spooler program to be used, followedby several options:
• The -c option tells lp to copy the print code file and print the copy instead ofthe original file. This option must not be omitted since the print code file will bedeleted immediately after executing the lp command.
• The -s option prevents lp from reporting status messages about the print job.
• The -oraw option tells lp to work in raw mode, i. e. data is not interpreted.This option must not be omitted.
• The -n option specifies the number of copies to be printed, e.g. -n2 for twocopies. If you just want to have one copy, this option can be omitted.
• The -d options tells lp which printer to use, e.g. use -dMyPrinter to printon the printer with the name MyPrinter . If you want to use the defaultprinter, this option can be omitted.
• The option %s stands for the name of the file to be printed and is automaticallyreplaced by an appropriate filename during runtime. The %s must not be omit-ted.
If the BSD printer spooler is running on your machine, the command for printingwith XWIN-PLOT will probably be (use this on Linux systems):
lpr -h -#1 %s
The option -h will suppress the printing of the burst page. With -# the number ofcopies can be specified.
The Preview Command textfield defines the command which runs the PostScriptpreviewer. On an SGI platform the xpsview software package is used as defaultpreviewer.
Once you have selected printer settings reflecting your configuration and yourneeds, the new setup can be activated by clicking on Apply or OK. If you want toexit without the changes taking effect, choose Cancel.

58 5.12 On-line help
DONE
INDEX
INDEX
To select the current printer configuration as the default setup, use the Save AsDefault option in the Printer Setup‘s File menu. Use Save As for saving the cur-rent printer setup with a specific name. The setup can be retrieved later using theLoad command.
5.12 On-line help
The complete XWIN-PLOT manual is available in a Hypertext help format. Helptexts are displayed after selecting the corresponding entries in the Help menu.

59
6
Object editors
XWIN-PLOT supports a variety of object editors:
• There are several standard object editors which allow for the setting of all rele-vant parameters for all graphic objects.
• There is a special 1D object editor for FIDs, T1/T2 curves and 1D spectra and aspecial 2D object editor for 2D spectra.
• The Attributes Selector (see Chapter 5.5 on page 44) can be used to modify anobject‘s graphic attributes.
• The Data Set Selector (see Chapter 5.6 on page 46) can be used to change anobject‘s data set.
6.1 Standard object editors
After marking an object and clicking on the Edit button one or more standardobject editors will be displayed. The number and types of these editors depend onthe type of the object for which the edit command was called. For simple objectslike rectangles only the basic object editor will be displayed. For more complexobjects there are additional object editors.
As long as an object is being edited it cannot be modified in the layout window.

60 6.1 Standard object editors
DONE
INDEX
INDEX
6.1.1 The basic object editor
With the basic object editor the position and dimension of an object can be set.
Note that the position and dimension are the logical position and dimension, notthe position and dimension of the bounding box. The markers placed aroundobjects (see Chapter 5.3.2 on page 40) show the logical position and dimension,while the dotted rectangle that appears as soon as the mouse cursor enters anobject, shows the position and dimension of the bounding box.
The logical position and dimension and the position and dimension of the bound-ing box only differ for a few objects, e.g. for a line object with arrow tips or for aspectrum or FID object with axes and the option Scale Bounding Box set to false.
After clicking on the Basic button an attribute editor will pop up. This editorallows you to change the marked objects attributes. The Basic button can only beused to select objects that support basic editing functions.
6.1.2 The arrow object editor
Arrows tips can be added to lines and bezier curves. When editing these objects thearrow style and tip width can be selected as shown in Figure 6.2. If you want afilled arrow tip, use the basic attributes to set the fill style and the fill color accord-ingly.
6.1.3 The EPSI object editor
Note: For differences in the Windows version of XWIN-PLOT please refer to Chap-ter 11
Figure 6.1 The basic editor
6.1 Standard object editors 61
DONE
INDEX
INDEX
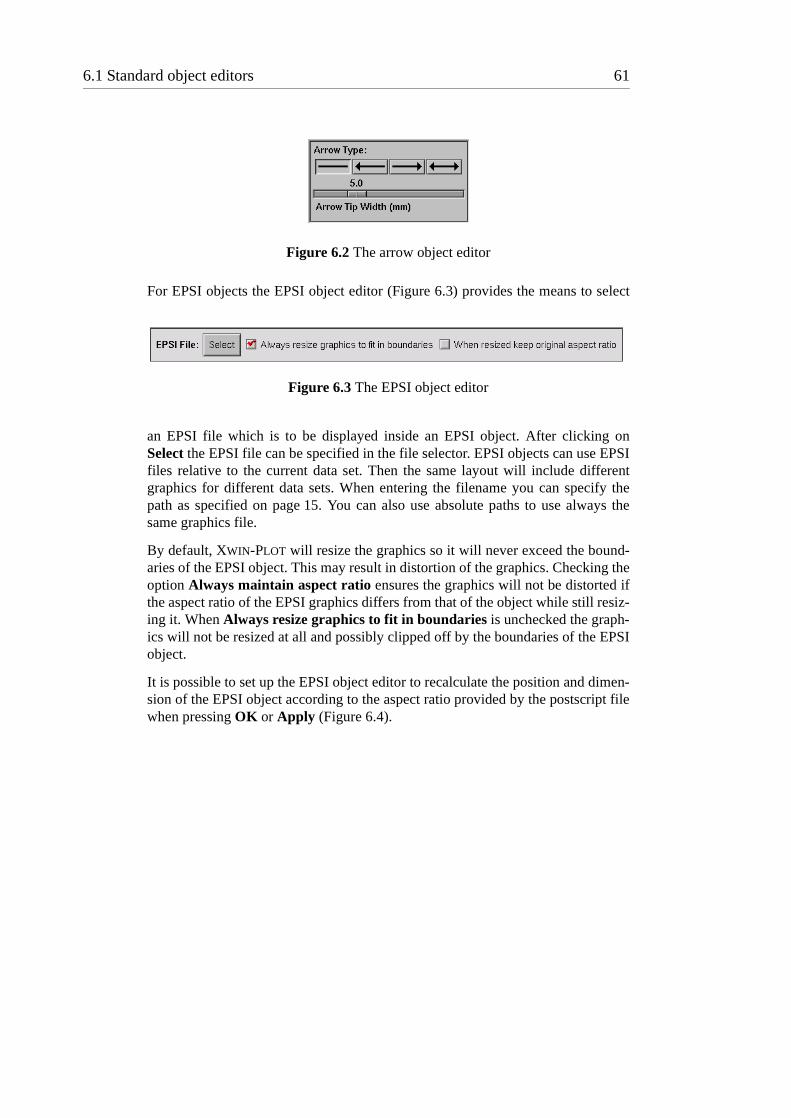
For EPSI objects the EPSI object editor (Figure 6.3) provides the means to select
an EPSI file which is to be displayed inside an EPSI object. After clicking onSelect the EPSI file can be specified in the file selector. EPSI objects can use EPSIfiles relative to the current data set. Then the same layout will include differentgraphics for different data sets. When entering the filename you can specify thepath as specified on page 15. You can also use absolute paths to use always thesame graphics file.
By default, XWIN-PLOT will resize the graphics so it will never exceed the bound-aries of the EPSI object. This may result in distortion of the graphics. Checking theoption Always maintain aspect ratio ensures the graphics will not be distorted ifthe aspect ratio of the EPSI graphics differs from that of the object while still resiz-ing it. When Always resize graphics to fit in boundaries is unchecked the graph-ics will not be resized at all and possibly clipped off by the boundaries of the EPSIobject.
It is possible to set up the EPSI object editor to recalculate the position and dimen-sion of the EPSI object according to the aspect ratio provided by the postscript filewhen pressing OK or Apply (Figure 6.4).
Figure 6.2 The arrow object editor
Figure 6.3 The EPSI object editor

62 6.1 Standard object editors
DONE
INDEX
INDEX
6.1.4 The text object editor
Text objects can be aligned vertically and horizontally by selecting vertical or hor-izontal alignments. (See Figure 6.5.) You can also edit the text by selecting Edit
Text. A dialog window with a simple text editor will be displayed. The buttonCharacter Chart displays a chart showing all available characters of the currentcharacter set, including those that cannot be typed on the keyboard. To select oneof these characters click on the corresponding button. The character will beinserted in the current text at the text cursor position.
With Load Text the text to be displayed can be loaded from a text file. After load-ing the text you can edit it with Edit Text. Note that the contents of this kind oftext object can only be changed manually. Sometimes it is desirable that the actualtext is read from a file and that there is a unique text file for each NMR dataset.The NMR text object has to be used in this case. “The NMR text object editor” onpage 78 provides more information.
When making changes to the text alignment, it may be necessary that the hot pointremains unchanged15). For this purpose an additional option should be used (Fig-ure 6.8). When changing a text objects contents, the object dimensions often
Figure 6.4 Resetting the aspect ratio of EPSI objects
Figure 6.5 The text object editor

6.1 Standard object editors 63
DONE
INDEX
INDEX
change, too. If the switch Recalculate Object Dimensions is activated, XWIN-PLOT will adjust the objects edges to fit the new size text object exactly. With someobjects, especially those with centered text, this may give undesired results. If youdon‘t want the text object‘s size to be affected after changing the text, deselect thisoption. The hot point option and the recalculation option do not change the objectdirectly but only the way OK or Apply work on this object.
6.1.5 The resizable text object editor
Text objects can be set up to change or not to change the font size automaticallyafter scaling. This can be done by enabling or disabling the button Allow auto-matic font resize (Figure 6.9).
15) The hot point is the text‘s anchor point.
Figure 6.6 Editing a text object

64 6.1 Standard object editors
DONE
INDEX
INDEX
Figure 6.7 The character chart
Figure 6.8 Options for editing text objects
Figure 6.9 The resizable text object editor

6.1 Standard object editors 65
DONE
INDEX
INDEX
6.1.6 The graph object editor
The graph editor (Figure 6.10) provides basic operations that can be applied to allobjects which support axes and grids. The horizontally and vertically visible parts
of a spectrum are affected by the data in the Xmin, Xmax, Ymin and Ymax text-fields. Horizontal and vertical axes or grids can be switched on and off with thecorresponding toggle buttons. The X-Axes Offset and the Y-Axes Offset, resp.,change the distance between the spectrum and its axes.
By default, the logical position and dimension of a graph object is the position anddimension of the curve that is displayed within this object. If you want the logicalposition and dimension of the graph object to be the same as the position anddimension of the graph object‘s bounding box, activate the button Scale BoundingBox. This is useful if you intend to group a graph object with a frame and want toscale this group. You should not activate Scale Bounding Box in order to group agraph object with text and line objects that serve as annotations. Scaling such agroup with Scale Bounding Box activated will change the relative positions of theannotations to the curve of the graph object.
When Draw Box around Curve is selected, XWIN-NMR places a box around thecurve object. For 2D spectra this is the default behavior.
Figure 6.10 The graph editor

66 6.1 Standard object editors
DONE
INDEX
INDEX
For each part of a graph object the basic attributes may be set independently. Thisenables you, for example, to assign a spectrum‘s axes a color different from thespectrum itself. To change the attributes of the spectrum‘s curve, the axes or thegrids, click on one of the corresponding buttons Curve, Axes or Grid. This willpop up the attribute editor.
6.1.7 The 1D spectrum object editor
The 1D spectrum object editor provides additional functions for 1D spectrumobjects (Figure 6.11).
XWIN-PLOT can add peak labels and integral data to a spectrum, depending on theway a data set was processed in XWIN-NMR. If present, the additional informationwill be displayed after selecting the appropriate toggle buttons. The format for dis-playing numerical peak and integral data can be configured in the correspondingtext fields. The notation for specifying the display format, in particular the numberof digits to be displayed, is identical to the one used in the C programming lan-guage16). The default format is
%.3f
Figure 6.11 The 1D object editor
16) See the on-line manual page for more information by executing the command man printf in a Unix shell.

6.1 Standard object editors 67
DONE
INDEX
INDEX
which denotes that the data is to be displayed in a floating point format with threedecimal places.
The units for axes and peak labels can be chosen independently. The graphicattributes of peaks and integrals may be changed as well as the attributes forcurves, axes and grids.
6.1.8 The 1D stacked spectrum object editor
With the stacked plot editor you can change the look of stacked plot objects. (SeeFigure 6.12.) The horizontal and vertical distance between the individual spectra of
a stacked plot can be selected within the Spectra Offset text field.
Figure 6.13 gives an example of a white washed stacked plot that was created withXWIN-PLOT. As you will notice, only the lines in the foreground are visible. This isthe result of setting the fill color in the stacked plots curve attributes to white andthe fill style to „filled“. If Set Curve Attributes to White Wash is active whenpressing OK or Apply, XWIN-PLOT will automatically set the curve attributes thisway. Change the curve attributes to the standard values if you want to remove thewhite wash look.
Before spectra can be combined to a stacked plot, they have to be added to theData Set Selector. The active spectrum in the selector is the first to be displayed inthe plot. The additional spectra for the stacked plot are those listed in ascendingorder behind the selected spectrum.
When creating the spectra list for the Data Set Selector in the Portfolio Editor, it isoften beneficial to use the sorting options in the portfolio‘s Edit menu to ensurethe correct order of spectra. Usually either an ascending or a descending order ispreferable. It is recommended that the data set names for spectra that are intendedto be used in a stacked plot are selected in such a way as to allow efficient sortingfor the order needed for the plot. For temperature dependent spectra, for example,
Figure 6.12 The stacked plot parameters

68 6.1 Standard object editors
DONE
INDEX
INDEX
this means that the data set names should contain information about the acquisitiontemperature. In stacked plots such spectra usually are displayed according to risingor falling temperatures, so data set names with the temperature as one of their com-ponents will guarantee that a particular order can easily be achieved.
6.1.9 The 2D spectrum object editor
When editing 2D spectra, the units may be chosen separately for each of the twoaxes. The graphic attributes for negative and positive levels can be selected glo-
Figure 6.13 A white washed stacked plot
Figure 6.14 Setting white wash attributes
4.54.64.74.84.95.05.1 ppm

6.1 Standard object editors 69
DONE
INDEX
INDEX
bally. Use the interactive 1D/2D editor to change the color settings for a particularlevel.
6.1.10 The 2D projection object editor
This editor allows to select 1D spectra that will be displayed as projections at theaxes of a 2D NMR spectrum. Each axis has a toggle button which allows to display
the corresponding projection (Figure 6.16). To select a projection data set, click onthe buttons Top Data Set, Bottom Data Set, Left Data Set and Right Data Set,respectively. The Data Set Selector will pop up and you can select the data set tobe displayed. The projection size can be changed in the corresponding text fields.All projections have identical graphic attributes which can be edited by clicking onthe Attributes button.
Figure 6.15 The 2D object editor
Figure 6.16 The 2D projection editor

70 6.1 Standard object editors
DONE
INDEX
INDEX
6.1.11 The T1/T2 object editor
XWIN-PLOT is capable of displaying T1/T2 curves created by the XWIN-NMR relax-ation (T1/T2) routine. In the T1/T2 object editor the curve attributes can bechanged (see Figure 6.17). For each of the T1/T2 relaxation point lists you can edit
the graphic attributes by clicking on a list entry while the button Edit Attributes isactive. Click on Edit Markers and select a list entry afterwards in order to changethe marker type and size in the Marker Selector (Figure 6.18). Optionally tags
Figure 6.17 The T1/T2 object editor
Figure 6.18 The Marker Selector

6.1 Standard object editors 71
DONE
INDEX
INDEX
identifying a curve can be displayed on the left or right of each curve. Show Anno-tation will display an annotation below the T1/T2 object. The graphic attributesfor the tags and the annotation can be chosen independently. Figure 6.19 demon-strates how a T1/T2 plot can look like. Note that the start and end points of the hor-
izontal scale are taken from the minimum and maximum information provided bythe corresponding JCAMP file containing the T1/T2 data. The range of the scalecan be changed in the graph object editor.
6.1.12 The NMR object editor
When editing NMR-related objects, you can choose a new data set for the currentobject in the NMR object editor (see Figure 6.20). After clicking on Select fromPortfolio the Data Set Selector will pop up and another data set can be selected asalready described in Chapter 5.6.
Figure 6.19 An example of a T1/T2 plot
0.5 1.0 1.5 2.0 2.5 3.0 3.5 4.0 4.5 sec
−1.0
−0.8
−0.6
−0.4
−0.2
0.8
0.6
0.4
0.2
0.0
(2)(1)(9)(8)(7)(6)(5)(3)(4)
Peak No. 1, Cursor Point = 4680, 719.74 Hz, 1.999 ppm (1)Peak No. 2, Cursor Point = 5410, 357.50 Hz, 0.993 ppm (2)Peak No. 3, Cursor Point = 5478, 323.76 Hz, 0.899 ppm (3)Peak No. 4, Cursor Point = 5491, 317.30 Hz, 0.881 ppm (4)Peak No. 5, Cursor Point = 5513, 306.39 Hz, 0.851 ppm (5)Peak No. 6, Cursor Point = 5516, 304.90 Hz, 0.847 ppm (6)Peak No. 7, Cursor Point = 5527, 299.44 Hz, 0.831 ppm (7)Peak No. 8, Cursor Point = 5530, 297.95 Hz, 0.827 ppm (8)Peak No. 9, Cursor Point = 5656, 235.43 Hz, 0.654 ppm (9)

72 6.2 The 1D/2D object editor
DONE
INDEX
INDEX
6.2 The 1D/2D object editor
The way how a 1D object, e. g. a spectrum or a FID, is displayed can be changedby using the interactive editing facilities available after clicking on the 1D/2D-Edit button while a 1D object is selected. 1D and 2D objects can also be edited byusing the extended editing mode which can be entered by selecting the Edit but-ton. The interactive editing mode provides tools for changing the dimensions of a1D or 2D object as well as adding or removing axes and grids.
The 1D/2D object can be moved vertically or horizontally with the tools on the leftof the toolbar‘s upper row. When clicking on one of the icons with the left mousebutton and keeping the button pressed, you can change the spectrum‘s position bymoving the mouse in the directions indicated by the arrows inside the icons.
Figure 6.20 The NMR object editor
Figure 6.21 Interactive 1D/2D editing

6.2 The 1D/2D object editor 73
DONE
INDEX
INDEX
By using the two icons on the right of the upper row the graphic can be expandedhorizontally or vertically. As long as the mouse button remains pressed and themouse is being moved the spectrum or FID will change.
Use the EXPAND button to expand the spectrum in all directions simultaneously.Moving the mouse pointer upwards results in the object being magnified. Movingthe pointer downwards reduces the object size.
If a 1D graphic is to be stretched vertically by well defined values you can multi-ply or divide its height by 2 or 8. Applied to a 2D object the level values of theobject will be affected by the multiplication or division.
With the next group of editing tools the object‘s edges can be adjusted to exactlyfit the object‘s dimensions. Each edge can be adjusted separately. When clickingon the icon on the right the spectrum‘s edges are reset to their original values.
74 6.2 The 1D/2D object editor
DONE
INDEX
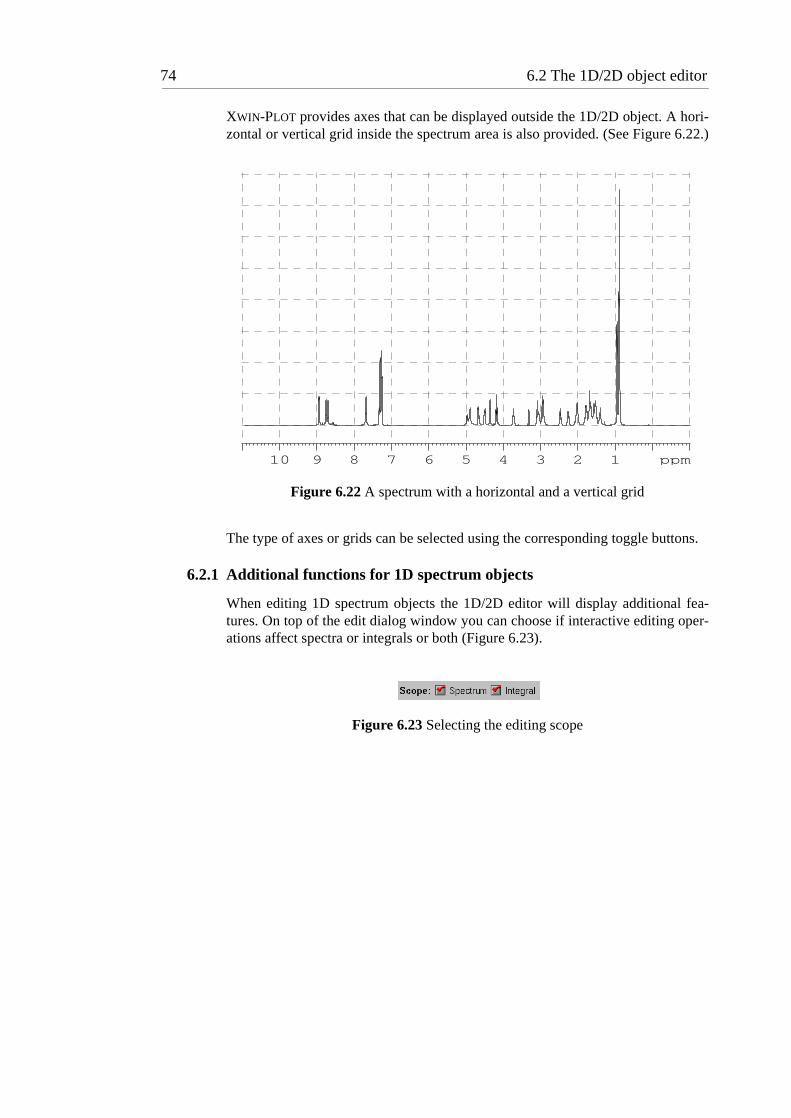
INDEX
XWIN-PLOT provides axes that can be displayed outside the 1D/2D object. A hori-zontal or vertical grid inside the spectrum area is also provided. (See Figure 6.22.)
The type of axes or grids can be selected using the corresponding toggle buttons.
6.2.1 Additional functions for 1D spectrum objects
When editing 1D spectrum objects the 1D/2D editor will display additional fea-tures. On top of the edit dialog window you can choose if interactive editing oper-ations affect spectra or integrals or both (Figure 6.23).
Figure 6.22 A spectrum with a horizontal and a vertical grid
Figure 6.23 Selecting the editing scope
10 9 8 7 6 5 4 3 2 1 ppm

6.2 The 1D/2D object editor 75
DONE
INDEX
INDEX
Peak labels and integral curves can be added to 1D spectra objects by activatingthe Show Peaks and Show Integrals options, respectively. (See Figure 6.24.)
It is often necessary to have a well defined relationship between the frequencyscale and a spectrum‘s width, especially for spectra comparison and when analyz-ing coupling patterns. Therefore, at the bottom of the interactive editing form youcan choose the scale type as well as its units.
The frequency scale can be normalized in Hz per cm or ppm per cm. The scale canalso be justified with an offset. You can display the current settings with Get Val-ues. The new data is applied to the current spectrum object with Use Values.
6.2.2 Additional functions for 2D spectrum objects
Called for a 2D NMR spectrum, the 1D/2D object editor provides facilities forinteractively changing the appearance of 2D projections as well as maintaining thelist of levels created with XWIN-NMR (Figure 6.26).
Scrolling and scaling of 2D projections works like already described for 1D spec-tra. The projection to be affected (top, bottom, left, right) is chosen with a radiobutton.
The 2D object editor displays a list containing the positive and negative 2D levelvalues as defined within XWIN-NMR. New levels are added to this list by entering
Figure 6.24 The options for adding peak labels and integral curves
Figure 6.25 Changing units and offsets

76 6.2 The 1D/2D object editor
DONE
INDEX
INDEX
their value in the Value text field and clicking on Add. Use the Remove button todelete one or more entries from the list. After clicking on Edit the 2D Level Cre-ator window will pop up. There you can create an entirely new level list based on
Figure 6.26 Editing a 2D spectrum and its projections
Figure 6.27 New level lists can be created with the 2D Level Creator
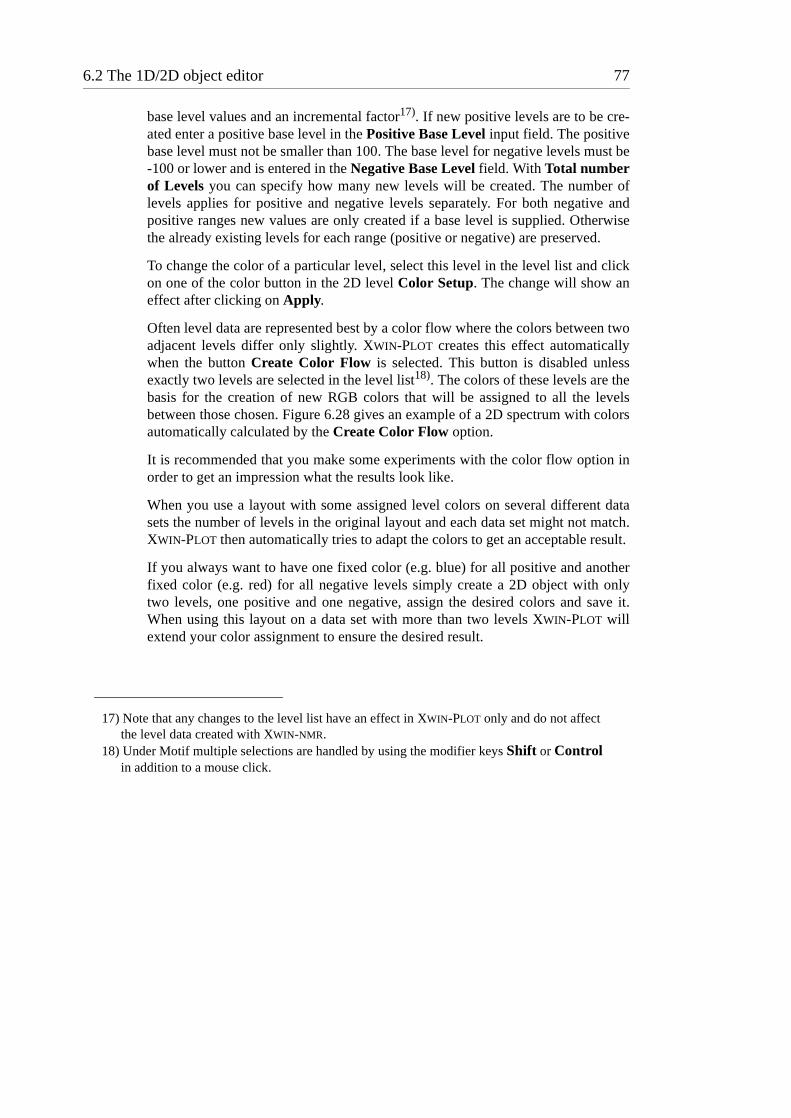
6.2 The 1D/2D object editor 77
DONE
INDEX
INDEX
base level values and an incremental factor17). If new positive levels are to be cre-ated enter a positive base level in the Positive Base Level input field. The positivebase level must not be smaller than 100. The base level for negative levels must be-100 or lower and is entered in the Negative Base Level field. With Total numberof Levels you can specify how many new levels will be created. The number oflevels applies for positive and negative levels separately. For both negative andpositive ranges new values are only created if a base level is supplied. Otherwisethe already existing levels for each range (positive or negative) are preserved.
To change the color of a particular level, select this level in the level list and clickon one of the color button in the 2D level Color Setup. The change will show aneffect after clicking on Apply.
Often level data are represented best by a color flow where the colors between twoadjacent levels differ only slightly. XWIN-PLOT creates this effect automaticallywhen the button Create Color Flow is selected. This button is disabled unlessexactly two levels are selected in the level list18). The colors of these levels are thebasis for the creation of new RGB colors that will be assigned to all the levelsbetween those chosen. Figure 6.28 gives an example of a 2D spectrum with colorsautomatically calculated by the Create Color Flow option.
It is recommended that you make some experiments with the color flow option inorder to get an impression what the results look like.
When you use a layout with some assigned level colors on several different datasets the number of levels in the original layout and each data set might not match.XWIN-PLOT then automatically tries to adapt the colors to get an acceptable result.
If you always want to have one fixed color (e.g. blue) for all positive and anotherfixed color (e.g. red) for all negative levels simply create a 2D object with onlytwo levels, one positive and one negative, assign the desired colors and save it.When using this layout on a data set with more than two levels XWIN-PLOT willextend your color assignment to ensure the desired result.
17) Note that any changes to the level list have an effect in XWIN-PLOT only and do not affect the level data created with XWIN-NMR.
18) Under Motif multiple selections are handled by using the modifier keys Shift or Control in addition to a mouse click.

78 6.3 The NMR text object editor
DONE
INDEX
INDEX
6.3 The NMR text object editor
In addition to the standard text objects that can be created in the Basic major edit-ing mode XWIN-PLOT provides for special dataset-related text objects. Theseobjects display a variable text instead of a fixed one. The text is read from a textfile whose name is entered in the NMR text object editor (Figure 6.29). When
Figure 6.28 A 2D spectrum displaying automatically created colors
Figure 6.29 The NMR text object editor

6.3 The NMR text object editor 79
DONE
INDEX
INDEX
entering the filename you can specify the path as specified on page 15. You canalso use absolute paths.


81
7
Automation editors
The automation editors are called with the Automation Parameters entry in theEdit menu. This entry is only enabled if an object supporting automation parame-ters is selected.
7.1 Reset actions
The automation editors provide options for controlling the behavior of 1D and 2Dobjects in respect to a reset of these objects. Each automation editor containsoptions that affect an object‘s X and Y dimension separately.
7.1.1 General reset actions
All automation editors have some reset actions in common. For the X dimensionthese reset actions are:
• Don‘t change: Xmin/Xmax will not be changed on a reset.
• Set to minimum/maximum: Xmin will be set to the minimum x value. Xmaxwill be set to the maximum x value.
These are the general reset actions for the Y dimension:
• Don‘t change: Ymin/Ymax will not be changed on a reset.

82 7.1 Reset actions
DONE
INDEX
INDEX
• Set to minimum/maximum: Ymin will be set to the minimum y value. Ymaxwill be set to the maximum y value.
7.1.2 The FID automation editor
The FID automation editor (Figure 7.1) provides options that control the resetbehavior of FID objects.
These are the additional reset actions for the Y dimension:
• Set to minimum/maximum between Xmin/Xmax: Ymin will be set to theminimum y value between Xmin/Xmax. Ymax will be set to the maximum yvalue between Xmin/Xmax.
Figure 7.1 The FID automation editor

7.1 Reset actions 83
DONE
INDEX
INDEX
7.1.3 The 1D automation editor
The way in which the 1D spectrum reacts in case of a reset can be selected withinthe 1D automation editor (Figure 7.2).
Figure 7.2 The 1D automation editor

84 7.1 Reset actions
DONE
INDEX
INDEX
The additional reset actions for the X dimension of a 1D spectrum have the follow-ing meaning:
• Set to F1P/F2P: Xmin will be set to the value of the parameter F1P in the dataset, Xmax will be set to the value of F2P. Use this when the 1D spectrumshould use the same axis limits as used in XWIN-NMR. This can also be useful inAU programs. Axis limits of the plot then can be controlled by setting theparameters F1P/F2P prior to the AUTOPLOT command.
These are the 1D spectrum object‘s specific reset actions for the Y dimension:
• Set to minimum/maximum between Xmin/Xmax: Ymin will be set to theminimum y value between Xmin/Xmax. Ymax will be set to the maximum yvalue between Xmin/Xmax.
• After reset size of biggest peak is: After Ymin/Ymax have been calculatedaccording to the selected action, Ymax will be rescaled with a user-defined fac-tor. You can choose to define the new size in percent of the object size (thedefault value 100% results in no changes). Alternatively, you can specify theabsolute new size in centimeters here, or tell XWIN-PLOT to get the new size incentimeter from the parameter CY in the data set. Together with the F1P/F2Poption above the last option can be used in AU programs to have full controlover plot limits and scaling.
If Use region file „reg“ on reset is activated, the reset action for Ymin/Ymax willonly take into account the regions defined in the file reg, intrng (See chapter3.5 on page 19.), or defined by the contents of the parameter SREGLST in the dataset.
7.1.4 The 2D automation editor
With this automation editor (Figure 7.3) you define how a 2D spectrum reacts to areset.
The additional reset actions of a 2D spectrum have the following meaning:
• Set to F2PLO/F2PHI: Xmin will be set to the value of the parameter F2PLOin the data set, Xmax will be set to the value of F2PHI.
• Set to F1PLO/F1PHI: Ymin will be set to the value of the parameter F1PLOin the data set, Ymax will be set to the value of F1PHI.

7.1 Reset actions 85
DONE
INDEX
INDEX
Use these options when the 2D spectrum should use the same axis limits as used inXWIN-NMR. Again, this can also be used in AU programs to control axis scaling bysetting the parameters F2PLO/F2PHI/F1PLO/F1PHI.
For each of the possible four projections then same reset actions are available asused for stand-alone 1D objects.
Figure 7.3 The 2D automation editor


87
8
Reusing layouts
An outstanding feature of the XWIN-PLOT plot editor is its layout support. A layoutis a graphics template that was created for particular data sets and saved for reusewith other data sets. When saving a layout, only the layout information, e. g. objectpositions and dimensions, are saved, not the actual data set information. This chap-ter describes how to reuse a layout in order to use XWIN-PLOT efficiently.
8.1 Layouts and data sets
The basic steps for reusing layouts are shown in Figure 8.1. This steps consists of:
• Loading the layouts
• Loading the data sets
• Resetting the layouts
• Printing
8.1.1 Loading layouts
Layouts can be loaded by using Open from the File menu. If you want to use morethan one layout, first use New to get a new layout and then Open to load the addi-tional layout.

88 8.1 Layouts and data sets
DONE
INDEX
INDEX
If you are using the stand-alone version of XWIN-PLOT, you can also load layoutsby specifying the layout file names on the command line. (See chapter 2.2 onpage 13.)
8.1.2 Loading data sets
Data sets may be loaded in the following ways:
• With the Portfolio Editor you can load arbitrary data sets. (See chapter 5.6.2 onpage 47.)
• Get Current Data Set in the XWIN-NMR menu loads the current XWIN-NMR
data set. Use Get Current Data Set + Reset if you also want to reset a layout.Use Get Current Data Set + Reset + Print to additionally print the layout.Note that these commands are only available in case XWIN-PLOT was startedfrom within XWIN-NMR.
Figure 8.1 Reusing layouts
Load layout(s)
Load data sets
Reset
Print layout(s)

8.2 Printing a series of spectra 89
DONE
INDEX
INDEX
8.1.3 Reset
A reset executes the reset actions of NMR objects. The reset actions can be used torescale a spectrum automatically. (See chapter 6.1.7 on page 66.)
To issue a reset you can either mark individual objects and use Reset MarkedObjects in the Edit menu, or you can reset all objects with Reset All Objects inthe Edit menu. A reset is done automatically by the Get Current Data Set +Reset command.
8.1.4 Print
To print a layout use the Print command from the File menu. (See chapter 5.8 onpage 50.) If you use the command Get Current Data Set + Reset + Print fromthe XWIN-NMR menu, the layout will be printed automatically.
8.2 Printing a series of spectra
To reuse layouts is very convenient when a series of spectra is to be printed. WithXWIN-PLOT several spectra can be printed easily using the plot editors Multi-Printcapability, available in the File menu. In the Multi-Print dialog window you canprint groups of data sets combined with all open layouts.
To use this feature the layouts that are to be used for printing have to be loadedfirst. Now the data set portfolio has to be prepared. In order to fill the Portfoliowith data enter the Portfolio Editor and put all data sets that are to be printed in thedata set portfolio. If more then one data set is used by the layouts, enter the numberof data sets in the Multi-Print dialog. Now simply press the Print button to getprintouts of all layout and data set combinations.

90 8.2 Printing a series of spectra
DONE
INDEX
INDEX
Figure 8.2 Printing multiple data sets

91
9
Autoplot AU Macro Reference
Once you have created some standard layouts according to your personal needs asimple autoplot command can be used to produce the plot without any furtheruser interaction. autoplot can be typed at the XWIN-NMR prompt and becomesreally important when you include plotting tasks in AU programs.
autoplot, together with the necessary arguments, can be entered and started ona standard shell prompt. For efficient use in AU programs a collection of AU mac-ros is available. There are macros to autoplot itself as well as macros to collect sev-eral datasets in a portfolio. Use of a portfolio instead of the current dataset lets youinclude more than one dataset in the layout.
9.1 Plotting the current data set
AUTOPLOT
The macro AUTOPLOT executes the autoplot command without any furtherarguments.
The name of the layout will be taken from the LAYOUT parameter in the currentdataset (see the edo dialog). A portfolio file portfolio.por will be loaded iffound in the processing directory of the current dataset. Otherwise the default port-folio will be used. Its first entry will always be set to the current dataset. If projec-

92 9.2 Plotting arbitrary data sets
DONE
INDEX
INDEX
tions have been calculated these will be included in the portfolio at positions twoto five. Other entries remain unchanged. This works exactly the same way as ifXWIN-PLOT was started within XWIN-NMR.
AUTOPLOT uses the printer that has been specified in the layout file. To changethe printer setting of a layout, open the layout with XWIN-PLOT, choose antherprinter setting in the Printer Setup dialog, and save the layout again.
Example code as it could be used in an AU program:
GETCURDATAAUTOPLOT
9.2 Plotting arbitrary data sets
To plot more than one dataset in a layout you need to create a portfolio file specify-ing those datasets. The following AU macros are provided to create and declareportfolio files.
DECLARE_PORTFOLIO
This macro prepares the AU program for the use of the other portfolio macros. Itmust be included at the beginning of the AU program.
CREATE_PORTFOLIO(“ filename” )
This creates a portfolio file named filename. You must do this before the firstuse of a ADD_TO_PORTFOLIO / ADD_CURDAT_TO_PORTFOLIO statement.The filename is taken without any further modification. It is a good idea to specifyan absolute path to a location that can be safely used, e.g. in the temporary folderor in your home directory (see the example below).
ADD_CURDAT_TO_PORTFOLIO
The current data set is added to the portfolio list.

9.2 Plotting arbitrary data sets 93
DONE
INDEX
INDEXCLOSE_PORTFOLIO
Closes the portfolio definition and makes it ready for use.
AUTOPLOT_WITH_PORTFOLIO
Executes the autoplot command. Instead of the standard portfolio search order,the portfolio file is loaded that has been constructed with the recentCREATE_PORTFOLIO / CLOSE_PORTFOLIO instructions. Note that for tech-nical reasons this macro will not automatically the peak list and / or parameter listas documented for the autoplot command on page 17.
AUTOPLOT_WITH_PORTFOLIO_TO_FILE(“ filename.ps” )
This works like AUTOPLOT_WITH_PORTFOLIO. The output is not sent to theprinter but to the specified Postscript file instead. The Windows version addition-ally supports the suffix “.emf” to create an Enhanced Metafile. Note that fortechnical reasons this macro will not automatically the peak list and / or parameterlist as documented for the autoplot command on page 17.
Example
/* A small AU example**** The current dataset shall have three PROCNOs*/DECLARE_PORTFOLIO
GETCURDATACREATE_PORTFOLIO(“ /tmp/myPortfolio.por” )ADD_CURDAT_TO_PORTFOLIO
IPROCNOADD_CURDAT_TO_PORTFOLIO

94 9.2 Plotting arbitrary data sets
DONE
INDEX
INDEXIPROCNOADD_CURDAT_TO_PORTFOLIO
CLOSE_PORTFOLIO
/* Go back to the initial dataset to use** the correct LAYOUT parameter*/DPROCNODPROCNO
AUTOPLOT_WITH_PORTFOLIOAUTOPLOT_WITH_PORTFOLIO_TO_FILE(“ /tmp/myPlot.ps” )
QUIT
For more information you may want to check the AU programs xwp_p1dlf,xwp_p2dpl and xwp_pcpd135. They are usually installed with the commandexpinstall.

95
10
Tips and tricks
XWIN-PLOT offers a lot of useful features and it surely will take some time beforeyou can exploit all of them. The more familiar you get with the plot editor the moreyou will learn how to use its tools to create sophisticated layouts. The intention ofthis chapter is to provide some valuable hints on the use of some of the editor‘sfeatures that might not come to your mind immediately.
10.1 A shadow around a spectrum
XWIN-PLOT does not offer a predefined object of the type „Spectrum inside aframe“ like the one shown in the previous examples. It is easy, however, to createsuch an object by combining a filled rectangle with a spectrum. The result isshown in Figure 10.1. Figure 10.2 demonstrates how the layout in this examplewas combined with three objects, namely the spectrum a), a rectangle filled withthe color white b) and finally a black rectangle c). The spectrum was surroundedby an empty rectangle and both objects were grouped with the Group command inthe Edit menu. The resulting object was placed in front of a filled rectangle of thesame size and both objects were combined to a group. This way you get a singleobject which looks like the one in Figure 10.1. Because the object‘s componentsare bound into a single group, the resulting object can be moved, scaled etc. like asingle object.
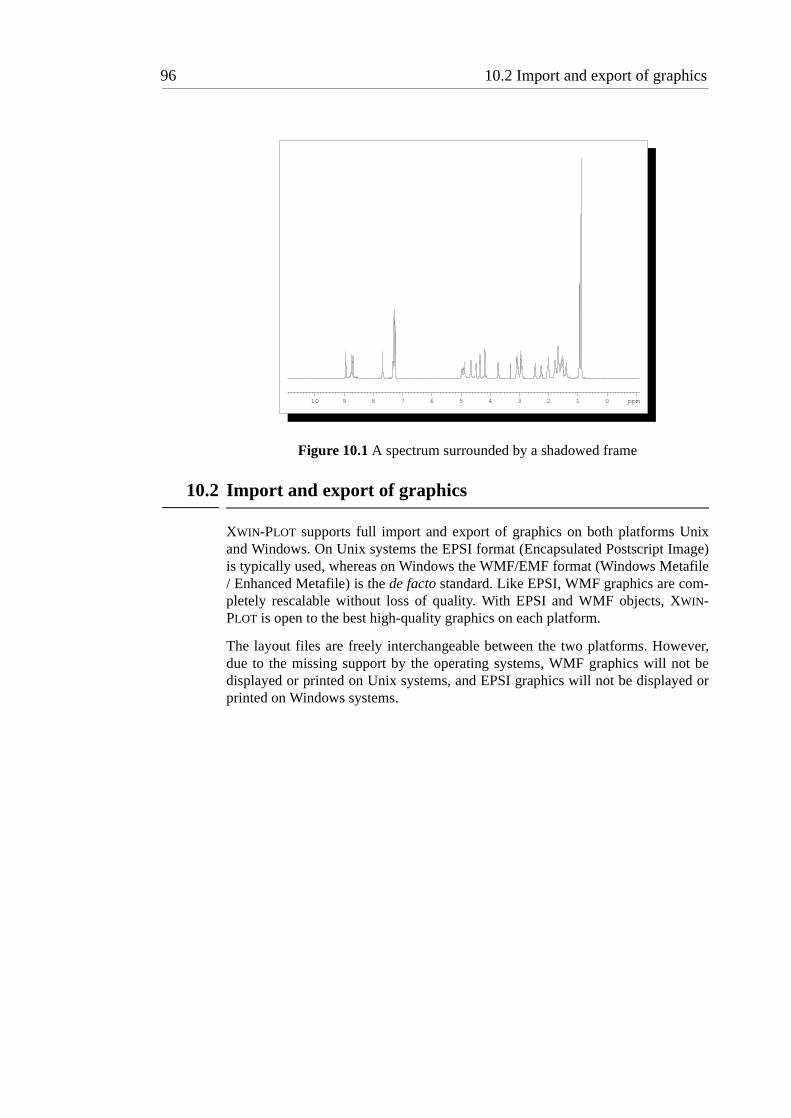
96 10.2 Import and export of graphics
DONE
INDEX
INDEX
10.2 Import and export of graphics
XWIN-PLOT supports full import and export of graphics on both platforms Unixand Windows. On Unix systems the EPSI format (Encapsulated Postscript Image)is typically used, whereas on Windows the WMF/EMF format (Windows Metafile/ Enhanced Metafile) is the de facto standard. Like EPSI, WMF graphics are com-pletely rescalable without loss of quality. With EPSI and WMF objects, XWIN-PLOT is open to the best high-quality graphics on each platform.
The layout files are freely interchangeable between the two platforms. However,due to the missing support by the operating systems, WMF graphics will not bedisplayed or printed on Unix systems, and EPSI graphics will not be displayed orprinted on Windows systems.
Figure 10.1 A spectrum surrounded by a shadowed frame
10 9 8 7 6 5 4 3 2 1 0 ppm

10.2 Import and export of graphics 97
DONE
INDEX
INDEX
10.2.1 EPSI support (Unix)
Compared to bitmap formats EPSI has the advantage of being scalable, i.e. you canrescale EPSI graphics without losing resolution.
To import an EPSI file create an EPSI object, enter the standard object editor forthis object and choose the file name. (See chapter 6.1.3 on page 60.) With XWIN-PLOT you can print layouts with EPSI objects on any printer supported by XWIN-PLOT. The printer need not be PostScript compatible.
A layout can be exported as an EPSI file like this:
1. Enter the Printer Setup dialog, choose EPSI as printer type and press the Applyor the OK button. (See chapter 5.11.3 on page 54.)
2. Enter the Print dialog and press the To File button. Enter a file name for yourEPSI file and press the OK button. By convention, EPSI files end with .eps or.epsi.
Figure 10.2 The building blocks of the graphic in Figure 10.1
10 9 8 7 6 5 4 3 2 1 0 ppm
c)b)
c)

98 10.2 Import and export of graphics
DONE
INDEX
INDEX
10.2.1.1 EPSI import to FrameMaker
This is how to import an EPSI file to FrameMaker:
1. From the File menu, choose Import and then File.
2. Select the file you want to import and press Import.
If you use FrameMaker 4 for Windows, please note:
• FrameMaker 4 cannot display EPSI directly and therefore uses a low-resolutionpreview bitmap. On a PostScript printer, however, the EPSI file will be printedin its full resolution.
• If you transfer the EPSI file generated by XWIN-PLOT from your workstation toyour PC using the ftp program, you must use binary mode for the transfer.
10.2.1.2 EPSI import to CorelDraw
To import an EPSI file to CorelDraw 6 you must do the following:
1. From the File menu, choose Import.
2. Select Postscript Interpreted (PS) for Files of type.
3. Select the EPSI file and click on Import.
4. In the Import PostScript dialog, click on OK.
Like XWIN-PLOT CorelDraw supports the printing of drawings with imported EPSIfiles on non-PostScript printers.
10.2.2 Windows Metafile Support (Windows)
Like EPSI, WMF19) graphics are scalable without loss of quality. There are twoways WMF graphics can be used:
1. Create a Metafile object, enter the standard object editor for this object andchoose the file name. The layout now includes the reference to an externalWMF file. Note that this file must be still present to display and print the WMFgraphics.
2. Import graphics of other Windows applications from the clipboard using Pastefrom the menu Edit. The metafile data are now part of the layout file and will
19) Some files use an .EMF suffix indicating that they are in Enhanced Metafile Format. XWIN-PLOT reads both formats WMF and EMF.

10.3 Shortcuts 99
DONE
INDEX
INDEX
be saved with it. In that case there is no external file containing the image.
This way the storage location of the image data can be external or internal. Thestandard object editor for Metafile objects will show you this for each object with ashort description.
To export your complete layout graphics to a Windows Metafile simply chooseExport from the File menu. XWIN-PLOT will create an image in the EMF format(Enhanced Metafile Format) that is accepted by almost all graphically orientedWindows applications.
Of course you can copy some or all of your graphics in XWIN-PLOT to the clip-board. If you want to copy the complete layout choose Mark All and then Copyfrom the menu Edit. Then switch over to your target application and use Paste toinsert the graphics.
Text marked in XWIN-PLOT will be exported as graphics. If you want to have a textobject exported as text only, open the standard object editor for that text object,select the Edit button, mark the text and choose Copy after pressing the rightmouse button.
10.3 Shortcuts
Some frequently needed XWIN-PLOT functions cannot only be called from themenu bar but also by using so called shortcuts. This means that a modifier key ispressed in addition to another key in order to call functions that are also availablein the menus of XWIN-PLOT. The shortcut [Control][A], for example, is an equiv-alent to the menu entry Mark All. Using shortcuts instead of the mouse can savetime when working with XWIN-PLOT.
Note that shortcuts probably don‘t work with a key like Num Lock, Scroll Lockor Caps Lock pressed.


101
11
Notes for Windows Users
With the Windows NT / Windows 2000 version of XWIN-PLOT the graphical userinterface was adapted to the Windows look-and-feel. Additionally, the behavior ofsome functions using operating system features was changed in order to improvethe embedding in the Microsoft Windows environment.
11.1 Printing and the Printer Setup
XWIN-PLOT for Windows uses the Windows printer drivers. This means that anyprinter for which a driver is correctly installed under Windows can be selected asprinting device in XWIN-PLOT.
Following the Windows style guidelines the option Printer Setup is called PageSetup and is available in the File menu. Selecting Print or Page Setup from theFile menu will show standard dialogs. The Split Page option is part of the PageSetup dialog like it is under UNIX.
If the user creates a new layout XWIN-PLOT uses the Document Defaults of thecurrently selected default printer to determine the document size. To change thedefault paper size (which will be typically Letter or A4) click on Start menu / Set-tings / Printers, mark your current default printer and choose Document Defaultsfrom the File menu. The dialog will be device-dependent.

102 11.2 Support for WMF/EMF graphics
DONE
INDEX
INDEX
XWIN-PLOT layout files created under Windows can be used by XWIN-PLOT underUNIX and vice versa. However, the name of the printer device will in most casesnot be correct. Just open the Page Setup dialog to specify the correct printer name.
11.2 Support for WMF/EMF graphics
To easily integrate graphics from other Windows applications with your layoutsXWIN-PLOT provides a “Metafile” graphics object. Use “Metafile” objects like theEPSI objects of the Unix version. XWIN-PLOT graphics can be exported to EMFgraphics files or by use of the clipboard or choose Export from the menu File tocreate a graphics file in Enhanced Metafile Format. Refer to Chapter 10.2 fordetailed information.
11.3 Clipboard
XWIN-PLOT fully supports the Windows clipboard for text and graphics. If you cutor copy one or more XWIN-PLOT objects to the clipboard you can not only pastethem to other XWIN-PLOT layouts but can also import them using the Paste com-mand from the Edit menu in applications like WinWord or PowerPoint. It is alsopossible to import text and graphics from other applications.
To view the current clipboard contents use the Clipboard Viewer by choosing Start/ Programs / Accessories / Clipboard Viewer.
11.4 Support for Email Clients
XWIN-PLOT is able to send the current plot graphics as Email. Simply chooseSend... from the File menu. Your default mail client will popup and create a newempty message with your plot added as a file attachment. For the attached graphicsfile the EMF (Windows Metafile) format will be used to ensure highest quality.
To enable mail support, you must have installed a Simple MAPI Client on your sys-tem. You can use the Windows Messaging package that is provided as part of theWindows setup. Another common client is Outlook Express that is part ofMicrosoft Internet Explorer. Please note that in Outlook Express, the Simple MAPIClient functionality must be explicitly enabled in the applications options. Forother mail programs, please refer to the related product documentation.

11.5 Toolbar 103
DONE
INDEX
INDEX
11.5 Toolbar
Below the menu bar XWIN-PLOT for Windows displays an additional toolbar con-sisting of some common icons. These provide easy access to often used file andedit functions. Moving the mouse cursor over the toolbar gives a short explanationfor each button in the status bar.


105
12
Appendix
12.1 Errors and warnings
12.1.1 Messages in the terminal window
Messages that appear in the terminal window (while running XWIN-PLOT usuallysignal fatal conditions. On Windows they will be displayed in an extra messagewindow. Please submit a detailed report of such messages to Bruker.
12.1.2 Messages in dialog windows
A typical warning in XWIN-PLOT is shown in Figure 12.1. In most cases suchwarnings result from NMR data files that do not exist. All NMR data needed bythe plot editor must have been created previously with XWIN-NMR as described inChapter 3. In practical terms this means that if integral data is to be displayed inXWIN-PLOT, the spectrum must have been integrated in XWIN-NMR. If you wantthe plot editor to show peak labels, these labels have to be created in XWIN-NMR
first. Remember that XWIN-PLOT is a program for displaying and printing NMRdata, not for creating or processing them.

106 12.1 Errors and warnings
DONE
INDEX
INDEX
Figure 12.1 Warnings are displayed inside a dialog window

12.2 What‘s new? 103
DONE
INDEX
INDEX
12.2 What‘s new?
This section gives an overview of the changes in the current version of the XWIN-PLOT software compared to previous versions. Beginning with version 2.5.1 bugfixes are documented in the Bruker Bug Database which is accessible on theBruker WWW server.
12.2.1 Changes since XWIN-PLOT 3.0
• XWIN-PLOT is now available in a version for Linux.
• After installation a large number of pre-designed layouts for typical 1H / 13Cmeasurements can be found in the layouts directory. Backup copies of alllayouts are placed in the subdirectory backup. All layouts will be set to readonly status after installation.
• Reset actions for 1D and 2D objects have been significantly enhanced to pro-vide more flexibility of the axis scaling. Projections of 2D objects can havetheir own reset actions. It is now possible to use axis limits as defined withinXWIN-NMR. (See Chapter 7.1.3 on page 83.)
• The new xwp command can be used instead of xwinplot in XWIN-NMR to letall 1D/2D objects use the axis limits as defined in XWIN-NMR, independantlyfrom the limits and reset actions specified in the layout (page 11).
• The new xwpr command can be used instead of xwinplot on the XWIN-NMR
command line. This will have XWIN-PLOT execute a Reset on all objects com-mand after loading the layout, just as AUTOPLOT does it by default (page 11).
• When starting from within XWIN-NMR, XWIN-PLOT and AUTOPLOT will auto-matically execute the commands xwp_lp and / or xwp_pp on the currentdataset if the parameter list and/or peak list is missing. (page 17, see also Chap-ter 9.2 on page 92).
• AUTOPLOT always stores an archive copy of the currently used layout file in theused dataset. (See Chapter 5.7.1 on page 50.)
• A new option for EPSI / Meta objects allows more flexibility in handling exter-nal graphics (page 60).
• The location of external EPSI / Meta objects can now be specified relative tothe assigned data set. This allows to include different graphics files for differentdata sets. EPSI / Meta objects also understand the symbol $XWINNM-RHOME. (Refer to page 16 in chapter 2.2.4.)

104 12.2 What‘s new?
DONE
INDEX
INDEX
• XWIN-PLOT now tries to get a more intelligent assignment of colors to differentlevels when the number of levels in the layout and the data set do not match(Section 6.2.2).
12.2.2 Changes since XWIN-PLOT 2.6.0• The new commands Save Layout/Portfolio to Dataset / Load Layout/Portfo-
lio from Dataset provide a way to quickly save the layout to the current data-set. The portfolio is saved as portfolio.por in the current dataset.
• If a file portfolio.por is found in the current dataset it is loaded instead ofthe default portfolio during startup of XWIN-NMR. (See chapter 5.6.2).
• EPSI and Metafile objects now have an option to always keep the originalaspect ratio if desired.
• Under Windows now two formats are provided for the export of layouts, PostS-cript (.ps) and Enhanced Metafile (.emf).
• The new option -e enables autoplot to create PostScript / Enhanced Metafilesinstead of printer output. (See Chapter 2.2.2 on page 14.)
• An extended set of AU macros improves the handling of datasets, portfoliosand file creation in AU programming (See Chapter 9).
12.2.3 Changes since XWIN-PLOT 2.5.1
• XWIN-PLOT under Windows NT can now include “Windows Metafile” graphicsinto its layouts. Pasting graphics from other Windows applications using thewindows clipboard is supported. See Chapter 10.2 for details.
• With the Windows NT version you can send your current plot graphics as Emaildirectly from within XWIN-PLOT (Chapter 11.4).
• Additional rescale factor for 1D objects for automation (See page 81).
12.2.4 Changes since XWIN-PLOT 2.0.1• XWIN-PLOT is available in a version for Windows NT. See Chapter 11 on page
101 for details.
• Added dataset-related text object. (Refer to page 78.)

12.2 What‘s new? 105
DONE
INDEX
INDEX
12.2.5 Changes since XWIN-PLOT 2.0.0
12.2.5.1 Bug fixes
• Fixed T1/T2 curve calculation algorithms.
12.2.6 Changes since XWIN-PLOT 1.4.4
12.2.6.1 General remarks
XWIN-PLOT 2.0 is released mainly in order to be compatible with XWIN-NMR 2.0.Note that XWIN-PLOT 2.0 is not compatible with old versions of XWIN-NMR.
12.2.6.2 New features
• The reset options for 1D and 2D NMR objects were moved to the automationeditors. (See Chapter 7 on page 81.)
• Positive and negative 2D projections defined within XWIN-NMR are automati-cally added to the XWIN-PLOT data set selector if XWIN-PLOT is started fromwithin XWIN-NMR. (Chapter 3.7 on page 19.)
• The settings made in the Attributes Selector can be loaded and saved.
• Additional help is provided by toolbar hints and startup tips. (Chapter 5.11.1 onpage 52.)
• The on-line help is based on the Acrobat Reader only.
• The stand-alone versions of XWIN-PLOT and AUTOPLOT were renamed toxwinplot and autoplot, resp.
12.2.7 Changes since XWIN-PLOT 1.4.0
• Text files can be loaded into a text object. (Refer to page 62 in chapter 6.1.4.)
• 2D projections can be scaled and scrolled using the 2D object editor. (Chapter6.2.2 on page 75.)

106 12.2 What‘s new?
DONE
INDEX
INDEX
12.2.8 Changes since XWIN-PLOT 1.3.0
12.2.8.1 New features
• The main window layout was changed in order two support two major editingmodes Basic and NMR.
• A special 2D editor, which includes a level editor, was added. (See Chapter6.2.2 on page 75.)
• A new object for displaying T1/T2-Fit curves was added. (See Chapter 6.1.11on page 70.)
• A facility to edit a list of data directories was added to the Portfolio Editor. (SeeChapter 5.6.2 on page 47.)
• The handling of RGB colors in the Attributes Selector dialog window was sim-plified.
12.2.8.2 Bug fixes
• EPSI objects created by particular PC programs were not always displayed cor-rectly. This bug has been fixed.
• Printing very large 2D spectra (e.g. on A0 size paper) required huge amounts ofmemory. This could cause the system to run out of swap space. This has beenfixed.
12.2.9 Changes since XWIN-PLOT 1.2.0
12.2.9.1 New features
• A new program called AUTOPLOT is supplied. With AUTOPLOT layouts can beprinted automatically without having to start XWIN-PLOT first. (See Chapter 2.)
• XWIN-PLOT and AUTOPLOT are now automatically started with the layout speci-fied by the parameter LAYOUT if started from XWIN-NMR. The LAYOUTparameter can be set with the XWIN-NMR edo command. (See Chapter 2.1 onpage 11.)
• White washed stacked plots are supported more directly. The stacked spectraobject editor provides a new option for setting the correct curve attributes. (See6.1.8 on page 67.)
• The Portfolio Editor supports appending of portfolio contents.

12.2 What‘s new? 107
DONE
INDEX
INDEX
• New devices were added to the Printer Setup.
• A section about EPSI import and export has been added to the manual. (SeeChapter 10.2 on page 96.)
• PostScript output created by XWIN-PLOT now works with programs like CorelDraw which have static limits for the maximum number of lines for a singleobject.
12.2.9.2 Bug fixes
• The scaling of FID objects did not always work. This bug has been fixed.
• Negative offsets with stacked plots now work correctly.
12.2.10 Changes since XWIN-PLOT 1.04
12.2.10.1 New features
• The XWIN-NMR interface dialog has been added. (See 3.9 on page 20.) With thisdialog it is possible to run XWIN-NMR commands from XWIN-PLOT (not for thestand-alone version).
• Get current data set gets the current XWIN-NMR data set. This command canbe combined with Reset and Reset + Print for fast layout printing. (See 8.1.2on page 88.)
• Update Data from Xwin-nmr updates all data used by the plot editor fromXWIN-NMR, i.e. all changes on the data sets done in XWIN-NMR are transferredto XWIN-PLOT. (See Chapter 3 on page 17).
• The Multi-Print dialog has been added. With this dialog a series of plots can becreated very easily. (See Chapter 8.2 on page 89.)
• The EPSI (= Encapsulated PostScript Interchange) object has been added. (SeeChapter 6.1.3 on page 60.)
• Text objects now can be adjusted not to change the font size then scaling by dis-abling Allow automatic font resize in the edit dialog. (See Chapter 6.1.5 onpage 63.) For the title and parameter object this is the default.
• By activating Use region file on reset on a spectrum (using the edit menu) thetext file reg in the processed data directory can be used to specify spectrumregions that will be used to determine y-scaling on a reset. (See Chapter 6.1.7on page 66.)
108 12.3 Known bugs
DONE
INDEX
INDEX
• By pressing the Alt key while expanding a 1D in expand mode (See Chapter5.2.2 on page 39.), portions of the spectra can be blown up according to thesetup in Global Setup. (See Chapter 5.11.1 on page 52.)
• If modifier keys (Shift, Ctrl, Alt) are pressed while scaling or moving spectra,the spectrum will not change its position. This allows for the use of a spectrumobject as a clipping window. (See Chapter 5.3.3 on page 42.)
• Pressing the right mouse button now automatically switches to mark mode,marks the object under the cursor and shows a popup menu which contains themost frequently used commands.
• Undo now can also undo zooming.
12.2.10.2 Bug fixes
• Titles without a newline character at the end did not work. This bug has beenfixed.
• A 2D spectrum object now can display the spectrum in a range larger then thespectrum range, e.g. a spectrum ranging from 0 to 127 points in x and y direc-tion can be displayed in a range of -100 to 300 points in x and y direction.
• Changing the units of 2D spectrum objects now changes the units of the projec-tions immediately.
• Scale bounding box on a 2D with projections now works.
• Under certain circumstances, the attribute selector did contain weird values,resulting for example in spectra being drawn with wrong line thickness or linestyle. This has been fixed.
• In expand mode, integrals are scaled properly now.
12.3 Known bugs
Due to the poor scaling mechanism of the X11 font scaler, text objects do notalways have a 100% WYSIWYG look. The width of text objects on the screenmay appear different from their width on the printer. This can result in text objectsto be clipped by the printer if the option Allow automatic font resize is enabledand the width of the text objects is made smaller. In this case the text object doesnot appear to be clipped on the display but it might be clipped by the printer.

DONE
INDEX
INDEX
INDEXNumerics1D/2D-Edit 722D Level Creator 762D Level Editor 76AAttributes 44AU Macro 91autoplot 14autoplot button 12Axes 66BBasic Editing Mode 60Blow-up 53Bruker
email 9ftp server 8WWW server 8
Bug reports 9CCharacter Chart 62Clear Clipboard 52Clipboard 51, 102Clipping window 42Color 56Copy 43CorelDraw 98Create Color Flow 77Creation modes 37Curve 66DData Set Selector 46Delete 42directory list 48EEdit Directory List 48Edit menu
Reset All Objects 89Reset Marked Objects 89
Email 102EPSI 60, 96Errors 105
EXPAND 73expand 39FFile menu
Abandon 49Close 49Close All 49New 49Open 49Save 49Save As 49
Font Size 46FrameMaker 98Full 40GGet from Clipboard 52Get Values 75Global Setup 52Grid 66Group 43IIntegral range file 18LLayout
file name syntax 15setup 53
Layouts 35Levels file 19Lower 43MMark All 42Marker Size 53Metafile 15, 93, 96, 98Multi-Print 89NNMR objects 38Number of Undo Steps 53OObject editors
1D editor 721D spectrum editor 66

DONE
INDEX
INDEX
1D stacked plot editor 672D projection object editor 692D spectrum editor 68arrow editor 60basic editor 60EPSI object editor 60graph editor 65NMR object editor 71NMR text object editor 78T1/T2 object editor 70text editor 62
On-line help 58Options
autoplot.stand 14Global Setup 52Layout Setup 30Printer Setup 23xwinplot.stand 13
Output Format 56PPaper Size 56Parameter listing 18Peak list 18Portfolio Editor 47
Append 48Clear 48Insert 48Remove 48
portfolio.por 48, 49Postscript 15, 93, 96Preview 51Preview Command 56Print 50, 101Print Command 56Printer Setup 54, 101
Load 58Save As 58Save As Default 58
Printer Type 54Put to Clipboard 51RRaise 43Recalculate Object Dimensions 63region file 19Reset 89Reset Action 83, 84Reusing layouts 87RGB Settings 44right mouse button popup 43
Rotate 43SScale Bounding Box 65Set Curve Attributes to White Wash 67Shortcuts 99Show
Clipboard 51Integrals 75Peaks 75Status Lines 53
Show Startup Hints 53Show Toolbar Hints 53Snap-In 54Split to X*Y Pages 56stacked plot 67stacking order 43TTitle 17To File 50UUndo 51Ungroup 43Use Values 75Wwarnings 105Windows Metafile 96, 102XX-Axes Offset 65XWIN-NMR Interface 20XWIN-NMR menu
Get Current Data Set 88Get Current Data Set + Reset 88Get Current Data Set + Reset + Print 88Update Data from XWIN-NMR 17
xwp 12xwpr 13YY-Axes Offset 65Zzoom 39Zoom In 40Zoom Out 40