Embed Size (px)
Citation preview

2011-12 School Accountability Report Card for Don Pedro Elementary Page 1 of 12
Don Pedro Elementary
School Accountability Report Card
Reported Using Data from the 2011-12 School Year
Published During 2012-13
Every school in California is required by state law to publish a School Accountability Report Card (SARC), by February 1 of each year. The SARC contains information about the condition and performance of each California public school. • For more information about SARC requirements, see the California Department of Education (CDE) SARC webpage at
http://www.cde.ca.gov/ta/ac/sa/. • For additional information about the school, parents and community members should contact the school principal or the district
office.
I. Data and Access
EdData Partnership Web Site EdData is a partnership of the CDE, EdSource, and the Fiscal Crisis Management and Assistance Team (FCMAT) that provides extensive financial, demographic, and performance information about California’s public kindergarten through grade twelve school districts and schools. DataQuest DataQuest is an online data tool located on the CDE DataQuest webpage at http://dq.cde.ca.gov/dataquest/ that contains additional information about this school and comparisons of the school to the district, the county, and the state. Specifically, DataQuest is a dynamic system that provides reports for accountability (e.g., state Academic Performance Index [API], federal Adequate Yearly Progress [AYP]), test data, enrollment, high school graduates, dropouts, course enrollments, staffing, and data regarding English learners. Internet Access Internet access is available at public libraries and other locations that are publicly accessible. Access to the Internet at libraries and public locations is generally provided on a first-come, first-served basis. Other use restrictions may include the hours of operation, the length of time that a workstation may be used (depending on availability), the types of software programs available on a workstation, and the ability to print documents.
II. About This School Contact Information (School Year 2012-13)
School Contact Information
School Name------- Don Pedro Elementary
Street------- 2300 Don Pedro Rd.
City, State, Zip------- Ceres, CA 95307-0307
Phone Number------- 209.556-1630
Principal------- Rick Hall
E-mail Address------- [email protected]
CDS Code------- 50-71043-6052443
2011-12 School Accountability Report Card for Don Pedro Elementary Page 2 of 12
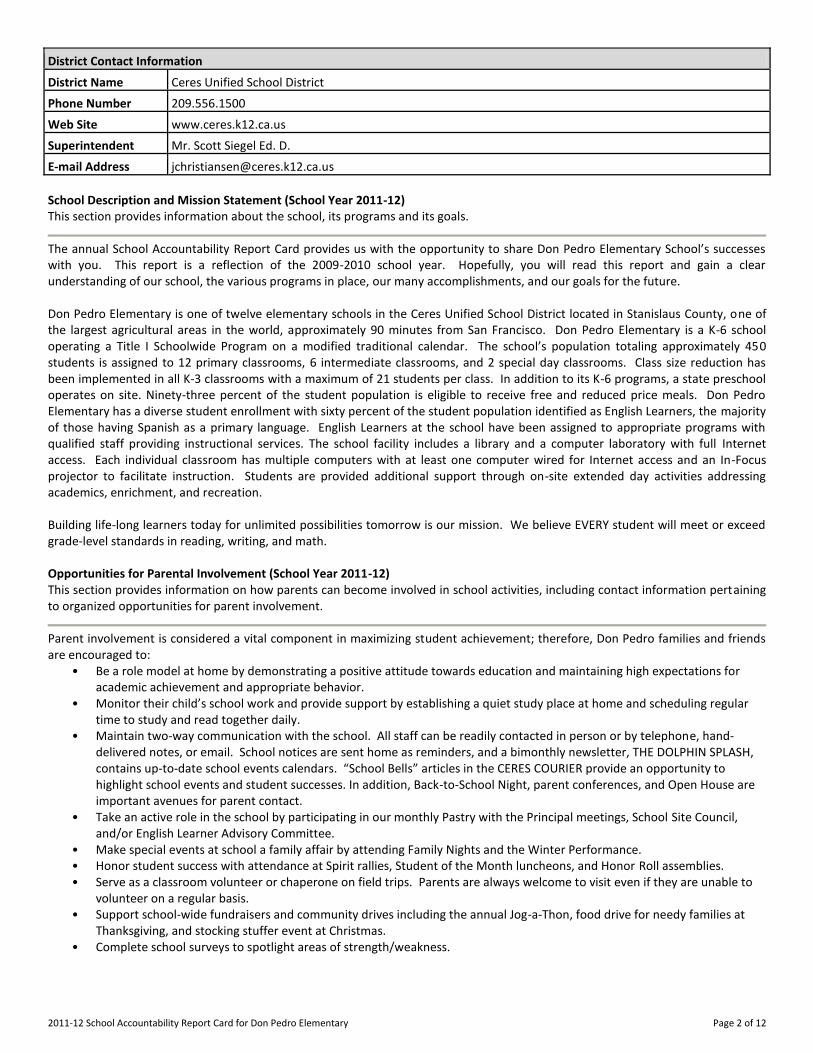
District Contact Information
District Name------- Ceres Unified School District
Phone Number------- 209.556.1500
Web Site------- www.ceres.k12.ca.us
Superintendent------- Mr. Scott Siegel Ed. D.
E-mail Address------- [email protected]
School Description and Mission Statement (School Year 2011-12) This section provides information about the school, its programs and its goals.
The annual School Accountability Report Card provides us with the opportunity to share Don Pedro Elementary School’s successes with you. This report is a reflection of the 2009-2010 school year. Hopefully, you will read this report and gain a clear understanding of our school, the various programs in place, our many accomplishments, and our goals for the future. Don Pedro Elementary is one of twelve elementary schools in the Ceres Unified School District located in Stanislaus County, one of the largest agricultural areas in the world, approximately 90 minutes from San Francisco. Don Pedro Elementary is a K-6 school operating a Title I Schoolwide Program on a modified traditional calendar. The school’s population totaling approximately 450 students is assigned to 12 primary classrooms, 6 intermediate classrooms, and 2 special day classrooms. Class size reduction has been implemented in all K-3 classrooms with a maximum of 21 students per class. In addition to its K-6 programs, a state preschool operates on site. Ninety-three percent of the student population is eligible to receive free and reduced price meals. Don Pedro Elementary has a diverse student enrollment with sixty percent of the student population identified as English Learners, the majority of those having Spanish as a primary language. English Learners at the school have been assigned to appropriate programs with qualified staff providing instructional services. The school facility includes a library and a computer laboratory with full Internet access. Each individual classroom has multiple computers with at least one computer wired for Internet access and an In-Focus projector to facilitate instruction. Students are provided additional support through on-site extended day activities addressing academics, enrichment, and recreation. Building life-long learners today for unlimited possibilities tomorrow is our mission. We believe EVERY student will meet or exceed grade-level standards in reading, writing, and math. Opportunities for Parental Involvement (School Year 2011-12) This section provides information on how parents can become involved in school activities, including contact information pertaining to organized opportunities for parent involvement.
Parent involvement is considered a vital component in maximizing student achievement; therefore, Don Pedro families and friends are encouraged to:
• Be a role model at home by demonstrating a positive attitude towards education and maintaining high expectations for academic achievement and appropriate behavior.
• Monitor their child’s school work and provide support by establishing a quiet study place at home and scheduling regular time to study and read together daily.
• Maintain two-way communication with the school. All staff can be readily contacted in person or by telephone, hand-delivered notes, or email. School notices are sent home as reminders, and a bimonthly newsletter, THE DOLPHIN SPLASH, contains up-to-date school events calendars. “School Bells” articles in the CERES COURIER provide an opportunity to highlight school events and student successes. In addition, Back-to-School Night, parent conferences, and Open House are important avenues for parent contact.
• Take an active role in the school by participating in our monthly Pastry with the Principal meetings, School Site Council, and/or English Learner Advisory Committee.
• Make special events at school a family affair by attending Family Nights and the Winter Performance. • Honor student success with attendance at Spirit rallies, Student of the Month luncheons, and Honor Roll assemblies. • Serve as a classroom volunteer or chaperone on field trips. Parents are always welcome to visit even if they are unable to
volunteer on a regular basis. • Support school-wide fundraisers and community drives including the annual Jog-a-Thon, food drive for needy families at
Thanksgiving, and stocking stuffer event at Christmas. • Complete school surveys to spotlight areas of strength/weakness.
2011-12 School Accountability Report Card for Don Pedro Elementary Page 3 of 12
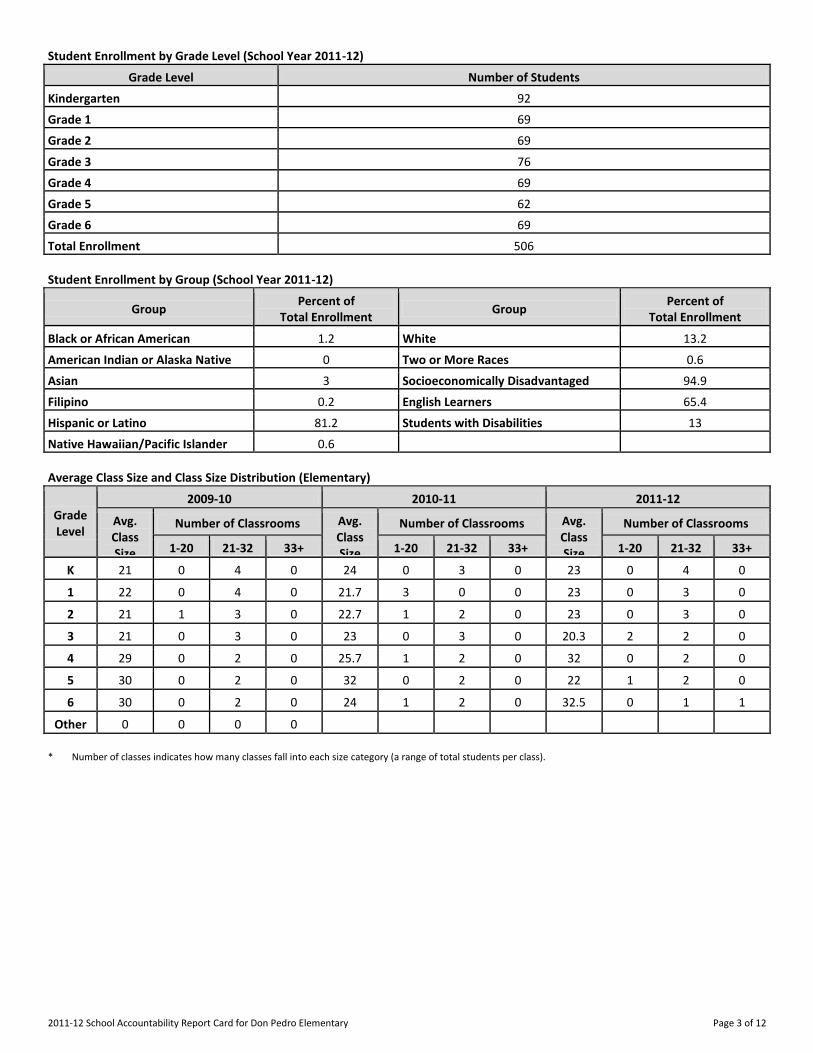
Student Enrollment by Grade Level (School Year 2011-12)
Grade Level Number of Students
Kindergarten------- 92
Grade 1------- 69
Grade 2------- 69
Grade 3------- 76
Grade 4------- 69
Grade 5------- 62
Grade 6------- 69
Total Enrollment------- 506
Student Enrollment by Group (School Year 2011-12)
Group Percent of
Total Enrollment Group
Percent of Total Enrollment
Black or African American------- 1.2 White 13.2
American Indian or Alaska Native-------
0 Two or More Races 0.6
Asian------- 3 Socioeconomically Disadvantaged 94.9
Filipino------- 0.2 English Learners 65.4
Hispanic or Latino------- 81.2 Students with Disabilities 13
Native Hawaiian/Pacific Islander 0.6
Average Class Size and Class Size Distribution (Elementary)
Grade Level
2009-10 2010-11 2011-12
Avg. Class Size
Number of Classrooms Avg. Class Size
Number of Classrooms Avg. Class Size
Number of Classrooms
1-20 21-32 33+ 1-20 21-32 33+ 1-20 21-32 33+
K ----------
21 0 4 0 24 0 3 0 23 0 4 0
1 ----------
22 0 4 0 21.7 3 0 0 23 0 3 0
2 ----------
21 1 3 0 22.7 1 2 0 23 0 3 0
3 ----------
21 0 3 0 23 0 3 0 20.3 2 2 0
4 ----------
29 0 2 0 25.7 1 2 0 32 0 2 0
5 ----------
30 0 2 0 32 0 2 0 22 1 2 0
6 ----------
30 0 2 0 24 1 2 0 32.5 0 1 1
Other ----------
0 0 0 0
* Number of classes indicates how many classes fall into each size category (a range of total students per class).

2011-12 School Accountability Report Card for Don Pedro Elementary Page 4 of 12
III. School Climate
School Safety Plan (School Year 2011-12) This section provides information about the school’s comprehensive safety plan, including the dates on which the safety plan was last reviewed, updated, and discussed with faculty; as well as a brief description of the key elements of the plan.
A comprehensive school safety plan is maintained with reviews conducted annually. The Plan includes a detailed Incident Management Team Handbook which specifies the following:
• Emergency telephone numbers • Incident Management Team members • General crisis response procedures • Incident Management Team responsibilities • Guidelines/emergency codes • Procedures for evacuations • Procedure for drop, cover, and hold • Procedure for Code Three—lockdowns • Procedures for terrorist threat conditions • Emergency utility shut-off locations • Evacuation routes • Staging areas • Crisis response checklist
The Plan outlines annual goals in the area of school climate and physical environment. Furthermore, District policy is delineated regarding sexual harassment, child abuse reporting, expulsions/ suspensions, teacher notification regarding students engaged in acts described in 48900, dress code, hate crises, and conduct code. Suspensions and Expulsions
Rate* School District
2009-10 2010-11 2011-12 2009-10 2010-11 2011-12
Suspensions------- 16.7 31.42 26.51 21.96 20.45 23.79
Expulsions------- 0 0.21 0 0.57 0.72 .58
* The rate of suspensions and expulsions is calculated by dividing the total number of incidents by the total enrollment (and multiplying by 100).
IV. School Facilities
School Facility Conditions and Planned Improvements (School Year 2012-13) This section provides information from the most recent Facility Inspection Tool (FIT) data (or equivalent), including: • Description of the safety, cleanliness, and adequacy of the school facility • Description of any planned or recently completed facility improvements • The year and month in which the data were collected • Description of any needed maintenance to ensure good repair
Year and month in which data were collected: The school underwent modernization during the 2006-07 school year with the addition of five new classrooms and the relocation of 10 classrooms. The kindergarten wing was provided a new playground, and the primary yard was expanded to include a soccer field and new playground equipment. New basketball courts were installed in the intermediate yard. The planning process has begun to build a new office wing, as well as replacing portables in the third grade wing by 2012. The exterior of the school was painted and changed to a "softer" color in Spring, 2010.
2011-12 School Accountability Report Card for Don Pedro Elementary Page 5 of 12
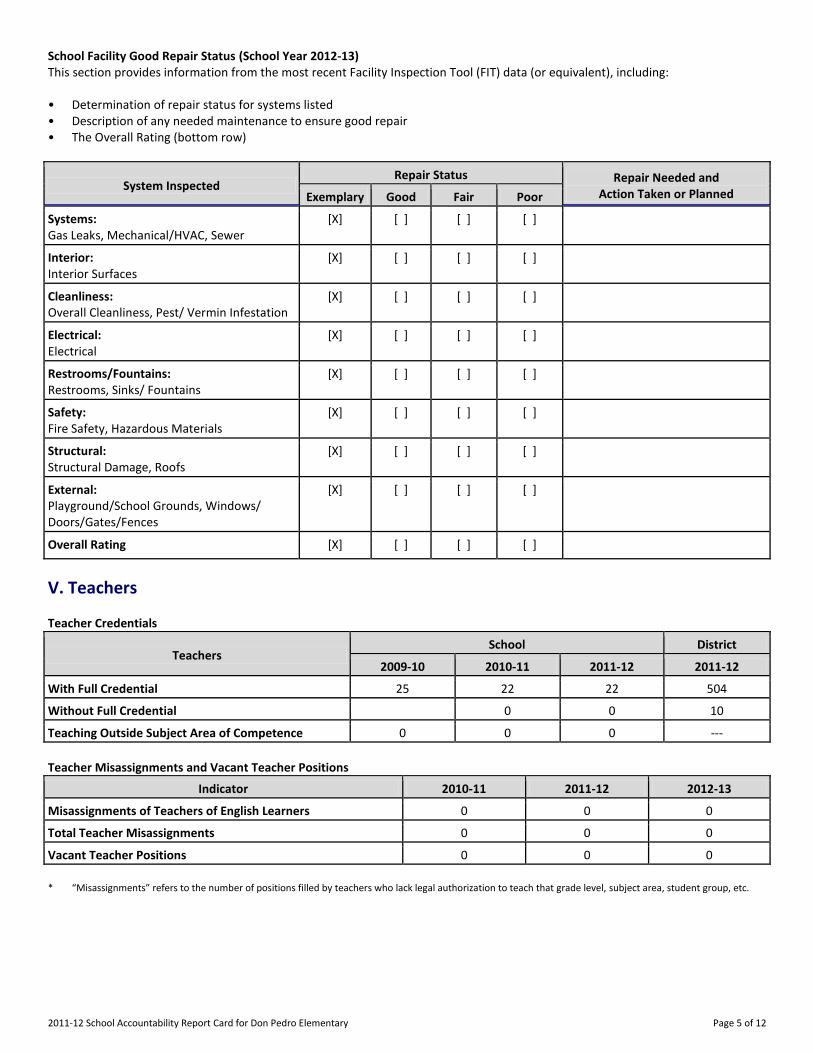
School Facility Good Repair Status (School Year 2012-13) This section provides information from the most recent Facility Inspection Tool (FIT) data (or equivalent), including: • Determination of repair status for systems listed • Description of any needed maintenance to ensure good repair • The Overall Rating (bottom row)
System Inspected Repair Status Repair Needed and
Action Taken or Planned Exemplary Good Fair Poor
Systems: Gas Leaks, Mechanical/HVAC, Sewer
[X] [ ] [ ] [ ]
Interior: Interior Surfaces
[X] [ ] [ ] [ ]
Cleanliness: Overall Cleanliness, Pest/ Vermin Infestation
[X] [ ] [ ] [ ]
Electrical: Electrical
[X] [ ] [ ] [ ]
Restrooms/Fountains: Restrooms, Sinks/ Fountains
[X] [ ] [ ] [ ]
Safety: Fire Safety, Hazardous Materials
[X] [ ] [ ] [ ]
Structural: Structural Damage, Roofs
[X] [ ] [ ] [ ]
External: Playground/School Grounds, Windows/ Doors/Gates/Fences
[X] [ ] [ ] [ ]
Overall Rating [X] [ ] [ ] [ ]
V. Teachers
Teacher Credentials
Teachers School District
2009-10 2010-11 2011-12 2011-12
With Full Credential 25 22 22 504
Without Full Credential 0 0 10
Teaching Outside Subject Area of Competence 0 0 0 ---
Teacher Misassignments and Vacant Teacher Positions
Indicator 2010-11 2011-12 2012-13
Misassignments of Teachers of English Learners 0 0 0
Total Teacher Misassignments 0 0 0
Vacant Teacher Positions 0 0 0
* “Misassignments” refers to the number of positions filled by teachers who lack legal authorization to teach that grade level, subject area, student group, etc.
2011-12 School Accountability Report Card for Don Pedro Elementary Page 6 of 12
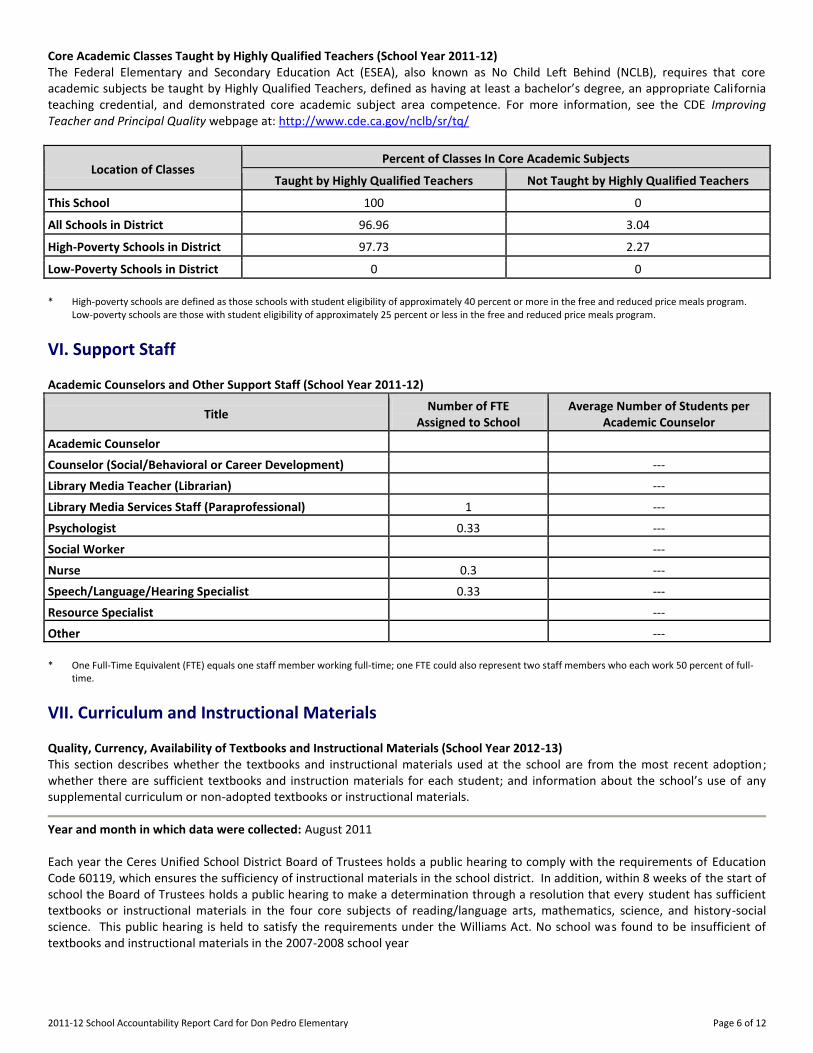
Core Academic Classes Taught by Highly Qualified Teachers (School Year 2011-12) The Federal Elementary and Secondary Education Act (ESEA), also known as No Child Left Behind (NCLB), requires that core academic subjects be taught by Highly Qualified Teachers, defined as having at least a bachelor’s degree, an appropriate California teaching credential, and demonstrated core academic subject area competence. For more information, see the CDE Improving Teacher and Principal Quality webpage at: http://www.cde.ca.gov/nclb/sr/tq/
Location of Classes Percent of Classes In Core Academic Subjects
Taught by Highly Qualified Teachers Not Taught by Highly Qualified Teachers
This School 100 0
All Schools in District 96.96 3.04
High-Poverty Schools in District 97.73 2.27
Low-Poverty Schools in District 0 0
* High-poverty schools are defined as those schools with student eligibility of approximately 40 percent or more in the free and reduced price meals program.
Low-poverty schools are those with student eligibility of approximately 25 percent or less in the free and reduced price meals program.
VI. Support Staff
Academic Counselors and Other Support Staff (School Year 2011-12)
Title Number of FTE
Assigned to School Average Number of Students per
Academic Counselor
Academic Counselor-------
Counselor (Social/Behavioral or Career Development) ---
Library Media Teacher (Librarian) ---
Library Media Services Staff (Paraprofessional) 1 ---
Psychologist------- 0.33 ---
Social Worker------- ---
Nurse------- 0.3 ---
Speech/Language/Hearing Specialist 0.33 ---
Resource Specialist------- ---
Other------- ---
* One Full-Time Equivalent (FTE) equals one staff member working full-time; one FTE could also represent two staff members who each work 50 percent of full-
time.
VII. Curriculum and Instructional Materials
Quality, Currency, Availability of Textbooks and Instructional Materials (School Year 2012-13) This section describes whether the textbooks and instructional materials used at the school are from the most recent adoption; whether there are sufficient textbooks and instruction materials for each student; and information about the school’s use of any supplemental curriculum or non-adopted textbooks or instructional materials.
Year and month in which data were collected: August 2011 Each year the Ceres Unified School District Board of Trustees holds a public hearing to comply with the requirements of Education Code 60119, which ensures the sufficiency of instructional materials in the school district. In addition, within 8 weeks of the start of school the Board of Trustees holds a public hearing to make a determination through a resolution that every student has sufficient textbooks or instructional materials in the four core subjects of reading/language arts, mathematics, science, and history-social science. This public hearing is held to satisfy the requirements under the Williams Act. No school was found to be insufficient of textbooks and instructional materials in the 2007-2008 school year
2011-12 School Accountability Report Card for Don Pedro Elementary Page 7 of 12
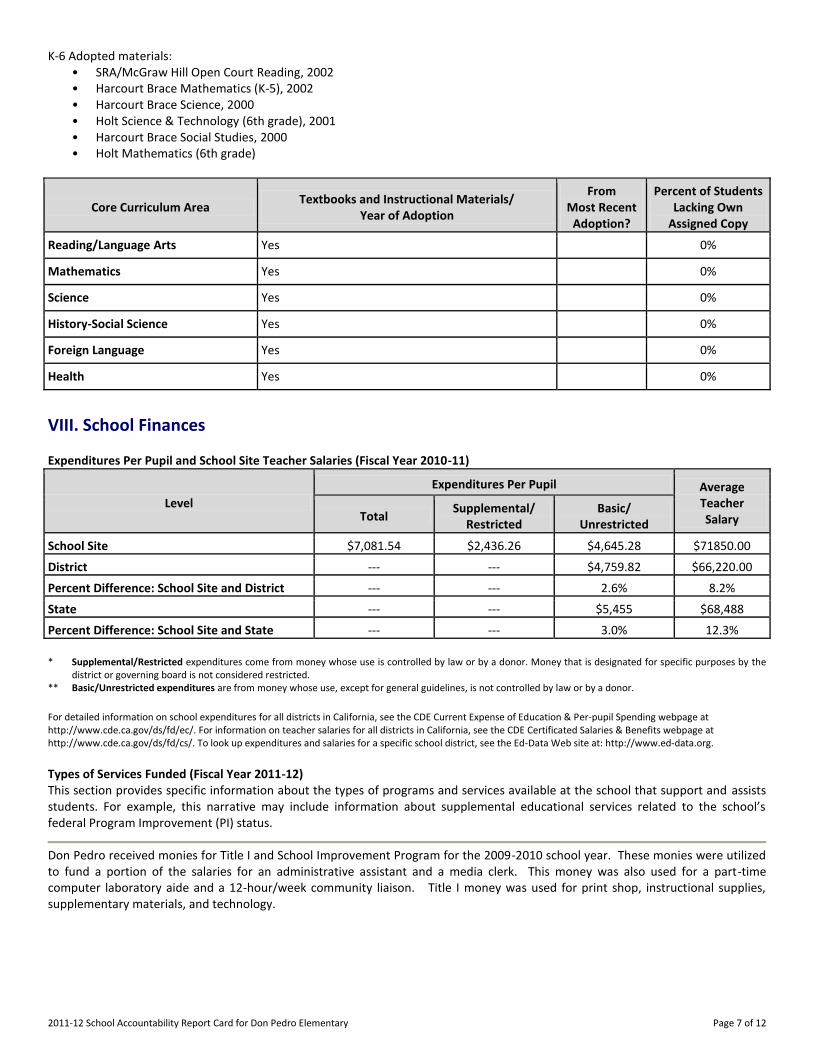
K-6 Adopted materials: • SRA/McGraw Hill Open Court Reading, 2002 • Harcourt Brace Mathematics (K-5), 2002 • Harcourt Brace Science, 2000 • Holt Science & Technology (6th grade), 2001 • Harcourt Brace Social Studies, 2000 • Holt Mathematics (6th grade)
Core Curriculum Area Textbooks and Instructional Materials/
Year of Adoption
From Most Recent
Adoption?
Percent of Students Lacking Own
Assigned Copy
Reading/Language Arts Yes 0%
Mathematics Yes 0%
Science------- Yes 0%
History-Social Science Yes 0%
Foreign Language Yes 0%
Health------- Yes 0%
VIII. School Finances
Expenditures Per Pupil and School Site Teacher Salaries (Fiscal Year 2010-11)
Level
Expenditures Per Pupil Average Teacher Salary Total
Supplemental/ Restricted
Basic/ Unrestricted
School Site------- $7,081.54 $2,436.26 $4,645.28 $71850.00
District------- --- --- $4,759.82 $66,220.00
Percent Difference: School Site and District --- --- 2.6% 8.2%
State------- --- --- $5,455 $68,488
Percent Difference: School Site and State --- --- 3.0% 12.3%
* Supplemental/Restricted expenditures come from money whose use is controlled by law or by a donor. Money that is designated for specific purposes by the
district or governing board is not considered restricted. ** Basic/Unrestricted expenditures are from money whose use, except for general guidelines, is not controlled by law or by a donor. For detailed information on school expenditures for all districts in California, see the CDE Current Expense of Education & Per-pupil Spending webpage at http://www.cde.ca.gov/ds/fd/ec/. For information on teacher salaries for all districts in California, see the CDE Certificated Salaries & Benefits webpage at http://www.cde.ca.gov/ds/fd/cs/. To look up expenditures and salaries for a specific school district, see the Ed-Data Web site at: http://www.ed-data.org. Types of Services Funded (Fiscal Year 2011-12) This section provides specific information about the types of programs and services available at the school that support and assists students. For example, this narrative may include information about supplemental educational services related to the school’s federal Program Improvement (PI) status.
Don Pedro received monies for Title I and School Improvement Program for the 2009-2010 school year. These monies were utilized to fund a portion of the salaries for an administrative assistant and a media clerk. This money was also used for a part-time computer laboratory aide and a 12-hour/week community liaison. Title I money was used for print shop, instructional supplies, supplementary materials, and technology.
2011-12 School Accountability Report Card for Don Pedro Elementary Page 8 of 12
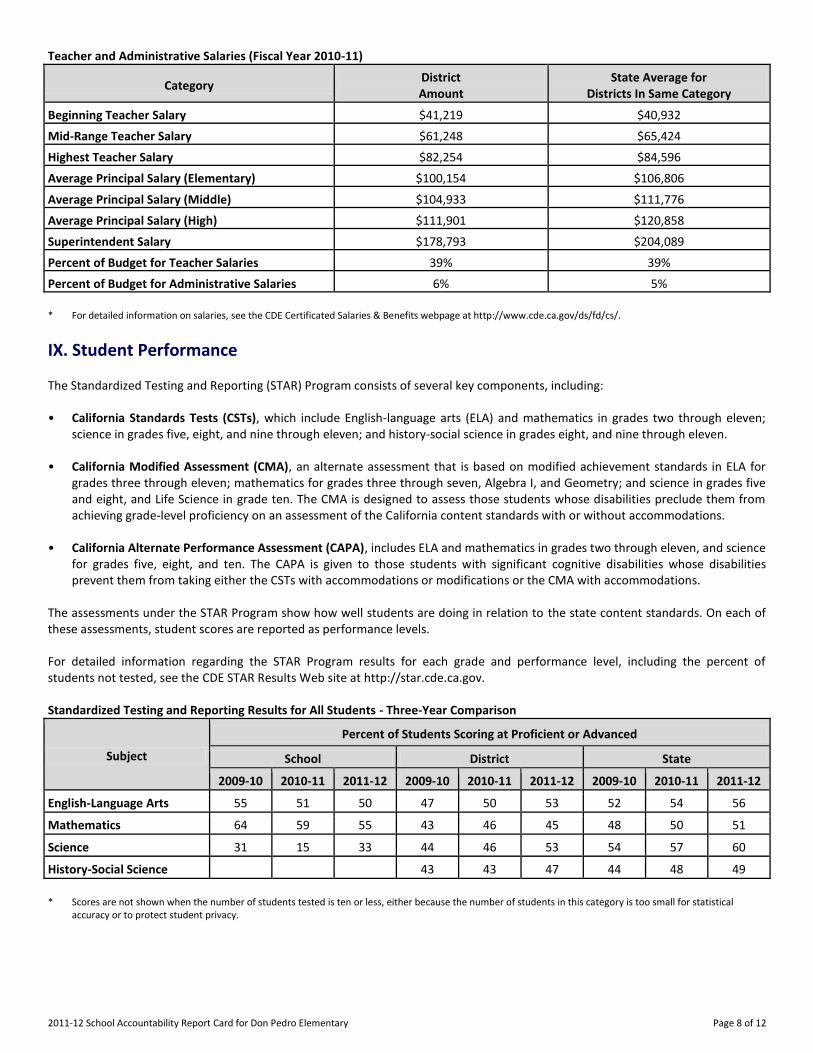
Teacher and Administrative Salaries (Fiscal Year 2010-11)
Category District Amount
State Average for Districts In Same Category
Beginning Teacher Salary $41,219 $40,932
Mid-Range Teacher Salary $61,248 $65,424
Highest Teacher Salary $82,254 $84,596
Average Principal Salary (Elementary) $100,154 $106,806
Average Principal Salary (Middle) $104,933 $111,776
Average Principal Salary (High) $111,901 $120,858
Superintendent Salary $178,793 $204,089
Percent of Budget for Teacher Salaries 39% 39%
Percent of Budget for Administrative Salaries 6% 5%
* For detailed information on salaries, see the CDE Certificated Salaries & Benefits webpage at http://www.cde.ca.gov/ds/fd/cs/.
IX. Student Performance
The Standardized Testing and Reporting (STAR) Program consists of several key components, including: • California Standards Tests (CSTs), which include English-language arts (ELA) and mathematics in grades two through eleven;
science in grades five, eight, and nine through eleven; and history-social science in grades eight, and nine through eleven. • California Modified Assessment (CMA), an alternate assessment that is based on modified achievement standards in ELA for
grades three through eleven; mathematics for grades three through seven, Algebra I, and Geometry; and science in grades five and eight, and Life Science in grade ten. The CMA is designed to assess those students whose disabilities preclude them from achieving grade-level proficiency on an assessment of the California content standards with or without accommodations.
• California Alternate Performance Assessment (CAPA), includes ELA and mathematics in grades two through eleven, and science
for grades five, eight, and ten. The CAPA is given to those students with significant cognitive disabilities whose disabilities prevent them from taking either the CSTs with accommodations or modifications or the CMA with accommodations.
The assessments under the STAR Program show how well students are doing in relation to the state content standards. On each of these assessments, student scores are reported as performance levels. For detailed information regarding the STAR Program results for each grade and performance level, including the percent of students not tested, see the CDE STAR Results Web site at http://star.cde.ca.gov. Standardized Testing and Reporting Results for All Students - Three-Year Comparison
Subject
Percent of Students Scoring at Proficient or Advanced
School District State
2009-10 2010-11 2011-12 2009-10 2010-11 2011-12 2009-10 2010-11 2011-12
English-Language Arts 55 51 50 47 50 53 52 54 56
Mathematics------- 64 59 55 43 46 45 48 50 51
Science------- 31 15 33 44 46 53 54 57 60
History-Social Science 43 43 47 44 48 49
* Scores are not shown when the number of students tested is ten or less, either because the number of students in this category is too small for statistical
accuracy or to protect student privacy.

2011-12 School Accountability Report Card for Don Pedro Elementary Page 9 of 12
Standardized Testing and Reporting Results by Student Group - Most Recent Year
Group Percent of Students Scoring at Proficient or Advanced
English-Language Arts Mathematics Science History-Social Science
All Students in the LEA 53 45 53 47
All Student at the School 50 55 33
Male------- 46 57 36
Female------- 53 53 30
Black or African American
American Indian or Alaska Native
Asian------- 31 46
Filipino-------
Hispanic or Latino 50 55 30
Native Hawaiian/Pacific Islander
White------- 57 62
Two or More Races-------
Socioeconomically Disadvantaged 49 55 35
English Learners------- 44 51 15
Students with Disabilities 28 32
Students Receiving Migrant Education Services 50 50
* Scores are not shown when the number of students tested is ten or less, either because the number of students in this category is too small for statistical
accuracy or to protect student privacy. California Physical Fitness Test Results (School Year 2011-12) The California Physical Fitness Test (PFT) is administered to students in grades five, seven, and nine only. This table displays by grade level the percent of students meeting the fitness standards for the most recent testing period. For detailed information regarding this test, and comparisons of a school’s test results to the district and state, see the CDE PFT webpage at http://www.cde.ca.gov/ta/tg/pf/.
Grade Level
Percent of Students Meeting Fitness Standards
Four of Six Standards Five of Six Standards Six of Six Standards
-------5------- 27.6 22.4 27.6
* Scores are not shown when the number of students tested is ten or less, either because the number of students in this category is too small for statistical
accuracy or to protect student privacy.
X. Accountability
Academic Performance Index The Academic Performance Index (API) is an annual measure of state academic performance and progress of schools in California. API scores range from 200 to 1,000, with a statewide target of 800. For detailed information about the API, see the CDE API webpage at http://www.cde.ca.gov/ta/ac/ap/. Academic Performance Index Ranks - Three-Year Comparison This table displays the school’s statewide and similar schools’ API ranks. The statewide API rank ranges from 1 to 10. A statewide rank of 1 means that the school has an API score in the lowest ten percent of all schools in the state, while a statewide rank of 10 means that the school has an API score in the highest ten percent of all schools in the state.
2011-12 School Accountability Report Card for Don Pedro Elementary Page 10 of 12
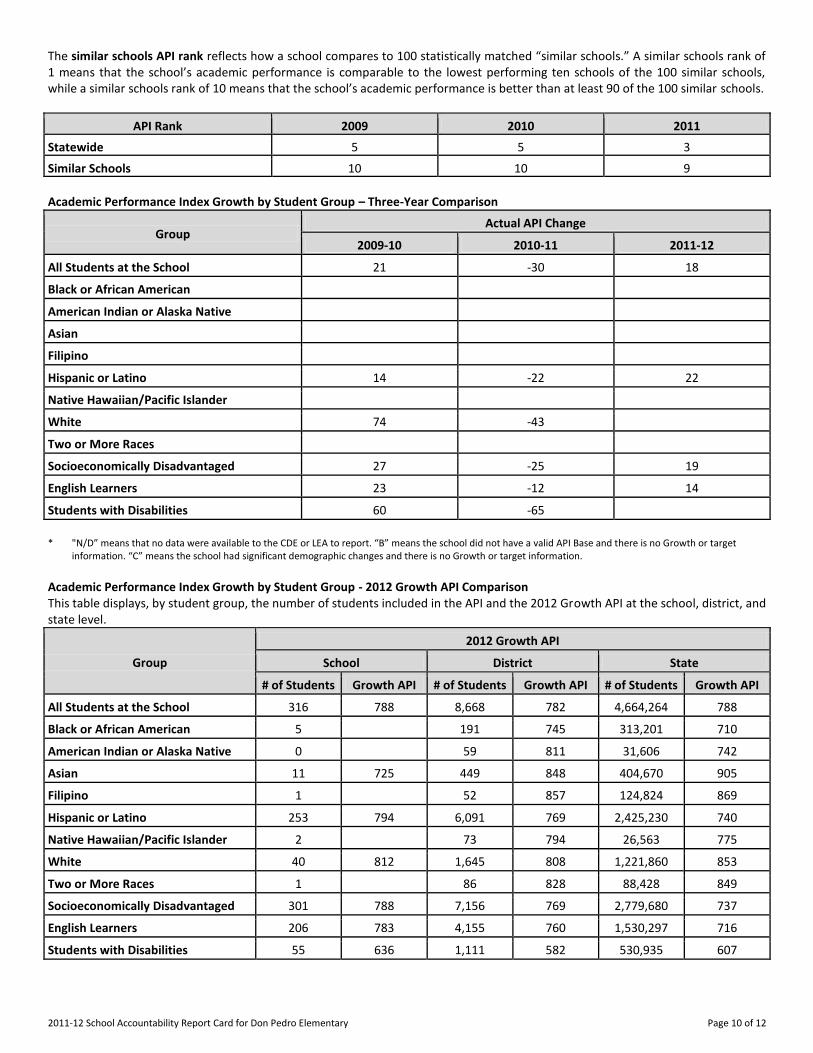
The similar schools API rank reflects how a school compares to 100 statistically matched “similar schools.” A similar schools rank of 1 means that the school’s academic performance is comparable to the lowest performing ten schools of the 100 similar schools, while a similar schools rank of 10 means that the school’s academic performance is better than at least 90 of the 100 similar schools.
API Rank 2009 2010 2011
Statewide------- 5 5 3
Similar Schools------- 10 10 9
Academic Performance Index Growth by Student Group – Three-Year Comparison
Group Actual API Change
2009-10 2010-11 2011-12
All Students at the School 21 -30 18
Black or African American
American Indian or Alaska Native
Asian-------
Filipino-------
Hispanic or Latino 14 -22 22
Native Hawaiian/Pacific Islander
White------- 74 -43
Two or More Races
Socioeconomically Disadvantaged 27 -25 19
English Learners 23 -12 14
Students with Disabilities 60 -65
* "N/D” means that no data were available to the CDE or LEA to report. “B” means the school did not have a valid API Base and there is no Growth or target
information. “C” means the school had significant demographic changes and there is no Growth or target information.
Academic Performance Index Growth by Student Group - 2012 Growth API Comparison This table displays, by student group, the number of students included in the API and the 2012 Growth API at the school, district, and state level.
Group
2012 Growth API
School District State
# of Students Growth API # of Students Growth API # of Students Growth API
All Students at the School 316 788 8,668 782 4,664,264 788
Black or African American 5 191 745 313,201 710
American Indian or Alaska Native 0 59 811 31,606 742
Asian------- 11 725 449 848 404,670 905
Filipino------- 1 52 857 124,824 869
Hispanic or Latino 253 794 6,091 769 2,425,230 740
Native Hawaiian/Pacific Islander 2 73 794 26,563 775
White------- 40 812 1,645 808 1,221,860 853
Two or More Races 1 86 828 88,428 849
Socioeconomically Disadvantaged 301 788 7,156 769 2,779,680 737
English Learners 206 783 4,155 760 1,530,297 716
Students with Disabilities 55 636 1,111 582 530,935 607
2011-12 School Accountability Report Card for Don Pedro Elementary Page 11 of 12
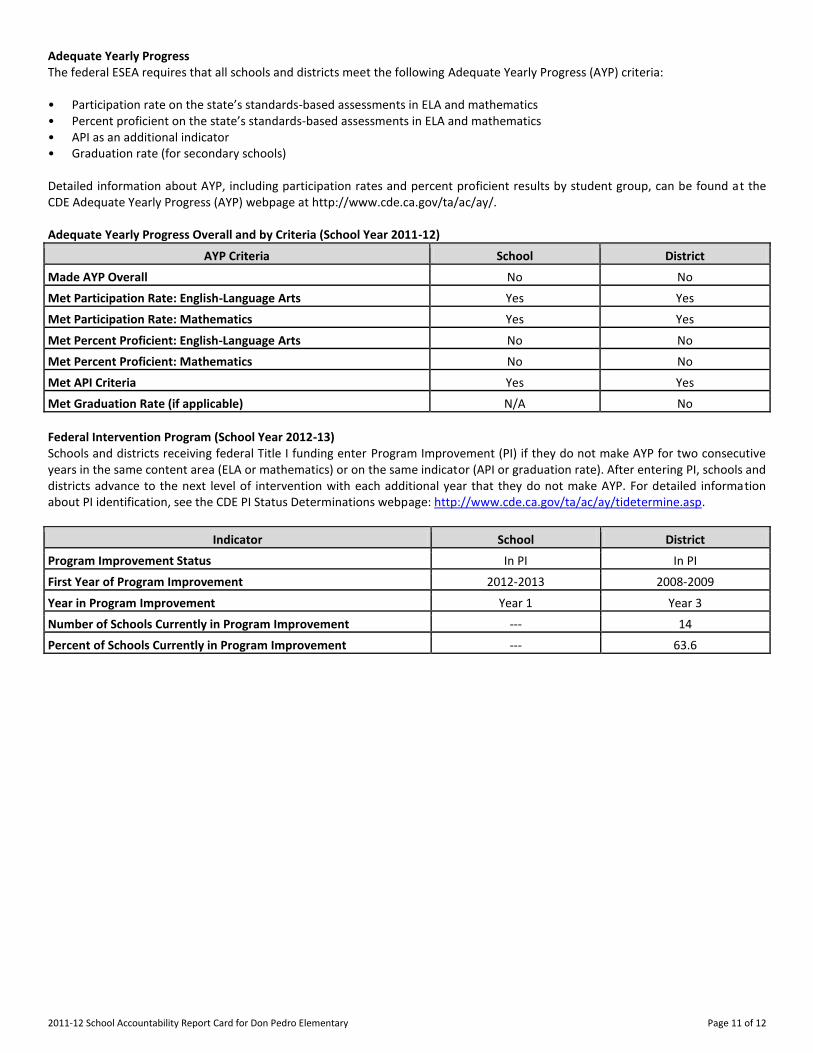
Adequate Yearly Progress The federal ESEA requires that all schools and districts meet the following Adequate Yearly Progress (AYP) criteria: • Participation rate on the state’s standards-based assessments in ELA and mathematics • Percent proficient on the state’s standards-based assessments in ELA and mathematics • API as an additional indicator • Graduation rate (for secondary schools) Detailed information about AYP, including participation rates and percent proficient results by student group, can be found at the CDE Adequate Yearly Progress (AYP) webpage at http://www.cde.ca.gov/ta/ac/ay/. Adequate Yearly Progress Overall and by Criteria (School Year 2011-12)
AYP Criteria School District
Made AYP Overall No No
Met Participation Rate: English-Language Arts Yes Yes
Met Participation Rate: Mathematics Yes Yes
Met Percent Proficient: English-Language Arts No No
Met Percent Proficient: Mathematics No No
Met API Criteria Yes Yes
Met Graduation Rate (if applicable) N/A No
Federal Intervention Program (School Year 2012-13) Schools and districts receiving federal Title I funding enter Program Improvement (PI) if they do not make AYP for two consecutive years in the same content area (ELA or mathematics) or on the same indicator (API or graduation rate). After entering PI, schools and districts advance to the next level of intervention with each additional year that they do not make AYP. For detailed information about PI identification, see the CDE PI Status Determinations webpage: http://www.cde.ca.gov/ta/ac/ay/tidetermine.asp.
Indicator School District
Program Improvement Status In PI In PI
First Year of Program Improvement 2012-2013 2008-2009
Year in Program Improvement Year 1 Year 3
Number of Schools Currently in Program Improvement --- 14
Percent of Schools Currently in Program Improvement --- 63.6
2011-12 School Accountability Report Card for Don Pedro Elementary Page 12 of 12
XI. Instructional Planning and Scheduling
Professional Development This section provides information on the number of days provided for professional development and continuous professional growth in the most recent three year period. Questions that may be answered include: • What are the primary/major areas of focus for staff development and specifically how were they selected? For example, were
student achievement data used to determine the need for professional development in reading instruction? • What are the methods by which professional development is delivered (e.g., after school workshops, conference attendance,
individual mentoring, etc.)? • How are teachers supported during implementation (e.g., through in-class coaching, teacher-principal meetings, student
performance, and data reporting, etc.)?
Staff development is a critical component to teacher and student success, and Ceres Unified School District is dedicated to a variety of professional development opportunities for staff. Every other Monday after school is dedicated to department and grade level meeting times, for teachers to collaborate, learn strategies, and develop action plans to meet identified student needs. Professional Development days have afforded teachers the opportunity to receive additional training related to Holt Gr. 6 Mathematics and implementation of district instructional norms to maximize student engagement during instruction. In addition, District coaches have provided classroom demonstrations and workshops upon request in support of the school’s established goals. Classroom visitations have been equally valuable giving grade-level teams the time to view curricular areas of interest and debrief during a subsequent planning time. The District participates in BTSA, AB 466, and other county and state approved formal training programs dedicated to improving teacher quality. In addition, the district fully supports classroom teachers with a cadre of full time staff developer/coaches who can assist with the implementation of curriculum and strategies. School sites must include a professional development plan and budget in their school site plan. Activities can include attendance at summer institutes, after school or Saturday workshops, teacher release days to attend conferences, and grade level or department release days for in depth professional development. All professional development is aligned to the district strategic plan. The goal of all professional development is to increase student achievement.