Embed Size (px)
Citation preview
Dominique Toupin, Ericsson
© Ericsson AB 2014 | 2014-09-29 | Page 2
› Tool Manager at Ericsson, helping Ericsson sites to develop better software efficiently
› Telecommunication systems – Open, standards-based common
platform – High availability, 99.999 % – Broad range of support for both
infrastructure and value-added applications
– Multimedia, network and application processing capabilities
About me
I do not sell processors or tools
© Ericsson AB 2014 | 2014-09-29 | Page 3
› Single core to multicore makes it harder:
Race conditions, Deadlocks, Non-deterministic behavior
› Many layers makes it worst: Middleware, VM, OS, hypervisor, sometimes across nodes or clusters
› Debuggers are invaluable for algorithm issues but they fall
short for the above category of problems, not to mention that some problems are not reproducible in the developer’s environment!
difficult-to-find bugs
© Ericsson AB 2014 | 2014-09-29 | Page 4
Heterogeneous Trace Correlation
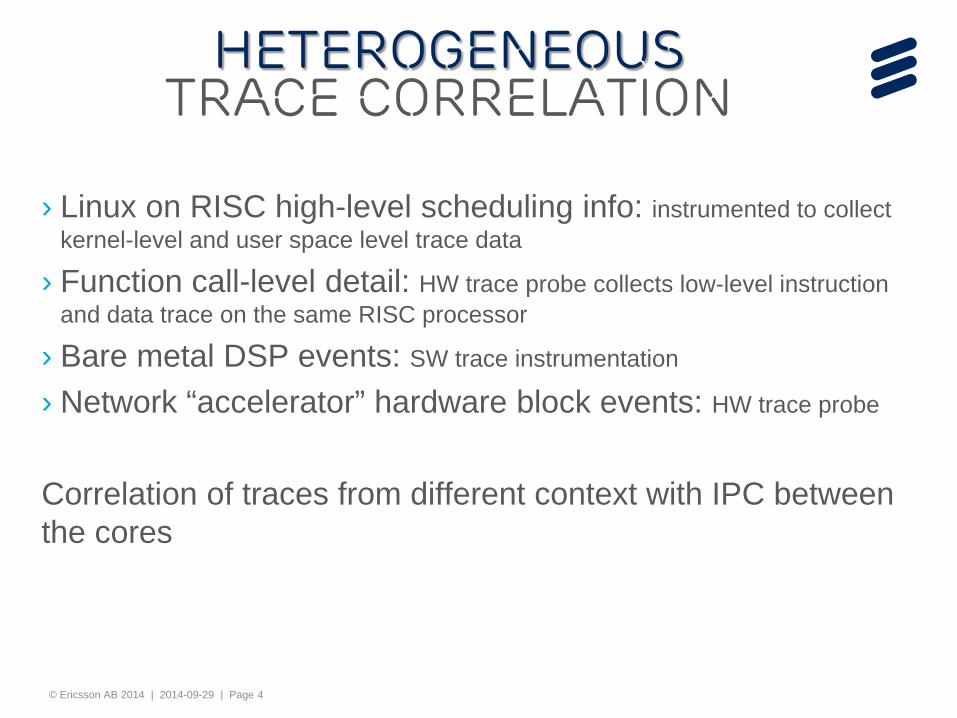
› Linux on RISC high-level scheduling info: instrumented to collect
kernel-level and user space level trace data
› Function call-level detail: HW trace probe collects low-level instruction and data trace on the same RISC processor
› Bare metal DSP events: SW trace instrumentation
› Network “accelerator” hardware block events: HW trace probe
Correlation of traces from different context with IPC between the cores
© Ericsson AB 2014 | 2014-09-29 | Page 5
Tracing Usefulness
› Tracing instead of logging to minimize impact on system behaviour
› Performance tuning
› Monitoring of live systems
Extreme cases and simple one: Linux Kernel, ust database
© Ericsson AB 2014 | 2014-09-29 | Page 6
› Log Levels Assigned to static tracepoints, with a verbosity level: 0 less verbose to 14, most verbose
› Wildcards Enable all events under certain hierarchy level: * for all events, libc_* for all events within libc, etc.
The combination of wildcards and loglevels allow users to gradually enable more specific instrumentation, and increase the verbosity level, as they narrow-down the source of their problem.
› Filtering Filtering on specific event fields allow use-cases such as following a call-id
A Trace use case
© Ericsson AB 2014 | 2014-09-29 | Page 7
› Started as Tracing and Monitoring Framework (TMF)
› Initially for LTTng traces
› Used to be under Eclipse Linux Tools Project
› New project Trace Compass at Eclipse Foundation –To increase community and collaboration in open-source –Keep the momentum going!
© Ericsson AB 2014 | 2014-09-29 | Page 8
› Framework to build trace visualization and analysis tools
› Scalability allows to handle traces exceeding memory
› Enables trace analysis and correlation from different sources
› Extensible for any trace or log format –Binary, text, XML etc.
© Ericsson AB 2014 | 2014-09-29 | Page 9
› Built-in trace parsers –Common Trace Format (CTF)
› Multi-Core Association Tool Infrastructure Workgroup › Used by LTTng Tracer for Linux Kernel and UST › Reviewed by Linux kernel developers
–Packet Capture (libPcap) › Used for IP network tracing
–Best Trace Format (BTF)
› Available as standalone application or set of plug-ins
© Ericsson AB 2014 | 2014-09-29 | Page 10
What Trace Compass provides (for plug-in developerS) › A trace and event data model › Event request handling with coalescing › Extension point to add new trace types › Reusable views and widgets
– E.g Time Graphs (Gantt-charts), X-Y-plots › Integration into common navigator framework (e.g. project explorer)
› An event filter model › Signal broadcasting between components › Time window and event synchronization › Generic state system › Sequence diagram framework
© Ericsson AB 2014 | 2014-09-29 | Page 11
© Ericsson AB 2014 | 2014-09-29 | Page 12
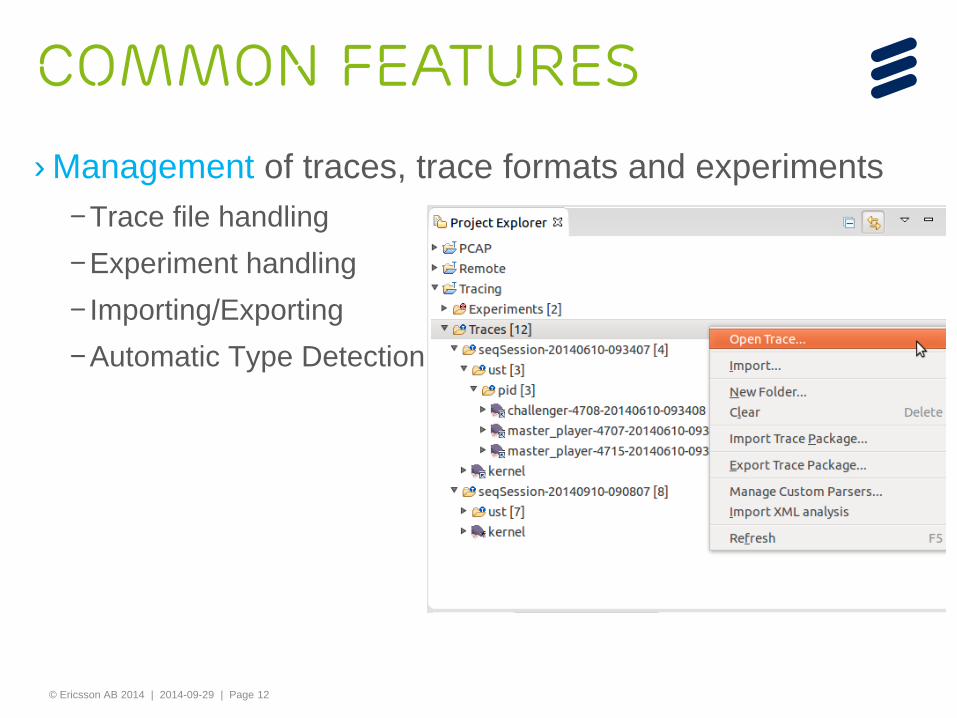
Common Features
› Management of traces, trace formats and experiments – Trace file handling – Experiment handling – Importing/Exporting – Automatic Type Detection
© Ericsson AB 2014 | 2014-09-29 | Page 13
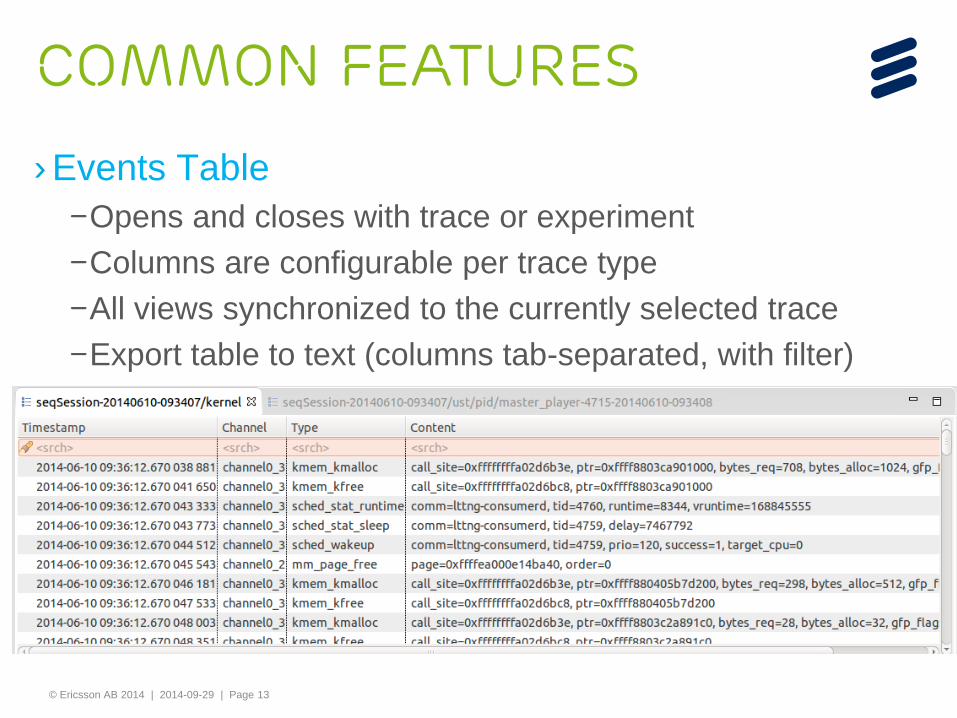
Common Features
› Events Table –Opens and closes with trace or experiment –Columns are configurable per trace type –All views synchronized to the currently selected trace –Export table to text (columns tab-separated, with filter)
© Ericsson AB 2014 | 2014-09-29 | Page 14
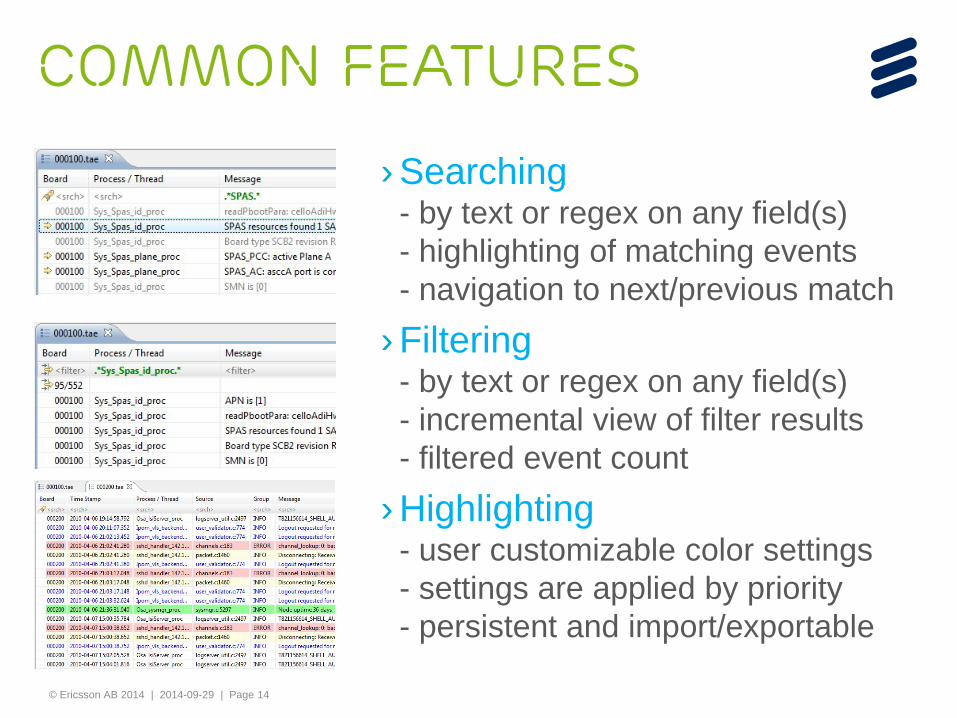
Common Features
› Searching - by text or regex on any field(s) - highlighting of matching events - navigation to next/previous match
› Filtering - by text or regex on any field(s) - incremental view of filter results - filtered event count
› Highlighting - user customizable color settings - settings are applied by priority - persistent and import/exportable
© Ericsson AB 2014 | 2014-09-29 | Page 15
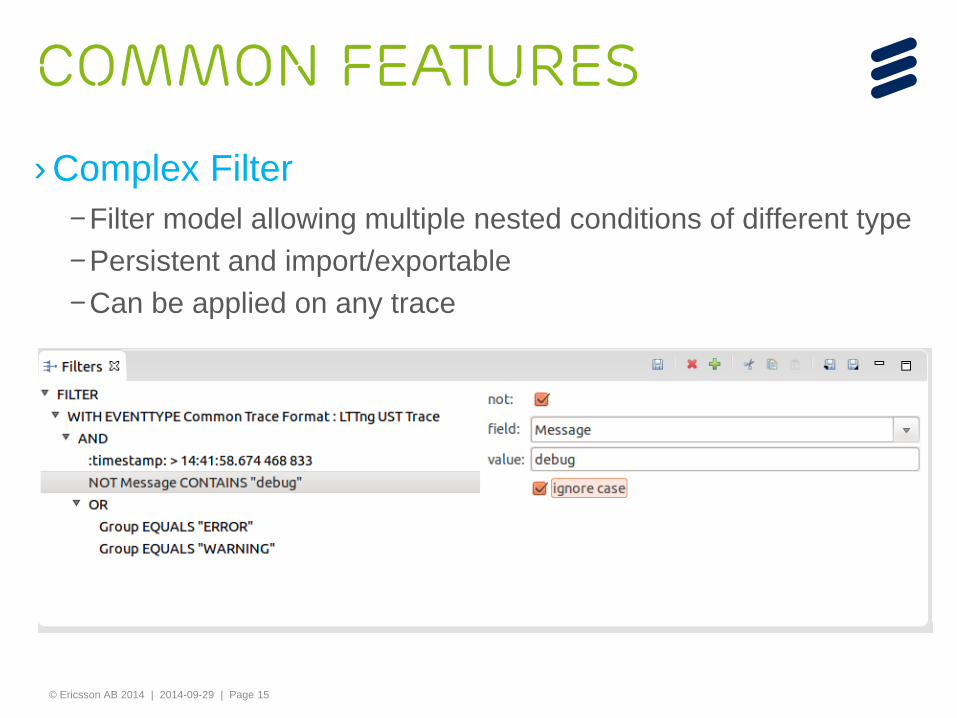
Common Features
› Complex Filter – Filter model allowing multiple nested conditions of different type – Persistent and import/exportable – Can be applied on any trace
© Ericsson AB 2014 | 2014-09-29 | Page 16
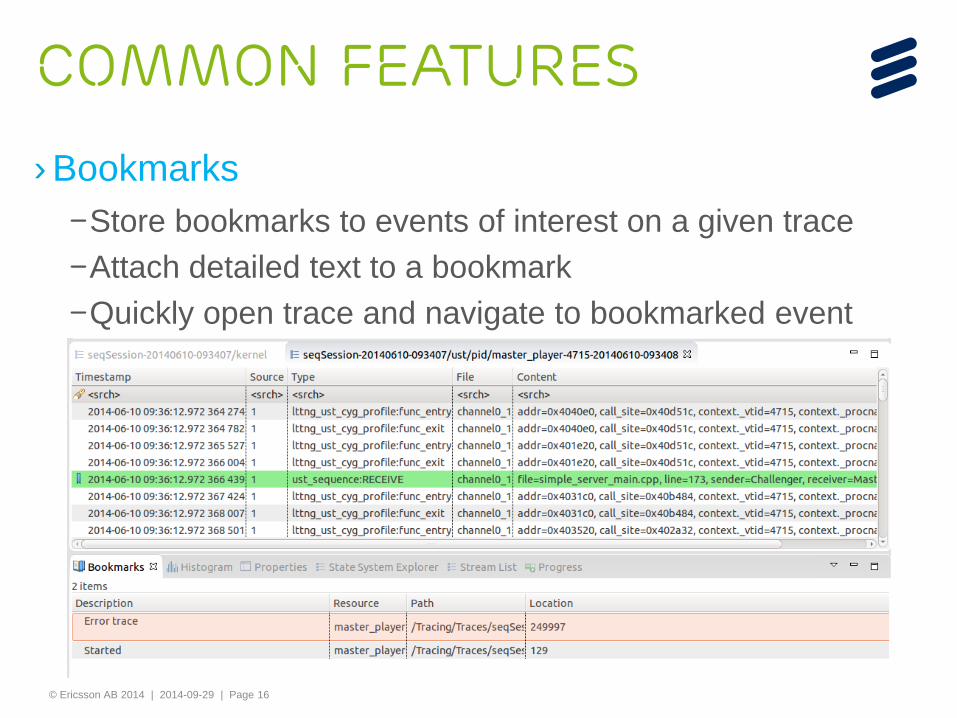
Common Features
› Bookmarks –Store bookmarks to events of interest on a given trace –Attach detailed text to a bookmark –Quickly open trace and navigate to bookmarked event
© Ericsson AB 2014 | 2014-09-29 | Page 17
Common Features
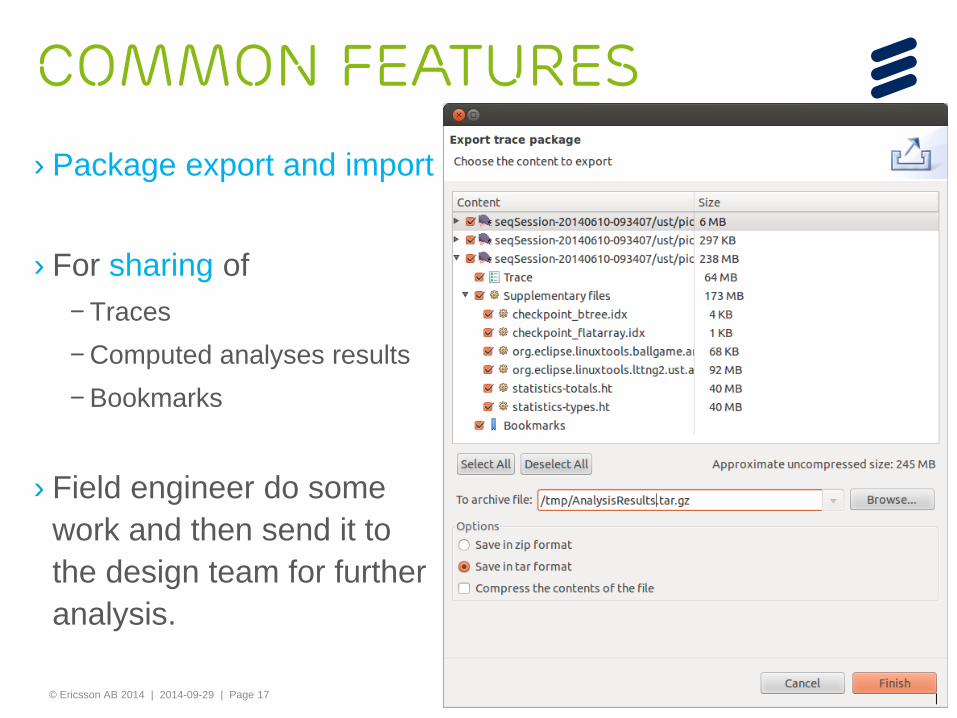
› Package export and import
› For sharing of – Traces – Computed analyses results – Bookmarks
› Field engineer do some work and then send it to the design team for further analysis.

© Ericsson AB 2014 | 2014-09-29 | Page 18
State System Support
› State system abstracts events, analyses traces and creates models to be displayed
› Persistent on disk, does not need to be rebuilt between runs
› Allows fast (O(log n)) queries of state attributes by time or type
› Support for several state systems in parallel
IDLE USERMODE INTERRUPTED USERMODE IDLE
sched_switch(process) irq_entry irq_exit sched_switch(swapper)
states: WAIT WAIT USERMODE USERMODE
events:
© Ericsson AB 2014 | 2014-09-29 | Page 19
Common Features
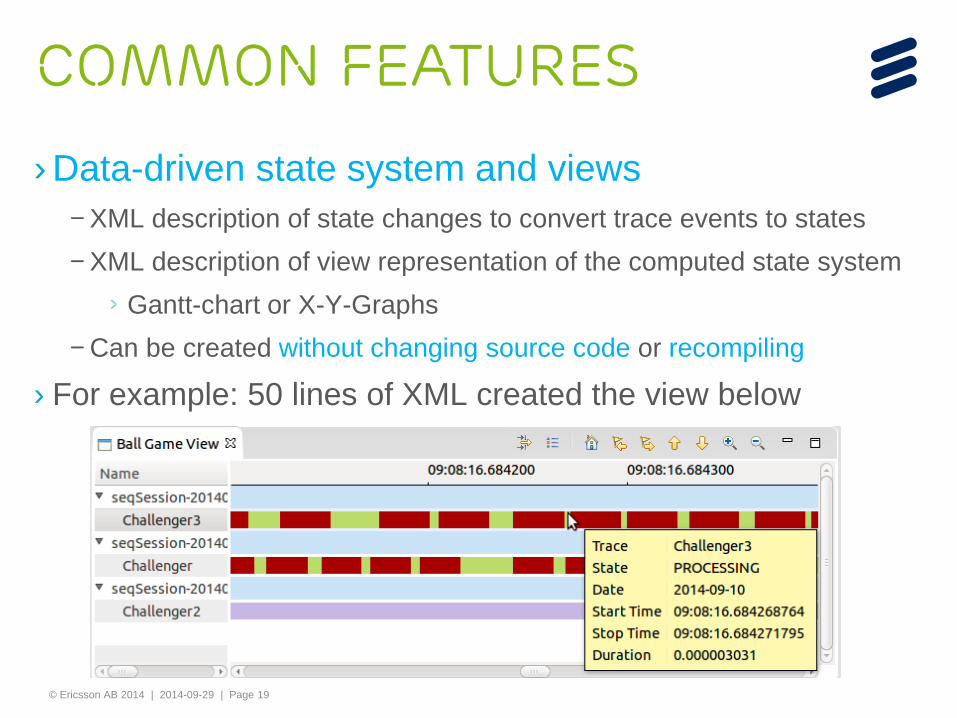
› Data-driven state system and views – XML description of state changes to convert trace events to states – XML description of view representation of the computed state system
› Gantt-chart or X-Y-Graphs – Can be created without changing source code or recompiling
› For example: 50 lines of XML created the view below
© Ericsson AB 2014 | 2014-09-29 | Page 20
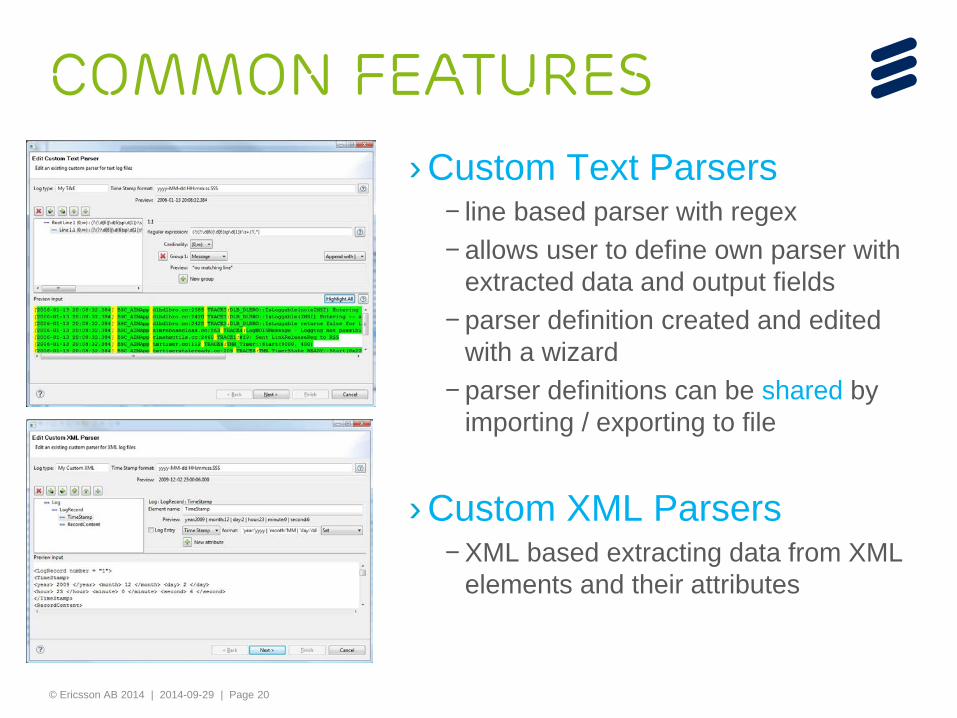
Common Features › Custom Text Parsers
– line based parser with regex – allows user to define own parser with
extracted data and output fields – parser definition created and edited
with a wizard – parser definitions can be shared by
importing / exporting to file
› Custom XML Parsers – XML based extracting data from XML
elements and their attributes
© Ericsson AB 2014 | 2014-09-29 | Page 21
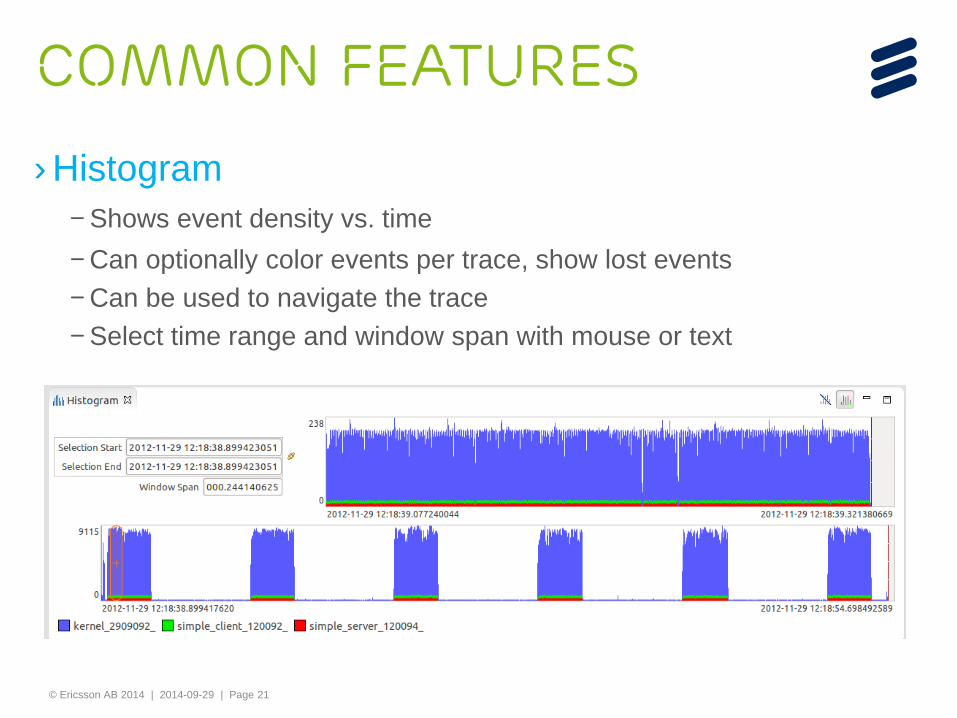
Common Features
› Histogram – Shows event density vs. time – Can optionally color events per trace, show lost events – Can be used to navigate the trace – Select time range and window span with mouse or text
© Ericsson AB 2014 | 2014-09-29 | Page 22
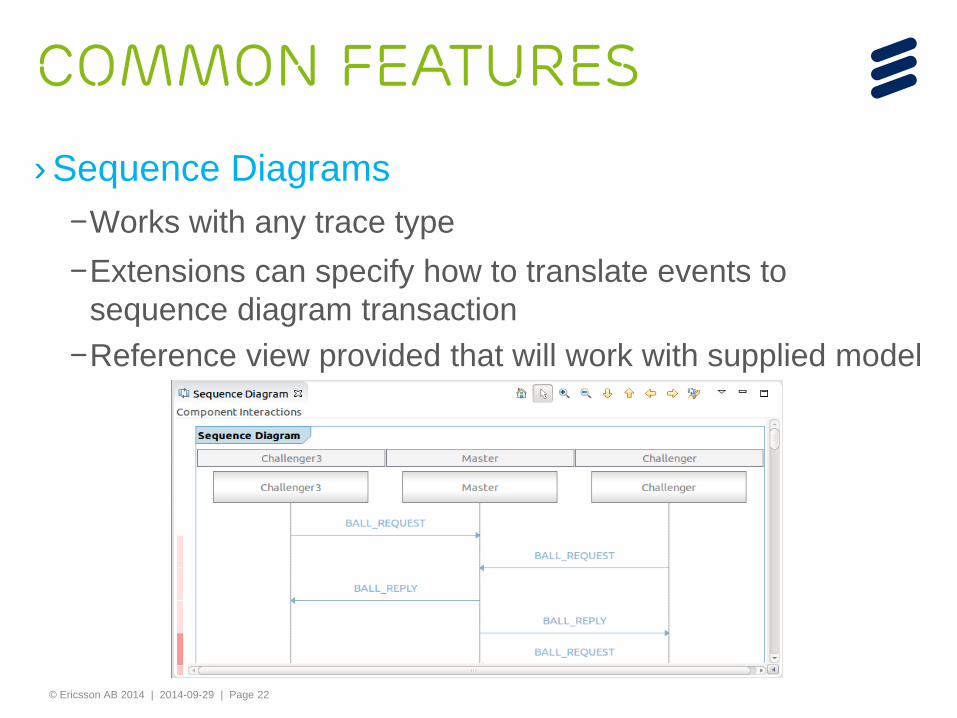
Common Features
› Sequence Diagrams –Works with any trace type –Extensions can specify how to translate events to
sequence diagram transaction –Reference view provided that will work with supplied model
© Ericsson AB 2014 | 2014-09-29 | Page 23
LTTNG Integration
› Reference implementations for –a plug-in extension to Trace Compass –various trace analyses –several visualization views
› Analysis of LTTng Kernel and UST Traces –Linux Tracing Toolkit next generation –Traces in Common Trace Format (CTF)
› Support of Live Trace Reading
› LTTng Remote Tracer Control
© Ericsson AB 2014 | 2014-09-29 | Page 24
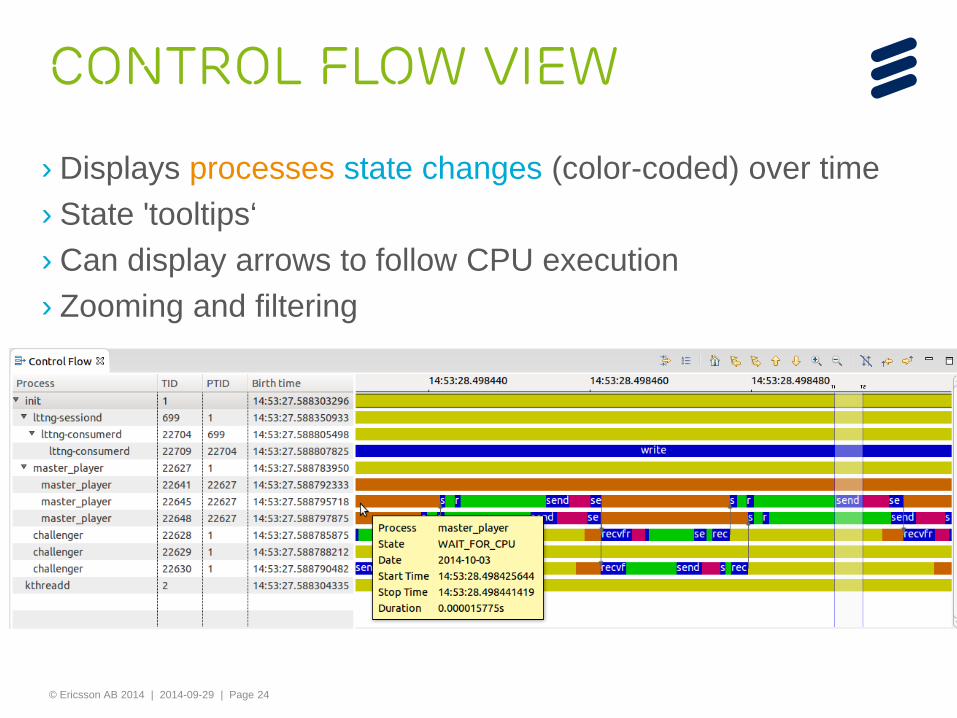
Control flow view
› Displays processes state changes (color-coded) over time › State 'tooltips‘ › Can display arrows to follow CPU execution › Zooming and filtering
© Ericsson AB 2014 | 2014-09-29 | Page 25
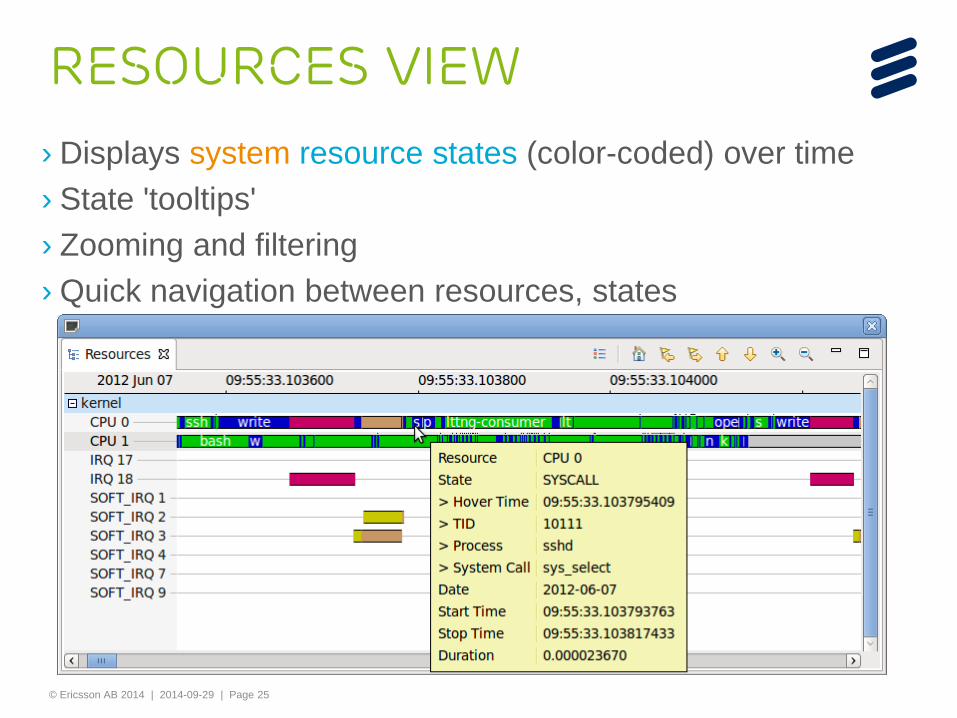
Resources view
› Displays system resource states (color-coded) over time › State 'tooltips' › Zooming and filtering › Quick navigation between resources, states
© Ericsson AB 2014 | 2014-09-29 | Page 26
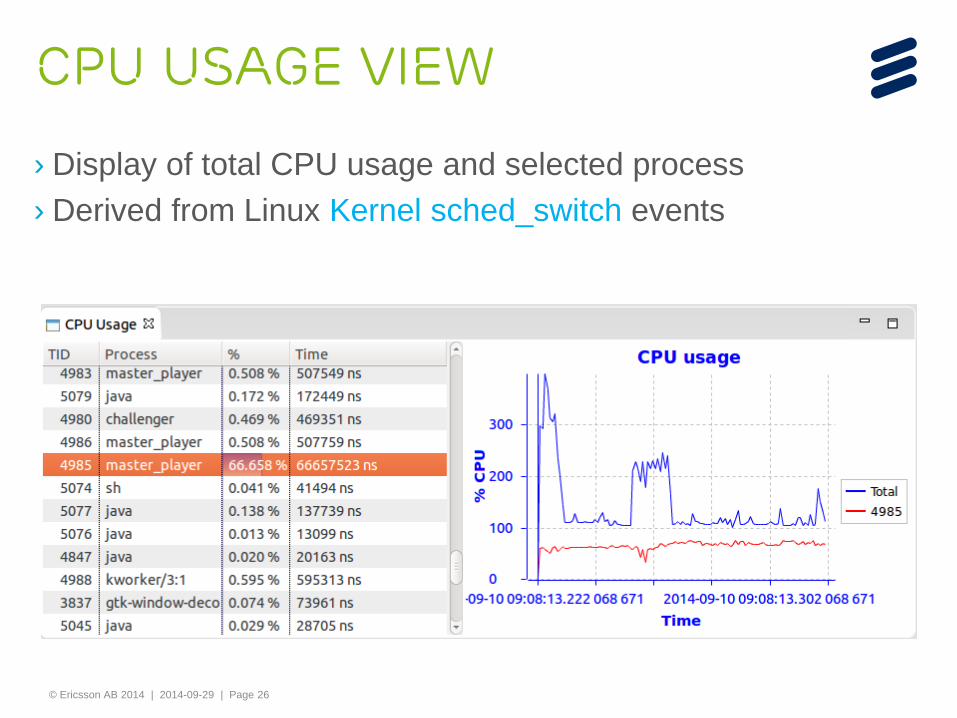
CPU USAGE View
› Display of total CPU usage and selected process › Derived from Linux Kernel sched_switch events
© Ericsson AB 2014 | 2014-09-29 | Page 27
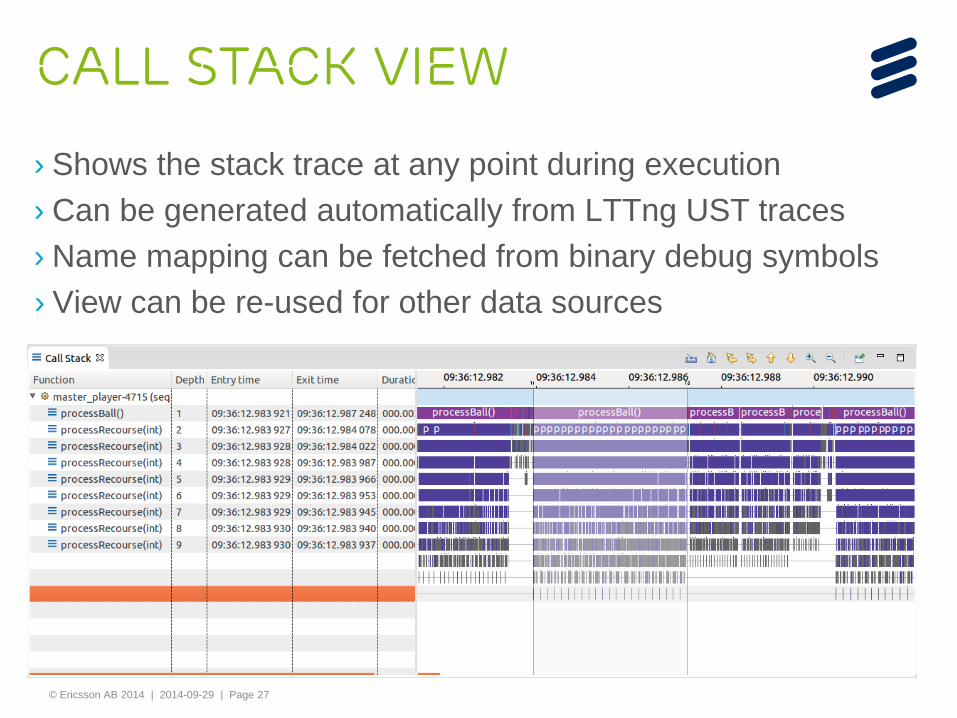
Call Stack View
› Shows the stack trace at any point during execution › Can be generated automatically from LTTng UST traces › Name mapping can be fetched from binary debug symbols › View can be re-used for other data sources
© Ericsson AB 2014 | 2014-09-29 | Page 28
SYSTEM-WIDE Tracing
› Correlation of events within a cluster across – Nodes, – CPUs, ASICs, GPUs, – Hypervisor, Kernel, User-space, Virtual Machines, Libraries, 3PP,
Applications
› Time synchronization of traces from multiple sources
› Based on synchronization information sources – Message exchanges, Time-stamps
› Complex timestamp transformation algorithm part of Trace Compass
› Complete reference implementation for LTTng Kernel traces
© Ericsson AB 2014 | 2014-09-29 | Page 29
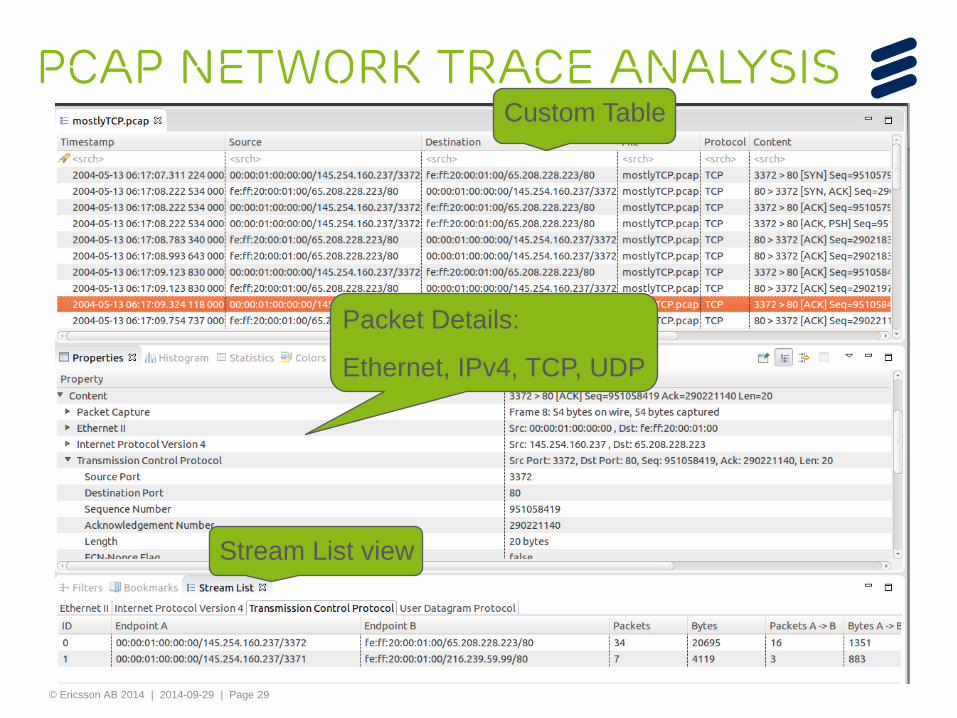
PCAP Network Trace ANALYSIS
Custom Table
Packet Details:
Ethernet, IPv4, TCP, UDP
Stream List view
© Ericsson AB 2014 | 2014-09-29 | Page 30
© Ericsson AB 2014 | 2014-09-29 | Page 31
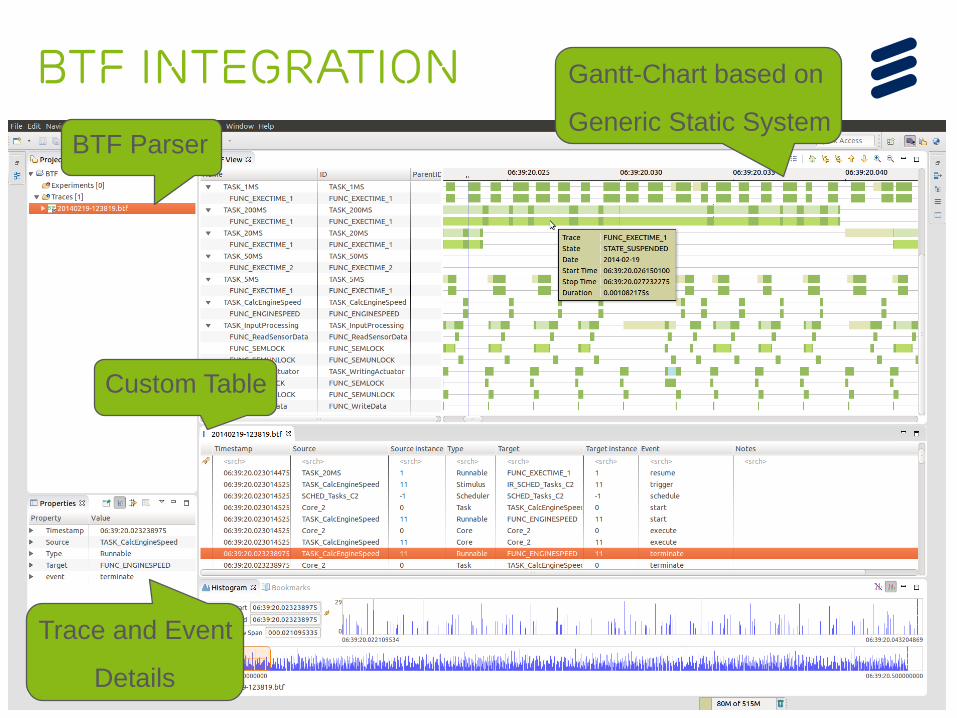
BTF Integration
Custom Table
Trace and Event
Details
Gantt-Chart based on
Generic Static System BTF Parser
© Ericsson AB 2014 | 2014-09-29 | Page 32
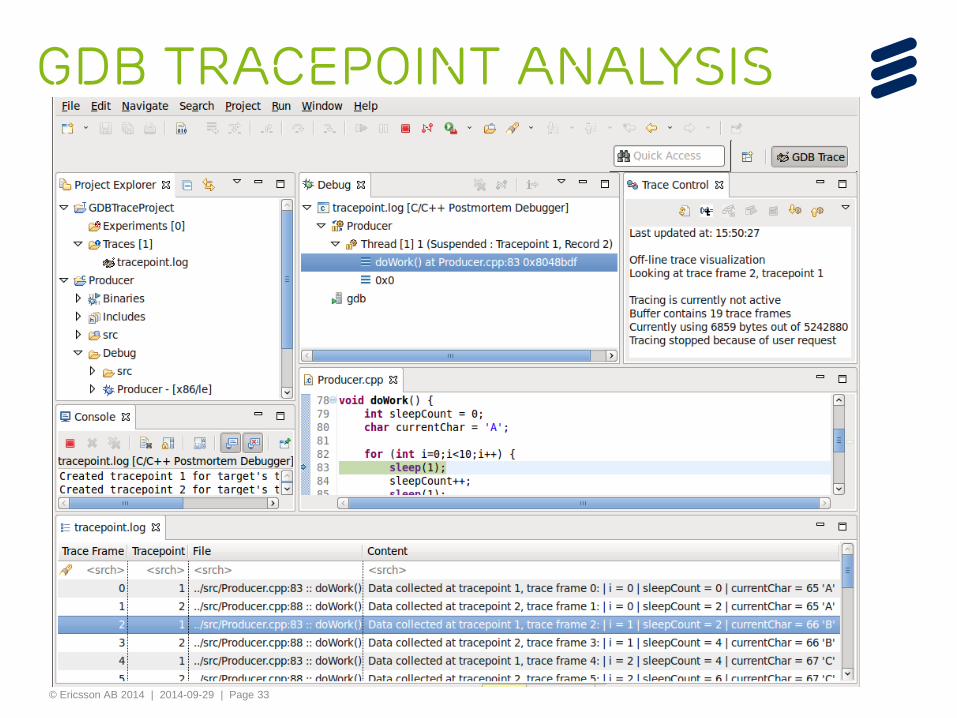
GDB TracePoint ANALYSIS
› Plug-in extension to Trace Compass
› Dynamic Tracepoints with GDB
› Integrated with Eclipse CDT Debug –For creating of GDB tracepoints –For collection of tracepoint information –Synchronization of Trace Compass with CDT Debug
› Visualization of GDB Trace Log using Trace Compass
© Ericsson AB 2014 | 2014-09-29 | Page 33
GDB TracePoint ANALYSIS
© Ericsson AB 2014 | 2014-09-29 | Page 34
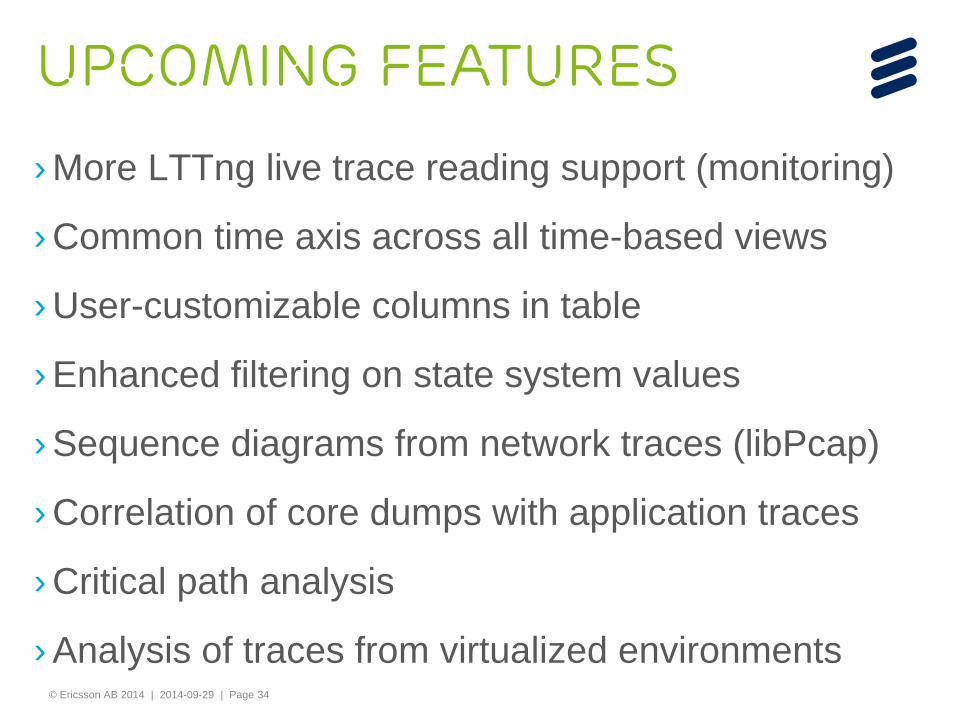
Upcoming FEATURES
› More LTTng live trace reading support (monitoring)
› Common time axis across all time-based views
› User-customizable columns in table
› Enhanced filtering on state system values
› Sequence diagrams from network traces (libPcap)
› Correlation of core dumps with application traces
› Critical path analysis
› Analysis of traces from virtualized environments
© Ericsson AB 2014 | 2014-09-29 | Page 35
© Ericsson AB 2014 | 2014-09-29 | Page 36
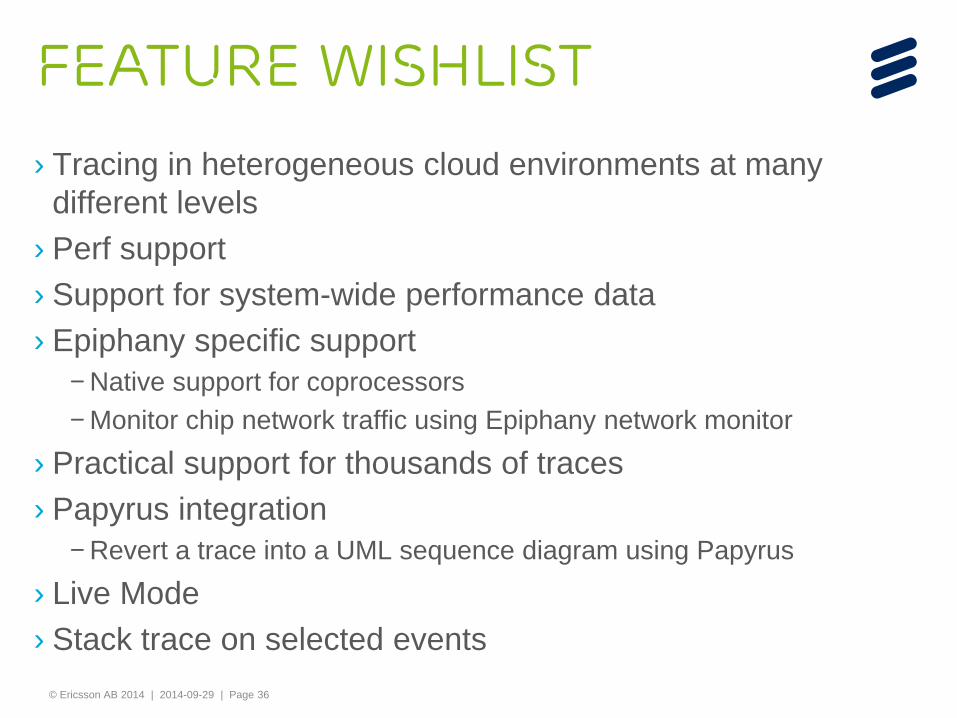
FEATURE Wishlist
› Tracing in heterogeneous cloud environments at many different levels
› Perf support › Support for system-wide performance data › Epiphany specific support
– Native support for coprocessors – Monitor chip network traffic using Epiphany network monitor
› Practical support for thousands of traces › Papyrus integration
– Revert a trace into a UML sequence diagram using Papyrus
› Live Mode › Stack trace on selected events
© Ericsson AB 2014 | 2014-09-29 | Page 37
REFERENCES › Project pages
– Trace Compass Proposal
– Eclipse Trace Compass Project
– Is Trace Compass Fast Yet
– Eclipse Linux Tools Project - LTTng Integration
› User and Developer Guides – Trace Compass User Guide
– PCAP - Network Analysis User Guide
– GDB Tracepoint Analysis User Guide
– Trace Compass Developer Guide
© Ericsson AB 2014 | 2014-09-29 | Page 38
REFERENCES › Working Groups
– Multicore Association Tool Infrastructure Working Groups
– PolarSys
– Diagnositic and Monitoring Working Group
› Others – CTF Requirements, specification, reference implementation
– Best Trace Format (BTF)
– libpcap (PAcket CAPture)
© Ericsson AB 2014 | 2014-09-29 | Page 39
Contacts
› Product Manager – [email protected]
› Trace Compass Committers – [email protected] – [email protected] – [email protected] – [email protected] – [email protected] – [email protected]
› Trace Compass Mailing List
© Ericsson AB 2014 | 2014-09-29 | Page 40
Questions
© Ericsson AB 2014 | 2014-09-29 | Page 41
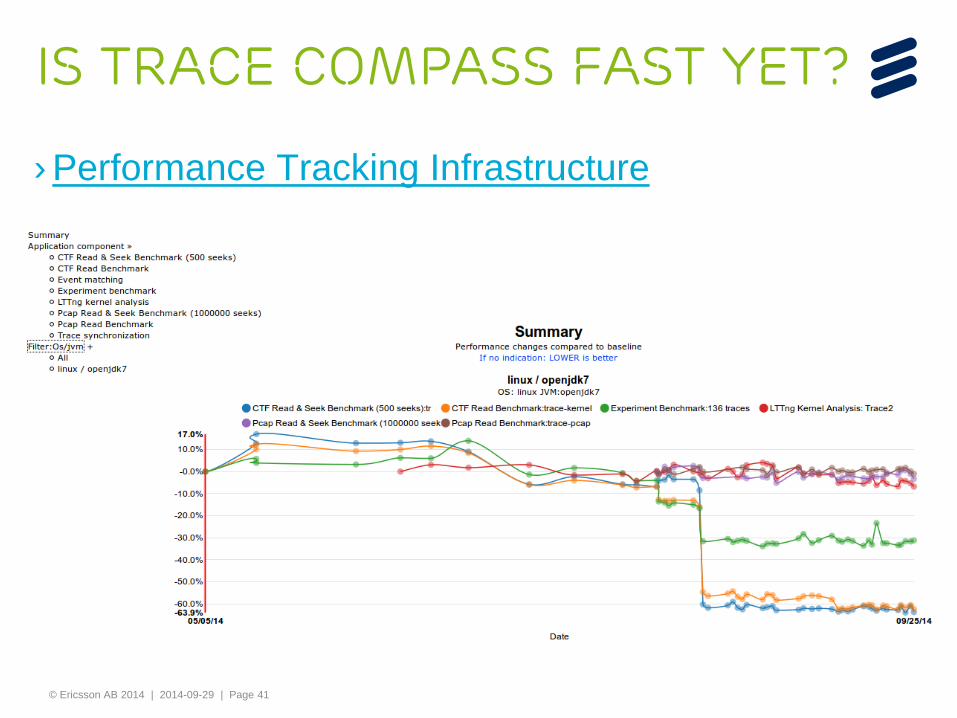
Is Trace Compass Fast Yet?
› Performance Tracking Infrastructure


![Toupin Genealogy Descendants - arslanmb.org · Toupin Family Genealogy Descendants of René Toupin [#3] & Geneviève Langlois Generations 1-8 Mark B. Arslan 407 Highlands Lake Drive](https://img.pdfslide.us/doc/110x75/5b9e712009d3f2083f8baf7f/toupin-genealogy-descendants-toupin-family-genealogy-descendants-of-rene.jpg)


![HAMILTONIAN AND VARIATIONAL PRINCIPLES - …authors.library.caltech.edu/25074/8/MFE_Chapter_5.pdf248 HAMILTONIAN AND VARIATIONAL PRINCIPLES CH. 5 Toupin [1960], Vainberg [1964], Washizu](https://img.pdfslide.us/doc/110x75/5ae895fa7f8b9a8b2b902a8b/hamiltonian-and-variational-principles-hamiltonian-and-variational-principles.jpg)