Embed Size (px)
Citation preview
Dominique Toupin, Ericsson
October 2014 | Page 2 (34)
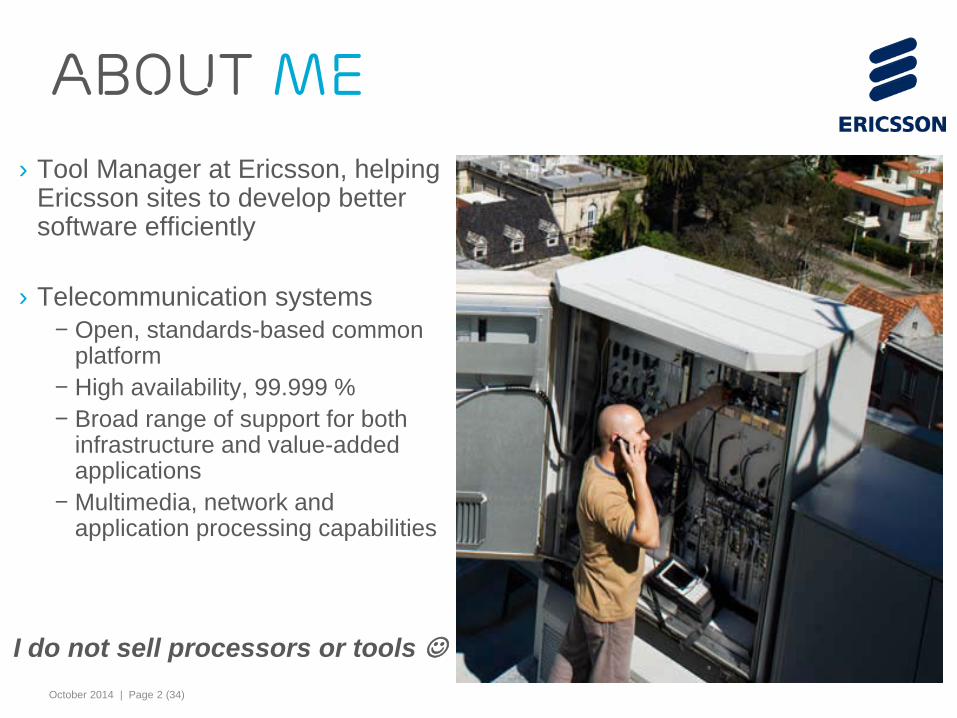
› Tool Manager at Ericsson, helping Ericsson sites to develop better software efficiently
› Telecommunication systems – Open, standards-based common
platform – High availability, 99.999 % – Broad range of support for both
infrastructure and value-added applications
– Multimedia, network and application processing capabilities
About me
I do not sell processors or tools
October 2014 | Page 3 (34) 3
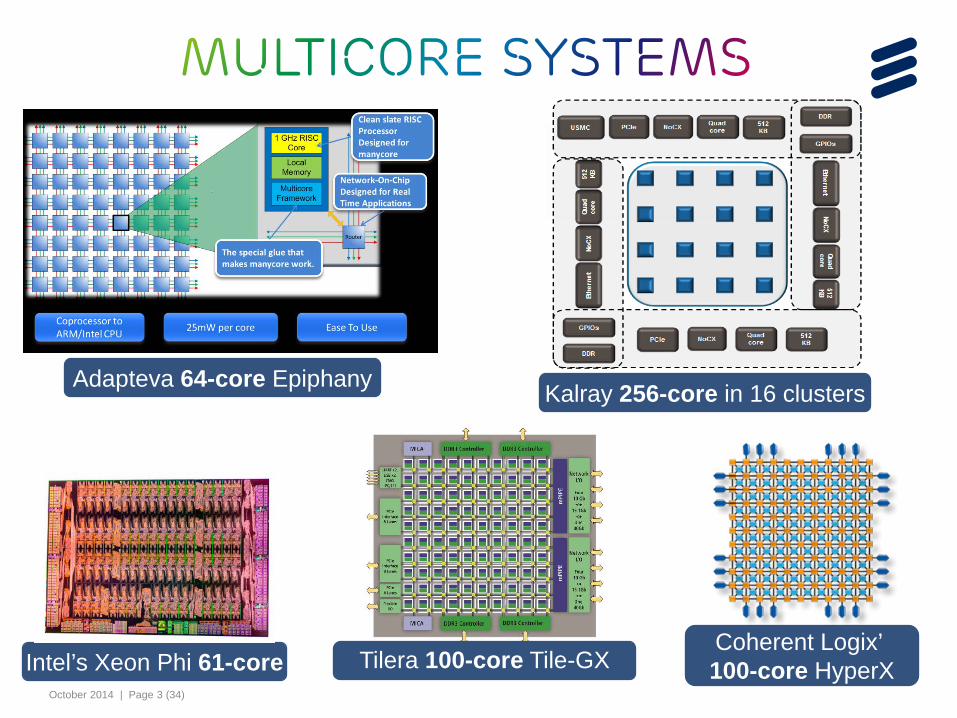
Intel’s Xeon Phi 61-core
Adapteva 64-core Epiphany
Tilera 100-core Tile-GX Coherent Logix’ 100-core HyperX
Kalray 256-core in 16 clusters
October 2014 | Page 4 (34)
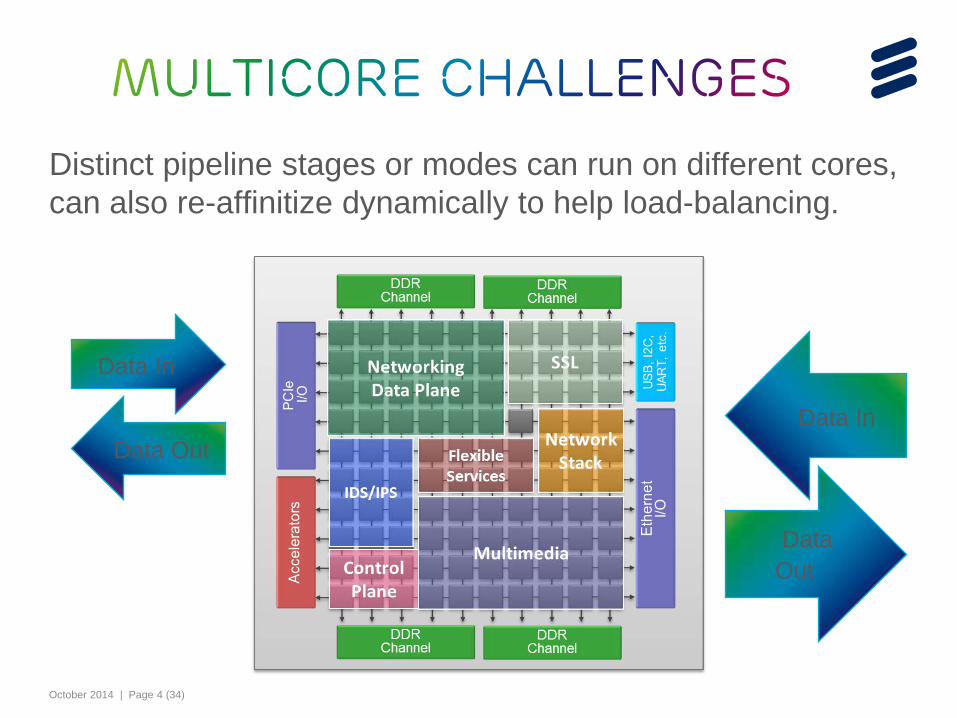
Distinct pipeline stages or modes can run on different cores, can also re-affinitize dynamically to help load-balancing.
Data In
Data Out Data In
Data Out
October 2014 | Page 5 (34)
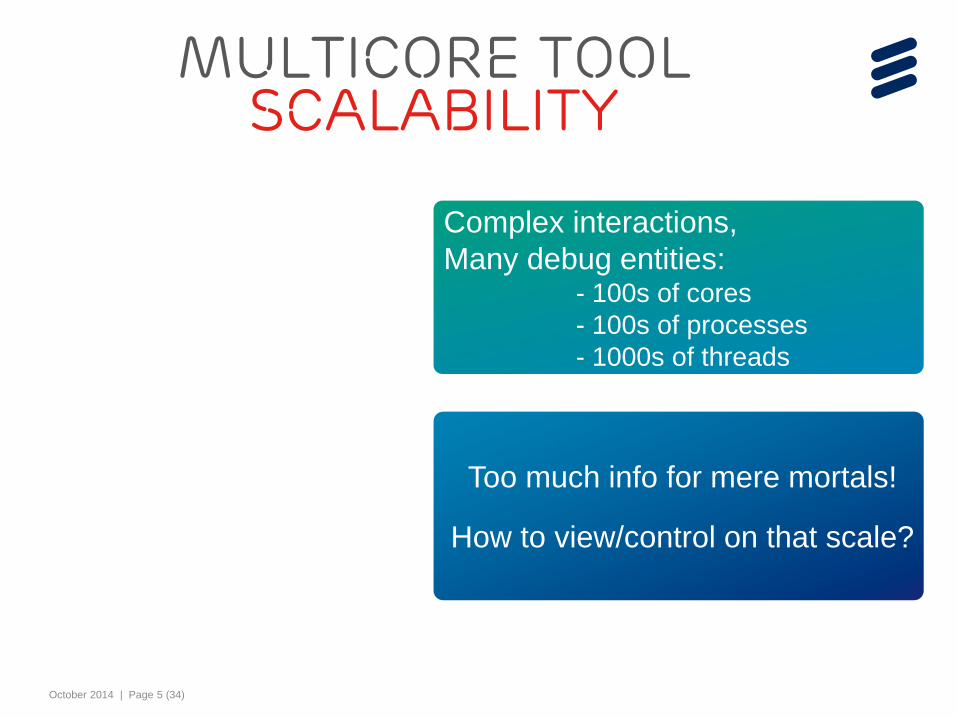
Multicore Tool Scalability
Complex interactions, Many debug entities:
- 100s of cores - 100s of processes - 1000s of threads
Too much info for mere mortals!
How to view/control on that scale?
October 2014 | Page 6 (34)
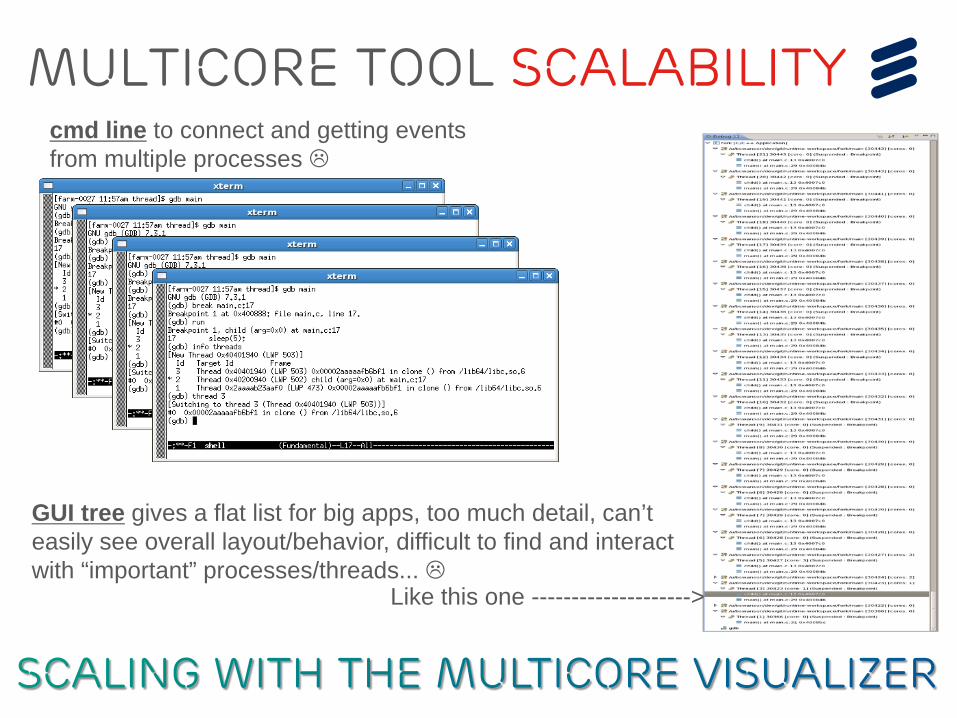
Multicore Tool Scalability cmd line to connect and getting events from multiple processes
GUI tree gives a flat list for big apps, too much detail, can’t easily see overall layout/behavior, difficult to find and interact with “important” processes/threads...
Like this one -------------------->
October 2014 | Page 7 (34)
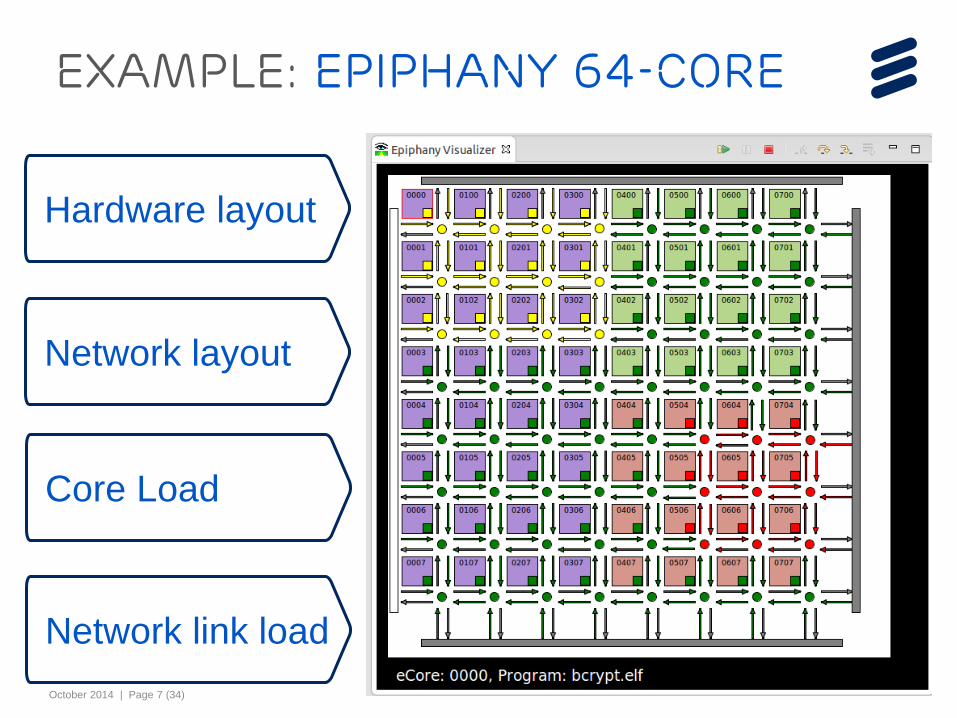
Example: Epiphany 64-core
Hardware layout
Network layout
Core Load
Network link load
October 2014 | Page 8 (34) 8
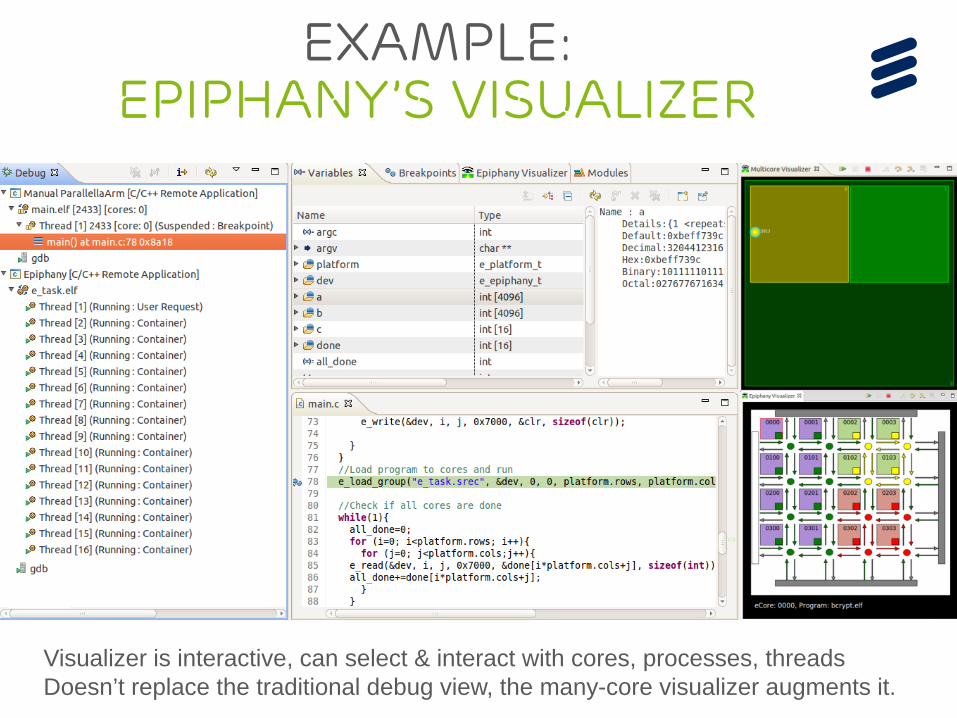
Example: Epiphany’s Visualizer
Visualizer is interactive, can select & interact with cores, processes, threads Doesn’t replace the traditional debug view, the many-core visualizer augments it.
October 2014 | Page 9 (34) 9
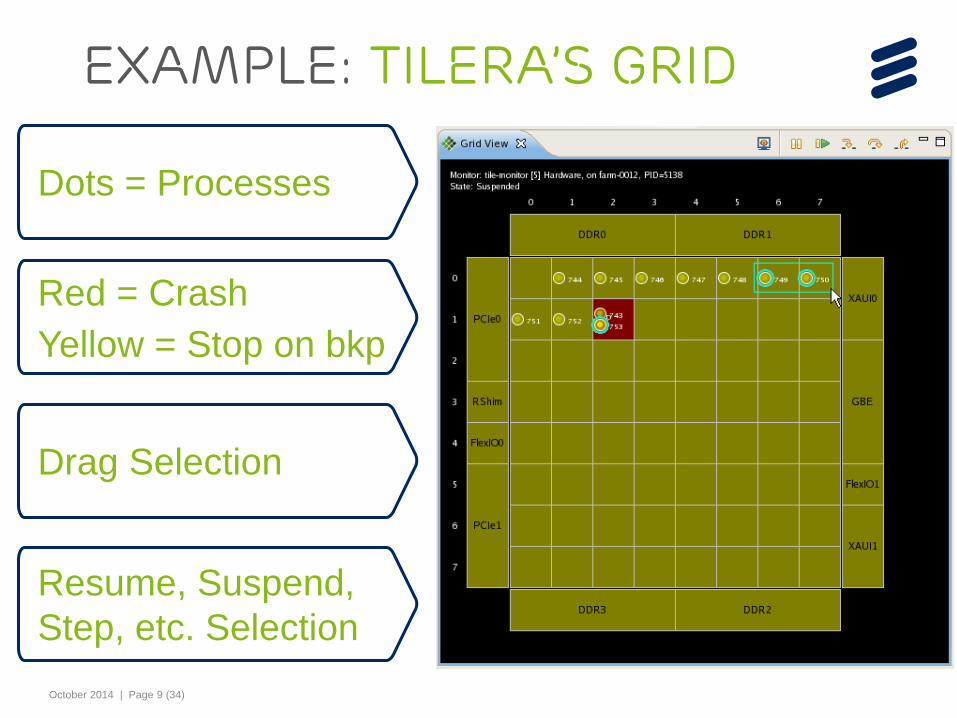
Example: Tilera’s Grid
Red = Crash Yellow = Stop on bkp
Dots = Processes
Drag Selection
Resume, Suspend, Step, etc. Selection
October 2014 | Page 10 (34) 10
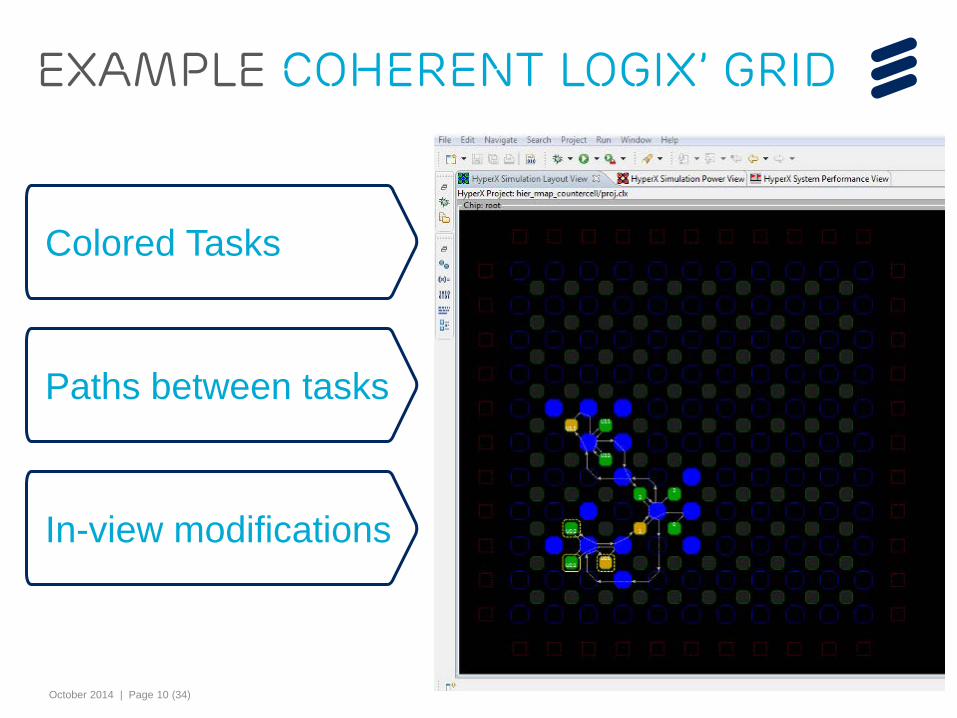
Example Coherent Logix’ Grid
Colored Tasks
Paths between tasks
In-view modifications
October 2014 | Page 11 (34) 11
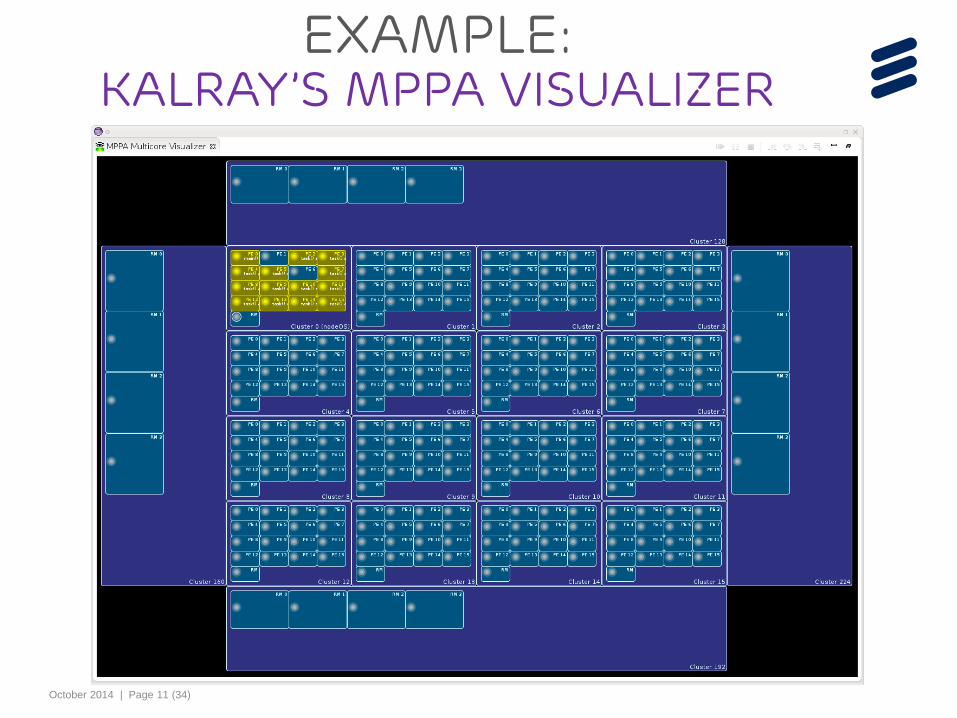
Example: KALRAY’s MPPA Visualizer
October 2014 | Page 12 (34)
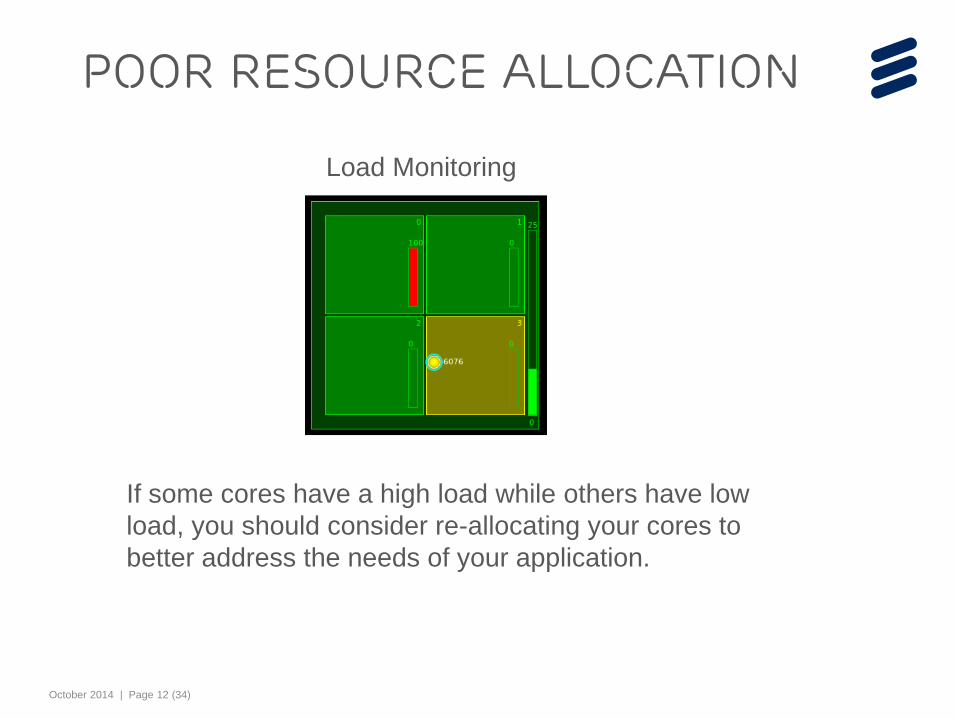
If some cores have a high load while others have low load, you should consider re-allocating your cores to better address the needs of your application.
Load Monitoring
poor resource allocation
October 2014 | Page 13 (34)
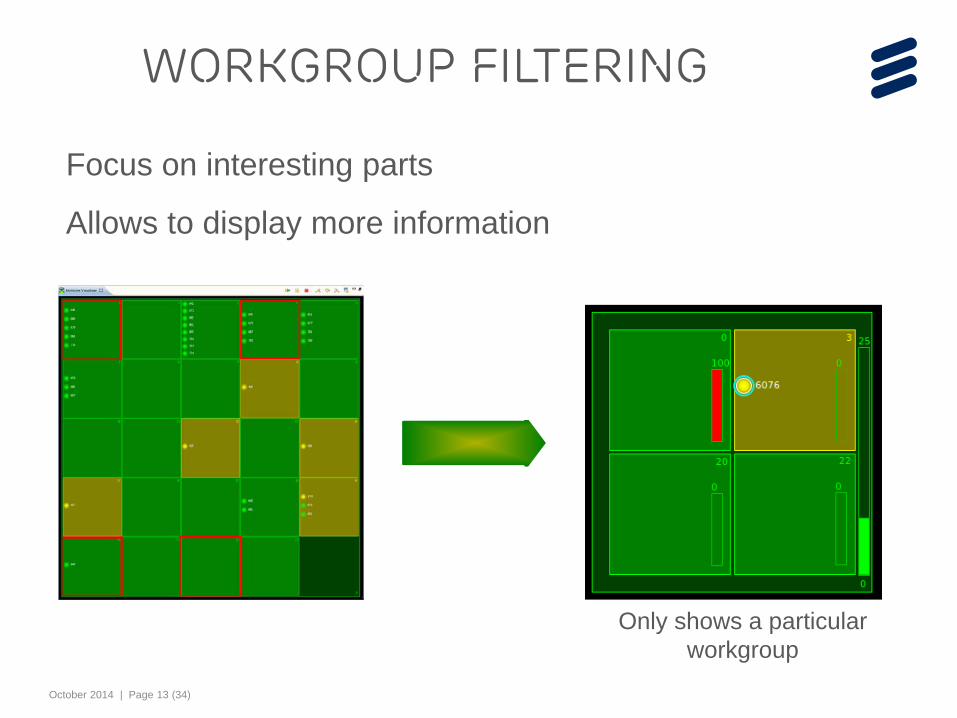
WorkGroup Filtering
Only shows a particular workgroup
Focus on interesting parts
Allows to display more information
October 2014 | Page 14 (34)
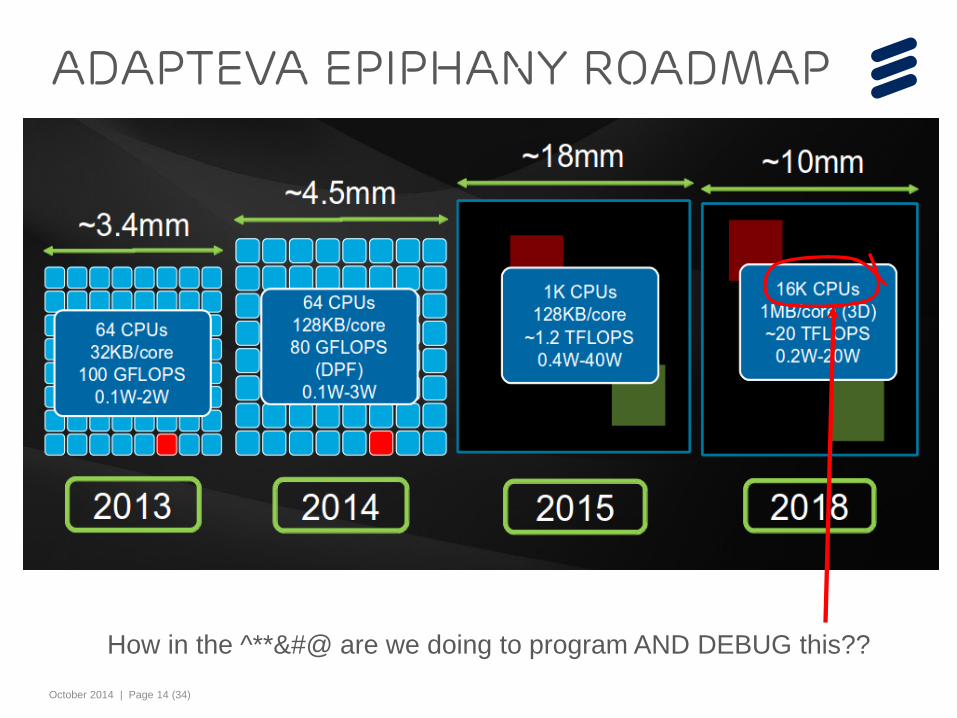
How in the ^**&#@ are we doing to program AND DEBUG this??
Adapteva Epiphany Roadmap
October 2014 | Page 15 (34)
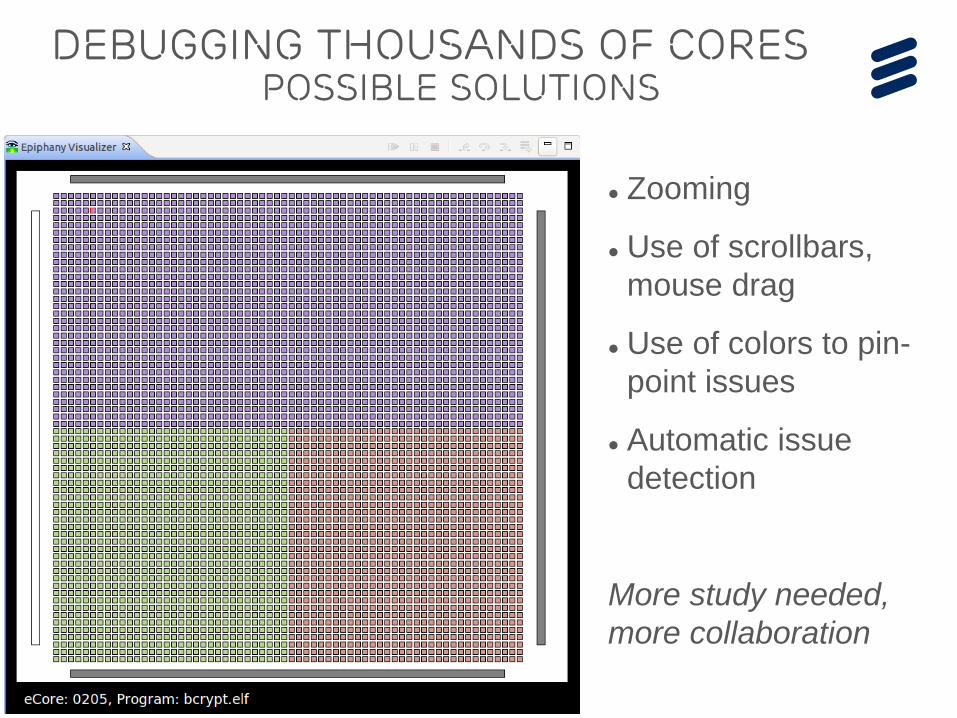
Debugging Thousands of cores Possible solutions
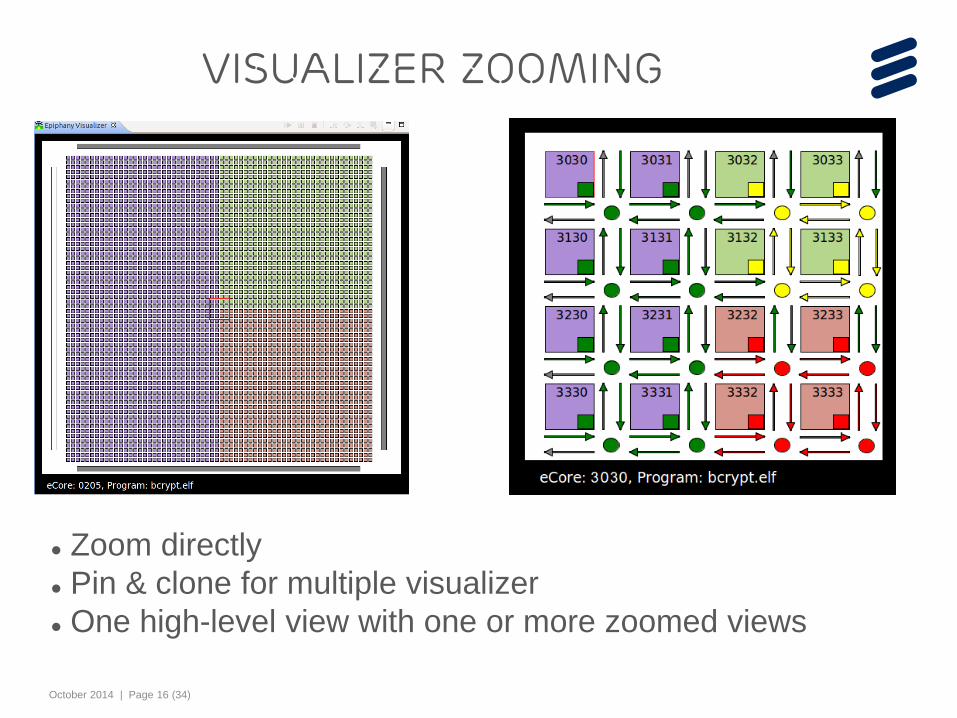
Zooming
Use of scrollbars, mouse drag
Use of colors to pin-point issues
Automatic issue detection
More study needed, more collaboration
October 2014 | Page 16 (34)
Zoom directly Pin & clone for multiple visualizer One high-level view with one or more zoomed views
Visualizer Zooming
October 2014 | Page 17 (34) 17
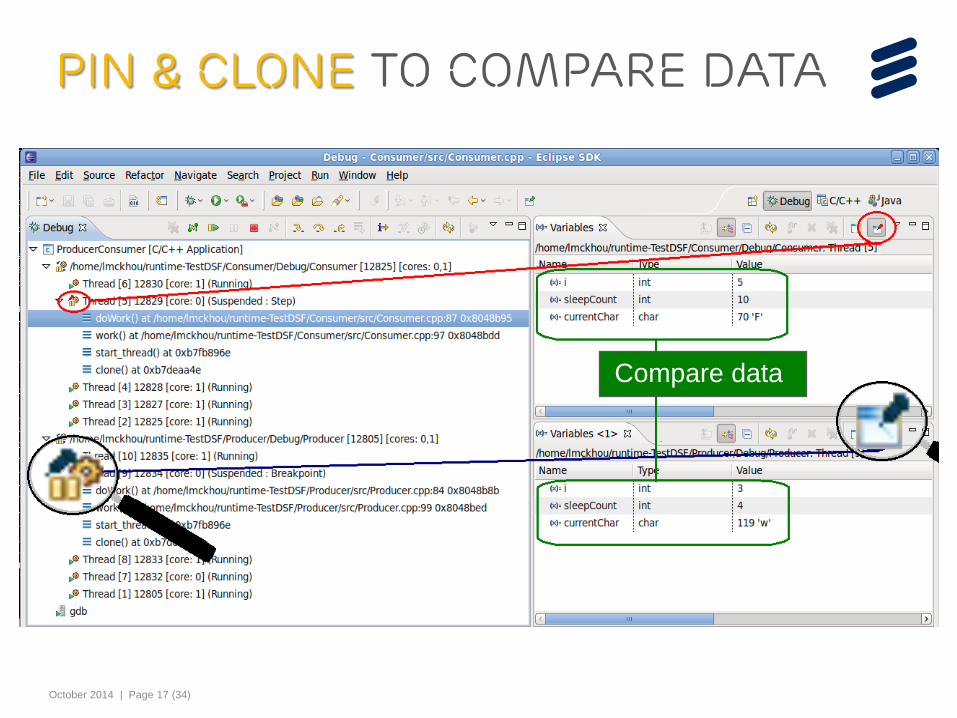
Pin & Clone to Compare data
Compare data
October 2014 | Page 18 (34)
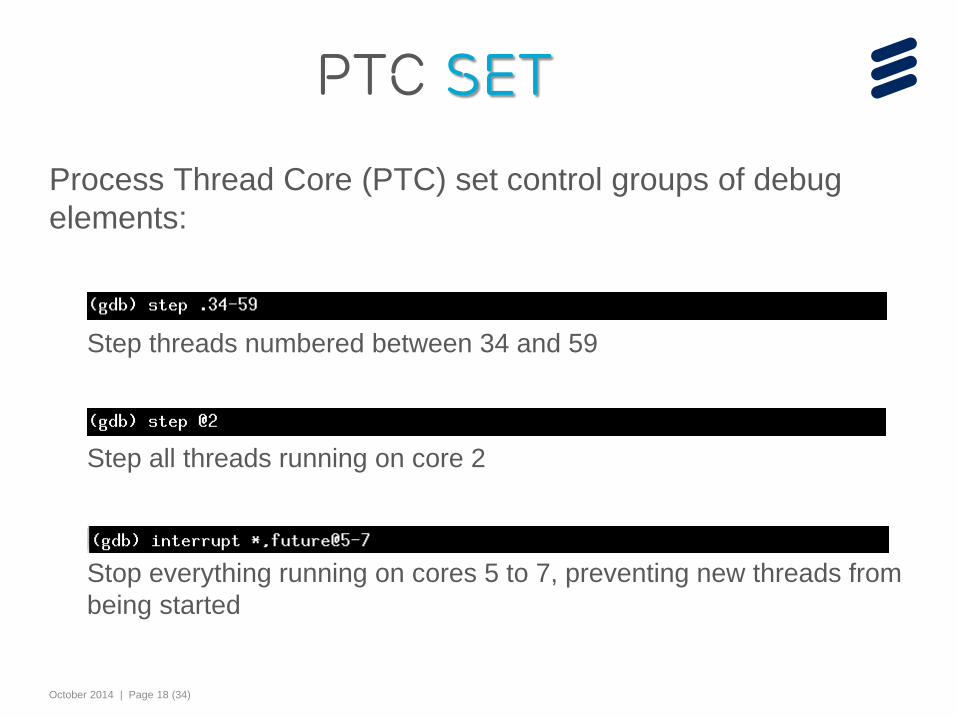
Process Thread Core (PTC) set control groups of debug elements:
Step threads numbered between 34 and 59
Step all threads running on core 2
Stop everything running on cores 5 to 7, preventing new threads from being started
PTC SET
October 2014 | Page 19 (34)
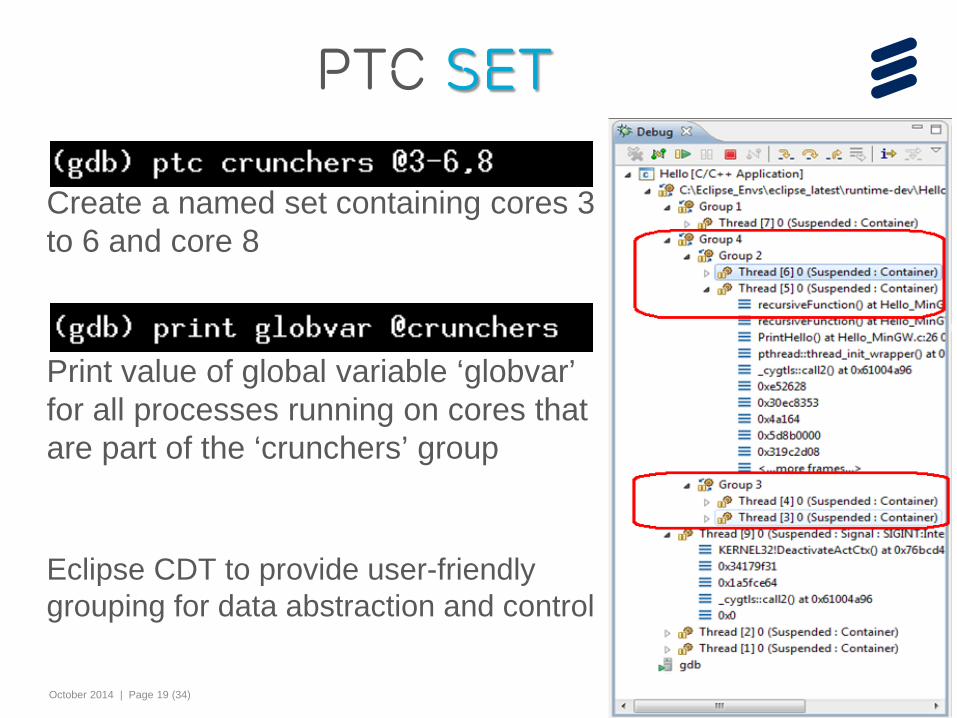
Create a named set containing cores 3 to 6 and core 8
Print value of global variable ‘globvar’ for all processes running on cores that are part of the ‘crunchers’ group
Eclipse CDT to provide user-friendly grouping for data abstraction and control
PTC SeT
October 2014 | Page 20 (34)
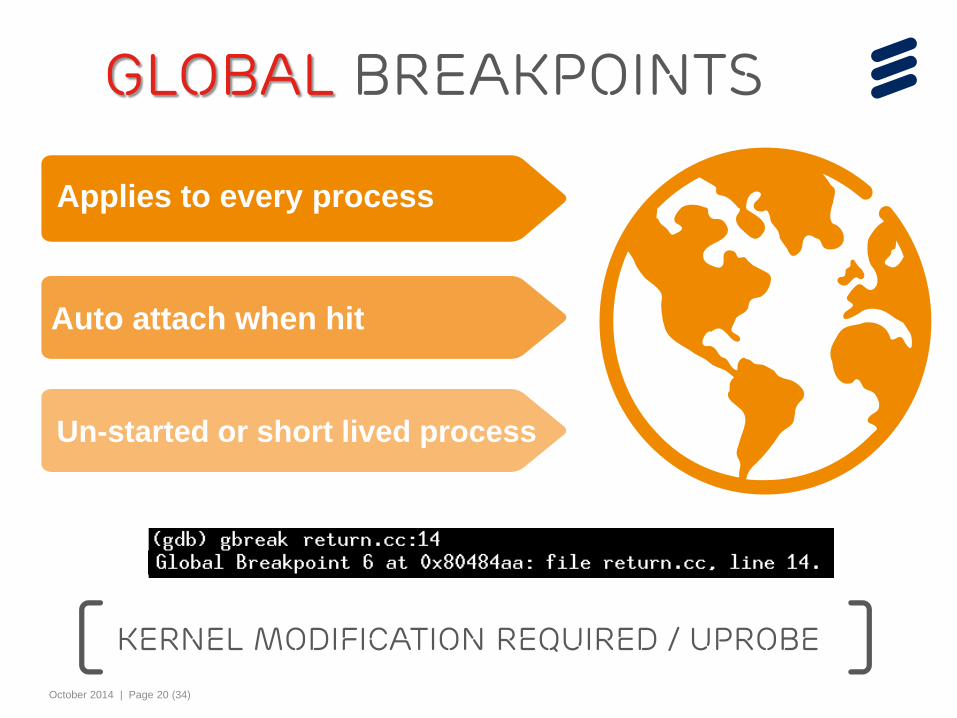
Global Breakpoints
Applies to every process
Auto attach when hit
Un-started or short lived process
Kernel modification required / UProbe
October 2014 | Page 21 (34)
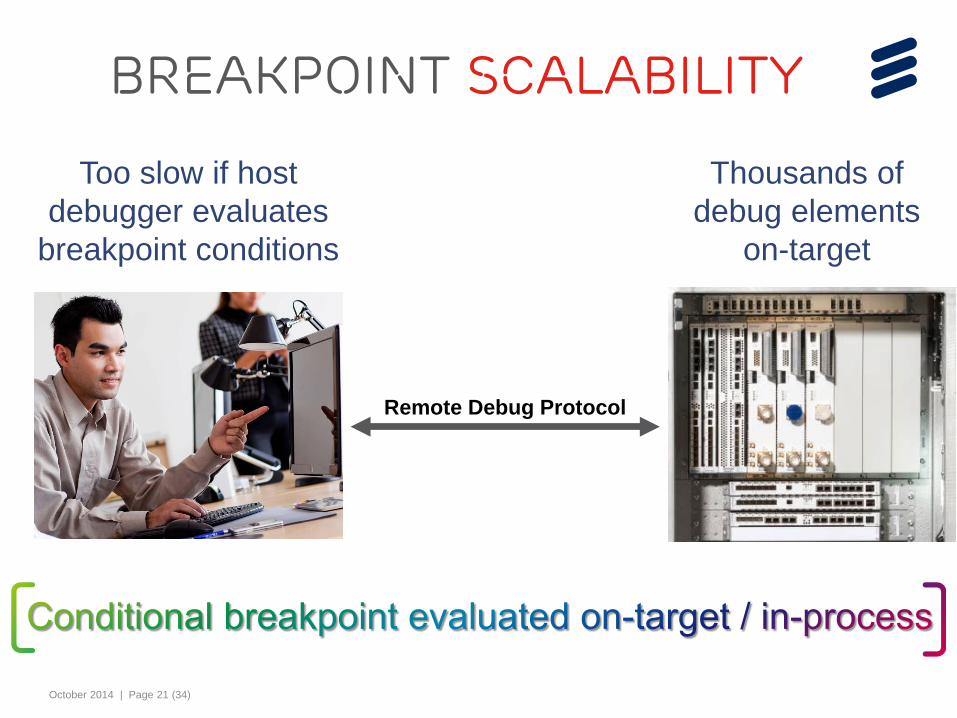
Breakpoint scalability
Thousands of debug elements
on-target
Too slow if host debugger evaluates
breakpoint conditions
Remote Debug Protocol
October 2014 | Page 22 (34) 22
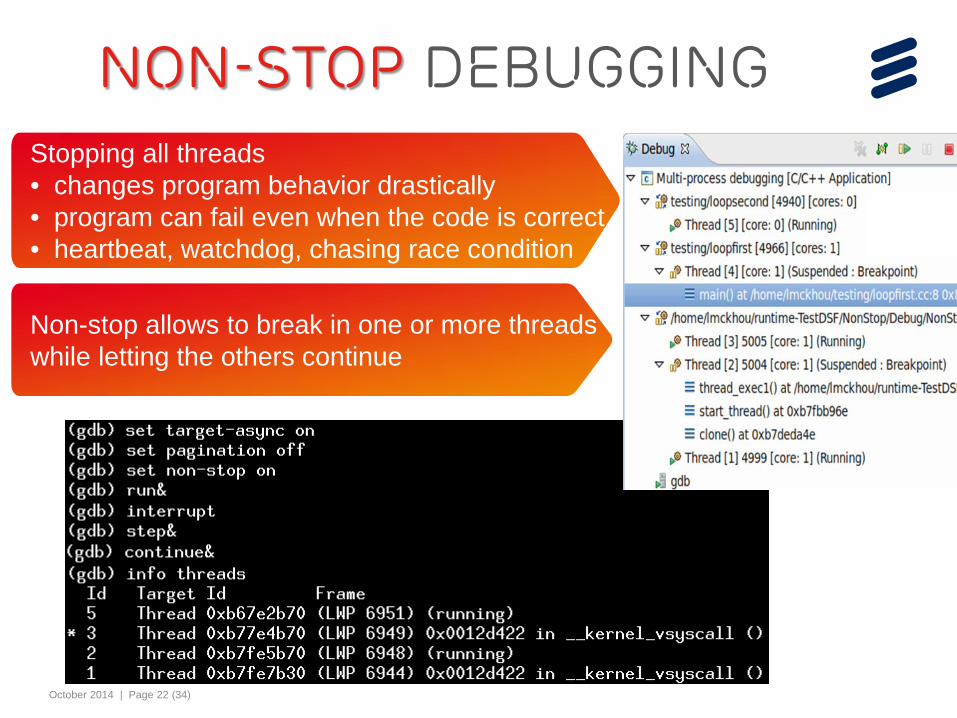
Non-Stop Debugging Stopping all threads • changes program behavior drastically • program can fail even when the code is correct • heartbeat, watchdog, chasing race condition
Non-stop allows to break in one or more threads while letting the others continue
October 2014 | Page 23 (34)
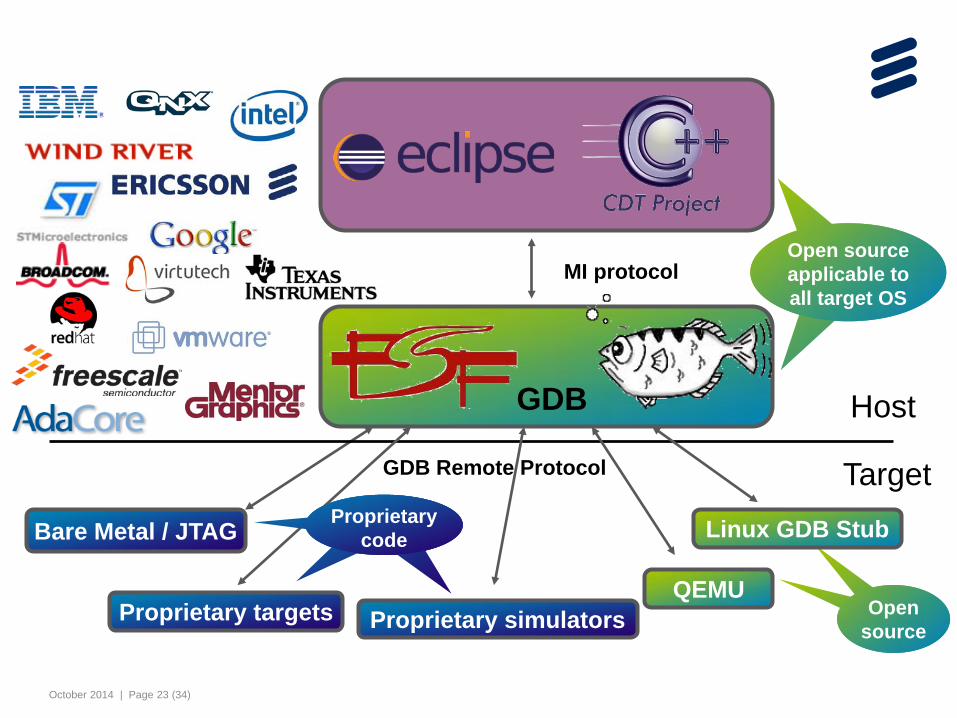
Open source
MI protocol
Target
Host
Open source
Open source applicable to all target OS
Open source applicable to all target OS
Proprietary simulators
Linux GDB Stub Bare Metal / JTAG
Proprietary targets
GDB Remote Protocol
GDB
Proprietary code
QEMU
October 2014 | Page 24 (34)
October 2014 | Page 25 (34)
› Debuggers are invaluable for algorithm issues but they fall short for the above category of problems, not to mention that some problems are not reproducible in the developer’s environment!
› Problems can be hard/impossible to reproduce in the lab
› Single core to multicore makes it harder: Race conditions, Deadlocks, Non-deterministic behavior
› Many layers makes it worst:
Middleware, VM, OS, hypervisor, sometimes across nodes or clusters
difficult-to-find bugs
October 2014 | Page 26 (34)
October 2014 | Page 27 (34)
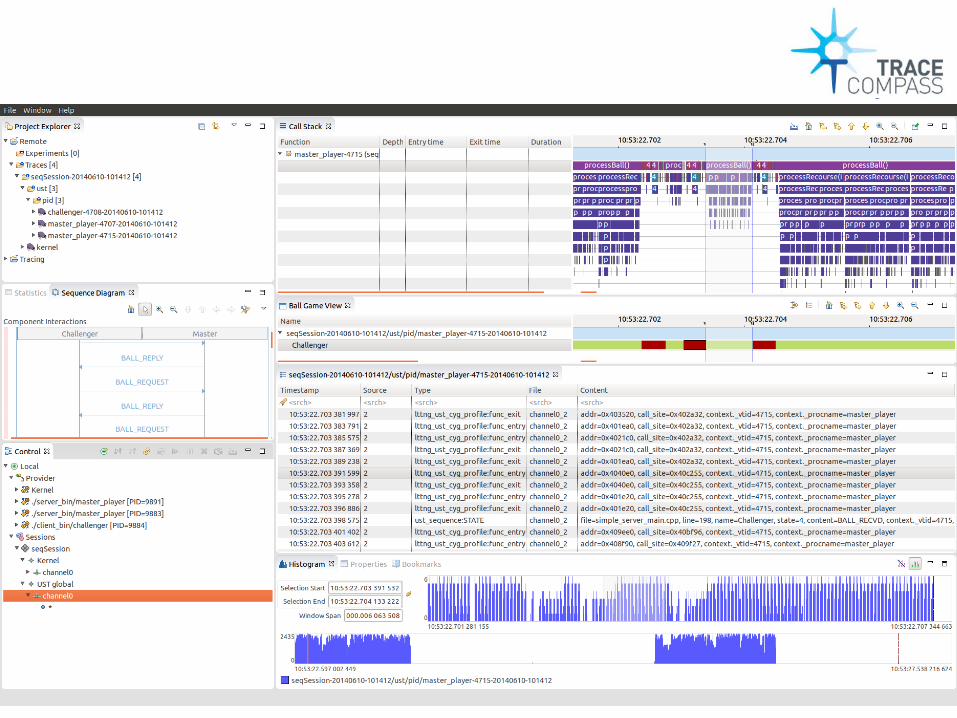
› Linux Tracing Toolkit (LTTng)
› GDB Tracepoint
› Linux Distros
› Babeltrace: convert to common trace format
› Eclipse Tracing Monitoring Framework
› Application, Kernel, HW, bare metal SW, etc.
Common Trace Format
October 2014 | Page 28 (34)
October 2014 | Page 29 (34)
› Tracing / Monitoring info into the many core visualizer
› Analysis: power consumption, memory, etc.
› cmd line trace operations, similar to GDB
› Correlate with system end results
› Show multi-core programing model concepts e.g. OpenMP, OpenCL, etc. in the CDT
› Etc.
Future work
October 2014 | Page 30 (34)
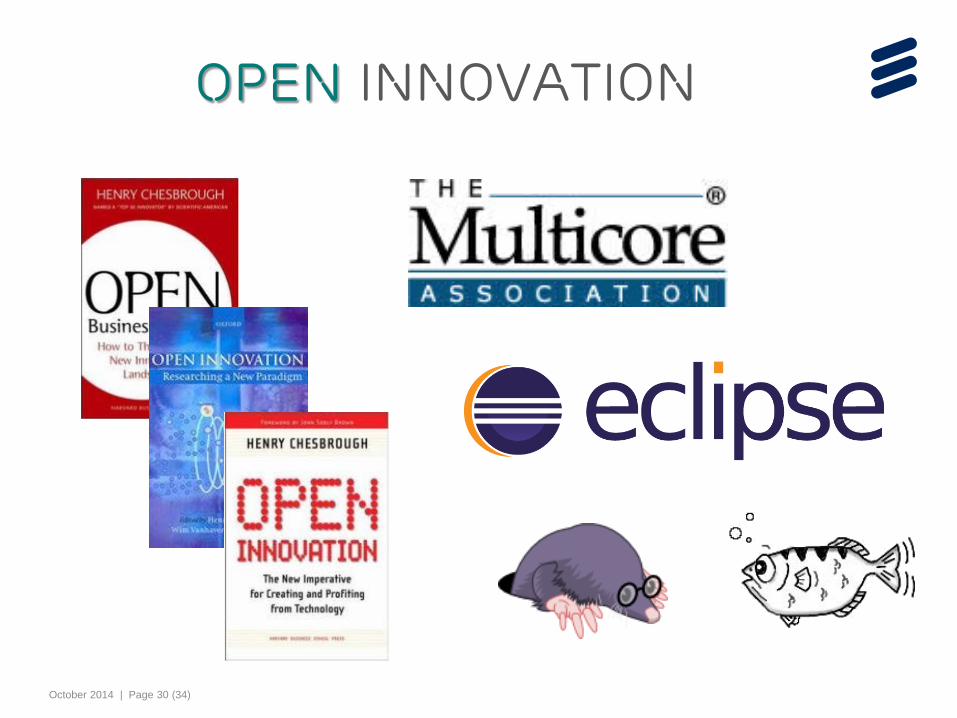
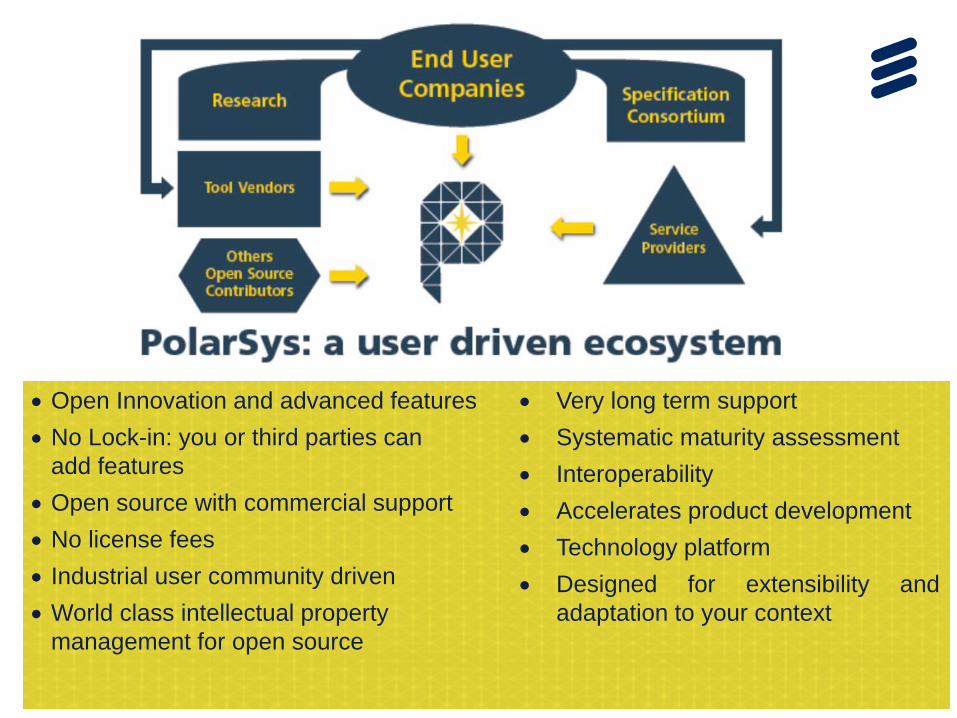
Open Innovation
October 2014 | Page 31 (34)
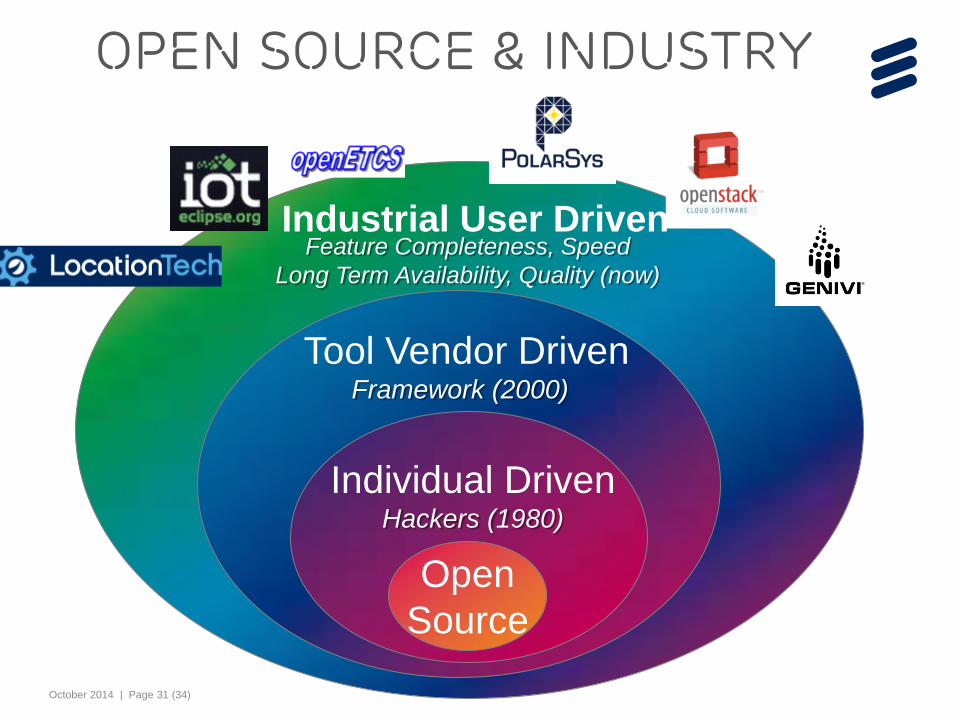
Open Source & Industry
Open Source
Individual Driven Hackers (1980)
Tool Vendor Driven Framework (2000)
Industrial User Driven Feature Completeness, Speed
Long Term Availability, Quality (now)
October 2014 | Page 32 (34)
• Very long term support • Systematic maturity assessment • Interoperability • Accelerates product development • Technology platform • Designed for extensibility and
adaptation to your context
• Open Innovation and advanced features • No Lock-in: you or third parties can
add features • Open source with commercial support • No license fees • Industrial user community driven • World class intellectual property
management for open source
October 2014 | Page 33 (34)
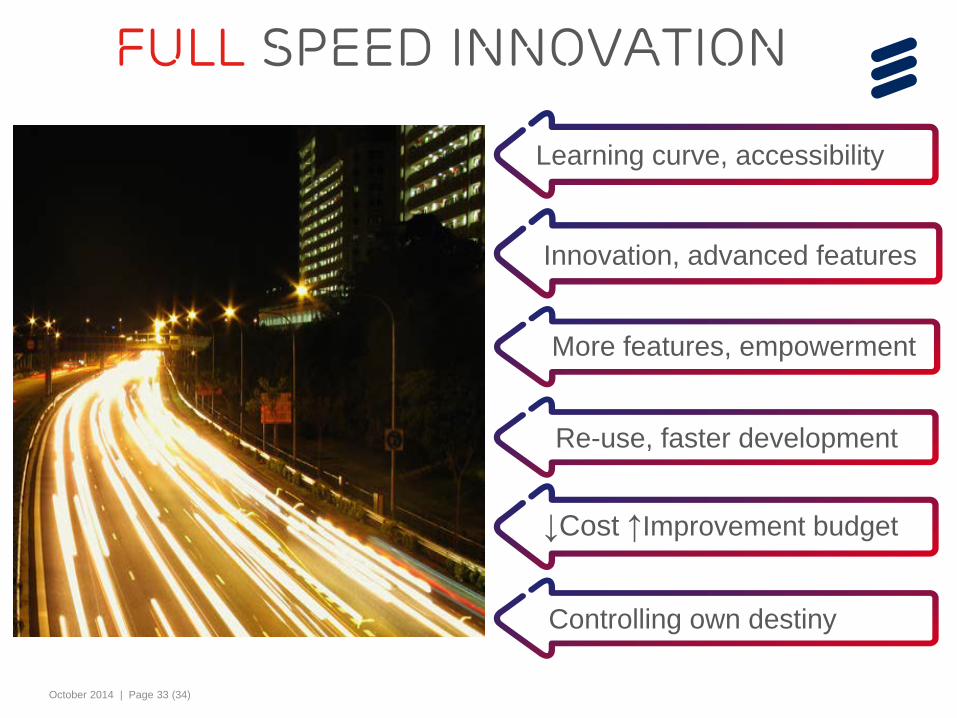
FULL Speed Innovation
Controlling own destiny
Learning curve, accessibility
↓Cost ↑Improvement budget
Re-use, faster development
Innovation, advanced features
More features, empowerment
dominique <dot> toupin <at> ericsson <dot> com


![Toupin Genealogy Descendants - arslanmb.org · Toupin Family Genealogy Descendants of René Toupin [#3] & Geneviève Langlois Generations 1-8 Mark B. Arslan 407 Highlands Lake Drive](https://img.pdfslide.us/doc/110x75/5b9e712009d3f2083f8baf7f/toupin-genealogy-descendants-toupin-family-genealogy-descendants-of-rene.jpg)