Embed Size (px)
Citation preview
Domestic Value Added in Chinese Exports�
Hiau Looi Keey Heiwai Tangz
June, 2012
Preliminary and Incomplete. Comments are welcome.
Abstract
In this paper, we use transaction-level trade data and �rm-level production data to assess the
domestic value added (DVA) in Chinese processing exports. Using export and import data for
processing �rms over 2000-2006, we compute the DVA ratio (DVAR) to gross exports for each
�rm and industry. Despite a substantial heterogeneity across industries, the average DVA ratio
in Chinese processing exports has risen from 35 percent in 2000 to 49 percent in 2006. Firm-level
regression results suggest that the rising DVAR is mainly driven by �rms substituting imported
materials with domestic materials. We also �nd that the substitution is in part due to the
large in�ux of foreign direct investments that induce the production of domestic intermediates.
Changes in wages and exchange rates do not seem to a¤ect �rms�DAVR. In sum, our results
show that Chinese exporters have been expanding along the global supply chain and are no
longer only responsible for the �nal stages of production.
Key Words domestic value added, value added trade, China
JEL Classi�cation Numbers: F2
�We thank David Hummels, Robert Johnson, and Shang-Jin Wei for discussions and comments. We are alsograteful for the participants at the IMF/WB/WTO Joint Workshop 2011 and Penn State-Tsinghua University con-ference on �China and the World Economy� in 2012 for feedbacks. The results and opinions present in this paperare entirely those of our own, and do not necessarily represent the views of the World Bank, its Executive Directors,or the countries they represent.
yDevelopment Research Group, The World Bank, Washington, DC 20433, USA; Tel.: (202)473-4155; Fax:(202)522-1159; e-mail: [email protected].
zDepartment of Economics, Tufts University and MIT Sloan School of Management; Tel.:(617)627-5947; email:[email protected].
1
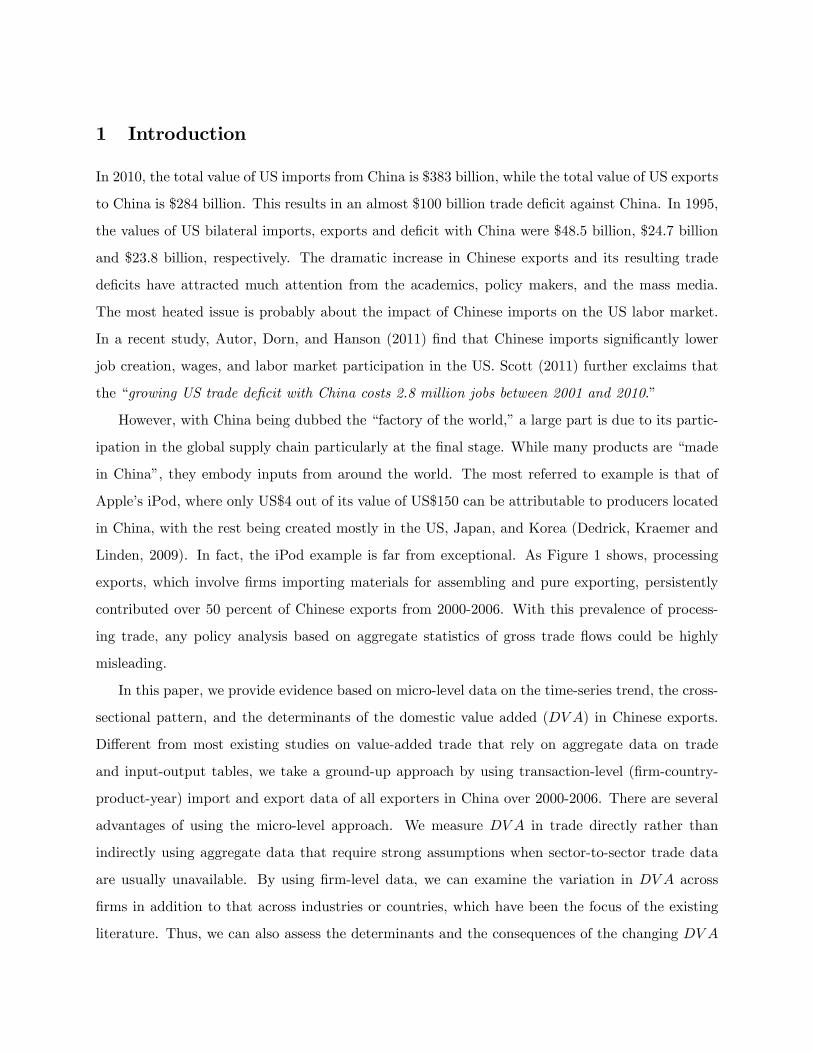
1 Introduction
In 2010, the total value of US imports from China is $383 billion, while the total value of US exports
to China is $284 billion. This results in an almost $100 billion trade de�cit against China. In 1995,
the values of US bilateral imports, exports and de�cit with China were $48.5 billion, $24.7 billion
and $23.8 billion, respectively. The dramatic increase in Chinese exports and its resulting trade
de�cits have attracted much attention from the academics, policy makers, and the mass media.
The most heated issue is probably about the impact of Chinese imports on the US labor market.
In a recent study, Autor, Dorn, and Hanson (2011) �nd that Chinese imports signi�cantly lower
job creation, wages, and labor market participation in the US. Scott (2011) further exclaims that
the �growing US trade de�cit with China costs 2.8 million jobs between 2001 and 2010.�
However, with China being dubbed the �factory of the world,�a large part is due to its partic-
ipation in the global supply chain particularly at the �nal stage. While many products are �made
in China�, they embody inputs from around the world. The most referred to example is that of
Apple�s iPod, where only US$4 out of its value of US$150 can be attributable to producers located
in China, with the rest being created mostly in the US, Japan, and Korea (Dedrick, Kraemer and
Linden, 2009). In fact, the iPod example is far from exceptional. As Figure 1 shows, processing
exports, which involve �rms importing materials for assembling and pure exporting, persistently
contributed over 50 percent of Chinese exports from 2000-2006. With this prevalence of process-
ing trade, any policy analysis based on aggregate statistics of gross trade �ows could be highly
misleading.
In this paper, we provide evidence based on micro-level data on the time-series trend, the cross-
sectional pattern, and the determinants of the domestic value added (DV A) in Chinese exports.
Di¤erent from most existing studies on value-added trade that rely on aggregate data on trade
and input-output tables, we take a ground-up approach by using transaction-level (�rm-country-
product-year) import and export data of all exporters in China over 2000-2006. There are several
advantages of using the micro-level approach. We measure DV A in trade directly rather than
indirectly using aggregate data that require strong assumptions when sector-to-sector trade data
are usually unavailable. By using �rm-level data, we can examine the variation in DV A across
�rms in addition to that across industries or countries, which have been the focus of the existing
literature. Thus, we can also assess the determinants and the consequences of the changing DV A
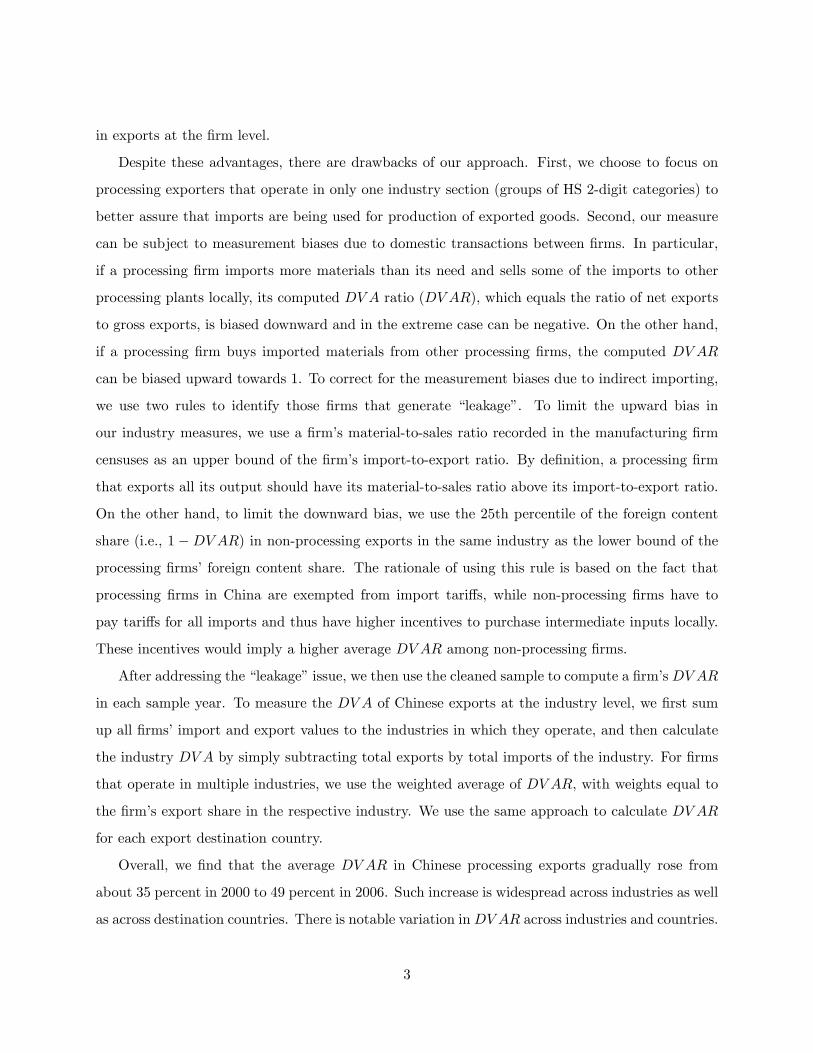
in exports at the �rm level.
Despite these advantages, there are drawbacks of our approach. First, we choose to focus on
processing exporters that operate in only one industry section (groups of HS 2-digit categories) to
better assure that imports are being used for production of exported goods. Second, our measure
can be subject to measurement biases due to domestic transactions between �rms. In particular,
if a processing �rm imports more materials than its need and sells some of the imports to other
processing plants locally, its computed DV A ratio (DV AR), which equals the ratio of net exports
to gross exports, is biased downward and in the extreme case can be negative. On the other hand,
if a processing �rm buys imported materials from other processing �rms, the computed DV AR
can be biased upward towards 1. To correct for the measurement biases due to indirect importing,
we use two rules to identify those �rms that generate �leakage�. To limit the upward bias in
our industry measures, we use a �rm�s material-to-sales ratio recorded in the manufacturing �rm
censuses as an upper bound of the �rm�s import-to-export ratio. By de�nition, a processing �rm
that exports all its output should have its material-to-sales ratio above its import-to-export ratio.
On the other hand, to limit the downward bias, we use the 25th percentile of the foreign content
share (i.e., 1 �DV AR) in non-processing exports in the same industry as the lower bound of the
processing �rms�foreign content share. The rationale of using this rule is based on the fact that
processing �rms in China are exempted from import tari¤s, while non-processing �rms have to
pay tari¤s for all imports and thus have higher incentives to purchase intermediate inputs locally.
These incentives would imply a higher average DV AR among non-processing �rms.
After addressing the �leakage�issue, we then use the cleaned sample to compute a �rm�s DV AR
in each sample year. To measure the DV A of Chinese exports at the industry level, we �rst sum
up all �rms�import and export values to the industries in which they operate, and then calculate
the industry DV A by simply subtracting total exports by total imports of the industry. For �rms
that operate in multiple industries, we use the weighted average of DV AR, with weights equal to
the �rm�s export share in the respective industry. We use the same approach to calculate DV AR
for each export destination country.
Overall, we �nd that the average DV AR in Chinese processing exports gradually rose from
about 35 percent in 2000 to 49 percent in 2006. Such increase is widespread across industries as well
as across destination countries. There is notable variation inDV AR across industries and countries.
3
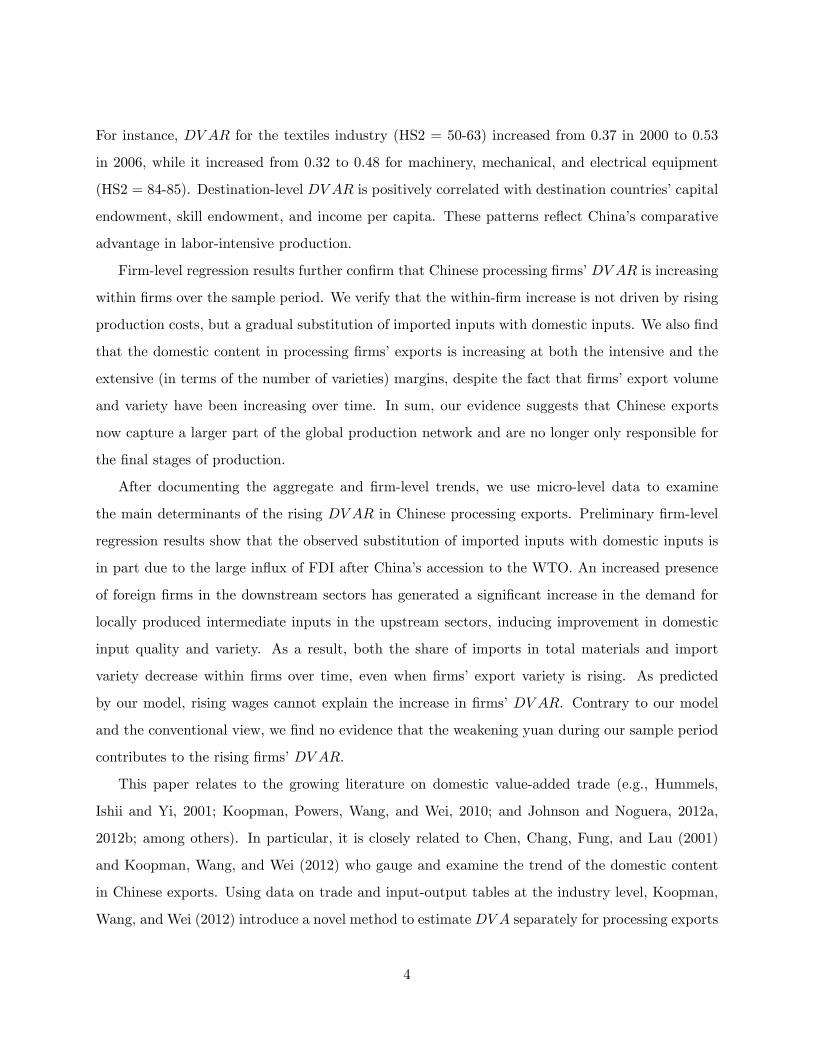
For instance, DV AR for the textiles industry (HS2 = 50-63) increased from 0.37 in 2000 to 0.53
in 2006, while it increased from 0.32 to 0.48 for machinery, mechanical, and electrical equipment
(HS2 = 84-85). Destination-level DV AR is positively correlated with destination countries�capital
endowment, skill endowment, and income per capita. These patterns re�ect China�s comparative
advantage in labor-intensive production.
Firm-level regression results further con�rm that Chinese processing �rms�DV AR is increasing
within �rms over the sample period. We verify that the within-�rm increase is not driven by rising
production costs, but a gradual substitution of imported inputs with domestic inputs. We also �nd
that the domestic content in processing �rms�exports is increasing at both the intensive and the
extensive (in terms of the number of varieties) margins, despite the fact that �rms�export volume
and variety have been increasing over time. In sum, our evidence suggests that Chinese exports
now capture a larger part of the global production network and are no longer only responsible for
the �nal stages of production.
After documenting the aggregate and �rm-level trends, we use micro-level data to examine
the main determinants of the rising DV AR in Chinese processing exports. Preliminary �rm-level
regression results show that the observed substitution of imported inputs with domestic inputs is
in part due to the large in�ux of FDI after China�s accession to the WTO. An increased presence
of foreign �rms in the downstream sectors has generated a signi�cant increase in the demand for
locally produced intermediate inputs in the upstream sectors, inducing improvement in domestic
input quality and variety. As a result, both the share of imports in total materials and import
variety decrease within �rms over time, even when �rms� export variety is rising. As predicted
by our model, rising wages cannot explain the increase in �rms�DV AR. Contrary to our model
and the conventional view, we �nd no evidence that the weakening yuan during our sample period
contributes to the rising �rms�DV AR.
This paper relates to the growing literature on domestic value-added trade (e.g., Hummels,
Ishii and Yi, 2001; Koopman, Powers, Wang, and Wei, 2010; and Johnson and Noguera, 2012a,
2012b; among others). In particular, it is closely related to Chen, Chang, Fung, and Lau (2001)
and Koopman, Wang, and Wei (2012) who gauge and examine the trend of the domestic content
in Chinese exports. Using data on trade and input-output tables at the industry level, Koopman,
Wang, and Wei (2012) introduce a novel method to estimate DV A separately for processing exports
4
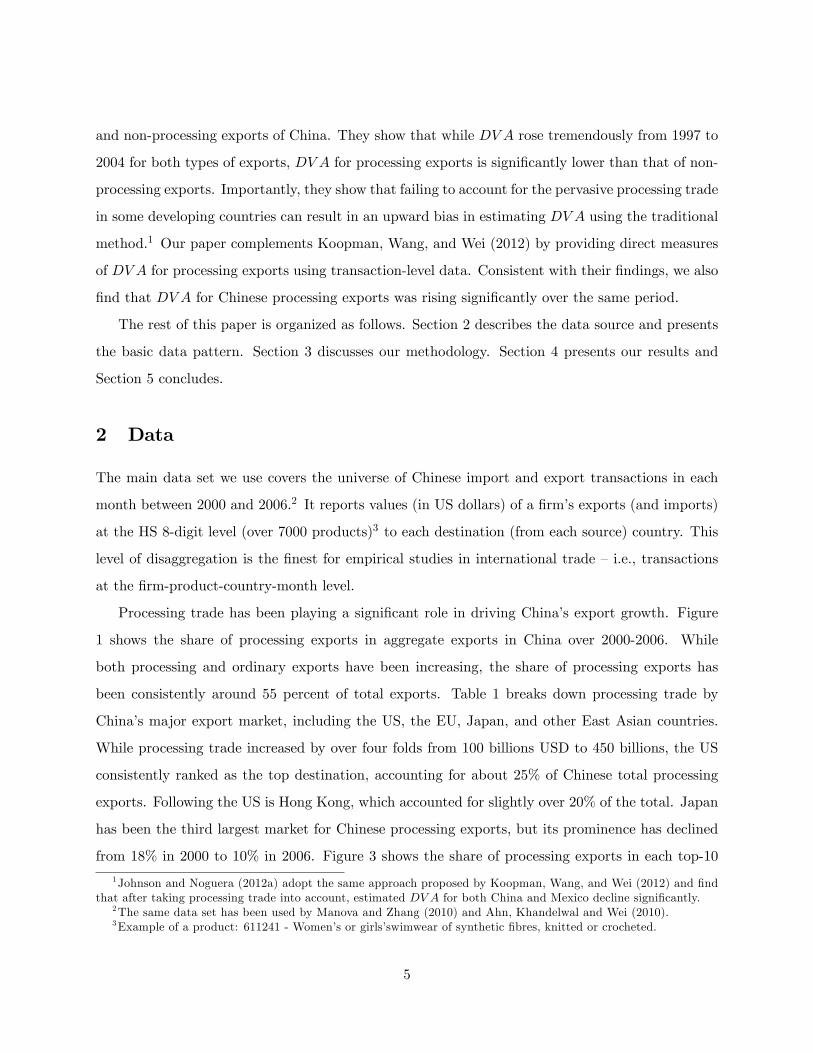
and non-processing exports of China. They show that while DV A rose tremendously from 1997 to
2004 for both types of exports, DV A for processing exports is signi�cantly lower than that of non-
processing exports. Importantly, they show that failing to account for the pervasive processing trade
in some developing countries can result in an upward bias in estimating DV A using the traditional
method.1 Our paper complements Koopman, Wang, and Wei (2012) by providing direct measures
of DV A for processing exports using transaction-level data. Consistent with their �ndings, we also
�nd that DV A for Chinese processing exports was rising signi�cantly over the same period.
The rest of this paper is organized as follows. Section 2 describes the data source and presents
the basic data pattern. Section 3 discusses our methodology. Section 4 presents our results and
Section 5 concludes.
2 Data
The main data set we use covers the universe of Chinese import and export transactions in each
month between 2000 and 2006.2 It reports values (in US dollars) of a �rm�s exports (and imports)
at the HS 8-digit level (over 7000 products)3 to each destination (from each source) country. This
level of disaggregation is the �nest for empirical studies in international trade �i.e., transactions
at the �rm-product-country-month level.
Processing trade has been playing a signi�cant role in driving China�s export growth. Figure
1 shows the share of processing exports in aggregate exports in China over 2000-2006. While
both processing and ordinary exports have been increasing, the share of processing exports has
been consistently around 55 percent of total exports. Table 1 breaks down processing trade by
China�s major export market, including the US, the EU, Japan, and other East Asian countries.
While processing trade increased by over four folds from 100 billions USD to 450 billions, the US
consistently ranked as the top destination, accounting for about 25% of Chinese total processing
exports. Following the US is Hong Kong, which accounted for slightly over 20% of the total. Japan
has been the third largest market for Chinese processing exports, but its prominence has declined
from 18% in 2000 to 10% in 2006. Figure 3 shows the share of processing exports in each top-10
1Johnson and Noguera (2012a) adopt the same approach proposed by Koopman, Wang, and Wei (2012) and �ndthat after taking processing trade into account, estimated DV A for both China and Mexico decline signi�cantly.
2The same data set has been used by Manova and Zhang (2010) and Ahn, Khandelwal and Wei (2010).3Example of a product: 611241 - Women�s or girls�swimwear of synthetic �bres, knitted or crocheted.
5
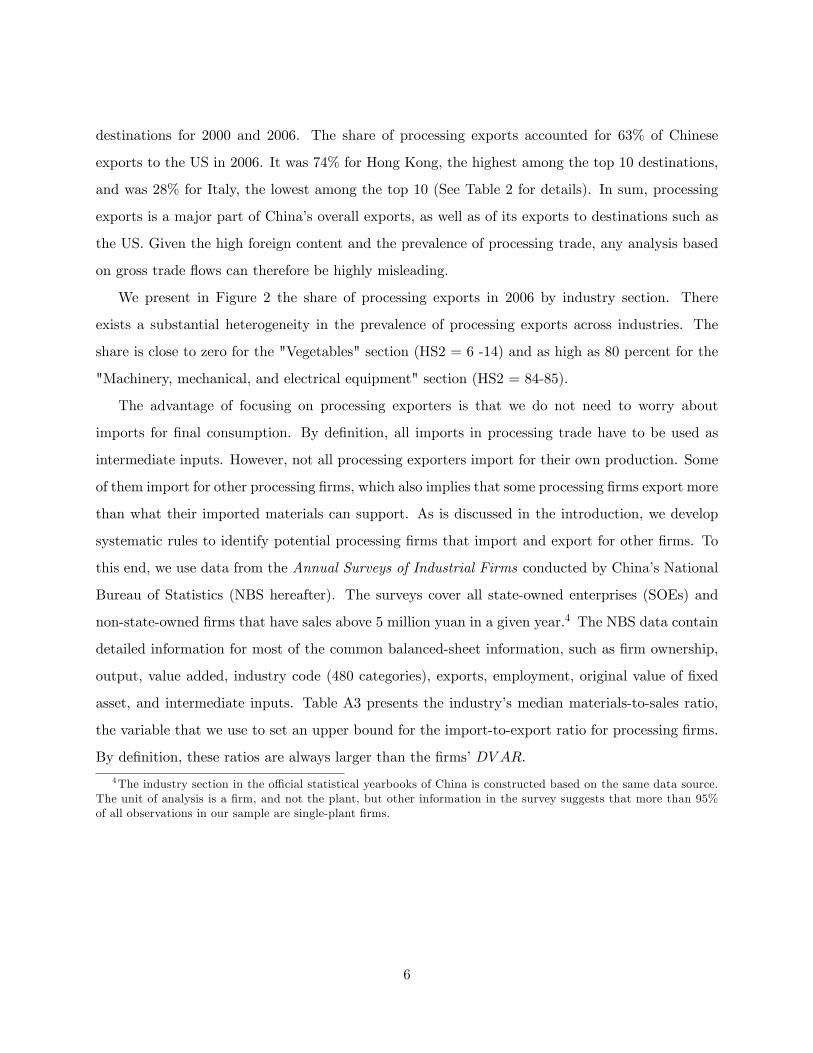
destinations for 2000 and 2006. The share of processing exports accounted for 63% of Chinese
exports to the US in 2006. It was 74% for Hong Kong, the highest among the top 10 destinations,
and was 28% for Italy, the lowest among the top 10 (See Table 2 for details). In sum, processing
exports is a major part of China�s overall exports, as well as of its exports to destinations such as
the US. Given the high foreign content and the prevalence of processing trade, any analysis based
on gross trade �ows can therefore be highly misleading.
We present in Figure 2 the share of processing exports in 2006 by industry section. There
exists a substantial heterogeneity in the prevalence of processing exports across industries. The
share is close to zero for the "Vegetables" section (HS2 = 6 -14) and as high as 80 percent for the
"Machinery, mechanical, and electrical equipment" section (HS2 = 84-85).
The advantage of focusing on processing exporters is that we do not need to worry about
imports for �nal consumption. By de�nition, all imports in processing trade have to be used as
intermediate inputs. However, not all processing exporters import for their own production. Some
of them import for other processing �rms, which also implies that some processing �rms export more
than what their imported materials can support. As is discussed in the introduction, we develop
systematic rules to identify potential processing �rms that import and export for other �rms. To
this end, we use data from the Annual Surveys of Industrial Firms conducted by China�s National
Bureau of Statistics (NBS hereafter). The surveys cover all state-owned enterprises (SOEs) and
non-state-owned �rms that have sales above 5 million yuan in a given year.4 The NBS data contain
detailed information for most of the common balanced-sheet information, such as �rm ownership,
output, value added, industry code (480 categories), exports, employment, original value of �xed
asset, and intermediate inputs. Table A3 presents the industry�s median materials-to-sales ratio,
the variable that we use to set an upper bound for the import-to-export ratio for processing �rms.
By de�nition, these ratios are always larger than the �rms�DV AR.
4The industry section in the o¢ cial statistical yearbooks of China is constructed based on the same data source.The unit of analysis is a �rm, and not the plant, but other information in the survey suggests that more than 95%of all observations in our sample are single-plant �rms.
6
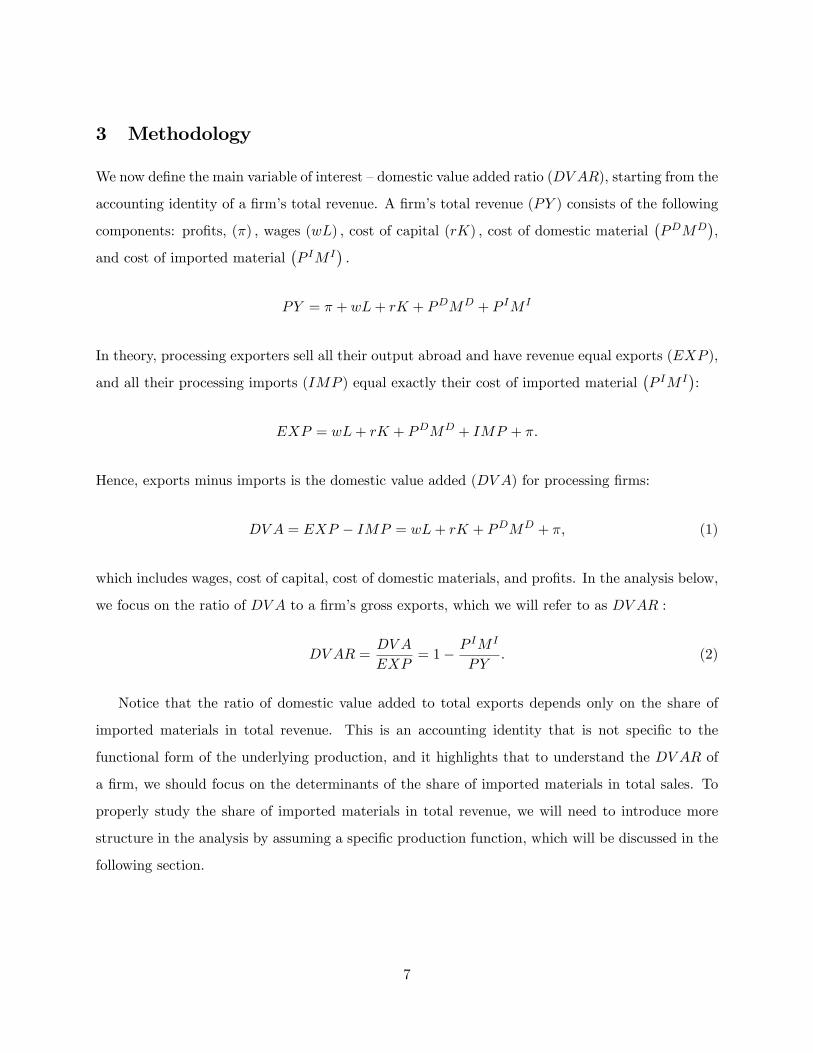
3 Methodology
We now de�ne the main variable of interest �domestic value added ratio (DV AR), starting from the
accounting identity of a �rm�s total revenue. A �rm�s total revenue (PY ) consists of the following
components: pro�ts, (�) ; wages (wL) ; cost of capital (rK) ; cost of domestic material�PDMD
�,
and cost of imported material�P IM I
�:
PY = � + wL+ rK + PDMD + P IM I
In theory, processing exporters sell all their output abroad and have revenue equal exports (EXP ),
and all their processing imports (IMP ) equal exactly their cost of imported material�P IM I
�:
EXP = wL+ rK + PDMD + IMP + �:
Hence, exports minus imports is the domestic value added (DV A) for processing �rms:
DV A = EXP � IMP = wL+ rK + PDMD + �; (1)
which includes wages, cost of capital, cost of domestic materials, and pro�ts. In the analysis below,
we focus on the ratio of DV A to a �rm�s gross exports, which we will refer to as DV AR :
DV AR =DV A
EXP= 1� P
IM I
PY: (2)
Notice that the ratio of domestic value added to total exports depends only on the share of
imported materials in total revenue. This is an accounting identity that is not speci�c to the
functional form of the underlying production, and it highlights that to understand the DV AR of
a �rm, we should focus on the determinants of the share of imported materials in total sales. To
properly study the share of imported materials in total revenue, we will need to introduce more
structure in the analysis by assuming a speci�c production function, which will be discussed in the
following section.
7
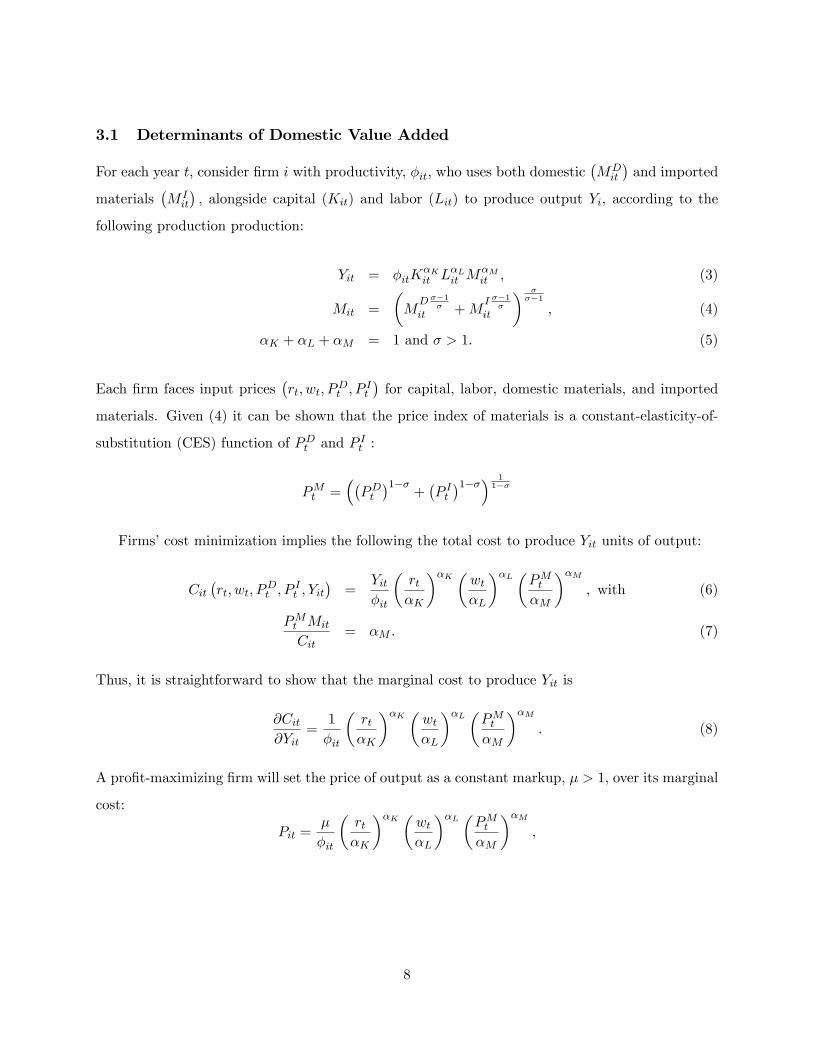
3.1 Determinants of Domestic Value Added
For each year t; consider �rm i with productivity, �it; who uses both domestic�MDit
�and imported
materials�M Iit
�; alongside capital (Kit) and labor (Lit) to produce output Yi, according to the
following production production:
Yit = �itK�Kit L
�Lit M
�Mit ; (3)
Mit =
�MD ��1
�it +M
I ��1�
it
� ���1
; (4)
�K + �L + �M = 1 and � > 1: (5)
Each �rm faces input prices�rt; wt; P
Dt ; P
It
�for capital, labor, domestic materials, and imported
materials. Given (4) it can be shown that the price index of materials is a constant-elasticity-of-
substitution (CES) function of PDt and P It :
PMt =��PDt�1��
+�P It�1��� 1
1��
Firms�cost minimization implies the following the total cost to produce Yit units of output:
Cit�rt; wt; P
Dt ; P
It ; Yit
�=
Yit�it
�rt�K
��K �wt�L
��L �PMt�M
��M; with (6)
PMt Mit
Cit= �M : (7)
Thus, it is straightforward to show that the marginal cost to produce Yit is
@Cit@Yit
=1
�it
�rt�K
��K �wt�L
��L �PMt�M
��M: (8)
A pro�t-maximizing �rm will set the price of output as a constant markup, � > 1; over its marginal
cost:
Pit =�
�it
�rt�K
��K �wt�L
��L �PMt�M
��M;
8
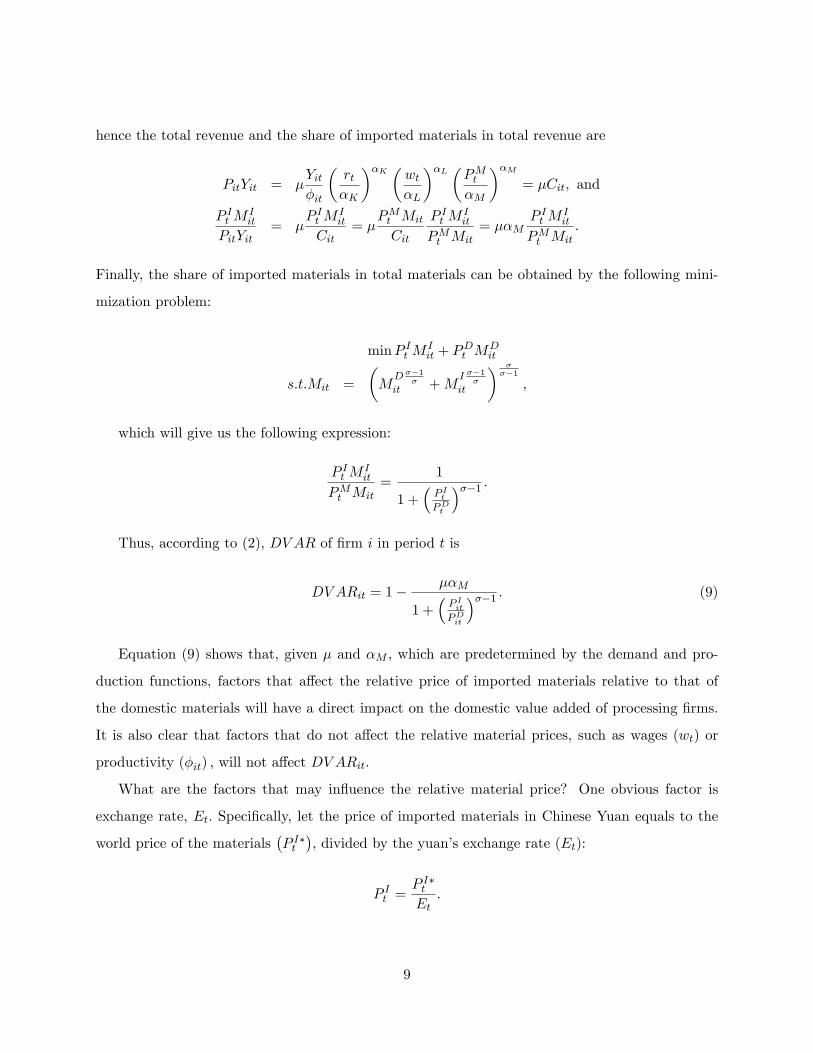
hence the total revenue and the share of imported materials in total revenue are
PitYit = �Yit�it
�rt�K
��K �wt�L
��L �PMt�M
��M= �Cit; and
P It MIit
PitYit= �
P It MIit
Cit= �
PMt Mit
Cit
P It MIit
PMt Mit= ��M
P It MIit
PMt Mit:
Finally, the share of imported materials in total materials can be obtained by the following mini-
mization problem:
minP It MIit + P
Dt M
Dit
s:t:Mit =
�MD ��1
�it +M
I ��1�
it
� ���1
;
which will give us the following expression:
P It MIit
PMt Mit=
1
1 +�P ItPDt
���1 :Thus, according to (2), DV AR of �rm i in period t is
DV ARit = 1���M
1 +�P IitPDit
���1 : (9)
Equation (9) shows that, given � and �M ; which are predetermined by the demand and pro-
duction functions, factors that a¤ect the relative price of imported materials relative to that of
the domestic materials will have a direct impact on the domestic value added of processing �rms.
It is also clear that factors that do not a¤ect the relative material prices, such as wages (wt) or
productivity (�it) ; will not a¤ect DV ARit:
What are the factors that may in�uence the relative material price? One obvious factor is
exchange rate, Et: Speci�cally, let the price of imported materials in Chinese Yuan equals to the
world price of the materials�P I�t
�, divided by the yuan�s exchange rate (Et):
P It =P I�tEt:
9
A depreciation of Chinese yuan (a lower Eit) causes the price of imported materials in yuan to be
higher. That will cause DV AR to be higher according to (9) :
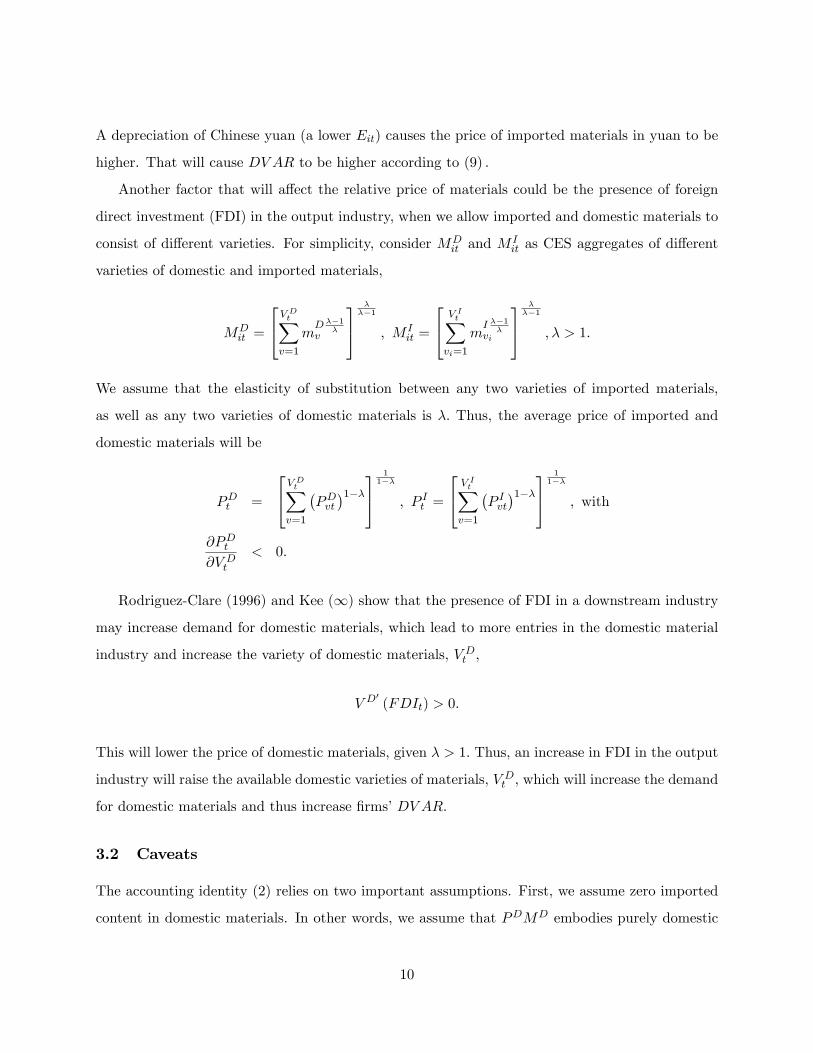
Another factor that will a¤ect the relative price of materials could be the presence of foreign
direct investment (FDI) in the output industry, when we allow imported and domestic materials to
consist of di¤erent varieties. For simplicity, consider MDit and M
Iit as CES aggregates of di¤erent
varieties of domestic and imported materials,
MDit =
24V DtXv=1
mD ��1
�v
35�
��1
; M Iit =
24 V ItXvi=1
mI ��1
�vi
35�
��1
; � > 1:
We assume that the elasticity of substitution between any two varieties of imported materials,
as well as any two varieties of domestic materials is �: Thus, the average price of imported and
domestic materials will be
PDt =
24V DtXv=1
�PDvt�1��35
11��
; P It =
24 V ItXv=1
�P Ivt�1��35
11��
; with
@PDt@V Dt
< 0:
Rodriguez-Clare (1996) and Kee (1) show that the presence of FDI in a downstream industry
may increase demand for domestic materials, which lead to more entries in the domestic material
industry and increase the variety of domestic materials, V Dt ;
V D0(FDIt) > 0:
This will lower the price of domestic materials, given � > 1: Thus, an increase in FDI in the output
industry will raise the available domestic varieties of materials, V Dt , which will increase the demand
for domestic materials and thus increase �rms�DV AR.
3.2 Caveats
The accounting identity (2) relies on two important assumptions. First, we assume zero imported
content in domestic materials. In other words, we assume that PDMD embodies purely domestic
10
content. Second, we assume that imported materials have no Chinese content, such that IMP
is completely foreign-made. If the �rst assumption is violated (i.e., the PDMD embodies foreign
content), DV A will be over-estimated based on (1). On the other hand, if the second assumption is
violated (i.e., IMP embodies domestic content), DV A will be under-estimated. The net bias will
depend on the extent each assumption is violated, but there is little information for us to assess
the direction of the bias at this stage. However, the existing estimates by Hummels, Ishii, and Yi
(2001) and Koopman, Wang, and Wei (2012) show that for Chinese processing trade, the foreign
content in domestic materials is around 5 to 10 percent. We will take the conservative estimate of
10 percent and discount all our DV AR measures by 10 percent for all �rms in all industries.
There is another caveat regarding using (2) to estimate DV AR: This is speci�c to the Chinese
context as processing �rms are legally permitted to sell their imported materials domestically and
bene�ted from tari¤ exemption, as long as the buyer is also a registered processing �rm. The buying
and selling of unused imported materials between two processing �rms are widespread in the Chinese
customs data and it introduces a lot of noise in the calculation of DV AR: In the extreme cases,
some of the DV AR are negative when processing import is larger than processing export. One
way to get around this is to rely on industry input-output tables. However, by construction, input-
output tables assume proportionality in the construction that all �rms within the same industry are
assumed to be completely homogeneous in terms of products and technology. This is not the case
from what we observe in the Chinese customs data. Even within a very narrowly de�ned industry,
the products and technology of �rms vary widely. Moreover, some processing �rms may consider the
purchases of imported materials from other processing �rms as domestic purchases, while others
may consider this kind of materials imported materials. On top of that there will be domestic
transaction costs such as markups and transportation or distribution fees involved in the trade of
imported materials among processing �rms. All these issues are completely sidestepped in the use
of an industry input-output table. Here we adopt a completely ground-up approach by only relying
on �rm-level information and focus on those �rms that can give us reliable DV AR estimates. We
will discuss how we �lter out those processing �rms that engage in indirect importing and exporting
in the following section.
11
3.3 Dealing with Indirect Importing
Under the current customs regulations in China, processing �rms can legally sell imported materials
to other processing �rms for export processing. Such transactions are not con�ned within the same
industries or geographic locations.5 For example, a shoes processing exporter may import leather
and sells it to a handbag processing exporter. While it is not clear how common the practice of
indirect importing is, it impacts the way we construct �rm-level DV AR based on (1). In particular,
for �rms that import more than their needs (the excessive importers), using (1) may underestimate
theirDV AR; and in the extreme scenario may causeDV AR to be negative (issue (i)).6 On the other
hand, for �rms that buy imported materials from other processing �rms (the excessive exporters),
using (1) may overestimate their DV AR; and in the extreme scenario, may cause DV AR to be
very close to 1 (issue (ii)).
To address the complication due to indirect importing, we need to �rst identify the excessive
importers and exporters. To this end, we use data from the Annual Surveys of Industrial Firms
conducted by China�s National Bureau of Statistics (NBS) for 2000-2006, which we refer to as NBS
data from now on. In particular, we use a �rm�s material-to-sales ratio to set an upper bound of
the �rm�s import-to-export ratio. To this end, we �rst merge the transaction-level trade data with
the NBS data.7 Not all the �rms from the two data sets can be merged. Table 3 and 4 presents
the size of the merged sample relative to the full sample. In terms of the number of �rms, about
16% of the single-section processing exporters from the customs were merged with the NBS data
and survive our �lters that weed out excessive importers. In terms of the export value, our �nal
sample covers about 32% of the original customs sample. Importantly, all manufacturing industry
sections were covered in almost all years.
Total material costs presumably consist of costs of domestic and imported materials. For these
export processing �rms, the value of total sales is very close to that of total exports reported in
the customs data. Hence, we can use the ratio of total material costs to total sales to set an upper
5See Regulations Concerning Customs Supervision and Control over the Inward Processing and Assembling Oper-ation by the Ministry of Commerce of China:http://english.mofcom.gov.cn/aarticle/lawsdata/chineselaw/200211/20021100053665.html6 In the raw data about 10 percent of the single-section �rms have negative net exports.7Since there is no common �rm identi�er that exists in both data sets, we use �rm names to do the merge. For
rare cases that have duplicate �rm names, we use the �rm�s address to improve the merge. Depending on the year,37-48% of export value in the trade data set is successfully merged to the NBS �rm data set. On average, 70% ofexport value reported in NBS is covered. See Ma, Tang, and Zhang (2012) for details.
12
bound for the import-to-export ratio for these �rms as follows:
PDMD + P IM I
PY> P IM I
PY=IMP
EXP:
Hence, we only focus on the single-section export-processing �rms that have their import-to-export
ratio no greater than the material-to-output ratio. This helps us weed out the excessive importers.
On the other side of the same token, there are processing �rms that appear to import too
little as they purchase intermediate inputs from other processing �rms locally. To identify these
�excessive exporters�(issue (ii) above), we use the 25th percentile of DV AR of the single-section
non-processing �rms that export within the same industry section.8 We �rst identify all registered
ordinary exporters that only export in one industry section. Unlike processing �rms, these exporters
are not obliged to export all products that use imported materials. They need to pay tari¤s on
imports and can use the imported materials for both domestic and foreign sales. Their incentives to
use imported materials are thus lower than processing traders. In addition, they are not restricted
by customs regulations whom to sell in the domestic economy. Thus, the DV AR of ordinary
exporters should be higher than processing �rms in the same industry section. Figure 4 plots the
median DV AR of processing exporters against the 25th percentile of DV AR of ordinary exporters
across industry sections. As is shown, the former are always higher than the latter. In sum, we focus
on single-section processing exporters that have their import-to-export ratio bounded between the
two cuto¤s as follows:
PDMD + P IM I
PY> IMP
EXP>�IMP
EXP
�OT(25)
; where (10)
DV AROT(25) = 1��IMPEXP
�OT(25)
is the 25 percentile of the DV AR of ordinary exporters within the same
industry section.9 Using this �ltered set of �rms with excessive importers and exporters removed,
8All empirical results are quantitatively similar if we use the 50th percentile of ordindary traders�DVAR.9Sometimes, particularly for those industries that use a lot of commodities based materials such as iron, copper
and crude oil, �rms have incentive to stock up imported materials when the international prices of such commoditiesare low in order to hedge again rising prices in the future. Thus, for this reason, the contemporary imports may notbe fully used by the contemporary exports within a �rm. For these �rms, the calculation of DV A based on (1) maynot be accurate.There is no easy way to get around the issue of inventory management. As it will be shown in the next section,
almost all the negative DV A HS 2 observations are no longer negative once we use (10) to select �rms to constructindustry DV A: This suggests that while inventory management could be important, it may not a¤ect our results,except for those industries that heavily rely on commodities with volatile international prices.
13
we obtain the DV A in exports in each industry section by subtracting total imports from total
exports.
3.4 Dealing with Multi-industry �rms
We can infer DV A based on (1) for all �rms, regardless of how many products they produce.
However, if our goal is to calculate DV A of Chinese exports at the product or industry level,
information from multi-industry �rms is not too useful. The reason is that how a multi-industry
�rm assigns the imported materials to the production of products in di¤erent industries is generally
not observable in the data. Thus, we focus on the subset of export-processing �rms that only
operate within a single industry section (20 of them), according to the United Nations industry
classi�cation.10 Examples of an industry section include Chemical Products (HS2 = 28-38), Textiles
(HS2 = 50-63), Footwear and Headgear, etc. (HS2 = 64-67), and Machinery, Mechanical, Electrical
Equipment (HS2 = 84-85). For these sets of single-industry processing �rms, while we do not know
the breakdown of its imports into each HS-2 or HS-6 categories, we know that all imports into an
industry section are used in production of exported products within that section (subject to the
potential "leakage" problem as discussed above). Using the sample of single-section exporters, we
are able to estimate the average DV A for each section.
Let us reiterate the procedures of constructing the �rm-level data set. We keep export-processing
�rms in the transaction-level data set who export in a single industry section.11 We then merge the
customs data to the production data from the NBS manufacturing surveys, and apply the material-
sales bound to remove the �excessive importers� in the sample, as speci�ed in (10). Then we use
the 25th percentile of the ordinary exporters�DV AR from each section to remove the �excessive
exporters.�We use the �nal cleaned sample to conduct sector-level, country-level, and �rm-level
analyses below.
10See http://unstats.un.org/unsd/tradekb/Knowledgebase/HS-Classi�cation-by-Section.11 In the customs data, there are records showing imports from China. Goods are �rst exported from China and
re-imported possibly due to VAT avoidance or transport cost saving. See Liu (2012).
14
4 Results
4.1 Cross-sectional Pattern
The cleaned data set contains unique single-section 5641 processing exporters in 7 years (2000-
2006), It covers over 34% of total processing export value as reported in the transaction-level data
(see 4). We also repeat our �rm-level regression analysis using a balanced sample of �rms to make
sure that all our results are not driven by entry/exit of �rms. The results remain quantitatively
similar.
Our sample over all 20 industry sections throughout the sample period. Figure 7 presents the
overall results. The (weighted) average DV AR across all industry sections in Chinese processing
exports (DV AR) has been rising. It was 35 percent in 2000, and by 2006, it reached 49 percent.
Figure 8 shows the average �rm DV AR by industry section for the year 2006. Figure 9 shows
the distributions of the DV AR across industry sections for 2000, 2003 and 2006. It is clear that
across the board, the share of domestic content in Chinese processing exports is increasing over
time. As is shown in Table A2, the industry sections that have the highest DV AR are Vehicles and
Aircrafts (HS2 = 86-89; DV AR = 0:690), Vegetables (HS2 = 6-14; 0:679), and Live Animals (HS
= 1-5; 0:633). In 2000, the top 3 industry sections with the highest DV AR are Wood and Articles
(HS2 = 44-46; DV AR = 0:568), Stone, Plaster, and Cement (HS2 = 68-70; DV AR = 0:531), and
Beverages and Spirits (HS2 = 16-24; DV AR = 0:473). In 2006, the industries with lowest DV AR
are Precious Metals (HS = 71; 0:315), Plastics and Rubber (HS = 39-40; 0:325), and Animal and
Vegetable Oil (HS2 = 15; 0:399). The full list of DV AR for all industries and the corresponding
DV AR can be found in Table A2.
Across export destinations, DV AR tends to be positively correlated with destination countries�
capital abundance, skill abundance, and income per capita (see Figure 10, Figure 11, and Figure
12). Regardless, there is an across-the-board rise in the DV AR in Chinese processing exports to
most destination countries.
What cause DV AR to increase over time? One possibility is the rising costs of production in
China. From (2) it is clear that higher wages or prices of domestic materials will push DV AR up,
unless it is o¤set by a reduction in the pro�t margins of the �rms. Alternatively, the rise in DV AR
could be a result of processing �rms substituting imported materials with domestic materials. Such
15
substitution may be caused by the fact that a larger fraction of the global production chains is
moving to China. If the second reason is the main culprit behind the rising DV AR in Chinese
exports, then the threat that Chinese workers are replacing workers in other countries, such as the
US, is larger.
4.2 Firm-level Analysis
To examine the �rm-level determinants of the rise in DV AR, we estimate the following regression
using the merged customs-NBS data:
DV ARit = �i + �t + �1
�wL
PY
�it
+ �2
�PDMD + P IM I
PY
�it
+ �it; (11)
where i stands for �rm, t represents year, and �it is the regression residual. The rising DV AR
within �rms over time will be captured by the year �xed e¤ects as follows,
�t > �t�1:
We include the material-to-sales ratio, PDMD+P IMI
PY , in (11) and the share of wages in total sales
as controls, based on equation (1). If �1 and �2 are both positive and signi�cant, while the year
�xed e¤ects are either not rising or insigni�cant, then the increasing domestic production costs is
the primary reason for the rise in DV AR: Conversely, if �1 and �2 are not positive and signi�cant,
while the year �xed e¤ects are rising and signi�cant, then it suggests that some imported materials
are being substituted with domestic materials, leaving the share of material costs in total sales
unchanged. While we have data for seven years (2000 to 2006), we omit the dummy for year
2000 in the regressions. That way, the coe¢ cients on the year dummies for 2001 to 2006 can be
interpreted as the within-�rm increase in DV AR in each year relative to 2000.
Table 5 presents our baseline results. Firm and year �xed e¤ects are always included. Column
(1) shows that all year �xed e¤ects are positive and signi�cant, suggesting that a �rm�s DV AR
is on average rising during the sample period. In particular, �rm DV AR increases on average by
18 percentage points from 2000 to 2006, which is similar in magnitude to the aggregate trend (see
Figure 7). Note that the aggregate trend can be driven by di¤erent �rms entering and exiting the
market in a systematic way. However, given that we control for �rm �xed e¤ects in the regression,
16
the within-�rm increase in DV AR is independent of the reallocation of �rms within the sector.
In other words, the regression results provide stronger support for the rising DV AR in Chinese
exports than what the aggregate trend depicts.
In Columns (2) to (5), we include wage rates, the share of the wage bill in total sales, as well
as the share of material costs in total revenue as regressors separately, in addition to �rm and
year �xed e¤ects. The idea of including these regressors is to examine whether the rising DV AR
is driven by either rising labor costs or the changing cost share of materials. According to our
model, wages should not matter for DV AR. In all speci�cations year �xed e¤ects remain positive,
rising, and signi�cant, while none of the control variables are positive and signi�cant. This suggests
that the within-�rm increase in DV AR is not driven by rising domestic costs of production, as is
de�ned in our accounting identity (1).12 We also repeat the same analysis for di¤erent samples by
ownership type (private, domestic private, foreign-owned). The results are presented in Columns
(6) to (8). Across all speci�cations, the year �xed e¤ects are always positive, rising and signi�cant,
suggesting that the within-�rm increase in DV AR is broad based and wide reaching and it is not
driven by certain �rms or industries.
Next, we examine whether the rising DV AR within �rms arises from Chinese processing ex-
porters substituting more imported materials with domestic materials over time. To this end, we
estimate the following speci�cation:
�IMP
Material
�it
= �i + �t + �1
�wL
PY
�it
+ �2 ln
�K
L
�it
+ �it;
where�
IMPMaterial
�itis the share of imported materials in total material cost for �rm i in year t, �i
and �t are �rm and year �xed e¤ect, respectively. Firm-level controls, including the wage-sales ratio
and the (log) capital-labor ratio, are included. If �rms are using more domestic materials in place
of imported materials, the year �xed e¤ects are expected to be declining, negative and signi�cant:
�t < �t�1 :
12We have also tried to include the pro�t-to-sales ratio as a regressor. While the coe¢ cient on the pro�t-to-salesis positive and signi�cant, as is speci�ed in(1), the year dummies remain quantitatively similar. We choose not toreport the speci�cation with pro�t-to-sales included as a regressor as the measurement error of pro�ts can be largein developing countries�data sets. Results are available upon request.
17
Table 6 presents the results. Similar to Table 5, we omit the year �xed e¤ect for 2000 in the
speci�cation. The coe¢ cient on a year dummy is thus interpreted as the within-�rm change in�IMP
Material
�itin that year relative to 2000. In Column (1) we only include �rm �xed e¤ects and
year �xed e¤ects. All the year �xed e¤ects are negative and signi�cant, suggesting that�
IMPMaterial
�it
is declining during the sample period. In particular, the result suggests that a �rm�s�
IMPMaterial
�it
dropped by about 16 percentage points in 2006 compared to 2000. This decisively indicates that
Chinese processing exporters are using more domestic materials relative to imported materials,
providing a reason for our �ndings that DV AR is increasing within �rms over time. When we
include other �rm controls and split the sample by ownership type of �rms, we continue to obtain
consistent and signi�cant results (columns (6)-(8)).
In Table 7, we further verify whether the decline in the share of imported materials in total
material cost is in part driven by the decline in the variety of imported materials. We measure
import variety by the count of imported HS6-country pairs at the �rm level. To empirically examine
the trend in import variety, we regress the log of a �rm�s number of import variety on �rm �xed
e¤ect, i; year �xed e¤ects, t, and the �rm-level controls as follows:
ln(import_varietyit) = i + t + 1
�wL
PY
�it
+ 2
�PDMD + P IM I
PY
�it
+ !it:
Similar to Table 6, all the year �xed e¤ects are negative, suggesting that on average, processing
�rms�import variety is declining over time. At the sample mean, the number of import varieties
decreased by 0.36 log points in 2006 relative to 2000. These �ndings are consistent with the
hypothesis that processing �rms are substituting imported inputs with domestic inputs at the
extensive margin.
One can argue that the decline in import variety can possibly be due to Chinese exporters
specializing in their core competence, and thus exporting and importing fewer varieties. To verify
this claim, we estimate the following speci�cation:
ln(Export_varietyit) = �i + �t + �1
�wL
PY
�it
+ �2
�PDMD + P IM I
PY
�it
+ uit,
where Export_varietyit is �rm i�s count of exported HS6-country pairs. Firm �xed e¤ects (�i),
year �xed e¤ects (�t), and other �rm-level control variables are included as before.
18
As is shown in Table 8, despite the decline in the share of imported materials in total material
cost and the decline in import variety, the number of varieties exported by a processing �rm is
rising over time, particularly after China�s accession to the WTO by the end of 2001. These results
show that while Chinese processing �rms are expanding their product scopes, they are reducing
their reliance on foreign imported inputs.
In sum, our empirical results suggest that the domestic content in Chinese processing exports
is rising over time. The rise is mainly driven by �rms actively substituting imported materials
with domestic materials, but not rising production costs. Nevertheless, in the last sample year
(2006), Chinese processing exports still embody substantial foreign content (40-50 percent), as
many anecdotes have described.
5 Possible reasons for the rising DVAR
What cause the Chinese processing �rms to substitute imported materials with domestic materials?
There are at least two main reasons behind the risingDV AR at the �rm level. As we argue in section
3.1, one reason is related to the weakening Chinese currency during our sample period. Another
reason is about the huge foreign direct investment (FDI) in�ow after China�s WTO accession at
the end of 2001.
From 2000 to 2006, the Chinese yuan has depreciated with respect to the currencies of most
China�s trade partners. A weaker yuan implied higher cost of imported materials (in yuans),
inducing �rms to turn to substitutes in the domestic market in order to minimize production
cost. Thus, we would expect a rising �rms�DV AR when the yuan is depreciating. To examine
this relation, we �rst construct a �rm-speci�c time-varying exchange rate (exposure to a yuan
appreciation). For each �rm i, let Iit be the set of common countries �rm i imports from in two
consecutive years, t and t� 1: Denote country j�s exchange rate with respect to the yuan for year
t and t� 1 by Ejt and Ejt�1; and its shares in �rm i0s imports in year t and t� 1 by sjt and sjt�1.
The �rm-speci�c rate of yuan appreciation with respect to source countries in year t is de�ned as
d lnEit =Xj2Iit
1
2(sjt + sjt�1) (lnEjt � lnEjt�1) :
19
Then the �rm-speci�c Tornqvist exchange rate for imports is
Eit = Eit�1 exp (d lnEit) ;
with the base year (2000 or any starting year) exchange rate set to 1 for all �rms, i.e., Ei0 = 1;8i.
Likewise, we also construct a �rm-speci�c time-varying exchange rate that is relevant for the exports
of each �rm. Given that exchange �uctuation with regard to export market may a¤ect �rm markups,
it is not clear apriori how the exchange rate with respect to the destination countries�currencies
may a¤ect �rm DV AR (Chatterjee, Dix-Carneiro and Vichyanond, 2012).
Let us now explore the reason related to FDI. As part of the conditions for China�s accession
to the WTO, the country has to relax restrictions substantially on foreign participation in its
economy in early 2000s. This regime change resulted in a large in�ow of FDI into China. In
addition to raising the demand for labor, an increased presence of foreign �rms also generated huge
demand for high-quality locally produced intermediate inputs. The entry of foreign �rms in the
downstream industry therefore causes quality upgrading and variety expansion in the upstream
industries (Rodriguez-Clare, 1996; Kee, 1). As such, all �rms have access to better and more
domestic materials, indirectly raising exporters�DV AR. We measure FDI both at the industry
and industry-province level, using information of foreign capital stock from the NBS data.
We test the hypothesis related to the in�ux of FDI (hypothesis 1) and the yuan depreciation
(hypothesis 2) in Table 9. Overall, our empirical results show that a higher level of foreign capital
stock in the sector or in the sector-province increases �rms�DV AR in the same industry, sup-
porting our hypothesis 1. However, the yuan depreciation against either China�s import-source or
destination countries do not appear to a¤ect �rms�DV AR.
6 Conclusions
In this paper, we use a ground-up approach to assess the domestic value added (DV A) in Chinese
exports based on transaction-level trade data and �rm-level production data. We �nd that the
DV A ratio (DV AR) used to be around 35 percent in 2000, it has since risen to 49 percent in
2006. Such changes a¤ect most industries in our sample, and most export destinations of Chinese
exports. Our �nding of rising DV A resonates with the existing �ndings in the literature, such as
20
Koopman, Wang and Wei (2012), who use information from the input-output tables for China to
measure DV AR in Chinese exports.
Firm-level regression results show that �rm DV AR is increasing gradually over the sample
period, and that the increase is not driven by rising domestic capital or labor costs, but a gradual
substitution of foreign imported inputs with domestic inputs. We also �nd that foreign content
in processing exports is decreasing over time at both the intensive and the extensive (number of
varieties) margins. Preliminary evidence suggests that the substitution is in part due to the huge
in�ux of FDI after the country�s accession to the WTO, which increased the supply of locally
produced intermediates. Changes in the Chinese yuan exchange rate, either against import-source
or destination countries, do not appear to a¤ect �rms�DV AR during our sample period. Regardless
of the reasons, our �ndings point to the fact that Chinese exports have been expanding along the
global production network and are no longer only responsible for the �nal stages of production.
Given that processing exporters do not need to pay tari¤s or VAT on such imported inputs,
they have more incentives to use imported materials compared to non-processing exporters. Thus,
the domestic content in processing exports is likely to be lower than that of non-processing exports.
In other words, our DV AR estimates provide a reasonable lower bound for the DV AR of overall
Chinese exports. Nevertheless, if we apply our DV AR estimates to all Chinese exports, a back-
of-the-envelope calculation shows that only about half of Chinese exports to the US are originated
from China. Any policy analysis based on gross exports will most likely overestimate the impact
of Chinese exports on the US labor market.
21
References
[1] Ahn, Jaebin., Amit Khandelwal, and Shang-Jin Wei (2011) �The Role of Intermediaries in
Facilitating Trade,�forthcoming Journal of International Economics.
[2] Autor, David, David Dorn, and Gordon Hanson (2011) �The China Syndrome: Local Labor
Market E¤ects of Import Competition in the United States�MIT Working Paper.
[3] Chen, Xikang, Leonard Cheng, K.C. Fung, and Lawrence J. Lau (2001). �The Estimation
of Domestic Value-Added and Employment Induced by Exports: An Application to Chinese
Exports to the United States,�presentation to the Institute of Systems Science, Academy of
Mathematics and Systems Science, Chinese Academy of Sciences, Beijing, June 2001.
[4] Chatterjee, Arpita, Rafael Dix-Carneiro and Jade Vichyanond (2012). �Multi-Product Firms
and Exchange Rate Fluctuations." Working Paper, University of Maryland.
[5] Dedrick, Jason, Kenneth L. Kraemer, and Greg Linden (2009). �Who Pro�ts from Innovation
in Global Value Chains? A Study of the iPod and notebook PCs,� Industrial and Corporate
Change 19:1, pp. 81�116.
[6] Hummels, D., J. Ishii and K. Yi (2001). �The Nature and Growth of Vertical Specialization
in World Trade,�Journal of International Economics 54:75-96.
[7] Javorcik, Beata Smarzynska (2004) "Does Foreign Direct Investment Increase the Productivity
of Domestic Firms?" American Economic Review, 94(3), 605-627.
[8] Johnson, Robert and G. Noguera (2012a). �Accounting for Intermediates: Production Sharing
and Trade in Value Added,�Journal of International Economics, 86 (2), 224-236.
[9] Johnson, Robert and G. Noguera (2012b). �Fragmentation and Trade in Value Added over
Four Decades,�Working Paper, Dartmouth College.
[10] Kee, Hiau Looi (1) "Local Intermediate Inputs and the Shared Supplier Spillovers of Foreign
Direct Investment," World Bank Working Paper.
22
[11] Koopman, Robert, Zhi Wang, and Shang-Jin Wei (2012). �Estimating Domestic Content in Ex-
ports When Processing Trade Is Pervasive,�Journal of Development Economics, 99:1, pp.178-
89.
[12] Koopman, Robert, William Powers, Zhi Wang, and Shang-Jin Wei (2010). �Give Credit Where
Credit Is Due: Tracing Value Added in Global Production Chains,�NBER Working Paper
No. 16426.
[13] Liu, Xuepeng (2012) �Tax Avoidance, Tax Preference and Re-imports: The Case of Redundant
Trade," Working Paper, Kennesaw State University.
[14] Ma, Yue, Heiwai Tang, Yifan Zhang (2012). �Factor Intensity, Product Switching, and Pro-
ductivity: Evidence from Chinese New Exporters,�Working Paper, Tufts University.
[15] Manova, Kalina and Zhiwei Zhang (2009) �China�s Exporters and Importers: Firms, Products,
and Trade Partners,�mimeo Stanford University.
[16] Rodriguez-Clare, Andres (1996) �Multinationals, Linkages, and Economic Development,"
American Economic Review, 86(4), 852-873.
[17] Scott, Robert (2011). �Growing U.S. trade de�cit with China cost 2.8 million jobs between
2001 and 2010,�Economic Policy Institute Brie�ng Paper #323.
23
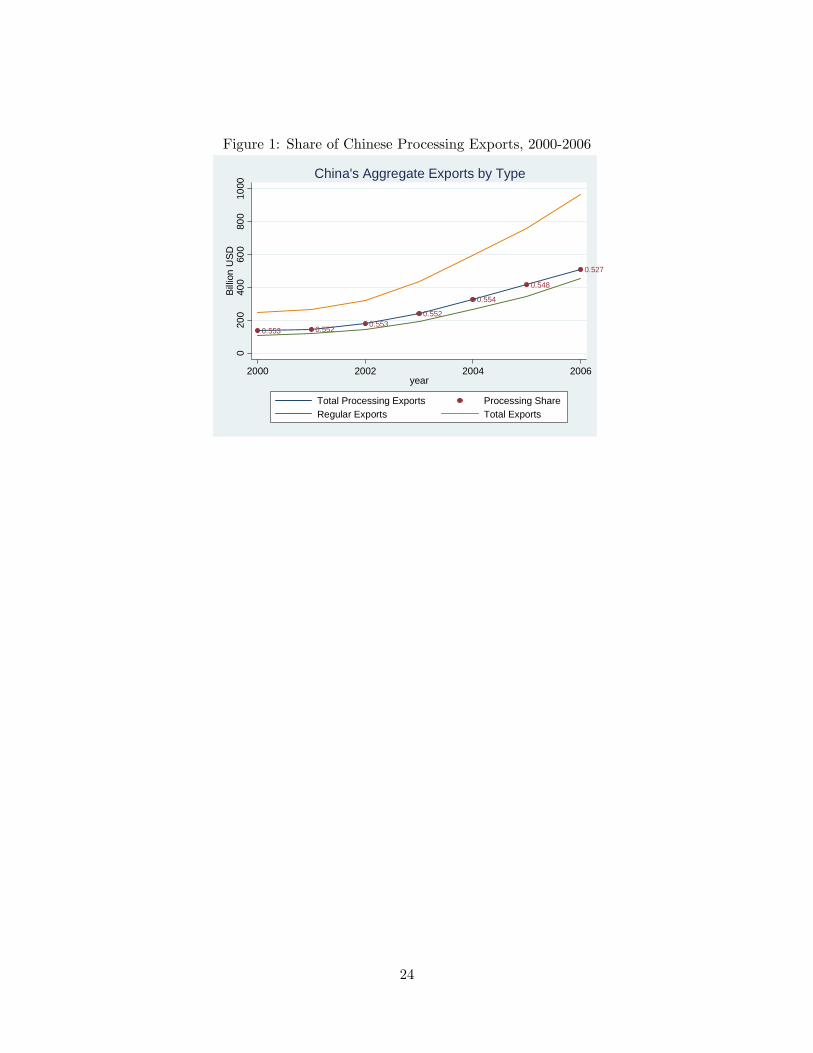
Figure 1: Share of Chinese Processing Exports, 2000-2006
0.553 0.5520.553
0.552
0.554
0.548
0.527
020
040
060
080
010
00Bi
llion
USD
2000 2002 2004 2006year
Total Processing Exports Processing ShareRegular Exports Total Exports
China's Aggregate Exports by Type
24
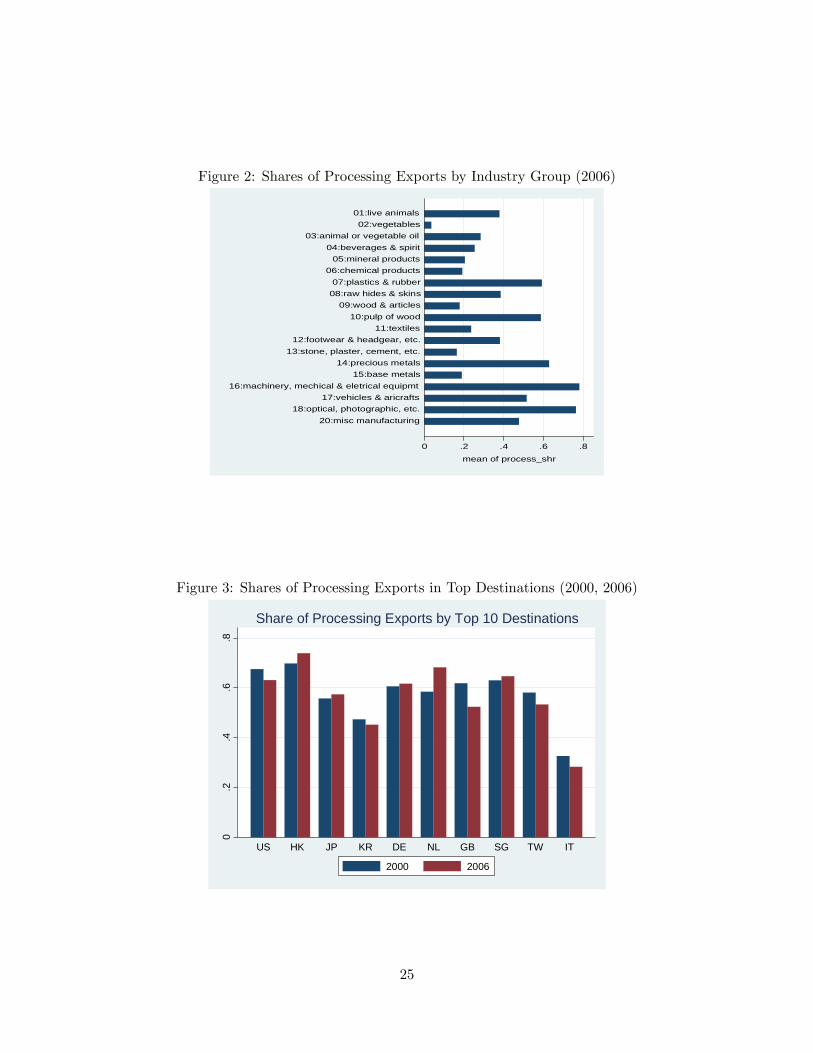
Figure 2: Shares of Processing Exports by Industry Group (2006)
0 .2 .4 .6 .8
mean of process_shr
20:misc manufacturing18:optical, photographic, etc.
17:vehicles & aricrafts16:machinery, mechical & eletrical equipmt
15:base metals14:precious metals
13:stone, plaster, cement, etc.12:footwear & headgear, etc.
11:textiles10:pulp of wood
09:wood & articles08:raw hides & skins07:plastics & rubber
06:chemical products05:mineral products
04:beverages & spirit03:animal or vegetable oil
02:vegetables01:live animals
Figure 3: Shares of Processing Exports in Top Destinations (2000, 2006)
0.2
.4.6
.8
US HK JP KR DE NL GB SG TW IT
Share of Processing Exports by Top 10 Destinations
2000 2006
25
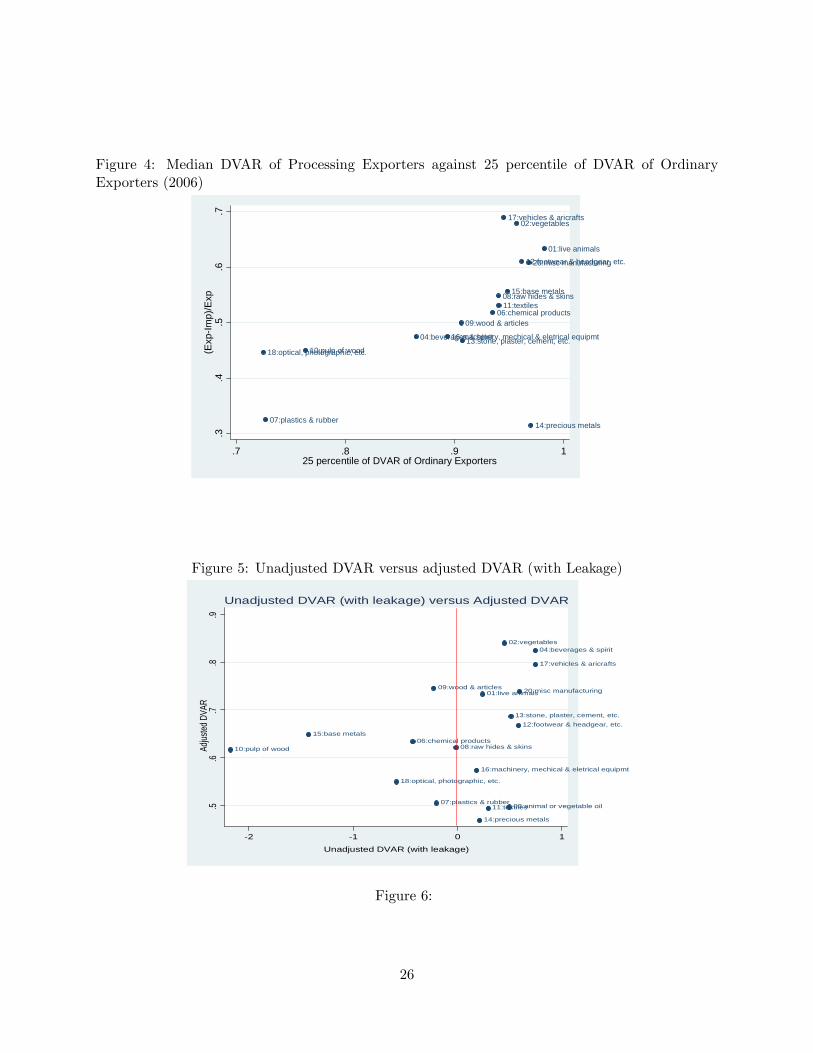
Figure 4: Median DVAR of Processing Exporters against 25 percentile of DVAR of OrdinaryExporters (2006)
01:live animals
02:vegetables
04:beverages & spirit
06:chemical products
07:plastics & rubber
08:raw hides & skins
09:wood & articles
10:pulp of wood
11:textiles
12:footwear & headgear, etc.
13:stone, plaster, cement, etc.
14:precious metals
15:base metals
16:machinery, mechical & eletrical equipmt
17:vehicles & aricrafts
18:optical, photographic, etc.
20:misc manufacturing
.3.4
.5.6
.7(E
xpIm
p)/E
xp
.7 .8 .9 125 percentile of DVAR of Ordinary Exporters
Figure 5: Unadjusted DVAR versus adjusted DVAR (with Leakage)
01:live animals
02:vegetables
03:animal or vegetable oil
04:beverages & spirit
06:chemical products
07:plastics & rubber
08:raw hides & skins
09:wood & articles
10:pulp of wood
11:textiles
12:footwear & headgear, etc.13:stone, plaster, cement, etc.
14:precious metals
15:base metals
16:machinery, mechical & eletrical equipmt
17:vehicles & aricrafts
18:optical, photographic, etc.
20:misc manufacturing
.5.6
.7.8
.9Ad
justed
DVA
R
2 1 0 1
Unadjusted DVAR (with leakage)
Unadjusted DVAR (with leakage) versus Adjusted DVAR
Figure 6:
26
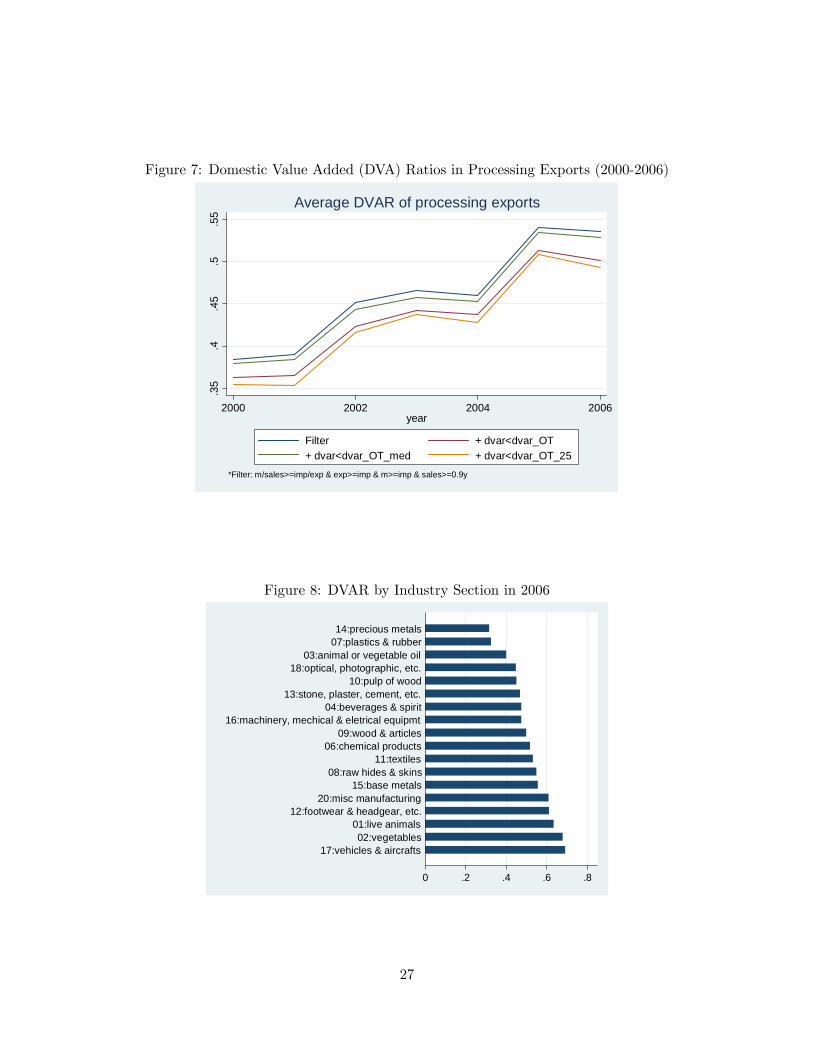
Figure 7: Domestic Value Added (DVA) Ratios in Processing Exports (2000-2006)
.35
.4.4
5.5
.55
2000 2002 2004 2006year
Filter + dvar<dvar_OT+ dvar<dvar_OT_med + dvar<dvar_OT_25
*Filter: m/sales>=imp/exp & exp>=imp & m>=imp & sales>=0.9y
Average DVAR of processing exports
Figure 8: DVAR by Industry Section in 2006
0 .2 .4 .6 .8
17:vehicles & aircrafts02:vegetables
01:live animals12:footwear & headgear, etc.
20:misc manufacturing15:base metals
08:raw hides & skins11:textiles
06:chemical products09:wood & articles
16:machinery, mechical & eletrical equipmt04:beverages & spirit
13:stone, plaster, cement, etc.10:pulp of wood
18:optical, photographic, etc.03:animal or vegetable oil
07:plastics & rubber14:precious metals
27
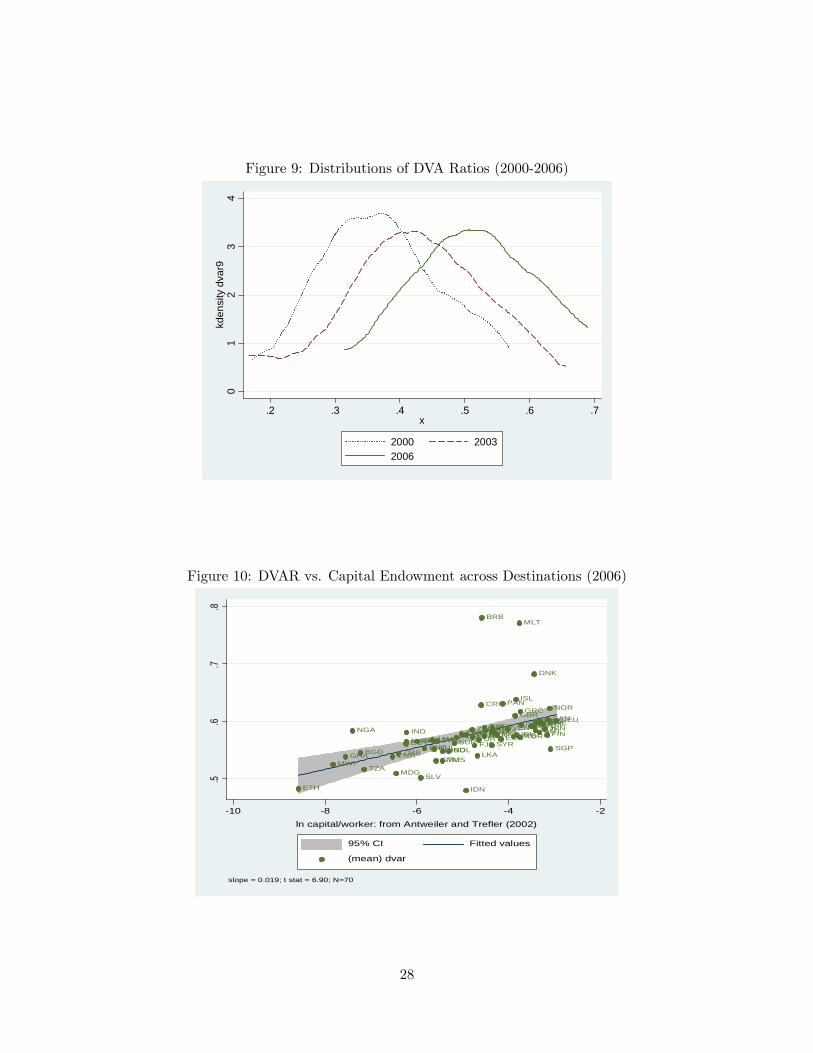
Figure 9: Distributions of DVA Ratios (2000-2006)
01
23
4kd
ensi
ty d
var9
.2 .3 .4 .5 .6 .7x
2000 20032006
Figure 10: DVAR vs. Capital Endowment across Destinations (2006)
ARGAUSAUTBEL
BGD BOL
BRA
BRB
CANCHL
CMR
COL
CRI
DEU
DNK
ECUEGY
ESP
ETH
FINFJI
FRAGBR
GHA
GRC
GTM
HKG
HND
IDN
IND IRL
ISL
ISRITA
JAM
JPNKOR
LKA
MAR
MDG
MEX
MLT
MUSMWI
MYSNGA NLD
NOR
NZL
PAK
PAN
PER
PHLPNG
PRT
SGP
SLV
SUR
SWE
SYR
THATUNTUR
TZA
URY
USAVENZAF
ZMB
ZWE
.5.6
.7.8
10 8 6 4 2ln capital/worker: from Antweiler and Trefler (2002)
95% CI Fitted values
(mean) dvar
slope = 0.019; t stat = 6.90; N=70
28
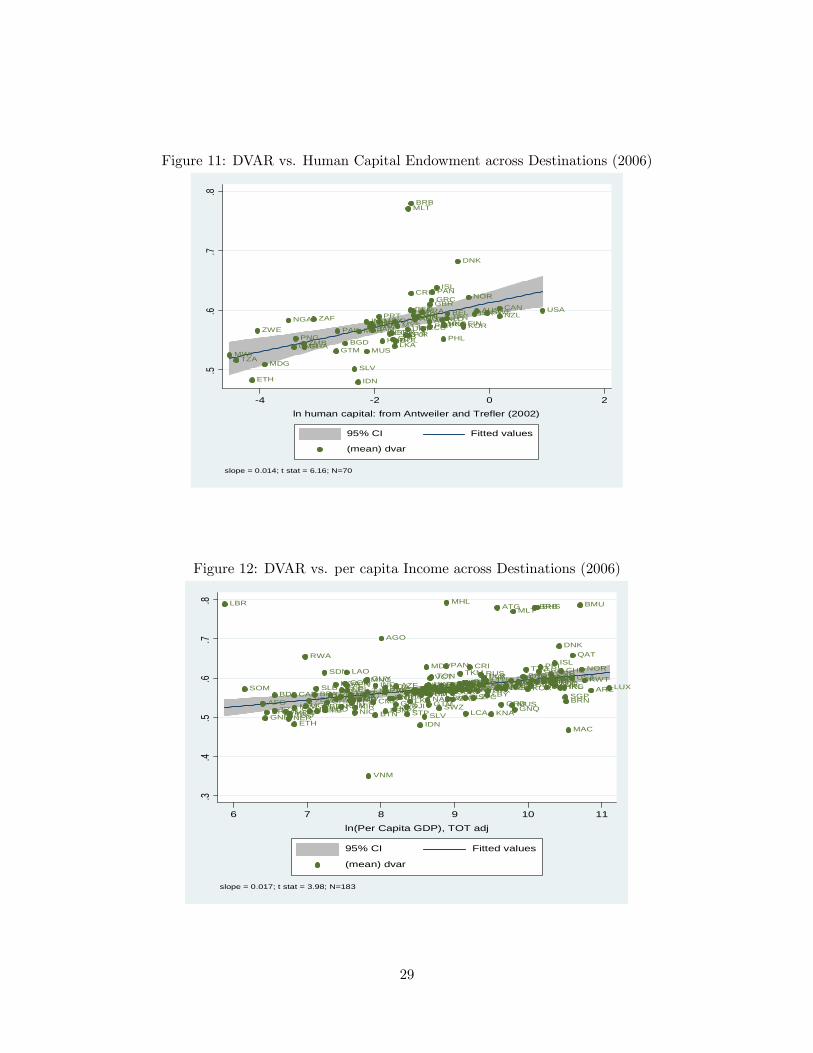
Figure 11: DVAR vs. Human Capital Endowment across Destinations (2006)
ARGAUS
AUTBEL
BGD BOL
BRA
BRB
CANCHL
CMR
COL
CRI
DEU
DNK
ECUEGY
ESP
ETH
FIN
FJI
FRAGBR
GHA
GRC
GTM
HKG
HND
IDN
IND IRL
ISL
ISRITA
JAM
JPNKOR
LKA
MAR
MDG
MEX
MLT
MUSMWI
MYSNGA NLD
NOR
NZL
PAK
PAN
PER
PHLPNG
PRT
SGP
SLV
SUR
SWE
SYR
THATUNTUR
TZA
URY
USAVENZAF
ZMB
ZWE
.5.6
.7.8
4 2 0 2ln human capital: from Antweiler and Trefler (2002)
95% CI Fitted values
(mean) dvar
slope = 0.014; t stat = 6.16; N=70
Figure 12: DVAR vs. per capita Income across Destinations (2006)
AFG
AGO
ALB AREARGARM
ATG
AUSAUTAZE
BDI
BEL
BEN
BFABGD
BGR
BHR
BHS
BIH
BLR
BLZ
BMU
BOLBRA
BRB
BRN
BTN
BWACAF
CANCHE
CHL
CIVCMRCOG
COLCOMCPV
CRI
CUB
CYPCZE
DJI
DMA
DNK
DOMDZAECUEGY
ERI
ESPEST
ETH
FINFJI
FRA
FSM
GAB
GBR
GEOGHA GIN
GMBGNB
GNQ
GRC
GRDGTM
GUYHKG
HNDHRV
HTIHUN
IDN
IND IRLIRNIRQ
ISL
ISRITA
JAMJORJPN
KAZ
KENKGZKHMKIR
KNA
KORKWT
LAO
LBN
LBR
LBY
LCA
LKALSO
LTULUX
LVA
MAC
MARMDA
MDG
MDV
MEX
MHL
MKD
MLI
MLT
MNG
MOZMRT
MUSMWI
MYS
NAM
NER
NGA
NIC
NLD
NOR
NPLNZLOMN
PAK
PAN
PERPHL
PLWPNG
POL
PRI
PRTPRY
QAT
RUS
RWA
SAU
SDN
SEN
SGPSLB SLE
SLV
SOM
STP
SUR SVKSVN
SWE
SWZSYCSYR
TCDTGO
THATJK
TKM
TLS
TONTTO
TUNTUR TWN
TZAUGA
UKRURY
USA
UZB
VCTVEN
VNM
VUTWSM
YEM
ZAF
ZMBZWE
.3.4
.5.6
.7.8
6 7 8 9 10 11ln(Per Capita GDP), TOT adj
95% CI Fitted values
(mean) dvar
slope = 0.017; t stat = 3.98; N=183
29
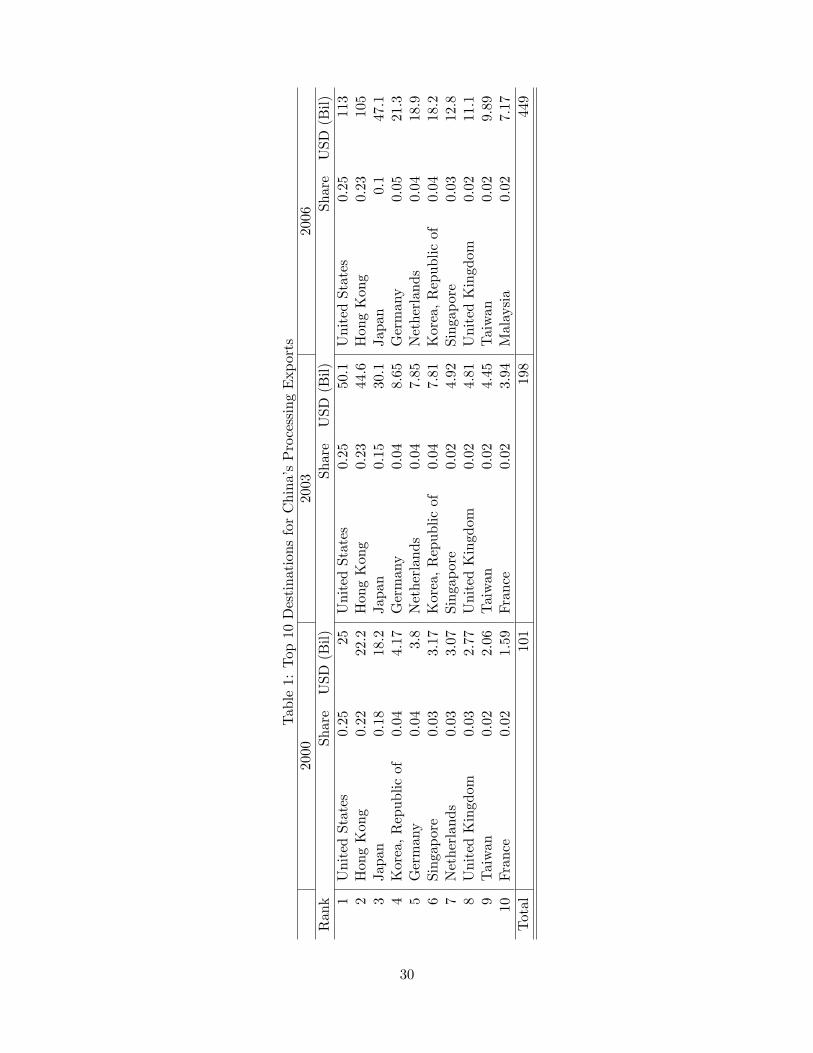
Table1:Top10DestinationsforChina�sProcessingExports
2000
2003
2006
Rank
Share
USD
(Bil)
Share
USD
(Bil)
Share
USD
(Bil)
1UnitedStates
0.25
25UnitedStates
0.25
50.1
UnitedStates
0.25
113
2HongKong
0.22
22.2
HongKong
0.23
44.6
HongKong
0.23
105
3Japan
0.18
18.2
Japan
0.15
30.1
Japan
0.1
47.1
4Korea,Republicof
0.04
4.17
Germany
0.04
8.65
Germany
0.05
21.3
5Germany
0.04
3.8
Netherlands
0.04
7.85
Netherlands
0.04
18.9
6Singapore
0.03
3.17
Korea,Republicof
0.04
7.81
Korea,Republicof
0.04
18.2
7Netherlands
0.03
3.07
Singapore
0.02
4.92
Singapore
0.03
12.8
8UnitedKingdom
0.03
2.77
UnitedKingdom
0.02
4.81
UnitedKingdom
0.02
11.1
9Taiwan
0.02
2.06
Taiwan
0.02
4.45
Taiwan
0.02
9.89
10France
0.02
1.59
France
0.02
3.94
Malaysia
0.02
7.17
Total
101
198
449
30
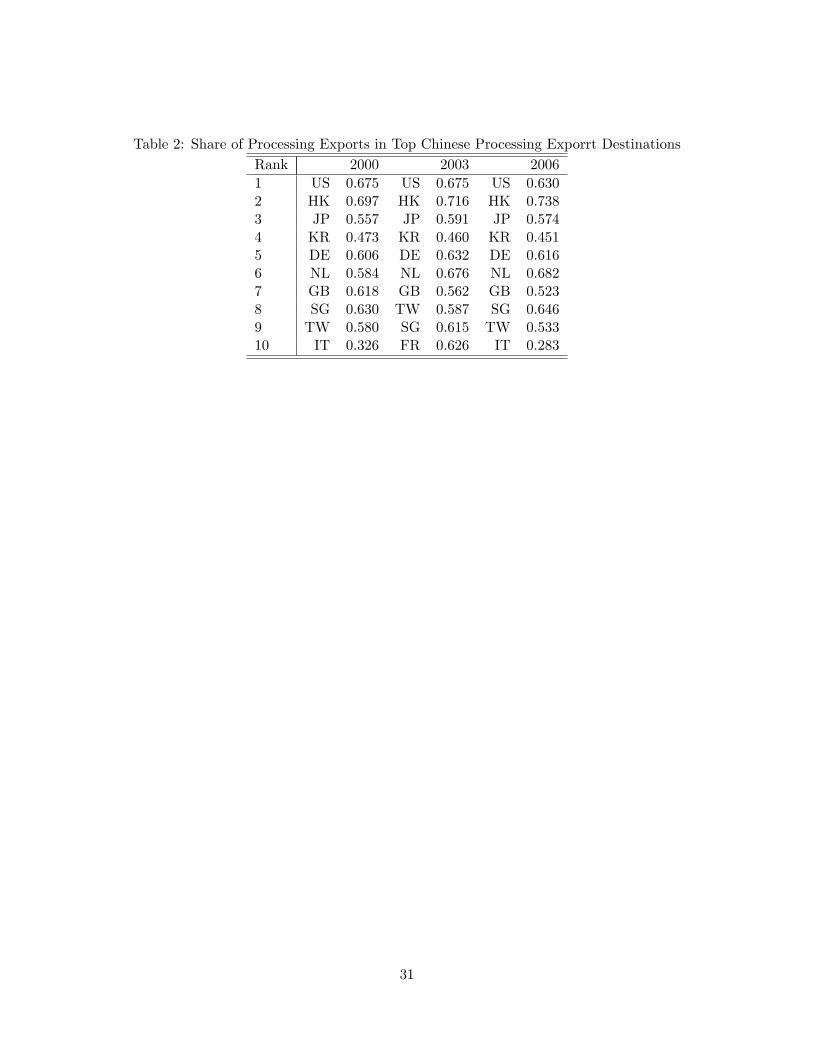
Table 2: Share of Processing Exports in Top Chinese Processing Exporrt DestinationsRank 2000 2003 20061 US 0.675 US 0.675 US 0.6302 HK 0.697 HK 0.716 HK 0.7383 JP 0.557 JP 0.591 JP 0.5744 KR 0.473 KR 0.460 KR 0.4515 DE 0.606 DE 0.632 DE 0.6166 NL 0.584 NL 0.676 NL 0.6827 GB 0.618 GB 0.562 GB 0.5238 SG 0.630 TW 0.587 SG 0.6469 TW 0.580 SG 0.615 TW 0.53310 IT 0.326 FR 0.626 IT 0.283
31
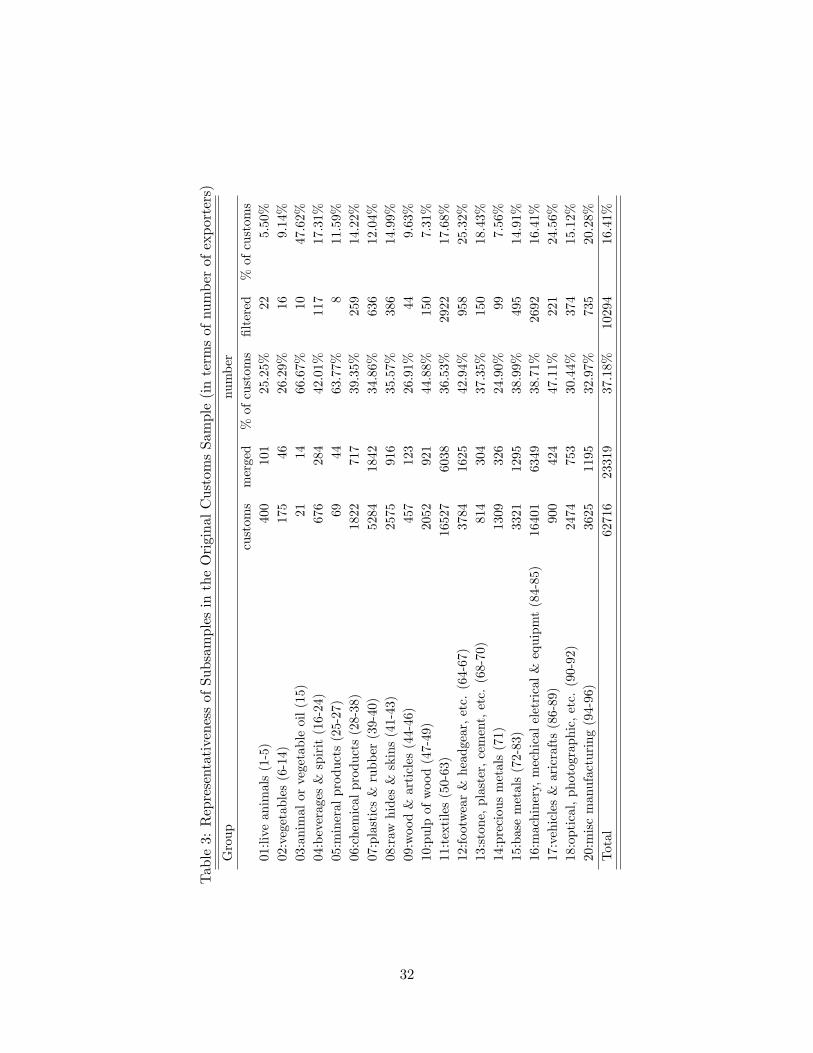
Table3:RepresentativenessofSubsamplesintheOriginalCustomsSample(intermsofnumberofexporters)
Group
number
customs
merged
%ofcustoms
�ltered
%ofcustoms
01:liveanimals(1-5)
400
101
25.25%
225.50%
02:vegetables(6-14)
175
4626.29%
169.14%
03:animalorvegetableoil(15)
2114
66.67%
1047.62%
04:beverages&spirit(16-24)
676
284
42.01%
117
17.31%
05:mineralproducts(25-27)
6944
63.77%
811.59%
06:chemicalproducts(28-38)
1822
717
39.35%
259
14.22%
07:plastics&rubber(39-40)
5284
1842
34.86%
636
12.04%
08:raw
hides&skins(41-43)
2575
916
35.57%
386
14.99%
09:wood&articles(44-46)
457
123
26.91%
449.63%
10:pulpofwood(47-49)
2052
921
44.88%
150
7.31%
11:textiles(50-63)
16527
6038
36.53%
2922
17.68%
12:footwear&headgear,etc.(64-67)
3784
1625
42.94%
958
25.32%
13:stone,plaster,cement,etc.(68-70)
814
304
37.35%
150
18.43%
14:preciousmetals(71)
1309
326
24.90%
997.56%
15:basemetals(72-83)
3321
1295
38.99%
495
14.91%
16:machinery,mechicaleletrical&equipmt(84-85)
16401
6349
38.71%
2692
16.41%
17:vehicles&aricrafts(86-89)
900
424
47.11%
221
24.56%
18:optical,photographic,etc.(90-92)
2474
753
30.44%
374
15.12%
20:miscmanufacturing(94-96)
3625
1195
32.97%
735
20.28%
Total
62716
23319
37.18%
10294
16.41%
32
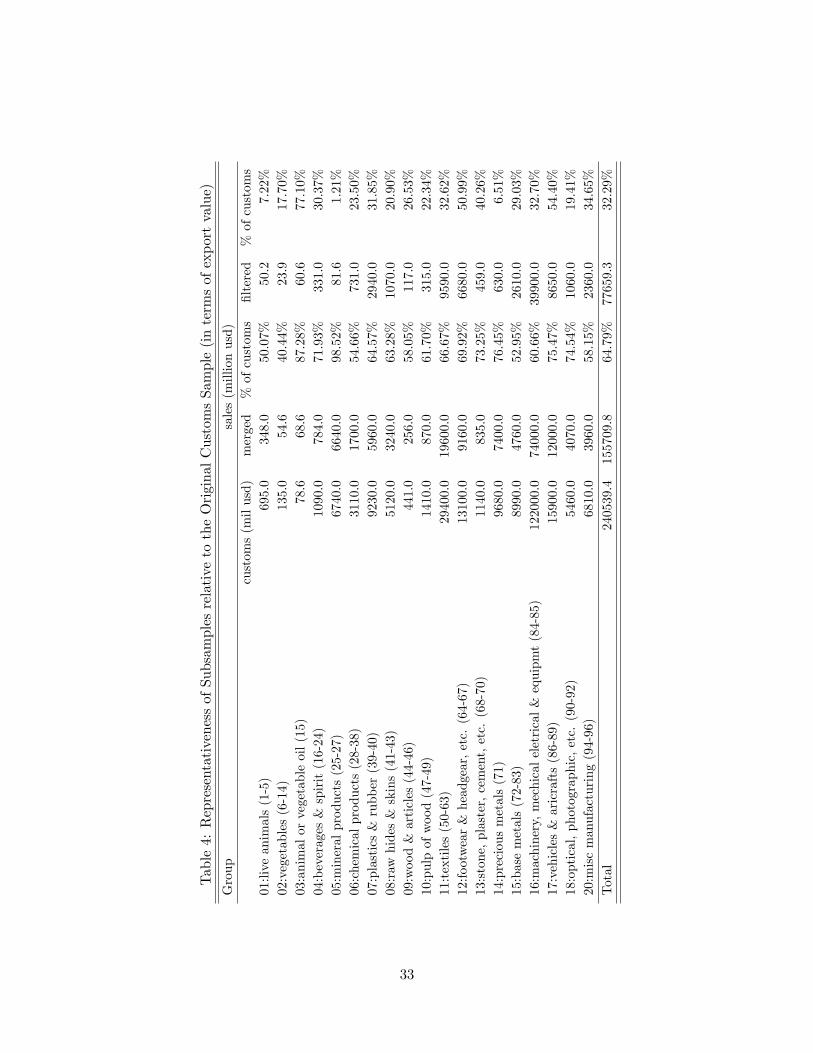
Table4:RepresentativenessofSubsamplesrelativetotheOriginalCustomsSample(intermsofexportvalue)
Group
sales(millionusd)
customs(milusd)
merged
%ofcustoms
�ltered
%ofcustoms
01:liveanimals(1-5)
695.0
348.0
50.07%
50.2
7.22%
02:vegetables(6-14)
135.0
54.6
40.44%
23.9
17.70%
03:animalorvegetableoil(15)
78.6
68.6
87.28%
60.6
77.10%
04:beverages&spirit(16-24)
1090.0
784.0
71.93%
331.0
30.37%
05:mineralproducts(25-27)
6740.0
6640.0
98.52%
81.6
1.21%
06:chemicalproducts(28-38)
3110.0
1700.0
54.66%
731.0
23.50%
07:plastics&rubber(39-40)
9230.0
5960.0
64.57%
2940.0
31.85%
08:raw
hides&skins(41-43)
5120.0
3240.0
63.28%
1070.0
20.90%
09:wood&articles(44-46)
441.0
256.0
58.05%
117.0
26.53%
10:pulpofwood(47-49)
1410.0
870.0
61.70%
315.0
22.34%
11:textiles(50-63)
29400.0
19600.0
66.67%
9590.0
32.62%
12:footwear&headgear,etc.(64-67)
13100.0
9160.0
69.92%
6680.0
50.99%
13:stone,plaster,cement,etc.(68-70)
1140.0
835.0
73.25%
459.0
40.26%
14:preciousmetals(71)
9680.0
7400.0
76.45%
630.0
6.51%
15:basemetals(72-83)
8990.0
4760.0
52.95%
2610.0
29.03%
16:machinery,mechicaleletrical&equipmt(84-85)
122000.0
74000.0
60.66%
39900.0
32.70%
17:vehicles&aricrafts(86-89)
15900.0
12000.0
75.47%
8650.0
54.40%
18:optical,photographic,etc.(90-92)
5460.0
4070.0
74.54%
1060.0
19.41%
20:miscmanufacturing(94-96)
6810.0
3960.0
58.15%
2360.0
34.65%
Total
240539.4
155709.8
64.79%
77659.3
32.29%
33
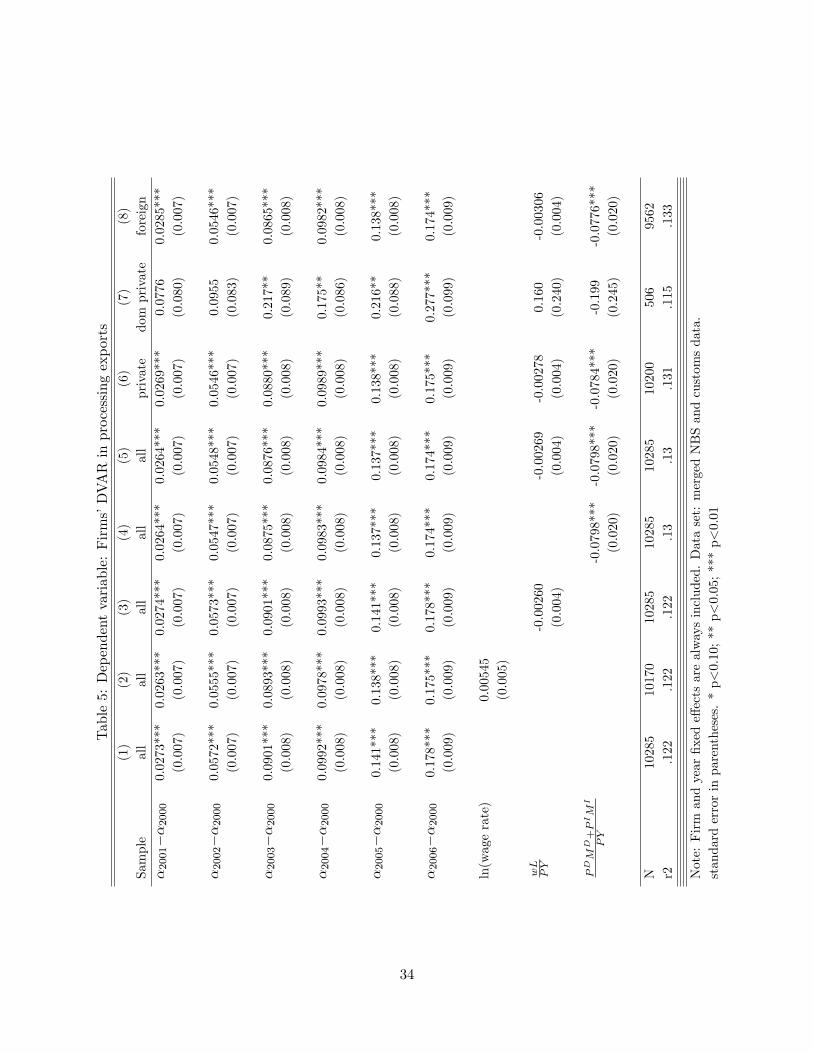
Table5:Dependentvariable:Firms�DVARinprocessingexports
(1)
(2)
(3)
(4)
(5)
(6)
(7)
(8)
Sample
all
all
all
all
all
private
domprivate
foreign
�2001��2000
0.0273***
0.0263***
0.0274***
0.0264***
0.0264***
0.0269***
0.0776
0.0285***
(0.007)
(0.007)
(0.007)
(0.007)
(0.007)
(0.007)
(0.080)
(0.007)
�2002��2000
0.0572***
0.0555***
0.0573***
0.0547***
0.0548***
0.0546***
0.0955
0.0546***
(0.007)
(0.007)
(0.007)
(0.007)
(0.007)
(0.007)
(0.083)
(0.007)
�2003��2000
0.0901***
0.0893***
0.0901***
0.0875***
0.0876***
0.0880***
0.217**
0.0865***
(0.008)
(0.008)
(0.008)
(0.008)
(0.008)
(0.008)
(0.089)
(0.008)
�2004��2000
0.0992***
0.0978***
0.0993***
0.0983***
0.0984***
0.0989***
0.175**
0.0982***
(0.008)
(0.008)
(0.008)
(0.008)
(0.008)
(0.008)
(0.086)
(0.008)
�2005��2000
0.141***
0.138***
0.141***
0.137***
0.137***
0.138***
0.216**
0.138***
(0.008)
(0.008)
(0.008)
(0.008)
(0.008)
(0.008)
(0.088)
(0.008)
�2006��2000
0.178***
0.175***
0.178***
0.174***
0.174***
0.175***
0.277***
0.174***
(0.009)
(0.009)
(0.009)
(0.009)
(0.009)
(0.009)
(0.099)
(0.009)
ln(wagerate)
0.00545
(0.005)
wL
PY
-0.00260
-0.00269
-0.00278
0.160
-0.00306
(0.004)
(0.004)
(0.004)
(0.240)
(0.004)
PDM
D+PIM
I
PY
-0.0798***
-0.0798***
-0.0784***
-0.199
-0.0776***
(0.020)
(0.020)
(0.020)
(0.245)
(0.020)
N10285
10170
10285
10285
10285
10200
506
9562
r2.122
.122
.122
.13
.13
.131
.115
.133
Note:Firmandyear�xede¤ectsarealwaysincluded.Dataset:mergedNBSandcustomsdata.
standarderrorinparentheses.*p<0.10;**p<0.05;***p<0.01
34
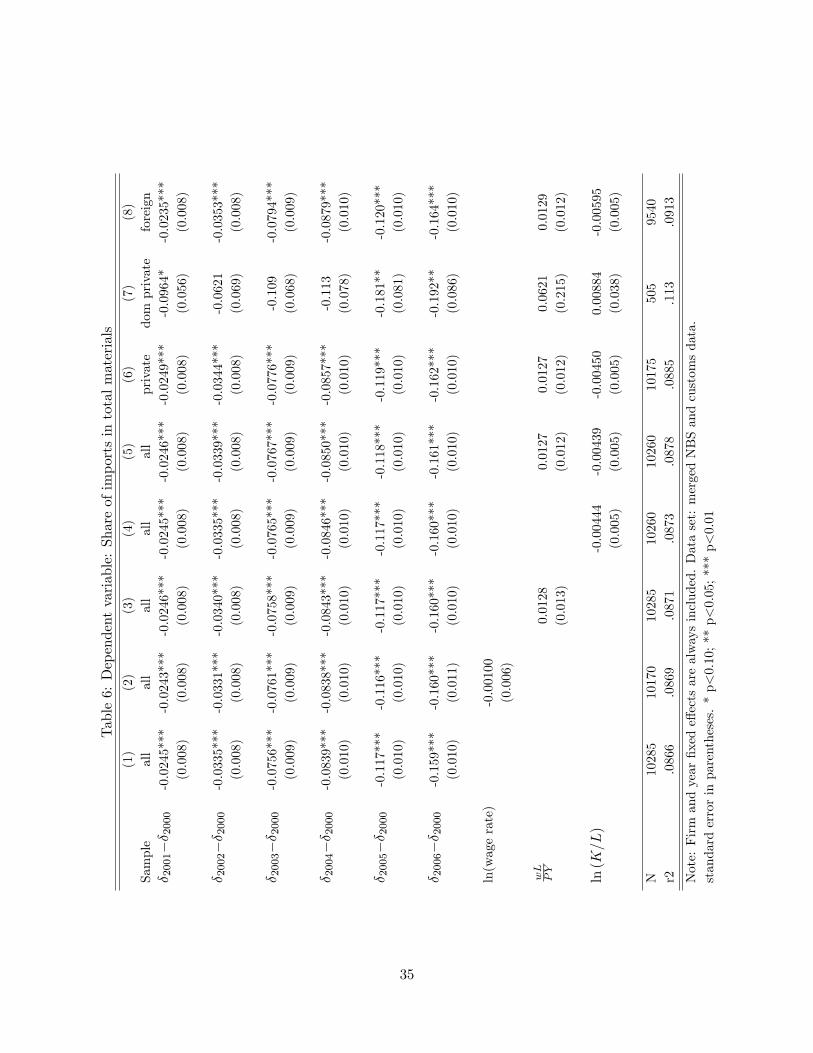
Table6:Dependentvariable:Shareofimportsintotalmaterials
(1)
(2)
(3)
(4)
(5)
(6)
(7)
(8)
Sample
all
all
all
all
all
private
domprivate
foreign
� 2001�� 2000
-0.0245***
-0.0243***
-0.0246***
-0.0245***
-0.0246***
-0.0249***
-0.0964*
-0.0235***
(0.008)
(0.008)
(0.008)
(0.008)
(0.008)
(0.008)
(0.056)
(0.008)
� 2002�� 2000
-0.0335***
-0.0331***
-0.0340***
-0.0335***
-0.0339***
-0.0344***
-0.0621
-0.0353***
(0.008)
(0.008)
(0.008)
(0.008)
(0.008)
(0.008)
(0.069)
(0.008)
� 2003�� 2000
-0.0756***
-0.0761***
-0.0758***
-0.0765***
-0.0767***
-0.0776***
-0.109
-0.0794***
(0.009)
(0.009)
(0.009)
(0.009)
(0.009)
(0.009)
(0.068)
(0.009)
� 2004�� 2000
-0.0839***
-0.0838***
-0.0843***
-0.0846***
-0.0850***
-0.0857***
-0.113
-0.0879***
(0.010)
(0.010)
(0.010)
(0.010)
(0.010)
(0.010)
(0.078)
(0.010)
� 2005�� 2000
-0.117***
-0.116***
-0.117***
-0.117***
-0.118***
-0.119***
-0.181**
-0.120***
(0.010)
(0.010)
(0.010)
(0.010)
(0.010)
(0.010)
(0.081)
(0.010)
� 2006�� 2000
-0.159***
-0.160***
-0.160***
-0.160***
-0.161***
-0.162***
-0.192**
-0.164***
(0.010)
(0.011)
(0.010)
(0.010)
(0.010)
(0.010)
(0.086)
(0.010)
ln(wagerate)
-0.00100
(0.006)
wL
PY
0.0128
0.0127
0.0127
0.0621
0.0129
(0.013)
(0.012)
(0.012)
(0.215)
(0.012)
ln(K=L)
-0.00444
-0.00439
-0.00450
0.00884
-0.00595
(0.005)
(0.005)
(0.005)
(0.038)
(0.005)
N10285
10170
10285
10260
10260
10175
505
9540
r2.0866
.0869
.0871
.0873
.0878
.0885
.113
.0913
Note:Firmandyear�xede¤ectsarealwaysincluded.Dataset:mergedNBSandcustomsdata.
standarderrorinparentheses.*p<0.10;**p<0.05;***p<0.01
35
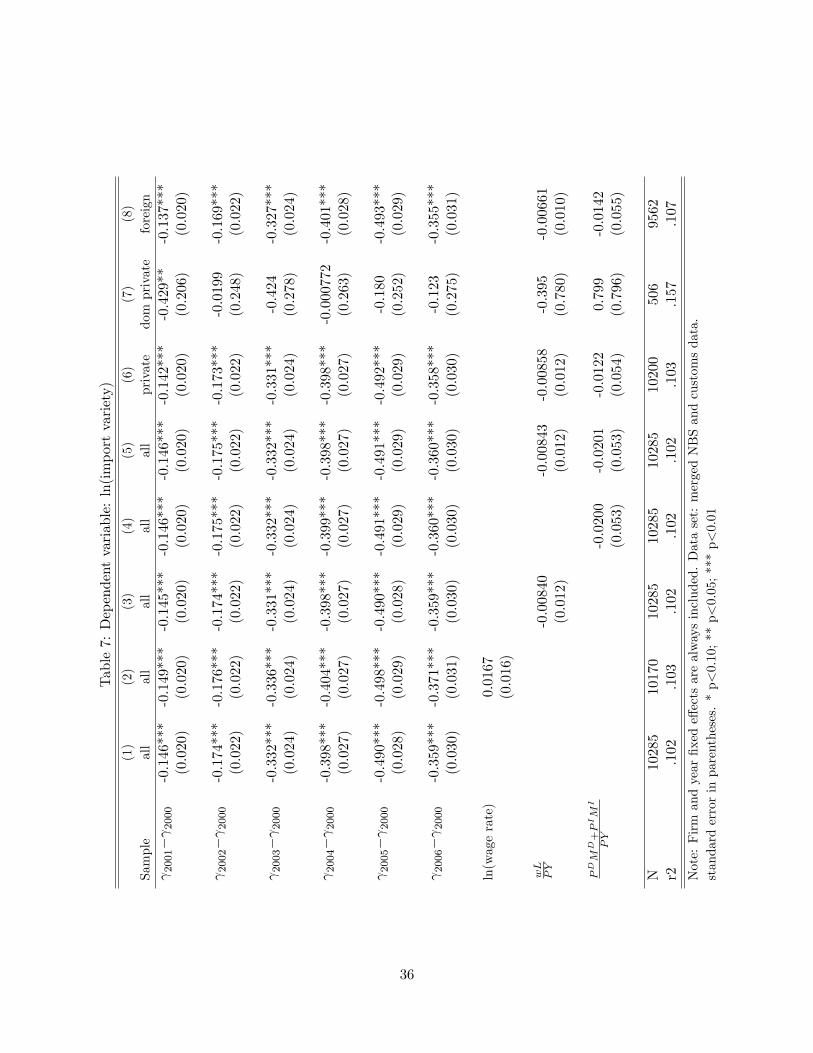
Table7:Dependentvariable:ln(importvariety)
(1)
(2)
(3)
(4)
(5)
(6)
(7)
(8)
Sample
all
all
all
all
all
private
domprivate
foreign
2001� 2000
-0.146***
-0.149***
-0.145***
-0.146***
-0.146***
-0.142***
-0.429**
-0.137***
(0.020)
(0.020)
(0.020)
(0.020)
(0.020)
(0.020)
(0.206)
(0.020)
2002� 2000
-0.174***
-0.176***
-0.174***
-0.175***
-0.175***
-0.173***
-0.0199
-0.169***
(0.022)
(0.022)
(0.022)
(0.022)
(0.022)
(0.022)
(0.248)
(0.022)
2003� 2000
-0.332***
-0.336***
-0.331***
-0.332***
-0.332***
-0.331***
-0.424
-0.327***
(0.024)
(0.024)
(0.024)
(0.024)
(0.024)
(0.024)
(0.278)
(0.024)
2004� 2000
-0.398***
-0.404***
-0.398***
-0.399***
-0.398***
-0.398***
-0.000772
-0.401***
(0.027)
(0.027)
(0.027)
(0.027)
(0.027)
(0.027)
(0.263)
(0.028)
2005� 2000
-0.490***
-0.498***
-0.490***
-0.491***
-0.491***
-0.492***
-0.180
-0.493***
(0.028)
(0.029)
(0.028)
(0.029)
(0.029)
(0.029)
(0.252)
(0.029)
2006� 2000
-0.359***
-0.371***
-0.359***
-0.360***
-0.360***
-0.358***
-0.123
-0.355***
(0.030)
(0.031)
(0.030)
(0.030)
(0.030)
(0.030)
(0.275)
(0.031)
ln(wagerate)
0.0167
(0.016)
wL
PY
-0.00840
-0.00843
-0.00858
-0.395
-0.00661
(0.012)
(0.012)
(0.012)
(0.780)
(0.010)
PDM
D+PIM
I
PY
-0.0200
-0.0201
-0.0122
0.799
-0.0142
(0.053)
(0.053)
(0.054)
(0.796)
(0.055)
N10285
10170
10285
10285
10285
10200
506
9562
r2.102
.103
.102
.102
.102
.103
.157
.107
Note:Firmandyear�xede¤ectsarealwaysincluded.Dataset:mergedNBSandcustomsdata.
standarderrorinparentheses.*p<0.10;**p<0.05;***p<0.01
36
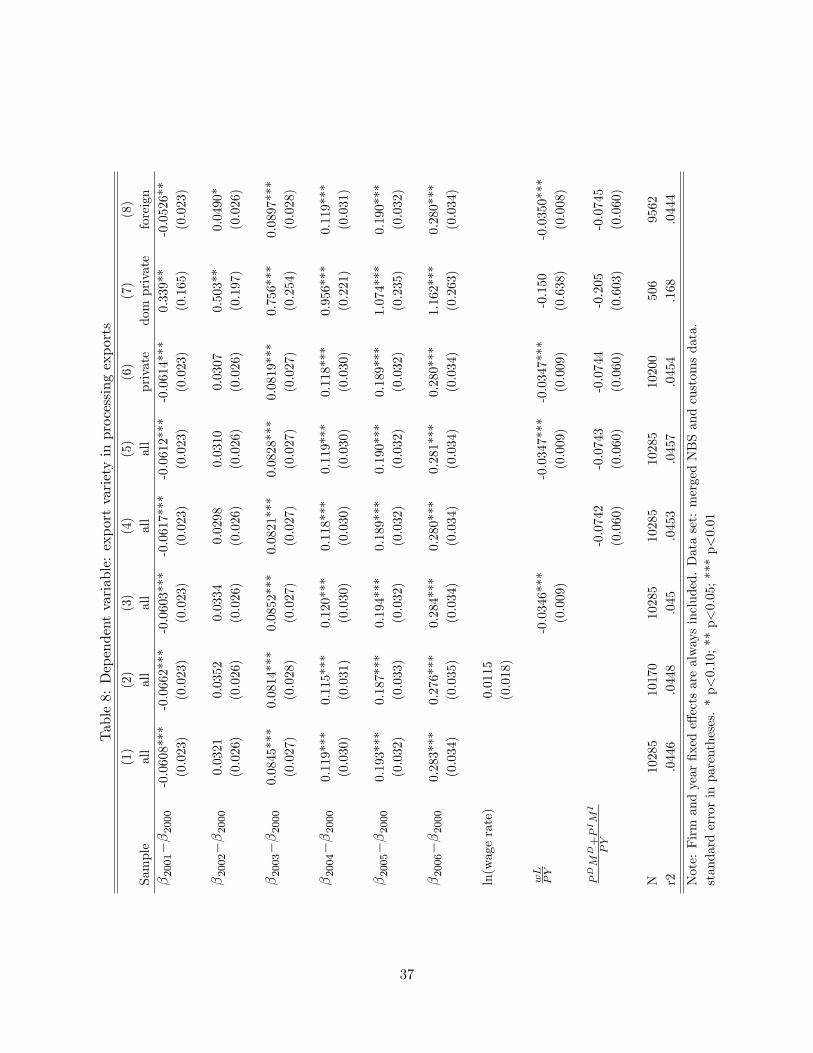
Table8:Dependentvariable:exportvarietyinprocessingexports
(1)
(2)
(3)
(4)
(5)
(6)
(7)
(8)
Sample
all
all
all
all
all
private
domprivate
foreign
�2001��2000
-0.0608***
-0.0662***
-0.0603***
-0.0617***
-0.0612***
-0.0614***
0.339**
-0.0526**
(0.023)
(0.023)
(0.023)
(0.023)
(0.023)
(0.023)
(0.165)
(0.023)
�2002��2000
0.0321
0.0352
0.0334
0.0298
0.0310
0.0307
0.503**
0.0490*
(0.026)
(0.026)
(0.026)
(0.026)
(0.026)
(0.026)
(0.197)
(0.026)
�2003��2000
0.0845***
0.0814***
0.0852***
0.0821***
0.0828***
0.0819***
0.756***
0.0897***
(0.027)
(0.028)
(0.027)
(0.027)
(0.027)
(0.027)
(0.254)
(0.028)
�2004��2000
0.119***
0.115***
0.120***
0.118***
0.119***
0.118***
0.956***
0.119***
(0.030)
(0.031)
(0.030)
(0.030)
(0.030)
(0.030)
(0.221)
(0.031)
�2005��2000
0.193***
0.187***
0.194***
0.189***
0.190***
0.189***
1.074***
0.190***
(0.032)
(0.033)
(0.032)
(0.032)
(0.032)
(0.032)
(0.235)
(0.032)
�2006��2000
0.283***
0.276***
0.284***
0.280***
0.281***
0.280***
1.162***
0.280***
(0.034)
(0.035)
(0.034)
(0.034)
(0.034)
(0.034)
(0.263)
(0.034)
ln(wagerate)
0.0115
(0.018)
wL
PY
-0.0346***
-0.0347***
-0.0347***
-0.150
-0.0350***
(0.009)
(0.009)
(0.009)
(0.638)
(0.008)
PDM
D+PIM
I
PY
-0.0742
-0.0743
-0.0744
-0.205
-0.0745
(0.060)
(0.060)
(0.060)
(0.603)
(0.060)
N10285
10170
10285
10285
10285
10200
506
9562
r2.0446
.0448
.045
.0453
.0457
.0454
.168
.0444
Note:Firmandyear�xede¤ectsarealwaysincluded.Dataset:mergedNBSandcustomsdata.
standarderrorinparentheses.*p<0.10;**p<0.05;***p<0.01
37
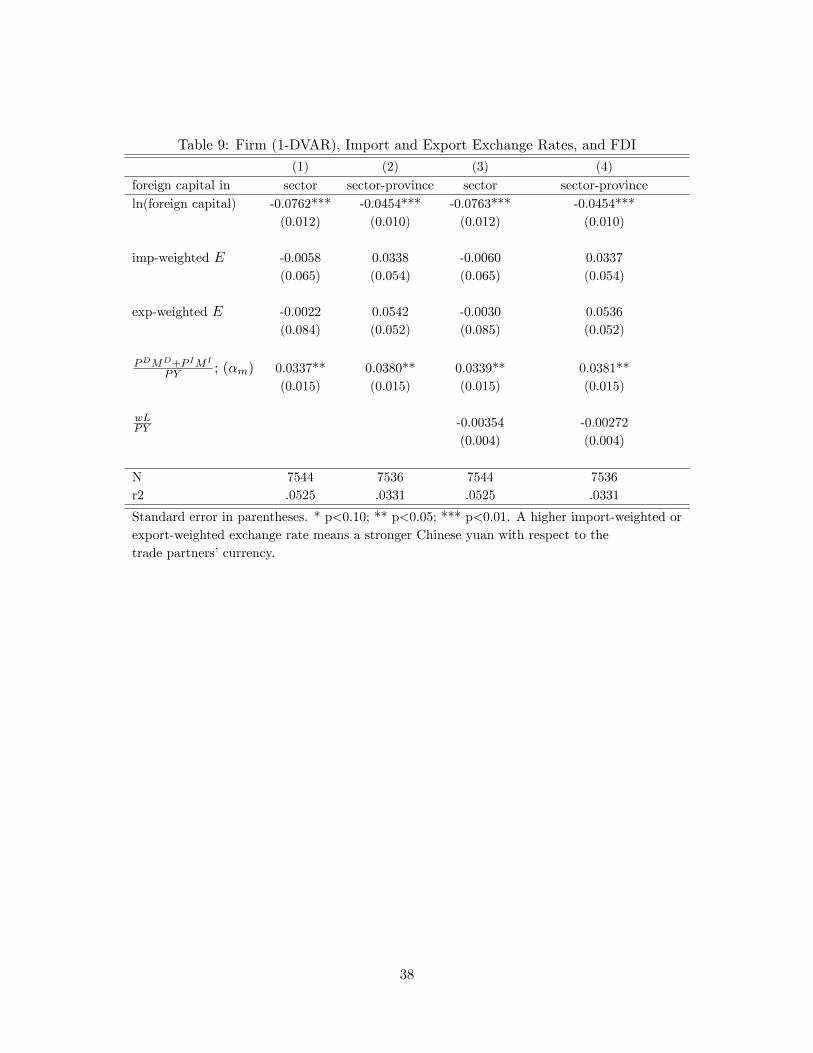
Table 9: Firm (1-DVAR), Import and Export Exchange Rates, and FDI
(1) (2) (3) (4)foreign capital in sector sector-province sector sector-provinceln(foreign capital) -0.0762*** -0.0454*** -0.0763*** -0.0454***
(0.012) (0.010) (0.012) (0.010)
imp-weighted E -0.0058 0.0338 -0.0060 0.0337(0.065) (0.054) (0.065) (0.054)
exp-weighted E -0.0022 0.0542 -0.0030 0.0536(0.084) (0.052) (0.085) (0.052)
PDMD+P IMI
PY ; (�m) 0.0337** 0.0380** 0.0339** 0.0381**(0.015) (0.015) (0.015) (0.015)
wLPY -0.00354 -0.00272
(0.004) (0.004)
N 7544 7536 7544 7536r2 .0525 .0331 .0525 .0331
Standard error in parentheses. * p<0.10; ** p<0.05; *** p<0.01. A higher import-weighted orexport-weighted exchange rate means a stronger Chinese yuan with respect to thetrade partners�currency.
38
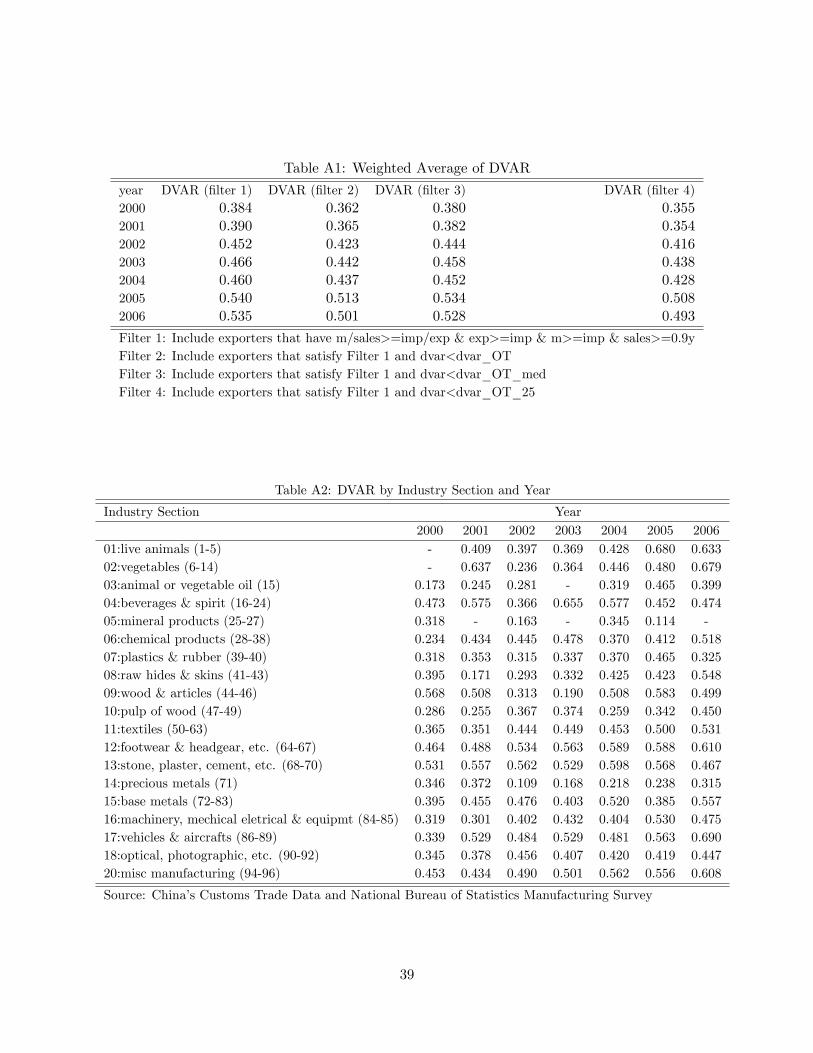
Table A1: Weighted Average of DVAR
year DVAR (�lter 1) DVAR (�lter 2) DVAR (�lter 3) DVAR (�lter 4)2000 0.384 0.362 0.380 0.3552001 0.390 0.365 0.382 0.3542002 0.452 0.423 0.444 0.4162003 0.466 0.442 0.458 0.4382004 0.460 0.437 0.452 0.4282005 0.540 0.513 0.534 0.5082006 0.535 0.501 0.528 0.493
Filter 1: Include exporters that have m/sales>=imp/exp & exp>=imp & m>=imp & sales>=0.9yFilter 2: Include exporters that satisfy Filter 1 and dvar<dvar_OTFilter 3: Include exporters that satisfy Filter 1 and dvar<dvar_OT_medFilter 4: Include exporters that satisfy Filter 1 and dvar<dvar_OT_25
Table A2: DVAR by Industry Section and Year
Industry Section Year2000 2001 2002 2003 2004 2005 2006
01:live animals (1-5) - 0.409 0.397 0.369 0.428 0.680 0.63302:vegetables (6-14) - 0.637 0.236 0.364 0.446 0.480 0.67903:animal or vegetable oil (15) 0.173 0.245 0.281 - 0.319 0.465 0.39904:beverages & spirit (16-24) 0.473 0.575 0.366 0.655 0.577 0.452 0.47405:mineral products (25-27) 0.318 - 0.163 - 0.345 0.114 -06:chemical products (28-38) 0.234 0.434 0.445 0.478 0.370 0.412 0.51807:plastics & rubber (39-40) 0.318 0.353 0.315 0.337 0.370 0.465 0.32508:raw hides & skins (41-43) 0.395 0.171 0.293 0.332 0.425 0.423 0.54809:wood & articles (44-46) 0.568 0.508 0.313 0.190 0.508 0.583 0.49910:pulp of wood (47-49) 0.286 0.255 0.367 0.374 0.259 0.342 0.45011:textiles (50-63) 0.365 0.351 0.444 0.449 0.453 0.500 0.53112:footwear & headgear, etc. (64-67) 0.464 0.488 0.534 0.563 0.589 0.588 0.61013:stone, plaster, cement, etc. (68-70) 0.531 0.557 0.562 0.529 0.598 0.568 0.46714:precious metals (71) 0.346 0.372 0.109 0.168 0.218 0.238 0.31515:base metals (72-83) 0.395 0.455 0.476 0.403 0.520 0.385 0.55716:machinery, mechical eletrical & equipmt (84-85) 0.319 0.301 0.402 0.432 0.404 0.530 0.47517:vehicles & aircrafts (86-89) 0.339 0.529 0.484 0.529 0.481 0.563 0.69018:optical, photographic, etc. (90-92) 0.345 0.378 0.456 0.407 0.420 0.419 0.44720:misc manufacturing (94-96) 0.453 0.434 0.490 0.501 0.562 0.556 0.608
Source: China�s Customs Trade Data and National Bureau of Statistics Manufacturing Survey
39
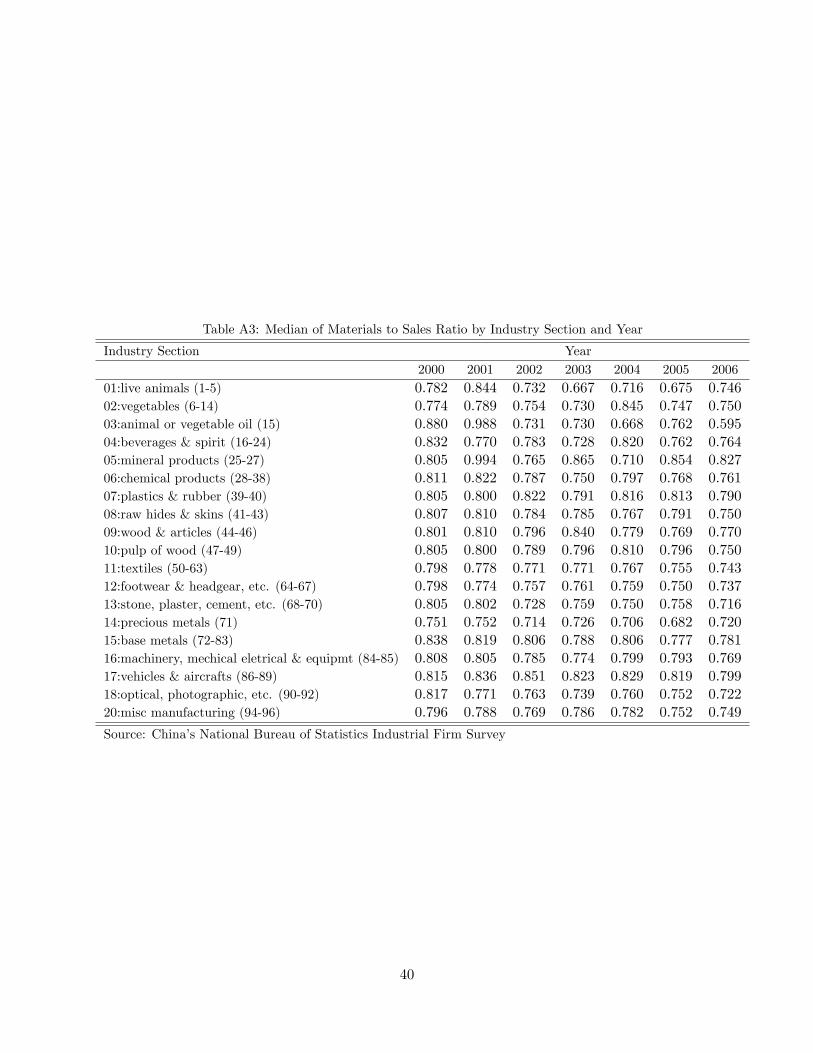
Table A3: Median of Materials to Sales Ratio by Industry Section and Year
Industry Section Year2000 2001 2002 2003 2004 2005 2006
01:live animals (1-5) 0.782 0.844 0.732 0.667 0.716 0.675 0.74602:vegetables (6-14) 0.774 0.789 0.754 0.730 0.845 0.747 0.75003:animal or vegetable oil (15) 0.880 0.988 0.731 0.730 0.668 0.762 0.59504:beverages & spirit (16-24) 0.832 0.770 0.783 0.728 0.820 0.762 0.76405:mineral products (25-27) 0.805 0.994 0.765 0.865 0.710 0.854 0.82706:chemical products (28-38) 0.811 0.822 0.787 0.750 0.797 0.768 0.76107:plastics & rubber (39-40) 0.805 0.800 0.822 0.791 0.816 0.813 0.79008:raw hides & skins (41-43) 0.807 0.810 0.784 0.785 0.767 0.791 0.75009:wood & articles (44-46) 0.801 0.810 0.796 0.840 0.779 0.769 0.77010:pulp of wood (47-49) 0.805 0.800 0.789 0.796 0.810 0.796 0.75011:textiles (50-63) 0.798 0.778 0.771 0.771 0.767 0.755 0.74312:footwear & headgear, etc. (64-67) 0.798 0.774 0.757 0.761 0.759 0.750 0.73713:stone, plaster, cement, etc. (68-70) 0.805 0.802 0.728 0.759 0.750 0.758 0.71614:precious metals (71) 0.751 0.752 0.714 0.726 0.706 0.682 0.72015:base metals (72-83) 0.838 0.819 0.806 0.788 0.806 0.777 0.78116:machinery, mechical eletrical & equipmt (84-85) 0.808 0.805 0.785 0.774 0.799 0.793 0.76917:vehicles & aircrafts (86-89) 0.815 0.836 0.851 0.823 0.829 0.819 0.79918:optical, photographic, etc. (90-92) 0.817 0.771 0.763 0.739 0.760 0.752 0.72220:misc manufacturing (94-96) 0.796 0.788 0.769 0.786 0.782 0.752 0.749
Source: China�s National Bureau of Statistics Industrial Firm Survey
40
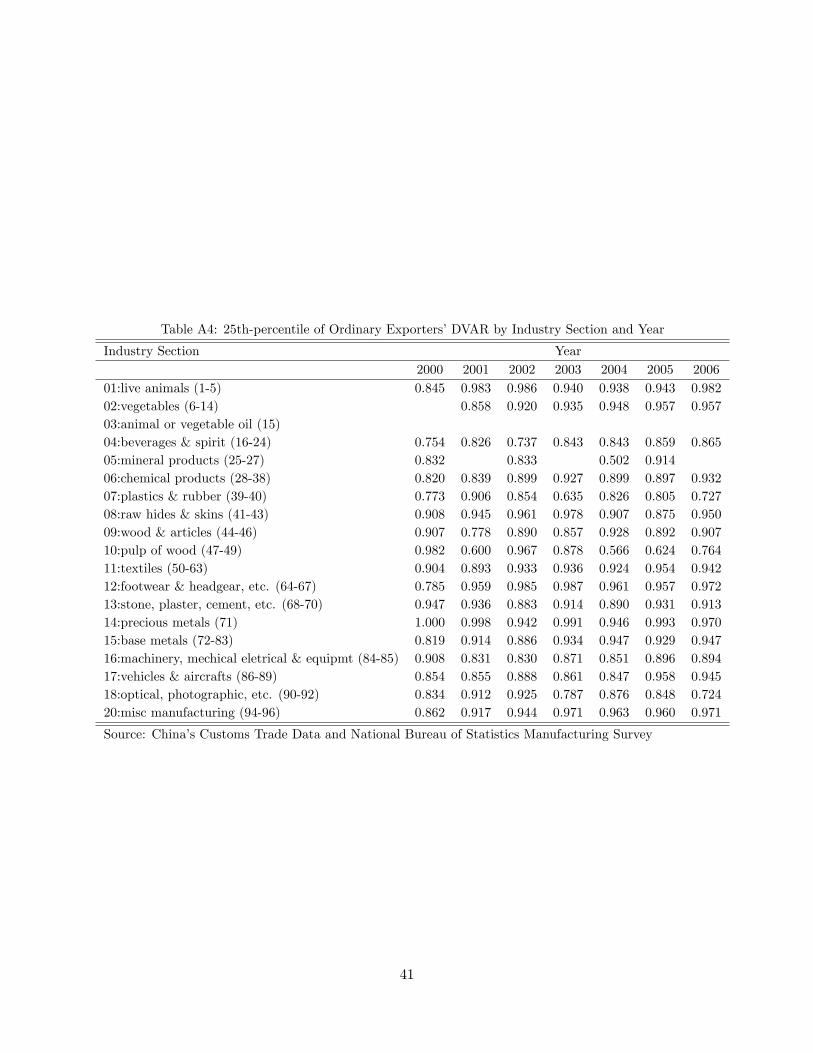
Table A4: 25th-percentile of Ordinary Exporters�DVAR by Industry Section and Year
Industry Section Year2000 2001 2002 2003 2004 2005 2006
01:live animals (1-5) 0.845 0.983 0.986 0.940 0.938 0.943 0.98202:vegetables (6-14) 0.858 0.920 0.935 0.948 0.957 0.95703:animal or vegetable oil (15)04:beverages & spirit (16-24) 0.754 0.826 0.737 0.843 0.843 0.859 0.86505:mineral products (25-27) 0.832 0.833 0.502 0.91406:chemical products (28-38) 0.820 0.839 0.899 0.927 0.899 0.897 0.93207:plastics & rubber (39-40) 0.773 0.906 0.854 0.635 0.826 0.805 0.72708:raw hides & skins (41-43) 0.908 0.945 0.961 0.978 0.907 0.875 0.95009:wood & articles (44-46) 0.907 0.778 0.890 0.857 0.928 0.892 0.90710:pulp of wood (47-49) 0.982 0.600 0.967 0.878 0.566 0.624 0.76411:textiles (50-63) 0.904 0.893 0.933 0.936 0.924 0.954 0.94212:footwear & headgear, etc. (64-67) 0.785 0.959 0.985 0.987 0.961 0.957 0.97213:stone, plaster, cement, etc. (68-70) 0.947 0.936 0.883 0.914 0.890 0.931 0.91314:precious metals (71) 1.000 0.998 0.942 0.991 0.946 0.993 0.97015:base metals (72-83) 0.819 0.914 0.886 0.934 0.947 0.929 0.94716:machinery, mechical eletrical & equipmt (84-85) 0.908 0.831 0.830 0.871 0.851 0.896 0.89417:vehicles & aircrafts (86-89) 0.854 0.855 0.888 0.861 0.847 0.958 0.94518:optical, photographic, etc. (90-92) 0.834 0.912 0.925 0.787 0.876 0.848 0.72420:misc manufacturing (94-96) 0.862 0.917 0.944 0.971 0.963 0.960 0.971
Source: China�s Customs Trade Data and National Bureau of Statistics Manufacturing Survey
41