Embed Size (px)
Citation preview

1
WCIB Occasional Paper Series
Weissman Center for International BusinessZicklin School of Business, Baruch College/CUNY
Anastasia Xenias, PhD, and Ron Erdmann1
U.S. Department of Commerce
October 2011
International Travel and Tourism Exports
and the New York Economy
The United States is exceptionally positioned within the global tourism industry. The U.S. ranks first in international visitor spendingand second in international traveler volume.2 Travel and tourism is America’s largest service export and a major jobs engine.Within the United States, New York holds a dominant position in terms of both international visitor arrivals and spending, placingNew York at the top of the global tourism industry. In 2010, five states dominated the share of international visitation within theUnited States—New York (33 percent), Florida (22 percent), California (21 percent), Nevada (10 percent) and Hawaii (8percent), in respectively. New York City accounts for nearly one third of all international arrivals to the United States, and ranksas either first or second among destinations of choice in international traveler surveys.3 In terms of national employment, NewYork City ranks fourth in travel and tourism related jobs.4 As international travel and tourism is forecast to grow considerably overthe next five years, the New York economy stands to benefit extensively. Below we present some key elements describing theimportance of this service export sector to the New York economy, both city and state.
Vol. 2 No. 1
1 Dr. Anastasia Xenias is Global Travel and Tourism Team Leader and Senior International Trade Specialist at the U.S. Commercial Service of the International TradeAdministration, Mr. Ron Erdmann is Deputy Director for Research at the Office of Travel and Tourism Industries of the International Trade Administration. The Office ofTravel and Tourism Industries (OTTI) manages the Travel and Tourism Statistical System for the United States. The System provides national and local level data thattracks past performance, provides insights into the future, and offers key traveler characteristics data to guide research-based marketing campaigns. The Global Traveland Tourism Team promotes exports of American travel and tourism services through foreign publicity facilitation and business to business matchmaking programs. Theanalysis presented here utilizes official U.S. economic data from the U.S. Department of Commerce. However, the views expressed here are those of the authors anddo not necessarily represent an official position of the International Trade Administration.
2 Based on data from the World Tourism Organization (http://unwto.org)
3 All travel and tourism related data, facts and figures are from the U.S. Department of Commerce International Trade Administration Office of Travel and TourismIndustries, unless otherwise specified. Multiple destinations visited data is collected on overseas travelers to the U.S. meaning the share of visits will far exceed 100percent.
4 Harvard Business School industry clusters.

2
International Travel and Tourism Exports and the New York Economy October 2011
I. U.S. Tourism Exports
In 2010, a record of just under 60 million international travelers came to America for tourism purposes, nearly 5 million morethan the year before, representing an 9 percent increase in the total number of international visitors over 2009. These travelersspent over $134.4 billion getting to the U.S. on American air carriers and during their stay5 representing an increase of 12percent, and supporting jobs for 1.1 million Americans while bolstering U.S. trade accounts. Because international travelerspending by visitors to the United States exceeds the spending by Americans going abroad, the U.S. has maintained a tradesurplus in travel and tourism exports every year since 1989. In 2010, that trade surplus amounted to over $32 billion. Travel andtourism is America’s largest services sector export, accounting for 24 percent of U.S. services exports and 7 percent of all exports(goods and services combined). Overall, travel and tourism is the nation’s fourth largest export industry.
5 The spending data is reported in current or nominal dollars, not adjusted for inflation. This figure is based on U.S. Department of Commerce data. Visa Internationalestimates an increase in international visitor spending of 18 percent in 2010 over 2009 based on data from their non-U.S. credit card holders who spent $34 billionin 2010 vs. $29 billion in 2009 visiting the United States.

3
International Travel and Tourism Exports and the New York Economy October 2011
II. The Central Position of New York City and New York State
New York City ranks as either first or second among destinations of choice for international travelers to the United States. In 2010,New York City welcomed 48.7 million total visitors including 9.7 million international travelers, receiving total visitor spending(domestic and international) of $31 billion, an increase of 9 percent over 2009,6 with international visitors contributing adisproprotionate amount of that total during their stay. The record number of tourists surpassed previous totals in both domesticand international arrivals. There is no question that travel and tourism is now a critical industry for New York City, withinternational tourism driving economic activity in this sector. The growth rate of international arrivals to New York City in 2010over 2009 at 11.3 percent significantly outpaced the national average of 9 percent. In direct contrast to the U.S. nationalaverage, international visitor spending dominates tourism receipts in New York City.
In 2010, New York state was the most visited state by overseas travelers to the U.S. for the 9th consecutive year, a spot previouslyheld by Florida. New York City, however, has been the number one destination city of overseas travelers to the United Statesevery year visitation estimates were collected starting in 1983. Since 1996, New York City has steadily increased market sharefrom 20 percent of all international arrivals to over 32 percent in 2010, meaning that nearly one third of all international traverlersto the United States come to New York City. New York City area airports account for 23 percent of all overseas passenger arrivals(16 percent JFK, 7 percent Newark), compared to 17 percent for Florida airports (Miami, Orlando, Ft. Lauderdale) and 15 percentfor California airports (LAX, San Francisco). In other words, New York City’s JFK airport alone equals overseas passenger arrivalsto all major Florida or California airports.
6 Total number of visitors (domestic and international), and total visitor spending tabulated by NYC & Company, New York City’s official promotion organization. NYC& Company defines visitors as individuals who made an overnight trip to New York City or traveled 50 miles or more one-way from home for a day trip, exclusive ofresidents, commuters, and full-time students; and total visitor spending as inclusive of direct spending in all categories experienced by visitors, plus indirect spendingby suppliers and induced spending resulting from wages and employee spending.

4
International Travel and Tourism Exports and the New York Economy October 2011
The largest increases in market share came in the years after the 9/11 terrorist attacks, with market share expanding rapidly from22 percent in 2000-2003 to add one or three percentage points each year. Even during the bleak year of 2009, wheninternational travel and tourism contracted nationally, New York City was able to increase its piece of the smaller pie from 32.4percent of all arrivals to the U.S. in 2008 to 32.8 percent in 2009. In 2010, the city’s share dipped slightly to 32.1 percent.This was the first drop in market share for New York City since 2003.
New York’s dominant position in international travel and tourism has significant benefits for the New York City economy. Researchby NYC & Company, for example, shows that tourist dollars spent in New York have saved local residents over $1,000 in taxeson average for each of the last five years, and that savings has doubled from previous years.7 However, New York City’s dominantmarket share does not mean fewer total tourists in other cities or states. New York may have a larger share of the pie, but, asnoted above, the pie got a whole lot bigger with the sharp expansion of international traveler arrivals and receipts over the pasttwenty years.
Data collected through the U.S. Department of Commerce Office of Travel and Tourism Industries (OTTI) International Survey ofInternational Air Travelers8 shows the strong preference foreigners have for visiting New York, in general. New York, both cityand state, rank as the first or second destination of choice for most international travelers to the United States. The strong overallpreference for New York, however, is not without qualifications. Europeans vote for New York by overwhelming majorities, whileAsians prefer the West Coast. Hawaii dominates the Japanese market, while California registers as the number one destinationfor most other Asian travelers to the United States, particularly travelers from Singapore, Taiwan and Korea. Distance may playa role in these preference rankings, with the East Coast being far more accessible to European travelers and the Pacific West beingcloser to Asian tourists. However, distance does not always determine destination preference. Australian tourists take Manhattanin huge numbers, with over 58 percent of Australians ranking New York City as their number one American destination despitethe near 24 hour flights. New Zealanders, by contrast prefer California giving that state 67.7 percent of their USA-bound travelersin 2009. Finally, British travelers may be closer to New York City and represent its largest volume of international tourists, but it’sFlorida that takes the largest market share of the British market.
7 Tax data is presented by NYC & Company as available on www.nycgo.com/articles/nyc-statistic-page
8 The Survey of International Air Travelers is an on-going primary research program which gathers statistical data about air passenger travelers in the U.S. - overseasand U.S. - Mexican markets. Survey data provides information on passenger trip planning, travel patterns, demographics and spending for two separate populations- non-U.S. residents traveling in the U.S.and U.S. residents traveling from the U.S. The Survey has been conducted on a monthly basis contunuously since January 1983.

5
International Travel and Tourism Exports and the New York Economy October 2011
Similarly, the decades-long visa-waiver status of many European countries may have benefitted New York, again with importantqualifications. Until November 2008, when South Korea was added, only Australia, New Zealand, Japan, Brunei and Singaporehad visa-waiver status in Asia. Of these, only Australia showed a distinct preference for travel to New York. Meanwhile, as notedabove, visa-waiver Brits tend to favor Florida beaches to Broadway. They do, nevertheless, tend to favor the East Coast of theUnited States over the West Coast. State rank is quite important when considering that 67 percent of all overseas arrivals visitonly one state (75 percent for Asians, 65 percent for Europeans). That said, the largest market for international tourism for NewYork City is the United Kingdom, accounting for more than 10 percent of the total overseas travelers. Second is Canada with nearly10 percent of all international arrivals (though Canada ranks first for the state as a whole). If Australia is included, we see thatover one-quarter of all international visitors to New York are from English-speaking countries.9
III. International Visitor Profile to New York City
Who are the overseas travelers who visit New York City and are they different than the average traveler to the country? Belowwe highlight differences between visitors to the city as compared to the country as a whole. The figures reflect data on New YorkCity only. In Table 3 we include respective figures for the state of New York. Given the weight of the city on the state’s tourismprofile, the figures are nearly identical, although a few differences are discernable.
9 “History of International Travel & Markets” New York City 2000-2009 preliminary results released by NYC & Company on May 15, 2011 based on data from theU.S. Department of Commerce Office of Travel and Tourism Industries.

Based on the OTTI Survey of International Air Travelers, we know that the average overseas traveler to New York City looks to theInternet as their number one source for information to plan their trip (45 percent), followed by the travel agent (37 percent). Theoverseas visitors use a travel agent to book their air trip 42 percent of the time and another 33 percent used the Internet, muchlike the average traveler in the United States. The overseas travelers who visit New York City are very independent with only 13percent taking a package, while the percentage of international travelers to the U.S.A. using a package is a slightly higher 17percent.
However, when it comes to their main purpose of trip, 60 percent of the overseas travelers to New York City are there forleisure/recreation/holidays compared to 54 percent for the country as a whole making New York more of a leisure destinationthan business one. Only 14 percent of the overseas visitors to the city were there for business compared to 18 percent for theUnited States. The length of their trip is 17 nights for the country. Of the 17 nights, New York City kept them within the city forover 7 of those nights. Forty-nine percent of the overseas visitors to New York City visited more than one state while within thecountry, which is far higher than the 33 percent total for the United States. That is, 49 percent of travelers to N.Y.C. go on to visitother states as well, while only 33 percent of all other travelers to the U.S. visit more than one state. So, while the City is by farthe number one destination within the country, travelers are also using it to visit other places while they are here. We also knowthat 36 percent of the overseas travelers to New York City are first time travelers to the country. This is much higher than the 25percent national total, a strong indication that international visitors see New York City as the primary place to visit in the UnitedStates emphasizing New York City’s status as the key gateway to tourism in America.
Because they visit more than one destination, the travelers to New York City are far more mobile than the average traveler to thecountry. The most popular mode of transportation is by hired car, with most travelers to the city using its taxis and limos (55percent). This is considerably higher than the 41 percent for the country as a whole. The next mode of transport used is subwaysand buses (45 percent) which are also much higher than the 26 percent average for the country. To visit other states, travelerstake another domestic flight 29 percent of the time, which is slightly higher than the United States average. In contrast, overseastravelers to the City are less likely to have access to a private or company car (21 percent versus 24 percent), and are far lesslikely to rent a car (19 percent versus 30 percent). By contrast, overseas visitors will use the rail service (19 percent) more so thanthe average travelers to the country (11 percent). Another major difference in the visitors to New York City when compared tothe average overseas travelers to the country is seen in the activity participation while within the country. While shopping (90percent) and dining in restaurants (85 percent) are by far the dominant activities, they show up in similar shares throughout thecountry. What is different is the next set of activities for visitors to New York City. Visiting historical sites occurred in almost 61percent of the city’s visitors compared to only 40 percent at the national level. Likewise, sightseeing in cities (59 percent comparedto 45 percent), and visiting art galleries/museums (46 percent versus 24 percent) also help define what is unique about the city.Furthermore, going to cultural heritage sites (34 percent) and attending a concert/play/musical (30 percent) were much higherthan the 24 percent and 17 percent averages for the country respectively. These high participation levels show the averageoverseas visitors to the city are packing far more into their trip than an average domestic traveler. Therefore they will have a muchhigher impact on New York City’s many travel related businesses. Participation levels are also higher because leisure travelerstend to be more active while within the country than do visitors here for business or those who visit friends and relatives.
Finally, when we look at the demographics of the overseas visitors to the city it shows that 54 percent of the visitors are males.The average age of men is 41 and the average age for women is 38. Both are very similar to the national average. The averageincome of overseas visitors to New York City, in 2010 was $90,100 also very similar to the average income of all visitors to theU.S. These affluent international visitors also tend to be overwhelmingly in higher skill jobs, with 62 percent of international visitorsto both New York City and America declaring their employment as executive/professional or technical in nature. In addition tohigh levels of professionals, New York City tends to host nearly twice as many international government and military officials aswell as more international students than the national average, at least partially resulting from the city’s unique position in globalaffairs as host to the United Nations headquarters.
6
International Travel and Tourism Exports and the New York Economy October 2011

7
International Travel and Tourism Exports and the New York Economy October 2011
Overseas travelers tend to spend substantially more while in New York City than the rest of the country on hotels ($586 vs. $421),gifts ($464 vs. $369) and entertainment ($217 vs. $172) as compared to the national average. However, far fewer internationalvisitors to New York City travel there by first or business class airfare (6.7 percent) than the U.S. as a whole (13.4 percent), asomewhat surprising outcome given New York’s status as a global financial capital.
8
International Travel and Tourism Exports and the New York Economy October 2011
IV. International Visitor Spending and New York Jobs
The U.S. Travel Association estimates that 1 out of every 9 American jobs depend on travel and tourism, with international travelspending of foreign visitors during their stay in the U.S. directly supporting 931,000 American jobs in 2010 and $24.7 billion inwages.10 The power of travel on employment is especially evident in the current economic climate. Analyzing U.S. Labor Departmentdata, the USTA reports that one out of every five jobs created in America during June 2011 was in the travel and tourism sector,outstripping job creation in other industries in a weak economy.11 While the increase in international visitor arrivals to the UnitedStates overall, and New York in particular, is important, it is visitor spending on travel and tourism and related activities (such asshopping, dining, sightseeing and entertainment) that has the greatest impact on employment. Nationally, international visitorspending outpaces domestic visitor spending. The total average spent for all travelers to the USA in 2010 was $2,240, comparedwith the average spending of overseas travelers to the USA of $3,980 in the same year.
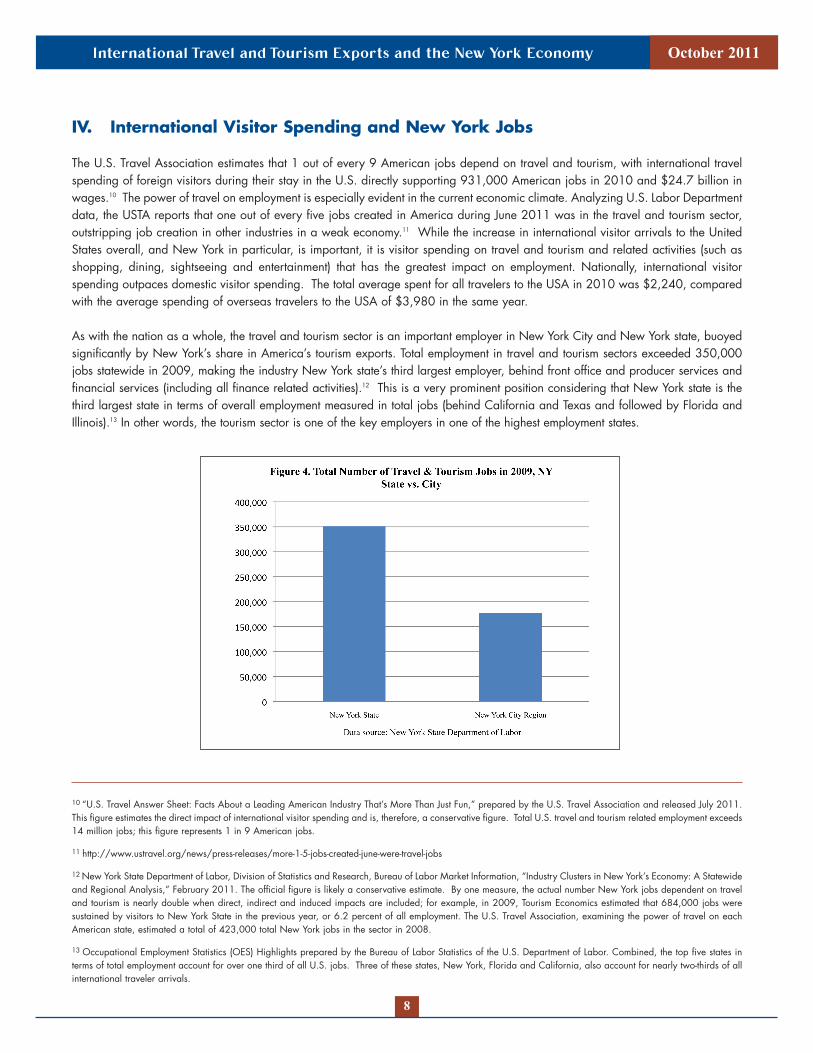
As with the nation as a whole, the travel and tourism sector is an important employer in New York City and New York state, buoyedsignificantly by New York’s share in America’s tourism exports. Total employment in travel and tourism sectors exceeded 350,000jobs statewide in 2009, making the industry New York state’s third largest employer, behind front office and producer services andfinancial services (including all finance related activities).12 This is a very prominent position considering that New York state is thethird largest state in terms of overall employment measured in total jobs (behind California and Texas and followed by Florida andIllinois).13 In other words, the tourism sector is one of the key employers in one of the highest employment states.
10 “U.S. Travel Answer Sheet: Facts About a Leading American Industry That’s More Than Just Fun,” prepared by the U.S. Travel Association and released July 2011.This figure estimates the direct impact of international visitor spending and is, therefore, a conservative figure. Total U.S. travel and tourism related employment exceeds14 million jobs; this figure represents 1 in 9 American jobs.
11 http://www.ustravel.org/news/press-releases/more-1-5-jobs-created-june-were-travel-jobs
12 New York State Department of Labor, Division of Statistics and Research, Bureau of Labor Market Information, “Industry Clusters in New York’s Economy: A Statewideand Regional Analysis,” February 2011. The official figure is likely a conservative estimate. By one measure, the actual number New York jobs dependent on traveland tourism is nearly double when direct, indirect and induced impacts are included; for example, in 2009, Tourism Economics estimated that 684,000 jobs weresustained by visitors to New York State in the previous year, or 6.2 percent of all employment. The U.S. Travel Association, examining the power of travel on eachAmerican state, estimated a total of 423,000 total New York jobs in the sector in 2008.
13 Occupational Employment Statistics (OES) Highlights prepared by the Bureau of Labor Statistics of the U.S. Department of Labor. Combined, the top five states interms of total employment account for over one third of all U.S. jobs. Three of these states, New York, Florida and California, also account for nearly two-thirds of allinternational traveler arrivals.

9
International Travel and Tourism Exports and the New York Economy October 2011
Although tourism supports jobs throughout the state with over $12 billion in wages paid in 2009, the largest proportion of traveland tourism related jobs in the state are in New York City. The average annual wages of individual tourism workers in New YorkCity, however, exceeds the state average by approximately $10,000 a year. Most travel and tourism employment in New YorkCity is concentrated in Manhattan which also generates nearly half of the state’s total travel and tourism wages at nearly $6 billiona year. However a significant number of travel and tourism jobs can be found in Queens reflecting the presence of America’smost important international gateway airport, John F. Kennedy Airport, in that borough. The number of travel and tourism jobs,especially in the boroughs outside Manhattan, is expected to increase further in 2011 and following years as a result of asignificant increase in the city’s hotel room capacity that is also heavily skewed towards adding capacity in neighborhoods andbusiness districts outside Manhattan.
New York City has the highest hotel development growth rate in the United States, averaging 5.7 percent in new hotel roomadditions annually in the period 2007-2010, and 7.7 percent through April 2011 compared to the same period the prior year.This is a strikingly rapid development when compared to an average annual growth rate in hotel room capacity of 1.1 percentannually during the twenty year period from 1988-2008. Moreover, the economic downturn following the financial crisis of 2008-2009 had little impact on hotel development in New York City. Overall the city’s hotel room inventory grew from 72,625 in 2008to approximately 90,000 rooms expected by the close of 2011, a cumulative increase of 24 percent. On average, 42 percentof new hotel properties built between 2008 and 2011 have been outside Manhattan, adding 2,600 hotel rooms in Queens,Brooklyn, the Bronx and Staten Island, driven by the arrival or expansion of national hotel chains to those boroughs.14
14 “Hotel Development in NYC” New York City Briefing Sheet 2011 – summer update, issued May 12, 2011 by NYC & Company.

10
International Travel and Tourism Exports and the New York Economy October 2011
International visitor spending positively impacts New York City employment as well as tax revenue. The U.S. Department ofCommerce Office of Travel and Tourism Industries estimates that overseas travelers to the United States who visited New York Cityspend on average $3,652 per trip, or approximately 10 percent more than the average for travelers who come to America but donot visit New York. In 2010, over 8.3 million overseas travelers visited New York arriving by air. Total overseas visitor spendingon trips to the United States that included New York City produced over $30 billion in spending including international airfare onU.S. carriers. When airfare is excluded, the average overseas traveler to New York spent $2295 per trip in 2010, or a total ofover $19 billion on their trip to the United States. Half of those travelers visited only New York, while another 25 percent visitedonly one additional state and 12 percent visited two additional states while a very small proportion visiting several states. Thus,although New York is a gateway to the United States, it still retains a large portion of the revenue spent by travelers using it as agateway or a singular destination.
Total visitor spending in New York City (domestic and international) has doubled since 2001 and tripled over the past twenty years.The growth rate in visitor spending in the city has far surpassed even the significant increase of the state as a whole where totaltraveler spending grew from $35 billion in 2001 to $54 billion in 2010, a 35 percent increase. NYC & Company, the city’s officialtourism promotion authority, estimates that international travelers to the city generate over half of all visitor spending. By oneestimate, international travelers generate approximately one third of all tourism spending for the state as a whole.15

11
International Travel and Tourism Exports and the New York Economy October 2011
The dollars spent by international travelers’ matters tremendously. The economic impact of travel and tourism extends beyond directand indirect employment in the sector. International visitor spending contributes significantly to New York’s tax revenues and thereforeto city and state budgets. Total tax receipts related to travel and tourism spending (domestic and international) exceeded $10 billionin 2010 for New York State as a whole. Only three states showed total tax revenues from travel and tourism at $10 billion ormore—California, Florida and New York. These were followed by Texas with $8.3 billion and Illinois with $5.5 billion in taxrevenues attributed to the tourism industry. Twenty-six states and the District of Colombia had tourism related tax revenue of under$5 billion (of these, 8 showed revenue under $2.5 billion) and 19 states had tax revenue from tourism under $1 billion (of these,12 showed revenue under $500 million).16 In other words, New York stands far above 47 of the 50 states and the District ofColombia in terms of direct budgetary benefits from the travel and tourism industry. New York City generates the bulk of travel andtourism related tax revenue for the state; near 80 percent of total tax receipts generated by travel to New York City accounting for25 percent of the state’s total tax receipts, while travel and tourism generates more than twice the amount in city taxes as it does instate taxes (an estimated $2.62 billion was collected by New York City in local taxes as a result of travel in 2009 compared to$1.2 billion in state taxes). Because international visitors to New York City account for half of all tourism spending, internationaltravel also has a disproportionate impact on tax revenue for both the city and the state.
15 A recent study by consulting firm Tourism Economics estimating the economic impact of the travel and tourism industry on New York State noted that in 2008 28percent of all visitor spending in the state was from international travelers. http://www.cnyrpdb.org/docs/minutes/2009-04_nys_tourismeconomicimpact.pdf
16 Some examples of tourism related tax revenues collected by states in 2010 are as follows: California $14.9 billion, Florida $10.5 billion, Texas $8.3 billion, Illinois$5.5 billion, Georgia $4.2 billion, Nevada $4.3 billion, North Carolina $2.8 billion, Colorado $2.6 billion, Arizona $2.2 billion, South Carolina $1.6 billion, DC$1.3 billion, Louisiana $1.2 billion, Alaska $344.1 million, Vermont $236.5 million. Data from official state statistics modeled and summarized for each state by theU.S. Travel Association under “The Power of Travel: Economic Impact of Travel and Tourism” http://www.poweroftravel.org.

12
International Travel and Tourism Exports and the New York Economy October 2011
V. Forecast
New York holds a dominant market share for five of the top ten markets for U.S. travel and tourism exports by 35 percent or more.In other words, New York is the U.S. destination of choice for visitors from five of America’s the top ten tourism export markets by35 percent or more. In the next five year period ending in 2016, arrivals from all countries where New York holds a dominantmarket share is expected to increase, albeit at varying rates. The largest increases from New York’s top markets are expected tocome from Brazil and Australia. The Office of Travel and Tourism Industries (OTTI) forecasts that tourist arrivals from Brazil to theUnited States are expected to expand by 15 percent in 2012 over the current year and by 150 percent in 2016 over 2010, thethird largest increase in travelers over this period. Arrivals from Australia are expected to increase by 11 percent in 2012 over2011 and by 82 percent in 2016 over 2010, the fifth largest increase in travelers to the U.S. in this period. New York is thedestination of choice for travelers from both markets, implying that New York City stands to benefit disproportionately from theprojected expansion. Arrivals from other top New York City markets are also expected to increase over the five year period, with36 percent more travelers from Germany by 2016, 57 percent from France and 23 percent from Italy. New York’s top marketoverall, the United Kingdom, will also send 35 percent more visitors to the U.S. in 2016 than it did in 2011, which will, however,likely benefit Florida more than New York if current preference trends hold.

13
International Travel and Tourism Exports and the New York Economy October 2011
According to the current Department of Commerce OTTI forecast, the United States would see 6 percent to 8 percent annual growthrates in visitor volume over the 2012 - 2016 period. By 2016 this growth would produce 89 million visitors, a 49 percent increaseand an additional 29 million visitors compared to 2010. The North America world region will account for half (51 percent) of thetotal visitor growth of 29 million visitors. Asia (+20 percent), Western Europe (+12 percent), and South America (+9 percent) areexpected to account for the bulk of the remaining 49 percent of total growth in visitor volume forecast in 2016 compared to 2010actual volume. All world regions are forecast to grow over the period and all but two of the top 40 visitor origin countries areforecast to grow from 2010 through 2016 (Ireland and Jamaica are the exceptions). Of the top 20 markets for U.S. travel exports,the largest percentage increases in arrivals over the period 2010 to 2016 are expected from China (232 percent) and SouthKorea (200 percent) where New York does not hold a dominant market share.
In sum, the travel and tourism industry is a major economic engine for both the state and the city of New York, especially the latter,with international travel and tourism arrivals contributing significantly to economic activity, employment and revenues. New YorkCity lies at the center of America’s travel and tourism exports. New York and New York City have done well over the past severalyears in increasing the share and volume of international travel to the state and city. This has helped the city and state generaterevenues and increase employment through the jobs supported by international traveler spending.
The forecast for travel to the United States is good and several of the markets that New York benefits from are poised to showcontinual growth into the future. In addition, executive policy and legislative initiatives expanding U.S. government support of traveland tourism exports stand to benefit New York, particularly due to its central position in international traveler arrivals to the UnitedStates. The Executive Order creating the National Export Initiative sets a goal for America to double exports over the next severalyears. This goal includes service exports such as travel and tourism, and mandates U.S. government agencies to engage and serveexport industries more closely. The Travel Promotion Act passed by the U.S. Congress in 2009 and signed into law by PresidentObama in 2010 provides for specific targeting of the travel and tourism sector, making available at least $100 million from feescollected from international visitors for use in marketing the country globally for the purpose of attracting more international visitors.In 2010, NYC & Company CEO George Fertitta was appointed by the U.S. Secretary of Commerce to the eleven-member Boardof Directors of the Corporation for Travel Promotion and selected as Vice Chairman, allowing New York to play a critical role in theshaping of this innovative public-private partnership to promote global tourism. Forecasts of future travel trends and governmentalpolicy initiatives should provide a winning combination for the continued success of this industry in New York.

14
International Travel and Tourism Exports and the New York Economy October 2011
References:
Michael E. Porter, 2011, “Hospitality and Tourism Cluster, Top 20 States by Employment 2008”Cluster Mapping Project, Institute for Strategy and Competitiveness, Harvard Business School.
U.S. Department of Labor, Bureau of Labor Statistics, June 2010, “Occupational Employment Statistics (OES)Highlights: An Overview of U.S. Occupational Employment and Wages in 2009”.
New York State Department of Labor, Division of Research and Statistics, Bureau of Labor Market Information,“Industry Clusters in New York’s Economy: A Statewide and Regional Analysis, February 2011http://www,labor.ny.gov/stats/nysindclusters.asp
Tourism Economics: A Division of Oxford Economics “The Economic Impact of Tourism and the I Love New YorkCampaign,” released November 2006http://www.tourismeconomics.com/docs/ILNY_Impact_Executive_Summary.pdf
Tourism Economics: A Division of Oxford Economics “The Economic Impact of Tourism in New York State,”released April 2009http://www.cnrpdb.org/docs/minutes/2009-04_nyc_tourismeconomicimpact.pdf
United Nations World Tourism Organization (UNWTO), Tourism Highlights 2010 Edition
OTTI reports:U.S. Department of Commerce Press Release, “New Report Forecasts Strong U.S. Travel and Tourism GrowthDuring Next Five Years,” May 23, 2011http://www.commerce.gov/news/press-releases/2011/05/23/new-report-forecasts-strong-us-travel-and-tourism-growth-during-next-
U.S. COMMERCE DEPARTMENT FORECASTS CONTINUED STRONG REBOUND IN INTERNATIONAL TRAVEL TOTHE UNITED STATES - 2011-2016, May 23, 2011http://www.tinet.ita.doc.gov/view/f-2000-99-001/index.html
U.S. Department of Commerce, International Trade Administration, Office of Travel and Tourism Industries,“Visitation to the United States: A Statistical Summary, 2010,” revised release July 2011http://tinet.ita.doc.gov
U.S. Department of Commerce, International Trade Administration, Office of Travel and Tourism Industries,“Top 10 International Markets: 2010 Visitation and Spending” revised release June 2011http://tinet.ita.doc.gov
U.S. Department of Commerce, International Trade Administration, Office of Travel and Tourism Industries,“Fast Facts About International Travel and Tourism to the United States,” revised release June 2011http://tinet.ita.doc.gov
U.S. Department of Commerce, International Trade Administration, Office of Travel and Tourism Industries,Overseas Visitation Estimates for U.S. States, Cities, and Census Regions: 2010” released May 2011http://tinet.ita.doc.gov
U.S. Department of Commerce, International Trade Administration, Office of Travel and Tourism Industries,“Survey of International Air Travelers, 2010” released May 2011,http://tinet.ita.doc.gov

15
International Travel and Tourism Exports and the New York Economy October 2011
U.S. Department of Commerce, International Trade Administration, Office of Travel and Tourism Industries,“Abstract of Travel To and From the U.S.”, released March 1996,http://tinet.ita.doc.gov
U.S. Department of Commerce, International Trade Administration, Office of Travel and Tourism Industries,“Top Cities Visited by Overseas Travelers, 1994-1995” released May 1996,http://tinet.ita.doc.gov
U.S. Department of Commerce, International Trade Administration, Office of Travel and Tourism Industries,“Overseas Visitors to Select U.S. Cities/Hawaiian Islands 2003-2004” and 2004-2005, released in May 2005,and May 2006http://tinet.ita.doc.gov
U.S. Department of Commerce, International Trade Administration, Office of Travel and Tourism Industries,“2010 Market Profile: Middle East” released May 2011http://tinet.ita.doc.gov
U.S. Department of Commerce, International Trade Administration, Office of Travel and Tourism Industries,“2010 Market Profile: Middle East” released May 2011http://tinet.ita.doc.gov
U.S. Department of Commerce, International Trade Administration, Office of Travel and Tourism Industries,“2010 Market Profile: Asia” released May 2011http://tinet.ita.doc.gov
U.S. Department of Commerce, International Trade Administration, Office of Travel and Tourism Industries,“2010 Market Profile: Eastern Europe” released May 2011http://tinet.ita.doc.gov
U.S. Department of Commerce, International Trade Administration, Office of Travel and Tourism Industries,“2010 Market Profile: Western Europe” released May 2011http://tinet.ita.doc.gov
U.S. Department of Commerce, International Trade Administration, Office of Travel and Tourism Industries,“2010 Market Profile: South America” released May 2011http://tinet.ita.doc.gov
U.S. Department of Commerce, International Trade Administration, Office of Travel and Tourism Industries,“Profile of Overseas Travelers to the United States: 2010 Inbound” released May 2011http://tinet.ita.doc.gov
Others:U.S. Travel Association, 2011, “Travel is an Economic Engine”,http://www.ustravel.org
“Visa: International Tourist Spending in U.S. Rose 18% in 2010,” Dow Jones Newswires, April 25, 2011.

Credits
Weissman Center for International Business, Director:Terrence F. Martell, Ph.D.
Saxe Distinguished Professor of Finance
Project Editor:Lene Skou
Weissman Center Deputy Director
Design and layout:Rachael Cronin
For more information about this report contact the
Weissman Center for International BusinessZicklin School of Business, Baruch College/CUNY
(646) 312-2070
To access a comprehensive compilation of information about New York City, visit NYCdata atwww.baruch.cuny.edu/nycdata
© The Weissman Center for International Business, Baruch College/CUNY 2010